Embed Size (px)
Citation preview
1
TOTAL FACTOR PRODUCTIVITY AND CROSS-BORDER FDI FLOWS IN OECD COUNTRIES - A PANELDATA ECONOMETRIC ANALYSIS*
Neil Dias Karunaratne
School of Economics. The University of Queensland.
Brisbane Qld. 4072 Australia.
Email: [email protected]
2
Abstract
The role of FDI inflows and outflows to host countries and from the source countries
emerged in the 1980s as the major vehicle technology transfer that accelerated the
globalization or international integration of 25 leading OECD economies over a period of 25
years (1983-2007). Although neoclassical and endogenous growth theories provide
unequivocal support for FDI flows because they generate positive externalities or spillover
effects through channels of GDP growth, capital formation and R&D, the empirical evidence
in support of these claims are mixed. The panel data econometrics performed using a new
multiplicatively complete index of total factor productivity provide fresh insights on the
cross-border FDI generated through technology transfer and other channels. The empirical
findings for the OECD countries are markedly different from the spillover effects on
developing countries that are plagued by technology absorptive capacity effects due to the
operation of threshold effects of underdeveloped human capital resources. The empirics on
cross-border FDI flows and the spillover effects that they generate in OECD countries will
provide much needed information to design and implement policies to harness the net benefits
from cross-border FDI flows and shed light on the design of policies to reconcile the
conflicting policies of austerity and growth that are required to prevent the sovereign debt
racked euro-zone countries from imploding the single currency union based on the euro.
Keywords: FDI . Externalities. Panel Data Econometrics. OECD. Euro.
JEL: O11, O40, F21, F23
Abbreviations

3
ABS Australian Bureau of Statistics
ADF Augmented Dickey Fuller
AIC Akaike Information Criterion
CPI Consumer Price Index
CRS Constant Returns to Scale
DW Durbin Watson
FDI Foreign Direct Investment
FE Fixed Effects
FGLS Feasible Generalized Least Squares
GDP Gross Domestic Product
GERD Gross Expenditure on R&D
GLS Generalized Least Squares
ICT Information and Communication Technology
IMF International Monetary Fund
IPD Implicit Price Deflator
ISIC International Standard Industrial Classification
KPSS Kwiatowski, Phillips, Schmidt and Shin
MFP Mutlifactor productivity
MNCs Multinational Corporations
OECD Organization for Economic Co-operation & Development
OLS Ordinary Least Squares
PC Productivity Commission
PPP Purchasing Power Parity
R&D Research and Development
RE Random Effects
TFP Total Factor Productivity

4
TNC Transnational corporation
UNCTAD United Nations Conference on Trade and Development
VA Value Added
WTO World Trade Organization

5
1. Introduction
The OECD economies are currently in the throes of a sovereign debt crisis that
threatens wreck the euro zone or the common currency union that was
established after the Maastricht treaty (1991). The euro zone economies, the
PIGS (Portugal, Italy, Greece and Spain) are hovering on the brink of
insolvency due to their inability to service their sovereign debt and contain their
deficits without a massive bail out form the European Central Bank and the IMF.
The strategies to steer the break-up the euro zone advocate the implementation
of polices of austerity (spending cuts) on the one hand and growth on the other
in the debt ravage OECD countries.
This paper presents empirics on how to reconcile policies of austerity, which is
code for increase in Total Factor Productivity (TFP) with growth, which is code
for increasing cross-border FDI. The impending implosion of the euro zone
requires the implementation of massive structural adjustment in the shape of
tax-payer funded bailouts to recapitalize banks in the PIGS. The failure to do so
would lead to the break-up of the single currency union or the euro
zone with the resulting crisis contagion not only adversely affecting the
economies of the OECD but also the global economy.
6
The cross-border transfer and diffusion of technology through Foreign Direct
Investment(FDI) under the aegis of Multinational Corporations (MNCs) has been a
major force in the globalization or linking of the OECD more rapidly with the
international economy during the study period 1983-2007. The nexus between cross-
border FDI flows and the acceleration of GDP growth has been the subject of intensive
research and heated debate over in recent decades. Both neoclassical economic theory
and endogenous or new growth theory lend unequivocal support to the proposition
that FDI flows are vehicles of cross-border transfer of technology that accelerates
productivity and potential growth in both the host and source countries. However,
empirical studies fail to match the hype of economic theory and an acrimonious debate
has raged between supporters of increased FDI flows and those opposed to such
increases on the basis diverse grounds that range from environmental pollution to the
undermining of national interest and economic independence.
The literature survey undertaken for this study clearly reveal that despite the
overwhelming theoretical support for cross-border FDI flows on the grounds that they
are vehicle for transfer of technology and act as the motor of productivity and GDP
growth by generating benign technological externalities or spillover effects the
empirical evidence in support of these claims are at best mixed. In this paper, we
identify some of the grounds for this skepticism and provide empirical evidence based
on panel data econometrics to shed light on the nexus between FDI and TFP by
generating empirical information on a number of fronts. First, the failure of the FDI
flows, GDP and TFP growth to live up to the theoretical hype is examined, and its
genesis due to the methodological flaws mired past studies is addressed. In this regard
a major flaw in the use of OLS estimates based on pooled cross-section time series is
the failure to take remedial measures to overcome the problems associated with
7
parameter heterogeneity, outliers, omitted variables, model uncertainty, measurement
error and endogeneity, low power of statistical tests that sap the reliability out of the
empirics churned out by these methods . In this paper, we attempt to overcome these
deficiencies by applying panel data econometric techniques. Second, much of the
theoretical and empirical analysis relating to the FDI flows has focused on the
externalities or spillover effects associated with the resulting GDP growth. However,
in this paper argue that the focus should be directly on the nexus between TFP growth
and FDI flows rather than on GDP growth. Second, in order to analyze more incisively
the technological spillovers generated by TFP growth due to FDI flows the paper
reports for the first by any study the empirical results related to the computation of
multiplicatively complete TFP indexes that can FDI related TFP into technological
spillovers effects that can be measured in the shape of scale economies, technical
efficiency and technological change. Third, the paper unlike many earlier studies
advances the knowledge frontier on the TFP-FDI empirics by considering both the
crowding- out and crowding- in effects of cross-border, FDI flows on both the host
country and the source country domestic investments and industries. These positive or
negative spillover effects from the cross-border MNC- FDI flows that may be driven
by the pecuniary motives of lowering production costs by vertical integration or by the
motive to access to new markets through horizontal integration are reviewed. Fourth,
the empirical analysis undertaken in this paper recognizes that the level of human
capital and institutional fabric may impose constraints on the absorptive capacity of
technology transferred by FDI to generate positive technological spillover effects on
the host or source country. In particular we recognize that absorptive capacity for
technology transferred by FDI is vastly different from that prevailing in developing
countries hamstrung by poor infrastructure, lack of sound banking and financial
institutions, law and order and a business friendly environment.. The empirical
8
analysis undertaken in this study has used the most up-to-date panel dataset for 25
OECD countries over the span of 25 years (1983-2007) . The panel data set has been
sourced from the most authoritative databases available from international
organizations like the OECD, UNCTAD, World Bank and independent sources such as
the Penn World Tables.
It is worthwhile recapitulating the contributions that the paper claims to make in
advancing the knowledge frontier on the FDI-TFP empirics and on at least five fronts:
i. We have refocused attention on the TFP linked spillover effects in this study rather
than on the more indirect GDP related spillover effects that has been the focus of most
empirical studies on FDI flows undertaken hitherto. ii. We contribute to the
advancement on the knowledge frontier on cross-border MNC-FDI flows by analyzing
spillover using for the first time a multiplicatively complete index, which enables the
decomposition o of technological change due to FDI flows into measurable spillover
effects in the form of scale economies and technical efficiency. iv. The empirical
results reported in this paper are fully cognizant of the consequences of the divergence
in the absorptive capacity in host and source countries for metabolizing and generating
spillover effects. In particular developing countries lack the human capital,
infrastructure , banking and financial institutions and business ethos that gives OECD
countries a head start over developing countries in attracting MNC-FDI flows. iv.
The empirical results of the study have taken account of both the crowding-in and
crowding-effects on domestic firms of both FDI inflows and outflows in a symmetric
manner unlike many other studies that have focused only on one side of the coin .v.
Finally we have compiled the most up-to-date and comprehensive panel database
from the most authoritative international and national databases that have been
published to-date .
9
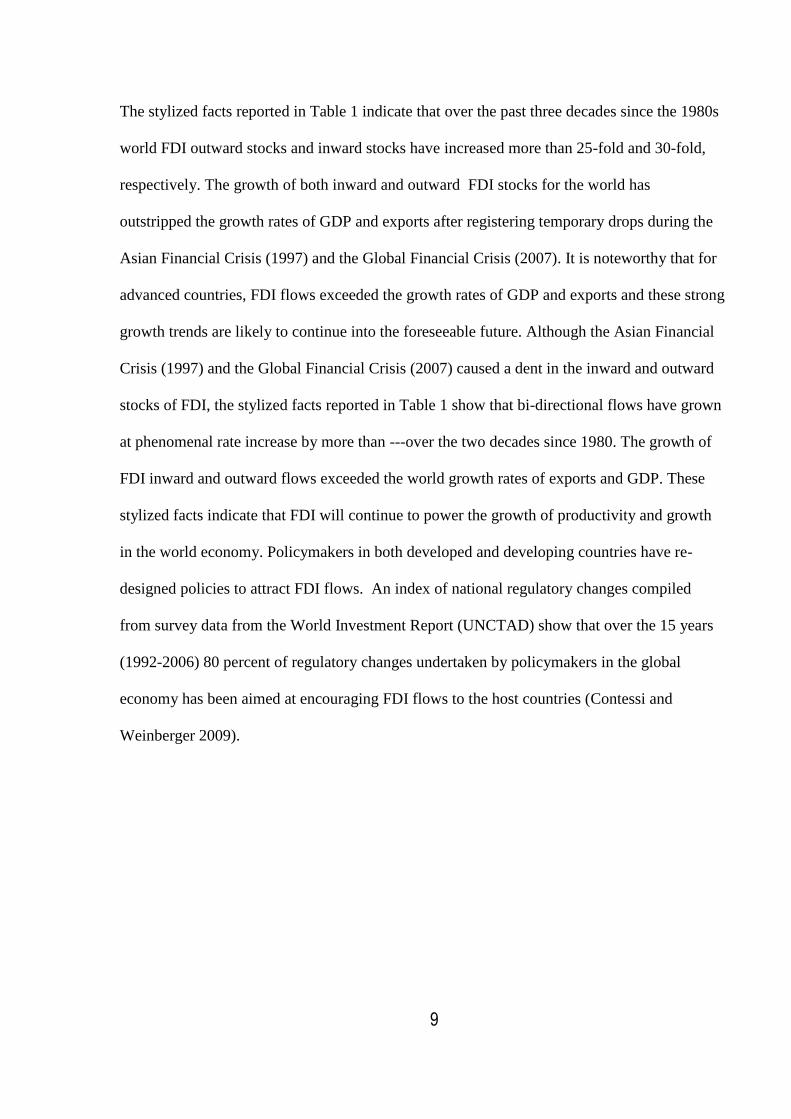
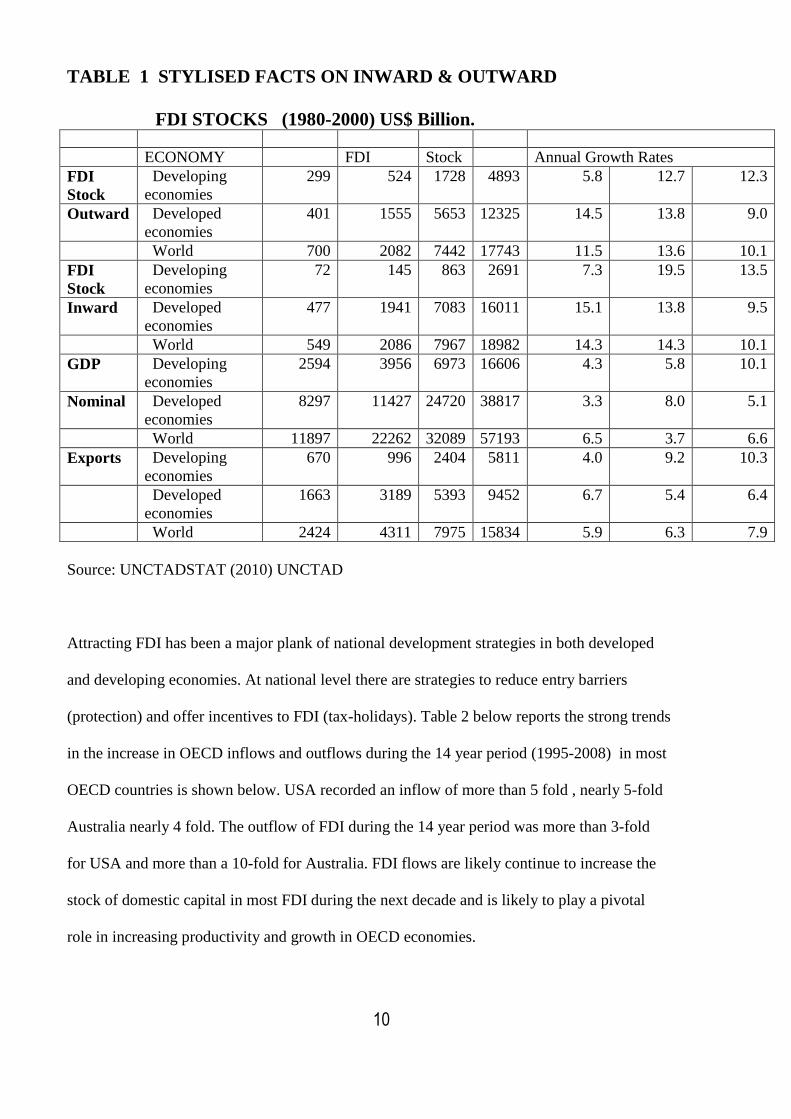
The stylized facts reported in Table 1 indicate that over the past three decades since the 1980s
world FDI outward stocks and inward stocks have increased more than 25-fold and 30-fold,
respectively. The growth of both inward and outward FDI stocks for the world has
outstripped the growth rates of GDP and exports after registering temporary drops during the
Asian Financial Crisis (1997) and the Global Financial Crisis (2007). It is noteworthy that for
advanced countries, FDI flows exceeded the growth rates of GDP and exports and these strong
growth trends are likely to continue into the foreseeable future. Although the Asian Financial
Crisis (1997) and the Global Financial Crisis (2007) caused a dent in the inward and outward
stocks of FDI, the stylized facts reported in Table 1 show that bi-directional flows have grown
at phenomenal rate increase by more than ---over the two decades since 1980. The growth of
FDI inward and outward flows exceeded the world growth rates of exports and GDP. These
stylized facts indicate that FDI will continue to power the growth of productivity and growth
in the world economy. Policymakers in both developed and developing countries have re-
designed policies to attract FDI flows. An index of national regulatory changes compiled
from survey data from the World Investment Report (UNCTAD) show that over the 15 years
(1992-2006) 80 percent of regulatory changes undertaken by policymakers in the global
economy has been aimed at encouraging FDI flows to the host countries (Contessi and
Weinberger 2009).
10
TABLE 1 STYLISED FACTS ON INWARD & OUTWARD
FDI STOCKS (1980-2000) US$ Billion. ECONOMY FDI Stock Annual Growth Rates
FDI
Stock
Developing
economies
299 524 1728 4893 5.8 12.7 12.3
Outward Developed
economies
401 1555 5653 12325 14.5 13.8 9.0
World 700 2082 7442 17743 11.5 13.6 10.1
FDI
Stock
Developing
economies
72 145 863 2691 7.3 19.5 13.5
Inward Developed
economies
477 1941 7083 16011 15.1 13.8 9.5
World 549 2086 7967 18982 14.3 14.3 10.1
GDP Developing
economies
2594 3956 6973 16606 4.3 5.8 10.1
Nominal Developed
economies
8297 11427 24720 38817 3.3 8.0 5.1
World 11897 22262 32089 57193 6.5 3.7 6.6
Exports Developing
economies
670 996 2404 5811 4.0 9.2 10.3
Developed
economies
1663 3189 5393 9452 6.7 5.4 6.4
World 2424 4311 7975 15834 5.9 6.3 7.9
Source: UNCTADSTAT (2010) UNCTAD
Attracting FDI has been a major plank of national development strategies in both developed
and developing economies. At national level there are strategies to reduce entry barriers
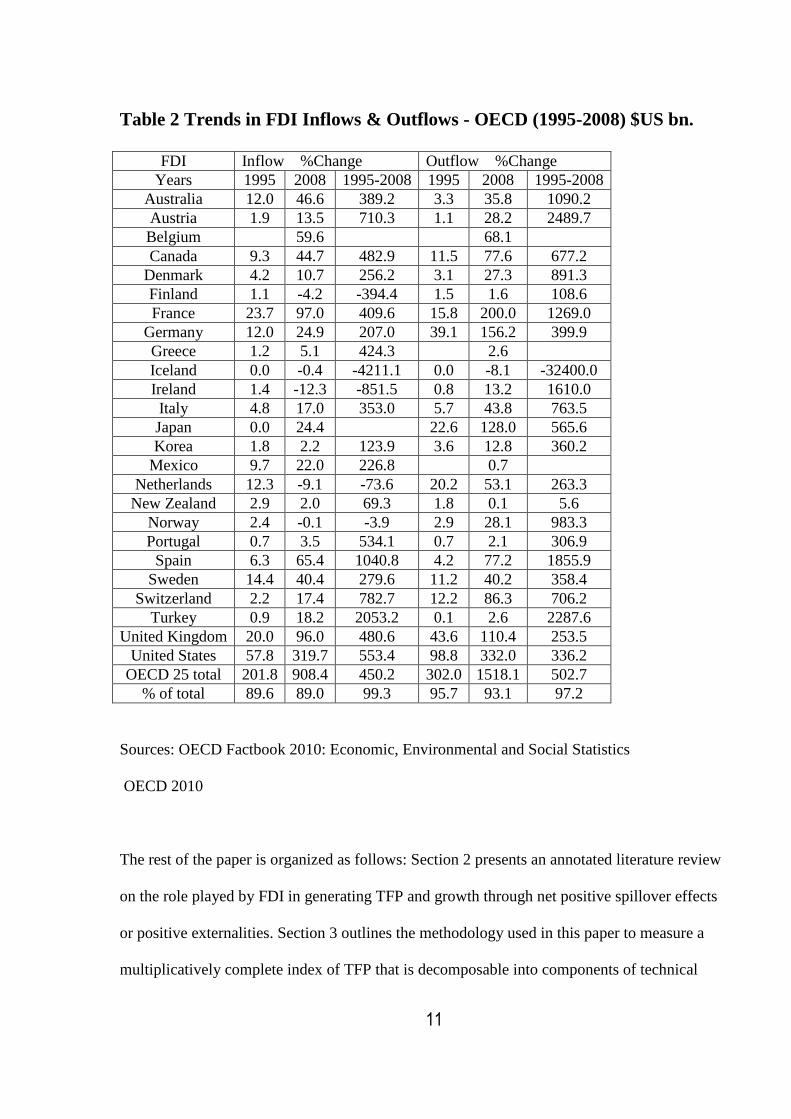
(protection) and offer incentives to FDI (tax-holidays). Table 2 below reports the strong trends
in the increase in OECD inflows and outflows during the 14 year period (1995-2008) in most
OECD countries is shown below. USA recorded an inflow of more than 5 fold , nearly 5-fold
Australia nearly 4 fold. The outflow of FDI during the 14 year period was more than 3-fold
for USA and more than a 10-fold for Australia. FDI flows are likely continue to increase the
stock of domestic capital in most FDI during the next decade and is likely to play a pivotal
role in increasing productivity and growth in OECD economies.
11
Table 2 Trends in FDI Inflows & Outflows - OECD (1995-2008) $US bn.
FDI Inflow %Change Outflow %Change
Years 1995 2008 1995-2008 1995 2008 1995-2008
Australia 12.0 46.6 389.2 3.3 35.8 1090.2
Austria 1.9 13.5 710.3 1.1 28.2 2489.7
Belgium 59.6 68.1
Canada 9.3 44.7 482.9 11.5 77.6 677.2
Denmark 4.2 10.7 256.2 3.1 27.3 891.3
Finland 1.1 -4.2 -394.4 1.5 1.6 108.6
France 23.7 97.0 409.6 15.8 200.0 1269.0
Germany 12.0 24.9 207.0 39.1 156.2 399.9
Greece 1.2 5.1 424.3 2.6
Iceland 0.0 -0.4 -4211.1 0.0 -8.1 -32400.0
Ireland 1.4 -12.3 -851.5 0.8 13.2 1610.0
Italy 4.8 17.0 353.0 5.7 43.8 763.5
Japan 0.0 24.4 22.6 128.0 565.6
Korea 1.8 2.2 123.9 3.6 12.8 360.2
Mexico 9.7 22.0 226.8 0.7
Netherlands 12.3 -9.1 -73.6 20.2 53.1 263.3
New Zealand 2.9 2.0 69.3 1.8 0.1 5.6
Norway 2.4 -0.1 -3.9 2.9 28.1 983.3
Portugal 0.7 3.5 534.1 0.7 2.1 306.9
Spain 6.3 65.4 1040.8 4.2 77.2 1855.9
Sweden 14.4 40.4 279.6 11.2 40.2 358.4
Switzerland 2.2 17.4 782.7 12.2 86.3 706.2
Turkey 0.9 18.2 2053.2 0.1 2.6 2287.6
United Kingdom 20.0 96.0 480.6 43.6 110.4 253.5
United States 57.8 319.7 553.4 98.8 332.0 336.2
OECD 25 total 201.8 908.4 450.2 302.0 1518.1 502.7
% of total 89.6 89.0 99.3 95.7 93.1 97.2
Sources: OECD Factbook 2010: Economic, Environmental and Social Statistics
OECD 2010
The rest of the paper is organized as follows: Section 2 presents an annotated literature review
on the role played by FDI in generating TFP and growth through net positive spillover effects
or positive externalities. Section 3 outlines the methodology used in this paper to measure a
multiplicatively complete index of TFP that is decomposable into components of technical

12
change and various measures of technical efficiency that can act proxy measures of
technological spillover effects due to FDI. Section 4 outlines the methodology of panel data
econometrics that has been deployed in this study to measure the link between changes in TFP
and FDI in the context of other major explanatory and controlling variables governing the
economies of the panel of OECD countries studied in this paper. Section 5 presents the key
empirical findings that link TFP changes to cross-border FDI flows subject to openness, R&D,
capital formation and control variables due to policy effects of inflation and government
spending and business cycle effects. Section 6 concludes the paper offering some policy
perspectives.
2. Literature Review
The importance of increasing total factor productivity or output as ratio of the various factor
input is widely recognized to be a key determinant of a nation’s growth and enhancement of
the living standards of its populace as underscored in the quotes of several eminent
economists:
“Productivity… in the long run it is almost everything.” (Krugman, 1994).
“Nothing contributes more to reduction of poverty..”, than productivity (Blinder, 1993)
“Productivity is the prime determinant in the long run of a nation’s standard of living. “
(Porter, 1991).
The empirical literature on the measurement of productivity identifies as a core indicator
increase in per capita GDP as a measure of improvement a country’s living standards due to
technical progress. The literature identifies technological change as an important determinant
13
of growth and productive externalities. Neoclassical growth theory identified exogenous
technical progress as an important driver of growth (Solow, 1956). Endogenous growth
models ascribe an important role to technological change for achieving perpetual or
sustainable economic growth (Romer, 1990). These growth theories haves have identified two
important channels through which FDI transfers technological change across borders. The first
channel, known as the diffusion channel plays a catalytic role in advance countries by
generating productivity externalities through the transfer x-efficiency (i.e. managerial,
marketing, product and process innovation, and access to markets and adaptation of advance
country technologies) according to (Coe, 1995, Grossman, 1991, De Mello., 1997). The
second channel through which FDI transfers technology is known as the absorption channel
and plays a significant role in increasing productivity and growth in the host country by
facilitating the absorption, adaptation, imitation , ‘learning- by- doing’ and reverse
engineering of new technology innovated in advance countries i(Coe, 1995, Savvides, 2005)
In this paper, we regard the increase in nation’s TFP as the major fulcrum that generates
positive externalities or spillover effects due to the cross-border transfer of technology via
FDI.
The major bone of contention is whether inward FDI stocks complements (crowds-in) or
substitutes (crowds-out) domestic investment. The crowding-in hypothesis contends that FDI
inward stocks alters the ownership structure of domestic investment and provides additional
capital, technological know-how, R&D that stimulates product and process innovation,
provides access to overseas marketing net works – and thus increases the profitability of
domestic investors. On the contrary, the crowding-out hypothesis contends that FDI inward
stocks reduces the market share of domestic firms, decreases profitability and drives domestic
firms to the wall. Below, we list the arguments that have been advanced by the proponents of
the crowding-in and crowding-out hypothesis based on a selective survey of the literature.
14
The proponents of the crowding-in hypothesis assert that FDI inflows causes domestic firms
in the host country to: i. Increase their investment in the domestic firms in order to meet the
competitive challenges posed by FDI (De Mello, 1999). ii. FDI inflows could increase
investment in infrastructure (transport and telecommunication) (Cardoso and Dornbusch,
1989). iii. FDI brings in its train the firm specific assets that promote innovation of new
products and processes (Herzer, 2008) (Blomström M., 1998). iv. FDI will increase demands
for host country factor inputs (capital and labour). v. FDI will create agglomeration
economies that attract more foreign investors and increase complementarities to host country
firm(Markusen J R and Venables A J., 1998) The operation of the crowding-hypothesis is
conditional on the host country attaining threshold levels of human capital development
(Carkovic. M. and Levine. R. , 2009, Borensztein, 1998) , degree of openness to trade
(Balasubramanyam, 1996, Bhagwati, 1978), level of financial sector development (Alfaro,
2004)
The proponents of the crowding-out hypothesis associate a number of adverse effects with
FDI inward stocks. i. The technological superiority of FDI gives them an advantage over
domestic firms to exploit profitable investment opportunities that arise ( (Fry M.J., 1992,
Agosin M. R. and Mayer R., 2000).(Kokko A., 1994). ii. Under conditions of imperfect
competition the advent of FDI in the host country could reduce the market share of domestic
firms and drive them to the wall due to reduce profitability (Kokko A., 1994). iii. Domestic
investment has no crowding out effects on domestic investments by increasing imports and
causing a worsening of the terms of trade increases in the current account and balance of
payments deficits(Stevens, 1992).iv. FDI can also crowd-out domestic firms because of the
inability of domestic firms to compete successfully with MNCs and their affiliates and
subsidiaries for the limited credit and financial resources that are available to a host nation
15
(Apergis N. Katrakilidis C. and Tabakis M., 2006). The openness to trade and investment
through trade liberalisation does not appear to have crowding out effects on domestic
investment according to studies by (Harrison(Harrison A. and Revenga A., 1995).
The crowding-in and crowding-out effects of FDI operate through a complex matrix of
channels giving results that diverge from theoretical predictions and intuition of the
policymakers. Therefore, whether FDI inflows can through net crowding-in effects can
generate positive externalities in the host or source country has to be resolved by empirical
analysis(Desai and . 2005).. A task, which we address in the next section.
FDI by MNCs are motivated by the objective of lowering production costs either by vertical
integration abroad or through access to new markets through horizontal integration. The
positive negative spillover effects from these different types of integration vary according to
the degree of FDI competition with domestic firms and market share in the host economy
(Arndt, 2010). Cross-country regressions empirics performed at the macro-level indicate that
technology transfer by FDI flows have different types of growth and productivity externalities
in advanced and developing countries. In developing countries for technology transfer through
FDI to ignite positive growth and productivity externalities it is imperative that the developing
country should have attained a critical threshold level of human capital development, well
functioning capital markets and open or liberal trading regimes to have the absorptive capacity
to benefit from the technology transferred by FDI (Carkovic, 2009, Borensztein, 1998, Xu,
2000a, Carkovic. M. and Levine. R. , 2009) . Some cross-country regression studies
demonstrate that technology transfer through FDI flows generate positive externalities in host
countries even if there is no strong absorptive capacity due to the absence of a developed
human capital threshold (Khawar, 2005). Some cross-country regression studies based on
developing countries demonstrate that openness to trade through the implementation of export
16
oriented industrialization strategies rather than inward looking import substituting
industrialization strategies are crucial for the positive growth and productivity externalities for
technology transfer through FDI flows to occur(Balasubramanyam, 1996, Xu, 2000b)
However, allowing unfettered technology transfer through FDI by removing capital controls
before the establishment of a sound financial and banking system could lead to moral hazard
outcomes due to the absence of prudential supervision of FDI flows rendering the host country
vulnerable to financial crises due to ‘sudden stops’ of capital flows due to panic behavior by
foreign investors (Bhagwati, 1978, Stiglitz, 2009)
The above literature review clearly establishes the case to analyze the effects of FDI flows on
advanced countries separately from those of developing countries as they are subject to
different human capital and financial structure threshold effects. Furthermore, the importance
of analyzing the effects of spillover effects of FDI flows by focusing on components of total
factor productivity rather than GDP growth is more insightful and provides useful guidelines
for policymakers confronted with task of designing policies for regulating the inflow and
outflow of FDI flows in a manner consistent with national interest.
.
The literature of the empirical effects o cross-border net FDI inflows are shrouded in
ambiguity and therefore rigorous empirical analysis is required to shed light on the
complex dynamics linking cross-border FDI flows and the TFP related spillover effects
they generate.
3. The Measurement of Total Factor Productivity (TFP)
17
It is our contention that the direct measurement of TFP and externalities or spillover effects
due FDI inward or outward stocks provide a more incisive measure of externalities than that
provided by the use of GDP growth as in most empirical studies undertaken on the subject to
date. The measurement of TFP poses formidable challenges and much of the neoclassical
growth literature use growth accounting to obtain TFP as a residual from by rearranging
components of a Cobb-Douglas , Translog of CES production function. The ‘Solow residual’
obtain from the Cobb-Douglas production function (Solow, 1956) is used to measure TFP and
some critics regard it as an “an index of ignorance” although Solow popularised this as a
measure of the unobserved component as a measure of TFP or exogenous technological
progress. In this study, we break new ground by measuring TFP using a multiplicatively
complete index number to measure TFP. A multiplicatively complete index number enables
the decomposition of measures of TFP into components of technical change and several
measures of technical efficiency as hypothesised by (O'Donell CJ., 2009, O'Donell, 2008). In
this study, we argue that these components provide proxy measures of technological spillover
associated with FDI cross-border flows.
The methodology used in this study to measure TFP assumes that TFP resulting FDI flows
into a country in period t is a ratio of aggregate output (Qt) to aggregate input (Xt) defined by:
TFPt = Qt/Xt (1)
The by computing the ratio defined below TFP growth from period 0 to period t for a given
country in terms of an index number:
TFP0t = Q0t /X0t (2)
18
The TFP index number defined above satisfies the properties of multiplicative completeness
and therefore lends itself to decomposition to components of technical change ( (O'Donell CJ.,
2009). The components can be used to measure important technological spillover effects
generated by FDI flows that have eluded rigorous quantification so far. The decomposition of
the TFP index into input-oriented components of technical change can be explained following
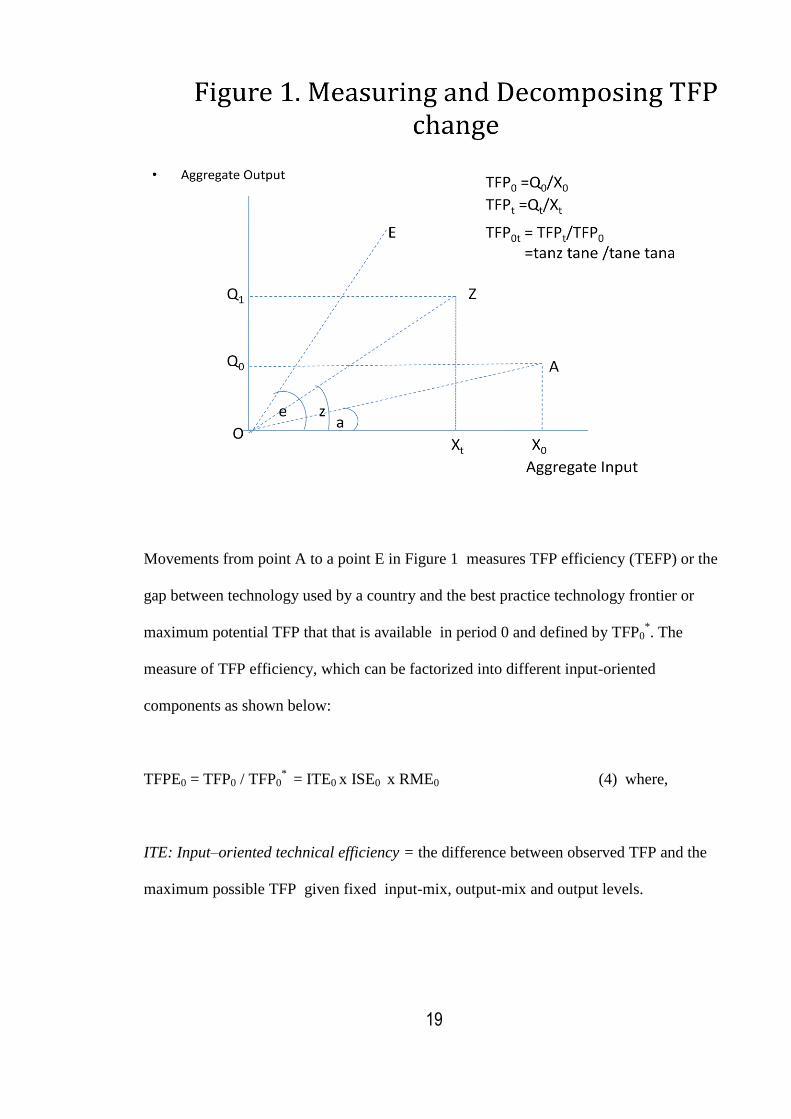
O’Donnell, in Figure 1 in the input-output or X-Q space. In the Figure the change in TFP
from period 0 and period t is depicted by a change in the slopes of the rays that pass through
the origin at point A and Z, shown by the angles and marked by the lower case letters a and z .
The index that measures the change in TFP between period 0 and 1 for a given country can be
defined by the ratio of the angles or the tangents as shown below, where tane represents TFP
at some non-negative point E on the X-Q space:
TFP0t = (tanz/tane) /(tane/tana) (3)
The equation (3) demonstrates that an index of TFP that can be expressed in terms of ratios of
output and input changes can be decomposed into several input-oriented decompositions that
also double up measures of spillover effects. The input-oriented decomposition measures have
also output oriented counterparts, which have similar interpretation and meaning.
19
Movements from point A to a point E in Figure 1 measures TFP efficiency (TEFP) or the
gap between technology used by a country and the best practice technology frontier or
maximum potential TFP that that is available in period 0 and defined by TFP0*. The
measure of TFP efficiency, which can be factorized into different input-oriented
components as shown below:
TFPE0 = TFP0 / TFP0* = ITE0 x ISE0 x RME0 (4) where,
ITE: Input–oriented technical efficiency = the difference between observed TFP and the
maximum possible TFP given fixed input-mix, output-mix and output levels.
20
ISE: Input –oriented scale efficiency = difference between TFP at a technically efficient
point and the maximum possible TFP while letting output vary given fixed input and
output mixes.
Residual Mix Efficiency (RME) = difference between TFP at a point on a mix restricted
frontier and the maximum TFP possible when input and output mixes and levels) are
variable.
A measure of TFP efficiency for period 1 or TFPE1 can be decomposed in a manner
analogous to that given in equation (4) and the ratio of the two decompositions enables
the specification of a multiplicatively complete index of TFP change between period 0
and 1 as shown below:
TFP0t = TFPt /TFP0 = [TFPt/TFP0*] x [ ITEt/ITE0 x ISEt/ISE0 x RMEt/RME0 ] (5)
In equation (5) the first term within parenthesis on the right hand side measures technical
change and is given by the ratio of the difference between the maximum potential TFP that
can be generated using technology available in period t and the period 0, respectively. The
other ratios measure technical efficiency change, scale efficiency change and residual mix that
occur between period 0 and t. The input oriented measures of technical change have output-
oriented counterparts that have similar interpretations. The DPIN Software based on non-
parametric data envelope analysis (DEA) written by (O'Donell CJ., 2009) has been used in
this study to decompose the multiplicatively complete using the Moorsteen-Bjurek TFP index
and the results are reported in Table 3. Several other index numbers satisfy the properties of
multiplicative completeness that facilitates the decomposition of TFP changes based in
meaningful components of technical change and technical efficiency that also can be
21
interpreted as spillover effect measures. The other index numbers that satisfy the properties of
multiplicative completeness include, Laspeyres, Paasche, Fisher Ideal, Tornquist, Hicks-
Moorsteen indexes. However, it is noteworthy that widely used Malmquist index popularized
by(Caves, 1982) fails to satisfy the properties of multiplicative completeness and therefore
cannot be used in the analysis of spillover effects due to technological change caused by FDI
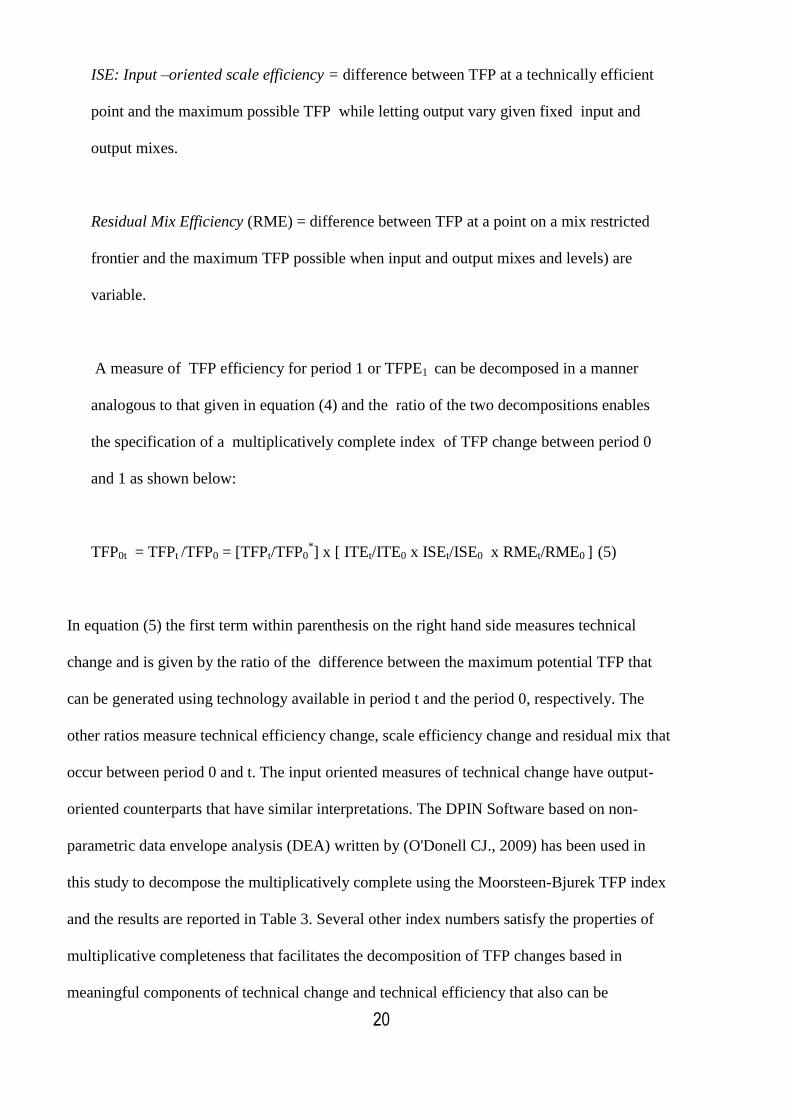
flows. The DPIN software also provides estimate of the decomposition of both input and
output oriented technical, scale and mix-efficiency and also measures of components of TFP
change are reported in Table 3 and Table 4 respectively and are given below:
TABLE 3 MEASURES OF TECHNICAL, SCALE & MIX EFFICIENCY
Year Obs Country Scores
t i n OTE OSE OME ITE ISE IME
1982 26 1 Australia 0.71 1 1 0.71 1 0.73
1982 29 4 Canada 0.64 1 1 0.64 1 0.59
1982 42 17 NZ 0.49 1 1 0.49 1 0.61
1982 49 24 UK 0.53 1 1 0.53 1 0.51
1982 50 25 USA 0.65 1 1 0.65 1 0.62
1992 276 1 Australia 0.41 1 1 0.41 1 0.89
1992 279 4 Canada 0.29 1 1 0.29 1 0.77
1992 292 17 NZ 0.58 1 1 0.58 1 0.94
1992 299 24 UK 0.47 1 1 0.47 1 0.99
1992 300 25 USA 0.6 1 1 0.6 1 0.94
2002 526 1 Australia 0.32 1 1 0.32 1 0.89
2002 529 4 Canada 0.24 1 1 0.24 1 0.75
2002 542 17 New Zealand 0.53 1 1 0.53 1 0.98
2002 549 24 UK 0.6 1 1 0.6 1 1
2002 550 25 USA 0.59 1 1 0.59 1 0.96
2007 651 1 Australia 0.02 1 1 0.02 1 0.56
2007 654 4 Canada 0.02 1 1 0.02 1 0.31
2007 667 17 NZ 0.02 1 1 0.02 1 0.83
2007 674 24 UK 0.02 1 1 0.02 1 0.92
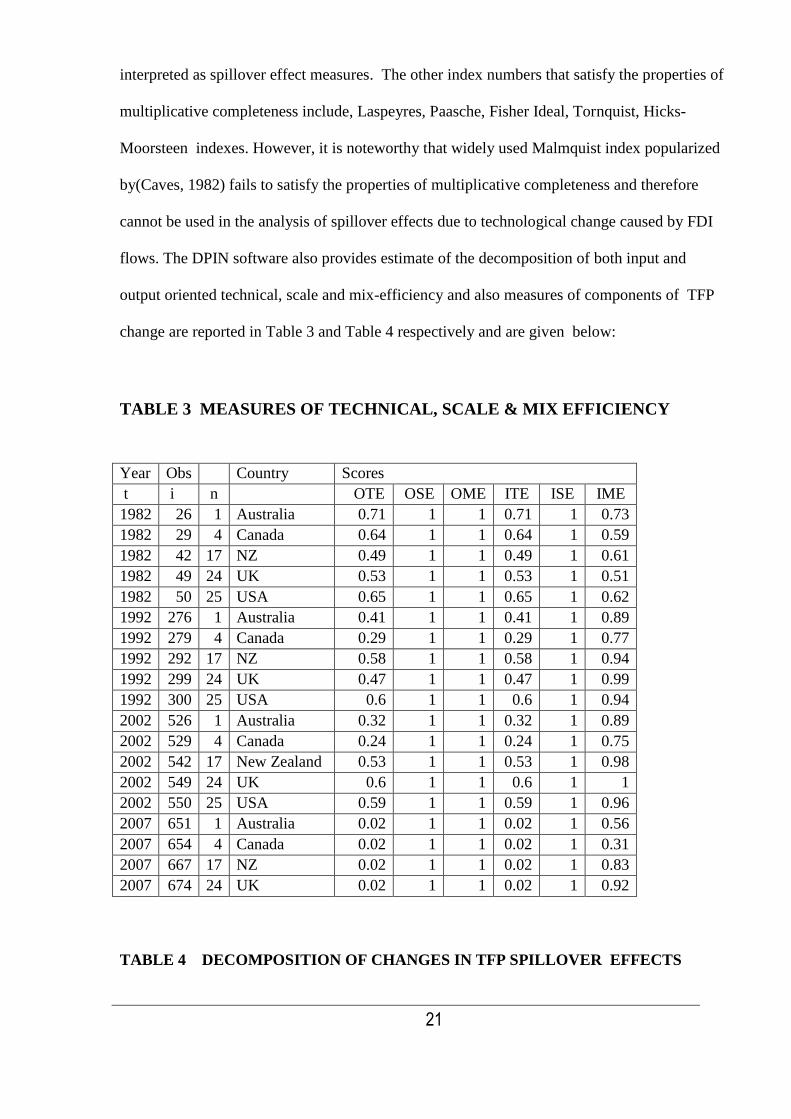
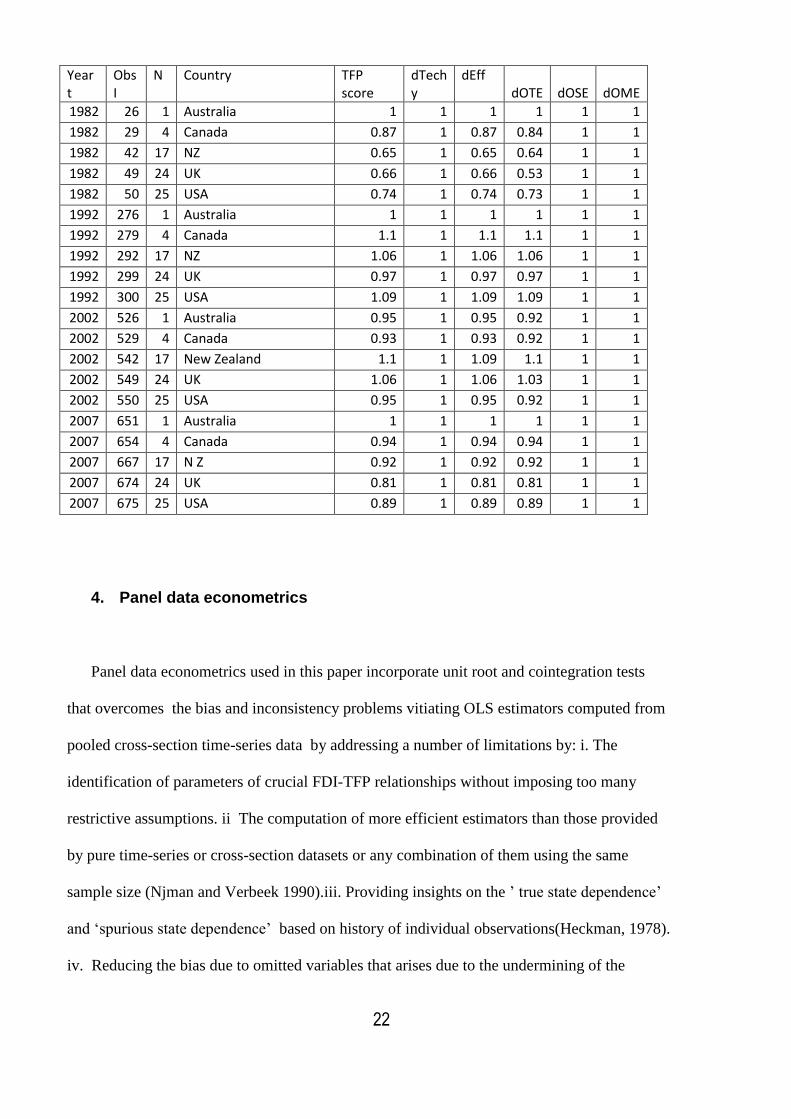
TABLE 4 DECOMPOSITION OF CHANGES IN TFP SPILLOVER EFFECTS
22
Year t
Obs I
N Country
TFP score
dTech y
dEff dOTE
dOSE
dOME
1982 26 1 Australia 1 1 1 1 1 1
1982 29 4 Canada 0.87 1 0.87 0.84 1 1
1982 42 17 NZ 0.65 1 0.65 0.64 1 1
1982 49 24 UK 0.66 1 0.66 0.53 1 1
1982 50 25 USA 0.74 1 0.74 0.73 1 1
1992 276 1 Australia 1 1 1 1 1 1
1992 279 4 Canada 1.1 1 1.1 1.1 1 1
1992 292 17 NZ 1.06 1 1.06 1.06 1 1
1992 299 24 UK 0.97 1 0.97 0.97 1 1
1992 300 25 USA 1.09 1 1.09 1.09 1 1
2002 526 1 Australia 0.95 1 0.95 0.92 1 1
2002 529 4 Canada 0.93 1 0.93 0.92 1 1
2002 542 17 New Zealand 1.1 1 1.09 1.1 1 1
2002 549 24 UK 1.06 1 1.06 1.03 1 1
2002 550 25 USA 0.95 1 0.95 0.92 1 1
2007 651 1 Australia 1 1 1 1 1 1
2007 654 4 Canada 0.94 1 0.94 0.94 1 1
2007 667 17 N Z 0.92 1 0.92 0.92 1 1
2007 674 24 UK 0.81 1 0.81 0.81 1 1
2007 675 25 USA 0.89 1 0.89 0.89 1 1
4. Panel data econometrics
Panel data econometrics used in this paper incorporate unit root and cointegration tests
that overcomes the bias and inconsistency problems vitiating OLS estimators computed from
pooled cross-section time-series data by addressing a number of limitations by: i. The
identification of parameters of crucial FDI-TFP relationships without imposing too many
restrictive assumptions. ii The computation of more efficient estimators than those provided
by pure time-series or cross-section datasets or any combination of them using the same
sample size (Njman and Verbeek 1990).iii. Providing insights on the ’ true state dependence’
and ‘spurious state dependence’ based on history of individual observations(Heckman, 1978).
iv. Reducing the bias due to omitted variables that arises due to the undermining of the
23
assumption that explanatory variables are uncorrelated with the error term (Mundlak, 1961) v.
Identifying valid internal instruments for regressors that are affected by measurement error,
where the transformed original variable transformed into a variable that is correlated with
explanatory variables in the model but uncorrelated with the error term. The advantages of
panel data econometrics are also critically surveyed by (Hsiao, 2003) and (Baltagi, 2005) and
others.
Panel unit root tests
Panel unit root tests are the multiple series analogue of unit root tests of a univariate series.
Panel unit root tests than their univarate counterparts. The panel unit root tests can be
classified based on restrictions on the autoregressive process across cross-sections or series. If
the AR(1) process for panel data is given by :
We report in this paper the unit root tests due to(Levin, 2002) or LLC , (Im, 2003) or IPS
which are panel unit root analogues of the Phillips-Perron (PP) and Augmented Dickey Fuller
(ADF) tests . We also report the results for the Hadri test (Hadri, 2000) which tests the null of
stationarity against the alternative in a panel setting in a manner analogous to the KPSS test in
the univariate case. Furthermore, the Maddala and Wu (1999) MWa panel unit root test is
based on the combination of the p-values of i cross-section unit root tests using a Fisher
24
(1932) index. Here i= 1….N , cross-sections and pi are the p-value of the i-th cross-section.
The resulting non-parametric MW tests could be computed using the Augmented Dickey
Fuller (ADF) or Phillips-Perron (PP) statistic which defined by P ( ) =- pi ) ~
2
(2Nd
.f). A detailed description of these statistics is given in the EVIEWS 7.1Manual.
Panel cointegration tests
Panel cointegration tests estimate the long-run equilibrium relationship between the TFP and
FDI variables of interest. The Engle-Granger Representation theorem (Engle and Granger
1987) postulates if the variables of interest are integrated order one I(1) and if the residuals of
the regression which specifies a linear combination of the variables of interest are stationary
or I(0) , then the variables of interest are cointegrated.
The methodology enunciated by (Pedroni, 1999) is invoked to implement cointegration tests
or tests for long-run equilibrium relationships among the major variables linking total factor
productivity and FDI and other major economic variab.es.. The Pedroni methodology which
is analogous to follows the Engle-Granger two-step procedure in the univariate case, allows
for the testing for the presence of heterogenous slope coefficients, fixed effects and individual
specific deterministic trends in the cointegration equation (1) as exemplified below:.
(1)
.
25
Where the residuals estimated from the panel regression equation (1) follows the AR-process
given in equation (2), where testing for cointegration is a test of whether the null-hypothesis
H0: i=1 for all i in the equation (2) below:
(2)
Pedroni formulates seven statistics based on the residuals of the cointegration regression
above.. The asymptotic distributions derived from these panel cointegration are used to derive
critical values for the cointegration test statistics under standardizations , based on the
moments of Brownian motion functions, which are distributed standard normal (Pedroni 1999:
660-661). The seven statistics formulated by Pedroni to test the null of no cointegration in
heterogenous panels are classified into four “within-dimension” panel tests and three
“between-dimension” group tests. The within-dimension tests take into account common time
factors and allow for heterogeneity across countries. The between-dimension tests are group
mean tests that take into account of heterogeneity of parameters across countries.
Granger causality tests
In order to test for the direction of causality between TFP and FDI variables we first estimate
the variants of the panel cointegration equation (1) by applying the methodology of based on
the Engle-Granger residual method as to panel data by Pedroni (2001). The estimated
equations only reveal the existence or not of cointegrating relationships among the variables
of interest. In order to determine the direction of causality between TFP and FDI we estimate
26
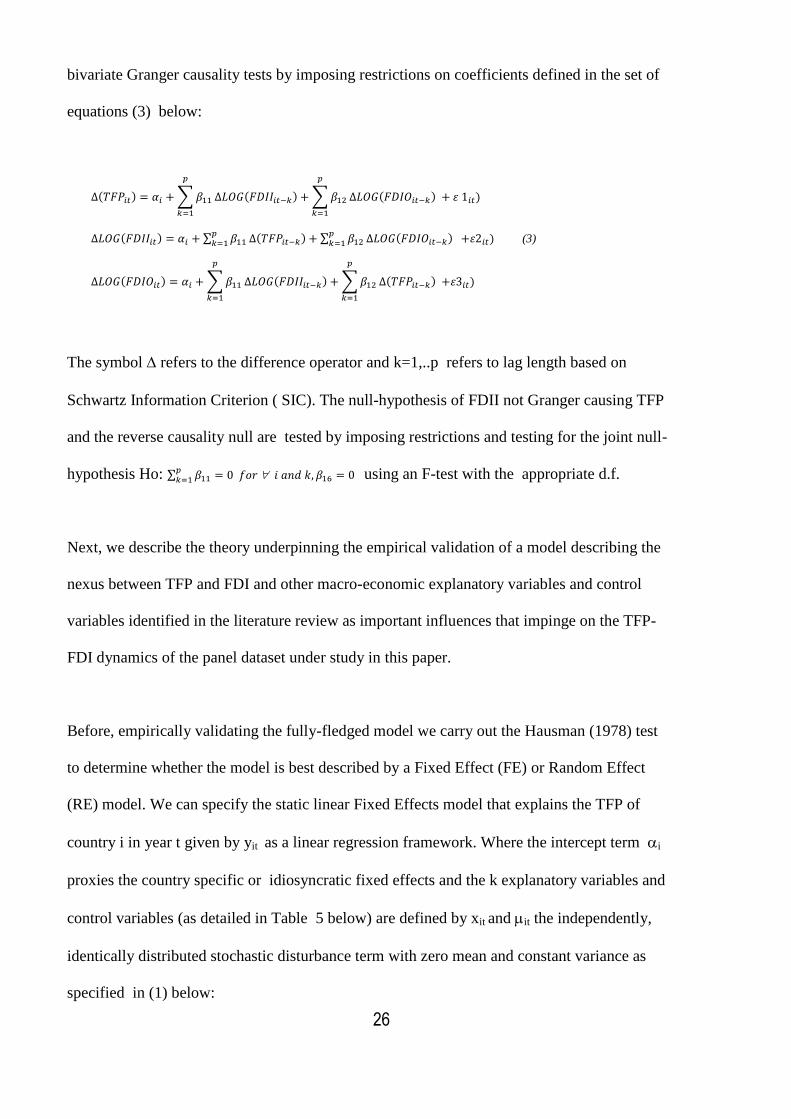
bivariate Granger causality tests by imposing restrictions on coefficients defined in the set of
equations (3) below:
(3)
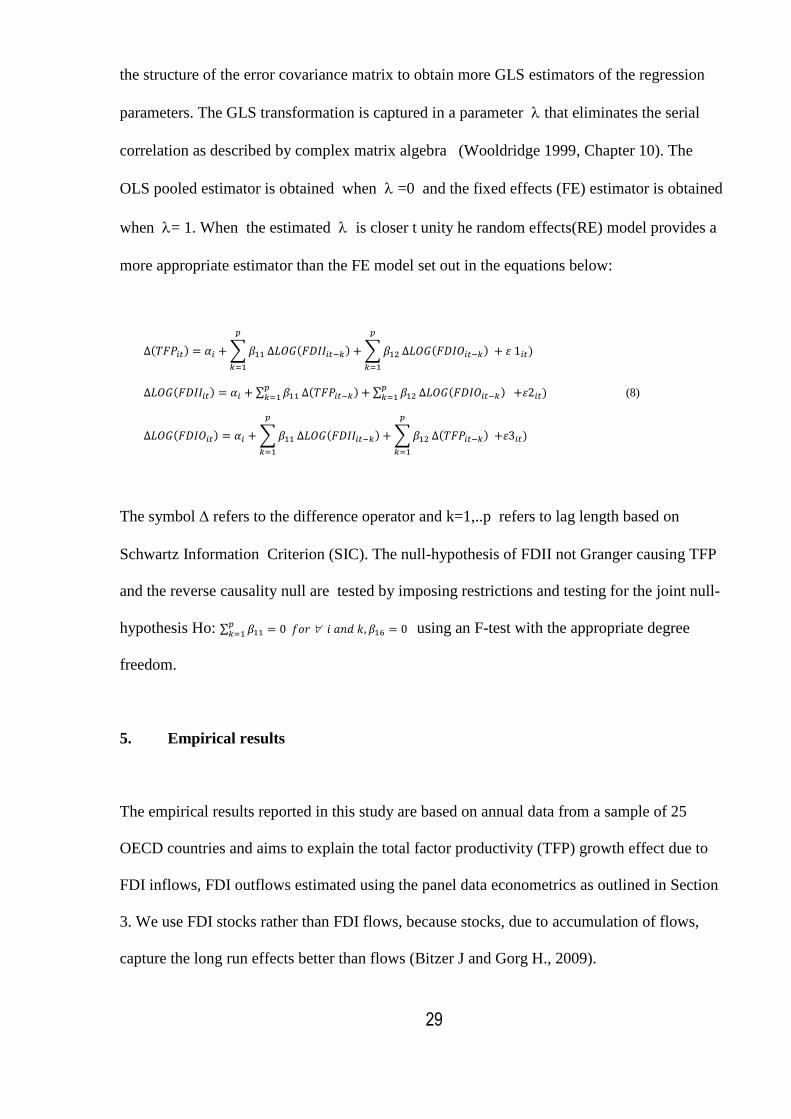
The symbol refers to the difference operator and k=1,..p refers to lag length based on
Schwartz Information Criterion ( SIC). The null-hypothesis of FDII not Granger causing TFP
and the reverse causality null are tested by imposing restrictions and testing for the joint null-
hypothesis Ho: using an F-test with the appropriate d.f.
Next, we describe the theory underpinning the empirical validation of a model describing the
nexus between TFP and FDI and other macro-economic explanatory variables and control
variables identified in the literature review as important influences that impinge on the TFP-
FDI dynamics of the panel dataset under study in this paper.
Before, empirically validating the fully-fledged model we carry out the Hausman (1978) test
to determine whether the model is best described by a Fixed Effect (FE) or Random Effect
(RE) model. We can specify the static linear Fixed Effects model that explains the TFP of
country i in year t given by yit as a linear regression framework. Where the intercept term i
proxies the country specific or idiosyncratic fixed effects and the k explanatory variables and
control variables (as detailed in Table 5 below) are defined by xit and it the independently,
identically distributed stochastic disturbance term with zero mean and constant variance as
specified in (1) below:
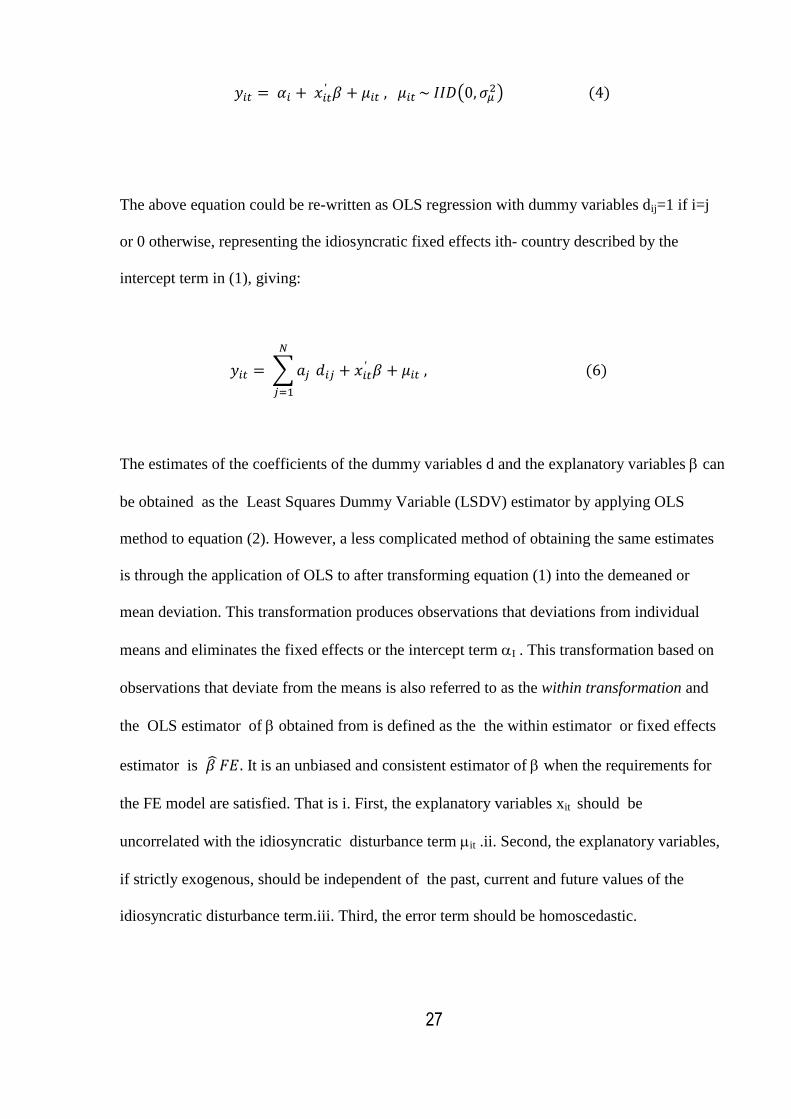
27
The above equation could be re-written as OLS regression with dummy variables dij=1 if i=j
or 0 otherwise, representing the idiosyncratic fixed effects ith- country described by the
intercept term in (1), giving:
The estimates of the coefficients of the dummy variables d and the explanatory variables can
be obtained as the Least Squares Dummy Variable (LSDV) estimator by applying OLS
method to equation (2). However, a less complicated method of obtaining the same estimates
is through the application of OLS to after transforming equation (1) into the demeaned or
mean deviation. This transformation produces observations that deviations from individual
means and eliminates the fixed effects or the intercept term I . This transformation based on
observations that deviate from the means is also referred to as the within transformation and
the OLS estimator of obtained from is defined as the the within estimator or fixed effects
estimator is It is an unbiased and consistent estimator of when the requirements for
the FE model are satisfied. That is i. First, the explanatory variables xit should be
uncorrelated with the idiosyncratic disturbance term it .ii. Second, the explanatory variables,
if strictly exogenous, should be independent of the past, current and future values of the
idiosyncratic disturbance term.iii. Third, the error term should be homoscedastic.
28
The degrees of freedom (df) correction for obtaining the fixed effects estimator by applying
pooled OLS to the time demeaned version of equation (1) we are dealing with a total of NT
observations and k independent variables. For each cross-section or country i, we lose 1 df
because of time-demeaning. Therefore, the appropriate df that should be used in tests of
significance is NT – N –k = N(T-1)-k.
The focus in the FE model is on the differences ‘within’ individual countries, i.e. it explains to
what extent yit differs from the mean of each country, but it does not explain why the mean of
y differs across countries. The FE regression parameters explain effects that are identified
only through the within dimension of the data.
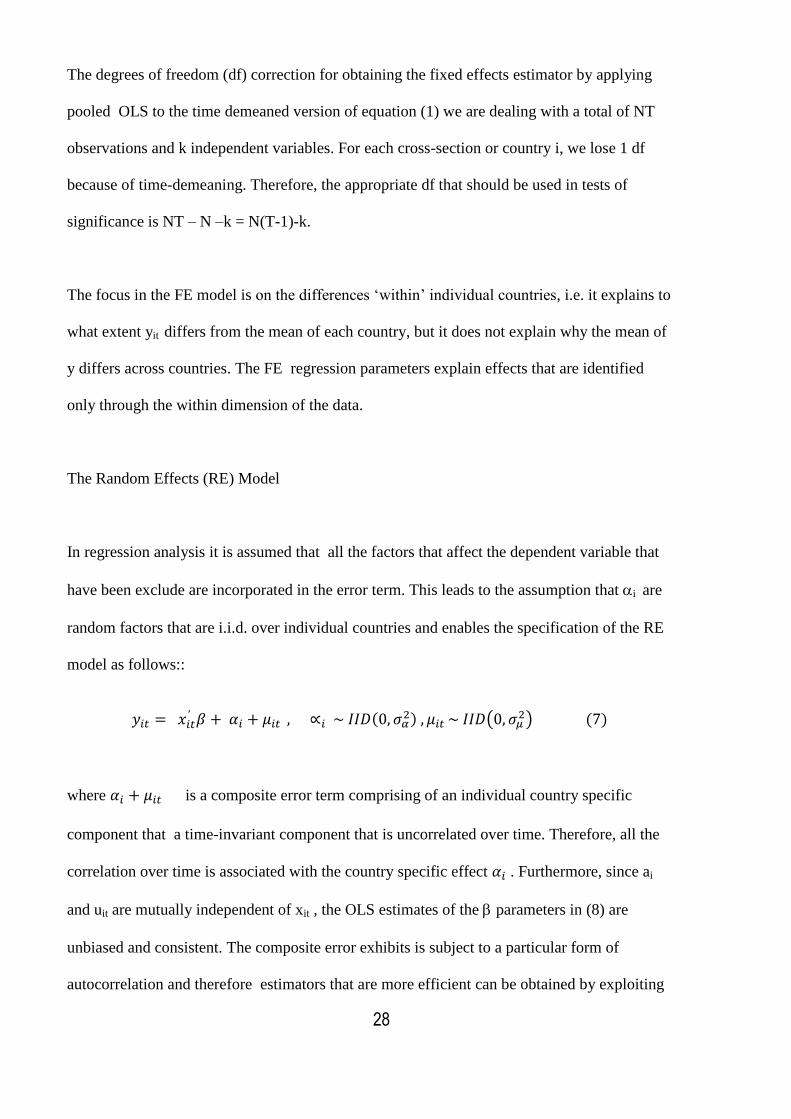
The Random Effects (RE) Model
In regression analysis it is assumed that all the factors that affect the dependent variable that
have been exclude are incorporated in the error term. This leads to the assumption that i are
random factors that are i.i.d. over individual countries and enables the specification of the RE
model as follows::
where is a composite error term comprising of an individual country specific
component that a time-invariant component that is uncorrelated over time. Therefore, all the
correlation over time is associated with the country specific effect . Furthermore, since ai
and uit are mutually independent of xit , the OLS estimates of the parameters in (8) are
unbiased and consistent. The composite error exhibits is subject to a particular form of
autocorrelation and therefore estimators that are more efficient can be obtained by exploiting
29
the structure of the error covariance matrix to obtain more GLS estimators of the regression
parameters. The GLS transformation is captured in a parameter that eliminates the serial
correlation as described by complex matrix algebra (Wooldridge 1999, Chapter 10). The
OLS pooled estimator is obtained when =0 and the fixed effects (FE) estimator is obtained
when = 1. When the estimated is closer t unity he random effects(RE) model provides a
more appropriate estimator than the FE model set out in the equations below:
(8)
The symbol refers to the difference operator and k=1,..p refers to lag length based on
Schwartz Information Criterion (SIC). The null-hypothesis of FDII not Granger causing TFP
and the reverse causality null are tested by imposing restrictions and testing for the joint null-
hypothesis Ho: using an F-test with the appropriate degree
freedom.
5. Empirical results
The empirical results reported in this study are based on annual data from a sample of 25
OECD countries and aims to explain the total factor productivity (TFP) growth effect due to
FDI inflows, FDI outflows estimated using the panel data econometrics as outlined in Section
3. We use FDI stocks rather than FDI flows, because stocks, due to accumulation of flows,
capture the long run effects better than flows (Bitzer J and Gorg H., 2009).
30
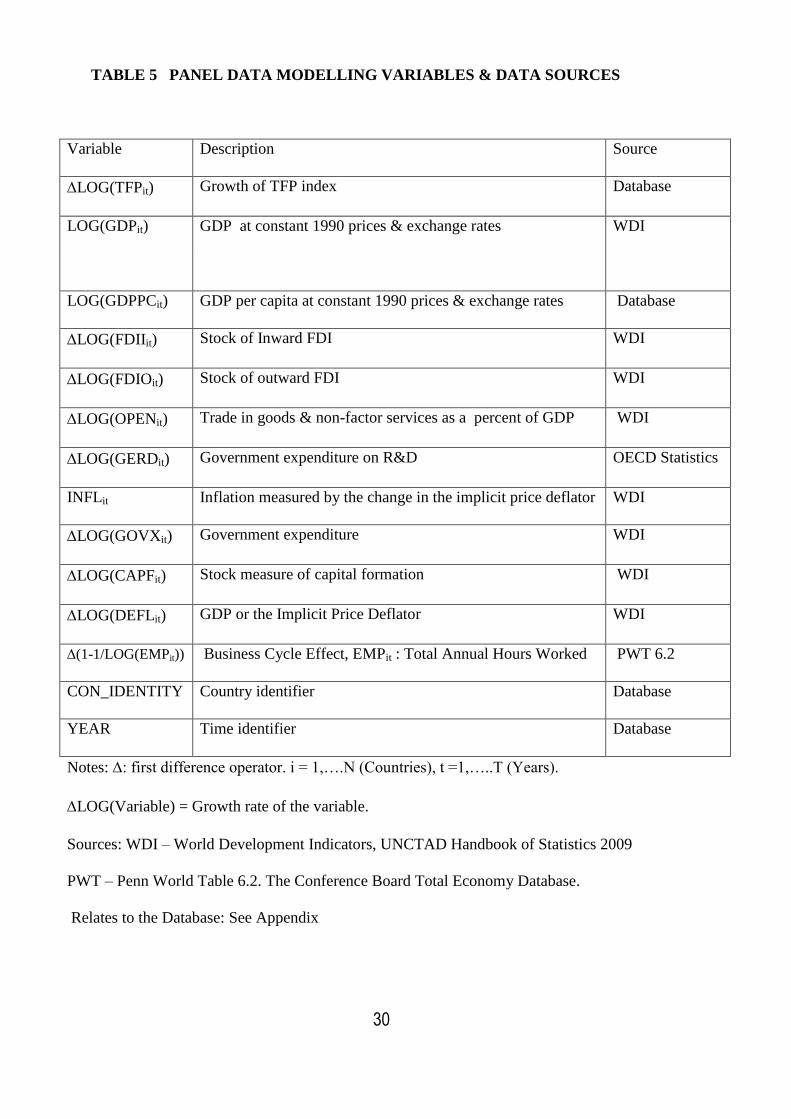
TABLE 5 PANEL DATA MODELLING VARIABLES & DATA SOURCES
Variable Description Source
LOG(TFPit) Growth of TFP index Database
LOG(GDPit) GDP at constant 1990 prices & exchange rates WDI
LOG(GDPPCit) GDP per capita at constant 1990 prices & exchange rates Database
LOG(FDIIit) Stock of Inward FDI WDI
LOG(FDIOit) Stock of outward FDI WDI
LOG(OPENit) Trade in goods & non-factor services as a percent of GDP WDI
LOG(GERDit) Government expenditure on R&D OECD Statistics
INFLit Inflation measured by the change in the implicit price deflator WDI
LOG(GOVXit) Government expenditure WDI
LOG(CAPFit) Stock measure of capital formation WDI
LOG(DEFLit) GDP or the Implicit Price Deflator WDI
(1-1/LOG(EMPit)) Business Cycle Effect, EMPit : Total Annual Hours Worked PWT 6.2
CON_IDENTITY Country identifier Database
YEAR Time identifier Database
Notes: : first difference operator. i = 1,….N (Countries), t =1,…..T (Years).
LOG(Variable) = Growth rate of the variable.
Sources: WDI – World Development Indicators, UNCTAD Handbook of Statistics 2009
PWT – Penn World Table 6.2. The Conference Board Total Economy Database.
Relates to the Database: See Appendix
31
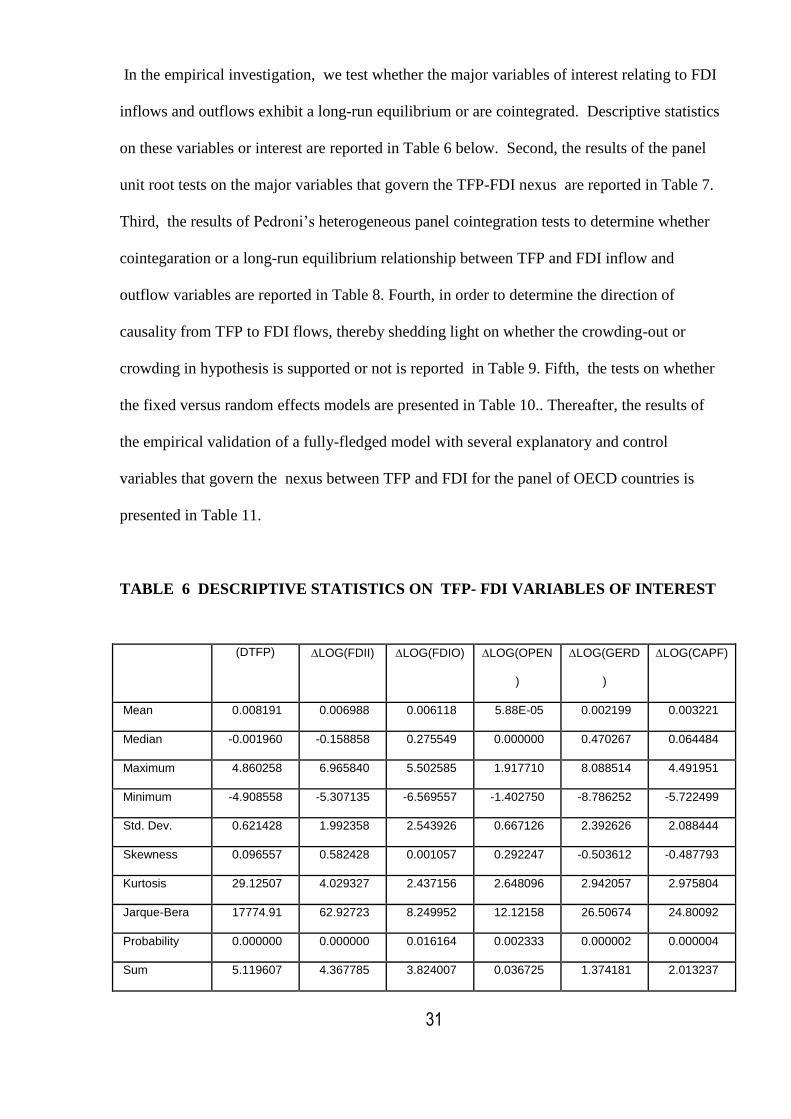
In the empirical investigation, we test whether the major variables of interest relating to FDI
inflows and outflows exhibit a long-run equilibrium or are cointegrated. Descriptive statistics
on these variables or interest are reported in Table 6 below. Second, the results of the panel
unit root tests on the major variables that govern the TFP-FDI nexus are reported in Table 7.
Third, the results of Pedroni’s heterogeneous panel cointegration tests to determine whether
cointegaration or a long-run equilibrium relationship between TFP and FDI inflow and
outflow variables are reported in Table 8. Fourth, in order to determine the direction of
causality from TFP to FDI flows, thereby shedding light on whether the crowding-out or
crowding in hypothesis is supported or not is reported in Table 9. Fifth, the tests on whether
the fixed versus random effects models are presented in Table 10.. Thereafter, the results of
the empirical validation of a fully-fledged model with several explanatory and control
variables that govern the nexus between TFP and FDI for the panel of OECD countries is
presented in Table 11.
TABLE 6 DESCRIPTIVE STATISTICS ON TFP- FDI VARIABLES OF INTEREST
(DTFP) LOG(FDII) LOG(FDIO) LOG(OPEN
)
LOG(GERD
)
LOG(CAPF)
Mean 0.008191 0.006988 0.006118 5.88E-05 0.002199 0.003221
Median -0.001960 -0.158858 0.275549 0.000000 0.470267 0.064484
Maximum 4.860258 6.965840 5.502585 1.917710 8.088514 4.491951
Minimum -4.908558 -5.307135 -6.569557 -1.402750 -8.786252 -5.722499
Std. Dev. 0.621428 1.992358 2.543926 0.667126 2.392626 2.088444
Skewness 0.096557 0.582428 0.001057 0.292247 -0.503612 -0.487793
Kurtosis 29.12507 4.029327 2.437156 2.648096 2.942057 2.975804
Jarque-Bera 17774.91 62.92723 8.249952 12.12158 26.50674 24.80092
Probability 0.000000 0.000000 0.016164 0.002333 0.000002 0.000004
Sum 5.119607 4.367785 3.824007 0.036725 1.374181 2.013237
32
Sum Sq. Dev. 240.9717 2476.962 4038.254 277.7157 3572.186 2721.637
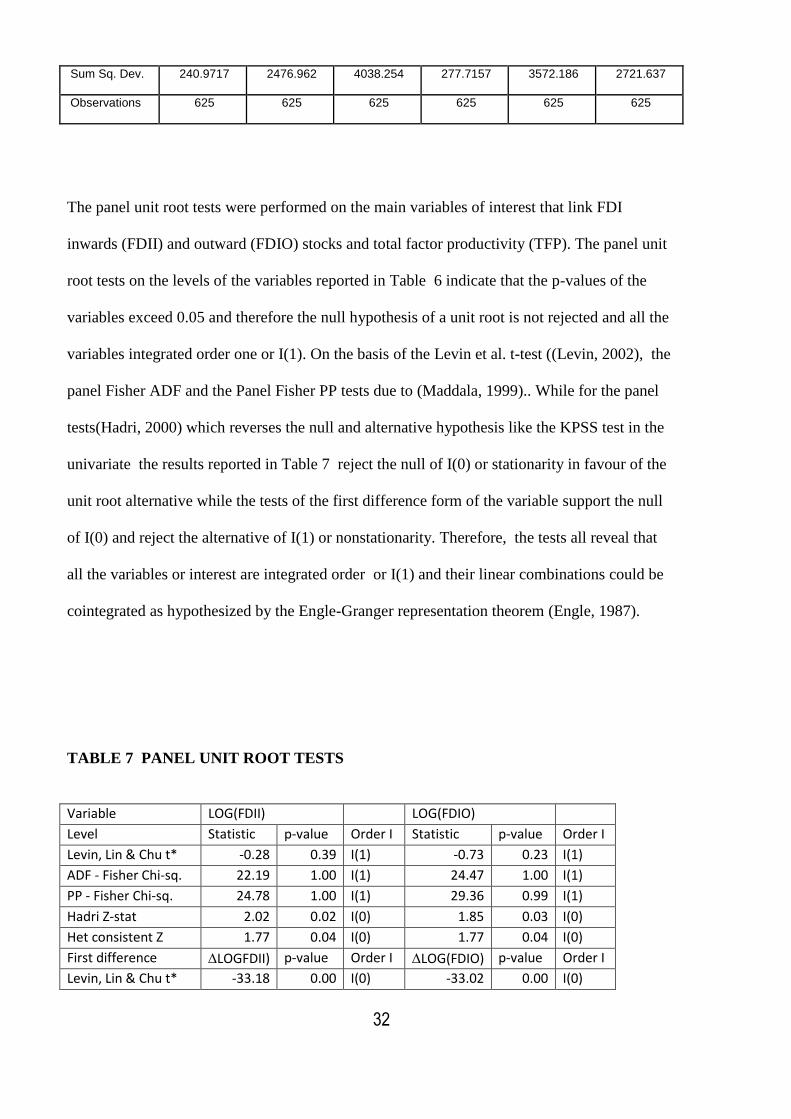
Observations 625 625 625 625 625 625
The panel unit root tests were performed on the main variables of interest that link FDI
inwards (FDII) and outward (FDIO) stocks and total factor productivity (TFP). The panel unit
root tests on the levels of the variables reported in Table 6 indicate that the p-values of the
variables exceed 0.05 and therefore the null hypothesis of a unit root is not rejected and all the
variables integrated order one or I(1). On the basis of the Levin et al. t-test ((Levin, 2002), the
panel Fisher ADF and the Panel Fisher PP tests due to (Maddala, 1999).. While for the panel
tests(Hadri, 2000) which reverses the null and alternative hypothesis like the KPSS test in the
univariate the results reported in Table 7 reject the null of I(0) or stationarity in favour of the
unit root alternative while the tests of the first difference form of the variable support the null
of I(0) and reject the alternative of I(1) or nonstationarity. Therefore, the tests all reveal that
all the variables or interest are integrated order or I(1) and their linear combinations could be
cointegrated as hypothesized by the Engle-Granger representation theorem (Engle, 1987).
TABLE 7 PANEL UNIT ROOT TESTS
Variable LOG(FDII) LOG(FDIO)
Level Statistic p-value Order I Statistic p-value Order I
Levin, Lin & Chu t* -0.28 0.39 I(1) -0.73 0.23 I(1)
ADF - Fisher Chi-sq. 22.19 1.00 I(1) 24.47 1.00 I(1)
PP - Fisher Chi-sq. 24.78 1.00 I(1) 29.36 0.99 I(1)
Hadri Z-stat 2.02 0.02 I(0) 1.85 0.03 I(0)
Het consistent Z 1.77 0.04 I(0) 1.77 0.04 I(0)
First difference LOGFDII) p-value Order I LOG(FDIO) p-value Order I
Levin, Lin & Chu t* -33.18 0.00 I(0) -33.02 0.00 I(0)
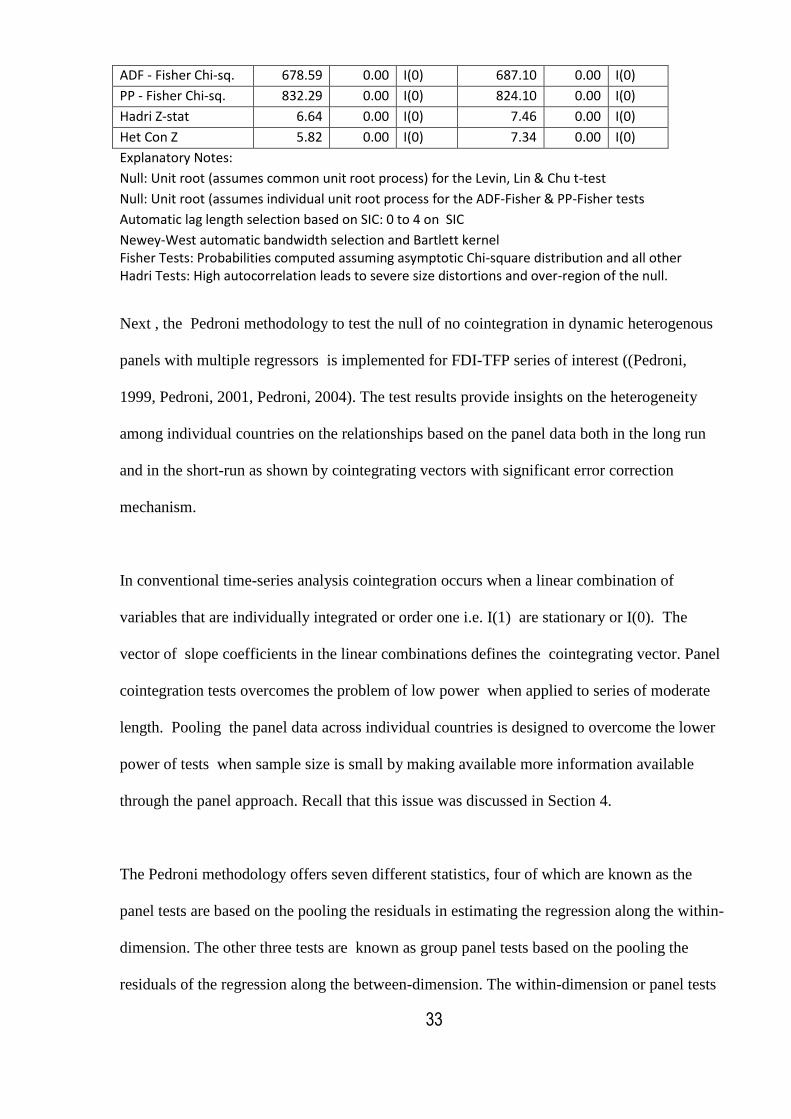
33
ADF - Fisher Chi-sq. 678.59 0.00 I(0) 687.10 0.00 I(0)
PP - Fisher Chi-sq. 832.29 0.00 I(0) 824.10 0.00 I(0)
Hadri Z-stat 6.64 0.00 I(0) 7.46 0.00 I(0)
Het Con Z 5.82 0.00 I(0) 7.34 0.00 I(0)
Explanatory Notes:
Null: Unit root (assumes common unit root process) for the Levin, Lin & Chu t-test
Null: Unit root (assumes individual unit root process for the ADF-Fisher & PP-Fisher tests
Automatic lag length selection based on SIC: 0 to 4 on SIC
Newey-West automatic bandwidth selection and Bartlett kernel Fisher Tests: Probabilities computed assuming asymptotic Chi-square distribution and all other Hadri Tests: High autocorrelation leads to severe size distortions and over-region of the null.
are computed assuming asymptotic normality.
Probabilities are computed assuming asymptotic normality.
Next , the Pedroni methodology to test the null of no cointegration in dynamic heterogenous
panels with multiple regressors is implemented for FDI-TFP series of interest ((Pedroni,
1999, Pedroni, 2001, Pedroni, 2004). The test results provide insights on the heterogeneity
among individual countries on the relationships based on the panel data both in the long run
and in the short-run as shown by cointegrating vectors with significant error correction
mechanism.
In conventional time-series analysis cointegration occurs when a linear combination of
variables that are individually integrated or order one i.e. I(1) are stationary or I(0). The
vector of slope coefficients in the linear combinations defines the cointegrating vector. Panel
cointegration tests overcomes the problem of low power when applied to series of moderate
length. Pooling the panel data across individual countries is designed to overcome the lower
power of tests when sample size is small by making available more information available
through the panel approach. Recall that this issue was discussed in Section 4.
The Pedroni methodology offers seven different statistics, four of which are known as the
panel tests are based on the pooling the residuals in estimating the regression along the within-
dimension. The other three tests are known as group panel tests based on the pooling the
residuals of the regression along the between-dimension. The within-dimension or panel tests
34
takes into account common time factors and allows for heterogeneity across countries. While
the between-dimension or group mean cointegration tests, allow for heterogeneity of
parameters across countries. These seven panel cointegration and the critical values based on
Monte Carlo simulations discussed in (Pedroni, 1999).
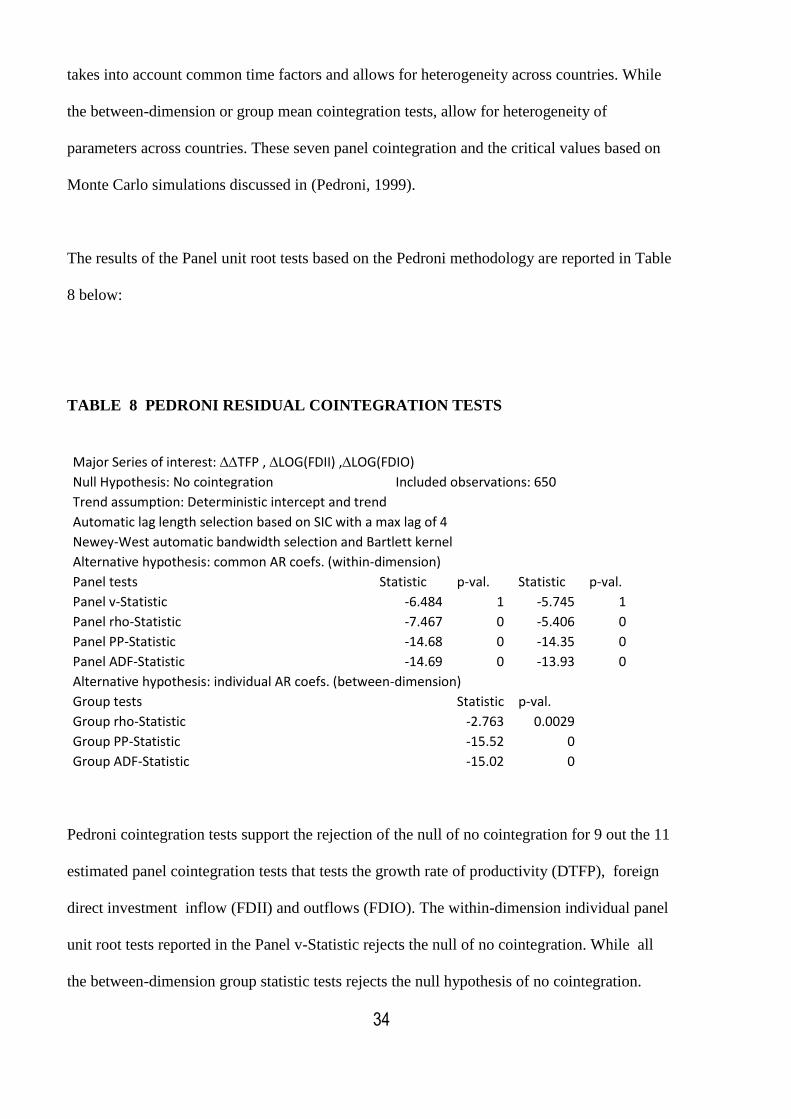
The results of the Panel unit root tests based on the Pedroni methodology are reported in Table
8 below:
TABLE 8 PEDRONI RESIDUAL COINTEGRATION TESTS
Major Series of interest: TFP , LOG(FDII) ,LOG(FDIO)
Null Hypothesis: No cointegration Included observations: 650
Trend assumption: Deterministic intercept and trend Automatic lag length selection based on SIC with a max lag of 4
Newey-West automatic bandwidth selection and Bartlett kernel Alternative hypothesis: common AR coefs. (within-dimension)
Panel tests Statistic p-val. Statistic p-val.
Panel v-Statistic -6.484 1 -5.745 1
Panel rho-Statistic -7.467 0 -5.406 0
Panel PP-Statistic -14.68 0 -14.35 0
Panel ADF-Statistic -14.69 0 -13.93 0
Alternative hypothesis: individual AR coefs. (between-dimension) Group tests
Statistic p-val.
Group rho-Statistic
-2.763 0.0029 Group PP-Statistic
-15.52 0
Group ADF-Statistic
-15.02 0
Pedroni cointegration tests support the rejection of the null of no cointegration for 9 out the 11
estimated panel cointegration tests that tests the growth rate of productivity (DTFP), foreign
direct investment inflow (FDII) and outflows (FDIO). The within-dimension individual panel
unit root tests reported in the Panel v-Statistic rejects the null of no cointegration. While all
the between-dimension group statistic tests rejects the null hypothesis of no cointegration.
35
Therefore, the Pedroni heterogenous panel cointegration tests provide support for the
hypothesis that the growth of total factor productivity and foreign direct investment inflows
and outflows are cointegrated or exhibit a long-run equilibrium relationship.
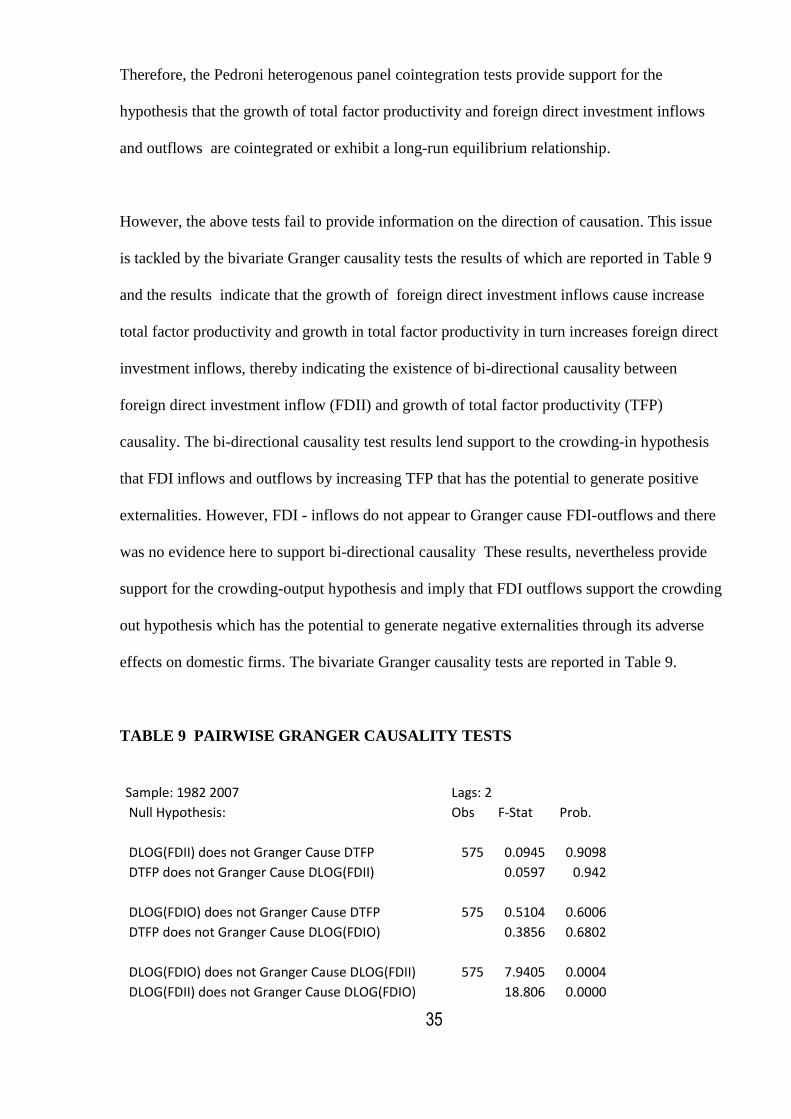
However, the above tests fail to provide information on the direction of causation. This issue
is tackled by the bivariate Granger causality tests the results of which are reported in Table 9
and the results indicate that the growth of foreign direct investment inflows cause increase
total factor productivity and growth in total factor productivity in turn increases foreign direct
investment inflows, thereby indicating the existence of bi-directional causality between
foreign direct investment inflow (FDII) and growth of total factor productivity (TFP)
causality. The bi-directional causality test results lend support to the crowding-in hypothesis
that FDI inflows and outflows by increasing TFP that has the potential to generate positive
externalities. However, FDI - inflows do not appear to Granger cause FDI-outflows and there
was no evidence here to support bi-directional causality These results, nevertheless provide
support for the crowding-output hypothesis and imply that FDI outflows support the crowding
out hypothesis which has the potential to generate negative externalities through its adverse
effects on domestic firms. The bivariate Granger causality tests are reported in Table 9.
TABLE 9 PAIRWISE GRANGER CAUSALITY TESTS
Sample: 1982 2007 Lags: 2
Null Hypothesis: Obs F-Stat Prob.
DLOG(FDII) does not Granger Cause DTFP 575 0.0945 0.9098
DTFP does not Granger Cause DLOG(FDII)
0.0597 0.942
DLOG(FDIO) does not Granger Cause DTFP 575 0.5104 0.6006
DTFP does not Granger Cause DLOG(FDIO)
0.3856 0.6802
DLOG(FDIO) does not Granger Cause DLOG(FDII) 575 7.9405 0.0004
DLOG(FDII) does not Granger Cause DLOG(FDIO)
18.806 0.0000
36
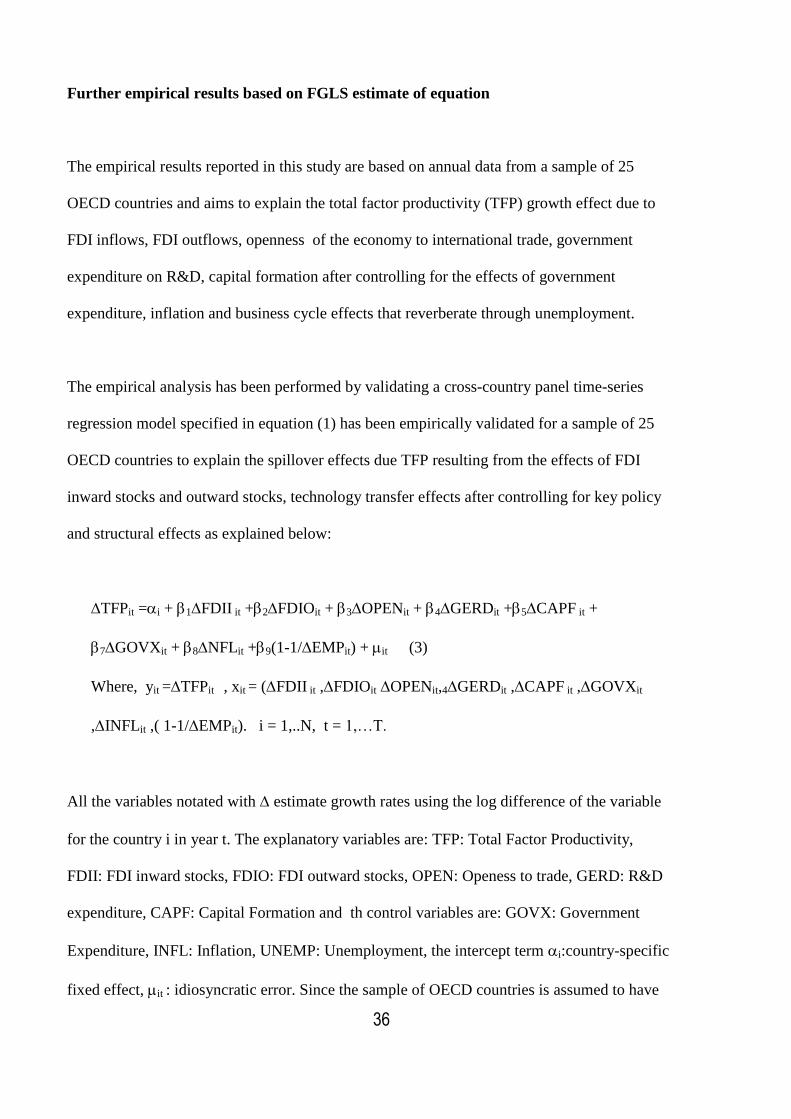
Further empirical results based on FGLS estimate of equation
The empirical results reported in this study are based on annual data from a sample of 25
OECD countries and aims to explain the total factor productivity (TFP) growth effect due to
FDI inflows, FDI outflows, openness of the economy to international trade, government
expenditure on R&D, capital formation after controlling for the effects of government
expenditure, inflation and business cycle effects that reverberate through unemployment.
The empirical analysis has been performed by validating a cross-country panel time-series
regression model specified in equation (1) has been empirically validated for a sample of 25
OECD countries to explain the spillover effects due TFP resulting from the effects of FDI
inward stocks and outward stocks, technology transfer effects after controlling for key policy
and structural effects as explained below:
TFPit =i + 1FDII it +2FDIOit + 3OPENit + 4GERDit +5CAPF it +
7GOVXit + 8NFLit +9(1-1/EMPit) + it (3)
Where, yit =TFPit , xit = (FDII it ,FDIOit OPENit,4GERDit ,CAPF it ,GOVXit
,INFLit ,( 1-1/EMPit). i = 1,..N, t = 1,…T.
All the variables notated with estimate growth rates using the log difference of the variable
for the country i in year t. The explanatory variables are: TFP: Total Factor Productivity,
FDII: FDI inward stocks, FDIO: FDI outward stocks, OPEN: Openess to trade, GERD: R&D
expenditure, CAPF: Capital Formation and th control variables are: GOVX: Government
Expenditure, INFL: Inflation, UNEMP: Unemployment, the intercept term i:country-specific
fixed effect, it : idiosyncratic error. Since the sample of OECD countries is assumed to have
37
attained the same threshold level of development no proxies have been included to capture
any institutional variations among the countries. In the empirical validation we have assumed
that country-specific fixed effects are a more crucial determinant in account for variation of
TFP spillover effects and GDP growth effects due FDI flows as hypothesized by Nath (2009)
rather than the time invariant initial conditions as proxied by GDP per capita (GDPPC) or the
Barro-effect in the convergence theory postulated by Barro and Xala-i-Martin (1995).
Table 5 summarizes the definitions of the variables and data-sources used in the empirical
validation of the panel data TFP and FDI spillover effects model for the OECD countries
investigated in this study.
The regression results from the from 9 sets of regressions using feasible GLS estimation with
cross-country weights are reported in Table 6. Regression models referred in column (1) to (6)
uses time-invariant GDP per capita (GDPPC) or the Barro effect, The results reported for
regression models in columns ((7) to (9) are based on cross-country specific fixed effects
model. The standard errors have been estimated using White’ s heteroscedasticity consistent-
variance covariance estimates that are robust to general heteroscedasticity. The regression
models estimated with the time-invariant initial conditions (or Barro-effect) do not provide
efficient estimators. But the regression models for cross-country specific effect models
provide efficient estimators and therefore we focus mainly on these results for analyzing the
TFP spillover effects due to FDI inward and outward stocks. Regression equation (7) includes
inward FDI (FDII) but excludes the outward FDI (FDIO), while equation (8) includes FDIO
but excludes FDII. Equation (9) includes both inward and outward FDI stocks. The regression
coefficients for FDII and FDIO have positive and significant impacts on the TFP growth
variable. The results from equation (9) are undermined by the multicollineaity between growth
rates of FDII and FDIO. The value for the growth of FDII is 0.01 implying that 1% increase in
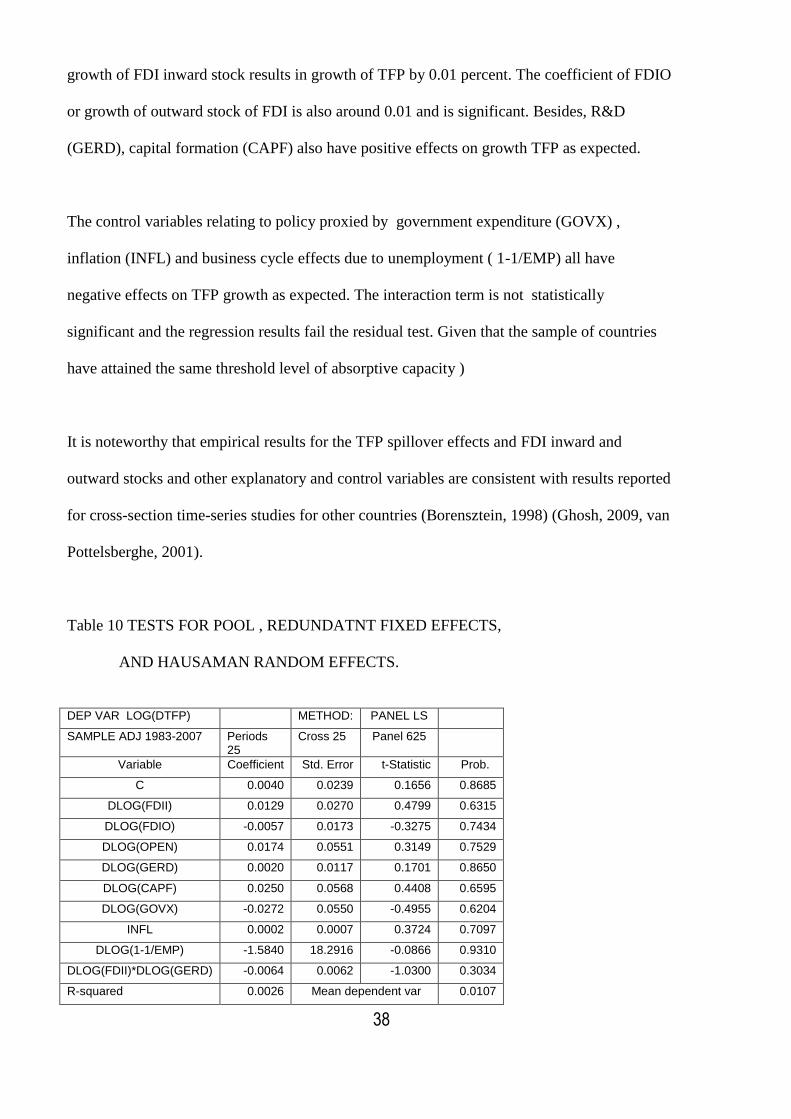
38
growth of FDI inward stock results in growth of TFP by 0.01 percent. The coefficient of FDIO
or growth of outward stock of FDI is also around 0.01 and is significant. Besides, R&D
(GERD), capital formation (CAPF) also have positive effects on growth TFP as expected.
The control variables relating to policy proxied by government expenditure (GOVX) ,
inflation (INFL) and business cycle effects due to unemployment ( 1-1/EMP) all have
negative effects on TFP growth as expected. The interaction term is not statistically
significant and the regression results fail the residual test. Given that the sample of countries
have attained the same threshold level of absorptive capacity )
It is noteworthy that empirical results for the TFP spillover effects and FDI inward and
outward stocks and other explanatory and control variables are consistent with results reported
for cross-section time-series studies for other countries (Borensztein, 1998) (Ghosh, 2009, van
Pottelsberghe, 2001).
Table 10 TESTS FOR POOL , REDUNDATNT FIXED EFFECTS,
AND HAUSAMAN RANDOM EFFECTS.
DEP VAR LOG(DTFP) METHOD: PANEL LS
SAMPLE ADJ 1983-2007 Periods 25
Cross 25 Panel 625
Variable Coefficient Std. Error t-Statistic Prob.
C 0.0040 0.0239 0.1656 0.8685
DLOG(FDII) 0.0129 0.0270 0.4799 0.6315
DLOG(FDIO) -0.0057 0.0173 -0.3275 0.7434
DLOG(OPEN) 0.0174 0.0551 0.3149 0.7529
DLOG(GERD) 0.0020 0.0117 0.1701 0.8650
DLOG(CAPF) 0.0250 0.0568 0.4408 0.6595
DLOG(GOVX) -0.0272 0.0550 -0.4955 0.6204
INFL 0.0002 0.0007 0.3724 0.7097
DLOG(1-1/EMP) -1.5840 18.2916 -0.0866 0.9310
DLOG(FDII)*DLOG(GERD) -0.0064 0.0062 -1.0300 0.3034
R-squared 0.0026 Mean dependent var 0.0107
39
Adjusted R-squared -0.0122 S.D. dependent var 0.5584
F-statistic 0.1780 Durbin-Watson stat 1.2319
Prob(F-statistic) 0.9963
Redundant Fixed Effects Tests
Effects Test Statistic d.f. Prob.
Cross-section F 1.0482 -24557.0000
0.4010
Cross-section Chi-square 27.1676 24.0000 0.2967
Period F 0.5632 -24557.0000
0.9548
Period Chi-square 14.7448 24.0000 0.9280
Cross-Section/Period F 0.7914 -48557.0000
0.8421
Cross-Section/Period Chi-square 40.5729 48.0000 0.7679
Effects Specification S.D. Rho
Cross-section random 0.0000 0.0000
Idiosyncratic random 0.5613 1.0000
Correlated Random Effects - Hausman Test
Test cross-section random effects
Test Summary Chi-Sq. Statistic
Chi-Sq. d.f. Prob.
Cross-section random 14.7784 9.0000 0.0972
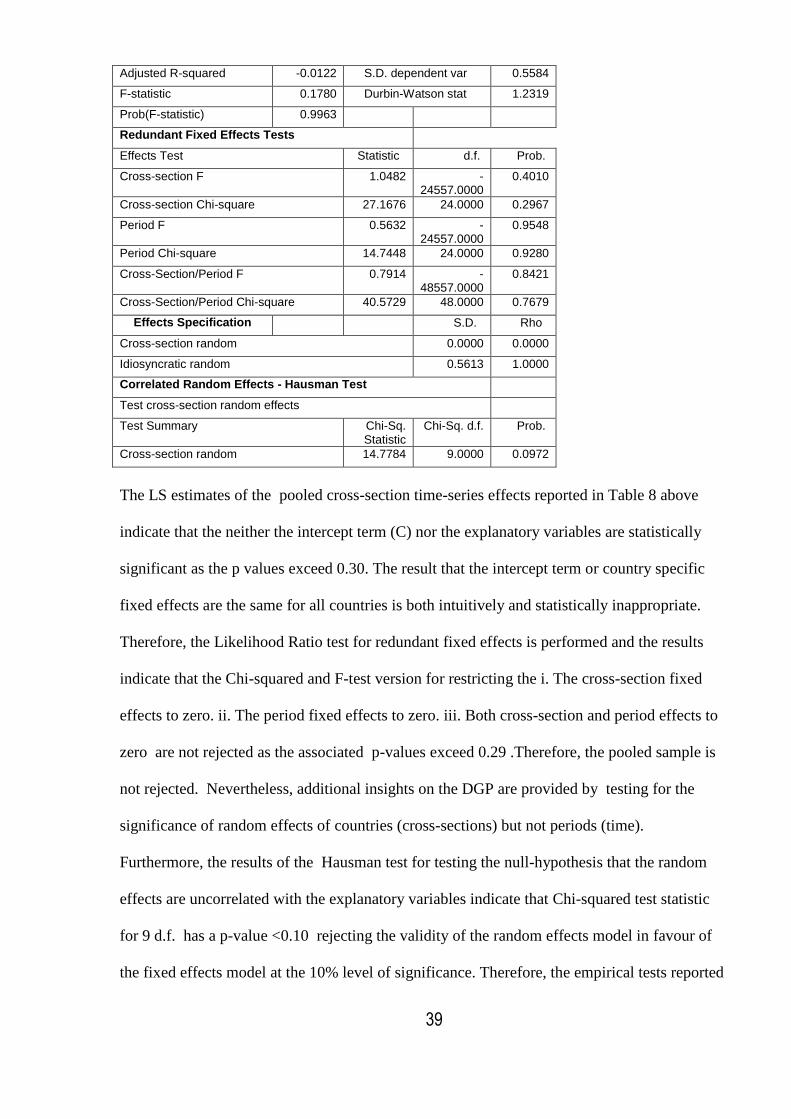
The LS estimates of the pooled cross-section time-series effects reported in Table 8 above
indicate that the neither the intercept term (C) nor the explanatory variables are statistically
significant as the p values exceed 0.30. The result that the intercept term or country specific
fixed effects are the same for all countries is both intuitively and statistically inappropriate.
Therefore, the Likelihood Ratio test for redundant fixed effects is performed and the results
indicate that the Chi-squared and F-test version for restricting the i. The cross-section fixed
effects to zero. ii. The period fixed effects to zero. iii. Both cross-section and period effects to
zero are not rejected as the associated p-values exceed 0.29 .Therefore, the pooled sample is
not rejected. Nevertheless, additional insights on the DGP are provided by testing for the
significance of random effects of countries (cross-sections) but not periods (time).
Furthermore, the results of the Hausman test for testing the null-hypothesis that the random
effects are uncorrelated with the explanatory variables indicate that Chi-squared test statistic
for 9 d.f. has a p-value <0.10 rejecting the validity of the random effects model in favour of
the fixed effects model at the 10% level of significance. Therefore, the empirical tests reported
40
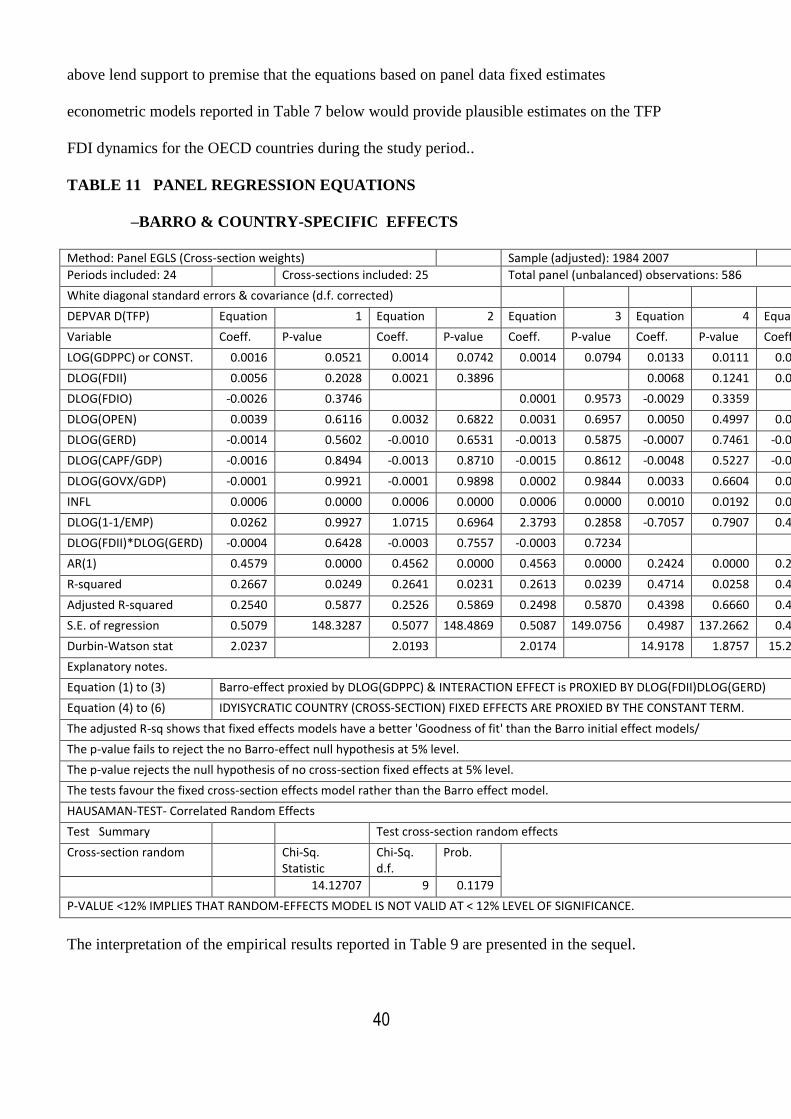
above lend support to premise that the equations based on panel data fixed estimates
econometric models reported in Table 7 below would provide plausible estimates on the TFP
FDI dynamics for the OECD countries during the study period..
TABLE 11 PANEL REGRESSION EQUATIONS
–BARRO & COUNTRY-SPECIFIC EFFECTS
Method: Panel EGLS (Cross-section weights) Sample (adjusted): 1984 2007
Periods included: 24 Cross-sections included: 25 Total panel (unbalanced) observations: 586
White diagonal standard errors & covariance (d.f. corrected)
DEPVAR D(TFP) Equation 1 Equation 2 Equation 3 Equation 4 Equation 5 Equation 6
Variable Coeff. P-value Coeff. P-value Coeff. P-value Coeff. P-value Coeff. P-value Coeff. P-value
LOG(GDPPC) or CONST. 0.0016 0.0521 0.0014 0.0742 0.0014 0.0794 0.0133 0.0111 0.0132 0.0117 0.0132 0.0119
DLOG(FDII) 0.0056 0.2028 0.0021 0.3896 0.0068 0.1241 0.0030 0.2337
DLOG(FDIO) -0.0026 0.3746 0.0001 0.9573 -0.0029 0.3359 0.0004 0.8234
DLOG(OPEN) 0.0039 0.6116 0.0032 0.6822 0.0031 0.6957 0.0050 0.4997 0.0047 0.5283 0.0049 0.5215
DLOG(GERD) -0.0014 0.5602 -0.0010 0.6531 -0.0013 0.5875 -0.0007 0.7461 -0.0003 0.9083 -0.0005 0.8362
DLOG(CAPF/GDP) -0.0016 0.8494 -0.0013 0.8710 -0.0015 0.8612 -0.0048 0.5227 -0.0039 0.6035 -0.0041 0.5841
DLOG(GOVX/GDP) -0.0001 0.9921 -0.0001 0.9898 0.0002 0.9844 0.0033 0.6604 0.0026 0.7275 0.0031 0.6803
INFL 0.0006 0.0000 0.0006 0.0000 0.0006 0.0000 0.0010 0.0192 0.0010 0.0254 0.0010 0.0260
DLOG(1-1/EMP) 0.0262 0.9927 1.0715 0.6964 2.3793 0.2858 -0.7057 0.7907 0.4776 0.8508 2.1658 0.2738
DLOG(FDII)*DLOG(GERD) -0.0004 0.6428 -0.0003 0.7557 -0.0003 0.7234
AR(1) 0.4579 0.0000 0.4562 0.0000 0.4563 0.0000 0.2424 0.0000 0.2412 0.0000 0.2414 0.0000
R-squared 0.2667 0.0249 0.2641 0.0231 0.2613 0.0239 0.4714 0.0258 0.4689 0.0247 0.4662 0.0241
Adjusted R-squared 0.2540 0.5877 0.2526 0.5869 0.2498 0.5870 0.4398 0.6660 0.4381 0.6643 0.4353 0.6632
S.E. of regression 0.5079 148.3287 0.5077 148.4869 0.5087 149.0756 0.4987 137.2662 0.4982 137.2614 0.4986 137.4634
Durbin-Watson stat 2.0237 2.0193 2.0174 14.9178 1.8757 15.2551 1.8730 15.0936 1.8706
Explanatory notes.
Equation (1) to (3) Barro-effect proxied by DLOG(GDPPC) & INTERACTION EFFECT is PROXIED BY DLOG(FDII)DLOG(GERD)
Equation (4) to (6) IDYISYCRATIC COUNTRY (CROSS-SECTION) FIXED EFFECTS ARE PROXIED BY THE CONSTANT TERM.
The adjusted R-sq shows that fixed effects models have a better 'Goodness of fit' than the Barro initial effect models/
The p-value fails to reject the no Barro-effect null hypothesis at 5% level.
The p-value rejects the null hypothesis of no cross-section fixed effects at 5% level.
The tests favour the fixed cross-section effects model rather than the Barro effect model.
HAUSAMAN-TEST- Correlated Random Effects
Test Summary Test cross-section random effects
Cross-section random Chi-Sq. Statistic
Chi-Sq. d.f.
Prob.
14.12707 9 0.1179
P-VALUE <12% IMPLIES THAT RANDOM-EFFECTS MODEL IS NOT VALID AT < 12% LEVEL OF SIGNIFICANCE.
The interpretation of the empirical results reported in Table 9 are presented in the sequel.
41
The Hausman test results favour the cross-section or country fixed effects models rather than
the random effects model at a p-value =0.12. The panel regression models (equations (1) to
(3) in Table 9) indicate that the Barro-initial effect (coefficient of DLOG(GDPPC) have p-
values >0.05 implying that the null-hypothesis that the Barro-effect is not significant at the
5% level of significance. The panel regression model (equations (4) to (6) in Table 7) indicate
that p-value =0.01 implies the null that cross-sectional fixed effects are not-significant is not
rejected at the 1% level of significance. Furthermore, ‘the goodness of fit given by adjusted-
R-squared is much higher for the country-specific fixed effects than the adjusted R-squared
from the panel regressions (equations (4) to (6) Table 9) are much higher than the adjusted
R-squared values for the Barro-effects panel regression equations (1) to (3) implying support
for country-specific effects that Barro initial effects for the OECD countries during the study
period .
The above finding that the country-specific’ fixed effects’ play a crucial role in explaining
growth of TFP spillover effects than Barro ‘initial effects’ in the advanced (OECD)
countries is consistent with similar findings in the GDP growth-FDI cross country empirics.
These studies underscore that in developing countries that have not attained a threshold level
of institutional development due to underdeveloped human capital, financial sector, the Barro
initial conditions play a pivotal role in determining the absorptive capacity of FDI related
growth spillover effects. While, in advanced countries TFP or growth spillover effects are not
subject to institutional threshold constraints and the countries country-specific fixed effects
play a key role in governing the technology transfer through FDI flows (Ghosh M and Wang
W., 2009, Carkovic. M. and Levine. R. , 2009). Equation (1) to (3) Table 7 report the results
for the’ Barro effect’ which are proxied by time-invariant initial conditions as captured by the
log of per capita GDP (logGDPPC) as the crucial determinant of FDI flows and related TFP
spillover effects for OECD countries as hypothesized by the convergence theories (Barro,
42
1995). The empirical findings for OECD countries differ from those reported for developing
countries where the country-specific effects rather than the “Barro initial effect’ plays the
significant role in determining whether FDI flows play the role of TFP increase and associated
positive spillover effect (Ghosh M and Wang W., 2009)
The panel data empirics reported in Table 9 therefore clearly support the hypothesis that time-
invariant initial conditions play a significant role in developed OECD countries in the
transmission of technological spillover effects mainly through the conduits of FDI flows and
of R& D (GERD). All the panel data regression empirics reported in Table 7 have been
estimated using feasible GLS with cross-country weights. The standard errors have been
estimated using White’s heteroscedasticity consistent covariances corrected for degrees of
freedom yielding estimates that are robust to general heteroscedasticity using EVIEWS 7
computer software.
The Barro time-invariant initial conditions are significant for equation (1) and (3) with FDI
inward stocks but not significant in FDI outward stocks. Therefore, initial conditions appear
to play a significant role in inward stocks of FDI flows and in their interactions with GERD ,
but outward FDI stocks do not appear to influenced by the initial conditions for the cross-
country regressions as reported in equation (2). The ‘goodness of fit’ measured by adjusted
R-squared is low for these equations relating the Barro time-invariant initial effects compared
to equations (4) to (6) which focus on the importance of country-specific idiosyncratic fixed
effects rather than the Barro initial effects. The country-specific effects proxied by the
constant term are significant for all the equations. The inward stocks of FDI (FDII) in
equation(4) and the outward stocks of FDI (FDIO) are by themselves not significant, but they
appear significant as a conduit for activating R&D as the interaction term FDI*GERD are
43
significant for all the equations (4) to (6). Besides, domestic policy variables such
expansionary monetary policy as shown by the coefficient for inflation (INFL) appears to
have positive effects of on the TFP spillovers through the FDI*GERD interaction effects. An
FDI friendly policy environment appears to play an important role in determining the TFP
spillovers according to estimates focusing on the country-specific fixed effects in equations
(4) to (6) in Table 9.
6. Concluding observations and Policy Perspectives.
The panel date econometric analysis undertaken in this paper focussing attention directly of the
nexus between TFP and FDI inward and outward stocks for 25 OECD economies over a 25 year
period (1983-2007) provide overwhelming support for the mainstream macroeconomic model
hypotheses enunciated both by neoclassical and endogenous growth theories that FDI inflows and
outflows generate technological spillovers and increase total factor productivity and therefore acts
as an engine of growth in advanced countries. Advanced countries are not constrained by
thresholds constraints imposed by deficiency of human capital due to scarcity of skilled workers, or
due to underdeveloped banking and financial institutions, lack of adequate infrastructure, and proper
enforcement of property rights that plague developing countries and undermine their absorptive
capacity and skill development, lack of law and order, endemic corruption.
National concerns relating to Dutch disease effects and global concerns as articulated in Kyoto
protocol and the findings of climate scientists that highlight the need to restrict carbon dioxide
emissions in order reduce the dangers of global warming. Negative externalities due to mining
of non-renewable resources or Dutch disease effects, environmental degradation and
outsourcing of services and their negative externalities are areas for future research not
addressed in this paper.
44
In this paper we study the impact of both inward and outward FDI on economic
growth in the OECD countries using panel data estimation for the period 1980-
2004. The main findings of our study are that both inward and outward FDI
positively contribute to economic growth in the OECD. However, the impact of
FDI in economic growth is moderate. Coefficients for all other variables in the
cross-country regression model have the expected signs. Recent studies (e.g.
(Golub, 2003a) and(Golub, 2003b), (Ghosh, 2007 June) suggest
tremendous potential for growth in the flows of FDI across OECD countries
through reduction of barriers. Our regression results indicate that the implications
for economic growth from these are however moderate.
Contrary to earlier findings, essentially on developing countries, that the
positive impact of FDI is conditional on countries’ stock of human capital or a
threshold absorptive capacity, our results from OECD data find that FDI exert
positive influence on both host and source country economic growth irrespective
of any threshold requirements. This is not surprising as our sample only includes
the developed economies which have already reached a threshold level of human
capital stock or the level of R&D.
A major contribution of this study is the provision of empirical information on how ot
reconcile the conflicting objectives of austerity (spending cuts) through the increase TFP or
more output with less inputs, with the objectives of growth that is generated by cross-border
FDI flows. The conflicting objectives of austerity and growth are two sides of the same coin
required to steer the sovereign debt ridden PIGS from imploding the single currency union
and the euro zone. The crisis contagion from the collapse of the euro zone will not only have
negative spillover effects on the OECD countries but also on the global economy.
45
\
REFERENCES
AGOSIN M. R. AND MAYER R. (2000) Foreign Investment in Developing Countries: Does it Crowd in Domestic Investment ? United Nations Conference on Trade and Development., Palais des Nations.
ALFARO, L., A. CHANDA, S. KALEMLI-OZCAN AND S. SAYEK (2004) (2004) FDI and Economic Growth: The Role of Local Financial Markets. Journal of International Economics, 64, 89-112.
APERGIS N. KATRAKILIDIS C. AND TABAKIS M. (2006) Dynamic Linkages Between FDI Inflows and Domestic Investment: A Panel Cointegration Approach. Atlantic Economic Journal, 34, 385-394.
ARNDT, C., BUCH, C.M. AND M SCHNITZER, M., (2010) FDI and Domestic Investment: An Industry Level View. The BE Journal of Economic Analysis and Policy, 10, 1-20.
BALASUBRAMANYAM, V. N., M. SALISU AND D. SAPSFORD (1996) Foreign Direct Investment and Growth in EP and IS Countries. The Economic Journal, 106, 92-105. BALTAGI, B. H. (2005) Econometric Analysis of Panel Data,, Chichester, Wiley. BARRO, R., J., AND, SALA-I-MARTIN, X. (1995) Economic Growth, New York, McGraw-
Hill BHAGWATI, J. N. (1978) Anatomy and Exchange Control Regimes. Studies in International Economic Relations New York. BITZER J AND GORG H. (2009) Foreign Direct Investment, Competition and Industry
Performance. The World Economy, 32, 21-233. BLINDER, A. (1993). BLOMSTRÖM M., A., KOKKO A., (1998) Multinational Corporations and Spillovers.
Journal of Economic Surveys, 12. BORENSZTEIN, E., J. DE GREGORIO AND J-W. LEE (1998) How Does Foreign Direct Investment Affect Growth? Journal of International Economics, 45, 115-135. CARKOVIC, M., AND, R. LEVINE. (2009) Does Foreign Direct Investment Accelerate Economic Growth? Global Economy Journal, 9, Art. 1. CARKOVIC. M. AND LEVINE. R. (2009) Does Foreign Direct Investment Accelerate Economic Growth? 9, Art. 1. CAVES, D., CHRISTENSEN, L.R., AND, DIEWERT, W.E., (1982) The Economic Theory
of Index Numbers adn the Measurement of Input, Output and Productivity. Econometrica, 50, 1393-1414.
46
COE, D. T., AND, HELPMAN,E. (1995) International R & D spilloovers. Eurpoean Economic Review, 39, 859-887.
DE MELLO. (1997) Foreign Direct Investment in Developing Countries and Growth: A Selective Survey. Journal of Development Studies, 34, 1-34.
DESAI, M. A., F. FOLEY AND J.R. HINES JR. & . (2005) Foreign direct investment and domestic capital stock. American Economic Review Papers and Proceedings, 95.
ENGLE, R., AND, GRANGER, C.. (1987) Cointegration and Error Correction: Representation Estimation and Testing. Econometrica, 55, 251-76.
FRY M.J. (1992) Foreign Direct Investment in a Macroeconomic Framework: Finance, Efficiency, Incentives and Distortions. PRE Working Paper, Washington D.C. World Bank.
GHOSH M AND WANG W. (2009) Does FDI Accelerate Economic Growth? Global Economy Journal, 9.
GHOSH, M., AND WANG, W. (2009) Does FDI Accelerate Economic Growth? The OECD Experience Based on Panel Data Estimates for the Period 1980-2004. Global Economy Journal, 9, 1-21.
GHOSH, M., P. SYNTETOS AND W. WANG (2007 June) Impact of Foreign Ownership Restrictions on FDI Stock in OECD Countries. Canadian Economic Association Meetings.
GOLUB, S. (2003a) Measures of Restrictions on Inward Foreign Direct Investment for OECD Countries. OECD Economic Studies, 36. GOLUB, S., N. GIUSEPPE, D. HAJKOVA, D. MIRZA, AND K. YOO (2003b) Policies and
International Integration: Influences on Trade and Foreign Direct Investment. Working Papers. OECD Economics Department
GROSSMAN, G. M. A. E. H. (1991) Innovation and Growth in the Global Economy, The MIT Press, Cambridge. Mass.
HADRI, K. (2000) Testing for stationarity in heterogenous panel data. Econometric Jounal, 3, 148-161.
HARRISON A. AND REVENGA A. (1995) The Effects of Trade Policy Reform: What Do We Really Know ? Working Paper No. 5225, National Bureau of Economic Research., NBER.
HECKMAN, J. J. (1978) Simple Statistical Models for Developed for Discrete Panel Data Developed and Applied to Test for Hypothesis of True State Dependence against the Hypothesis of Spurious Dependence. Annales de I'INSEE, 30/31, 227-269.
HERZER, D. (2008) The Long-run Relationship Between Outward FDI and Domestic Output: Evidence from Panel Data. Economics Letters 100, 146-149.
HSIAO, C. (2003) Analysis of Panel Data, Cambridge, Cambridge University Press,. IM, K. S., PESARAN, M.H., AND, SHIN, Y.,, (2003) Testing for unit roots in heterogenous
panels. Journal of Econometrics, 115. KHAWAR, M. (2005) Foreign Direct Investment and Economic Growth: A Cross Country Analysis. Global Economy Journal,, 5, 1-11. KOKKO A. (1994) Technology , Market Characteristics and Spillovers. Journal of
Development Economics, 43, 279-93. KRUGMAN, P. (1994) The Age of Diminished Expectations.
47
LEVIN, A., LIN, C., AND, CHU, C.S.J., (2002) Unit root tests in panel data. Journal of Econometrics, 108, 1-24.
MADDALA, G. S. A., WU, S.. (1999) A comparative study of unit root tests with panel data and a new simple test. Oxford Bulletin of Economics and Statistics, 61, 631-652.
MARKUSEN J R AND VENABLES A J. (1998) Multinational Firms and the New Trade Theory. Journal of International Economics, 46, 183-203.
MUNDLAK, Y. (1961) Empirical Production Function Free Management Bias. Jounral of Farm Economics., 43, 44-56.
O'DONELL, C. J. (2008) An Aggregate Quantity-Price Framework for Measuring and Decomposing Productivity and Profitability Change. Working Paper.
O'DONELL CJ. (2009) Mesauring and Decomposing Agricultural Productivity and Profitability Change. Conference of Agricultural Resource Economics Society.
PEDRONI, P. (1999) Critical values for cointegration tests in heterogenous panels with multiple regressors. Oxofrd Bulletin of Economics and Statistics, 61, 653-670.
PEDRONI, P. (2001) Purchasing power parity tests in cointegrated panels. The Review of Economics and Statistics, 83.
PEDRONI, P. (2004) Panel cointegration: asymptotic and finite sample properties of pooled time series tests with an application to PPP hypothesis. Econometric Theory., 20.
PORTER, M. E. (1991) The Competitive Advantage of Nations. ROMER, P. (1990) Endogenous Technical Change. Journal of Political Economy, 98: .
S71-S102. SAVVIDES, A., AND, ZACHARIADIS, M. (2005) Internatioonal technology diffusion and
growth of TFP in the manufuacturing sector of developing countries. Review of Development Economics, 9, 482-501.
SHANKS. S. AND ZENG. S. (2006) Econometric Modelling of R&D and Australia's Productivity. Staff Working Paper, Productivity Commission.
SOLOW, R. M. (1956) A Contribution to the Theory of Economic Growth. Quarterly Journal of Economics, 70, 65-94.
STEVENS, G. V. G., LIPSEY, R.E (1992) Interactions between domestic and foreign investment. Journal of Money and Finance, 11, 40–62. STIGLITZ, J. (2009) Making Globalization Work, New York, Norton & Co. VAN POTTELSBERGHE, B., AND LICHTENBERG, F. (2001) Does Foreing direct
investment transfer technology across borders,. The Review of Economics and Statistics, 83, 975-1000.
XU, B. (2000a) Multinational Enterprises, Technology Diffusion, and Host Country Productivity Growth. Journal of Development Economics, 62, 477-493. XU, B. (2000b) Multinational Enterprises, Technology Diffusion, and Host Country Productivity Growth. Journal of Development Economics 62, 477-493.
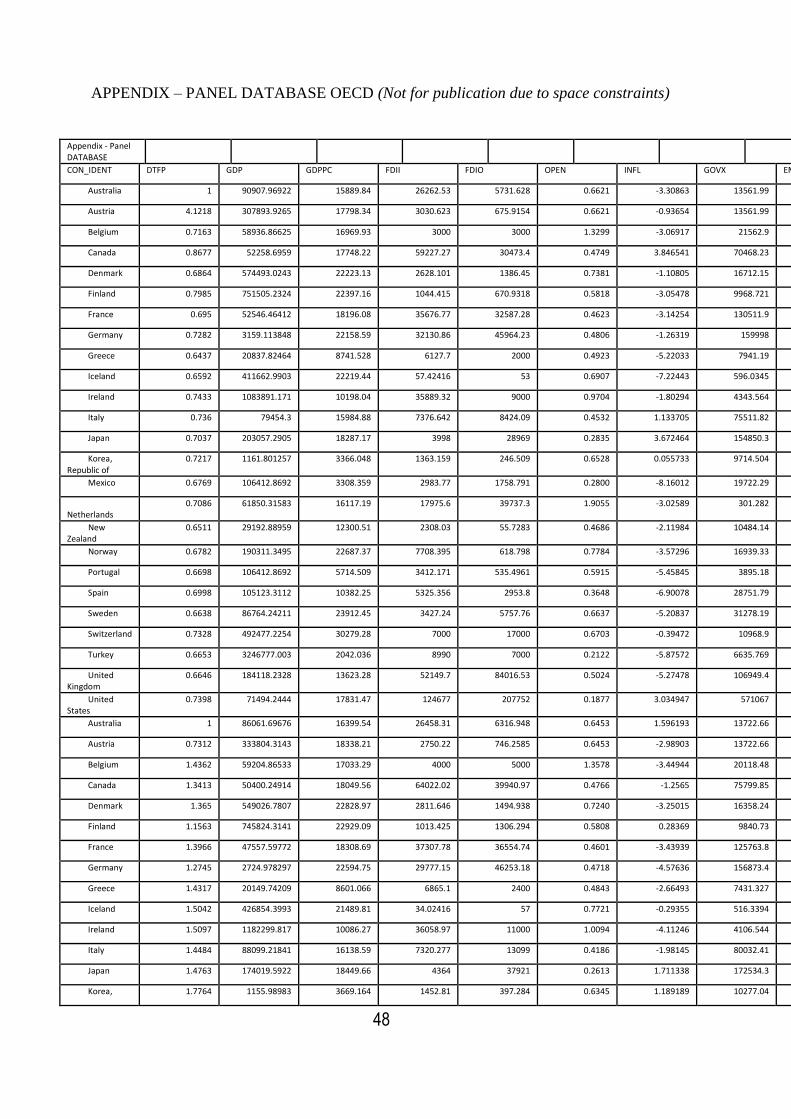
48
APPENDIX – PANEL DATABASE OECD (Not for publication due to space constraints)
Appendix - Panel DATABASE
CON_IDENT DTFP GDP GDPPC FDII FDIO OPEN INFL GOVX EMP CAPF DEFL YEAR
Australia 1 90907.96922 15889.84 26262.53 5731.628 0.6621 -3.30863 13561.99 6416.5 16255.45 78.32988 1982
Austria 4.1218 307893.9265 17798.34 3030.623 675.9154 0.6621 -0.93654 13561.99 3090.3 16255.45 52.46954
Belgium 0.7163 58936.86625 16969.93 3000 3000 1.3299 -3.06917 21562.9 3533.693 18032.56 54.55581
Canada 0.8677 52258.6959 17748.22 59227.27 30473.4 0.4749 3.846541 70468.23 8500 59396.95 69.34697
Denmark 0.6864 574493.0243 22223.13 2628.101 1386.45 0.7381 -1.10805 16712.15 2368.7 10500.64 51.76992
Finland 0.7985 751505.2324 22397.16 1044.415 670.9318 0.5818 -3.05478 9968.721 2385 14436.27 48.34598
France 0.695 52546.46412 18196.08 35676.77 32587.28 0.4623 -3.14254 130511.9 21644.2 126639.6 56.50958
Germany 0.7282 3159.113848 22158.59 32130.86 45964.23 0.4806 -1.26319 159998 26774 162283 55.1049
Greece 0.6437 20837.82464 8741.528 6127.7 2000 0.4923 -5.22033 7941.19 55810 12843.68 61.36629
Iceland 0.6592 411662.9903 22219.44 57.42416 53 0.6907 -7.22443 596.0345 115.6 885.8738 60.9863
Ireland 0.7433 1083891.171 10198.04 35889.32 9000 0.9704 -1.80294 4343.564 55360 5452.194 58.8182
Italy 0.736 79454.3 15984.88 7376.642 8424.09 0.4532 1.133705 75511.82 20725 97572.25 45.49755
Japan 0.7037 203057.2905 18287.17 3998 28969 0.2835 3.672464 154850.3 55810 329486.1 49.97119
Korea, Republic of
0.7217 1161.801257 3366.048 1363.159 246.509 0.6528 0.055733 9714.504 14023 22460.29 58.5526
Mexico 0.6769 106412.8692 3308.359 2983.77 1758.791 0.2800 -8.16012 19722.29 15200 57413.14 78.06307
Netherlands
0.7086 61850.31583 16117.19 17975.6 39737.3 1.9055 -3.02589 301.282 5107.9 218.9801 63.75029
New Zealand
0.6511 29192.88959 12300.51 2308.03 55.7283 0.4686 -2.11984 10484.14 1350.5 10532.1 61.48595
Norway 0.6782 190311.3495 22687.37 7708.395 618.798 0.7784 -3.57296 16939.33 1935 16674.69 66.30564
Portugal 0.6698 106412.8692 5714.509 3412.171 535.4961 0.5915 -5.45845 3895.18 3968.5 9941.407 51.45439
Spain 0.6998 105123.3112 10382.25 5325.356 2953.8 0.3648 -6.90078 28751.79 11230.6 41792 48.24699
Sweden 0.6638 86764.24211 23912.45 3427.24 5757.76 0.6637 -5.20837 31278.19 4225 20244.81 53.4682
Switzerland 0.7328 492477.2254 30279.28 7000 17000 0.6703 -0.39472 10968.9 3240 26992.46 54.3832
Turkey 0.6653 3246777.003 2042.036 8990 7000 0.2122 -5.87572 6635.769 4500 15640.44 65.55052
United Kingdom
0.6646 184118.2328 13623.28 52149.7 84016.53 0.5024 -5.27478 106949.4 24345 80716.67 62.961
United States
0.7398 71494.2444 17831.47 124677 207752 0.1877 3.034947 571067 100397 605446 76.80205
Australia 1 86061.69676 16399.54 26458.31 6316.948 0.6453 1.596193 13722.66 6300.4 15546.18 75.02126 1983
Austria 0.7312 333804.3143 18338.21 2750.22 746.2585 0.6453 -2.98903 13722.66 3158.4 15546.18 51.533
Belgium 1.4362 59204.86533 17033.29 4000 5000 1.3578 -3.44944 20118.48 3432 14826.74 51.48663
Canada 1.3413 50400.24914 18049.56 64022.02 39940.97 0.4766 -1.2565 75799.85 9500 66002.84 73.19351
Denmark 1.365 549026.7807 22828.97 2811.646 1494.938 0.7240 -3.25015 16358.24 2389.3 10564.91 50.66187
Finland 1.1563 745824.3141 22929.09 1013.425 1306.294 0.5808 0.28369 9840.73 2419 13640.82 45.29121
France 1.3966 47557.59772 18308.69 37307.78 36554.74 0.4601 -3.43939 125763.8 21693.7 109706.7 53.36704
Germany 1.2745 2724.978297 22594.75 29777.15 46253.18 0.4718 -4.57636 156873.4 26608 166539.7 53.84171
Greece 1.4317 20149.74209 8601.066 6865.1 2400 0.4843 -2.66493 7431.327 57330 11177.93 56.14596
Iceland 1.5042 426854.3993 21489.81 34.02416 57 0.7721 -0.29355 516.3394 122.8 572.8146 53.76188
Ireland 1.5097 1182299.817 10086.27 36058.97 11000 1.0094 -4.11246 4106.544 56380 4522.583 57.01526
Italy 1.4484 88099.21841 16138.59 7320.277 13099 0.4186 -1.98145 80032.41 20725 94838.26 46.63126
Japan 1.4763 174019.5922 18449.66 4364 37921 0.2613 1.711338 172534.3 57330 335550.3 53.64365
Korea, 1.7764 1155.98983 3669.164 1452.81 397.284 0.6345 1.189189 10277.04 14505 25179.6 58.60833

49
Republic of
Mexico 1.8065 97850.79162 3108.623 5175.369 1783.166 0.3098 9.687494 14209.61 15500 44573.85 69.90296
Netherlands
1.326 60780.25137 16368.77 16924.2 39781 1.7274 -6.10892 323.7119 5007 200.0611 60.7244
New Zealand
1.3238 26050.83895 12523.29 2249.992 489.8763 0.5204 -5.15849 12700.73 1390.6 12343.38 59.36611
Norway 1.3862 165977.9706 23490.26 8051.579 667.107 0.7579 -3.18115 15135.2 1945 16695.3 62.73268
Portugal 1.5758 97850.79162 5676.351 3567.254 567.03 0.6254 -2.59994 3524.858 4352.8 7352.404 45.99594
Spain 1.4145 104914.0655 10518.95 5277.92 3536.33 0.3974 -0.44952 25823.88 11044.4 35069.08 41.34621
Sweden 1.3368 82911.91265 24353.41 3374.58 7341.9 0.7044 -0.14215 28066.32 4224 18349.68 48.25983
Switzerland 1.3181 466934.9336 30280.81 8277.128 17849.52 0.6748 -4.11501 11312.54 3256.5 26304.54 53.98848
Turkey 1.7219 3527963.004 2098.292 9036 9000 0.2318 -5.2848 6998.445 15990 14024.96 59.67481
United Kingdom
1.4125 197983.5063 14091.88 54008.73 86874.91 0.5153 -4.79443 100716.6 23624 80268.34 57.68622
United States
1.4297 67402.63254 18466.6 137061 218093 0.1791 2.997422 616688 100834 658836 79.83699
Australia 1.0001 82275.81045 17023.92 26385.32 6653.094 0.6876 -12.1994 12966.5 6493.86 15191.42 76.61745 1984
Austria 0.9701 347149.6964 18321.41 2674.104 1079.051 0.6876 -0.23019 13235.41 3235.3 15191.42 48.54398
Belgium 0.9651 57714.6439 17457.07 5000 6000 1.4461 0.873733 19175.65 3466.336 14974.88 48.03719
Canada 1.0035 52259.10841 18895.7 65070.38 43142.75 0.5375 -1.58912 75737.41 10000 71196.33 71.93701
Denmark 0.9328 521269.2899 23796.44 2761.368 1800.938 0.7396 0.921175 14855.85 2488.4 11604.59 47.41172
Finland 1.0311 701694.1657 23500.86 1039.816 1829.131 0.5729 1.001563 10198.76 2442 13573.28 45.5749
France 1.0293 46211.23615 18473.01 39506.29 38780.64 0.4830 1.316089 120169.3 21509 100620 49.92765
Germany 1.0137 2822.001925 23330.78 26934.88 59908.58 0.5007 -0.62848 146168 26626 155132.9 49.26535
Greece 0.9849 19510.47847 8734.554 7588 2600 0.4811 -1.53223 7443.491 57660 11302.17 53.48104
Iceland 0.9611 421901.3687 22116.47 47.72416 59.4609 0.7605 0.457126 491.3052 128.5 653.902 53.46832
Ireland 1.0206 1258070.288 10459.37 36180.33 12206.05 1.1187 1.386614 3844.216 57330 4183.041 52.90279
Italy 0.9852 97169.59849 16631.89 11565.28 16599.9 0.4420 0.203825 78225.07 20809 98218.47 44.64981
Japan 1.0461 205268.1186 18902.75 4458 43974 0.2736 1.038158 180953.4 57660 355031.6 55.35499
Korea, Republic of
1.0129 1167.612684 3905.19 1585.401 461.039 0.6342 -1.76156 10663.71 14429 28999.03 59.79752
Mexico 1.0525 101769.2005 3162.693 6716.368 2005.145 0.2937 1.773355 17584.87 16000 50315.56 79.59045
Netherlands
1.0034 61098.8845 16858.5 18016.5 47813 1.6120 -1.00068 345.5782 5120.5 182.4128 54.61548
New Zealand
0.9651 24116.23742 13027.34 1739.612 662.3608 0.6516 -0.17679 14441.11 1400.5 15313.67 54.20762
Norway 1.01 167103.4295 24793.28 7831.03 1092.78 0.7697 -0.10469 15913.58 1970 15923.87 59.55153
Portugal 1.1594 101769.2005 5551.625 3787.228 589.6069 0.6839 1.989799 3239.578 4288.2 5352.752 43.396
Spain 1.0716 99955.38233 10667.29 6331.411 4455.4 0.4159 1.09072 25591.42 10743.2 33466.86 40.8967
Sweden 1.0151 80641.27502 25379.8 3337.23 10767.5 0.7031 1.173347 28188.19 4255 19758.35 48.11769
Switzerland 0.9916 439021.5497 31043.61 7652.998 25093.19 0.7146 -1.09587 10546.85 3288.2 26760.3 49.87347
Turkey 1.0941 3922889.002 2193.413 9149 1163.97 0.2821 4.087404 5812.429 16000 13682.85 54.39001
United Kingdom
1.0166 173604.2099 14436.88 46375.54 100313.5 0.5632 1.049511 93646.15 24235 79654.79 52.89179
United States
1.0015 68782.54505 19600.28 164583 238369 0.1874 2.529866 671865 105005 835801 82.83441
Australia 0.9999 85156.19868 17513.6 26615.78 8653.712 0.7240 1.536704 13370.63 6697.45 15848.8 64.4181 1985
Austria 1.1433 355708.4794 18768.18 3580.15 1219.11 0.7240 19.12346 13561.99 3234.5 15848.8 48.31378
Belgium 1.1057 61203.8532 17736.71 6000 7000 1.3970 17.91983 19409.59 3513.8 14841.41 48.91092
Canada 1.0358 55159.61198 19566.23 64656.89 46935.17 0.5424 0.878155 77675.79 11742 74381.72 70.3479
Denmark 1.0231 544152.0038 24762.96 3613.335 2454.938 0.7514 16.65398 15508.68 2553.4 13193.55 48.33289
Finland 1.0663 708870.1758 24158.12 1338.564 2341.865 0.5610 13.12194 11268.11 2466 14066.43 46.57646
France 1.1097 46013.64396 18680.85 41716.12 44011.37 0.4774 18.74437 125540.7 21450.3 104591.4 51.24374
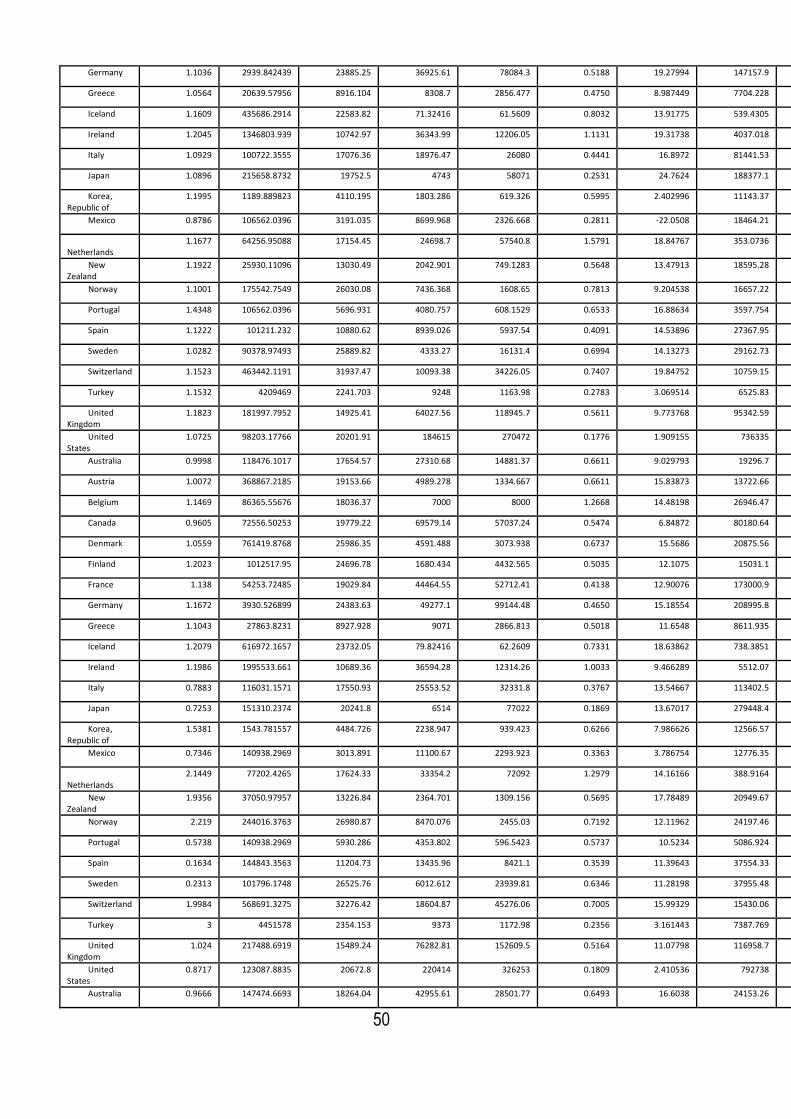
50
Germany 1.1036 2939.842439 23885.25 36925.61 78084.3 0.5188 19.27994 147157.9 26940 152840.1 48.63687
Greece 1.0564 20639.57956 8916.104 8308.7 2856.477 0.4750 8.987449 7704.228 58070 11834.9 51.94881
Iceland 1.1609 435686.2914 22583.82 71.32416 61.5609 0.8032 13.91775 539.4305 130 610.598 53.92545
Ireland 1.2045 1346803.939 10742.97 36343.99 12206.05 1.1131 19.31738 4037.018 57660 3880.224 54.28941
Italy 1.0929 100722.3555 17076.36 18976.47 26080 0.4441 16.8972 81441.53 20894 100814.7 44.85364
Japan 1.0896 215658.8732 19752.5 4743 58071 0.2531 24.7624 188377.1 58070 386872.3 56.39315
Korea, Republic of
1.1995 1189.889823 4110.195 1803.286 619.326 0.5995 2.402996 11143.37 14970 29751.22 58.03596
Mexico 0.8786 106562.0396 3191.035 8699.968 2326.668 0.2811 -22.0508 18464.21 18000 56362.56 81.36381
Netherlands
1.1677 64256.95088 17154.45 24698.7 57540.8 1.5791 18.84767 353.0736 5144.5 218.9801 53.6148
New Zealand
1.1922 25930.11096 13030.49 2042.901 749.1283 0.5648 13.47913 18595.28 11475.5 19553.94 54.03083
Norway 1.1001 175542.7549 26030.08 7436.368 1608.65 0.7813 9.204538 16657.22 2014 15693.65 59.44684
Portugal 1.4348 106562.0396 5696.931 4080.757 608.1529 0.6533 16.88634 3597.754 4279.2 5342.243 45.3858
Spain 1.1222 101211.232 10880.62 8939.026 5937.54 0.4091 14.53896 27367.95 10641.1 35538.32 41.98741
Sweden 1.0282 90378.97493 25889.82 4333.27 16131.4 0.6994 14.13273 29162.73 4299 22485.45 49.29103
Switzerland 1.1523 463442.1191 31937.47 10093.38 34226.05 0.7407 19.84752 10759.15 3354 27051.98 48.7776
Turkey 1.1532 4209469 2241.703 9248 1163.98 0.2783 3.069514 6525.83 16162 18338.02 58.47741
United Kingdom
1.1823 181997.7952 14925.41 64027.56 118945.7 0.5611 9.773768 95342.59 24539 83697.57 53.9413
United States
1.0725 98203.17766 20201.91 184615 270472 0.1776 1.909155 736335 107150 851659 85.36428
Australia 0.9998 118476.1017 17654.57 27310.68 14881.37 0.6611 9.029793 19296.7 6974.51 22027.73 65.9548 1986
Austria 1.0072 368867.2185 19153.66 4989.278 1334.667 0.6611 15.83873 13722.66 3282.3 22027.73 67.43724
Belgium 1.1469 86365.55676 18036.37 7000 8000 1.2668 14.48198 26946.47 3524.8 20200.69 66.83075
Canada 0.9605 72556.50253 19779.22 69579.14 57037.24 0.5474 6.84872 80180.64 12095 77821.52 71.22605
Denmark 1.0559 761419.8768 25986.35 4591.488 3073.938 0.6737 15.5686 20875.56 2662.5 20177.01 64.98688
Finland 1.2023 1012517.95 24696.78 1680.434 4432.565 0.5035 12.1075 15031.1 2458 17745.05 59.6984
France 1.138 54253.72485 19029.84 44464.55 52712.41 0.4138 12.90076 173000.9 21550.7 151250.5 69.9881
Germany 1.1672 3930.526899 24383.63 49277.1 99144.48 0.4650 15.18554 208995.8 27083 218499.8 67.91681
Greece 1.1043 27863.8231 8927.928 9071 2866.813 0.5018 11.6548 8611.935 58530 13504.42 60.93626
Iceland 1.2079 616972.1657 23732.05 79.82416 62.2609 0.7331 18.63862 738.3851 132 724.4523 67.8432
Ireland 1.1986 1995533.661 10689.36 36594.28 12314.26 1.0033 9.466289 5512.07 58070 4917.747 73.60679
Italy 0.7883 116031.1571 17550.93 25553.52 32331.8 0.3767 13.54667 113402.5 21006 133996.3 61.75084
Japan 0.7253 151310.2374 20241.8 6514 77022 0.1869 13.67017 279448.4 58530 568368.7 81.15555
Korea, Republic of
1.5381 1543.781557 4484.726 2238.947 939.423 0.6266 7.986626 12566.57 15505 33303.79 60.43895
Mexico 0.7346 140938.2969 3013.891 11100.67 2293.923 0.3363 3.786754 12776.35 20000 34621.99 59.31297
Netherlands
2.1449 77202.4265 17624.33 33354.2 72092 1.2979 14.16166 388.9164 5600 401.887 72.46247
New Zealand
1.9356 37050.97957 13226.84 2364.701 1309.156 0.5695 17.78489 20949.67 1544.1 20417.82 67.50997
Norway 2.219 244016.3763 26980.87 8470.076 2455.03 0.7192 12.11962 24197.46 2086 21013.45 68.65138
Portugal 0.5738 140938.2969 5930.286 4353.802 596.5423 0.5737 10.5234 5086.924 4287.1 8264.259 62.27214
Spain 0.1634 144843.3563 11204.73 13435.96 8421.1 0.3539 11.39643 37554.33 10880.9 51557.61 56.52638
Sweden 0.2313 101796.1748 26525.76 6012.612 23939.81 0.6346 11.28198 37955.48 4299 27913.9 63.42376
Switzerland 1.9984 568691.3275 32276.42 18604.87 45276.06 0.7005 15.99329 15430.06 3430 38490.2 68.62512
Turkey 3 4451578 2354.153 9373 1172.98 0.2356 3.161443 7387.769 16500 23975.23 61.54692
United Kingdom
1.024 217488.6919 15489.24 76282.81 152609.5 0.5164 11.07798 116958.7 24568 101444.3 63.71507
United States
0.8717 123087.8835 20672.8 220414 326253 0.1809 2.410536 792738 109597 874675 87.27344
Australia 0.9666 147474.6693 18264.04 42955.61 28501.77 0.6493 16.6038 24153.26 7128.76 27924.51 74.9846 1987

51
Austria 0.3242 421532.8151 19411.61 6648.267 1359.729 0.6493 3.320117 12966.5 3299.8 27924.51 83.27597
Belgium 0.7787 107366.082 18414.82 8000 9000 1.2396 3.041952 33065.16 3479.827 26593 81.31273
Canada 0.3755 90377.00596 20331.95 81502.54 66876 0.5246 9.820914 88890.45 12422 93109.94 78.07477
Denmark 1.0784 924178.3794 26048.27 5628.639 3793.938 0.6385 4.521208 27201.96 2678.7 22967.94 80.55547
Finland 1.0223 1256278.938 25493.17 2620.122 5708.419 0.4988 9.551566 19064.47 2452 22753.19 71.80589
France 0.979 63170.69896 19391.99 49084.08 52533.94 0.4064 3.318621 208181.9 21631.2 187575.1 82.88887
Germany 0.7302 5438.529434 24685.96 64713.88 104186.4 0.4514 3.385697 262062.2 27366 264165.6 83.10235
Greece 1.7092 32913.71864 8696.261 10135.5 2884.011 0.4980 8.268405 10215.17 59110 11964.34 72.59106
Iceland 3.0858 776335.1067 25477.05 82.22416 56.29222 0.6959 9.271221 1067.361 134 1125.974 86.48182
Ireland 1.0491 2420153.833 11207.32 36916.76 13064.39 1.0408 4.845956 6143.573 58530 5289.68 83.07308
Italy 1.0472 145950.933 18103.74 31353.43 36906.96 0.3704 4.664713 148473.7 20986 171556.8 75.29751
Japan 1.0374 163957.9054 20928.1 9018 110780 0.1765 13.0155 341146.7 59110 701733.6 94.82572
Korea, Republic of
0.9974 1613.760832 4918.947 2840.804 1095.617 0.6573 14.37507 15423.52 16354 43592.32 68.42558
Mexico 0.9971 171653.8414 3011.644 13735.27 2332.195 0.3591 13.22203 13372.01 22000 38977.7 63.09973
Netherlands
0.9663 92448.47828 17875.1 43449.4 73471.3 1.4293 2.880035 393.5376 5864 345.5536 86.62413
New Zealand
1.0678 46076.16545 13219.1 3159.424 1923.673 0.5642 16.56717 24474.43 1556.8 18791.43 85.29486
Norway 0.978 309478.061 27352.74 8616.125 3972.603 0.6700 6.799181 27581.8 2126 25367.91 80.771
Portugal 0.7829 171653.8414 6314.523 4869.681 642.0109 0.6326 6.401268 6246.021 4402.7 12142.97 72.79553
Spain 1.0564 180918.9742 11800.2 22992.05 9434.11 0.3631 8.350686 49206.05 11368.9 69698.31 67.92281
Sweden 0.9021 117175.6311 27311.25 9233.926 28422.93 0.6396 7.512175 44836.56 4316 35678.79 74.70574
Switzerland 0.9456 697700.0564 32474.02 26307.36 48907.05 0.6902 3.923214 19078.27 3515 48809.32 84.61841
Turkey 1.0329 4728278 2531.211 9488 1172.99 0.2650 1.334984 7399.859 17000 27505.58 64.70837
United Kingdom
1.0581 274882.9669 16162.12 109351.7 184958 0.5152 11.79096 139823.4 25083 130888.3 74.79305
United States
0.9722 132148.3596 21128.35 263394 347179 0.1920 3.073646 838716 112440 916080 89.68397
Australia 0.9044 160218.2118 18633.06 62070.65 28950.23 0.6877 6.233687 25642.57 7181.7 31810.02 91.58839 1988
Austria 0.7459 498163.5237 20032.11 6816.395 2878.329 0.6877 -3.19397 13370.63 3310.6 31810.02 86.59609
Belgium 0.8372 113230.3601 19234.47 9000 10000 0.6877 -1.86615 33628.13 3495.9 32166.74 84.35468
Canada 1.0616 107621.5746 21035.25 95728.18 77604.94 0.6877 7.617611 103933.6 12818.9 113871.8 87.89569
Denmark 1.0561 1005374.748 25985.15 5485.307 5859.938 0.6877 -2.85405 29246.72 2694.9 22916.5 85.07668
Finland 0.9972 1355931.51 26714.63 3039.818 7938.187 0.6877 2.88092 21842.15 2458 29593.37 81.35746
France 0.928 73383.25397 20170.71 56286.8 76889.09 0.6877 -3.05564 222683.4 21829.5 216179.1 86.20749
Germany 0.8638 6016.183109 25403.25 61525.59 121075.5 0.6877 -3.36991 279445.2 27742 294374.8 86.48804
Greece 1.0262 36651.07216 9035.302 11632 2870.892 0.6877 0.00609 10438.48 60110 16012.96 80.85947
Iceland 1.0134 859008.2745 25179.98 94.55981 60.11117 0.6877 -7.03554 1246.848 135 1253.502 95.75304
Ireland 1.0533 2938525.965 11826.71 37174.2 14577.68 0.6877 -1.59843 6235.5 59110 5741.884 87.91903
Italy 0.9303 195406.4203 18859.25 36883.98 42779.22 0.6877 0.594493 167759.9 21253 193691.3 79.96222
Japan 0.9677 200783.465 22267.96 10416 154367 0.6877 -5.35774 402830.5 60110 916320.5 107.8412
Korea, Republic of
1.0629 1673.085823 5377.711 3689.151 1488.02 0.6877 12.57394 20732.6 16870 60437.09 82.80065
Mexico 1.0061 193829.6344 2990.745 16615.26 2449.134 0.6877 12.85679 16095.56 28127.9 50587.04 76.32176
Netherlands
0.8904 100057.3374 18370.13 42545.5 88004.6 0.6877 -4.95927 390.3816 6032 467.1857 89.50417
New Zealand
0.9464 53881.99889 13135.72 3167.902 2058.829 0.6877 -4.05456 27488.73 1508.2 17906 101.862
Norway 0.9369 365230.5831 27190.29 8660.578 5094.482 0.6877 -0.24687 28542.96 2114 4 27839.26 87.57018
Portugal 0.9676 193829.6344 6798.833 5861.227 737 0.6877 0.820194 7584.494 4516.8 15803.96 79.1968
Spain 1.0626 195539.8287 12377.31 29578.08 11371.7 0.6877 3.957644 57500.48 11772.7 90025.6 76.2735
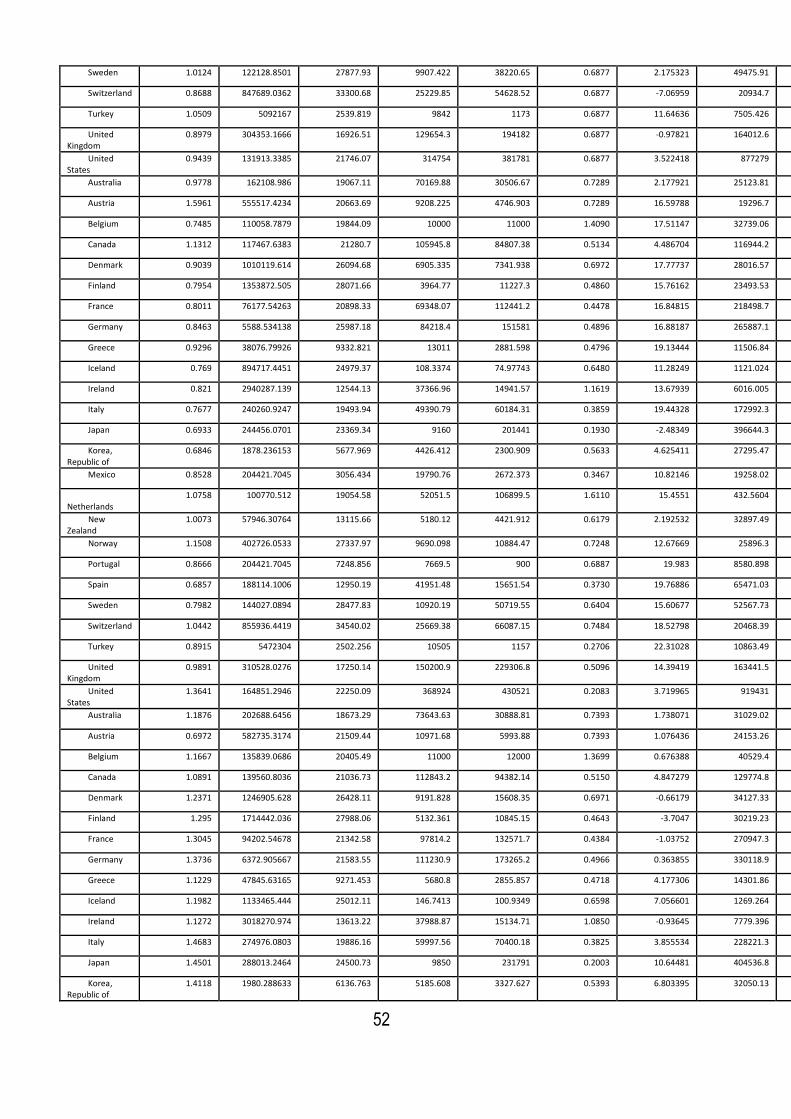
52
Sweden 1.0124 122128.8501 27877.93 9907.422 38220.65 0.6877 2.175323 49475.91 4375 42239.81 82.21791
Switzerland 0.8688 847689.0362 33300.68 25229.85 54628.52 0.6877 -7.06959 20934.7 3607 55531.76 88.54162
Turkey 1.0509 5092167 2539.819 9842 1173 0.6877 11.64636 7505.426 19445 28083.08 66.04335
United Kingdom
0.8979 304353.1666 16926.51 129654.3 194182 0.6877 -0.97821 164012.6 25914 178981.4 86.58401
United States
0.9439 131913.3385 21746.07 314754 381781 0.6877 3.522418 877279 114968 952384 92.75762
Australia 0.9778 162108.986 19067.11 70169.88 30506.67 0.7289 2.177921 25123.81 7716.3 32837.72 97.82208 1989
Austria 1.5961 555517.4234 20663.69 9208.225 4746.903 0.7289 16.59788 19296.7 3346.4 32837.72 83.40212
Belgium 0.7485 110058.7879 19844.09 10000 11000 1.4090 17.51147 32739.06 3594.9 35024.99 82.48853
Canada 1.1312 117467.6383 21280.7 105945.8 84807.38 0.5134 4.486704 116944.2 13086 129348.9 95.5133
Denmark 0.9039 1010119.614 26094.68 6905.335 7341.938 0.6972 17.77737 28016.57 2645.3 22678.39 82.22263
Finland 0.7954 1353872.505 28071.66 3964.77 11227.3 0.4860 15.76162 23493.53 2531 35812.53 84.23838
France 0.8011 76177.54263 20898.33 69348.07 112441.2 0.4478 16.84815 218498.7 22146.2 226311.5 83.15185
Germany 0.8463 5588.534138 25987.18 84218.4 151581 0.4896 16.88187 265887.1 29334 306227.3 83.11813
Greece 0.9296 38076.79926 9332.821 13011 2881.598 0.4796 19.13444 11506.84 61280 16789.29 80.86556
Iceland 0.769 894717.4451 24979.37 108.3374 74.97743 0.6480 11.28249 1121.024 136 1050.917 88.71751
Ireland 0.821 2940287.139 12544.13 37366.96 14941.57 1.1619 13.67939 6016.005 60110 6730.864 86.32061
Italy 0.7677 240260.9247 19493.94 49390.79 60184.31 0.3859 19.44328 172992.3 21154 199506.9 80.55672
Japan 0.6933 244456.0701 23369.34 9160 201441 0.1930 -2.48349 396644.3 61280 950672.7 102.4835
Korea, Republic of
0.6846 1878.236153 5677.969 4426.412 2300.909 0.5633 4.625411 27295.47 17560 80356.04 95.37459
Mexico 0.8528 204421.7045 3056.434 19790.76 2672.373 0.3467 10.82146 19258.02 2900 62633.18 89.17854
Netherlands
1.0758 100770.512 19054.58 52051.5 106899.5 1.6110 15.4551 432.5604 6155 619.0655 84.5449
New Zealand
1.0073 57946.30764 13115.66 5180.12 4421.912 0.6179 2.192532 32897.49 1468.4 24026.32 97.80747
Norway 1.1508 402726.0533 27337.97 9690.098 10884.47 0.7248 12.67669 25896.3 2049 25354.04 87.32331
Portugal 0.8666 204421.7045 7248.856 7669.5 900 0.6887 19.983 8580.898 4613.1 15781.59 80.017
Spain 0.6857 188114.1006 12950.19 41951.48 15651.54 0.3730 19.76886 65471.03 12258.3 104465.3 80.23114
Sweden 0.7982 144027.0894 28477.83 10920.19 50719.55 0.6404 15.60677 52567.73 4442 48938.37 84.39323
Switzerland 1.0442 855936.4419 34540.02 25669.38 66087.15 0.7484 18.52798 20468.39 3704 56371.03 81.47202
Turkey 0.8915 5472304 2502.256 10505 1157 0.2706 22.31028 10863.49 18866 30918.59 77.68972
United Kingdom
0.9891 310528.0276 17250.14 150200.9 229306.8 0.5096 14.39419 163441.5 26684 186526.6 85.60581
United States
1.3641 164851.2946 22250.09 368924 430521 0.2083 3.719965 919431 117342 1021589 96.28003
Australia 1.1876 202688.6456 18673.29 73643.63 30888.81 0.7393 1.738071 31029.02 7836.6 41300.99 100 1990
Austria 0.6972 582735.3174 21509.44 10971.68 5993.88 0.7393 1.076436 24153.26 3420 41300.99 100
Belgium 1.1667 135839.0686 20405.49 11000 12000 1.3699 0.676388 40529.4 3636.7 45319.91 100
Canada 1.0891 139560.8036 21036.73 112843.2 94382.14 0.5150 4.847279 129774.8 13165.1 121857.3 100
Denmark 1.2371 1246905.628 26428.11 9191.828 15608.35 0.6971 -0.66179 34127.33 2670 27082.4 100
Finland 1.295 1714442.036 27988.06 5132.361 10845.15 0.4643 -3.7047 30219.23 2525 39874.52 100
France 1.3045 94202.54678 21342.58 97814.2 132571.7 0.4384 -1.03752 270947.3 22381.1 280801.5 100
Germany 1.3736 6372.905667 21583.55 111230.9 173265.2 0.4966 0.363855 330118.9 29684 397047 100
Greece 1.1229 47845.63165 9271.453 5680.8 2855.857 0.4718 4.177306 14301.86 62490 21301.63 100
Iceland 1.1982 1133465.444 25012.11 146.7413 100.9349 0.6598 7.056601 1269.264 137 1209.381 100
Ireland 1.1272 3018270.974 13613.22 37988.87 15134.71 1.0850 -0.93645 7779.396 61280 9889.746 100
Italy 1.4683 274976.0803 19886.16 59997.56 70400.18 0.3825 3.855534 228221.3 21454 253267.8 100
Japan 1.4501 288013.2464 24500.73 9850 231791 0.2003 10.64481 404536.8 62490 999968.9 100
Korea, Republic of
1.4118 1980.288633 6136.763 5185.608 3327.627 0.5393 6.803395 32050.13 18085 101681.9 100
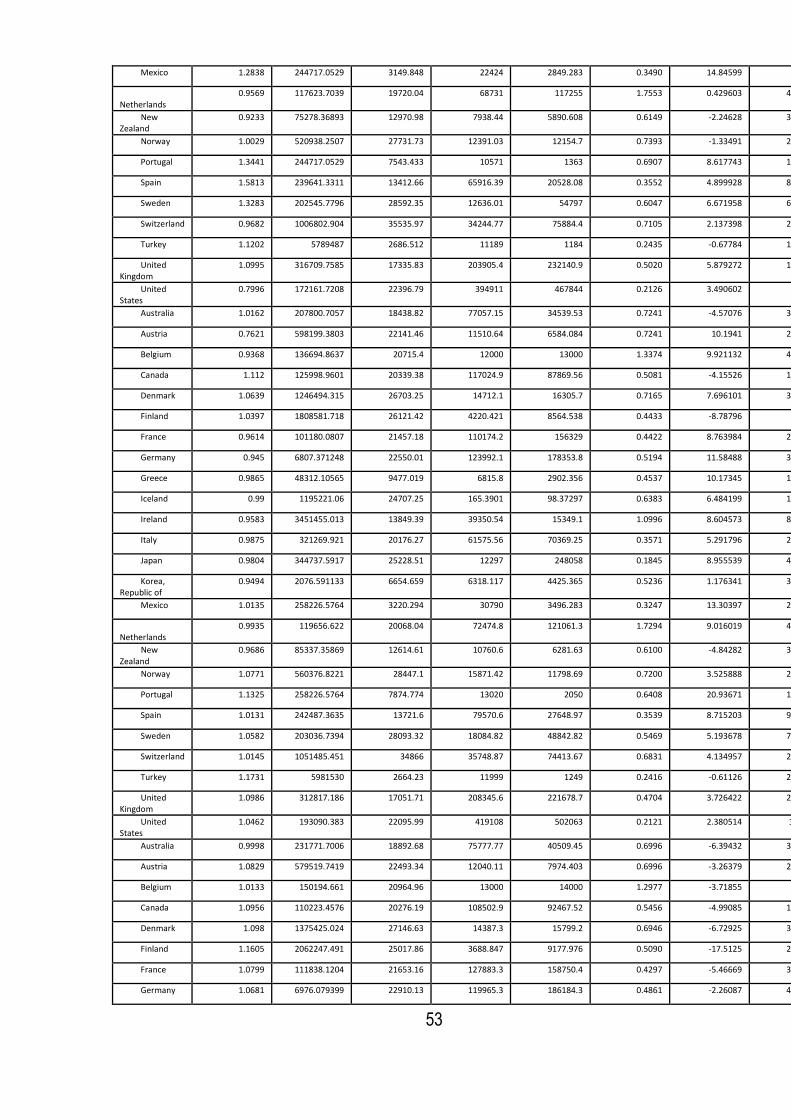
53
Mexico 1.2838 244717.0529 3149.848 22424 2849.283 0.3490 14.84599 23006.2 74432.3 100
Netherlands
0.9569 117623.7039 19720.04 68731 117255 1.7553 0.429603 473.0926 6356 590.4745 100
New Zealand
0.9233 75278.36893 12970.98 7938.44 5890.608 0.6149 -2.24628 38631.94 1481.4 29450.85 100
Norway 1.0029 520938.2507 27731.73 12391.03 12154.7 0.7393 -1.33491 26682.89 2030 24603.09 100
Portugal 1.3441 244717.0529 7543.433 10571 1363 0.6907 8.617743 11751.17 4717.5 20087.22 100
Spain 1.5813 239641.3311 13412.66 65916.39 20528.08 0.3552 4.899928 86901.39 12578.8 135941.5 100
Sweden 1.3283 202545.7796 28592.35 12636.01 54797 0.6047 6.671958 65759.54 4485 56760.37 100
Switzerland 0.9682 1006802.904 35535.97 34244.77 75884.4 0.7105 2.137398 26795.62 3821 72325.81 100
Turkey 1.1202 5789487 2686.512 11189 1184 0.2435 -0.67784 17922.44 19946 45093.9 100
United Kingdom
1.0995 316709.7585 17335.83 203905.4 232140.9 0.5020 5.879272 195891.8 27191 199534 100
United States
0.7996 172161.7208 22396.79 394911 467844 0.2126 3.490602 983441 118793 1021536 100
Australia 1.0162 207800.7057 18438.82 77057.15 34539.53 0.7241 -4.57076 32709.47 7667.9 43671.94 101.7381 1991
Austria 0.7621 598199.3803 22141.46 11510.64 6584.084 0.7241 10.1941 25642.57 3481.7 43671.94 101.0764
Belgium 0.9368 136694.8637 20715.4 12000 13000 1.3374 9.921132 43328.34 3730.5 43588.58 100.6764
Canada 1.112 125998.9601 20339.38 117024.9 87869.56 0.5081 -4.15526 141600.5 12916.1 112365.5 104.8473
Denmark 1.0639 1246494.315 26703.25 14712.1 16305.7 0.7165 7.696101 34607.43 2647.2 25517.87 99.33821
Finland 1.0397 1808581.718 26121.42 4220.421 8564.538 0.4433 -8.78796 31157.9 2402 27827.75 96.2953
France 0.9614 101180.0807 21457.18 110174.2 156329 0.4422 8.763984 277022.9 22420.3 270525 98.96248
Germany 0.945 6807.371248 22550.01 123992.1 178353.8 0.5194 11.58488 344839.7 30094 433972.4 100.3639
Greece 0.9865 48312.10565 9477.019 6815.8 2902.356 0.4537 10.17345 14488.71 63690 23583.76 104.1773
Iceland 0.99 1195221.06 24707.25 165.3901 98.37297 0.6383 6.484199 1399.707 136.9 1363.59 107.0566
Ireland 0.9583 3451455.013 13849.39 39350.54 15349.1 1.0996 8.604573 8309.575 62490 9125.955 99.06355
Italy 0.9875 321269.921 20176.27 61575.56 70369.25 0.3571 5.291796 241756.5 21595 263190 103.8555
Japan 0.9804 344737.5917 25228.51 12297 248058 0.1845 8.955539 465262.1 63690 1130234 110.6448
Korea, Republic of
0.9494 2076.591133 6654.659 6318.117 4425.365 0.5236 1.176341 36892.14 18677 125825.1 106.8034
Mexico 1.0135 258226.5764 3220.294 30790 3496.283 0.3247 13.30397 29816.32 30534.1 89811.63 114.846
Netherlands
0.9935 119656.622 20068.04 72474.8 121061.3 1.7294 9.016019 478.7597 6521 651.1689 100.4296
New Zealand
0.9686 85337.35869 12614.61 10760.6 6281.63 0.6100 -4.84282 35644.75 1460.8 23322.98 97.75372
Norway 1.0771 560376.8221 28447.1 15871.42 11798.69 0.7200 3.525888 24283.11 2010 23781.95 98.66509
Portugal 1.1325 258226.5764 7874.774 13020 2050 0.6408 20.93671 14790.71 4857.4 21142.88 108.6177
Spain 1.0131 242487.3635 13721.6 79570.6 27648.97 0.3539 8.715203 97346.85 12609.4 141769.5 104.8999
Sweden 1.0582 203036.7394 28093.32 18084.82 48842.82 0.5469 5.193678 71171.12 4396 50879.68 106.672
Switzerland 1.0145 1051485.451 34866 35748.87 74413.67 0.6831 4.134957 28462.31 4075 66171.59 102.1374
Turkey 1.1731 5981530 2664.23 11999 1249 0.2416 -0.61126 20262.04 19022 42194.96 99.32216
United Kingdom
1.0986 312817.186 17051.71 208345.6 221678.7 0.4704 3.726422 213985.3 26305 176635.4 105.8793
United States
1.0462 193090.383 22095.99 419108 502063 0.2121 2.380514 1027005 117718 971452 103.4906
Australia 0.9998 231771.7006 18892.68 75777.77 40509.45 0.6996 -6.39432 37358.16 7612.2 47610.4 97.16732 1992
Austria 1.0829 579519.7419 22493.34 12040.11 7974.403 0.6996 -3.26379 25123.81 3546.7 47610.4 111.2705
Belgium 1.0133 150194.661 20964.96 13000 14000 1.2977 -3.71855 49033 3772.5 48089.55 110.5975
Canada 1.0956 110223.4576 20276.19 108502.9 92467.52 0.5456 -4.99085 139640.5 12842 103140.9 100.692
Denmark 1.098 1375425.024 27146.63 14387.3 15799.2 0.6946 -6.72925 37946.15 2652.2 26843.84 107.0343
Finland 1.1605 2062247.491 25017.86 3688.847 9177.976 0.5090 -17.5125 27939.13 2233 20484.8 87.50734
France 1.0799 111838.1204 21653.16 127883.3 158750.4 0.4297 -5.46669 313644.5 22001.5 274086.8 107.7265
Germany 1.0681 6976.079399 22910.13 119965.3 186184.3 0.4861 -2.26087 403752.7 29782 482329.1 111.9487
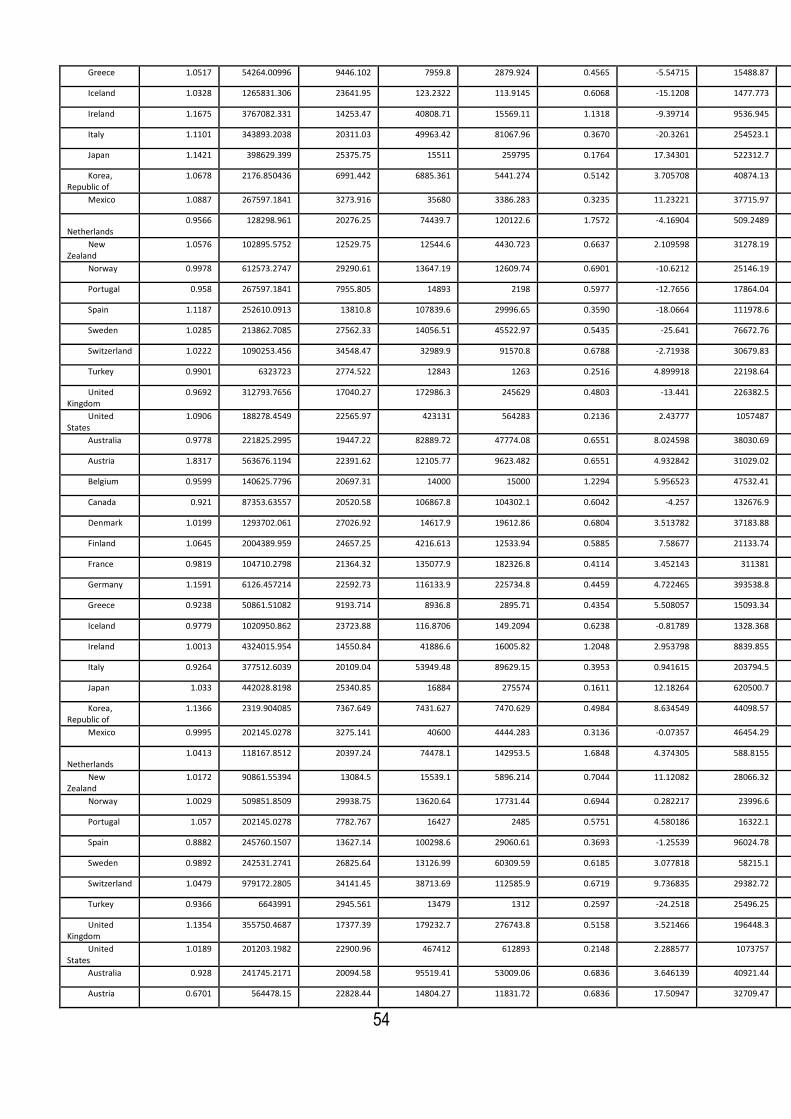
54
Greece 1.0517 54264.00996 9446.102 7959.8 2879.924 0.4565 -5.54715 15488.87 64360 23319.1 114.3508
Iceland 1.0328 1265831.306 23641.95 123.2322 113.9145 0.6068 -15.1208 1477.773 136.9 1262.958 113.5408
Ireland 1.1675 3767082.331 14253.47 40808.71 15569.11 1.1318 -9.39714 9536.945 63690 8668.471 107.6681
Italy 1.1101 343893.2038 20311.03 49963.42 81067.96 0.3670 -20.3261 254523.1 21609 271219.5 109.1473
Japan 1.1421 398629.399 25375.75 15511 259795 0.1764 17.34301 522312.7 64360 1166912 119.6003
Korea, Republic of
1.0678 2176.850436 6991.442 6885.361 5441.274 0.5142 3.705708 40874.13 19033 126413.3 107.9797
Mexico 1.0887 267597.1841 3273.916 35680 3386.283 0.3235 11.23221 37715.97 31000 103687.5 128.15
Netherlands
0.9566 128298.961 20276.25 74439.7 120122.6 1.7572 -4.16904 509.2489 6597 633.2091 109.4456
New Zealand
1.0576 102895.5752 12529.75 12544.6 4430.723 0.6637 2.109598 31278.19 1466.6 20244.81 92.91091
Norway 0.9978 612573.2747 29290.61 13647.19 12609.74 0.6901 -10.6212 25146.19 2004 24334.38 102.191
Portugal 0.958 267597.1841 7955.805 14893 2198 0.5977 -12.7656 17864.04 4586.7 24707.93 129.5544
Spain 1.1187 252610.0913 13810.8 107839.6 29996.65 0.3590 -18.0664 111978.6 12822.3 143352.7 113.6151
Sweden 1.0285 213862.7085 27562.33 14056.51 45522.97 0.5435 -25.641 76672.76 4209 48327.15 111.8656
Switzerland 1.0222 1090253.456 34548.47 32989.9 91570.8 0.6788 -2.71938 30679.83 4016 60072.11 106.2724
Turkey 0.9901 6323723 2774.522 12843 1263 0.2516 4.899918 22198.64 19085 46665.05 98.7109
United Kingdom
0.9692 312793.7656 17040.27 172986.3 245629 0.4803 -13.441 226382.5 25728 173161.6 109.6057
United States
1.0906 188278.4549 22565.97 423131 564283 0.2136 2.43777 1057487 118492 1038326 105.8711
Australia 0.9778 221825.2995 19447.22 82889.72 47774.08 0.6551 8.024598 38030.69 7644.8 44768.18 90.77299 1993
Austria 1.8317 563676.1194 22391.62 12105.77 9623.482 0.6551 4.932842 31029.02 3575.5 44768.18 108.0067
Belgium 0.9599 140625.7796 20697.31 14000 15000 1.2294 5.956523 47532.41 3745.5 44679.88 106.879
Canada 0.921 87353.63557 20520.58 106867.8 104302.1 0.6042 -4.257 132676.9 13014.7 100595.8 95.70117
Denmark 1.0199 1293702.061 27026.92 14617.9 19612.86 0.6804 3.513782 37183.88 2584.4 22841.98 100.3051
Finland 1.0645 2004389.959 24657.25 4216.613 12533.94 0.5885 7.58677 21133.74 2099 13848.72 69.99485
France 0.9819 104710.2798 21364.32 135077.9 182326.8 0.4114 3.452143 311381 21713.9 226441.4 102.2598
Germany 1.1591 6126.457214 22592.73 116133.9 225734.8 0.4459 4.722465 393538.8 29397 444347.4 109.6879
Greece 0.9238 50861.51082 9193.714 8936.8 2895.71 0.4354 5.508057 15093.34 64500 20777.96 108.8036
Iceland 0.9779 1020950.862 23723.88 116.8706 149.2094 0.6238 -0.81789 1328.368 136.6 1036.077 98.41996
Ireland 1.0013 4324015.954 14550.84 41886.6 16005.82 1.2048 2.953798 8839.855 64360 7554.645 98.27098
Italy 0.9264 377512.6039 20109.04 53949.48 89629.15 0.3953 0.941615 203794.5 20705 192625.9 88.82127
Japan 1.033 442028.8198 25340.85 16884 275574 0.1611 12.18264 620500.7 64500 1279729 136.9434
Korea, Republic of
1.1366 2319.904085 7367.649 7431.627 7470.629 0.4984 8.634549 44098.57 19328 132967.2 111.6854
Mexico 0.9995 202145.0278 3275.141 40600 4444.283 0.3136 -0.07357 46454.29 32832.7 103653.5 139.3822
Netherlands
1.0413 118167.8512 20397.24 74478.1 142953.5 1.6848 4.374305 588.8155 6648 584.9375 105.2766
New Zealand
1.0172 90861.55394 13084.5 15539.1 5896.214 0.7044 11.12082 28066.32 1495.8 18349.68 95.0205
Norway 1.0029 509851.8509 29938.75 13620.64 17731.44 0.6944 0.282217 23996.6 2004 23131.66 91.56978
Portugal 1.057 202145.0278 7782.767 16427 2485 0.5751 4.580186 16322.1 4493.1 19368.83 116.7889
Spain 0.8882 245760.1507 13627.14 100298.6 29060.61 0.3693 -1.25539 96024.78 12293.8 106411.8 95.54877
Sweden 0.9892 242531.2741 26825.64 13126.99 60309.59 0.6185 3.077818 58215.1 3964 30583.06 86.22461
Switzerland 1.0479 979172.2805 34141.45 38713.69 112585.9 0.6719 9.736835 29382.72 3983 54969.8 103.553
Turkey 0.9366 6643991 2945.561 13479 1312 0.2597 -24.2518 25496.25 18047 61234.5 103.6108
United Kingdom
1.1354 355750.4687 17377.39 179232.7 276743.8 0.5158 3.521466 196448.3 25317 151970 96.1647
United States
1.0189 201203.1982 22900.96 467412 612893 0.2148 2.288577 1073757 120259 1129481 108.3089
Australia 0.928 241745.2171 20094.58 95519.41 53009.06 0.6836 3.646139 40921.44 7904.3 49102.09 98.79759 1994
Austria 0.6701 564478.15 22828.44 14804.27 11831.72 0.6836 17.50947 32709.47 3742 49102.09 112.9396
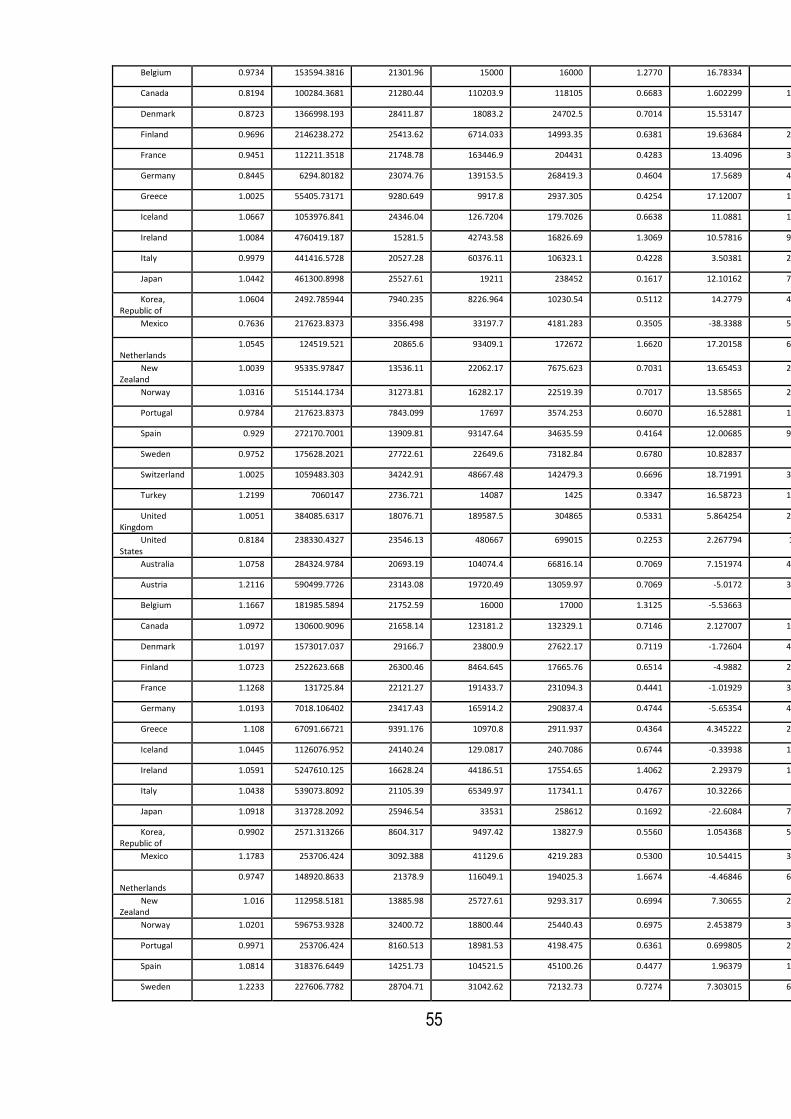
55
Belgium 0.9734 153594.3816 21301.96 15000 16000 1.2770 16.78334 51586.7 3754.95 48871.61 112.8355
Canada 0.8194 100284.3681 21280.44 110203.9 118105 0.6683 1.602299 125648.2 13291.7 106530.4 91.44417
Denmark 0.8723 1366998.193 28411.87 18083.2 24702.5 0.7014 15.53147 39201 2554.9 27072.34 103.8188
Finland 0.9696 2146238.272 25413.62 6714.033 14993.35 0.6381 19.63684 23564.32 2080 16890.68 77.58162
France 0.9451 112211.3518 21748.78 163446.9 204431 0.4283 13.4096 324628.5 21750 250534.1 105.7119
Germany 0.8445 6294.80182 23074.76 139153.5 268419.3 0.4604 17.5689 418116.2 36048 482294.4 114.4103
Greece 1.0025 55405.73171 9280.649 9917.8 2937.305 0.4254 17.12007 15576.14 64530 20983.97 114.3117
Iceland 1.0667 1053976.841 24346.04 126.7204 179.7026 0.6638 11.0881 1357.257 137.7 1007.519 97.60207
Ireland 1.0084 4760419.187 15281.5 42743.58 16826.69 1.3069 10.57816 9535.814 64500 8785.457 101.2248
Italy 0.9979 441416.5728 20527.28 60376.11 106323.1 0.4228 3.50381 202936.4 20373 197573.5 89.76289
Japan 1.0442 461300.8998 25527.61 19211 238452 0.1617 12.10162 700218.5 64530 1349838 149.126
Korea, Republic of
1.0604 2492.785944 7940.235 8226.964 10230.54 0.5112 14.2779 49853.19 19905 160797.4 120.32
Mexico 0.7636 217623.8373 3356.498 33197.7 4181.283 0.3505 -38.3388 50803.96 33000 111870.4 139.3086
Netherlands
1.0545 124519.521 20865.6 93409.1 172672 1.6620 17.20158 622.8183 6692 582.098 109.6509
New Zealand
1.0039 95335.97847 13536.11 22062.17 7675.623 0.7031 13.65453 28188.19 1559.5 19758.35 106.1413
Norway 1.0316 515144.1734 31273.81 16282.17 22519.39 0.7017 13.58565 26354.49 2035 24707.89 91.852
Portugal 0.9784 217623.8373 7843.099 17697 3574.253 0.6070 16.52881 17181.95 4481.8 21061.67 121.3691
Spain 0.929 272170.7001 13909.81 93147.64 34635.59 0.4164 12.00685 93936.59 12207.6 108457.9 94.29338
Sweden 0.9752 175628.2021 27722.61 22649.6 73182.84 0.6780 10.82837 60559.2 3928 35437.67 89.30243
Switzerland 1.0025 1059483.303 34242.91 48667.48 142479.3 0.6696 18.71991 32218.54 3955 64294.06 113.2898
Turkey 1.2199 7060147 2736.721 14087 1425 0.3347 16.58723 16514.99 19401 34500.65 79.35898
United Kingdom
1.0051 384085.6317 18076.71 189587.5 304865 0.5331 5.864254 207302.7 26000 171610.7 99.68617
United States
0.8184 238330.4327 23546.13 480667 699015 0.2253 2.267794 1102446 123060 1278594 110.5975
Australia 1.0758 284324.9784 20693.19 104074.4 66816.14 0.7069 7.151974 48747.78 8218.2 59168.02 102.4437 1995
Austria 1.2116 590499.7726 23143.08 19720.49 13059.97 0.7069 -5.0172 37358.16 3758.8 59168.02 130.4491
Belgium 1.1667 181985.5894 21752.59 16000 17000 1.3125 -5.53663 61246 3794.9 56900.03 129.6188
Canada 1.0972 130600.9096 21658.14 123181.2 132329.1 0.7146 2.127007 125658.6 13295.4 110771.3 93.04647
Denmark 1.0197 1573017.037 29166.7 23800.9 27622.17 0.7119 -1.72604 45907.03 2609.7 35499.28 119.3503
Finland 1.0723 2522623.668 26300.46 8464.645 17665.76 0.6514 -4.9882 29755.43 2128 23170.65 97.21846
France 1.1268 131725.84 22121.27 191433.7 231094.3 0.4441 -1.01929 372608.6 21954.4 291966.8 119.1215
Germany 1.0193 7018.106402 23417.43 165914.2 290837.4 0.4744 -5.65354 493784.4 35982 560587.6 131.9792
Greece 1.108 67091.66721 9391.176 10970.8 2911.937 0.4364 4.345222 20352.83 64570 24289.95 131.4317
Iceland 1.0445 1126076.952 24140.24 129.0817 240.7086 0.6744 -0.33938 1547.665 141.8 1146.9 108.6902
Ireland 1.0591 5247610.125 16628.24 44186.51 17554.65 1.4062 2.29379 10945.28 64530 12158.13 111.8029
Italy 1.0438 539073.8092 21105.39 65349.97 117341.1 0.4767 10.32266 202254 20233 223356.5 93.2667
Japan 1.0918 313728.2092 25946.54 33531 258612 0.1692 -22.6084 793788.4 64570 1491725 161.2276
Korea, Republic of
0.9902 2571.313266 8604.317 9497.42 13827.9 0.5560 1.054368 59594.86 20432 200155.7 134.5979
Mexico 1.1783 253706.424 3092.388 41129.6 4219.283 0.5300 10.54415 31237.66 32652.2 69440.74 100.9698
Netherlands
0.9747 148920.8633 21378.9 116049.1 194025.3 1.6674 -4.46846 650.0206 6835 621.851 126.8525
New Zealand
1.016 112958.5181 13885.98 25727.61 9293.317 0.6994 7.30655 29162.73 1632.6 22485.45 119.7959
Norway 1.0201 596753.9328 32400.72 18800.44 25440.43 0.6975 2.453879 33249.06 2079 29477.25 105.4376
Portugal 0.9971 253706.424 8160.513 18981.53 4198.475 0.6361 0.699805 20265.06 4441.7 26305.96 137.8979
Spain 1.0814 318376.6449 14251.73 104521.5 45100.26 0.4477 1.96379 107910.9 12512 130673.2 106.3002
Sweden 1.2233 227606.7782 28704.71 31042.62 72132.73 0.7274 7.303015 67522.62 3986 42901.79 100.1308
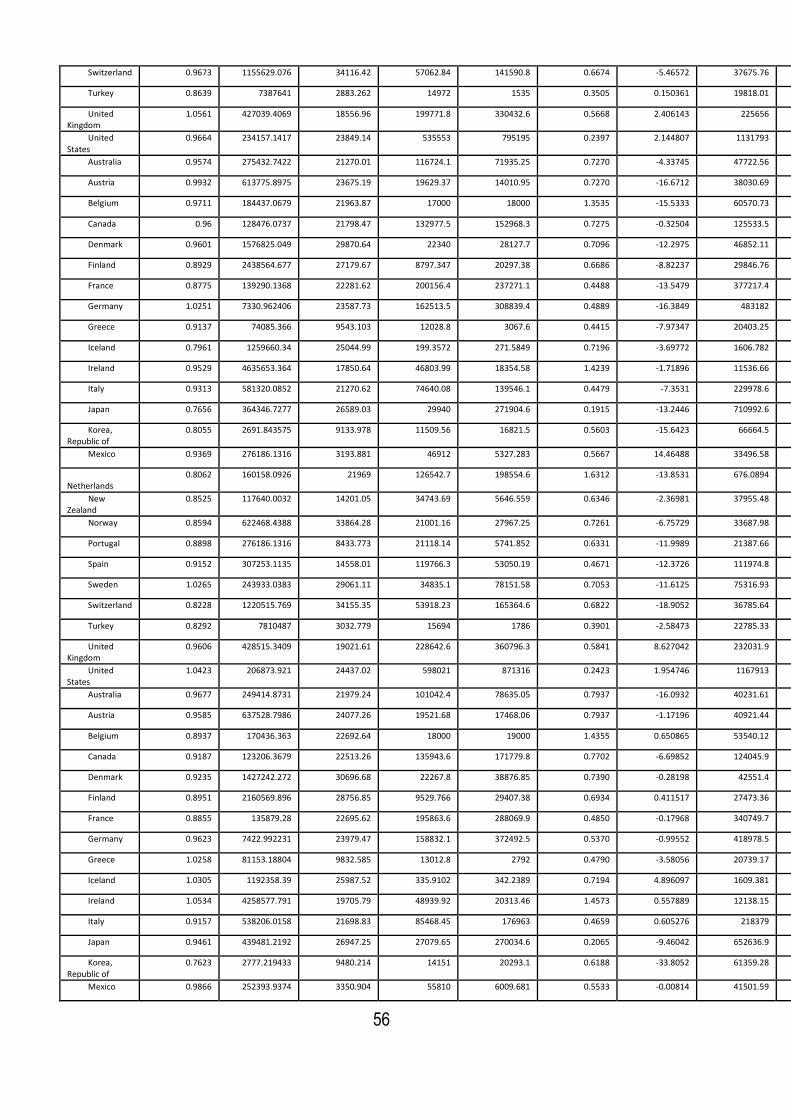
56
Switzerland 0.9673 1155629.076 34116.42 57062.84 141590.8 0.6674 -5.46572 37675.76 3952 74462.58 132.0097
Turkey 0.8639 7387641 2883.262 14972 1535 0.3505 0.150361 19818.01 19893 53027.91 95.94621
United Kingdom
1.0561 427039.4069 18556.96 199771.8 330432.6 0.5668 2.406143 225656 27660 193195.8 105.5504
United States
0.9664 234157.1417 23849.14 535553 795195 0.2397 2.144807 1131793 124900 1340514 112.8653
Australia 0.9574 275432.7422 21270.01 116724.1 71935.25 0.7270 -4.33745 47722.56 8324.2 57923.96 109.5957 1996
Austria 0.9932 613775.8975 23675.19 19629.37 14010.95 0.7270 -16.6712 38030.69 3709.8 57923.96 125.4319
Belgium 0.9711 184437.0679 21963.87 17000 18000 1.3535 -15.5333 60570.73 3791.88 53889.44 124.0822
Canada 0.96 128476.0737 21798.47 132977.5 152968.3 0.7275 -0.32504 125533.5 13421.4 111632.2 95.17347
Denmark 0.9601 1576825.049 29870.64 22340 28127.7 0.7096 -12.2975 46852.11 2627.3 35110.8 117.6243
Finland 0.8929 2438564.677 27179.67 8797.347 20297.38 0.6686 -8.82237 29846.76 2158 21614.6 92.23026
France 0.8775 139290.1368 22281.62 200156.4 237271.1 0.4488 -13.5479 377217.4 22036.4 278287 118.1022
Germany 1.0251 7330.962406 23587.73 162513.5 308839.4 0.4889 -16.3849 483182 35805 514778.9 126.3257
Greece 0.9137 74085.366 9543.103 12028.8 3067.6 0.4415 -7.97347 20403.25 64860 26883.56 135.777
Iceland 0.7961 1259660.34 25044.99 199.3572 271.5849 0.7196 -3.69772 1606.782 142 1389.218 108.3508
Ireland 0.9529 4635653.364 17850.64 46803.99 18354.58 1.4239 -1.71896 11536.66 64570 14497.7 114.0967
Italy 0.9313 581320.0852 21270.62 74640.08 139546.1 0.4479 -7.3531 229978.6 20320 241441 103.5894
Japan 0.7656 364346.7277 26589.03 29940 271904.6 0.1915 -13.2446 710992.6 64860 1340506 138.6192
Korea, Republic of
0.8055 2691.843575 9133.978 11509.56 16821.5 0.5603 -15.6423 66664.5 20817 222751.4 135.6523
Mexico 0.9369 276186.1316 3193.881 46912 5327.283 0.5667 14.46488 33496.58 33968.6 94014.08 111.514
Netherlands
0.8062 160158.0926 21969 126542.7 198554.6 1.6312 -13.8531 676.0894 6971 796.4804 122.384
New Zealand
0.8525 117640.0032 14201.05 34743.69 5646.559 0.6346 -2.36981 37955.48 1687.5 27913.9 127.1024
Norway 0.8594 622468.4388 33864.28 21001.16 27967.25 0.7261 -6.75729 33687.98 2131 32358.48 107.8915
Portugal 0.8898 276186.1316 8433.773 21118.14 5741.852 0.6331 -11.9989 21387.66 4467.2 27700.41 138.5977
Spain 0.9152 307253.1135 14558.01 119766.3 53050.19 0.4671 -12.3726 111974.8 12817.5 135105.2 108.264
Sweden 1.0265 243933.0383 29061.11 34835.1 78151.58 0.7053 -11.6125 75316.93 3963 45093.35 107.4338
Switzerland 0.8228 1220515.769 34155.35 53918.23 165364.6 0.6822 -18.9052 36785.64 3950 69416.7 126.544
Turkey 0.8292 7810487 3032.779 15694 1786 0.3901 -2.58473 22785.33 20388 54772.34 96.09657
United Kingdom
0.9606 428515.3409 19021.61 228642.6 360796.3 0.5841 8.627042 232031.9 27967 205874.6 107.9566
United States
1.0423 206873.921 24437.02 598021 871316 0.2423 1.954746 1167913 126708 1449646 115.0101
Australia 0.9677 249414.8731 21979.24 101042.4 78635.05 0.7937 -16.0932 40231.61 8391.3 51459.38 105.2583 1997
Austria 0.9585 637528.7986 24077.26 19521.68 17468.06 0.7937 -1.17196 40921.44 3719.4 51459.38 108.7607
Belgium 0.8937 170436.363 22692.64 18000 19000 1.4355 0.650865 53540.12 3839.17 50904.84 108.5489
Canada 0.9187 123206.3679 22513.26 135943.6 171779.8 0.7702 -6.69852 124045.9 13706 132181 94.84844
Denmark 0.9235 1427242.272 30696.68 22267.8 38876.85 0.7390 -0.28198 42551.4 2682 35468.46 105.3268
Finland 0.8951 2160569.896 28756.85 9529.766 29407.38 0.6934 0.411517 27473.36 2194 23052.52 83.40789
France 0.8855 135879.28 22695.62 195863.6 288069.9 0.4850 -0.17968 340749.7 22166.6 248148.9 104.5543
Germany 0.9623 7422.992231 23979.47 158832.1 372492.5 0.5370 -0.99552 418978.5 35860 456142.6 109.9408
Greece 1.0258 81153.18804 9832.585 13012.8 2792 0.4790 -3.58056 20739.17 65570 26607.69 127.8035
Iceland 1.0305 1192358.39 25987.52 335.9102 342.2389 0.7194 4.896097 1609.381 142 1461.519 104.6531
Ireland 1.0534 4258577.791 19705.79 48939.92 20313.46 1.4573 0.557889 12138.15 64860 17163.26 112.3778
Italy 0.9157 538206.0158 21698.83 85468.45 176963 0.4659 0.605276 218379 20413 230813.4 96.23626
Japan 0.9461 439481.2192 26947.25 27079.65 270034.6 0.2065 -9.46042 652636.9 65570 1207876 125.3746
Korea, Republic of
0.7623 2777.219433 9480.214 14151 20293.1 0.6188 -33.8052 61359.28 21106 190836.5 120.0099
Mexico 0.9866 252393.9374 3350.904 55810 6009.681 0.5533 -0.00814 41501.59 35924.8 126931.9 125.9788
57
Netherlands
1.0057 158223.0424 22768.98 122192.7 229000.1 1.4250 0.264768 721.3461 7194 690.1739 108.5309
New Zealand
0.8488 111953.4151 14298.6 31507.18 5490.835 0.6396 -22.461 44836.56 1735.9 35678.79 124.7326
Norway 0.9151 572661.1686 35492.76 22485.89 23719.21 0.7451 -7.05196 36959.03 2194 34747.64 101.1342
Portugal 0.9745 252393.9374 8760.044 22392.51 10225.07 0.6519 1.253092 20278.81 4546 28663.92 126.5988
Spain 0.8974 266880.1742 15082.3 105295.5 74133.45 0.5174 0.416862 100058.7 13345.6 126351.8 95.89145
Sweden 1.1205 255243.1829 29761.7 41453.6 93573.5 0.7673 -3.26305 67498.64 3922 40279.93 95.8213
Switzerland 1.0263 1358947.156 34742.06 59518.93 184232.3 0.7501 0.422539 31188.83 3951 59309.88 107.6388
Turkey 0.8665 8304986 3206.173 16499 2153 0.4352 2.177425 25260.7 20362 58617.91 93.51184
United Kingdom
0.9488 381799.3356 19558.6 252958.6 488372.1 0.5668 4.49657 246632.4 28468 233943.3 116.5836
United States
1.0451 212145.8297 25229.84 681842 1000703 0.2503 1.30286 1206599 129558 1614750 116.9648
Australia 1.0589 255131.0823 22860.89 105944.4 89556.2 0.8166 4.306003 41054.81 8572.3 52550.31 89.1651 1998
Austria 0.9315 616781.7793 24920.47 23564.24 19126.87 0.8166 -3.8218 48747.78 3723.3 52550.31 107.5887
Belgium 1.1792 173653.201 23032.58 19000 20000 1.4505 -4.14826 54395.34 3857.47 52252.68 109.1998
Canada 1.2156 130237.03 23227.5 143344.7 201434.2 0.8088 1.401668 120877.3 14046.2 125747.7 88.14991
Denmark 1.094 1474678.247 31228.61 35693.89 51332.65 0.7432 -2.45068 44488.84 2692.4 37399.56 105.0448
Finland 1.1459 2184474.594 30179.68 16455.06 33849.52 0.6803 -2.8416 27958.16 2247 25810.87 83.81941
France 1.1273 136514.8739 23399.73 246214 334096.8 0.4993 -4.31924 340602.6 22694.6 275868.9 104.3747
Germany 1.1917 8291.725191 24452.1 206776.4 413394.6 0.5595 -4.14814 418315.5 36402 472033.2 108.9453
Greece 1.1861 88116.38434 10116.1 13084 3935 0.4929 -0.47434 21048.09 65140 28439.5 124.2229
Iceland 1.1885 1217117.061 27375.07 465.9983 454.4728 0.7387 1.391431 1838.431 147.9 2001.484 109.5492
Ireland 1.1334 3856551.243 21082.21 62450.23 25231.54 1.6183 -0.93884 12511.04 65570 20297.96 112.9357
Italy 1.1534 360101.1496 22035.44 108821.6 181851.7 0.4729 -3.10406 220447.5 20618 238815.3 96.84154
Japan 1.1764 461558.2734 26345.63 26064.01 248776.9 0.1994 15.58077 613451.1 65140 1012702 115.9142
Korea, Republic of
1.6096 2807.531166 8757.845 19223.29 23333.6 0.7517 15.31675 45490.34 19994 88730.1 86.20472
Mexico 1.3018 253097.4046 3460.785 63610.4 7910.232 0.5787 12.62366 45726.77 36871.7 125353.6 125.9707
Netherlands
1.1582 151139.2 23521.55 164473.2 260874.5 1.4809 -2.60059 664.3213 7435 786.038 108.7957
New Zealand
1.2083 118547.1449 14245.83 33190.54 7006.237 0.6354 -0.4725 49475.91 1725 42239.81 102.2716
Norway 1.1443 600849.3123 36241.87 25618.42 29814.17 0.7346 2.955996 40300.08 2248 37762.8 94.08227
Portugal 1.1412 253097.4046 9152.1 30088.81 11492.83 0.6684 -1.49805 21647.62 4857 32183.74 127.8519
Spain 1.1444 275109.6313 15702.84 126059.5 118040.5 0.5355 -1.7603 104022.3 13904.2 140919.1 96.30831
Sweden 1.2206 269262.0543 30907.05 51002.65 106249.6 0.7961 -2.67977 68251.57 3979 43065.49 92.55825
Switzerland 1.1036 1455892.099 35563.63 71995.13 194584.7 0.7635 -3.11788 31122.44 4006 64816.67 108.0613
Turkey 0.9925 8752441 3250.7 17439 2798 0.4152 -3.01648 27606.68 20872 59543.31 95.68927
United Kingdom
1.105 416179.8768 20157.49 337386.2 686420.1 0.5385 -0.14953 259165.1 28651 267382.7 121.0802
United States
1.1762 210923.9792 25969.66 778418 1215960 0.2454 1.722633 1246905 131463 1747673 118.2677
Australia 0.9812 253825.9926 23500.97 120588.8 85385.45 0.8347 -5.42822 41640.17 8720.2 52114.62 93.4711 1999
Austria 0.9096 661250.6296 25720.46 23471.09 24820.64 0.8347 -12.446 47722.56 3762.3 52114.62 103.7669
Belgium 1.0079 173943.2703 23768.92 20000 21000 1.4631 -12.5257 54603.14 4006.88 53562.26 105.0515
Canada 0.9894 130706.8345 24291.04 174990 237639 0.8271 3.739579 125227.2 14406.7 134248.3 89.55158
Denmark 0.9756 1460321.573 31898.79 47642.86 44981.47 0.7636 -11.3941 44776.27 2707 34503.69 102.5941
Finland 0.9007 2143555.863 31286.19 18320.29 52109.17 0.6747 -9.11721 27677.65 2317 24737.19 80.9778
France 0.9098 140643.8536 24066.72 244668.3 445091.1 0.5019 -12.3176 338102.8 23080.2 282307.3 100.0554
Germany 0.8446 8742.606422 24935.13 235259.2 541861 0.5793 -14.7858 412559.9 33604 460576.9 104.7971
Greece 0.9529 96418.35724 10421.68 15890 6093.8 0.5473 -16.72 21878.92 64620 30914.89 123.7486
58
Iceland 0.9578 1200785.476 28222.7 477.7395 663.1641 0.7186 -5.14861 2005.536 153.3 1906.151 110.9406
Ireland 0.9991 4368738.11 22998.25 72815.42 27925.26 1.6423 -9.7999 13267.89 65140 22730.85 111.9968
Italy 0.8935 464313.3676 22462.06 108638.5 180275.2 0.4709 -11.0374 218903.7 20864 240894.3 93.73747
Japan 1.0533 526888.7386 26263.69 46115.46 278442.1 0.1897 5.084647 721705.8 64620 1085528 131.495
Korea, Republic of
1.0125 2788.482816 9514.687 29106.22 26833.2 0.6760 5.979707 56388.92 20281 133294.7 101.5215
Mexico 1.0294 257063.7728 3534.73 78060 8273.376 0.5755 18.53665 55333.06 37279.9 138127.3 138.5944
Netherlands
0.866 159045.8645 24481.35 192228.2 305461.1 1.5670 -10.5746 658.2969 7613 780.0715 106.1951
New Zealand
0.8501 121658.7275 14878.38 32875.38 8491.035 0.6404 -11.5805 52567.73 1766.3 3 48938.37 101.7991
Norway 0.9942 617861.8659 36766.52 29429.69 34026 0.7143 2.40333 36474.9 2259 34890.12 97.03827
Portugal 0.9307 257063.7728 9463.024 26910.42 19793.15 0.6601 -13.7751 22647.43 4921.6 33818.11 126.3538
Spain 0.9111 270883.7016 16360.43 125360.9 129193.6 0.5519 -9.96223 106129.5 14689.8 155221.4 94.54801
Sweden 1.0215 249761.6577 32324.87 73300.82 123256 0.7988 -7.63586 69185.35 4068 44470.1 89.87848
Switzerland 0.8838 1502661.135 35933.2 75994.87 232160.7 0.7855 -10.5406 30243.23 4038 61090.66 104.9434
Turkey 1.1435 9277902 3048.113 18222 3668 0.3873 0.37407 30543.27 21413 47763.72 92.67279
United Kingdom
0.9844 399612.3282 20706.46 385145.9 897845.4 0.5372 -6.37349 274492.6 29037 271837.5 120.9307
United States
0.9832 191200.3323 26807.41 955726 1316247 0.2507 2.644401 1327129 133488 1886464 119.9903
Australia 1.0318 231933.6712 23675.62 111138.7 109602.3 0.9108 -7.24953 36567.87 8951.3 46808.79 88.04288 2000
Austria 0.5852 724915.9995 26516.96 31164.88 28510.59 0.9108 -1.06163 40231.61 3776.5 46808.79 91.32092
Belgium 0.9319 160081.272 24592.04 21000 22000 1.6635 -0.83686 49454.54 4092.17 50631.06 92.52587
Canada 1.046 121796.4792 25321.77 212715.6 250692.6 0.8540 -2.83262 134726.7 14764.2 146656.5 93.29116
Denmark 0.9981 1330608.906 32898.9 45916.45 45825.32 0.8707 -0.41543 40219.37 2722.1 33908.09 91.19998
Finland 0.9697 1900219.658 32780.35 24272.57 52225.24 0.7746 0.047747 24781.63 2356 24548.53 71.86059
France 0.9177 127087.941 24881.28 259775.4 508861.5 0.5623 -0.8327 304712.5 23689.3 272319.8 87.73777
Germany 0.9342 8697.306704 25721.52 271610.7 617760.6 0.6640 -1.536 361074 36816 413837.9 90.01138
Greece 0.9585 96595.65092 10851.63 14112.8 7020.42 0.6322 -1.5436 22634.13 64460 29633.99 107.0286
Iceland 1.0372 1097345.758 29177.05 497.4734 842.8363 0.7443 -13.068 2037.157 156.4 2020.811 105.792
Ireland 0.9716 4667449.302 24795.22 127088.7 40819.08 1.8273 2.398205 13314.44 64620 23123.16 102.1969
Italy 0.9309 533385.2068 23231.58 121169.8 182374.9 0.5318 0.022414 202439.5 21225 227094.9 82.70012
Japan 1.0245 636731.3487 26971.01 50322.02 300113.8 0.2052 -16.9575 788208.7 64460 1187402 136.5796
Korea, Republic of
0.9779 2856.44203 10251.21 38109.8 19970 0.7427 -9.99469 63752.09 21156 163015.1 107.5012
Mexico 1.0709 245571.6044 3713.656 97170.2 12077.5 0.5825 11.16789 67673.88 38044.5 169123.3 157.131
Netherlands
1.0716 168287.6216 25304.26 243732.6 332154.2 1.5002 1.988112 663.4892 7798 779.1813 95.62053
New Zealand
1.0514 112649.8122 15088.68 24893.8 7174.851 0.6047 -3.70084 65759.54 1800 56760.37 90.21853
Norway 1.0877 580673.0386 37741.77 30265.02 37466 0.7596 -0.41314 34278.17 2269 30999.99 99.4416
Portugal 1.0016 245571.6044 9785.047 32043.19 22264.94 0.7041 0.773936 21764.95 5032.9 31196.59 112.5788
Spain 0.9593 252396.3338 17049.58 156348.2 143580.3 0.6120 1.018418 99834.09 15505.9 152586.9 84.58578
Sweden 0.9995 266559.6451 33700.75 93995.08 123275.5 0.8689 -7.61015 63862.08 4159 44922.95 82.24262
Switzerland 1.0529 1477511.641 37045.81 86804.22 252236.7 0.8714 0.820832 27992.71 4080 58622.85 94.40279
Turkey 1.039 9834008 3222.325 19204 4581 0.4319 -19.5632 31257.83 21851 55355.9 93.04685
United Kingdom
1.0626 380520.2379 21418.84 438631 869700.4 0.5710 -3.16054 275326.8 29509 260913.8 114.5572
United States
1.1203 190154.0031 27483.83 1256867 1460352 0.2713 2.955402 1411822 135208 2012959 122.6347
Australia 1.0039 231660.5668 24268.64 111739.2 114888.2 0.9471 6.62346 35899.72 9060.839 45097.67 80.79335 2001
Austria 0.8799 715442.9374 26624.35 34999.31 42484.66 0.9471 6.026019 41054.81 3799.6 45097.67 90.25929
Belgium 1.0085 160475.7043 24704.05 22000 200970 1.6608 6.526908 50449.66 4051.198 47468.93 91.68901
59
Canada 1.081 125089.7084 25518.69 213756.8 275698.9 0.8134 -0.21026 136693.8 14946.2 137231 90.45854
Denmark 1.0442 1342426.75 33014.83 43458.97 57412.93 0.8783 7.127228 41243.61 2725.1 32679.08 90.78455
Finland 1.0504 1890953.996 33564.43 24070.26 63933.2 0.7332 4.681382 25534.45 2388 24669.13 71.90834
France 1.0834 131030.5948 25194.34 295323 586367.4 0.5509 6.670561 305943 24145.5 269484.2 86.90508
Germany 0.9749 7922.978114 26017.87 272153 695765.5 0.6761 5.89812 358144.4 36536 368542.6 88.47538
Greece 1.0586 104687.2064 11306.37 13941.25 9000.988 0.6122 9.555606 22755.5 64120 30405.99 105.485
Iceland 1.117 1117350.18 30064.25 686.2749 1257.334 0.7866 11.36057 1866.346 159 1685.478 92.72396
Ireland 1.118 4095485.152 25865.14 134052.5 58882.38 1.8432 10.33593 15268.05 64460 23742.25 104.5951
Italy 1.0393 504584.0691 23570.14 113434.5 194496 0.5281 7.216452 211950.7 21634 229951.4 82.72253
Japan 0.9538 681762.3728 26977.84 50318.66 304236.9 0.2049 -5.47356 716886 64120 1013808 119.6221
Korea, Republic of
1.1272 2898.759492 10581.34 53210 20730 0.6922 5.949138 64299.26 21572 147146.4 97.50649
Mexico 1.099 225205.287 3664.217 140358.6 12868.7 0.5225 5.898252 76404.85 38065.8 158590.8 168.2989
Netherlands
1.1059 170923.7223 25653.14 282881.7 396530.1 1.5431 8.975857 490.9162 7953 1047.576 97.60864
New Zealand
1.1028 115711.1793 15478.36 20925.4 9425.379 0.5469 8.711234 71171.12 1845.8 50879.68 86.51769
Norway 1.1162 609102.3794 38265.16 32669 47076 0.7459 10.52343 32471.22 2278 31011.98 99.02845
Portugal 1.0985 225205.287 9924.46 36023.23 21325.2 0.6781 10.56933 22761.14 5121.7 31347.73 113.3527
Spain 1.0664 257479.2803 17478.91 177253.6 163588.9 0.5957 8.306848 103972.2 16146.3 160522.1 85.6042
Sweden 1.0252 196007.1955 33957.43 91941.99 146507.1 0.8631 5.816883 59537.7 4239 39959.1 74.63246
Switzerland 1.1191 1470986.317 37235.63 88765.69 292203.8 0.8693 8.367171 29758.39 4146 59386.53 95.22362
Turkey 1.2374 10147524 2937.284 19677 5847 0.5076 12.63967 24297.69 21524 29549.66 73.48364
United Kingdom
1.1406 424693.538 21841.17 506685.6 994136.3 0.5654 8.192816 280116 29824 256770.6 111.3966
United States
1.0717 205964.5727 27394.69 1343987 1616548 0.2491 2.21972 1497456 135073 1910499 125.5901
Australia 0.9512 251895.5157 24720.39 141136.1 161949.4 0.9332 20.55098 38362.09 9245.777 45431.39 87.41681 2002
Austria 2.4071 734656.5547 26703.27 44895.47 55961.32 0.9332 20.5524 41640.17 3835.7 45431.39 96.28531
Belgium 0.9814 173880.8994 24978.86 229513 306288 1.6038 21.49352 56753 4069.833 48422.12 98.21592
Canada 0.931 135342.1245 25995.15 225892 318954.7 0.7871 14.15935 143009.9 15310.4 141752.6 90.24828
Denmark 0.9735 1460303.339 33062.33 53116.36 68608.6 0.8862 21.35795 45626.98 2715.3 35484.76 97.91178
Finland 0.9753 2017012.506 34031.27 33987.07 76049.58 0.7138 14.88842 28570.85 2393 24817.62 76.58972
France 1.0101 147395.1855 25287.07 385178.8 724219 0.5252 20.75105 341533.7 24316.4 276966 93.57564
Germany 0.9045 8907.213121 25990.62 297785.2 830718.6 0.6689 20.139 387557.6 36172 348406.6 94.3735
Greece 1.0008 122525.8066 11720.33 15560.6 12336.98 0.5569 27.70038 26969.32 63300 32880.66 115.0406
Iceland 1.0263 1218980.724 29804.61 797.8655 1733.427 0.7331 21.05555 2259.265 156.7 1620.852 104.0845
Ireland 1.0957 3918332.894 27056.69 182897.4 73322.17 1.7082 26.33794 18361.65 64120 27069.65 114.9311
Italy 0.9418 575929.7572 23535.99 130819 238887.5 0.5049 21.21809 234137.3 21922 257565.8 89.93898
Japan 0.9542 711103.0668 27008.14 78140.12 335499.5 0.2142 7.335905 704258.7 63300 903922.1 114.1485
Korea, Republic of
0.986 2934.263036 11260.59 62660 24990 0.6478 8.122686 72680.96 22169 168153 103.4556
Mexico 0.9447 248611.5167 3649.005 164080.4 16587 0.5056 -4.99296 82197.38 38939.7 163640.4 174.1971
Netherlands
1.0959 191927.5361 25540.38 349968.9 523206.4 1.4668 24.01872 512.7274 8018 868.5735 106.5845
New Zealand
1.095 127460.7196 16059.46 30194.7 11883.31 0.5435 28.00424 76672.76 1906.2 48327.15 95.22893
Norway 1.0174 686278.1575 38605.57 42781.06 57083 0.6888 17.65108 36304.61 2286 34312.07 109.5519
Portugal 1.0945 248611.5167 9935.751 44636.74 34443.26 0.6425 29.37719 25545.68 5145.6 32149.31 123.922
Spain 1.0097 281308.0721 17712.68 257105.7 221020.6 0.5678 23.37463 118015 16630.3 182756.3 93.91105
Sweden 1.0723 232530.4849 34629.94 119367.5 185732.6 0.8235 18.31205 67577.45 4244 41883.62 80.44935
Switzerland 1.0815 1611999.98 37123.38 124805.3 341372.8 0.8217 17.49775 32972.41 4171 59837.66 103.5908
60
Turkey 0.6935 10492427 3126.334 18795 6138 0.4880 19.83292 29600.93 21354 40958.04 86.12331
United Kingdom
1.056 545653.5897 22194.11 523319.5 1187046 0.5478 14.67799 318599.5 29974 275281.1 119.5894
United States
0.953 252024.1413 27550.56 1327170 1769613 0.2425 2.729863 1617133 136485 1894519 127.8098
Australia 0.9522 310062.5352 25391.47 199340.7 203775.8 0.9370 19.03768 47522.89 9464.923 57788.06 107.9678 2003
Austria 1.0147 865906.682 26856.67 57636.38 69806.06 0.9370 14.34247 36567.87 3798.4 57788.06 116.8377
Belgium 0.9568 212622.8684 25115.47 351499 370687 1.5753 15.15507 71342.62 4070.422 59215.55 119.7094
Canada 0.9014 164547.8306 26206.7 289140.4 372670.3 0.7248 11.66083 170169.3 15672.3 173096.4 104.4076
Denmark 0.9704 1803530.864 33090.96 65840.27 95113.5 0.8444 14.52505 56353.13 2692.5 41739.17 119.2697
Finland 0.9685 2442118.015 34543.18 50256.53 85022.5 0.7014 9.805737 35831.58 2385 30450.29 91.47814
France 0.9363 193457.551 25386.05 527583.2 845368.7 0.5012 13.451 427919.7 24325.3 339531.7 114.3267
Germany 1.1238 10967.71164 25906.82 394512.5 925095.3 0.6732 12.88053 470467.2 356569 424836.9 114.5125
Greece 0.9549 157377.6782 12286.08 22453.6 13791.27 0.5334 19.66977 33184.16 63160 47017.49 142.7409
Iceland 0.9326 1507108.925 30360.64 1193.267 4039.728 0.7166 15.07017 2856.641 156.9 2169.407 125.1401
Ireland 1.0244 4229098.16 27703.37 222837.3 106692 1.5161 17.34138 23806.87 63300 36588.21 141.269
Italy 1.0085 643760.1377 23405.92 180890.6 280481.1 0.4856 14.67335 296762.8 22133 311483.5 111.1571
Japan 0.9436 700323.1604 27354.34 89729.23 370543.6 0.2239 7.291141 763391.3 63160 966287 121.4844
Korea, Republic of
0.9348 3019.639444 11556.33 66070 32170 0.6847 7.635305 83967.95 22139 192409.2 111.5783
Mexico 0.905 311038.2627 3659.473 180555.3 21672.6 0.5217 4.498726 82847.57 39221.5 160313.9 169.2042
Netherlands
0.9541 225109.7777 25499.14 426610.9 587252.1 1.4413 14.13443 544.3582 7991 880.6484 130.6032
New Zealand
0.9455 156407.1739 16409.69 44327.44 13957.1 0.6185 21.07174 58215.1 1955.6 30583.06 123.2332
Norway 0.9616 883632.9675 38748.27 48967.07 80932 0.6762 13.47674 40903.97 2269 38996.12 127.203
Portugal 1.0485 311038.2627 9790.546 60584.31 43940.69 0.6254 19.48595 31747.08 5127.7 35794.78 153.2992
Spain 0.9924 328122.448 17994.06 339651.9 282294.4 0.5502 16.94047 153401.5 17295.9 241976 117.2857
Sweden 1.0677 303008.2892 35111.92 158884.2 214586.8 0.8075 10.15961 85540.81 4234 51540.85 98.7614
Switzerland 0.9106 1860893.346 36755.22 162232.8 400589.6 0.8152 10.79662 39167.74 4156 68083.29 121.0885
Turkey 0.8402 10987209 3263.057 33537 7060 0.4703 16.59311 36967.27 21147 53319.66 105.9562
United Kingdom
0.928 660151.0201 22703.68 606157.6 1247190 0.5329 20.15779 380129.7 30264 311272.8 134.2674
United States
0.836 289039.1313 27970.67 1395159 2160844 0.2453 3.753454 1741001 137736 1984103 130.5397
Australia 0.974 359624.5181 25792.12 263389.4 175540.6 1.0001 11.05457 53835.96 9623.283 65673.58 127.0055 2004
Austria 1.0669 992229.8096 27304.9 70713.75 71806.89 1.0001 2.578073 35899.72 3744.0 3 65673.58 131.1802
Belgium 0.9211 244728.1142 25738.36 466548 478170.2 1.6331 3.615831 81926.83 4139.2 72759.56 134.8645
Canada 0.8887 188921.7932 26730.24 315262.5 388316.9 0.7253 12.73339 190156.3 15947 205622.6 116.0685
Denmark 0.9994 2065523.497 33700.9 82504.74 110165 0.8584 4.126994 64934.79 2720.1 49825.6 133.7948
Finland 0.9606 2745214.903 35726.83 57379.14 81860.51 0.7305 0.397019 41501.68 2387 35503.16 101.2839
France 0.9133 230766.1743 25835.26 641760.9 868469.9 0.5132 2.420476 489911 24346.1 404038.6 127.7777
Germany 1.0133 13233.60798 26160.8 512066.2 927459 0.7178 1.117444 516362.1 36566 470618.9 127.393
Greece 1.009 184978.2397 12824.37 28481.53 13601.94 0.5399 5.564944 39346.38 63290 52273.69 162.4107
Iceland 0.9538 1727825.272 32309.01 2087.893 10091.41 0.7386 20.58511 3318.941 156.1 3099.499 140.2102
Ireland 0.9719 4605935.545 28331.25 207646.8 104152.2 1.5267 4.334943 28513.9 63160 45374.33 158.6104
Italy 0.9433 721975.7811 23539.94 220720.3 293475.2 0.4999 3.027691 342997.3 22404 359363.8 125.8304
Japan 0.9572 758223.93 28078.2 96984.25 386581.3 0.2467 -3.91758 826932.9 63290 1061126 128.7756
Korea, Republic of
0.9774 3103.573227 12051.1 87770 38680 0.7761 13.84934 96154.59 22557 216106.7 119.2136
Mexico 0.9277 357192.0645 3772.067 204214.2 29641 0.5509 16.08215 81596.56 40561 187349.5 173.7029
Netherlands
0.9222 258579.4536 25944.98 477218.9 615726.8 1.5367 3.236608 581.9583 7928 836.8234 144.7376
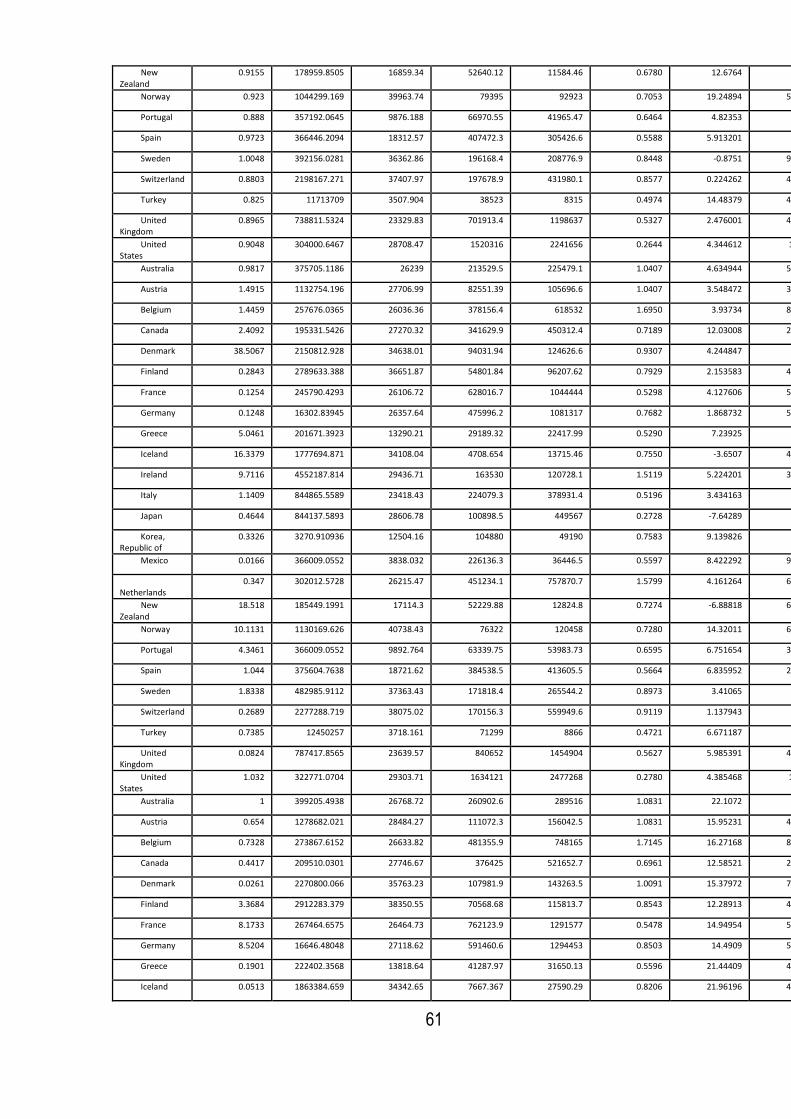
61
New Zealand
0.9155 178959.8505 16859.34 52640.12 11584.46 0.6780 12.6764 60559.2 2024.1 35437.67 144.3049
Norway 0.923 1044299.169 39963.74 79395 92923 0.7053 19.24894 51612.31 2276 46617.23 140.6797
Portugal 0.888 357192.0645 9876.188 66970.55 41965.47 0.6464 4.82353 36935.8 5127.5 41371.06 172.7852
Spain 0.9723 366446.2094 18312.57 407472.3 305426.6 0.5588 5.913201 185948 17970.8 295277.3 134.2262
Sweden 1.0048 392156.0281 36362.86 196168.4 208776.9 0.8448 -0.8751 95597.75 4213 58563.02 108.921
Switzerland 0.8803 2198167.271 37407.97 197678.9 431980.1 0.8577 0.224262 43048.79 4169 77061.41 131.8852
Turkey 0.825 11713709 3507.904 38523 8315 0.4974 14.48379 46861.03 21791 76039.34 122.5493
United Kingdom
0.8965 738811.5324 23329.83 701913.4 1198637 0.5327 2.476001 460963.4 30543 375938.3 154.4252
United States
0.9048 304000.6467 28708.47 1520316 2241656 0.2644 4.344612 1854665 139252 2218049 134.2931
Australia 0.9817 375705.1186 26239 213529.5 225479.1 1.0407 4.634944 56130.55 9968.577 68911.61 138.06 2005
Austria 1.4915 1132754.196 27706.99 82551.39 105696.6 1.0407 3.548472 38362.09 3824.4 68911.61 133.7583
Belgium 1.4459 257676.0365 26036.36 378156.4 618532 1.6950 3.93734 85875.24 4235.3 78187.34 138.4803
Canada 2.4092 195331.5426 27270.32 341629.9 450312.4 0.7189 12.03008 214725.9 16169.7 248916.6 128.8019
Denmark 38.5067 2150812.928 34638.01 94031.94 124626.6 0.9307 4.244847 67119.4 2732.8 53662.14 137.9218
Finland 0.2843 2789633.388 36651.87 54801.84 96207.62 0.7929 2.153583 43640.25 2421 40250.21 101.6809
France 0.1254 245790.4293 26106.72 628016.7 1044444 0.5298 4.127606 509157.5 24497.5 437170.5 130.1982
Germany 0.1248 16302.83945 26357.64 475996.2 1081317 0.7682 1.868732 522260.4 37322 471372.4 128.5105
Greece 5.0461 201671.3923 13290.21 29189.32 22417.99 0.5290 7.23925 41068 63560 51481.62 167.9757
Iceland 16.3379 1777694.871 34108.04 4708.654 13715.46 0.7550 -3.6507 4010.961 161.3 4618.789 160.7954
Ireland 9.7116 4552187.814 29436.71 163530 120728.1 1.5119 5.224201 30970.25 63290 54523.7 162.9453
Italy 1.1409 844865.5589 23418.43 224079.3 378931.4 0.5196 3.434163 361660 22563 367800.8 128.8581
Japan 0.4644 844137.5893 28606.78 100898.5 449567 0.2728 -7.64289 822022 63560 1072790 124.858
Korea, Republic of
0.3326 3270.910936 12504.16 104880 49190 0.7583 9.139826 117184 22856 250817 133.063
Mexico 0.0166 366009.0552 3838.032 226136.3 36446.5 0.5597 8.422292 91454.02 40791.8 201404.1 189.7851
Netherlands
0.347 302012.5728 26215.47 451234.1 757870.7 1.5799 4.161264 625.1372 7958 930.8703 147.9743
New Zealand
18.518 185449.1991 17114.3 52229.88 12824.8 0.7274 -6.88818 67522.62 2084.6 42901.79 156.9813
Norway 10.1131 1130169.626 40738.43 76322 120458 0.7280 14.32011 63954.21 2289 56742.57 159.9287
Portugal 4.3461 366009.0552 9892.764 63339.75 53983.73 0.6595 6.751654 39762.97 5122.6 41846.13 177.6087
Spain 1.044 375604.7638 18721.62 384538.5 413605.5 0.5664 6.835952 203626.3 18973.2 3 333189.1 140.1394
Sweden 1.8338 482985.9112 37363.43 171818.4 265544.2 0.8973 3.41065 96706.6 4263 5 63117.15 108.0459
Switzerland 0.2689 2277288.719 38075.02 170156.3 559949.6 0.9119 1.137943 43954.7 4201 81200.53 132.1094
Turkey 0.7385 12450257 3718.161 71299 8866 0.4721 6.671187 56936.3 22046 96546.9 137.0331
United Kingdom
0.0824 787417.8565 23639.57 840652 1454904 0.5627 5.985391 488434.2 30776 392572.1 156.9012
United States
1.032 322771.0704 29303.71 1634121 2477268 0.2780 4.385468 1970730 141730 2435411 138.6378
Australia 1 399205.4938 26768.72 260902.6 289516 1.0831 22.1072 59387.5 10218.35 72708.11 142.695 2006
Austria 0.654 1278682.021 28484.27 111072.3 156042.5 1.0831 15.95231 47522.89 3928.3 72708.11 137.3067
Belgium 0.7328 273867.6152 26633.82 481355.9 748165 1.7145 16.27168 89428.36 4264 88216.53 142.4177
Canada 0.4417 209510.0301 27746.67 376425 521652.7 0.6961 12.58521 245884.2 16484.3 292704.3 140.8319
Denmark 0.0261 2270800.066 35763.23 107981.9 143263.5 1.0091 15.37972 71050.91 2786.6 61180.69 142.1666
Finland 3.3684 2912283.379 38350.55 70568.68 115813.7 0.8543 12.28913 45876.46 2466 43420.18 103.8345
France 8.1733 267464.6575 26464.73 762123.9 1291577 0.5478 14.94954 530779.4 24745.7 479660.8 134.3258
Germany 8.5204 16646.48048 27118.62 591460.6 1294453 0.8503 14.4909 533694.9 38163 513598.1 130.3792
Greece 0.1901 222402.3568 13818.64 41287.97 31650.13 0.5596 21.44409 42844.62 63820 57749.14 175.2149
Iceland 0.0513 1863384.659 34342.65 7667.367 27590.29 0.8206 21.96196 4066.272 169.6 5859.191 157.1447
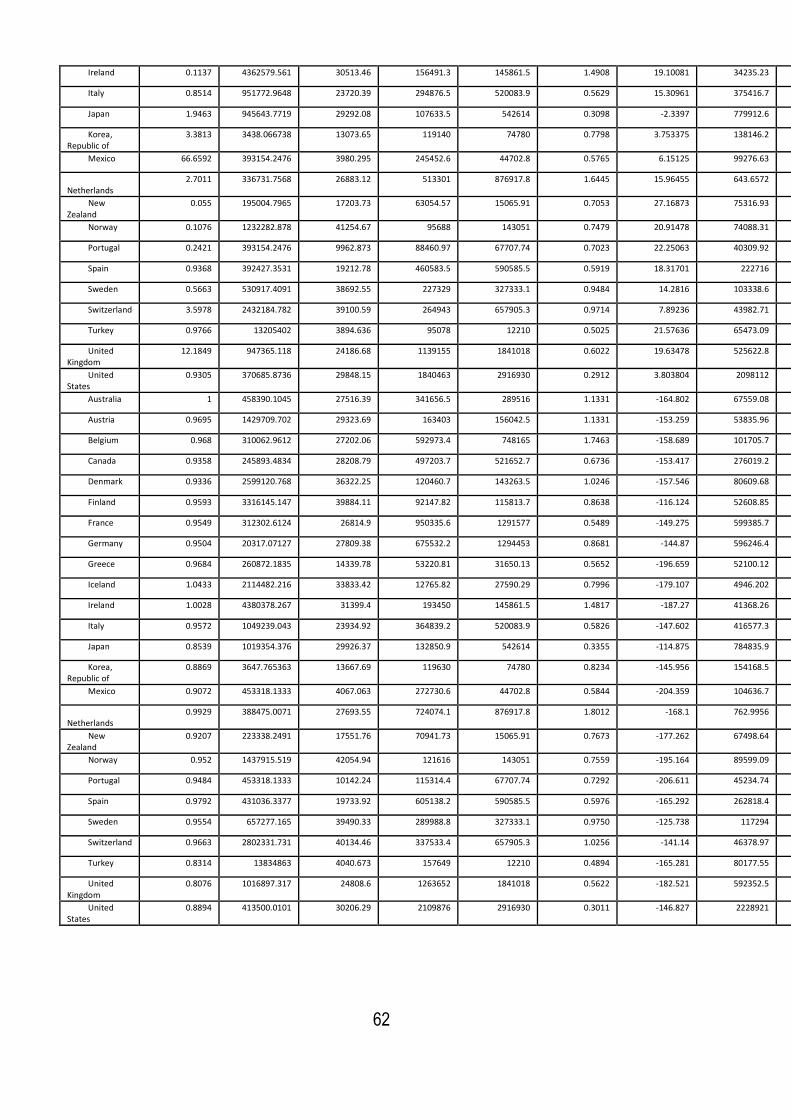
62
Ireland 0.1137 4362579.561 30513.46 156491.3 145861.5 1.4908 19.10081 34235.23 63560 61437.83 168.1695
Italy 0.8514 951772.9648 23720.39 294876.5 520083.9 0.5629 15.30961 375416.7 22988 402762 132.2923
Japan 1.9463 945643.7719 29292.08 107633.5 542614 0.3098 -2.3397 779912.6 63820 1038003 117.2151
Korea, Republic of
3.3813 3438.066738 13073.65 119140 74780 0.7798 3.753375 138146.2 23151 281933.9 142.2028
Mexico 66.6592 393154.2476 3980.295 245452.6 44702.8 0.5765 6.15125 99276.63 42197.8 243011.4 198.2074
Netherlands
2.7011 336731.7568 26883.12 513301 876917.8 1.6445 15.96455 643.6572 8108 1023.801 152.1355
New Zealand
0.055 195004.7965 17203.73 63054.57 15065.91 0.7053 27.16873 75316.93 2134.7 45093.35 150.0931
Norway 0.1076 1232282.878 41254.67 95688 143051 0.7479 20.91478 74088.31 2362 66140.02 174.2488
Portugal 0.2421 393154.2476 9962.873 88460.97 67707.74 0.7023 22.25063 40309.92 5159.5 43255.98 184.3604
Spain 0.9368 392427.3531 19212.78 460583.5 590585.5 0.5919 18.31701 222716 19747.6 380744.5 146.9753
Sweden 0.5663 530917.4091 38692.55 227329 327333.1 0.9484 14.2816 103338.6 4341 71659.82 111.4566
Switzerland 3.5978 2432184.782 39100.59 264943 657905.3 0.9714 7.89236 43982.71 4304 87280.07 133.2474
Turkey 0.9766 13205402 3894.636 95078 12210 0.5025 21.57636 65473.09 22330 117093.1 143.7043
United Kingdom
12.1849 947365.118 24186.68 1139155 1841018 0.6022 19.63478 525622.8 30500 427843.1 162.8866
United States
0.9305 370685.8736 29848.15 1840463 2916930 0.2912 3.803804 2098112 144427 2591081 143.0232
Australia 1 458390.1045 27516.39 341656.5 289516 1.1331 -164.802 67559.08 10512.35 84523.72 164.8022 2007
Austria 0.9695 1429709.702 29323.69 163403 156042.5 1.1331 -153.259 53835.96 4027.9 84523.72 153.259
Belgium 0.968 310062.9612 27202.06 592973.4 748165 1.7463 -158.689 101705.7 4380.275 103464.4 158.6894
Canada 0.9358 245893.4834 28208.79 497203.7 521652.7 0.6736 -153.417 276019.2 16866.4 332578.2 153.4171
Denmark 0.9336 2599120.768 36322.25 120460.7 143263.5 1.0246 -157.546 80609.68 2778.6 70936.48 157.5463
Finland 0.9593 3316145.147 39884.11 92147.82 115813.7 0.8638 -116.124 52608.85 2512 54789.14 116.1236
France 0.9549 312302.6124 26814.9 950335.6 1291577 0.5489 -149.275 599385.7 25093.1 575880.9 149.2753
Germany 0.9504 20317.07127 27809.38 675532.2 1294453 0.8681 -144.87 596246.4 38734 605731.3 144.8701
Greece 0.9684 260872.1835 14339.78 53220.81 31650.13 0.5652 -196.659 52100.12 64120 70593.15 196.659
Iceland 1.0433 2114482.216 33833.42 12765.82 27590.29 0.7996 -179.107 4946.202 177.2 5793.88 179.1066
Ireland 1.0028 4380378.267 31399.4 193450 145861.5 1.4817 -187.27 41368.26 63820 68494.02 187.2703
Italy 0.9572 1049239.043 23934.92 364839.2 520083.9 0.5826 -147.602 416577.3 23222 460618.3 147.6019
Japan 0.8539 1019354.376 29926.37 132850.9 542614 0.3355 -114.875 784835.9 64120 1055680 114.8754
Korea, Republic of
0.8869 3647.765363 13667.69 119630 74780 0.8234 -145.956 154168.5 23433 308760.1 145.9562
Mexico 0.9072 453318.1333 4067.063 272730.6 44702.8 0.5844 -204.359 104636.7 42906.7 262118.4 204.3586
Netherlands
0.9929 388475.0071 27693.55 724074.1 876917.8 1.8012 -168.1 762.9956 8310 857.5265 168.1001
New Zealand
0.9207 223338.2491 17551.76 70941.73 15065.91 0.7673 -177.262 67498.64 2174.5 40279.93 177.2619
Norway 0.952 1437915.519 42054.94 121616 143051 0.7559 -195.164 89599.09 2443 82667.44 195.1635
Portugal 0.9484 453318.1333 10142.24 115314.4 67707.74 0.7292 -206.611 45234.74 5169.7 49542.63 206.611
Spain 0.9792 431036.3377 19733.92 605138.2 590585.5 0.5976 -165.292 262818.4 20356 448052.6 165.2923
Sweden 0.9554 657277.165 39490.33 289988.8 327333.1 0.9750 -125.738 117294 4541 89308.56 125.7382
Switzerland 0.9663 2802331.731 40134.46 337533.4 657905.3 1.0256 -141.14 46378.97 4413 95826.29 141.1397
Turkey 0.8314 13834863 4040.673 157649 12210 0.4894 -165.281 80177.55 20738 145713.8 165.2807
United Kingdom
0.8076 1016897.317 24808.6 1263652 1841018 0.5622 -182.521 592352.5 30200 511385.5 182.5214
United States
0.8894 413500.0101 30206.29 2109876 2916930 0.3011 -146.827 2228921 146047 2531980 146.827