Embed Size (px)
Citation preview
1
TOTAL MAXIMUM DAILY LOAD ASSESSMENT
UPPER SOUTH PLATTE RIVER SEGMENT 4
HALL VALLEY/HANDCART GULCH
COPPER
PARK COUNTY, COLORADO
April 2008
TMDL SUMMARY
Waterbody Name/Segment Number
Mainstem of the North Fork of the South
Platte River, including all tributaries, lakes,
reservoirs and wetlands from the source to the
confluence with the South Platte River,
except for specific listings in Segments 1b,
5a, 5b, and 5c. / COSPUS04
Pollutant/Condition Addressed Copper (dissolved)
Affected Portion of Segments Hall Valley area to Geneva Creek
Use Classification/Waterbody Designation
Aquatic Life Cold 1
Recreation 1a
Water Supply
Agriculture
Waterbody Antidegradation Designation Reviewable
Water Quality Target
Attainment of water quality standards for
Copper
Acute= e 0.9422[ln(hardness)]-1.7408)
Chronic= e 0.8545[ln(hardness)]-1.7428)
TMDL Goal Attainment of water quality standards
EXECUTIVE SUMMARY
Segment COSPUS04 has been identified as water-quality limited for dissolved copper on the 1998
303(d) List, as approved by the Colorado Water Quality Control Commission. This TMDL derives
waste load allocations and load allocations for dissolved copper to demonstrate the load reduction
necessary to attain the currently adopted standards.
FINAL
2
I. INTRODUCTION
Section 303(d) of the federal Clean Water Act requires states to identify water bodies or stream
segments which are water quality limited. Water quality limited segments are those water bodies or
stream segments which, for one or more assigned use classifications or standards, the classification or
standard is not fully achieved. Once listed, the State is required to quantify the amount of a specific
pollutant that a listed water body can assimilate without violating applicable water quality standards
and to apportion that allowable quantity among the different pollutant sources. This maximum
allowable pollutant quantity is referred to as the Total Maximum Daily Load (TMDL). The TMDL is
comprised of the Load Allocation (LA) which is that portion of the pollutant load attributed to natural
background or the nonpoint sources, the Waste Load Allocation (WLA) which is that portion of the
pollutant load associated with point source discharges, and a Margin of Safety (MOS). The TMDL
may also include an allocation reserved to accommodate future growth. The TMDL may be expressed
as the sum of the LA, WLA and MOS (Equation 1)
Equation 1. TMDL=WLA+LA+MOS
Alternatively, a segment or pollutant may be removed from the list if the applicable standard is
attained, if implementation of clean up activities via an alternate means will result in attainment of
standards, if the original listing decision is shown to be in error, or if the standards have been changed
as the result of a Use Attainability Analysis (UAA).
The goal of this TMDL document is to identify the reductions in metals loadings for dissolved copper
necessary to attain the applicable water quality standards.
II. BACKGROUND
The portion of the mainstem of the North Fork of the South Platte River and tributaries from the Hall
Valley area to the confluence with Geneva Creek has been was identified by the Division as impaired
on all of the 303(d) Lists since the first list was prepared in 1992. The 1992, 1994 and 1996 303(d)
Lists identified segment 4 as partially supporting the Aquatic Life Use based on a nonpoint source
assessment. Copper (Cu) and Manganese (Mn) were identified as the pollutants in non-attainment of
the assigned Aquatic Life Use based on numeric standards. The 1998 303(d) List identified aluminum,
cadmium, copper, iron and lead as causing the water quality impairment of the waterbody based on
1991 sampling. The 2002 303(d) List delisted the segment for cadmium, iron and lead since it was
meeting those standards and removed the aluminum listing because there was not an assigned
aluminum standard for the segment. The 2004 and 2006 303(d) Lists identify segment 4 as impaired or
in non-attainment of the aquatic life use because of copper concentrations in exceedance of the
assigned standards.
FINAL
3
III. SEGMENT DESCRIPTION
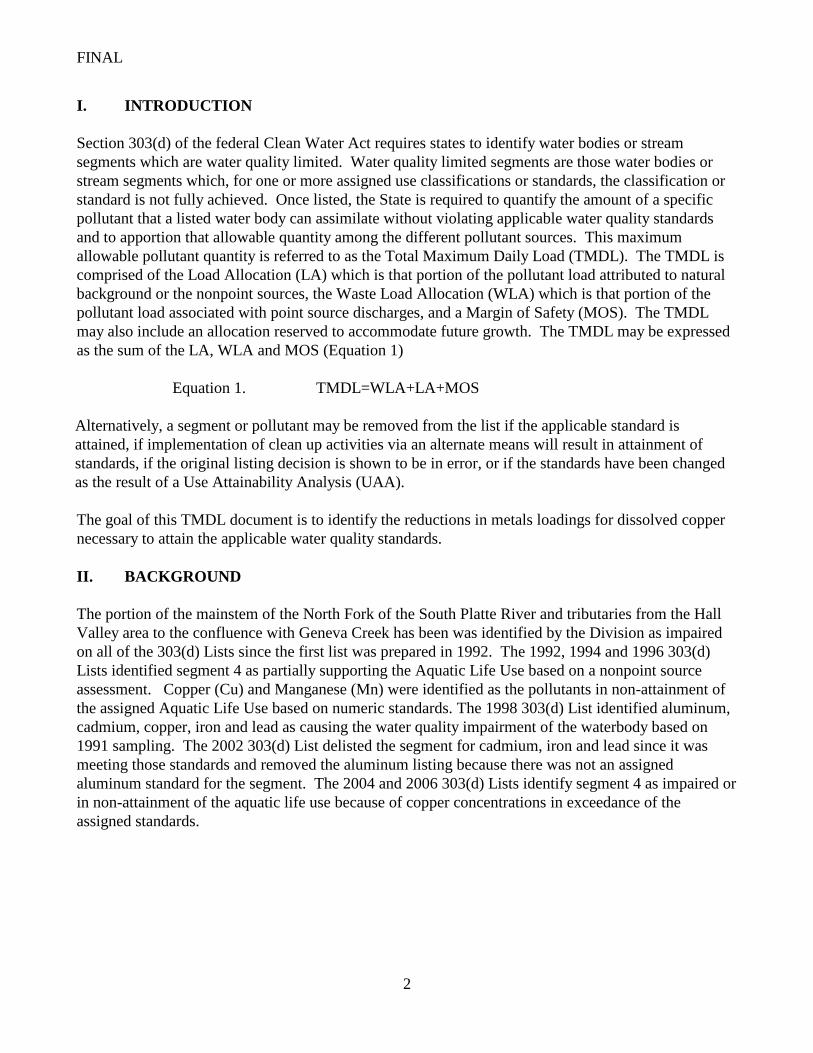
The headwaters of the North Fork of the South Platte River include the Hall Valley and Handcart
Gulch watersheds that lie on the northwest edge of Park County in central Colorado. The Hall
Valley/Handcart Gulch watershed covers approximately 11.2 square miles (CDPHE/HMWMD 2001)
and is bounded by the Continental Divide on the north and west and the Hall Valley/Jefferson Creek
watershed divide to the south. The Handcart Gulch watershed divide is to the north and east of the
upper portion of Hall Valley. The two basins are identified in Figure 1. Map of Hall Valley / Handcart
Gulch.
Figure 1. Map of Hall Valley / Handcart Gulch
FINAL
4
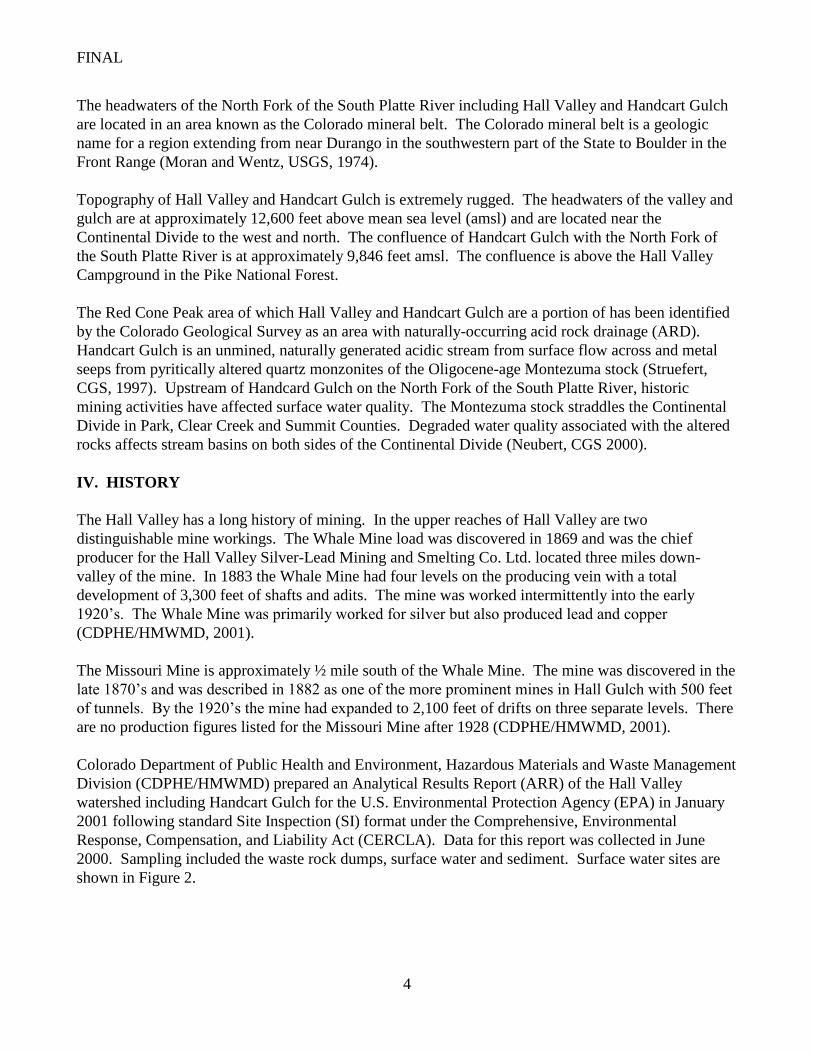
The headwaters of the North Fork of the South Platte River including Hall Valley and Handcart Gulch
are located in an area known as the Colorado mineral belt. The Colorado mineral belt is a geologic
name for a region extending from near Durango in the southwestern part of the State to Boulder in the
Front Range (Moran and Wentz, USGS, 1974).
Topography of Hall Valley and Handcart Gulch is extremely rugged. The headwaters of the valley and
gulch are at approximately 12,600 feet above mean sea level (amsl) and are located near the
Continental Divide to the west and north. The confluence of Handcart Gulch with the North Fork of
the South Platte River is at approximately 9,846 feet amsl. The confluence is above the Hall Valley
Campground in the Pike National Forest.
The Red Cone Peak area of which Hall Valley and Handcart Gulch are a portion of has been identified
by the Colorado Geological Survey as an area with naturally-occurring acid rock drainage (ARD).
Handcart Gulch is an unmined, naturally generated acidic stream from surface flow across and metal
seeps from pyritically altered quartz monzonites of the Oligocene-age Montezuma stock (Struefert,
CGS, 1997). Upstream of Handcard Gulch on the North Fork of the South Platte River, historic
mining activities have affected surface water quality. The Montezuma stock straddles the Continental
Divide in Park, Clear Creek and Summit Counties. Degraded water quality associated with the altered
rocks affects stream basins on both sides of the Continental Divide (Neubert, CGS 2000).
IV. HISTORY
The Hall Valley has a long history of mining. In the upper reaches of Hall Valley are two
distinguishable mine workings. The Whale Mine load was discovered in 1869 and was the chief
producer for the Hall Valley Silver-Lead Mining and Smelting Co. Ltd. located three miles down-
valley of the mine. In 1883 the Whale Mine had four levels on the producing vein with a total
development of 3,300 feet of shafts and adits. The mine was worked intermittently into the early
1920’s. The Whale Mine was primarily worked for silver but also produced lead and copper
(CDPHE/HMWMD, 2001).
The Missouri Mine is approximately ½ mile south of the Whale Mine. The mine was discovered in the
late 1870’s and was described in 1882 as one of the more prominent mines in Hall Gulch with 500 feet
of tunnels. By the 1920’s the mine had expanded to 2,100 feet of drifts on three separate levels. There
are no production figures listed for the Missouri Mine after 1928 (CDPHE/HMWMD, 2001).
Colorado Department of Public Health and Environment, Hazardous Materials and Waste Management
Division (CDPHE/HMWMD) prepared an Analytical Results Report (ARR) of the Hall Valley
watershed including Handcart Gulch for the U.S. Environmental Protection Agency (EPA) in January
2001 following standard Site Inspection (SI) format under the Comprehensive, Environmental
Response, Compensation, and Liability Act (CERCLA). Data for this report was collected in June
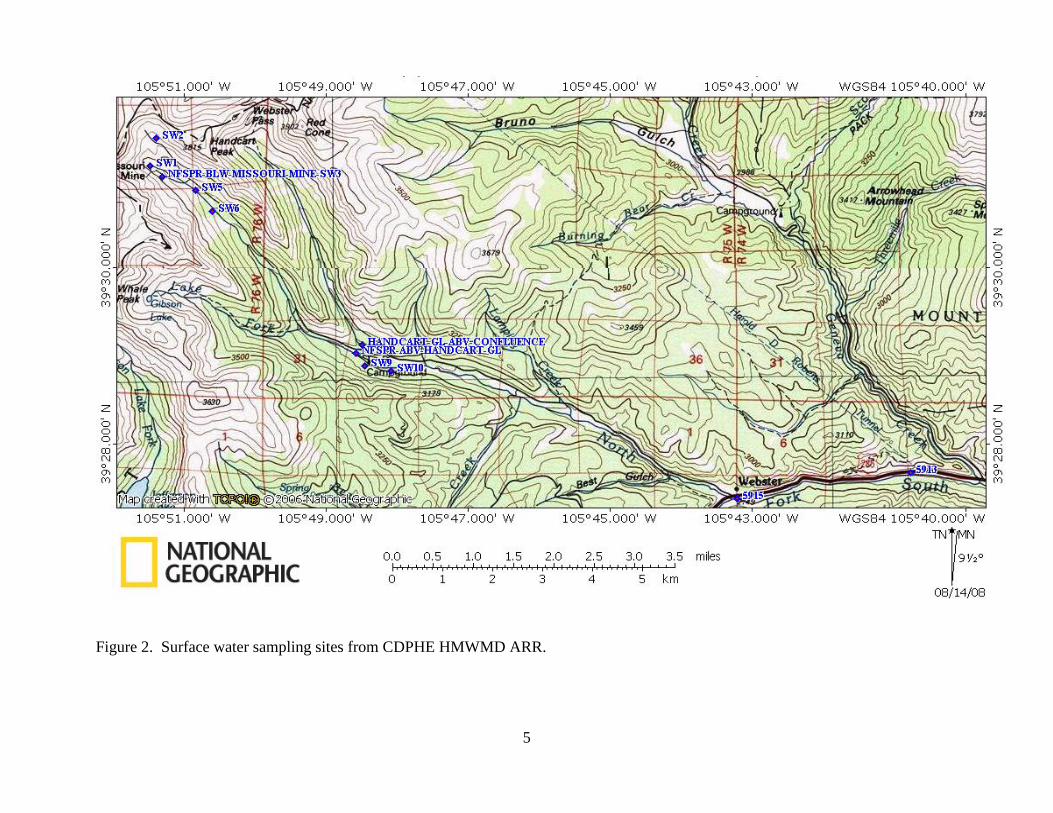
2000. Sampling included the waste rock dumps, surface water and sediment. Surface water sites are
shown in Figure 2.
5
Figure 2. Surface water sampling sites from CDPHE HMWMD ARR.
6
Flow in Handcart Gulch is composed of low pH poor quality groundwater from numerous visible and
subsurface seeps. Much of the rock in the gulch is stained red, yellow and brown as a result of the
naturally-occurring ARD. Downstream of a number of seeps the stream channel is lined with ferricrete
and abundant orange-red precipitate, and lesser amounts of grey-yellow precipitate (Neuburt, CGS,
2000). Handcart Gulch carries a considerable load of dissolved metals to the North Fork. Mass
balance calculations based on sampling results indicate that Handcart Gulch is the predominant source
of metals to the North Fork of the South Platte River (CDPHE/HMWMD, 2001).
The mainstem of the North Fork of the South Platte River (North Fork) begins to show aquatic life
impairment below the Missouri Mine as it starts its flow through the Hall Valley area. Handcart Gulch
confluences with the North Fork about half way down the valley. The Colorado Division of Wildlife
reports fish populations in the North Fork of the South Platte River above the confluence with
Handcart Gulch. Handcart Gulch and the North Fork of the South Platte River do not support a fishery
below the confluence for an undetermined distance downstream. In the Hall Valley Watershed ARR it
was noted that fish populations are present and fishing does occur in the North Fork of the South Platte
River from the confluence of Geneva Creek to the confluence with the South Platte River
(CDPHE/HMWMD, 2001). The confluence of Handcart Gulch with the North Fork of the South Platte
River to the Geneva Creek confluence is approximately 8.5 miles.
V. DISCHARGE PERMITS AND PROPERTY OWNERSHIP
There are currently no Colorado Discharge Permit System (CDPS) or National Permit Discharge
Elimination System (NPDES) permits that discharge to the listed portions of segment COSPUS04.
Land ownership in the area is mixed between Federal (USDA Forest Service) and private interests.
VI. PROBLEM IDENTIFICATION
Copper is the pollutant of concern for this TMDL. The TMDL addresses a portion of Upper South
Platte segment 4 (COSPUS04), which is the mainstem of the North Fork of the South Platte River,
including all tributaries, lakes, reservoirs and wetlands from the source to the confluence with the
South Platte river, except for specific listings in segments 1b, 5a, 5b, and 5c. The portion of concern is
from the Hall Valley area to the confluence with Geneva Creek. The 303(d) lists rate the segment
priority as “medium”. There are no permitted point sources in this watershed. The Division has not
acted on this listing until 2008 because no significant anthropogenic point sources have been identified
in the watershed that could be addressed through an NPDES or CDPS permit.
VII. WATER QUALITY GOALS AND TARGETS
The water quality targets and goals for this TMDL are attainment of the current dissolved copper water
quality standards, and attainment of the assigned aquatic life cold 1 use.
FINAL
7
VIII. WATER QUALITY STANDARDS
Standards Framework
Waterbodies in Colorado are divided into discrete units or “segments”. The Colorado Basic Standards
and Methodologies for Surface Water, Regulation 31, discusses segmentation of waterbodies in terms
of several broad considerations:
31.6(4)(b)…Segments may constitute a specified stretch of a river mainstem, a specific
tributary, a specific lake or reservoir, or a generally defined grouping of waters within the
basin (e.g., a specific mainstem segment and all tributaries flowing into that mainstem segment.
(c) Segments shall generally be delineated according to the points at which the use, physical
characteristics or water quality characteristics of a watercourse are determined to change
significantly enough to require a change in use classifications and/or water quality standards
As noted in paragraph 31.6(4)(c), the use or uses of surface waters are an important consideration with
respect to segmentation. In Colorado there are four categories of beneficial use which are recognized.
These include Aquatic Life Use, Recreational Use, Agricultural Use and Water Supply Use. A
segment may be designated for any or all of these “Use Classifications”:
31.6 Waters shall be classified for the present beneficial uses of the water, or the beneficial
uses that may be reasonably expected in the future for which the water is suitable in its present
condition or the beneficial uses for which it is to become suitable as a goal.
Each assigned use is associated with a series of pollutant specific numeric standards. These pollutants
may vary and are relevant to a given Classified Use. Numeric pollutant criteria are identified in
sections 31.11 and 31.16 of the Basic Standards and Methodologies for Surface Water.
Uses and Standards Addressed in this TMDL
The segment of the North Fork of the South Platte River addressed by this TMDL, COSPUS04, is
classified for Aquatic Life (Cold 1), Water Supply, Agriculture, and Recreation (1a) Uses. The
segment-specific numeric standards can be found in Regulation 38, Classifications and Numeric
Standards for South Platte River Basin, Laramie River Basin, Republican River Basin, Smoky Hill
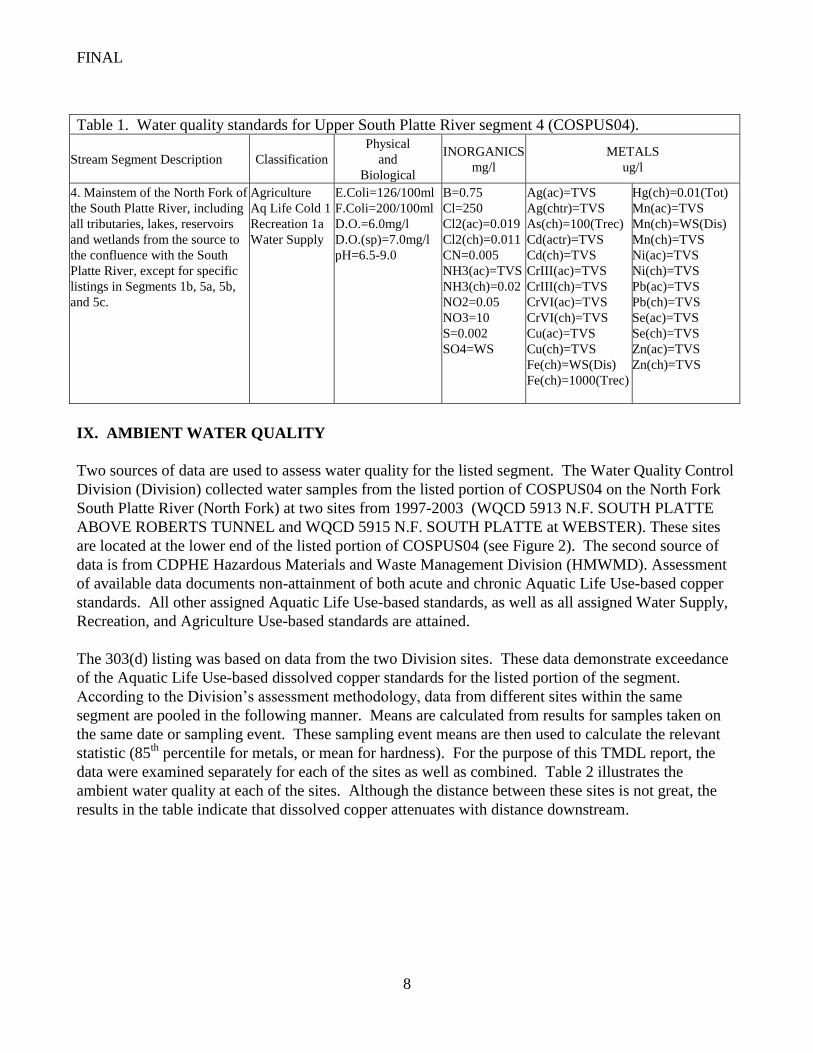
River Basin (WQCC, 2007b). The segment descriptions and associated standards are in Table 1 below.
The Table Value Standards (TVS) associated with the assigned Aquatic Life Use classification, are
hardness based standards. Assessments for TVS metals are based on segment-specific mean hardness
values. Based on data from WQCD monitoring stations, the dissolved chronic copper standard for
COSPUS04 is 3.96 ug/L (TVS based on a mean total hardness value of 38.5 mg/L). Note that the acute
Aquatic Life Use-based standard is based on sample-specific hardness and therefore is calculated for
each discrete sampling event.
FINAL
8
Table 1. Water quality standards for Upper South Platte River segment 4 (COSPUS04).
Stream Segment Description Classification
Physical
and
Biological
INORGANICS
mg/l
METALS
ug/l
4. Mainstem of the North Fork of
the South Platte River, including
all tributaries, lakes, reservoirs
and wetlands from the source to
the confluence with the South
Platte River, except for specific
listings in Segments 1b, 5a, 5b,
and 5c.
Agriculture
Aq Life Cold 1
Recreation 1a
Water Supply
E.Coli=126/100ml
F.Coli=200/100ml
D.O.=6.0mg/l
D.O.(sp)=7.0mg/l
pH=6.5-9.0
B=0.75
Cl=250
Cl2(ac)=0.019
Cl2(ch)=0.011
CN=0.005
NH3(ac)=TVS
NH3(ch)=0.02
NO2=0.05
NO3=10
S=0.002
SO4=WS
Ag(ac)=TVS
Ag(chtr)=TVS
As(ch)=100(Trec)
Cd(actr)=TVS
Cd(ch)=TVS
CrIII(ac)=TVS
CrIII(ch)=TVS
CrVI(ac)=TVS
CrVI(ch)=TVS
Cu(ac)=TVS
Cu(ch)=TVS
Fe(ch)=WS(Dis)
Fe(ch)=1000(Trec)
Hg(ch)=0.01(Tot)
Mn(ac)=TVS
Mn(ch)=WS(Dis)
Mn(ch)=TVS
Ni(ac)=TVS
Ni(ch)=TVS
Pb(ac)=TVS
Pb(ch)=TVS
Se(ac)=TVS
Se(ch)=TVS
Zn(ac)=TVS
Zn(ch)=TVS
IX. AMBIENT WATER QUALITY
Two sources of data are used to assess water quality for the listed segment. The Water Quality Control
Division (Division) collected water samples from the listed portion of COSPUS04 on the North Fork
South Platte River (North Fork) at two sites from 1997-2003 (WQCD 5913 N.F. SOUTH PLATTE
ABOVE ROBERTS TUNNEL and WQCD 5915 N.F. SOUTH PLATTE at WEBSTER). These sites
are located at the lower end of the listed portion of COSPUS04 (see Figure 2). The second source of
data is from CDPHE Hazardous Materials and Waste Management Division (HMWMD). Assessment
of available data documents non-attainment of both acute and chronic Aquatic Life Use-based copper
standards. All other assigned Aquatic Life Use-based standards, as well as all assigned Water Supply,
Recreation, and Agriculture Use-based standards are attained.
The 303(d) listing was based on data from the two Division sites. These data demonstrate exceedance
of the Aquatic Life Use-based dissolved copper standards for the listed portion of the segment.
According to the Division’s assessment methodology, data from different sites within the same
segment are pooled in the following manner. Means are calculated from results for samples taken on
the same date or sampling event. These sampling event means are then used to calculate the relevant
statistic (85th
percentile for metals, or mean for hardness). For the purpose of this TMDL report, the
data were examined separately for each of the sites as well as combined. Table 2 illustrates the
ambient water quality at each of the sites. Although the distance between these sites is not great, the
results in the table indicate that dissolved copper attenuates with distance downstream.
FINAL
9
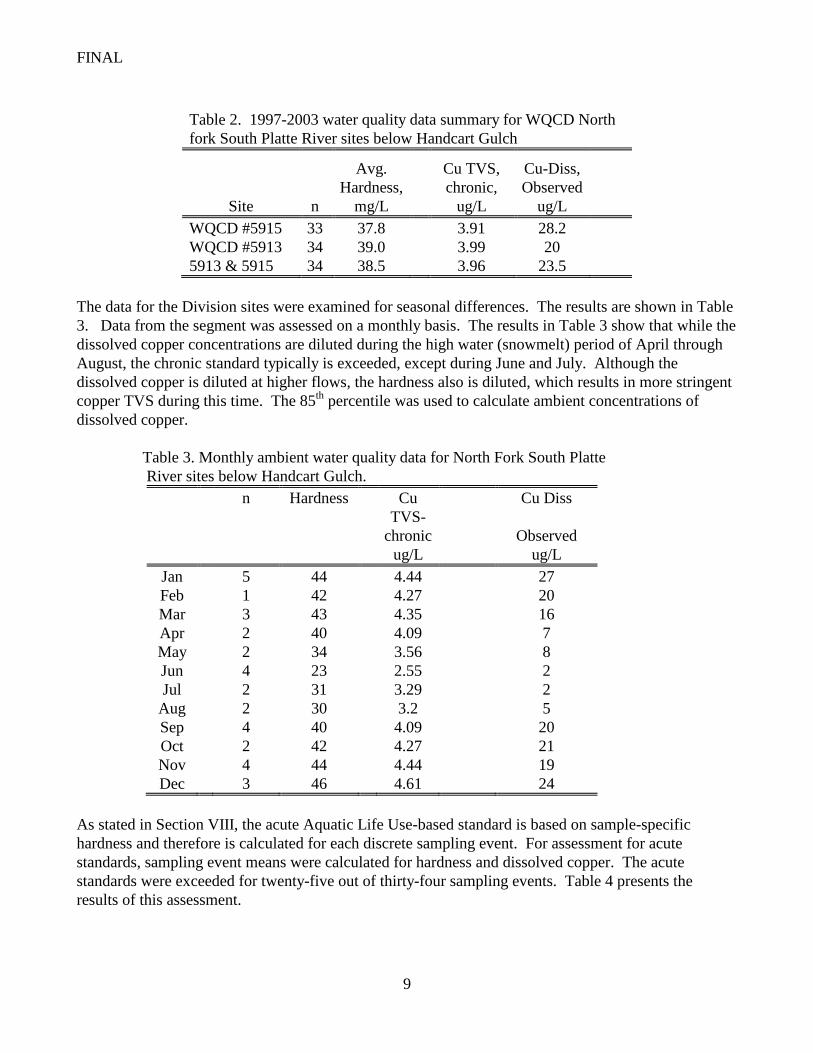
Table 2. 1997-2003 water quality data summary for WQCD North
fork South Platte River sites below Handcart Gulch
Site n
Avg.
Hardness,
mg/L
Cu TVS,
chronic,
ug/L
Cu-Diss,
Observed
ug/L
WQCD #5915 33 37.8 3.91 28.2
WQCD #5913 34 39.0 3.99 20
5913 & 5915 34 38.5 3.96 23.5
The data for the Division sites were examined for seasonal differences. The results are shown in Table
3. Data from the segment was assessed on a monthly basis. The results in Table 3 show that while the
dissolved copper concentrations are diluted during the high water (snowmelt) period of April through
August, the chronic standard typically is exceeded, except during June and July. Although the
dissolved copper is diluted at higher flows, the hardness also is diluted, which results in more stringent
copper TVS during this time. The 85th
percentile was used to calculate ambient concentrations of
dissolved copper.
Table 3. Monthly ambient water quality data for North Fork South Platte
River sites below Handcart Gulch.
n Hardness Cu Cu Diss
TVS-
chronic
ug/L
Observed
ug/L
Jan 5 44 4.44 27
Feb 1 42 4.27 20
Mar 3 43 4.35 16
Apr 2 40 4.09 7
May 2 34 3.56 8
Jun 4 23 2.55 2
Jul 2 31 3.29 2
Aug 2 30 3.2 5
Sep 4 40 4.09 20
Oct 2 42 4.27 21
Nov 4 44 4.44 19
Dec 3 46 4.61 24
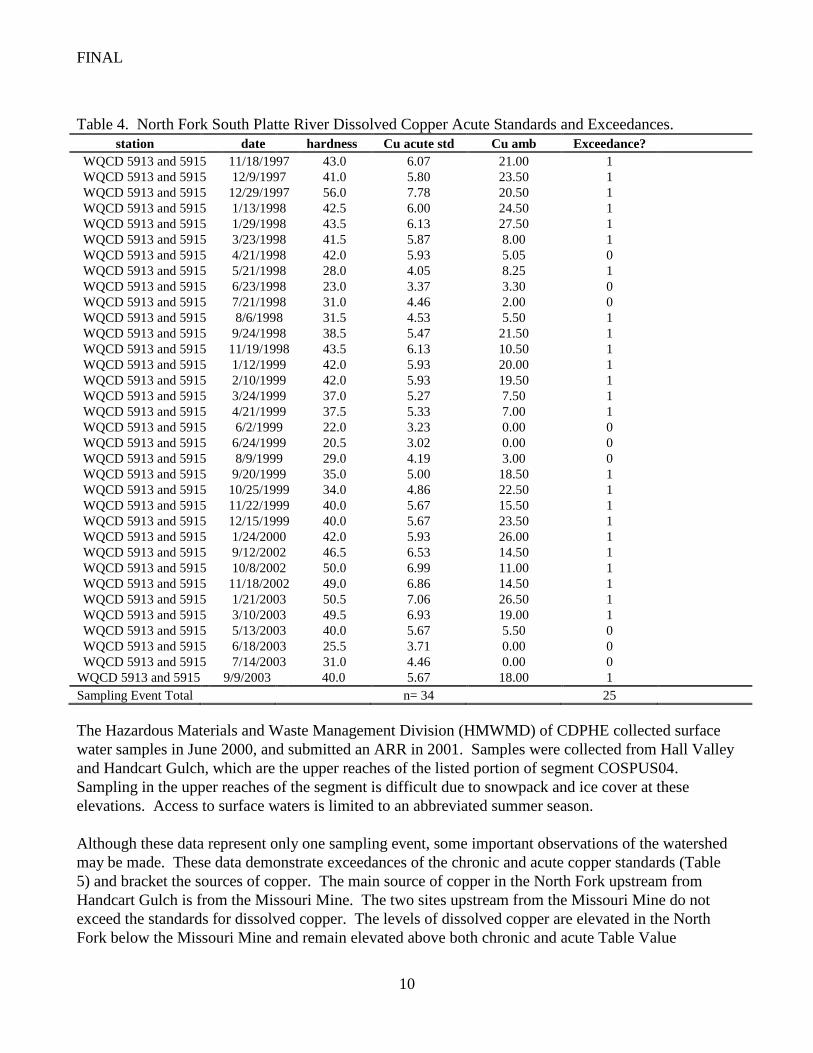
As stated in Section VIII, the acute Aquatic Life Use-based standard is based on sample-specific
hardness and therefore is calculated for each discrete sampling event. For assessment for acute
standards, sampling event means were calculated for hardness and dissolved copper. The acute
standards were exceeded for twenty-five out of thirty-four sampling events. Table 4 presents the
results of this assessment.
FINAL
10
Table 4. North Fork South Platte River Dissolved Copper Acute Standards and Exceedances.
station date hardness Cu acute std Cu amb Exceedance?
WQCD 5913 and 5915 11/18/1997 43.0 6.07 21.00 1
WQCD 5913 and 5915 12/9/1997 41.0 5.80 23.50 1
WQCD 5913 and 5915 12/29/1997 56.0 7.78 20.50 1
WQCD 5913 and 5915 1/13/1998 42.5 6.00 24.50 1
WQCD 5913 and 5915 1/29/1998 43.5 6.13 27.50 1
WQCD 5913 and 5915 3/23/1998 41.5 5.87 8.00 1
WQCD 5913 and 5915 4/21/1998 42.0 5.93 5.05 0
WQCD 5913 and 5915 5/21/1998 28.0 4.05 8.25 1
WQCD 5913 and 5915 6/23/1998 23.0 3.37 3.30 0
WQCD 5913 and 5915 7/21/1998 31.0 4.46 2.00 0
WQCD 5913 and 5915 8/6/1998 31.5 4.53 5.50 1
WQCD 5913 and 5915 9/24/1998 38.5 5.47 21.50 1
WQCD 5913 and 5915 11/19/1998 43.5 6.13 10.50 1
WQCD 5913 and 5915 1/12/1999 42.0 5.93 20.00 1
WQCD 5913 and 5915 2/10/1999 42.0 5.93 19.50 1
WQCD 5913 and 5915 3/24/1999 37.0 5.27 7.50 1
WQCD 5913 and 5915 4/21/1999 37.5 5.33 7.00 1
WQCD 5913 and 5915 6/2/1999 22.0 3.23 0.00 0
WQCD 5913 and 5915 6/24/1999 20.5 3.02 0.00 0
WQCD 5913 and 5915 8/9/1999 29.0 4.19 3.00 0
WQCD 5913 and 5915 9/20/1999 35.0 5.00 18.50 1
WQCD 5913 and 5915 10/25/1999 34.0 4.86 22.50 1
WQCD 5913 and 5915 11/22/1999 40.0 5.67 15.50 1
WQCD 5913 and 5915 12/15/1999 40.0 5.67 23.50 1
WQCD 5913 and 5915 1/24/2000 42.0 5.93 26.00 1
WQCD 5913 and 5915 9/12/2002 46.5 6.53 14.50 1
WQCD 5913 and 5915 10/8/2002 50.0 6.99 11.00 1
WQCD 5913 and 5915 11/18/2002 49.0 6.86 14.50 1
WQCD 5913 and 5915 1/21/2003 50.5 7.06 26.50 1
WQCD 5913 and 5915 3/10/2003 49.5 6.93 19.00 1
WQCD 5913 and 5915 5/13/2003 40.0 5.67 5.50 0
WQCD 5913 and 5915 6/18/2003 25.5 3.71 0.00 0
WQCD 5913 and 5915 7/14/2003 31.0 4.46 0.00 0
WQCD 5913 and 5915 9/9/2003 40.0 5.67 18.00 1
Sampling Event Total n= 34 25
The Hazardous Materials and Waste Management Division (HMWMD) of CDPHE collected surface
water samples in June 2000, and submitted an ARR in 2001. Samples were collected from Hall Valley
and Handcart Gulch, which are the upper reaches of the listed portion of segment COSPUS04.
Sampling in the upper reaches of the segment is difficult due to snowpack and ice cover at these
elevations. Access to surface waters is limited to an abbreviated summer season.
Although these data represent only one sampling event, some important observations of the watershed
may be made. These data demonstrate exceedances of the chronic and acute copper standards (Table
5) and bracket the sources of copper. The main source of copper in the North Fork upstream from
Handcart Gulch is from the Missouri Mine. The two sites upstream from the Missouri Mine do not
exceed the standards for dissolved copper. The levels of dissolved copper are elevated in the North
Fork below the Missouri Mine and remain elevated above both chronic and acute Table Value
FINAL
11
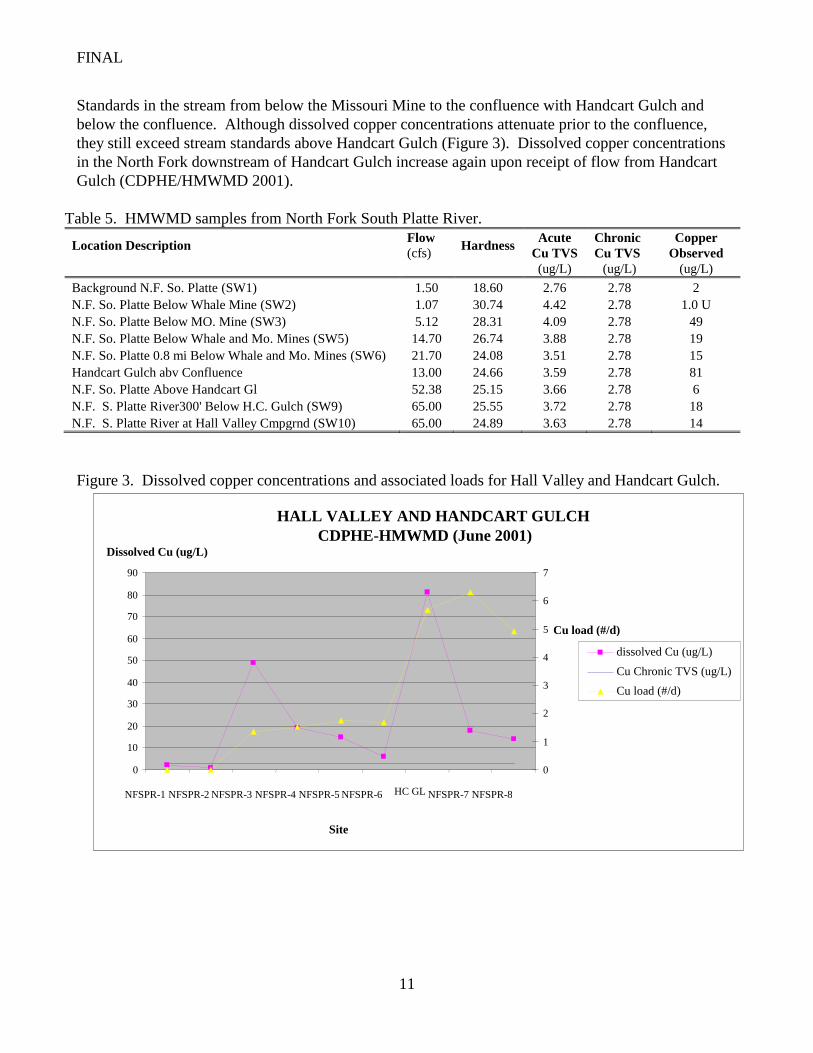
Standards in the stream from below the Missouri Mine to the confluence with Handcart Gulch and
below the confluence. Although dissolved copper concentrations attenuate prior to the confluence,
they still exceed stream standards above Handcart Gulch (Figure 3). Dissolved copper concentrations
in the North Fork downstream of Handcart Gulch increase again upon receipt of flow from Handcart
Gulch (CDPHE/HMWMD 2001).
Table 5. HMWMD samples from North Fork South Platte River.
Location Description Flow
(cfs) Hardness
Acute
Cu TVS
Chronic
Cu TVS
Copper
Observed
(ug/L) (ug/L) (ug/L)
Background N.F. So. Platte (SW1) 1.50 18.60 2.76 2.78 2
N.F. So. Platte Below Whale Mine (SW2) 1.07 30.74 4.42 2.78 1.0 U
N.F. So. Platte Below MO. Mine (SW3) 5.12 28.31 4.09 2.78 49
N.F. So. Platte Below Whale and Mo. Mines (SW5) 14.70 26.74 3.88 2.78 19
N.F. So. Platte 0.8 mi Below Whale and Mo. Mines (SW6) 21.70 24.08 3.51 2.78 15
Handcart Gulch abv Confluence 13.00 24.66 3.59 2.78 81
N.F. So. Platte Above Handcart Gl 52.38 25.15 3.66 2.78 6
N.F. S. Platte River300' Below H.C. Gulch (SW9) 65.00 25.55 3.72 2.78 18
N.F. S. Platte River at Hall Valley Cmpgrnd (SW10) 65.00 24.89 3.63 2.78 14
Figure 3. Dissolved copper concentrations and associated loads for Hall Valley and Handcart Gulch.
HALL VALLEY AND HANDCART GULCH
CDPHE-HMWMD (June 2001)
0
10
20
30
40
50
60
70
80
90
NFSPR-1 NFSPR-2 NFSPR-3 NFSPR-4 NFSPR-5 NFSPR-6 HC GL NFSPR-7 NFSPR-8
8 Site
Dissolved Cu (ug/L)
0
1
2
3
4
5
6
7
Cu load (#/d)
dissolved Cu (ug/L)
Cu Chronic TVS (ug/L)
Cu load (#/d)
FINAL
12
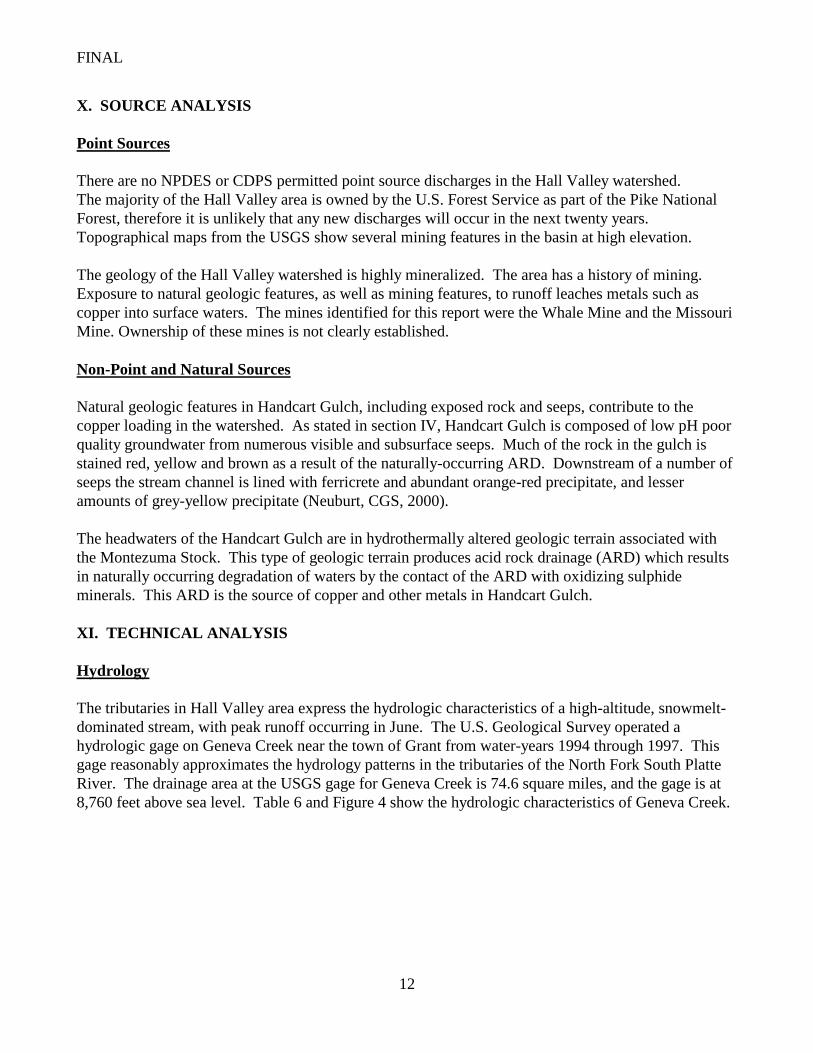
X. SOURCE ANALYSIS
Point Sources
There are no NPDES or CDPS permitted point source discharges in the Hall Valley watershed.
The majority of the Hall Valley area is owned by the U.S. Forest Service as part of the Pike National
Forest, therefore it is unlikely that any new discharges will occur in the next twenty years.
Topographical maps from the USGS show several mining features in the basin at high elevation.
The geology of the Hall Valley watershed is highly mineralized. The area has a history of mining.
Exposure to natural geologic features, as well as mining features, to runoff leaches metals such as
copper into surface waters. The mines identified for this report were the Whale Mine and the Missouri
Mine. Ownership of these mines is not clearly established.
Non-Point and Natural Sources
Natural geologic features in Handcart Gulch, including exposed rock and seeps, contribute to the
copper loading in the watershed. As stated in section IV, Handcart Gulch is composed of low pH poor
quality groundwater from numerous visible and subsurface seeps. Much of the rock in the gulch is
stained red, yellow and brown as a result of the naturally-occurring ARD. Downstream of a number of
seeps the stream channel is lined with ferricrete and abundant orange-red precipitate, and lesser
amounts of grey-yellow precipitate (Neuburt, CGS, 2000).
The headwaters of the Handcart Gulch are in hydrothermally altered geologic terrain associated with
the Montezuma Stock. This type of geologic terrain produces acid rock drainage (ARD) which results
in naturally occurring degradation of waters by the contact of the ARD with oxidizing sulphide
minerals. This ARD is the source of copper and other metals in Handcart Gulch.
XI. TECHNICAL ANALYSIS
Hydrology
The tributaries in Hall Valley area express the hydrologic characteristics of a high-altitude, snowmelt-
dominated stream, with peak runoff occurring in June. The U.S. Geological Survey operated a
hydrologic gage on Geneva Creek near the town of Grant from water-years 1994 through 1997. This
gage reasonably approximates the hydrology patterns in the tributaries of the North Fork South Platte
River. The drainage area at the USGS gage for Geneva Creek is 74.6 square miles, and the gage is at
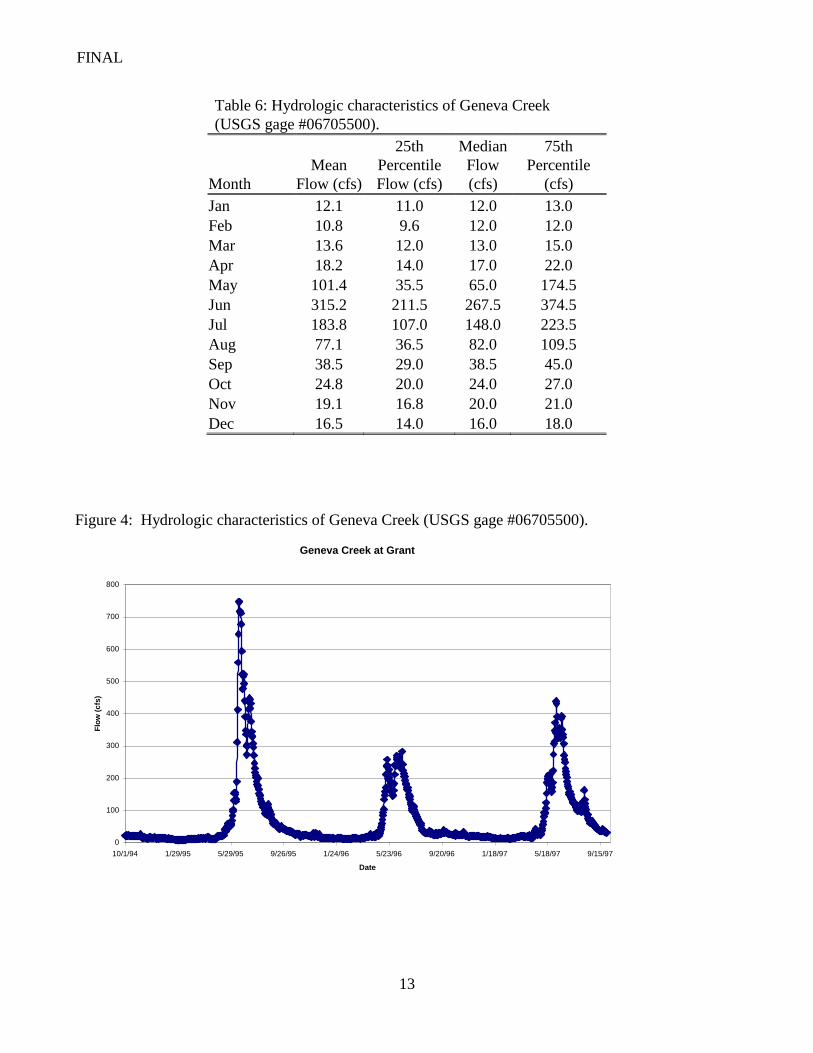
8,760 feet above sea level. Table 6 and Figure 4 show the hydrologic characteristics of Geneva Creek.
FINAL
13
Table 6: Hydrologic characteristics of Geneva Creek
(USGS gage #06705500).
Month
Mean
Flow (cfs)
25th
Percentile
Flow (cfs)
Median
Flow
(cfs)
75th
Percentile
(cfs)
Jan 12.1 11.0 12.0 13.0
Feb 10.8 9.6 12.0 12.0
Mar 13.6 12.0 13.0 15.0
Apr 18.2 14.0 17.0 22.0
May 101.4 35.5 65.0 174.5
Jun 315.2 211.5 267.5 374.5
Jul 183.8 107.0 148.0 223.5
Aug 77.1 36.5 82.0 109.5
Sep 38.5 29.0 38.5 45.0
Oct 24.8 20.0 24.0 27.0
Nov 19.1 16.8 20.0 21.0
Dec 16.5 14.0 16.0 18.0
Figure 4: Hydrologic characteristics of Geneva Creek (USGS gage #06705500).
Geneva Creek at Grant
0
100
200
300
400
500
600
700
800
10/1/94 1/29/95 5/29/95 9/26/95 1/24/96 5/23/96 9/20/96 1/18/97 5/18/97 9/15/97
Date
Flo
w (
cfs
)
FINAL
14
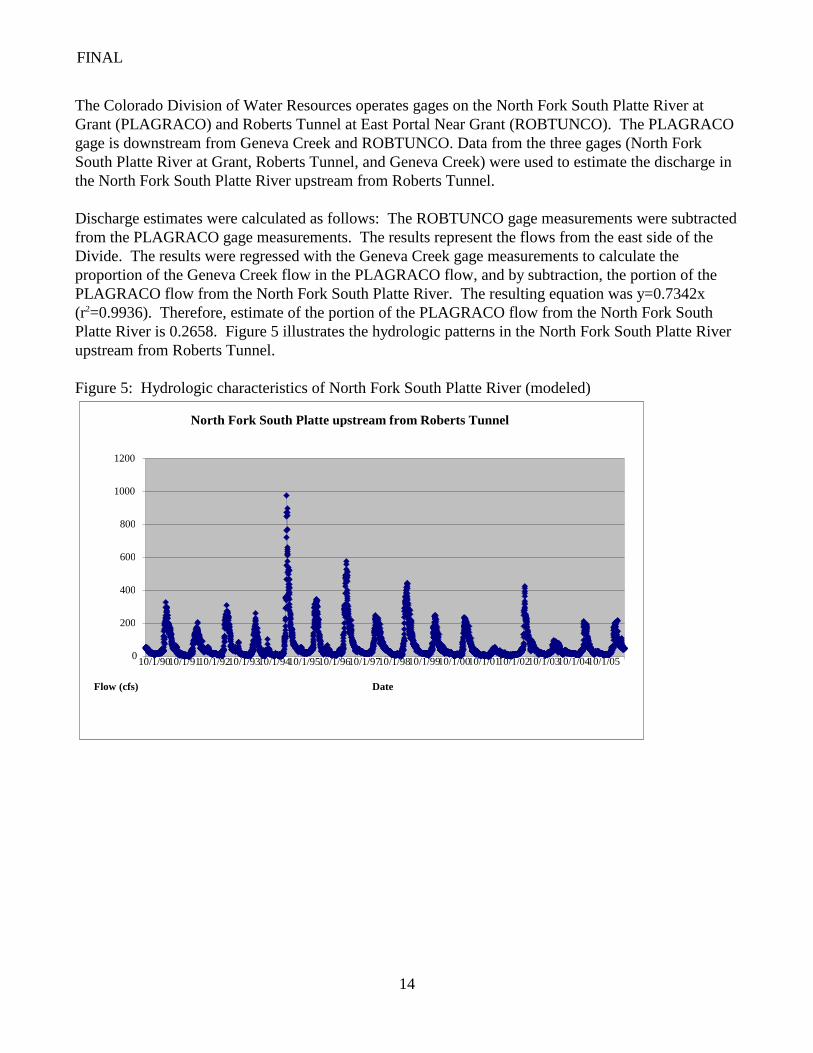
The Colorado Division of Water Resources operates gages on the North Fork South Platte River at
Grant (PLAGRACO) and Roberts Tunnel at East Portal Near Grant (ROBTUNCO). The PLAGRACO
gage is downstream from Geneva Creek and ROBTUNCO. Data from the three gages (North Fork
South Platte River at Grant, Roberts Tunnel, and Geneva Creek) were used to estimate the discharge in
the North Fork South Platte River upstream from Roberts Tunnel.
Discharge estimates were calculated as follows: The ROBTUNCO gage measurements were subtracted
from the PLAGRACO gage measurements. The results represent the flows from the east side of the
Divide. The results were regressed with the Geneva Creek gage measurements to calculate the
proportion of the Geneva Creek flow in the PLAGRACO flow, and by subtraction, the portion of the
PLAGRACO flow from the North Fork South Platte River. The resulting equation was y=0.7342x
(r2=0.9936). Therefore, estimate of the portion of the PLAGRACO flow from the North Fork South
Platte River is 0.2658. Figure 5 illustrates the hydrologic patterns in the North Fork South Platte River
upstream from Roberts Tunnel.
Figure 5: Hydrologic characteristics of North Fork South Platte River (modeled)
North Fork South Platte upstream from Roberts Tunnel
0
200
400
600
800
1000
1200
10/1/90 10/1/91 10/1/92 10/1/93 10/1/94 10/1/95 10/1/96 10/1/97 10/1/98 10/1/99 10/1/00 10/1/01 10/1/02 10/1/03 10/1/04 10/1/05
Date Flow (cfs)
FINAL
15
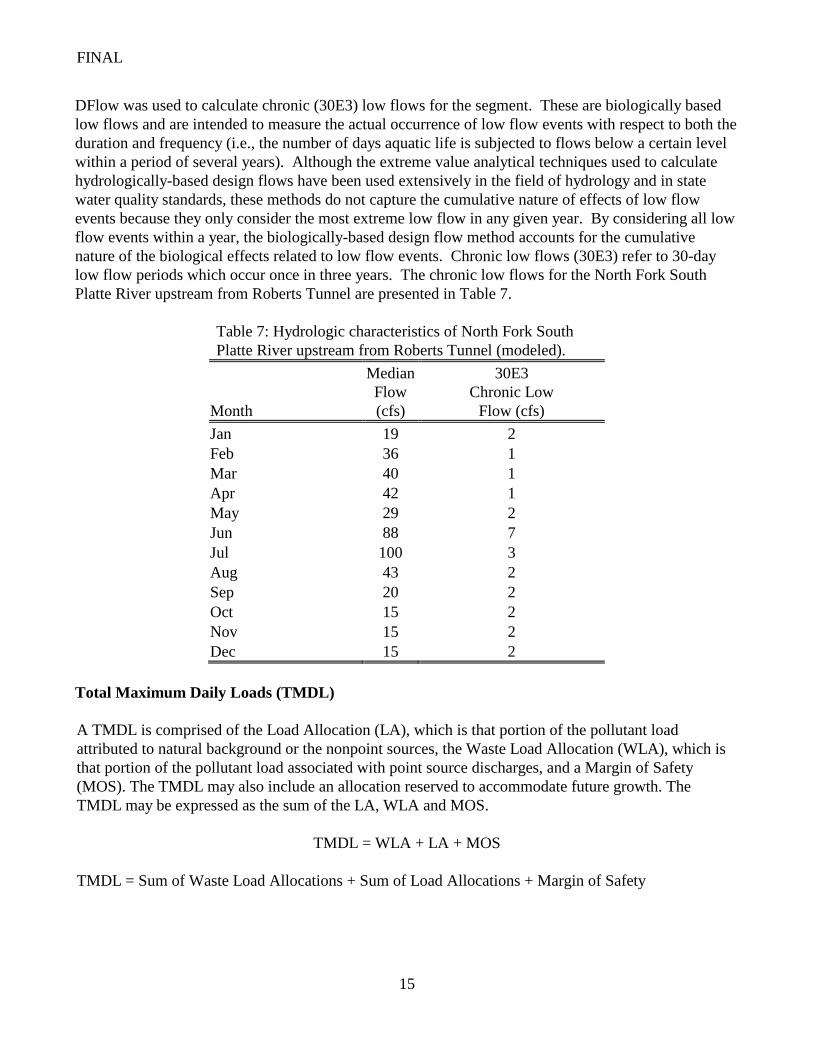
DFlow was used to calculate chronic (30E3) low flows for the segment. These are biologically based
low flows and are intended to measure the actual occurrence of low flow events with respect to both the
duration and frequency (i.e., the number of days aquatic life is subjected to flows below a certain level
within a period of several years). Although the extreme value analytical techniques used to calculate
hydrologically-based design flows have been used extensively in the field of hydrology and in state
water quality standards, these methods do not capture the cumulative nature of effects of low flow
events because they only consider the most extreme low flow in any given year. By considering all low
flow events within a year, the biologically-based design flow method accounts for the cumulative
nature of the biological effects related to low flow events. Chronic low flows (30E3) refer to 30-day
low flow periods which occur once in three years. The chronic low flows for the North Fork South
Platte River upstream from Roberts Tunnel are presented in Table 7.
Table 7: Hydrologic characteristics of North Fork South
Platte River upstream from Roberts Tunnel (modeled).
Month
Median
Flow
(cfs)
30E3
Chronic Low
Flow (cfs)
Jan 19 2
Feb 36 1
Mar 40 1
Apr 42 1
May 29 2
Jun 88 7
Jul 100 3
Aug 43 2
Sep 20 2
Oct 15 2
Nov 15 2
Dec 15 2
Total Maximum Daily Loads (TMDL)
A TMDL is comprised of the Load Allocation (LA), which is that portion of the pollutant load
attributed to natural background or the nonpoint sources, the Waste Load Allocation (WLA), which is
that portion of the pollutant load associated with point source discharges, and a Margin of Safety
(MOS). The TMDL may also include an allocation reserved to accommodate future growth. The
TMDL may be expressed as the sum of the LA, WLA and MOS.
TMDL = WLA + LA + MOS
TMDL = Sum of Waste Load Allocations + Sum of Load Allocations + Margin of Safety
FINAL
16
Waste Load Allocations (WLA)
There are no permitted dischargers within the geographic scope of the TMDL. There are two legacy
mining operations within the upper portion of the North Fork South Platte mainstem portion of the
affected watershed. Copper loading from these sources is included in the waste load allocation for this
TMDL. Contributions from Missouri Mine and possibly the Whale Mine represent an unpermitted
WLA.
Load Allocations (LA)
All other sources that were examined are considered nonpoint sources and therefore are accountable to
load allocations. Such sources of copper loading are treated as nonpoint sources and/or background.
Copper loading from Handcart Gulch is expressed in the Load Allocation (LA) of the TMDL.
Margin of Safety (MOS)
According to the Federal Clean Water Act, TMDLs require a margin of safety (MOS) component that
accounts for the uncertainty about the relationship between the pollutant loads and the receiving
waterbody. The margin of safety may be explicit (a separate value in the TMDL) or implicit (included
in factors determining the TMDL). The MOS used in this TMDL analysis is implicit and resides in the
conservative assumptions utilized in the calculations. The conservative assumptions used in the
analysis include the use of the 85th percentile of the data in establishing ambient conditions. Mean
hardness was used in calculation of hardness based TVS and represents a conservative element.
Finally, the TMDL is based on stream low flow (30-day chronic low flows) which is considerably
lower than flows recorded during low-flow conditions. Using low flow to calculate the TMDLs tends
to overestimate the loading reductions.
TMDL FOR DISSOLVED COPPER
The TMDL for dissolved copper is based on the data collected by the Water Quality Control Division
of CDPHE and is presented in Table 8. These data were collected from the lower reach of the listed
portion of the segment on the mainstem of the North Fork South Platte River below the source area.
The TMDL is calculated using low flows while the ambient or observed loads are calculated using
median stream flows. Proposed copper reductions are conservative and overestimate the reductions
necessary to attain chronic standards. However, basing the TMDLs on low flows addresses the acute
copper exceedances, as well as the chronic copper exceedances.
FINAL
17
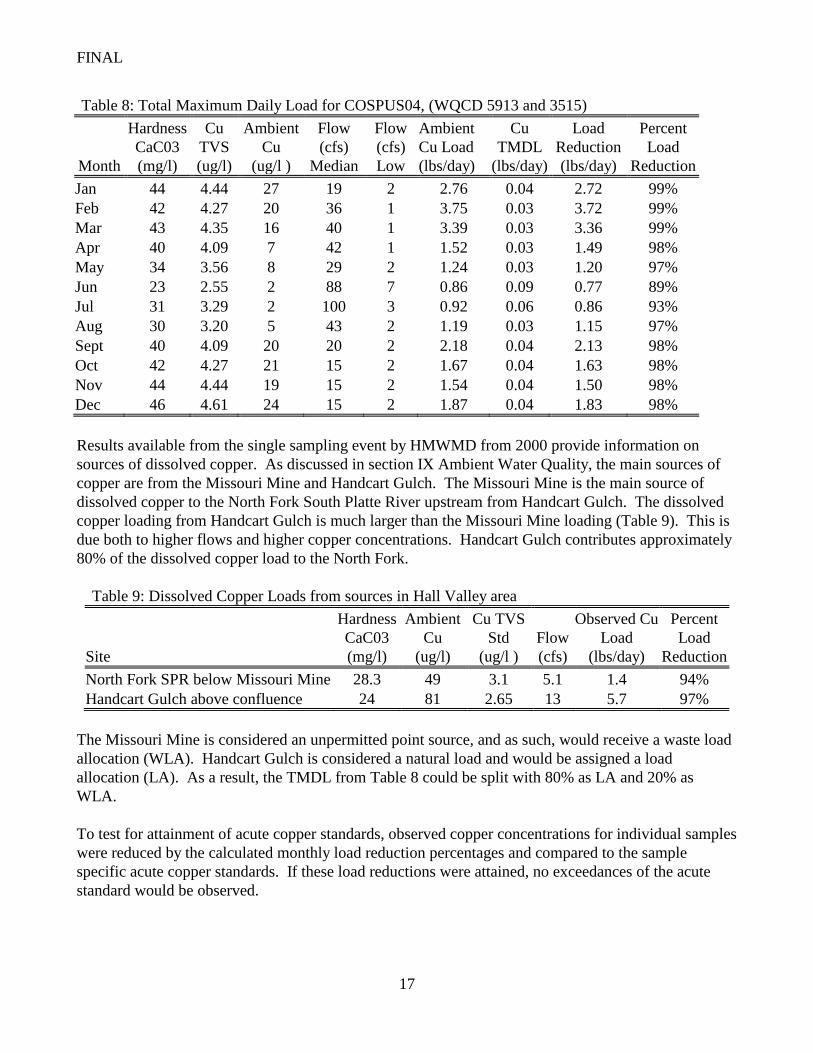
Table 8: Total Maximum Daily Load for COSPUS04, (WQCD 5913 and 3515)
Month
Hardness
CaC03
(mg/l)
Cu
TVS
(ug/l)
Ambient
Cu
(ug/l )
Flow
(cfs)
Median
Flow
(cfs)
Low
Ambient
Cu Load
(lbs/day)
Cu
TMDL
(lbs/day)
Load
Reduction
(lbs/day)
Percent
Load
Reduction
Jan 44 4.44 27 19 2 2.76 0.04 2.72 99%
Feb 42 4.27 20 36 1 3.75 0.03 3.72 99%
Mar 43 4.35 16 40 1 3.39 0.03 3.36 99%
Apr 40 4.09 7 42 1 1.52 0.03 1.49 98%
May 34 3.56 8 29 2 1.24 0.03 1.20 97%
Jun 23 2.55 2 88 7 0.86 0.09 0.77 89%
Jul 31 3.29 2 100 3 0.92 0.06 0.86 93%
Aug 30 3.20 5 43 2 1.19 0.03 1.15 97%
Sept 40 4.09 20 20 2 2.18 0.04 2.13 98%
Oct 42 4.27 21 15 2 1.67 0.04 1.63 98%
Nov 44 4.44 19 15 2 1.54 0.04 1.50 98%
Dec 46 4.61 24 15 2 1.87 0.04 1.83 98%
Results available from the single sampling event by HMWMD from 2000 provide information on
sources of dissolved copper. As discussed in section IX Ambient Water Quality, the main sources of
copper are from the Missouri Mine and Handcart Gulch. The Missouri Mine is the main source of
dissolved copper to the North Fork South Platte River upstream from Handcart Gulch. The dissolved
copper loading from Handcart Gulch is much larger than the Missouri Mine loading (Table 9). This is
due both to higher flows and higher copper concentrations. Handcart Gulch contributes approximately
80% of the dissolved copper load to the North Fork.
Table 9: Dissolved Copper Loads from sources in Hall Valley area
Site
Hardness
CaC03
(mg/l)
Ambient
Cu
(ug/l)
Cu TVS
Std
(ug/l )
Flow
(cfs)
Observed Cu
Load
(lbs/day)
Percent
Load
Reduction
North Fork SPR below Missouri Mine 28.3 49 3.1 5.1 1.4 94%
Handcart Gulch above confluence 24 81 2.65 13 5.7 97%
The Missouri Mine is considered an unpermitted point source, and as such, would receive a waste load
allocation (WLA). Handcart Gulch is considered a natural load and would be assigned a load
allocation (LA). As a result, the TMDL from Table 8 could be split with 80% as LA and 20% as
WLA.
To test for attainment of acute copper standards, observed copper concentrations for individual samples
were reduced by the calculated monthly load reduction percentages and compared to the sample
specific acute copper standards. If these load reductions were attained, no exceedances of the acute
standard would be observed.
FINAL
18
XII. RESTORATION PLANNING AND IMPLEMENTATION PROCESS
The Division plans only limited monitoring from this area. The area is owned by the U.S. Forest
Service and private interests. Currently there are no plans by parties to develop the area through
additional recreation development, logging or mining that may expose additional rock to precipitation
and weathering. The area has not been mined for over 75 years and is not expected to be explored or
mined in the next 20 years.
The Hazardous Materials and Waste Management Division of CDPHE prepared an Analytical Results
Report of the Hall Valley watershed. In response, the EPA is not expected to pursue any remedial
activities designed to improve water in the valley.
Natural attenuation mechanisms have and continue to remediate effects from the naturally-occurring
acid rock drainage in the basin. Natural attenuation mechanisms such as precipitation help to
ameliorate water quality by removing metals from solution. Analyses of new and old precipitate show
that trace metals are incorporated and remain immobile (Meyer, CGS, 1997).
The Division is considering a proposal to modify the aquatic life standards for the Hall Valley /
Handcart Gulch segment to reflect the ambient conditions in the basin. During the Regulation 38,
Classification and Numeric Standards South Platte River Basin, Laramie River Basin, Republican
River Basin, Smoky Hill River Basin hearing in 2009 the Water Quality Control Commission will
consider alternate acute and chronic standards adjusted to reflect ambient water conditions of the upper
basin affected by ARD.
XIII. PUBLIC INVOLVEMENT
The portion of COSPUS04 North Fork South Platte River from Hall Valley to Geneva Creek was
included on the 1998 303(d) list of impaired waters in Colorado based upon water quality data. The
development of the 303(d) list is a public process involving solicitation from the public, of candidate
waterbodies, formation of a technical review committee comprised of representatives of both the public
and private sector, and a public hearing before the Colorado Water Quality Control Commission.
Public notice is provided concerning both the solicitation of impaired waterbodies and the public
hearing.
The TMDL itself is subject to an independent public process. The TMDL report was made available
for public review and comment during a 30 day public notice period in April, 2008.
FINAL
19
XV. REFERENCES
Combined Assessment Analytical Results Report, Hall Valley, Park County, Colorado, CDPHE,
Hazardous Materials and Waste Management Division, January 10, 2001.
Meyer, Wendy A.; Streufert, Randall K.; Williamson, Mark A.; A Comparison of Natural Acid Rock
Drainage Occurrences in Colorado, Colorado Geological Survey, 1997?.
Moran, Robert E. and Wentz, Dennis A.; Effects of Metal-Mine Drainage on Water Quality in Selected
Areas of Colorado, 1972-73; USGS, 1974.
Neubert, John, Naturally Degraded Surface Water Associated with Hydrothermally Altered Terrane in
Colorado, Colorado Geological Survey, 2000.
Regulation 38, Classification and Numeric Standards South Platte River Basin, Laramie River Basin,
Republican River Basin, Smokey Hill River Basin, amended effective January 20, 2005.
USFS-Abandoned Mined Land Inventory Project, South Platte Ranger District, Summary Report,
USDA/USFS, January 4, 1993.