Embed Size (px)
Citation preview
Total Quality Management and Reliability Engineering
U7BAA05
Prepared by Mrs.Kavitha.NAssistant Professor, Mechanical DepartmentVelTech Dr.RR & Dr.SR Technical University
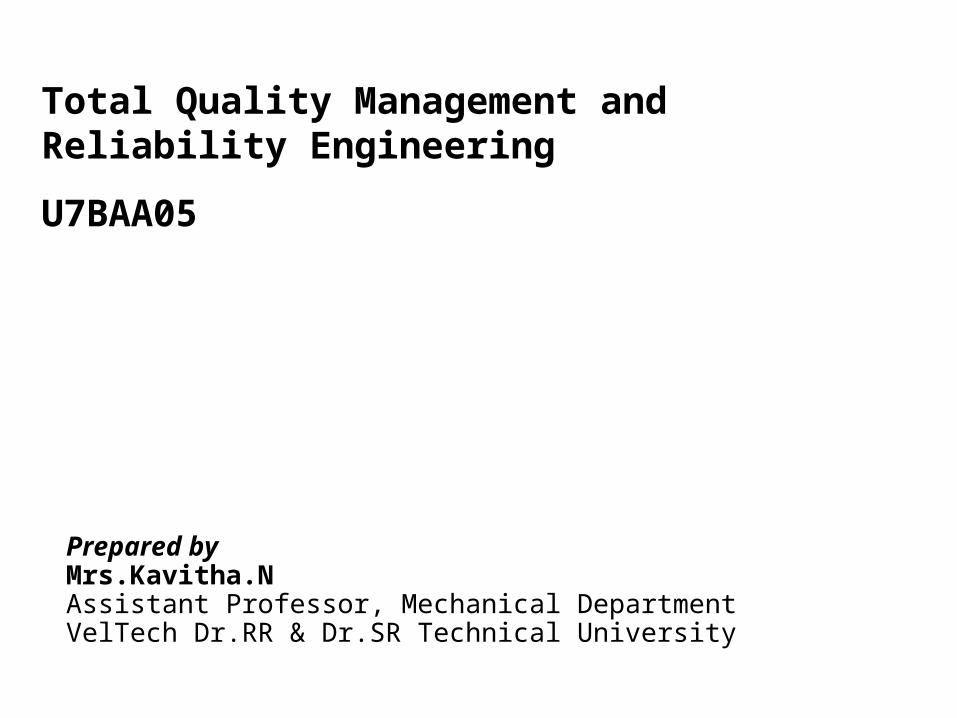
TQM Total Quality Management (TQM) is an enhancement to the traditional way of doing business. Total - Made up of the whole Quality - Degree of Excellence a Product or Management - Art of handling, controlling, directing etc. TQM is the application of quantitative methods and human resources to improve all the processes within an organization and exceed CUSTOMER NEEDS now and in the future.
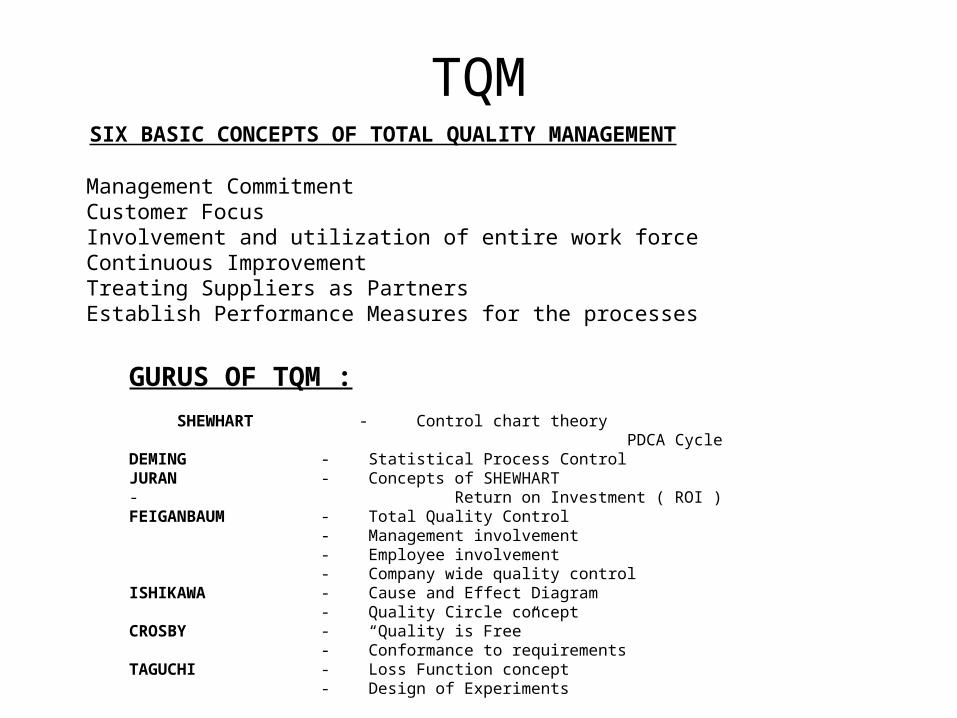
TQM SIX BASIC CONCEPTS OF TOTAL QUALITY MANAGEMENT Management Commitment Customer Focus Involvement and utilization of entire work force Continuous Improvement Treating Suppliers as Partners Establish Performance Measures for the processes
GURUS OF TQM :
SHEWHART - Control chart theory PDCA CycleDEMING - Statistical Process ControlJURAN - Concepts of SHEWHART- Return on Investment ( ROI )FEIGANBAUM - Total Quality Control
- Management involvement- Employee involvement- Company wide quality control
ISHIKAWA - Cause and Effect Diagram- Quality Circle concept
CROSBY - “Quality is Free”- Conformance to requirements
TAGUCHI - Loss Function concept- Design of Experiments
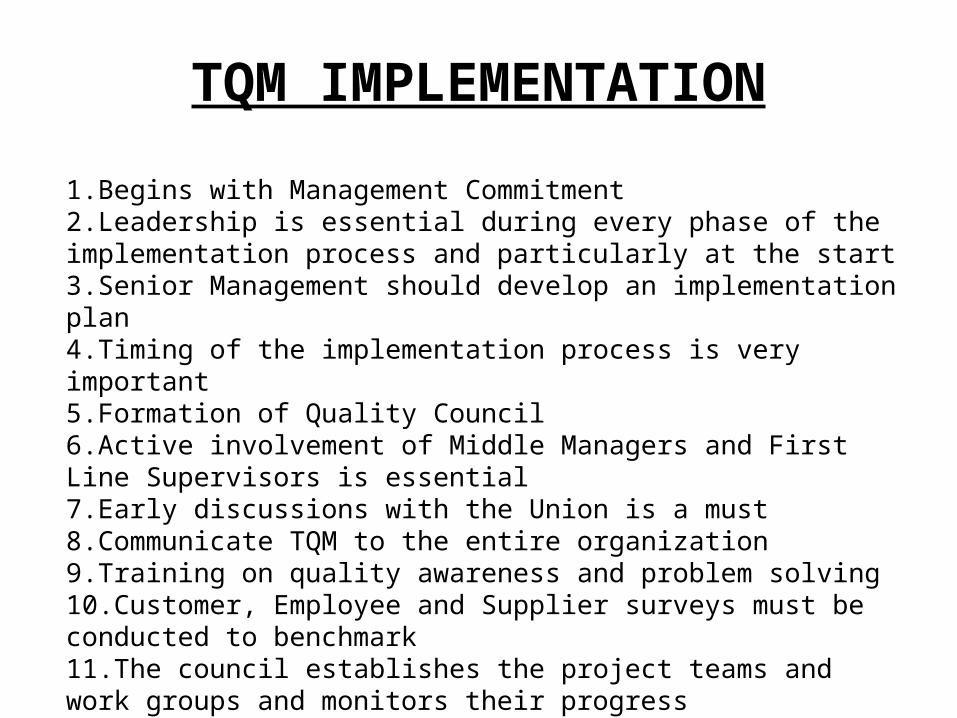
TQM IMPLEMENTATION 1.Begins with Management Commitment2.Leadership is essential during every phase of the implementation process and particularly at the start3.Senior Management should develop an implementation plan4.Timing of the implementation process is very important5.Formation of Quality Council6.Active involvement of Middle Managers and First Line Supervisors is essential7.Early discussions with the Union is a must8.Communicate TQM to the entire organization9.Training on quality awareness and problem solving10.Customer, Employee and Supplier surveys must be conducted to benchmark11.The council establishes the project teams and work groups and monitors their progress
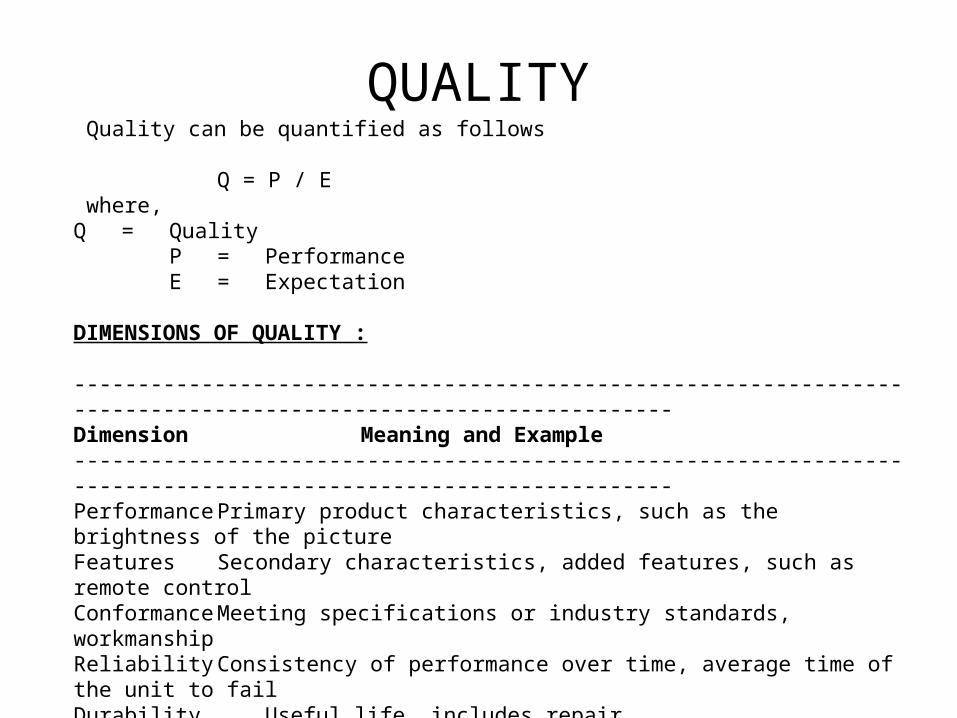
QUALITY Quality can be quantified as follows
Q = P / E where, Q = Quality
P = PerformanceE = Expectation
DIMENSIONS OF QUALITY : ----------------------------------------------------------------------------------------------------------------Dimension Meaning and Example----------------------------------------------------------------------------------------------------------------Performance Primary product characteristics, such as the brightness of the pictureFeatures Secondary characteristics, added features, such as remote controlConformance Meeting specifications or industry standards, workmanshipReliability Consistency of performance over time, average time of the unit to failDurability Useful life, includes repairService Resolution of problems and complaints, ease of repairResponse Human – to – human interface, such as the courtesy of the dealerAesthetics Sensory characteristics, such as exterior finishReputation Past performance and other intangibles, such as being ranked first----------------------------------------------------------------------------------------------------------------
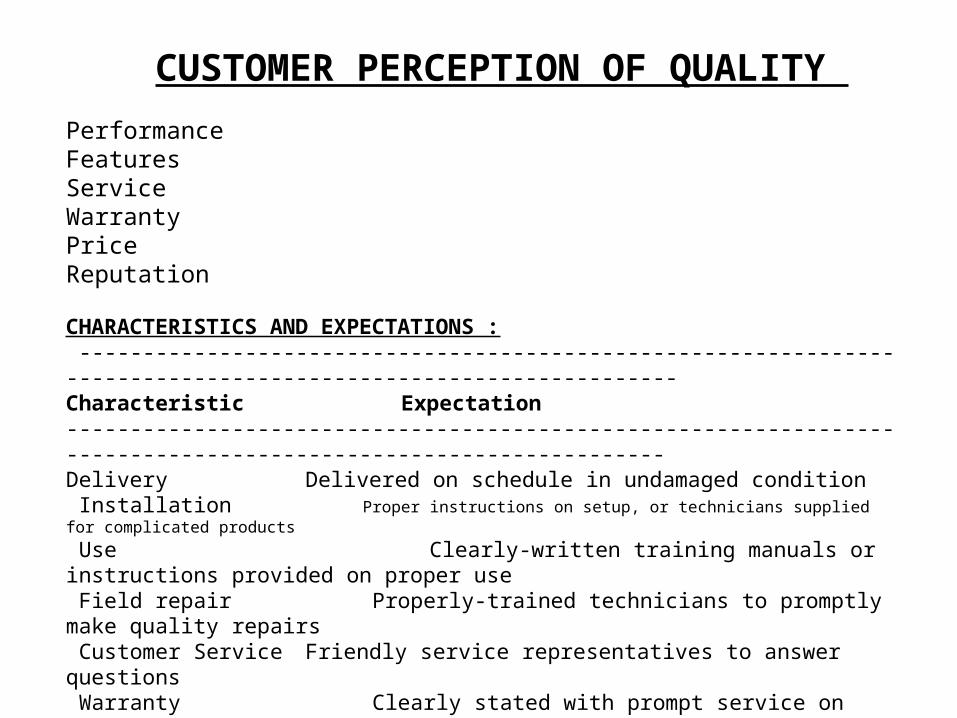
CUSTOMER PERCEPTION OF QUALITY
PerformanceFeaturesServiceWarrantyPriceReputation
CHARACTERISTICS AND EXPECTATIONS : ----------------------------------------------------------------------------------------------------------------Characteristic Expectation----------------------------------------------------------------------------------------------------------------Delivery Delivered on schedule in undamaged condition Installation Proper instructions on setup, or technicians supplied for complicated products
Use Clearly-written training manuals or instructions provided on proper use Field repair Properly-trained technicians to promptly make quality repairs Customer Service Friendly service representatives to answer questions Warranty Clearly stated with prompt service on claims----------------------------------------------------------------------------------------------------------------
LEADERSHIP A leader is one who instills purposes, not one who controls by brute force. He strengthens and inspires the followers to accomplish shared goals. Leaders Shape the Organization’s valuePromote the Organization’s valueProtect the Organization’s value andExemplifies the Organization values CHARACTERISTICS OF QUALITY LEADERS : They give priority attention to external and internal customers and their needs.They empower, rather than control, subordinates.They emphasis improvement rather than maintenance.They emphasis prevention.They emphasis collaboration rather than competition.They train and coach, rather than direct and supervise.They learn from the problems.They continually try to improve communications.They continually demonstrate their commitment to quality.They choose suppliers on the basis of quality, not price.They establish organizational systems to support the quality effort.They encourage and recognize team effort.
QUALITY COUNCIL A quality council is established to provide overall direction. The council is composed of Chief Executive OfficerSenior ManagersCoordinator or ConsultantA representative from the Union Duties of the council are Develop the core values, vision statement, mission statement and quality policy statementDevelop the strategic long term plan with goals and Annual Quality Improvement Program with objectivesCreate the total education and training planDetermine and monitor the cost of poor qualityDetermine the performance measuresDetermine projects those improve the processEstablish multifunctional project and work group teamsRevise the recognition and rewards system

QUALITY COUNCIL A quality council is established to provide overall direction. The council is composed of Chief Executive OfficerSenior ManagersCoordinator or ConsultantA representative from the Union Duties of the council are Develop the core values, vision statement, mission statement and quality policy statementDevelop the strategic long term plan with goals and Annual Quality Improvement Program with objectivesCreate the total education and training planDetermine and monitor the cost of poor qualityDetermine the performance measuresDetermine projects those improve the processEstablish multifunctional project and work group teamsRevise the recognition and rewards system
THE JURAN TRILOGY 1.PLANNING Determine internal & external customers.Their needs are discovered.Develop product / service features.Develop the processes able to produce the product / service features.Transfer plans to operations. 2.CONTROL Control is used by operating forces to help meet the product, process and service requirements. It consists of the following steps Determine items to be controlled.Set goals for the controls.Measure actual performance.Compare actual performance to goals.Act on the difference. 3. IMPROVEMENT Aims to attain levels of performance that are higher than current levels. It consists of the following steps Establishment of quality council.Identify the improvement projects.Establish the project teams with a project leader.Provide the team with the resources.
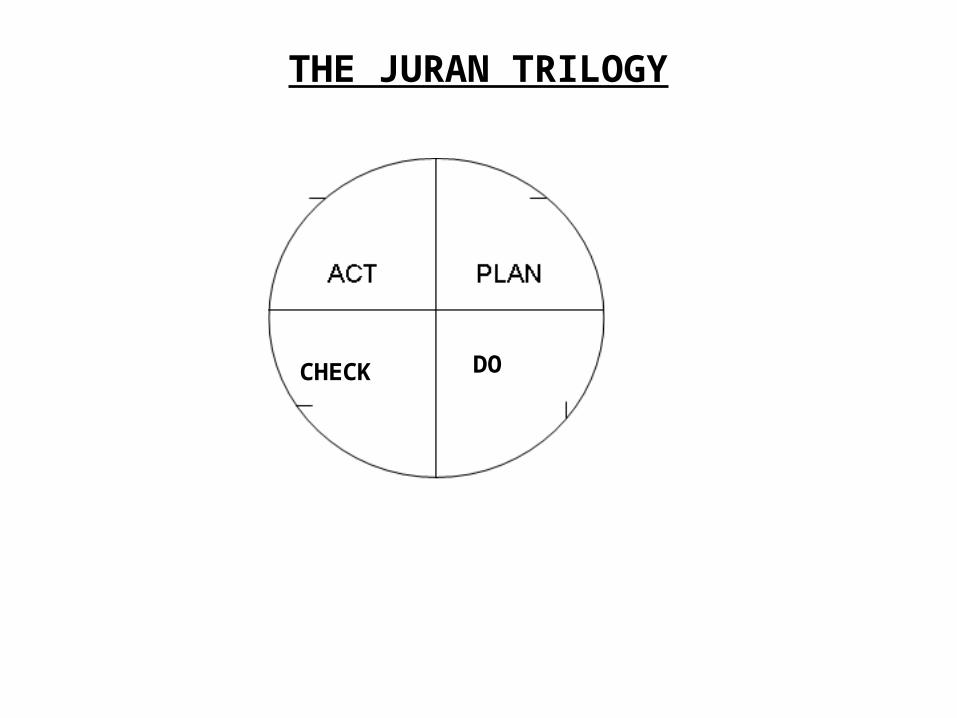
THE JURAN TRILOGY
CHECK DO
DEMING PHILOSOPHY 1.Create and publish the Aims and Purposes of the organization.2.Learn the New Philosophy.3.Understand the purpose of Inspection.4.Stop awarding business based on price alone.5.Improve constantly and forever the System.6.Institute Training.7.Teach and Institute Leadership.8.Drive out Fear, Create Trust and Create a climate for innovation.9.Optimize the efforts of Teams, Groups and Staff areas.10.Eliminate exhortations for the Work force.11.Eliminate numerical quotas for the work force.12.Eliminate Management by objectives.13.Remove Barriers THAT ROB PEOPLE OF PRIDE OF WORKMANSHIP.14.Encourage Education and Self-improvement for everyone.15.Take action to accomplish the transformation.
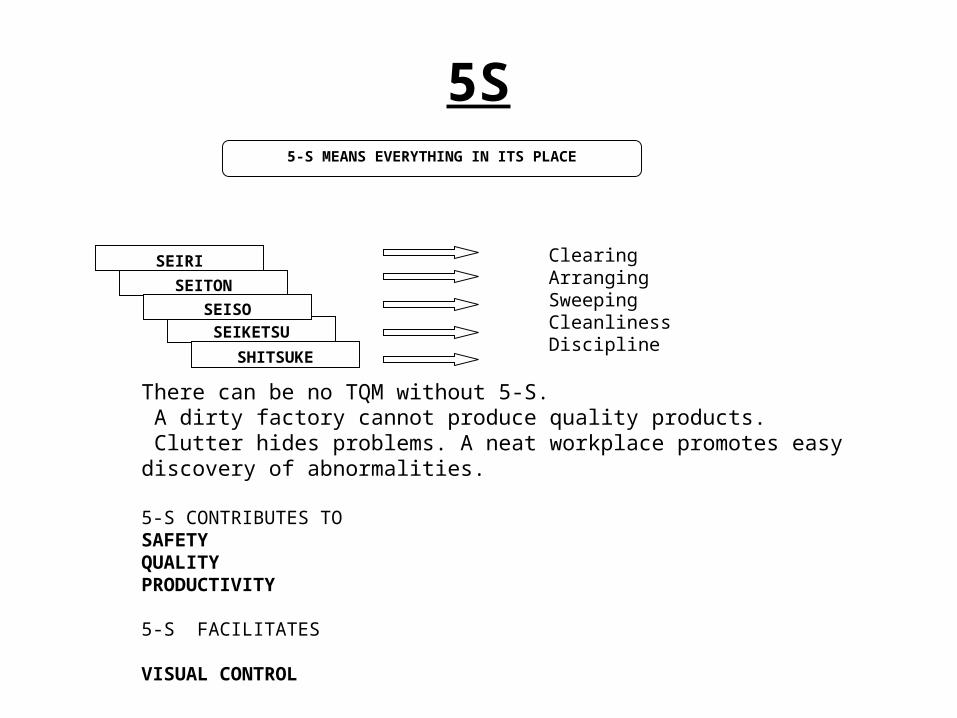
5S 5-S MEANS EVERYTHING IN ITS PLACE
SEIRI
SEITON
SEIKETSU
SEISO
SHITSUKE
ClearingArrangingSweepingCleanlinessDiscipline
There can be no TQM without 5-S. A dirty factory cannot produce quality products. Clutter hides problems. A neat workplace promotes easy discovery of abnormalities. 5-S CONTRIBUTES TOSAFETYQUALITYPRODUCTIVITY 5-S FACILITATES VISUAL CONTROL
KAIZEN
Kaizen is a Japanese word for the philosophy that defines management’s roles in continuously encouraging and implementing small improvements involving everyone.It focuses on simplification by breaking down complex progress into their sub – processes and then improving them. The Kaizen improvement focuses on the use of : •Value – added and non – value work activities.•Muda, which refers to the seven classes of waste – over-production, delay, transportation, processing, inventory, wasted motion, and defective parts.•Principles of motion study and the use of cell technology.•Principles of materials handling and use of one – piece flow.•Documentation of standard operating procedures.•The five S’s for workplace organization.•Visual management.•Just – in – time principles.•Poka – Yoke.•Team dynamics.
TQM TOOLS (SEVEN TOOLS OF QUALITY)
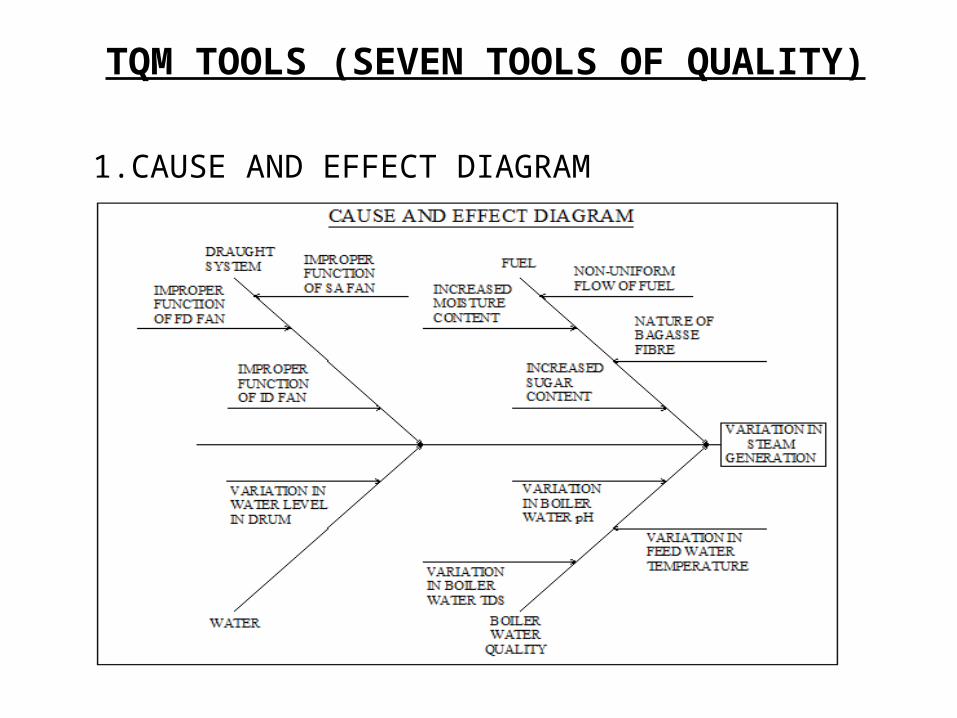
1.CAUSE AND EFFECT DIAGRAM
TQM TOOLS (SEVEN TOOLS OF QUALITY)
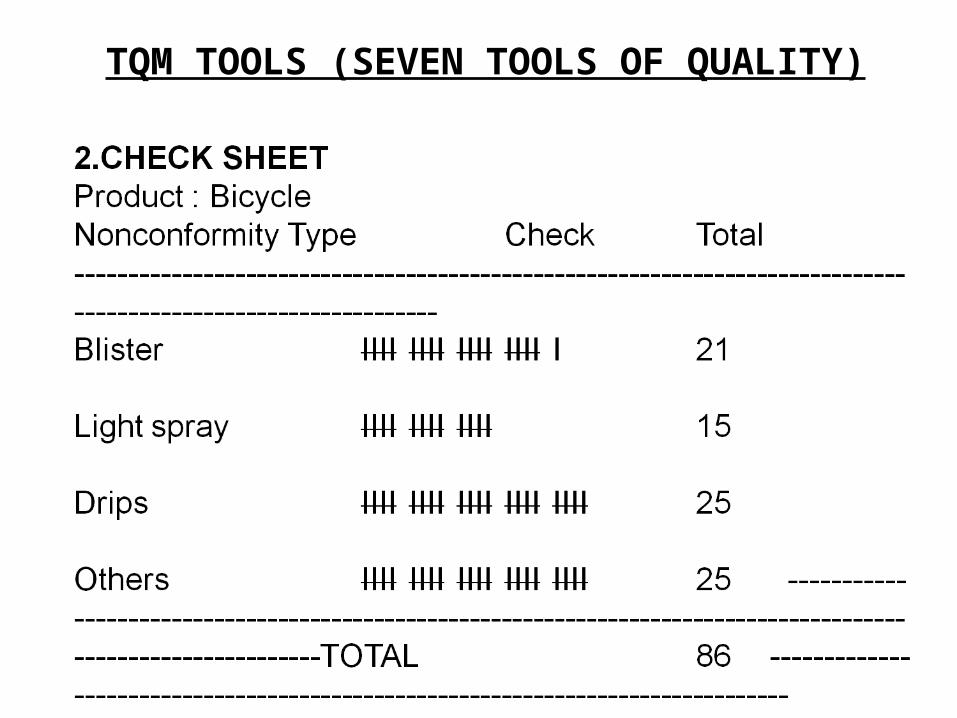
TQM TOOLS (SEVEN TOOLS OF QUALITY)
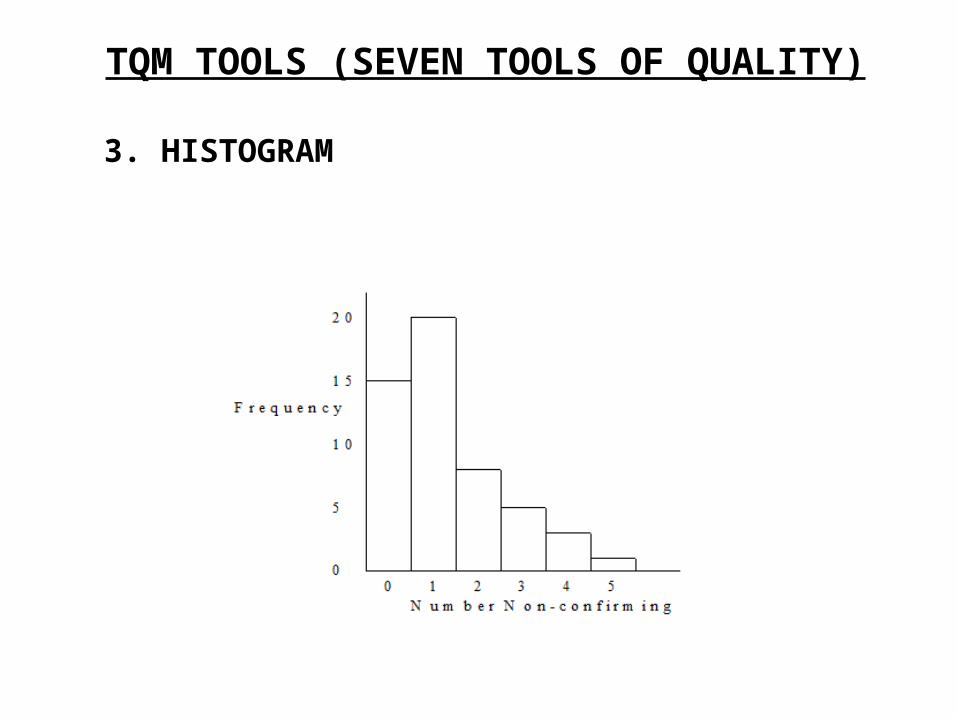
3. HISTOGRAM
TQM TOOLS (SEVEN TOOLS OF QUALITY)
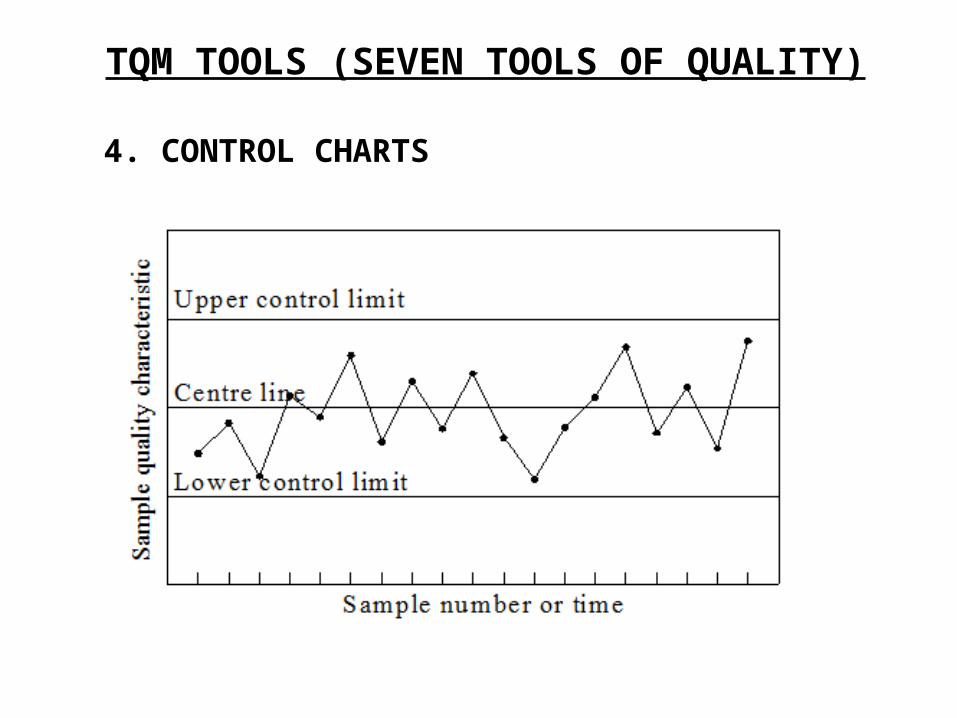
4. CONTROL CHARTS
TQM TOOLS (SEVEN TOOLS OF QUALITY)
5. SCATTER DIAGRAM In scatter diagram, three types of co-relations exist.
Positive correlation.Negative correlation.No correlation.
6. PARETO DIAGRAM 7. FLOW DIAGRAM
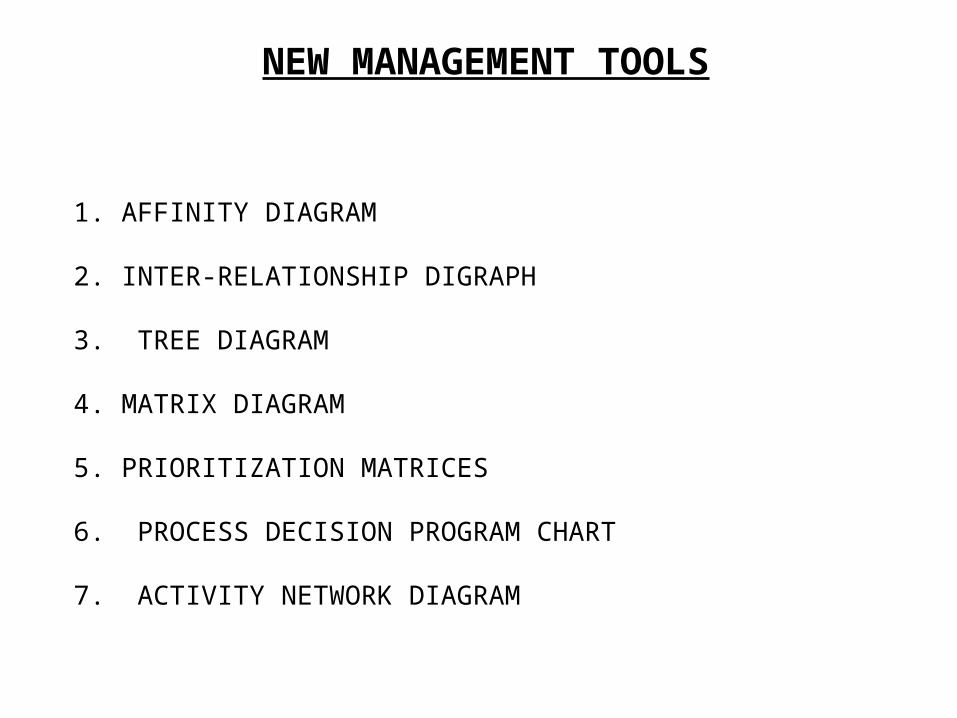
NEW MANAGEMENT TOOLS
1. AFFINITY DIAGRAM
2. INTER-RELATIONSHIP DIGRAPH
3. TREE DIAGRAM
4. MATRIX DIAGRAM
5. PRIORITIZATION MATRICES
6. PROCESS DECISION PROGRAM CHART
7. ACTIVITY NETWORK DIAGRAM
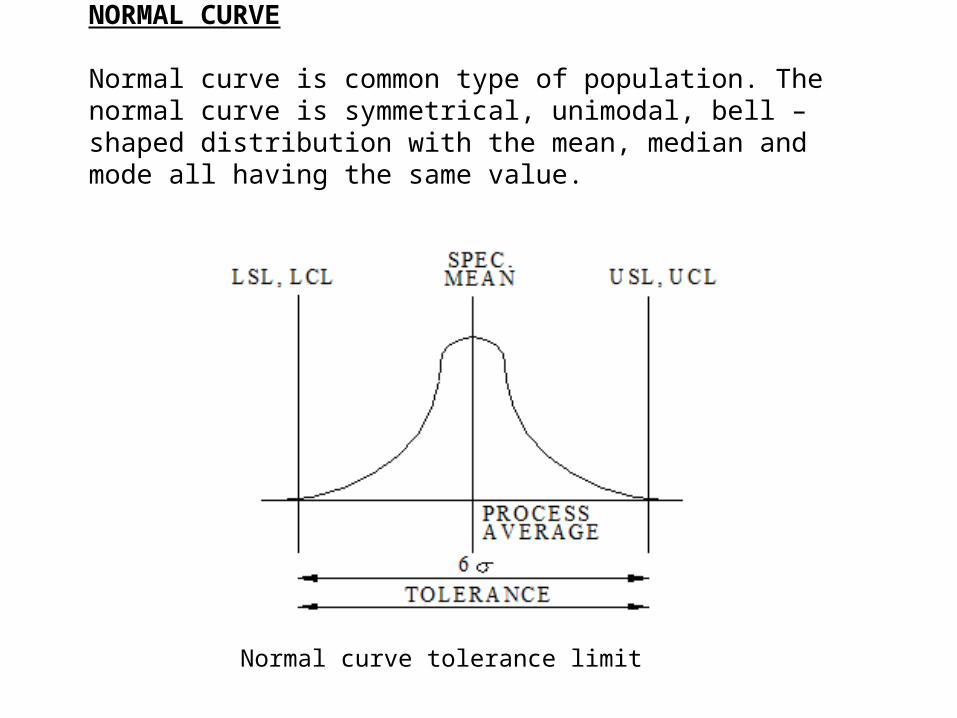
NORMAL CURVE Normal curve is common type of population. The normal curve is symmetrical, unimodal, bell – shaped distribution with the mean, median and mode all having the same value.
Normal curve tolerance limit
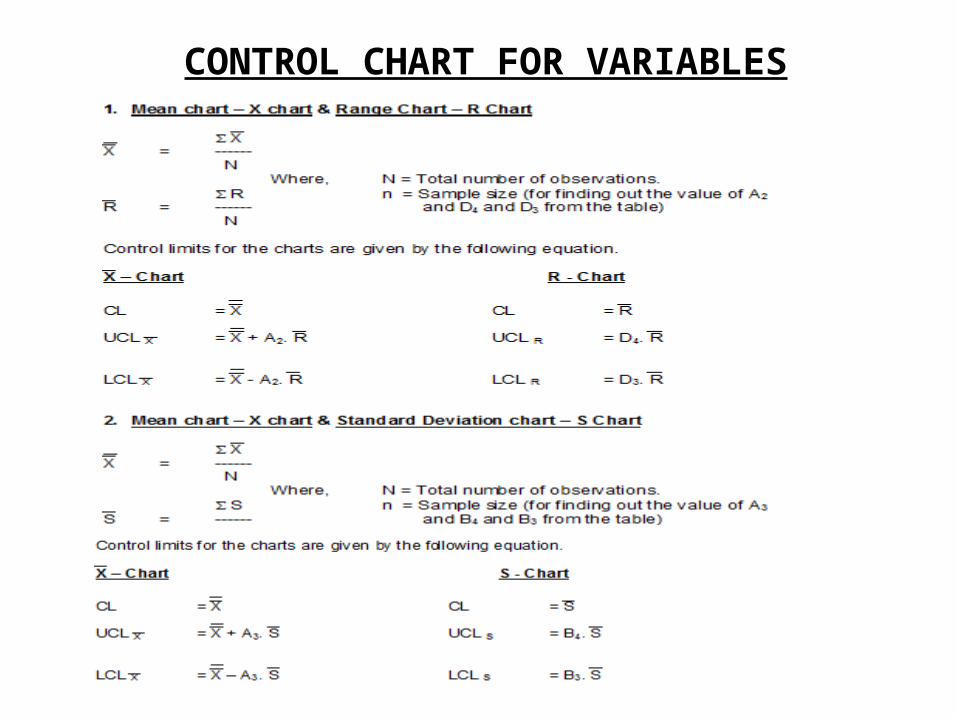
CONTROL CHART FOR VARIABLES
QUALITY FUNCTION DEPLOYMENT
Quality Function Deployment is a planning tool used to fulfill customer expectations. Quality Function Deployment focuses on customer expectations or requirements, often referred to as voice of the customer. QFD TEAM : There are two types of teams namely 1. Team for designing a new product 2. Team for improving an existing product
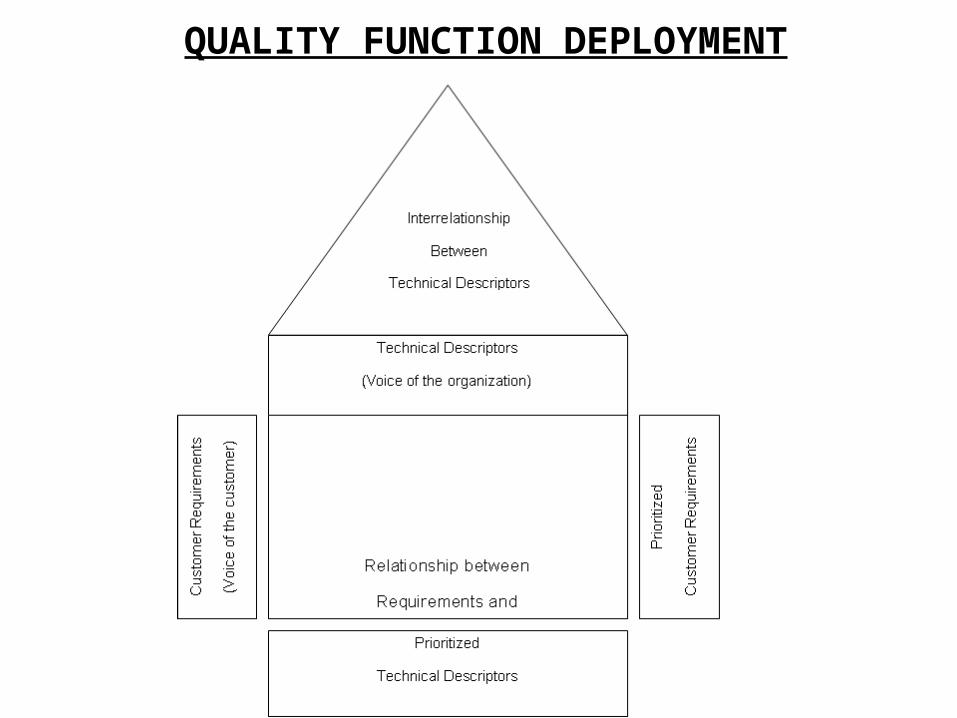
QUALITY FUNCTION DEPLOYMENT
QUALITY FUNCTION DEPLOYMENT
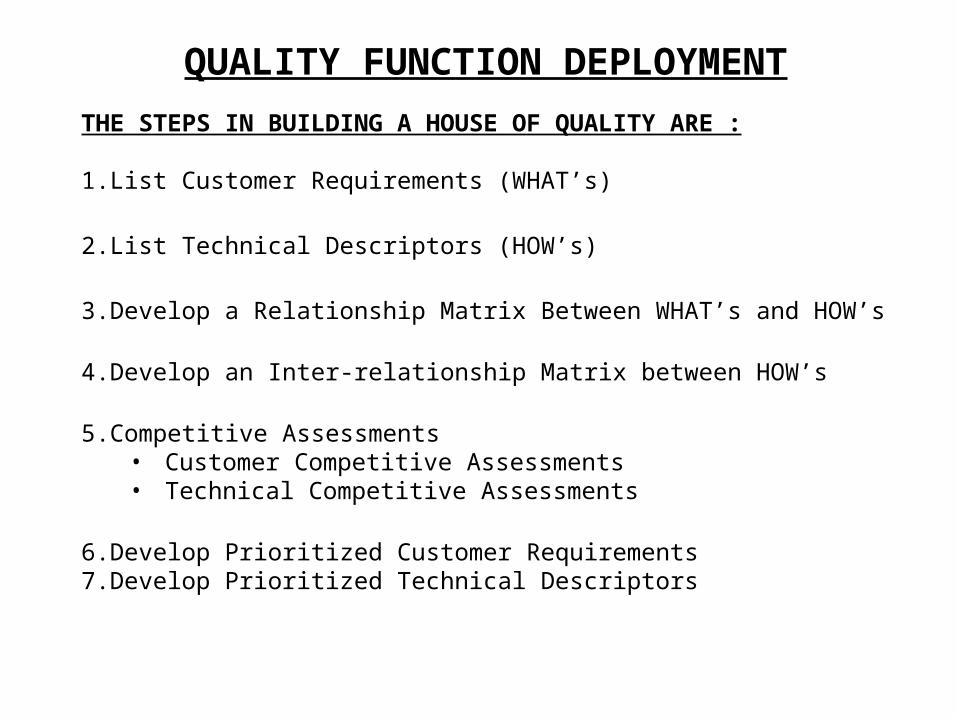
THE STEPS IN BUILDING A HOUSE OF QUALITY ARE : 1.List Customer Requirements (WHAT’s)
2.List Technical Descriptors (HOW’s)
3.Develop a Relationship Matrix Between WHAT’s and HOW’s
4.Develop an Inter-relationship Matrix between HOW’s
5.Competitive Assessments• Customer Competitive Assessments• Technical Competitive Assessments
6.Develop Prioritized Customer Requirements7.Develop Prioritized Technical Descriptors
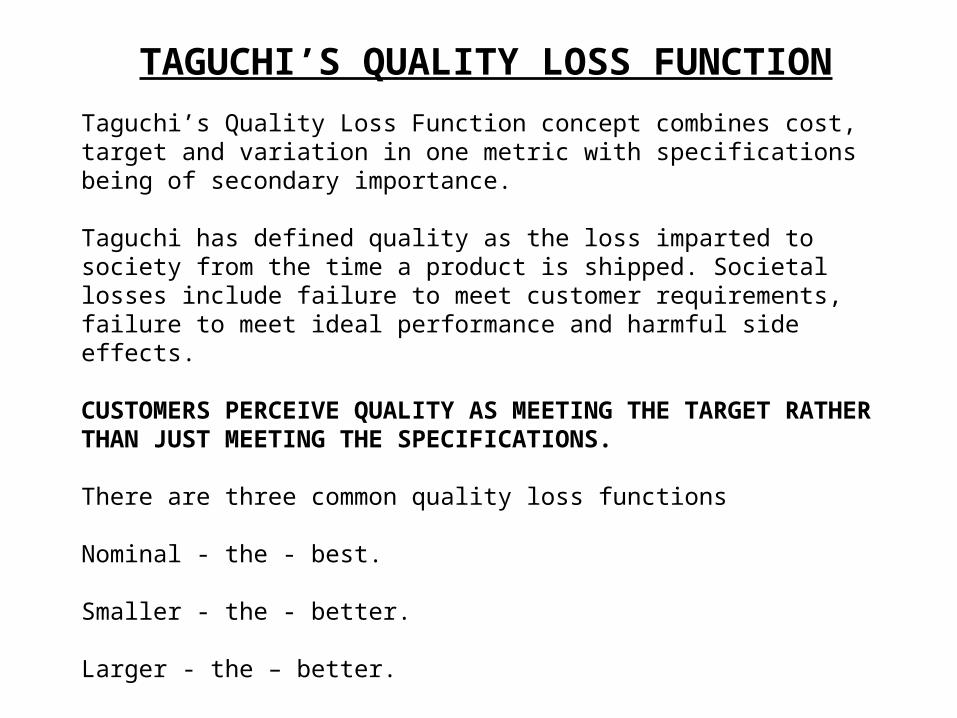
TAGUCHI’S QUALITY LOSS FUNCTION
Taguchi’s Quality Loss Function concept combines cost, target and variation in one metric with specifications being of secondary importance. Taguchi has defined quality as the loss imparted to society from the time a product is shipped. Societal losses include failure to meet customer requirements, failure to meet ideal performance and harmful side effects. CUSTOMERS PERCEIVE QUALITY AS MEETING THE TARGET RATHER THAN JUST MEETING THE SPECIFICATIONS. There are three common quality loss functions Nominal - the - best. Smaller - the - better. Larger - the – better.
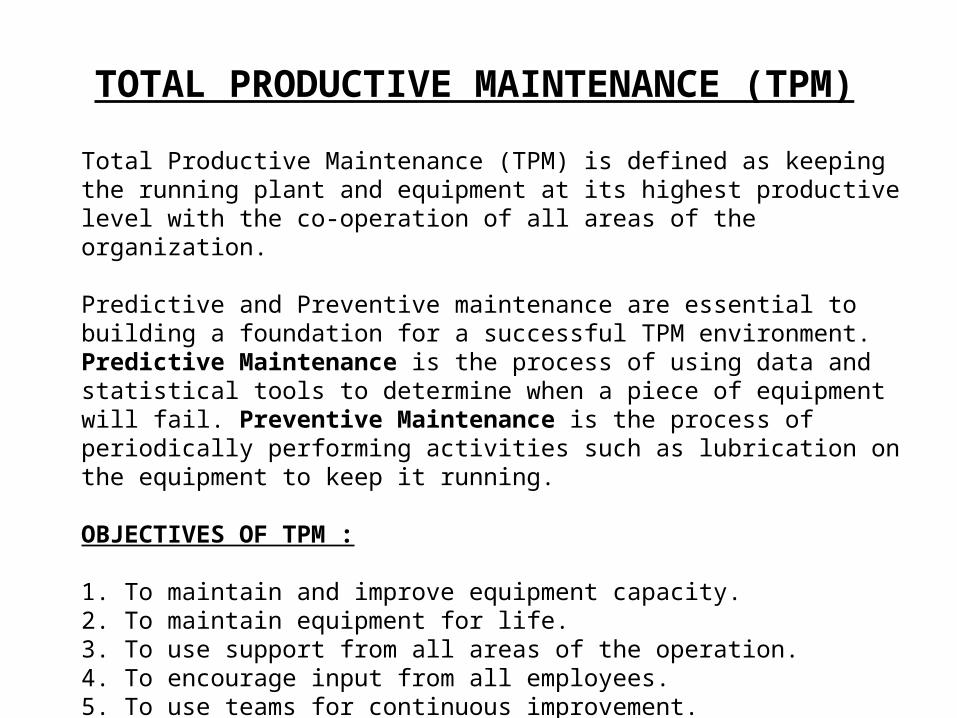
TOTAL PRODUCTIVE MAINTENANCE (TPM))
Total Productive Maintenance (TPM) is defined as keeping the running plant and equipment at its highest productive level with the co-operation of all areas of the organization.
Predictive and Preventive maintenance are essential to building a foundation for a successful TPM environment. Predictive Maintenance is the process of using data and statistical tools to determine when a piece of equipment will fail. Preventive Maintenance is the process of periodically performing activities such as lubrication on the equipment to keep it running. OBJECTIVES OF TPM : 1. To maintain and improve equipment capacity.2. To maintain equipment for life.3. To use support from all areas of the operation.4. To encourage input from all employees.5. To use teams for continuous improvement.
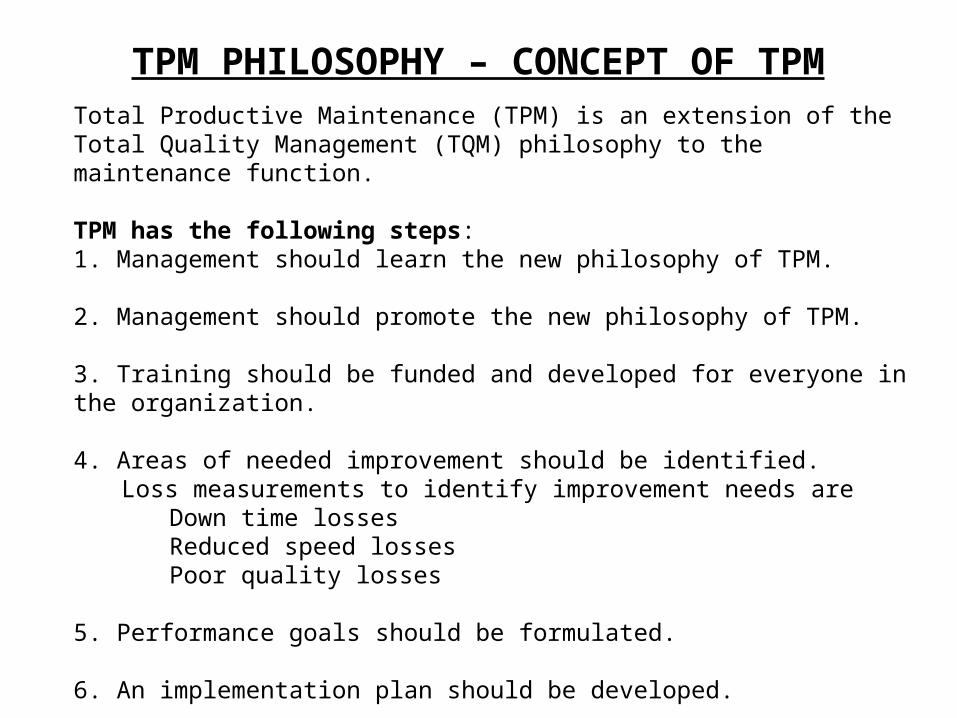
TPM PHILOSOPHY – CONCEPT OF TPMTotal Productive Maintenance (TPM) is an extension of the Total Quality Management (TQM) philosophy to the maintenance function. TPM has the following steps: 1. Management should learn the new philosophy of TPM. 2. Management should promote the new philosophy of TPM. 3. Training should be funded and developed for everyone in the organization. 4. Areas of needed improvement should be identified. Loss measurements to identify improvement needs are Down time losses
Reduced speed lossesPoor quality losses
5. Performance goals should be formulated. 6. An implementation plan should be developed. 7. Autonomous worth groups should be established.
ISO 9000 STANDARDS
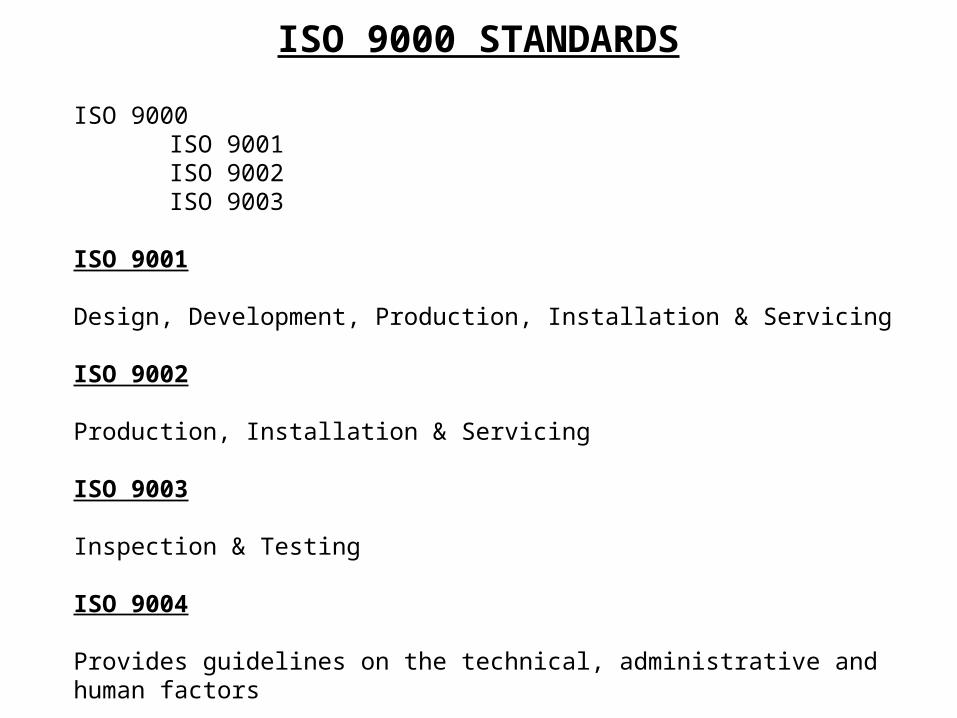
ISO 9000ISO 9001ISO 9002ISO 9003
ISO 9001 Design, Development, Production, Installation & Servicing ISO 9002 Production, Installation & Servicing ISO 9003 Inspection & Testing ISO 9004 Provides guidelines on the technical, administrative and human factors
ISO 9000 STANDARDS
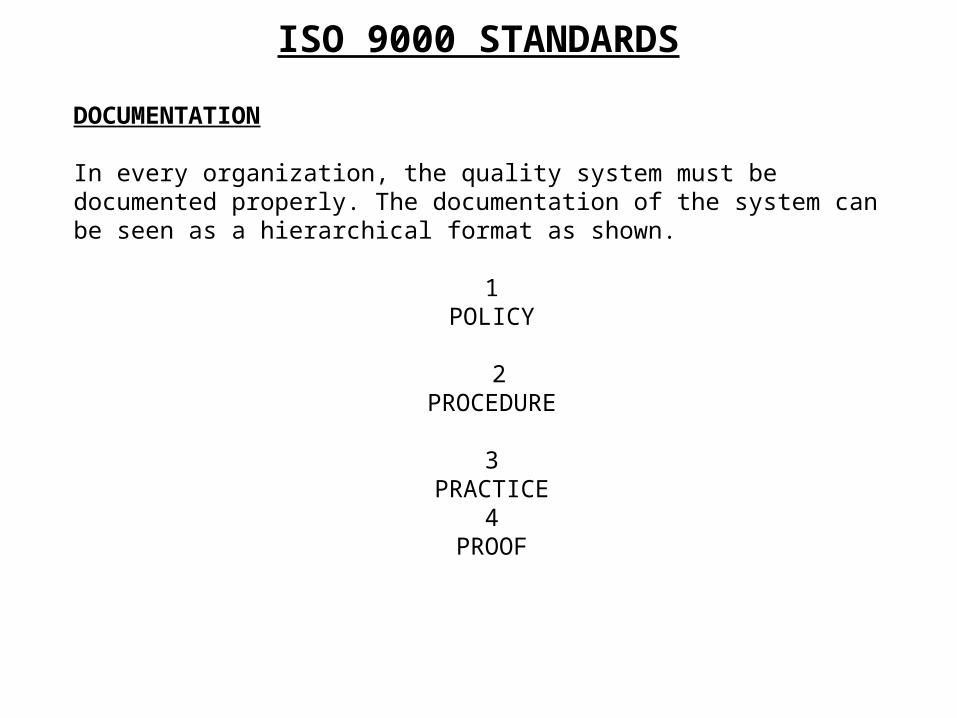
DOCUMENTATION In every organization, the quality system must be documented properly. The documentation of the system can be seen as a hierarchical format as shown.
1POLICY
2
PROCEDURE 3
PRACTICE4
PROOF
QUALITY AUDITING
The term Audit refers to a regular examination and checking of accounts or financial records, settlement or adjustment of accounts. It also refers to checking, inspection and examination of Production Processes.
PURPOSE OF QUALITY AUDIT : To establish the adequacy of the system.To determine the effectiveness of the system.To afford opportunities for system analysis.To help in problem solving.To make decision making easier etc.
QUALITY AUDITING TYPES OF QUALITY AUDIT : First – Party Audit.Second – Party Audit.Third – Party Audit. Quality audit can also be classified on the basis of the area taken into account for the audit such as System Audit.Process Audit.Product Audit.Adequacy Audit.Compliance Audit.
Six Sigma
• A term (Greek) used in statistics to representstandard deviation from mean value, an indicator of the degree of variation in a set of a process.
• Sigma measures how far a given process deviates from perfection. Higher sigma capability, better performance
• Six Sigma is a disciplined, data-driven approach and methodology for eliminating defects in any process -- from manufacturing to transactional and from product to service.
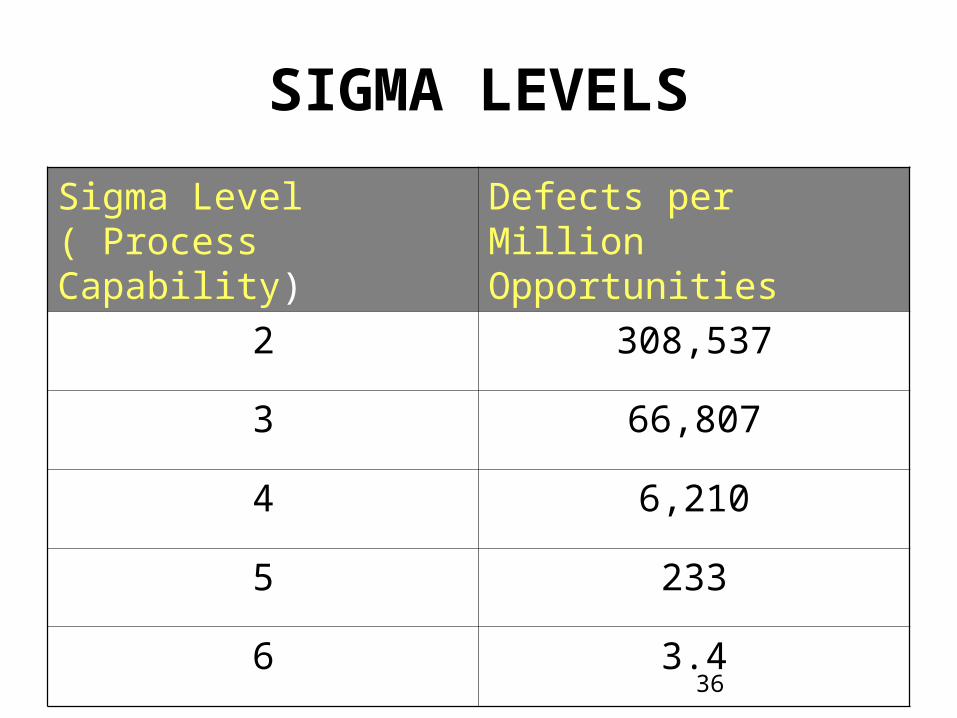
• To achieve Six Sigma, a process must not produce more than 3.4 defects per million opportunities.
• A Six Sigma opportunity is then the total quantity of chances for a defect.
Six Sigma
This is accomplished through the use of two Six Sigma sub-methodologies: DMAIC and DMADV.
• The Six Sigma DMAIC process (define, measure, analyze, improve, control) is an improvement system for existing processes falling below specification and looking for incremental improvement.
• The Six Sigma DMADV process (define, measure, analyze, design, verify) is an improvement system used to develop new processes or products at Six Sigma quality levels.
• Both Six Sigma processes are executed by Six Sigma Green Belts and Six Sigma Black Belts, and are overseen by Six Sigma Master Black Belts.
Six Sigma DMAIC
DMAIC Define the project goals and customer (internal and external)
deliverables Measure the process to determine current performance Analyze and determine the root cause(s) of the defects Improve the process by eliminating defects Control future process performance
When To Use DMAICThe DMAIC methodology, instead of the DMADV methodology,
should be used when a product or process is in existence at your company but is not meeting customer specification or is not performing adequately.
36
SIGMA LEVELS
Sigma Level ( Process Capability)
Defects per Million Opportunities
2 308,537
3 66,807
4 6,210
5 233
6 3.4
• Generally defined as the ability of a product to perform as expected over time.
• Formally defined as the probability that a product, piece of equipment, or system will perform its intended function for a stated period of time under specified operating conditions.
• Means quality over the long run.
• A product that “works” for a long period of time is a reliable one.
• Since all units of a product will fail at different times, reliability is a probability.
ReliabilityReliability
Tests are based on one or more of the following characteristics:
• Mean life: the average life of the product.
• Failure rate: the percentage of failures per unit time or number of cycles.
• Hazard rate: the instantaneous failure rate at a specified time.
• Reliable life: the life beyond which some specified portion of the items in the lot will survive.
• Availability:It is a time-related factor that measures the ability of a product or service to perform its designated function.
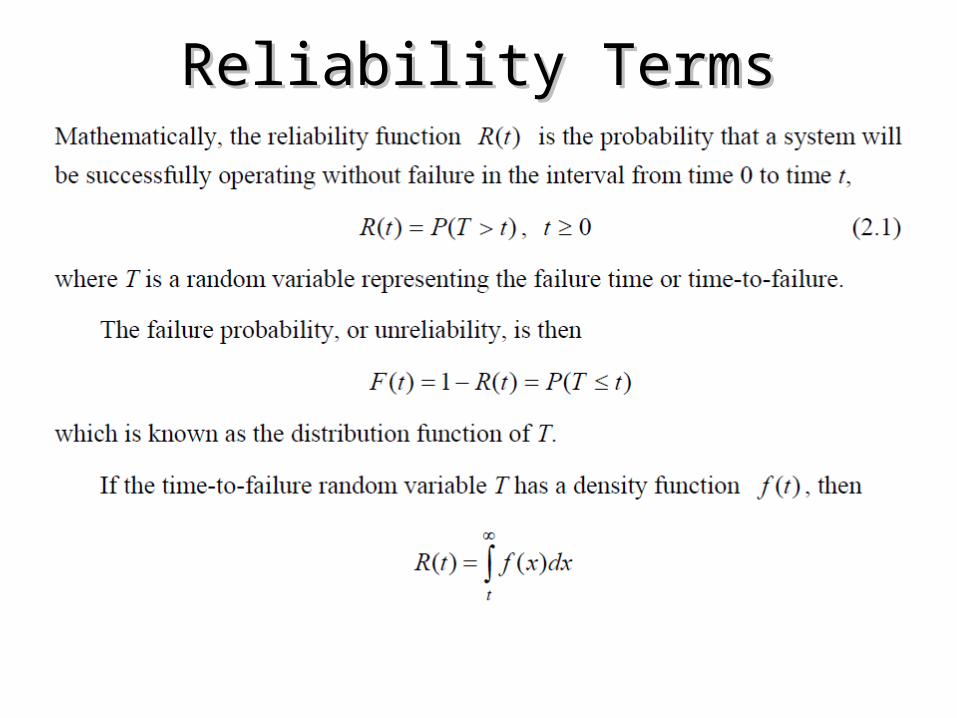
Reliability TermsReliability Terms
Reliability TermsReliability Terms

Reliability TermsReliability Terms
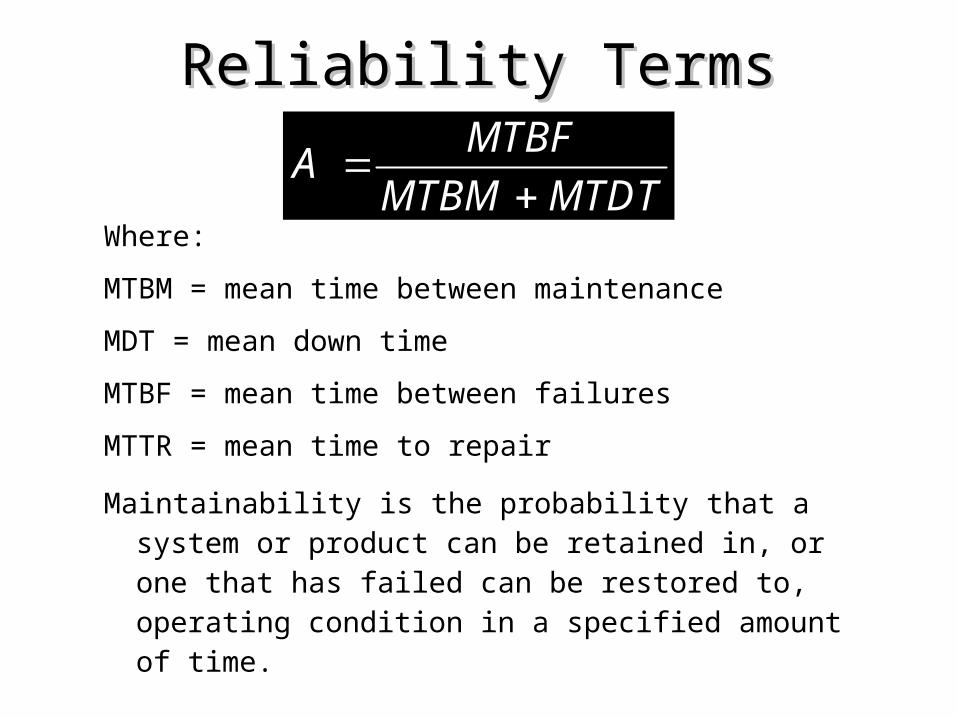
Where:
MTBM = mean time between maintenance
MDT = mean down time
MTBF = mean time between failures
MTTR = mean time to repair
Maintainability is the probability that a system or product can be retained in, or one that has failed can be restored to, operating condition in a specified amount of time.
Reliability TermsReliability TermsMTBF
AMTBM MTDT
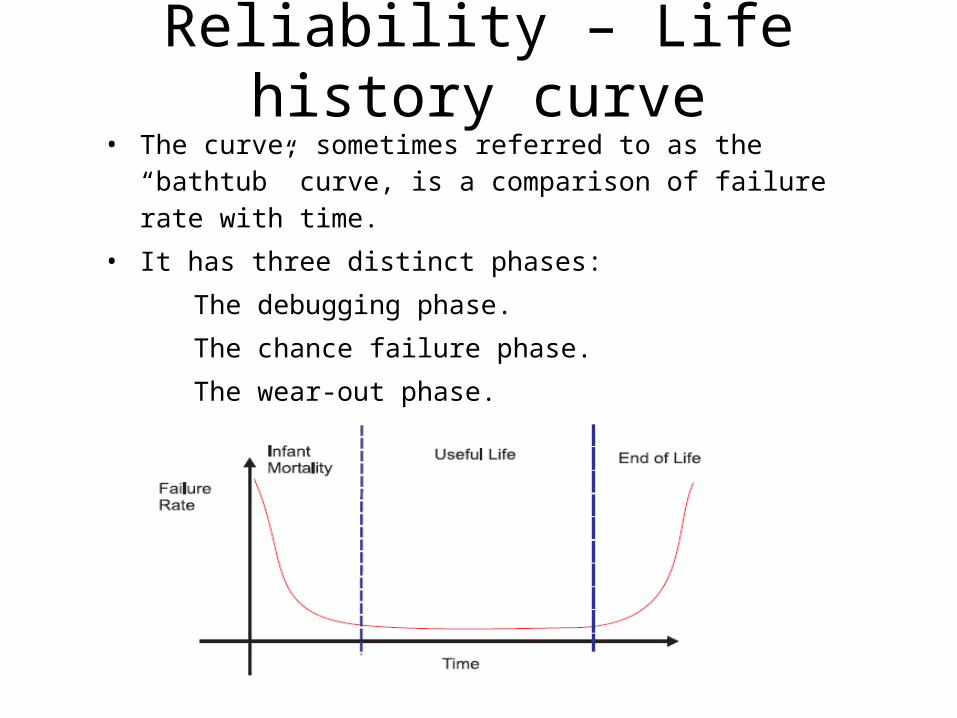
Reliability – Life history curve• The curve, sometimes referred to as the “bathtub”
curve, is a comparison of failure rate with time.
• It has three distinct phases:
The debugging phase.
The chance failure phase.
The wear-out phase.
•As products become more complex (have more components), the chance that they will not function increases.
•The method of arranging the components affects the reliability of the entire system.
•Components can be arranged in series, parallel, or a combination.
System ReliabilitySystem Reliability
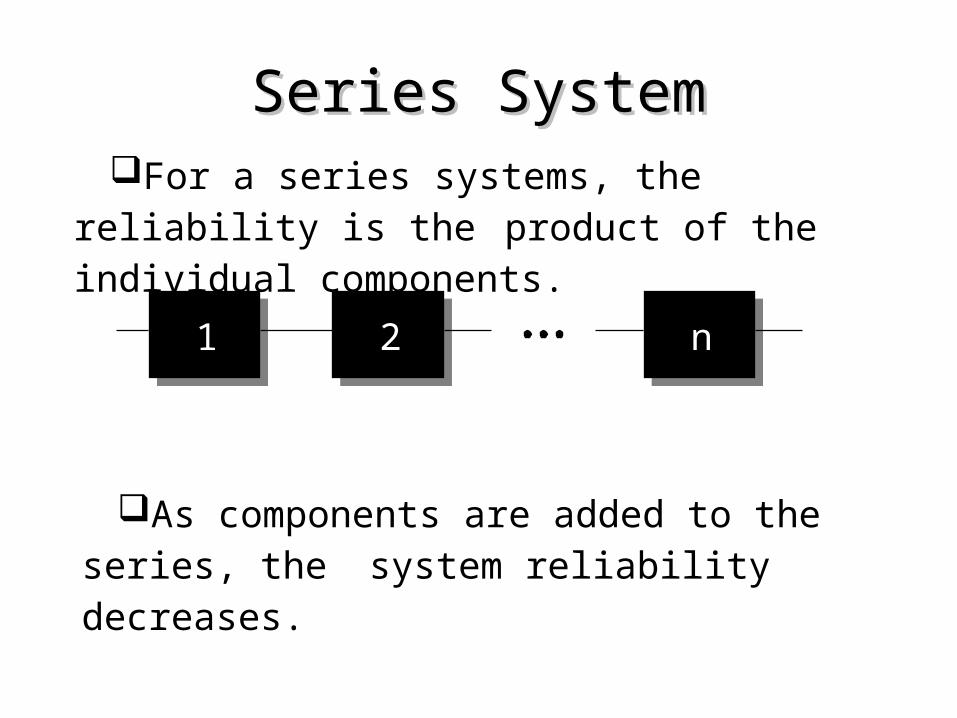
RS = R1 R2 ... Rn
1 2 n
For a series systems, the reliability is the product of the individual components.
As components are added to the series, the system reliability decreases.
Series SystemSeries System
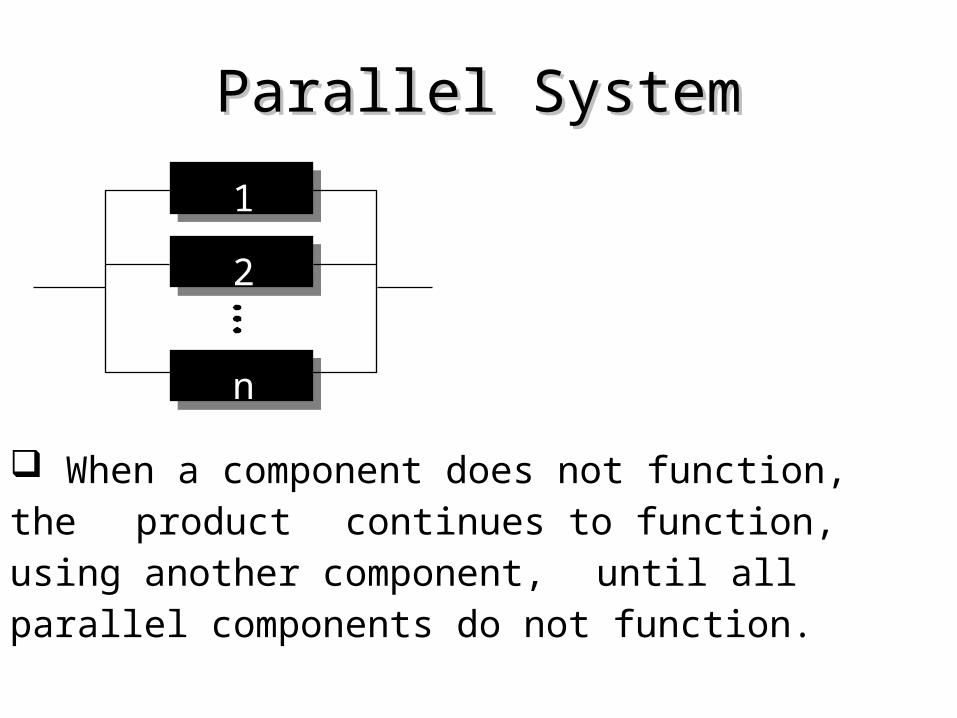
Rs = 1 - (1 - R1) (1 - R2)... (1 - Rn)
1
2
n
When a component does not function, the product continues to function, using another component, until all parallel components do not function.
Parallel SystemParallel System
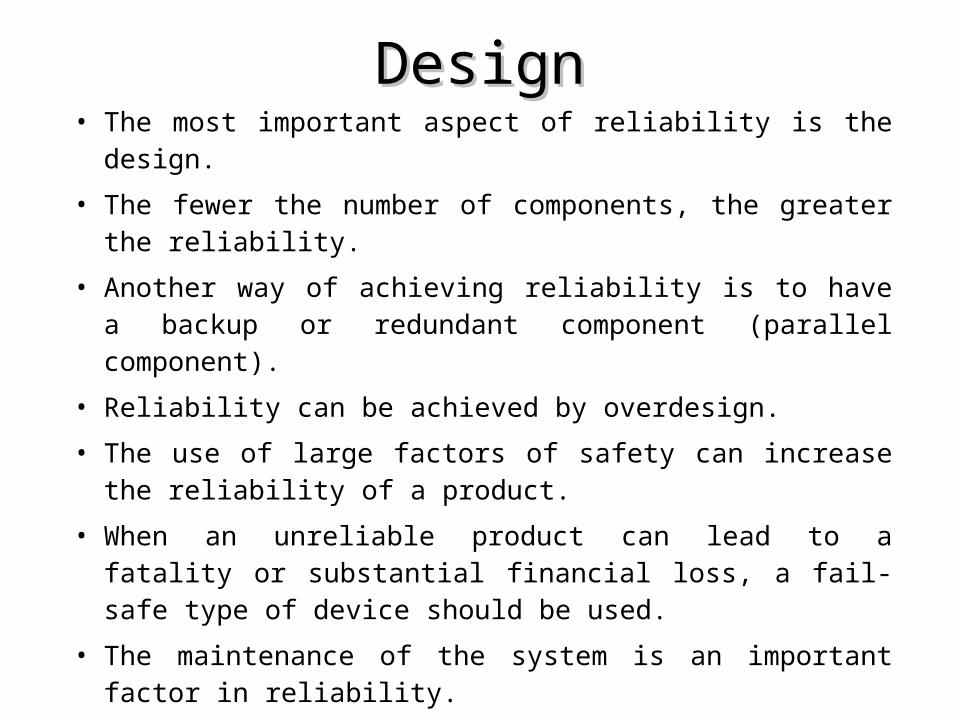
• The most important aspect of reliability is the design.
• The fewer the number of components, the greater the reliability.
• Another way of achieving reliability is to have a backup or redundant component (parallel component).
• Reliability can be achieved by overdesign.
• The use of large factors of safety can increase the reliability of a product.
• When an unreliable product can lead to a fatality or substantial financial loss, a fail-safe type of device should be used.
• The maintenance of the system is an important factor in reliability.
DesignDesign
Distributions Applicable to Reliability:
• Exponential distribution.
• Normal distribution.
• Weibull distribution.
Reliability Curves:Reliability Curves:
• The curves as a function of time.The curves as a function of time.
Statistical AspectsStatistical Aspects
The Weibull distribution is usually used.
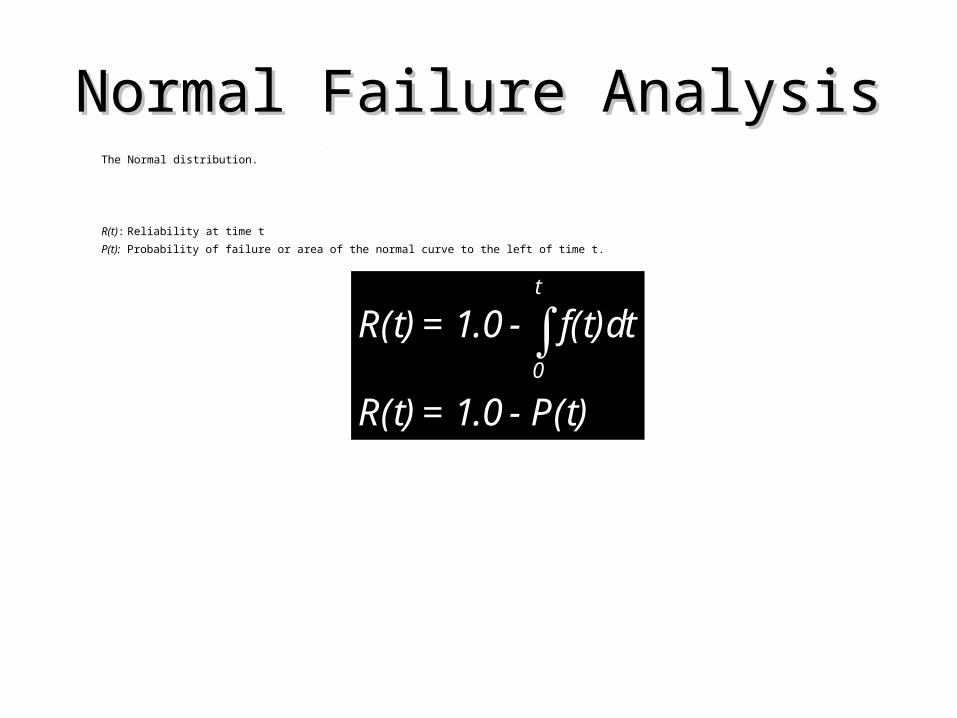
The Normal distribution.
R(t): Reliability at time t
P(t): Probability of failure or area of the normal curve to the left of time t.
Normal Failure AnalysisNormal Failure Analysis
t
0
R(t)= 1.0 - f(t)dt
R(t)= 1.0 - P(t)
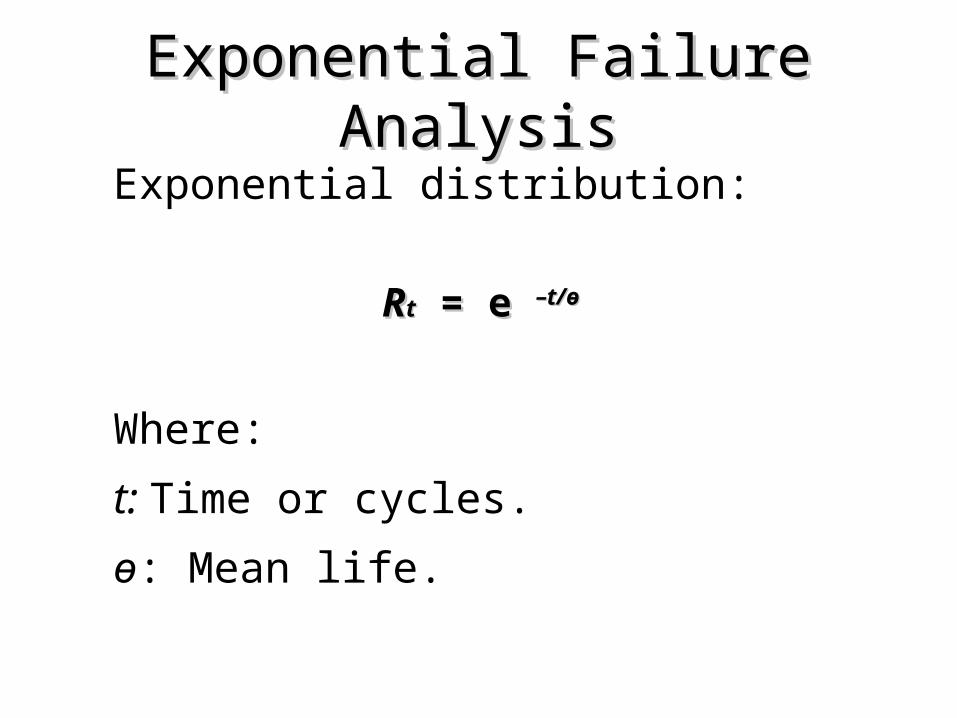
Exponential distribution:
RRtt = = e e –t/–t/өө
Where:
t: Time or cycles.
ө: Mean life.
Exponential Failure AnalysisExponential Failure Analysis
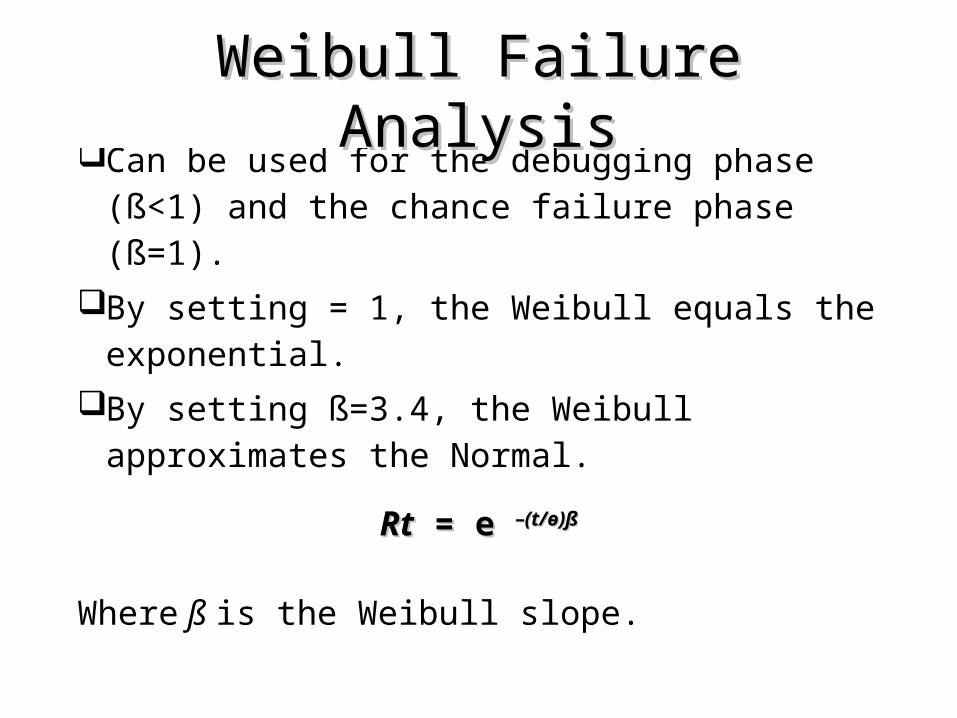
Can be used for the debugging phase (ß<1) and the chance failure phase (ß=1).
By setting = 1, the Weibull equals the exponential.
By setting ß=3.4, the Weibull approximates the Normal.
RtRt = = e e –(t/–(t/өө)ß)ß
Where ß is the Weibull slope.
Weibull Failure AnalysisWeibull Failure Analysis
Type of Tests:Failure-Terminated: These life-test sample
plans are terminated when a preassigned number of failures occurs to the sample.
Time-Terminated: This life-test sampling plan is terminated when the sample obtains a predetermined test time.
Life and Reliability Testing PlansLife and Reliability Testing Plans
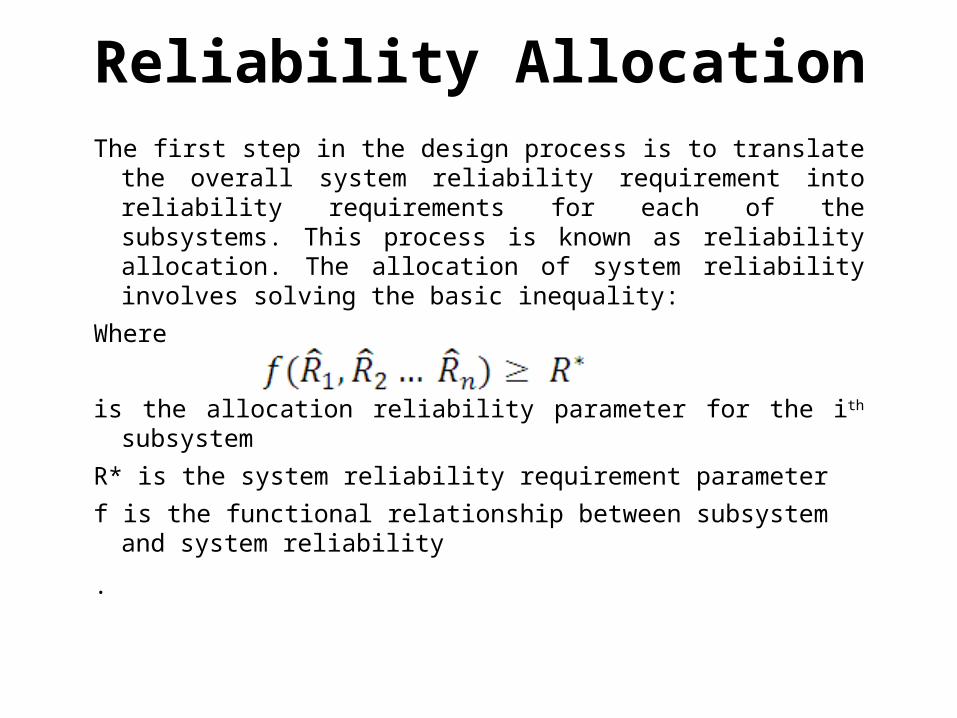
The first step in the design process is to translate the overall system reliability requirement into reliability requirements for each of the subsystems. This process is known as reliability allocation. The allocation of system reliability involves solving the basic inequality:
Where
is the allocation reliability parameter for the ith subsystem
R* is the system reliability requirement parameter
f is the functional relationship between subsystem and system reliability
.
Reliability Allocation

![VELTECH VEL MULTIMEDIA VEL HIGHTECH - · Web viewFind the heat loss per square meter and interface temperatures. [M.U. Oct. – 97] Given Inner temperature T1 = 900(C + 273 = 1173](https://img.pdfslide.net/doc/110x75/5aabf1507f8b9aa06a8c8547/veltech-vel-multimedia-vel-hightech-viewfind-the-heat-loss-per-square-meter.jpg)