Embed Size (px)
Citation preview
8/13/2019 Tourism in Iceland in Figures April 2013
http://slidepdf.com/reader/full/tourism-in-iceland-in-figures-april-2013 1/21
ICELANDIC
TOURIST
STOFA
BOARD
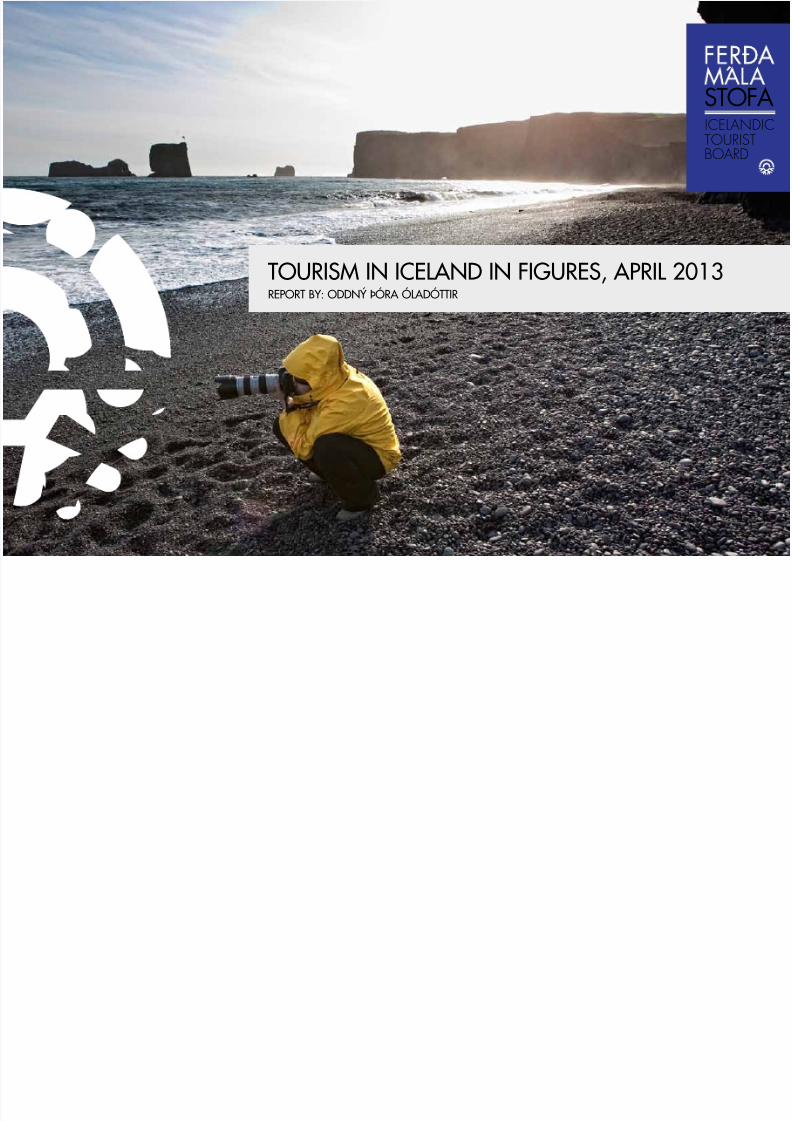
TOURISM IN ICELAND IN FIGURES, APRIL 2REPORT BY: ODDNÝ ÞÓRA ÓLADÓTTIR
8/13/2019 Tourism in Iceland in Figures April 2013
http://slidepdf.com/reader/full/tourism-in-iceland-in-figures-april-2013 2/21
1
TOURISM IN ICELAND IN FIGURES
CONTENTS Page
ECONOMIC STATISTICS IN ICELANDIC TOURISM 2
INTERNATIONAL VISITORS AND CRUISES 3
INTERNATIONAL VISITORS TO ICELAND 2010 –12 4
INTERNATIONAL VISITORS BY SEASON 5
NATIONALITIES THROUGH KEFL V K 2012/2011 6
DEPARTURES FROM KEFLAV K AIRPORT 2012 7
OVERNIGHT STAYS – ALL TYPES OFACCOMMODATION
8
OVERNIGHT STAYS IN HOTELS / GUESTHOUSES 9
INTERNATIONAL VISITORS IN ICELAND 2011 –12 10 –15
TRAVELS OF ICELANDERS 2012/2011 16 –20
8/13/2019 Tourism in Iceland in Figures April 2013
http://slidepdf.com/reader/full/tourism-in-iceland-in-figures-april-2013 3/21
2
ECONOMIC STATISTICS IN ICELANDIC TOURISMTHE SHARE OF TOURISM IN ICELAND’S GDPIn 2010, the share of tourism in Iceland’s GDP was 6%, having been
between 4.4 –6.0% since 2000.
THE SHARE OF TOURISM IN EXPORT REVENUETourism’s share in 200 9 –2012 was between 18.8% and 23.5%according to measurements of the export of goods and services.
Export of goods andservices (ISK billions)
Tourism(ISK billions) Share of tourism
2009 791,296 155,160 19.6%2010 865,449 162,649 18.8%
2011 964,396 196,324 20.4%2012 1,010,744 237,707 23.5%
TAXES ON TOURISMGoods and service taxes from tourism-related activities amountedapproximately 15bn in 2010.
TOURISM CONSUMPTION OF FOREIGN VISITORSForeign visitors paid approximately ISK 238bn to Icelandiccompanies in 2012 according to measurements of servicetransactions. The growth in spending was around 21% between2011 and 2012. When, however, account is taken of price changes,the real growth was approx. 14%. At fixed-price levels, the spendingof international visitors has increased by just under 30% from 2009to 2012. The above figures relate to international visitortransactions with Icelandic companies, both in Iceland and overseas.
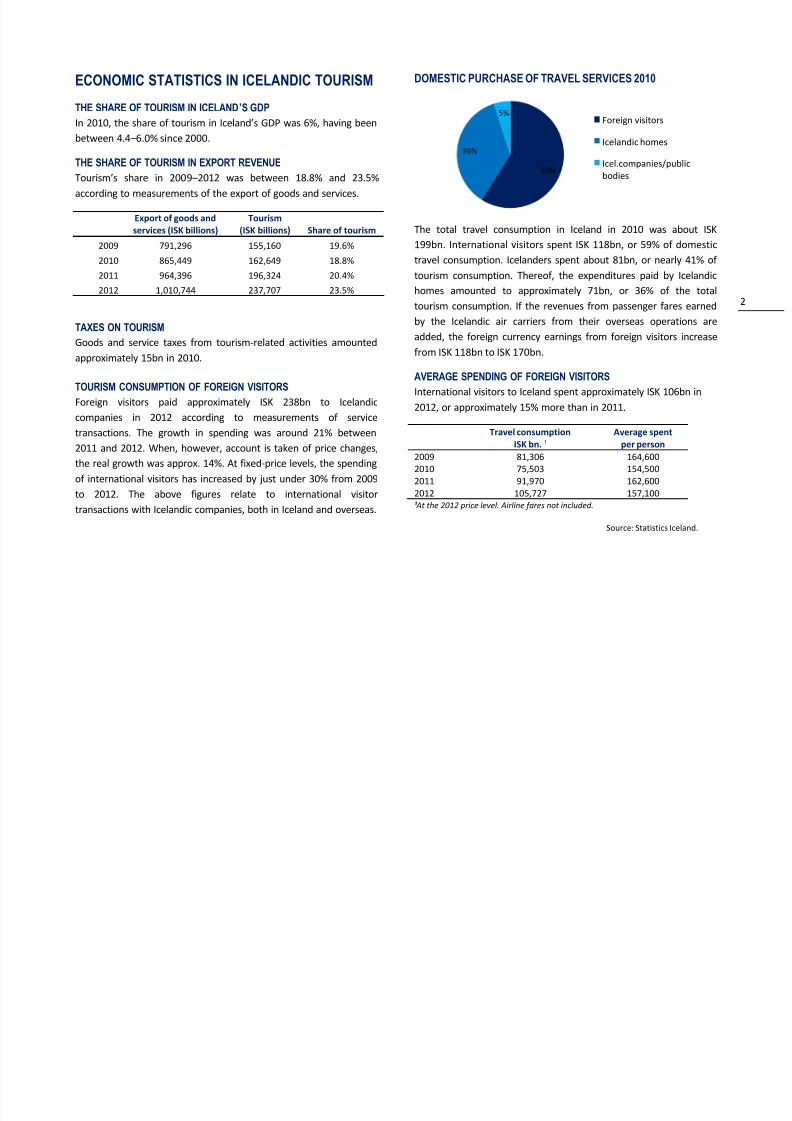
DOMESTIC PURCHASE OF TRAVEL SERVICES 2010
The total travel consumption in Iceland in 2010 was about ISK199bn. International visitors spent ISK 118bn, or 59% of domestictravel consumption. Icelanders spent about 81bn, or nearly 41% of
tourism consumption. Thereof, the expenditures paid by Icelandichomes amounted to approximately 71bn, or 36% of the totaltourism consumption. If the revenues from passenger fares earnedby the Icelandic air carriers from their overseas operations areadded, the foreign currency earnings from foreign visitors increasefrom ISK 118bn to ISK 170bn.
AVERAGE SPENDING OF FOREIGN VISITORSInternational visitors to Iceland spent approximately ISK 106bn in2012, or approximately 15% more than in 2011.
Travel consumptionISK bn. ¹
Average spentper person
2009201020112012
81,30675,50391,970105,727
164,600154,500162,600157,100
¹ At the 2012 price level. Airline fares not included.
Source: Statistics Iceland.
59%
36%
5%Foreign visitors
Icelandic homes
Icel.companies/publicbodies
8/13/2019 Tourism in Iceland in Figures April 2013
http://slidepdf.com/reader/full/tourism-in-iceland-in-figures-april-2013 4/21
3
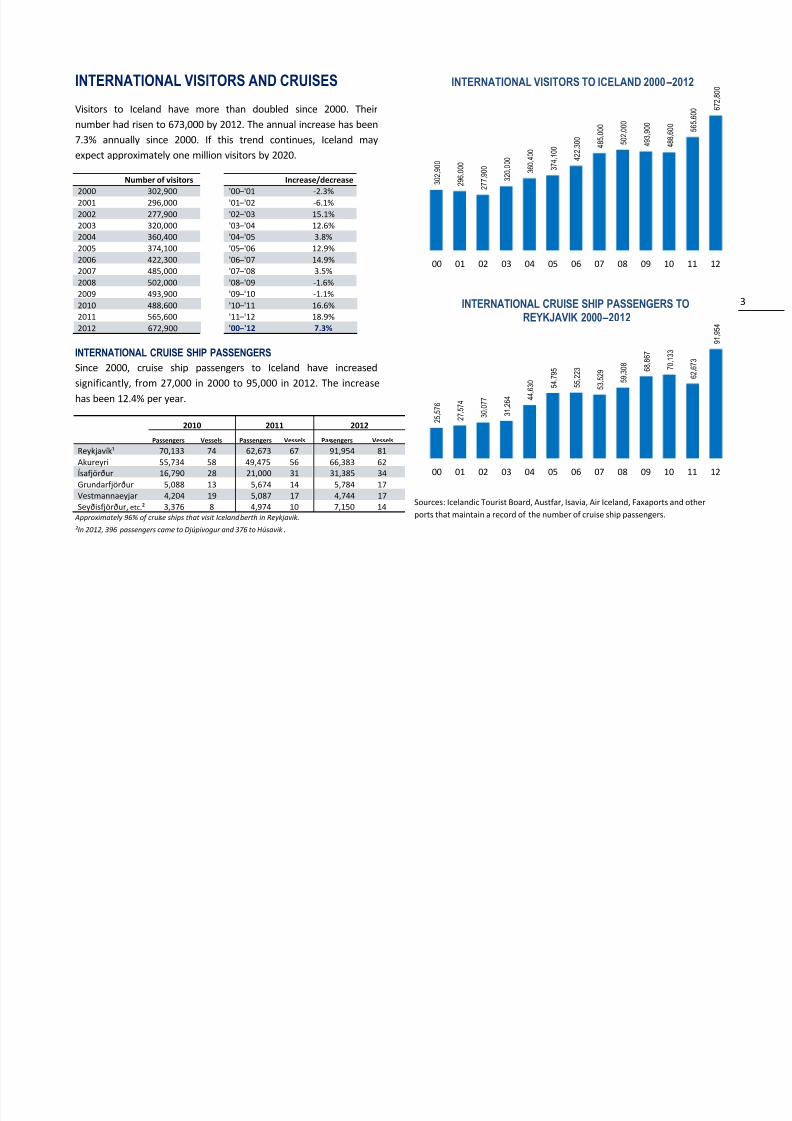
INTERNATIONAL VISITORS AND CRUISESVisitors to Iceland have more than doubled since 2000. Theirnumber had risen to 673,000 by 2012. The annual increase has been
7.3% annually since 2000. If this trend continues, Iceland mayexpect approximately one million visitors by 2020.
Number of visitors Increase/decrease2000 302,900 '00 – '01 -2.3%2001 296,000 '01 – '02 -6.1%2002 277,900 '02 – '03 15.1%2003 320,000 '03 – '04 12.6%2004 360,400 '04 – '05 3.8%2005 374,100 '05 – '06 12.9%2006 422,300 '06 – '07 14.9%2007 485,000 '07 – '08 3.5%2008 502,000 '08 – '09 -1.6%2009 493,900 '09 – '10 -1.1%2010 488,600 '10 – '11 16.6%2011 565,600 '11 – '12 18.9%2012 672,900 '00 –'12 7.3%
INTERNATIONAL CRUISE SHIP PASSENGERSSince 2000, cruise ship passengers to Iceland have increasedsignificantly, from 27,000 in 2000 to 95,000 in 2012. The increasehas been 12.4% per year.
2010 2011 2012
Passengers Vessels Passengers Vessels Passengers Vessels
Reykjavík¹ 70,133 74 62,673 67 91,954 81Akureyri 55,734 58 49,475 56 66,383 62Ísafjörður 16,790 28 21,000 31 31,385 34Grundarfjörður 5,088 13 5,674 14 5,784 17Vestmannaeyjar 4,204 19 5,087 17 4,744 17Seyðisfjörður,etc.² 3,376 8 4,974 10 7,150 14
Approximately 96% of cruise ships that visit Iceland berth in Reykjavik.
²In 2012, 396 passengers came to Djúpivogur and 376 to Húsavik .
Sources: Icelandic Tourist Board, Austfar, Isavia, Air Iceland, Faxaports and otherports that maintain a record of the number of cruise ship passengers.
3 0 2
, 9 0 0
2 9 6
, 0 0 0
2 7 7
, 9 0 0
3 2 0
, 0 0 0
3 6 0
, 4 0 0
3 7 4
, 1 0 0
4 2 2
, 3 0 0
4 8 5
, 0 0 0
5 0 2
, 0 0 0
4 9 3
, 9 0 0
4 8 8
, 6 0 0
5 6 5
, 6 0 0
6 7 2
, 8 0 0
00 01 02 03 04 05 06 07 08 09 10 11 12
INTERNATIONAL VISITORS TO ICELAND 2000 –2012
2 5 , 5 7 6
2 7
, 5 7 4
3 0
, 0 7 7
3 1
, 2 6 4
4 4
, 6 3 0
5 4
, 7 9 5
5 5
, 2 2 3
5 3
, 5 2 9
5 9
, 3 0 8
6 8
, 8 6 7
7 0
, 1 3 3
6 2
, 6 7 3
9 1
, 9 5 4
00 01 02 03 04 05 06 07 08 09 10 11 12
INTERNATIONAL CRUISE SHIP PASSENGERS TOREYKJAVIK 2000 –2012
8/13/2019 Tourism in Iceland in Figures April 2013
http://slidepdf.com/reader/full/tourism-in-iceland-in-figures-april-2013 5/21
4
INTERNATIONAL VISITORS TO ICELAND 2010 –12
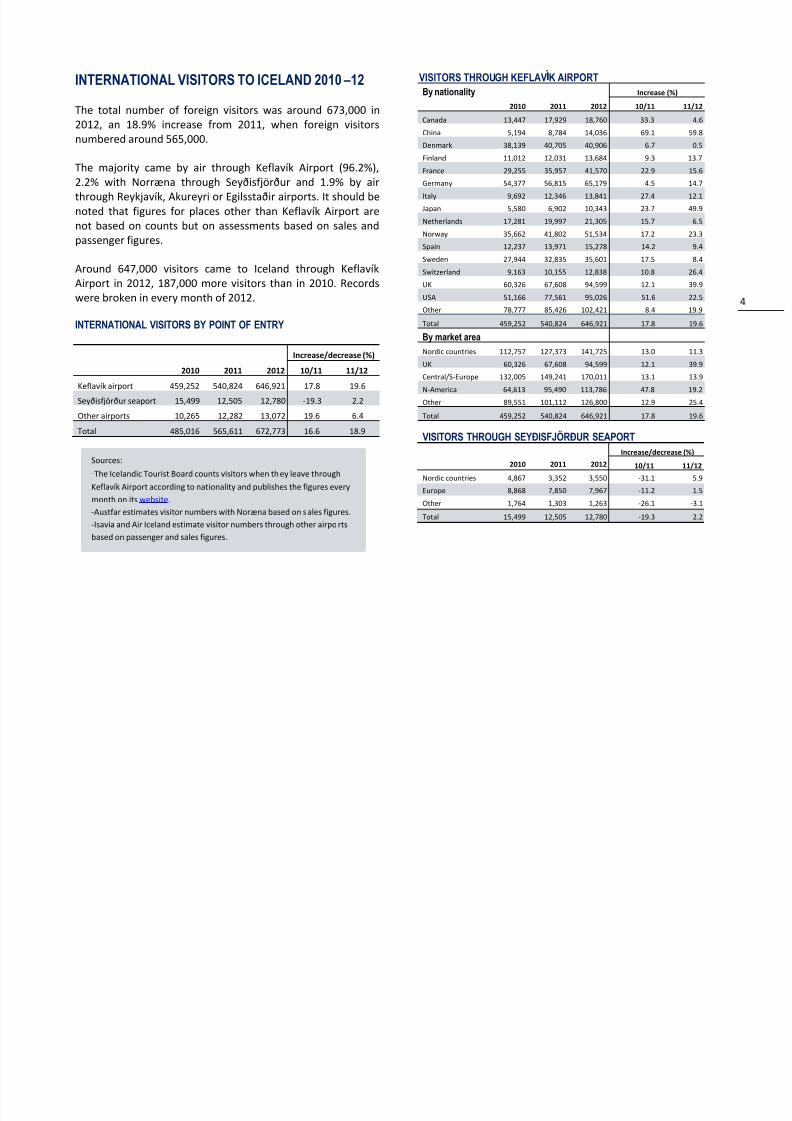
The total number of foreign visitors was around 673,000 in2012, an 18.9% increase from 2011, when foreign visitors
numbered around 565,000.
The majority came by air through Keflavík Airport (96.2%),2.2% with Norræna through Seyðisfjörður and 1.9% by airthrough Reykjavík, Akureyri or Egilsstaðir airports. It should benoted that figures for places other than Keflavík Airport arenot based on counts but on assessments based on sales andpassenger figures.
Around 647,000 visitors came to Iceland through KeflavíkAirport in 2012, 187,000 more visitors than in 2010. Recordswere broken in every month of 2012.
INTERNATIONAL VISITORS BY POINT OF ENTRY
Increase/decrease (%)
2010 2011 2012 10/11 11/12
Keflavík airport 459,252 540,824 646,921 17.8 19.6
Seyðisfjörður seaport 15,499 12,505 12,780 -19.3 2.2
Other airports 10,265 12,282 13,072 19.6 6.4Total 485,016 565,611 672,773 16.6 18.9
VISITORS THROUGH KEFLAV K AIRPORTBy nationality Increase (%)
2010 2011 2012 10/11 11/12
Canada 13,447 17,929 18,760 33.3 4.6China 5,194 8,784 14,036 69.1 59.8Denmark 38,139 40,705 40,906 6.7 0.5Finland 11,012 12,031 13,684 9.3 13.7France 29,255 35,957 41,570 22.9 15.6Germany 54,377 56,815 65,179 4.5 14.7Italy 9,692 12,346 13,841 27.4 12.1Japan 5,580 6,902 10,343 23.7 49.9Netherlands 17,281 19,997 21,305 15.7 6.5Norway 35,662 41,802 51,534 17.2 23.3Spain 12,237 13,971 15,278 14.2 9.4Sweden 27,944 32,835 35,601 17.5 8.4Switzerland 9,163 10,155 12,838 10.8 26.4UK 60,326 67,608 94,599 12.1 39.9USA 51,166 77,561 95,026 51.6 22.5Other 78,777 85,426 102,421 8.4 19.9
Total 459,252 540,824 646,921 17.8 19.6
By market area Nordic countries 112,757 127,373 141,725 13.0 11.3UK 60,326 67,608 94,599 12.1 39.9Central/S-Europe 132,005 149,241 170,011 13.1 13.9N-America 64,613 95,490 113,786 47.8 19.2Other 89,551 101,112 126,800 12.9 25.4
Total 459,252 540,824 646,921 17.8 19.6
VISITORS THROUGH SEYÐISFJÖRÐUR SEAPORT Increase/decrease (%)
2010 2011 2012 10/11 11/12
Nordic countries 4,867 3,352 3,550 -31.1 5.9Europe 8,868 7,850 7,967 -11.2 1.5Other 1,764 1,303 1,263 -26.1 -3.1
Total 15,499 12,505 12,780 -19.3 2.2
Sources:-The Icelandic Tourist Board counts visitors when they leave throughKeflavík Airport according to nationality and publishes the figures everymonth on its website . -Austfar estimates visitor numbers with Noræna based on sales figures.-Isavia and Air Iceland estimate visitor numbers through other airportsbased on passenger and sales figures.
8/13/2019 Tourism in Iceland in Figures April 2013
http://slidepdf.com/reader/full/tourism-in-iceland-in-figures-april-2013 6/21
5
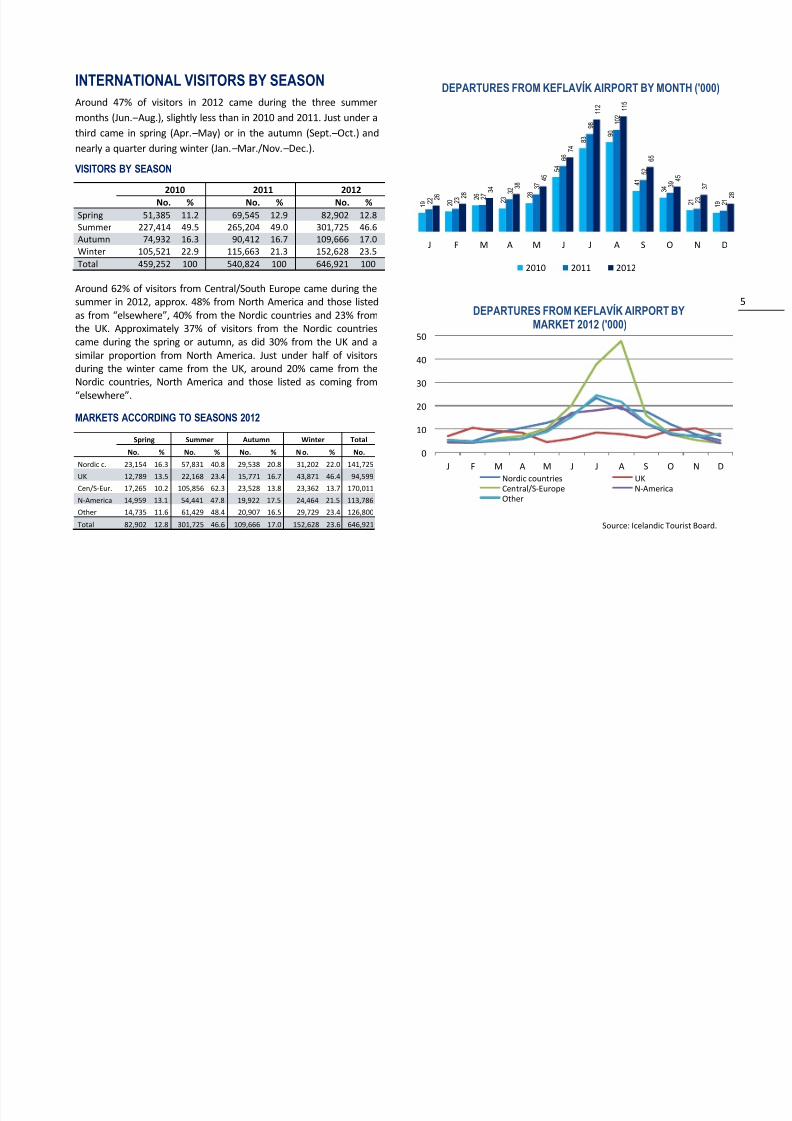
INTERNATIONAL VISITORS BY SEASONAround 47% of visitors in 2012 came during the three summermonths (Jun. –Aug.), slightly less than in 2010 and 2011. Just under athird came in spring (Apr. –May) or in the autumn (Sept. –Oct.) andnearly a quarter during winter (Jan. –Mar./Nov. –Dec.).
VISITORS BY SEASON
2010 2011 2012No. % No. % No. %
Spring 51,385 11.2 69,545 12.9 82,902 12.8Summer 227,414 49.5 265,204 49.0 301,725 46.6Autumn 74,932 16.3 90,412 16.7 109,666 17.0Winter 105,521 22.9 115,663 21.3 152,628 23.5Total 459,252 100 540,824 100 646,921 100
Around 62% of visitors from Central/South Europe came during thesummer in 2012, approx. 48% from North America and those listedas from “elsewhere”, 40% from the Nordic countries and 23% fromthe UK. Approximately 37% of visitors from the Nordic countriescame during the spring or autumn, as did 30% from the UK and asimilar proportion from North America. Just under half of visitorsduring the winter came from the UK, around 20% came from theNordic countries, North America and those listed as coming from“elsewhere”.
MARKETS ACCORDING TO SEASONS 2012Spring Summer Autumn Winter Total
No. % No. % No. % N o. % No.
Nordic c. 23,154 16.3 57,831 40.8 29,538 20.8 31,202 22.0 141,725UK 12,789 13.5 22,168 23.4 15,771 16.7 43,871 46.4 94,599Cen/S-Eur. 17,265 10.2 105,856 62.3 23,528 13.8 23,362 13.7 170,011N-America 14,959 13.1 54,441 47.8 19,922 17.5 24,464 21.5 113,786Other 14,735 11.6 61,429 48.4 20,907 16.5 29,729 23.4 126,800Total 82,902 12.8 301,725 46.6 109,666 17.0 152,628 23.6 646,921 Source: Icelandic Tourist Board.
1 9
2 0
2 6
2 3
2 8
5 4
8 3 9
0
4 1
3 4
2 1
1 9
2 2
2 3
2 7
3 2
3 7
6 6
9 8
1 0 2
5 2
3 9
2 3
2 1
2 6
2 8
3 4
3 8
4 5
7 4
1 1 2
1 1 5
6 5
4 5
3 7
2 8
J F M A M J J A S O N D
2010 2011 2012
DEPARTURES FROM KEFLAVÍK AIRPORT BY MONTH ('00
0
10
20
30
40
50
J F M A M J J A S O N DNordic countries UKCentral/S-Europe N-AmericaOther
DEPARTURES FROM KEFLAVÍK AIRPORT BYMARKET 2012 ('000)
8/13/2019 Tourism in Iceland in Figures April 2013
http://slidepdf.com/reader/full/tourism-in-iceland-in-figures-april-2013 7/21
6
NATIONALITIES THROUGHKEFLAVÍK AIRPORT 2012/11
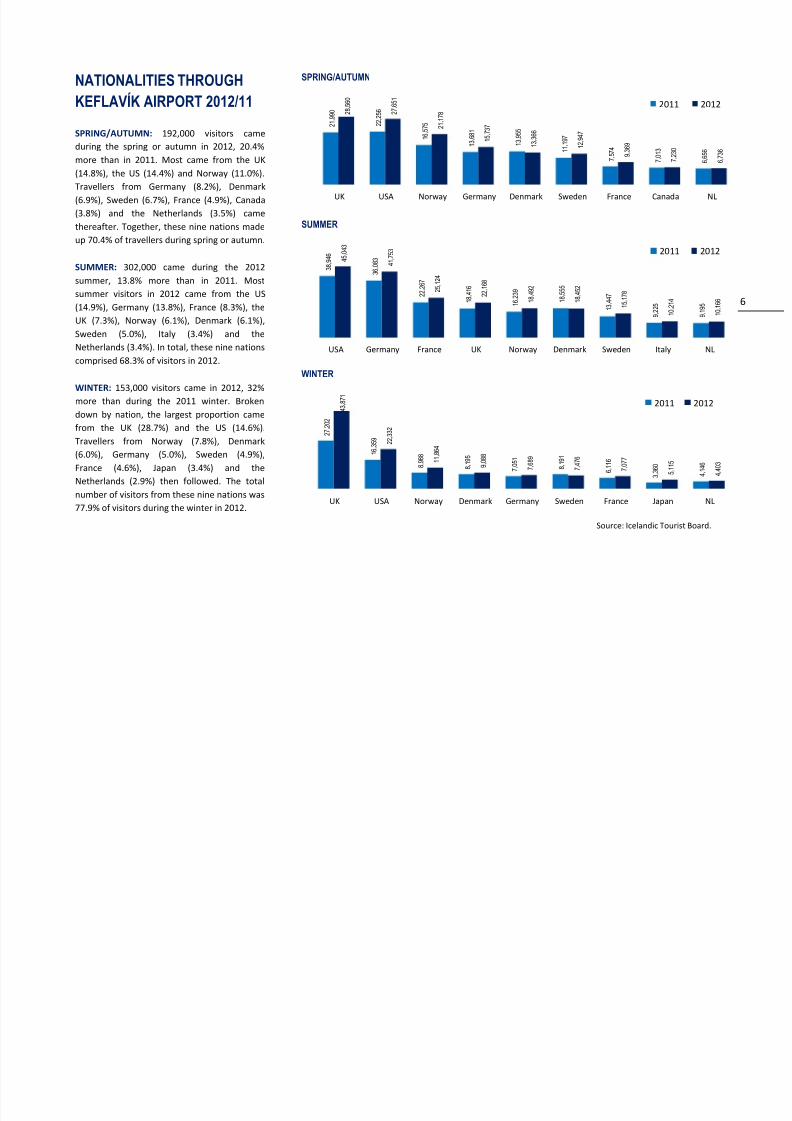
SPRING/AUTUMN: 192,000 visitors cameduring the spring or autumn in 2012, 20.4%more than in 2011. Most came from the UK(14.8%), the US (14.4%) and Norway (11.0%).Travellers from Germany (8.2%), Denmark(6.9%), Sweden (6.7%), France (4.9%), Canada(3.8%) and the Netherlands (3.5%) camethereafter. Together, these nine nations madeup 70.4% of travellers during spring or autumn.
SUMMER: 302,000 came during the 2012summer, 13.8% more than in 2011. Mostsummer visitors in 2012 came from the US(14.9%), Germany (13.8%), France (8.3%), theUK (7.3%), Norway (6.1%), Denmark (6.1%),Sweden (5.0%), Italy (3.4%) and theNetherlands (3.4%). In total, these nine nationscomprised 68.3% of visitors in 2012.
WINTER: 153,000 visitors came in 2012, 32%more than during the 2011 winter. Broken
down by nation, the largest proportion camefrom the UK (28.7%) and the US (14.6%).Travellers from Norway (7.8%), Denmark(6.0%), Germany (5.0%), Sweden (4.9%),France (4.6%), Japan (3.4%) and theNetherlands (2.9%) then followed. The totalnumber of visitors from these nine nations was77.9% of visitors during the winter in 2012.
SPRING/AUTUMN
SUMMER
WINTER
Source: Icelandic Tourist Board.
2 1
, 9 9 0
2 2
, 2 5 6
1
6 , 5
7 5
1 3
, 6
8 1
1 3 , 9 5 5
1 1
, 1 9 7
7 , 5
7 4
7 , 0
1 3
6 , 6
5 6
2 8
, 5 6 0
2 7
, 6 5 1
2 1
, 1 7 8
1 5
, 7 3 7
1 3
, 3
6 6
1 2
, 9 4 7
9 , 3
6 9
7 , 2
3 0
6 , 7
3 6
UK USA Norway Germany Denmark Sweden France Canada NL
2011 2012
3 8
, 9 4 6
3 6
, 0 8 3
2 2
, 2 6 7
1 8
, 4 1 6
1 6
, 2 3 9
1 8
, 5 5 5
1 3
, 4 4 7
9 , 2
2 5
9 , 1
9 5
4 5
, 0 4 3
4 1
, 7 5 3
2 5
, 1 2 4
2 2
, 1 6 8
1 8
, 4 9 2
1 8
, 4 5 2
1 5
, 1 7 8
1 0
, 2 1 4
1 0
, 1 6 6
USA Germany France UK Norway Denmark Sweden Italy NL
2011 2012
2 7
, 2 0 2
1 6
, 3 5 9
8 , 9
8 8
8 , 1
9 5
7 , 0
5 1
8 , 1
9 1
6 , 1
1 6
3 , 3
6 0
4 , 1
4 6
4 3
, 8 7 1
2 2
, 3 3 2
1 1
, 8 6 4
9 , 0
8 8
7 , 6
8 9
7 , 4
7 6
7 , 0
7 7
5 , 1
1 5
4 , 4
0 3
UK USA Norway Denmark Germany Sweden France Japan NL
2011 2012
8/13/2019 Tourism in Iceland in Figures April 2013
http://slidepdf.com/reader/full/tourism-in-iceland-in-figures-april-2013 8/21
7
DEPARTURES FROM KEFLAVÍK AIRPORT 2012By nationality By season* By month
Total Spring Summer Autumn Winter Jan Feb Mar Apr May Jun Jul Aug Sep Oct Nov Dec
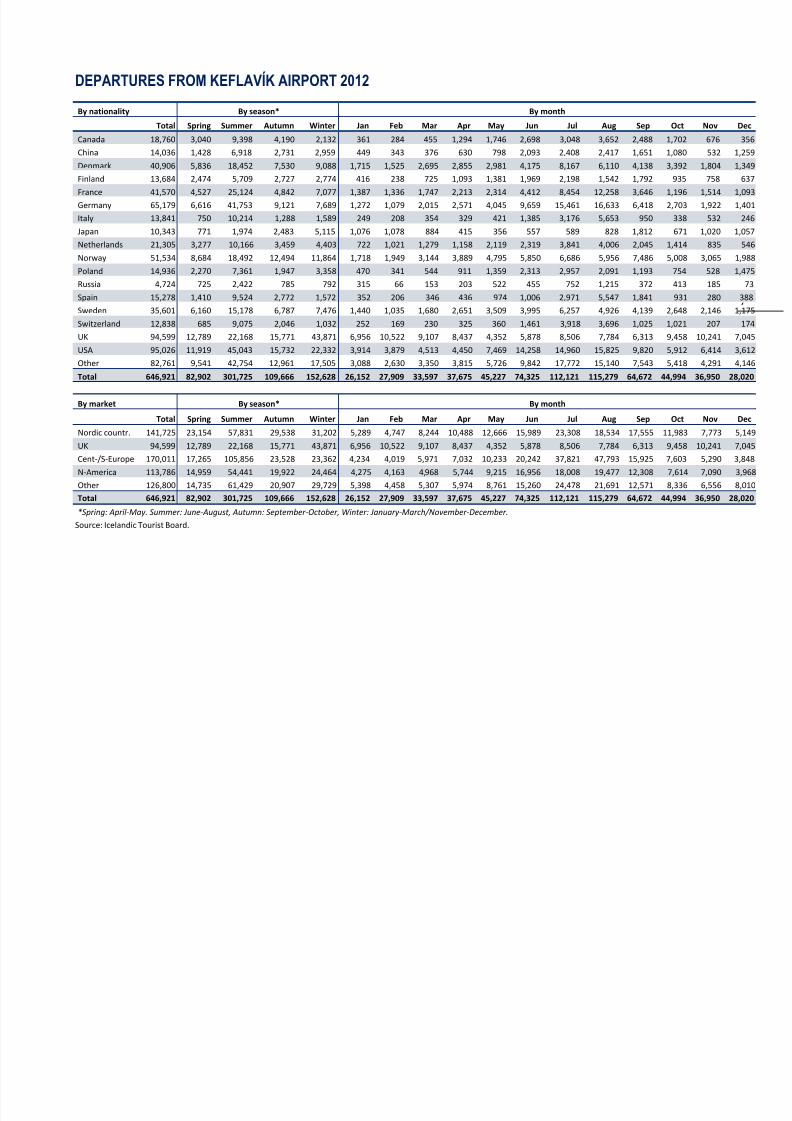
Canada 18,760 3,040 9,398 4,190 2,132 361 284 455 1,294 1,746 2,698 3,048 3,652 2,488 1,702 676 356China 14,036 1,428 6,918 2,731 2,959 449 343 376 630 798 2,093 2,408 2,417 1,651 1,080 532 1,259Denmark 40,906 5,836 18,452 7,530 9,088 1,715 1,525 2,695 2,855 2,981 4,175 8,167 6,110 4,138 3,392 1,804 1,349Finland 13,684 2,474 5,709 2,727 2,774 416 238 725 1,093 1,381 1,969 2,198 1,542 1,792 935 758 637France 41,570 4,527 25,124 4,842 7,077 1,387 1,336 1,747 2,213 2,314 4,412 8,454 12,258 3,646 1,196 1,514 1,093Germany 65,179 6,616 41,753 9,121 7,689 1,272 1,079 2,015 2,571 4,045 9,659 15,461 16,633 6,418 2,703 1,922 1,401Italy 13,841 750 10,214 1,288 1,589 249 208 354 329 421 1,385 3,176 5,653 950 338 532 246Japan 10,343 771 1,974 2,483 5,115 1,076 1,078 884 415 356 557 589 828 1,812 671 1,020 1,057Netherlands 21,305 3,277 10,166 3,459 4,403 722 1,021 1,279 1,158 2,119 2,319 3,841 4,006 2,045 1,414 835 546Norway 51,534 8,684 18,492 12,494 11,864 1,718 1,949 3,144 3,889 4,795 5,850 6,686 5,956 7,486 5,008 3,065 1,988Poland 14,936 2,270 7,361 1,947 3,358 470 341 544 911 1,359 2,313 2,957 2,091 1,193 754 528 1,475Russia 4,724 725 2,422 785 792 315 66 153 203 522 455 752 1,215 372 413 185 73Spain 15,278 1,410 9,524 2,772 1,572 352 206 346 436 974 1,006 2,971 5,547 1,841 931 280 388Sweden 35,601 6,160 15,178 6,787 7,476 1,440 1,035 1,680 2,651 3,509 3,995 6,257 4,926 4,139 2,648 2,146 1,175Switzerland 12,838 685 9,075 2,046 1,032 252 169 230 325 360 1,461 3,918 3,696 1,025 1,021 207 174UK 94,599 12,789 22,168 15,771 43,871 6,956 10,522 9,107 8,437 4,352 5,878 8,506 7,784 6,313 9,458 10,241 7,045USA 95,026 11,919 45,043 15,732 22,332 3,914 3,879 4,513 4,450 7,469 14,258 14,960 15,825 9,820 5,912 6,414 3,612Other 82,761 9,541 42,754 12,961 17,505 3,088 2,630 3,350 3,815 5,726 9,842 17,772 15,140 7,543 5,418 4,291 4,146Total 646,921 82,902 301,725 109,666 152,628 26,152 27,909 33,597 37,675 45,227 74,325 112,121 115,279 64,672 44,994 36,950 28,020
By market By season* By month
Total Spring Summer Autumn Winter Jan Feb Mar Apr May Jun Jul Aug Sep Oct Nov Dec
Nordic countr. 141,725 23,154 57,831 29,538 31,202 5,289 4,747 8,244 10,488 12,666 15,989 23,308 18,534 17,555 11,983 7,773 5,149UK 94,599 12,789 22,168 15,771 43,871 6,956 10,522 9,107 8,437 4,352 5,878 8,506 7,784 6,313 9,458 10,241 7,045Cent-/S-Europe 170,011 17,265 105,856 23,528 23,362 4,234 4,019 5,971 7,032 10,233 20,242 37,821 47,793 15,925 7,603 5,290 3,848N-America 113,786 14,959 54,441 19,922 24,464 4,275 4,163 4,968 5,744 9,215 16,956 18,008 19,477 12,308 7,614 7,090 3,968Other 126,800 14,735 61,429 20,907 29,729 5,398 4,458 5,307 5,974 8,761 15,260 24,478 21,691 12,571 8,336 6,556 8,010Total 646,921 82,902 301,725 109,666 152,628 26,152 27,909 33,597 37,675 45,227 74,325 112,121 115,279 64,672 44,994 36,950 28,020
*Spring: April-May. Summer: June-August, Autumn: September-October, Winter: January-March/November-December.Source: Icelandic Tourist Board.
8/13/2019 Tourism in Iceland in Figures April 2013
http://slidepdf.com/reader/full/tourism-in-iceland-in-figures-april-2013 9/21
8
OVERNIGHT STAYS – ALLTYPES OF ACCOMMODATION
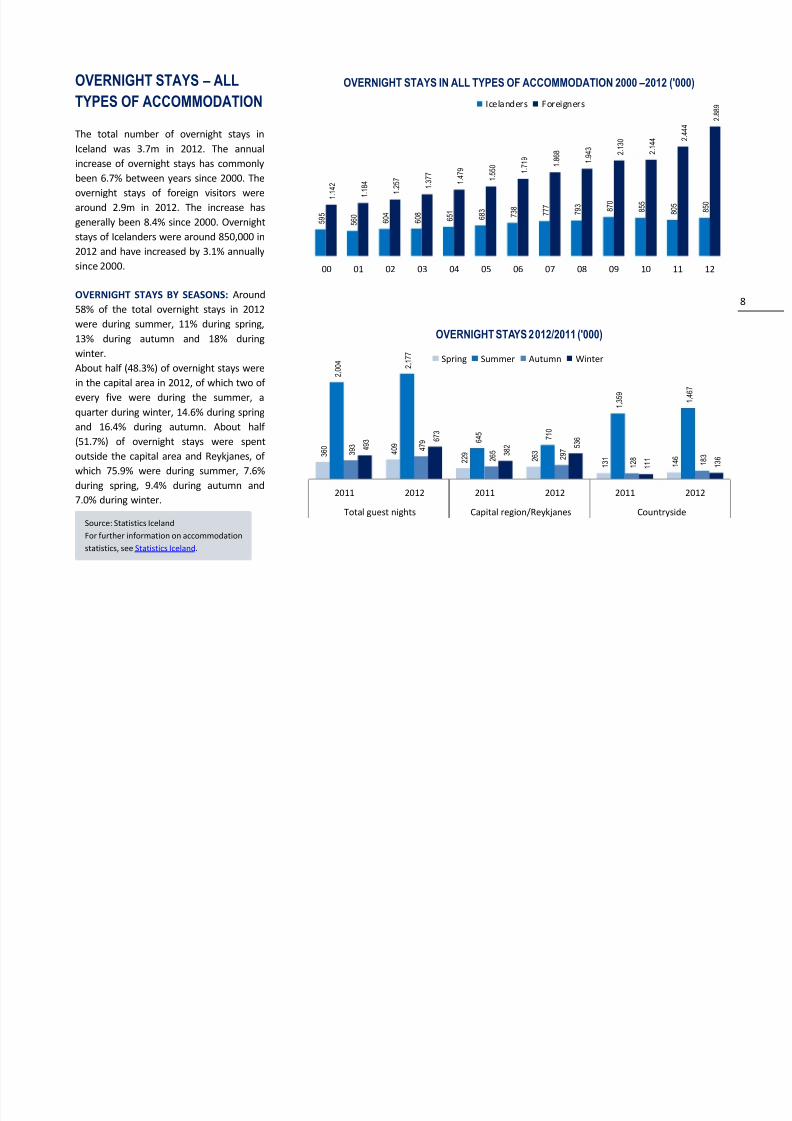
The total number of overnight stays inIceland was 3.7m in 2012. The annualincrease of overnight stays has commonlybeen 6.7% between years since 2000. Theovernight stays of foreign visitors werearound 2.9m in 2012. The increase hasgenerally been 8.4% since 2000. Overnightstays of Icelanders were around 850,000 in2012 and have increased by 3.1% annuallysince 2000.
OVERNIGHT STAYS BY SEASONS: Around58% of the total overnight stays in 2012were during summer, 11% during spring,13% during autumn and 18% duringwinter.About half (48.3%) of overnight stays werein the capital area in 2012, of which two ofevery five were during the summer, a
quarter during winter, 14.6% during springand 16.4% during autumn. About half(51.7%) of overnight stays were spentoutside the capital area and Reykjanes, ofwhich 75.9% were during summer, 7.6%during spring, 9.4% during autumn and7.0% during winter.
5 9 5
5 6 0
6 0 4
6 0 8
6 5 1
6 8 3
7 3 8
7 7 7
7 9 3
8 7 0
8 5 5
8 0 5
8 5 0
1 . 1
4 2
1 . 1
8 4
1 . 2
5 7
1 . 3
7 7
1 . 4
7 9
1 . 5
5 0
1 . 7
1 9
1 . 8
6 8
1 . 9
4 3
2 . 1
3 0
2 . 1
4 4
2
. 4 4 4
2
. 8 8 9
00 01 02 03 04 05 06 07 08 09 10 11 12
Icelanders Foreigners
OVERNIGHT STAYS IN ALL TYPES OF ACCOMMODATION 2000 –2012 ('000)
3 6 0
4 0 9
2 2 9
2 6 3
1 3 1
1 4 6
2 , 0
0 4
2 , 1
7 7
6 4 5
7 1 0
1 , 3
5 9
1 , 4
6 7
3 9 3
4 7 9
2 6 5
2 9 7
1 2 8
1 8 3
4 9 3
6 7 3
3 8 2
5 3 6
1 1 1
1 3 6
2011 2012 2011 2012 2011 2012
Total guest nights Capital region/Reykjanes Countryside
OVERNIGHT STAYS 2012/2011 ('000)
Spring Summer Autumn Winter
Source: Statistics IcelandFor further information on accommodationstatistics, see Statistics Iceland.
8/13/2019 Tourism in Iceland in Figures April 2013
http://slidepdf.com/reader/full/tourism-in-iceland-in-figures-april-2013 10/21
9
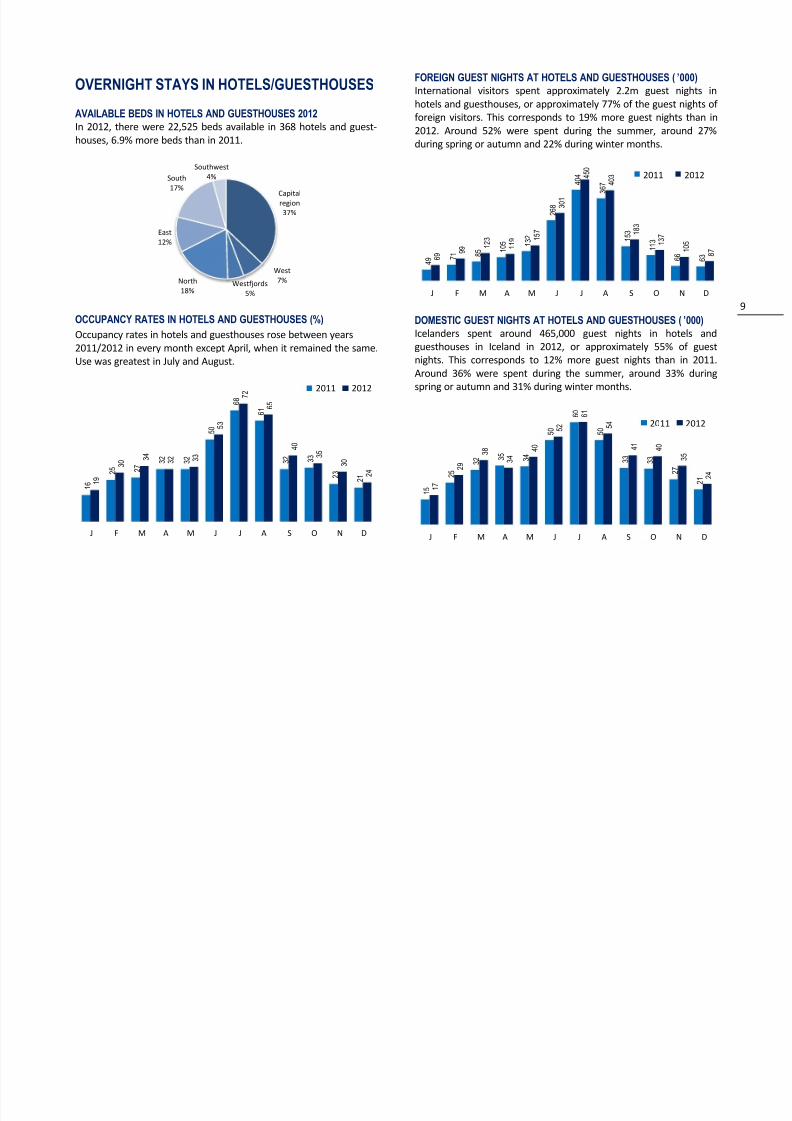
OVERNIGHT STAYS IN HOTELS/GUESTHOUSESAVAILABLE BEDS IN HOTELS AND GUESTHOUSES 2012In 2012, there were 22,525 beds available in 368 hotels and guest-
houses, 6.9% more beds than in 2011.
OCCUPANCY RATES IN HOTELS AND GUESTHOUSES (%)Occupancy rates in hotels and guesthouses rose between years2011/2012 in every month except April, when it remained the same.Use was greatest in July and August.
FOREIGN GUEST NIGHTS AT HOTELS AND GUESTHOUSES (’000)International visitors spent approximately 2.2m guest nights inhotels and guesthouses, or approximately 77% of the guest nights offoreign visitors. This corresponds to 19% more guest nights than in2012. Around 52% were spent during the summer, around 27%during spring or autumn and 22% during winter months.
DOMESTIC GUEST NIGHTS AT HOTELS AND GUESTHOUSES (’000) Icelanders spent around 465,000 guest nights in hotels andguesthouses in Iceland in 2012, or approximately 55% of guestnights. This corresponds to 12% more guest nights than in 2011.Around 36% were spent during the summer, around 33% duringspring or autumn and 31% during winter months.
Capitalregion37%
West7%Westfjords
5%North18%
East12%
South17%
Southwest4%
1 6
2 5
2 7
3 2
3 2
5 0
6 8
6 1
3 2
3 3
2 3
2 1
1 9
3 0
3 4
3 2
3 3
5 3
7 2
6 5
4 0
3 5
3 0
2 4
J F M A M J J A S O N D
2011 2012
4 9
7 1
8 5
1 0 5
1 3 2
2 6 8
4 0 4
3 6 7
1 5 3
1 1 3
6 6
6 3
6 9
9 9
1 2 3
1 1 9
1 5 7
3 0 1
4 5 0
4 0 3
1 8 3
1 3 7
1 0 5
8 7
J F M A M J J A S O N D
2011 2012
1 5
2 5
3 2
3 5
3 4
5 0
6 0
5 0
3 3
3 3
2 7
2 1
1 7
2 9
3 8
3 4
4 0
5 2
6 1
5 4
4 1
4 0
3 5
2 4
J F M A M J J A S O N D
2011 2012
8/13/2019 Tourism in Iceland in Figures April 2013
http://slidepdf.com/reader/full/tourism-in-iceland-in-figures-april-2013 11/21
10
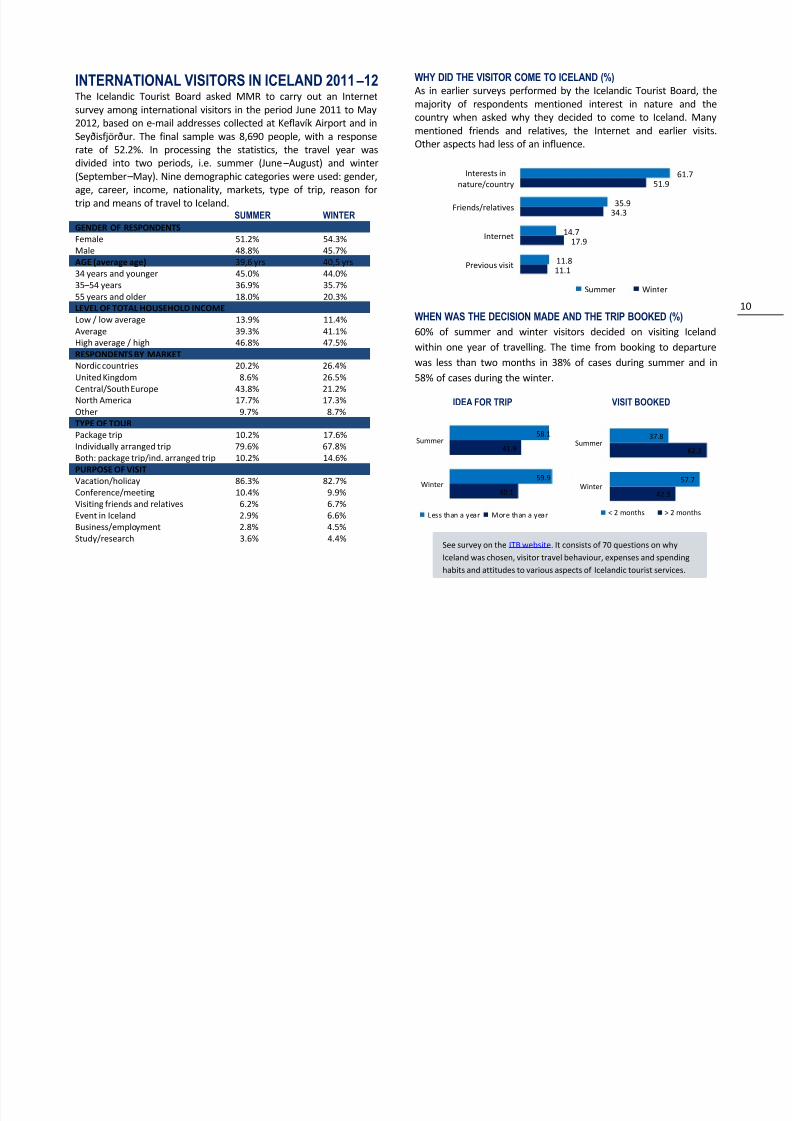
INTERNATIONAL VISITORS IN ICELAND 2011 –12The Icelandic Tourist Board asked MMR to carry out an Internetsurvey among international visitors in the period June 2011 to May2012, based on e-mail addresses collected at Keflavík Airport and in
Seyðisfjörður. The final sample was 8,690 people, with a responserate of 52.2%. In processing the statistics, the travel year wasdivided into two periods, i.e. summer (June –August) and winter(September –May). Nine demographic categories were used: gender,age, career, income, nationality, markets, type of trip, reason fortrip and means of travel to Iceland.
SUMMER WINTERGENDER OF RESPONDENTSFemale 51.2% 54.3%Male 48.8% 45.7%AGE (average age) 39,6 yrs 40,5 yrs
34 years and younger 45.0% 44.0%35 –54 years 36.9% 35.7%55 years and older 18.0% 20.3%LEVEL OF TOTAL HOUSEHOLD INCOME Low / low average 13.9% 11.4%Average 39.3% 41.1%High average / high 46.8% 47.5%RESPONDENTS BY MARKET Nordic countries 20.2% 26.4%United Kingdom 8.6% 26.5%Central/South Europe 43.8% 21.2%North America 17.7% 17.3%
Other 9.7% 8.7%TYPE OF TOURPackage trip 10.2% 17.6%Individually arranged trip 79.6% 67.8%Both: package trip/ind. arranged trip 10.2% 14.6%PURPOSE OF VISIT Vacation/holiday 86.3% 82.7%Conference/meeting 10.4% 9.9%Visiting friends and relatives 6.2% 6.7%Event in Iceland 2.9% 6.6%Business/employment 2.8% 4.5%Study/research 3.6% 4.4%
WHY DID THE VISITOR COME TO ICELAND (%)As in earlier surveys performed by the Icelandic Tourist Board, themajority of respondents mentioned interest in nature and thecountry when asked why they decided to come to Iceland. Manymentioned friends and relatives, the Internet and earlier visits.Other aspects had less of an influence.
WHEN WAS THE DECISION MADE AND THE TRIP BOOKED (%)60% of summer and winter visitors decided on visiting Icelandwithin one year of travelling. The time from booking to departurewas less than two months in 38% of cases during summer and in58% of cases during the winter.
IDEA FOR TRIP VISIT BOOKED
11.1
17.9
34.3
51.9
11.8
14.7
35.9
61.7
Previous visit
Internet
Friends/relatives
Interests innature/country
Summer Winter
40.1
41.9
59.9
58.1
Winter
Summer
Less than a year More than a year
42.3
62.2
57.7
37.8
Winter
Summer
< 2 months > 2 months
See survey on the ITB website. It consists of 70 questions on whyIceland was chosen, visitor travel behaviour, expenses and spendinghabits and attitudes to various aspects of Icelandic tourist services.
8/13/2019 Tourism in Iceland in Figures April 2013
http://slidepdf.com/reader/full/tourism-in-iceland-in-figures-april-2013 12/21
11
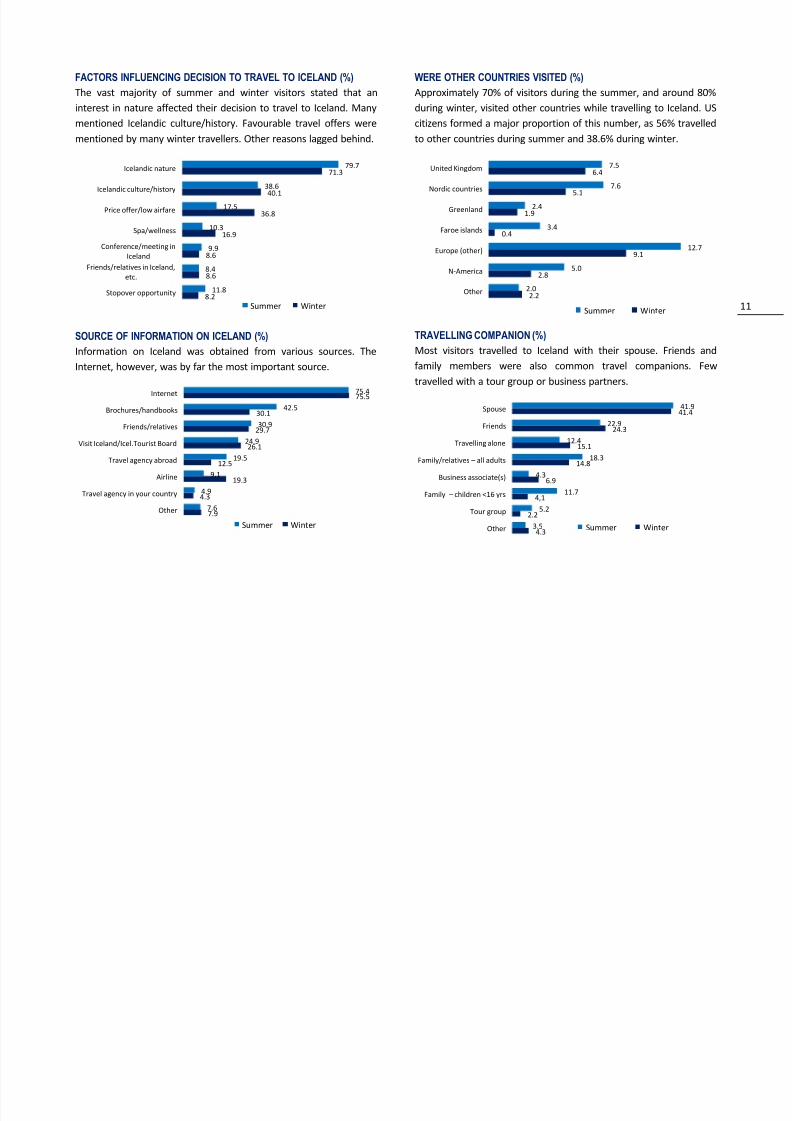
FACTORS INFLUENCING DECISION TO TRAVEL TO ICELAND (%)The vast majority of summer and winter visitors stated that aninterest in nature affected their decision to travel to Iceland. Manymentioned Icelandic culture/history. Favourable travel offers were
mentioned by many winter travellers. Other reasons lagged behind.
SOURCE OF INFORMATION ON ICELAND (%)Information on Iceland was obtained from various sources. TheInternet, however, was by far the most important source.
WERE OTHER COUNTRIES VISITED (%)Approximately 70% of visitors during the summer, and around 80%during winter, visited other countries while travelling to Iceland. UScitizens formed a major proportion of this number, as 56% travelled
to other countries during summer and 38.6% during winter.
TRAVELLING COMPANION (%)Most visitors travelled to Iceland with their spouse. Friends andfamily members were also common travel companions. Fewtravelled with a tour group or business partners.
8.2
8.6
8.6
16.9
36.8
40.1
71.3
11.8
8.4
9.9
10.3
17.5
38.6
79.7
Stopover opportunity
Friends/relatives in Iceland,
etc.
Conference/meeting inIceland
Spa/wellness
Price offer/low airfare
Icelandic culture/history
Icelandic nature
Summer Winter
7.9
4.3
19.3
12.5
26.1
29.730.1
75.5
7.6
4.9
9,1
19.5
24.9
30.9
42.5
75.4
Other
Travel agency in your country
Airline
Travel agency abroad
Visit Iceland/Icel.Tourist Board
Friends/relatives
Brochures/handbooks
Internet
Summer Winter
2.2
2.8
9.1
0.4
1.9
5.1
6.4
2.0
5.0
12.7
3.4
2.4
7.6
7.5
Other
N-America
Europe (other)
Faroe islands
Greenland
Nordic countries
United Kingdom
Summer Winter
4.3
2.2
4,1
6.9
14.8
15.1
24.341.4
3.5
5.2
11.7
4.3
18.3
12.4
22.9
41.9
Other
Tour group
Family – children <16 yrs
Business associate(s)
Family/relatives – all adults
Travelling alone
Friends
Spouse
Summer Winter
8/13/2019 Tourism in Iceland in Figures April 2013
http://slidepdf.com/reader/full/tourism-in-iceland-in-figures-april-2013 13/21
12
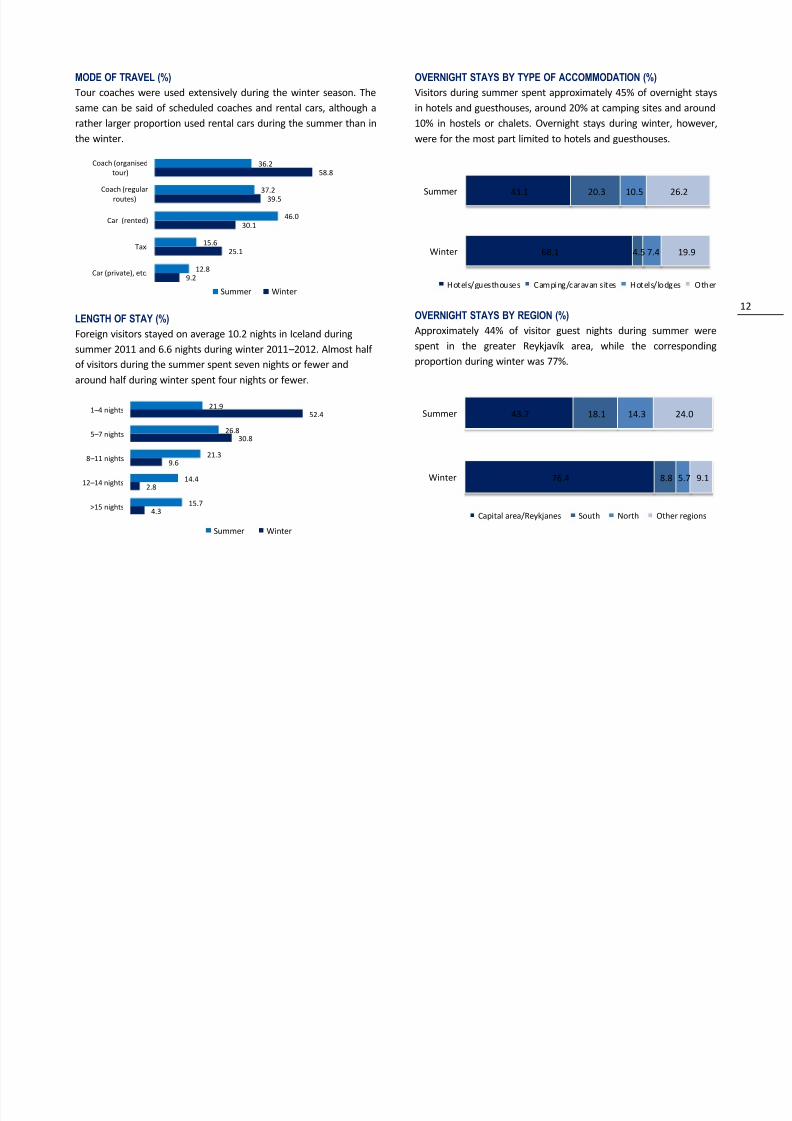
MODE OF TRAVEL (%)Tour coaches were used extensively during the winter season. Thesame can be said of scheduled coaches and rental cars, although arather larger proportion used rental cars during the summer than in
the winter.
LENGTH OF STAY (%)Foreign visitors stayed on average 10.2 nights in Iceland duringsummer 2011 and 6.6 nights during winter 2011 –2012. Almost halfof visitors during the summer spent seven nights or fewer andaround half during winter spent four nights or fewer.
OVERNIGHT STAYS BY TYPE OF ACCOMMODATION (%)Visitors during summer spent approximately 45% of overnight staysin hotels and guesthouses, around 20% at camping sites and around10% in hostels or chalets. Overnight stays during winter, however,
were for the most part limited to hotels and guesthouses.
OVERNIGHT STAYS BY REGION (%)Approximately 44% of visitor guest nights during summer werespent in the greater Reykjavík area, while the correspondingproportion during winter was 77%.
9.2
25.1
30.1
39.5
58.8
12.8
15.6
46.0
37.2
36.2
Car (private), etc.
Taxi
Car (rented)
Coach (regularroutes)
Coach (organisedtour)
Summer Winter
4.3
2.8
9.6
30.8
52.4
15.7
14.4
21.3
26.8
21.9
>15 nights
12 –14 nights
8 –11 nights
5 –7 nights
1 –4 nights
Summer Winter
68.1
43.1
4.5
20.3
7.4
10.5
19.9
26.2
Winter
Summer
Hotels/guesthouses Camping/caravan sites Hotels/lodges Other
76.4
43.7
8.8
18.1
5.7
14.3
9.1
24.0
Winter
Summer
Capital area/Reykjanes South North Other regions
8/13/2019 Tourism in Iceland in Figures April 2013
http://slidepdf.com/reader/full/tourism-in-iceland-in-figures-april-2013 14/21
8/13/2019 Tourism in Iceland in Figures April 2013
http://slidepdf.com/reader/full/tourism-in-iceland-in-figures-april-2013 15/21
14
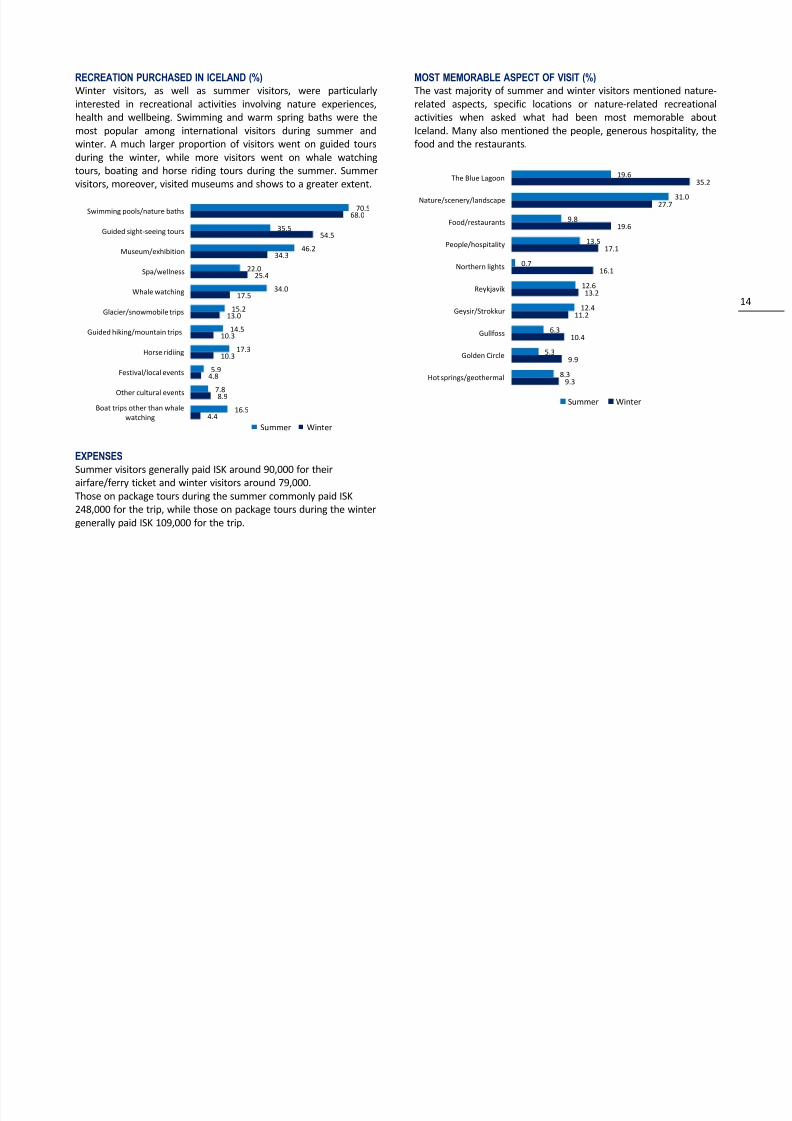
RECREATION PURCHASED IN ICELAND (%)Winter visitors, as well as summer visitors, were particularlyinterested in recreational activities involving nature experiences,health and wellbeing. Swimming and warm spring baths were themost popular among international visitors during summer andwinter. A much larger proportion of visitors went on guided toursduring the winter, while more visitors went on whale watchingtours, boating and horse riding tours during the summer. Summervisitors, moreover, visited museums and shows to a greater extent.
EXPENSESSummer visitors generally paid ISK around 90,000 for theirairfare/ferry ticket and winter visitors around 79,000.Those on package tours during the summer commonly paid ISK248,000 for the trip, while those on package tours during the wintergenerally paid ISK 109,000 for the trip.
MOST MEMORABLE ASPECT OF VISIT (%)The vast majority of summer and winter visitors mentioned nature-related aspects, specific locations or nature-related recreationalactivities when asked what had been most memorable aboutIceland. Many also mentioned the people, generous hospitality, thefood and the restaurants.
4.4
8.9
4.8
10.3
10.3
13.0
17.5
25.4
34.3
54.5
68.0
16.5
7.8
5.9
17.3
14.5
15.2
34.0
22.0
46.2
35.5
70.5
Boat trips other than whalewatching
Other cultural events
Festival/local events
Horse ridiing
Guided hiking/mountain trips
Glacier/snowmobile trips
Whale watching
Spa/wellness
Museum/exhibition
Guided sight-seeing tours
Swimming pools/nature baths
Summer Winter
9.3
9.9
10.4
11.2
13.2
16.1
17.1
19.6
27.7
35.2
8.3
5.3
6.3
12.4
12.6
0.7
13.5
9.8
31.0
19.6
Hot springs/geothermal
Golden Circle
Gullfoss
Geysir/Strokkur
Reykjavík
Northern lights
People/hospitality
Food/restaurants
Nature/scenery/landscape
The Blue Lagoon
Summer Winter
8/13/2019 Tourism in Iceland in Figures April 2013
http://slidepdf.com/reader/full/tourism-in-iceland-in-figures-april-2013 16/21
15
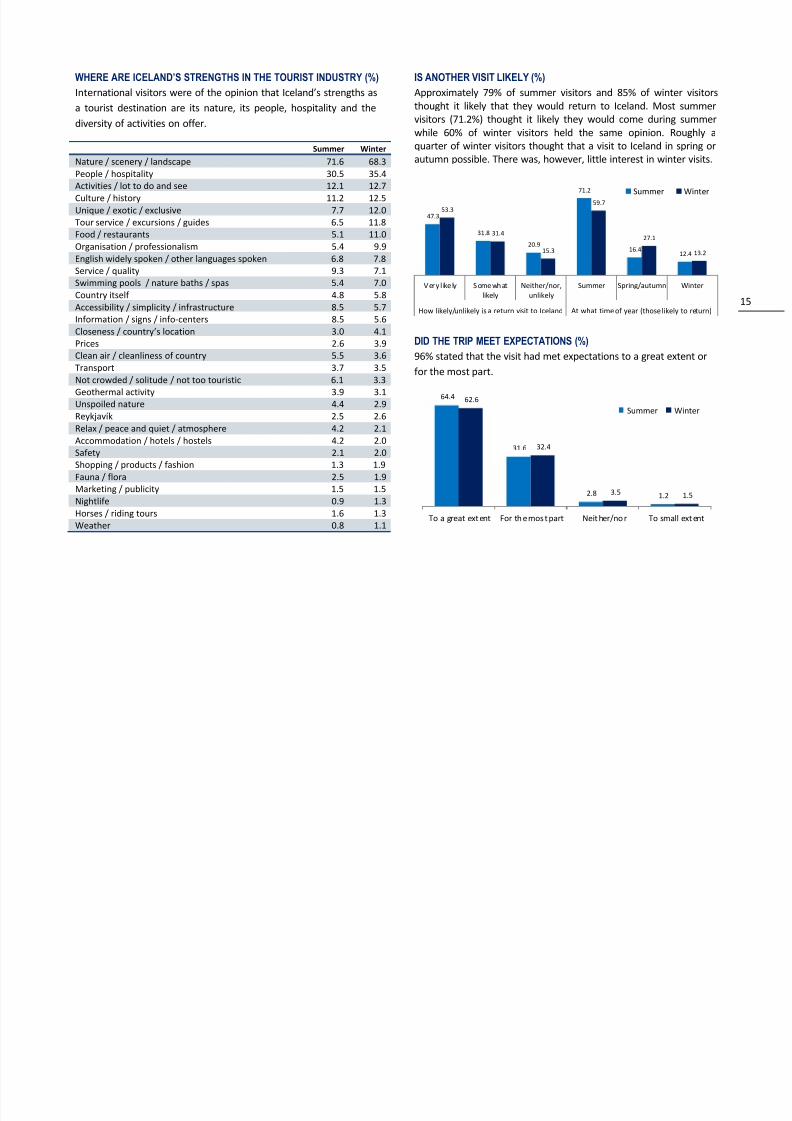
WHERE ARE ICELAND’S STRENGTHS IN THE TOURIST INDUSTRY (%) International visitors were of the opinion that Iceland’s strengths asa tourist destination are its nature, its people, hospitality and thediversity of activities on offer.
Summer WinterNature / scenery / landscape 71.6 68.3People / hospitality 30.5 35.4Activities / lot to do and see 12.1 12.7Culture / history 11.2 12.5Unique / exotic / exclusive 7.7 12.0Tour service / excursions / guides 6.5 11.8Food / restaurants 5.1 11.0Organisation / professionalism 5.4 9.9English widely spoken / other languages spoken 6.8 7.8Service / quality 9.3 7.1Swimming pools / nature baths / spas 5.4 7.0Country itself 4.8 5.8Accessibility / simplicity / infrastructure 8.5 5.7Information / signs / info-centers 8.5 5.6Closeness / country ’s location 3.0 4.1Prices 2.6 3.9Clean air / cleanliness of country 5.5 3.6Transport 3.7 3.5Not crowded / solitude / not too touristic 6.1 3.3Geothermal activity 3.9 3.1Unspoiled nature 4.4 2.9
Reykjavík 2.5 2.6Relax / peace and quiet / atmosphere 4.2 2.1Accommodation / hotels / hostels 4.2 2.0Safety 2.1 2.0Shopping / products / fashion 1.3 1.9Fauna / flora 2.5 1.9Marketing / publicity 1.5 1.5Nightlife 0.9 1.3Horses / riding tours 1.6 1.3Weather 0.8 1.1
IS ANOTHER VISIT LIKELY (%)Approximately 79% of summer visitors and 85% of winter visitorsthought it likely that they would return to Iceland. Most summervisitors (71.2%) thought it likely they would come during summerwhile 60% of winter visitors held the same opinion. Roughly aquarter of winter visitors thought that a visit to Iceland in spring orautumn possible. There was, however, little interest in winter visits.
DID THE TRIP MEET EXPECTATIONS (%)96% stated that the visit had met expectations to a great extent orfor the most part.
47.3
31.8
20.9
71.2
16.4 12.4
53.3
31.4
15.3
59.7
27.1
13.2
Very l ike ly Somewhatlikely
Neither/nor,unlikely
Summer Spring/autumn Winter
How likely/unlikely is a return visit to Iceland At what time of year (those likely to return)
Summer Winter
64.4
31.6
2.8 1.2
62.6
32.4
3.5 1.5
To a great extent For the mos t part Neither/nor To small extent
Summer Winter
8/13/2019 Tourism in Iceland in Figures April 2013
http://slidepdf.com/reader/full/tourism-in-iceland-in-figures-april-2013 17/21
16
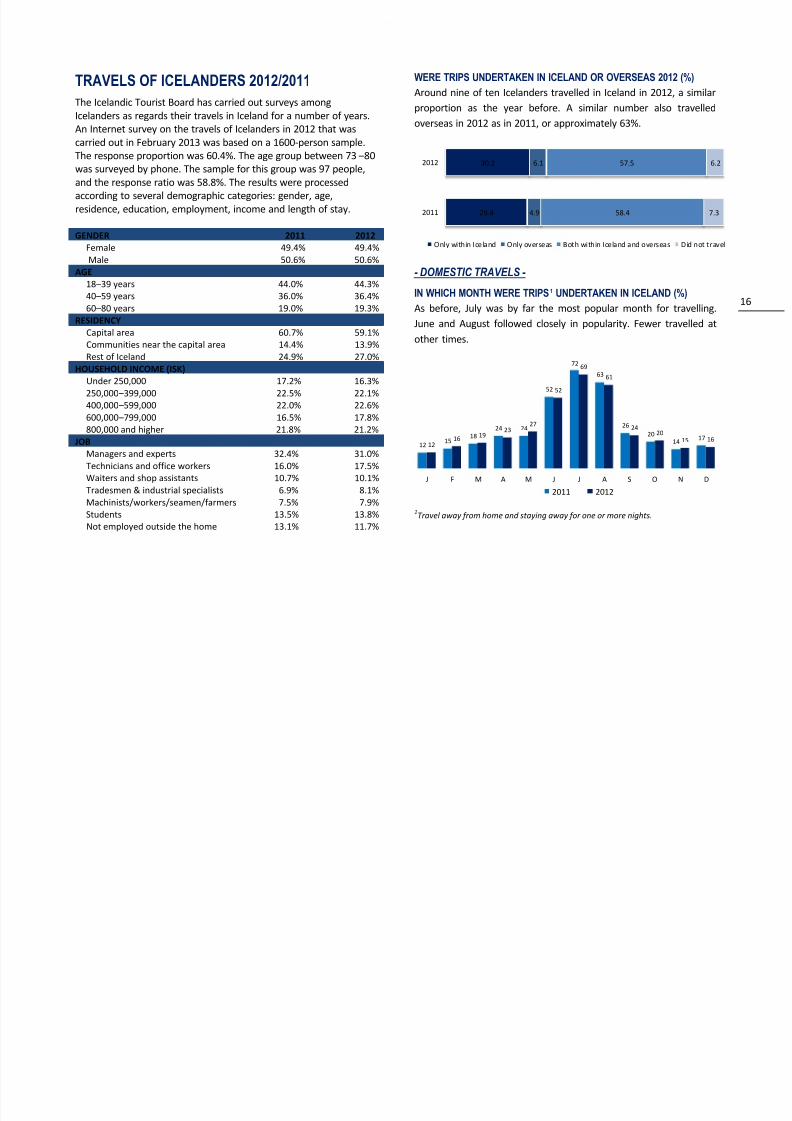
TRAVELS OF ICELANDERS 2012/2011The Icelandic Tourist Board has carried out surveys amongIcelanders as regards their travels in Iceland for a number of years.An Internet survey on the travels of Icelanders in 2012 that wascarried out in February 2013 was based on a 1600-person sample.The response proportion was 60.4%. The age group between 73 –80was surveyed by phone. The sample for this group was 97 people,and the response ratio was 58.8%. The results were processedaccording to several demographic categories: gender, age,residence, education, employment, income and length of stay.
GENDER 2011 2012Female 49.4% 49.4%Male 50.6% 50.6%
AGE18 –39 years 44.0% 44.3%40 –59 years 36.0% 36.4%60 –80 years 19.0% 19.3%
RESIDENCYCapital area 60.7% 59.1%Communities near the capital area 14.4% 13.9%Rest of Iceland 24.9% 27.0%
HOUSEHOLD INCOME (ISK) Under 250,000 17.2% 16.3%250,000 –399,000 22.5% 22.1%400,000 –599,000 22.0% 22.6%
600,000 –799,000 16.5% 17.8%800,000 and higher 21.8% 21.2%
JOBManagers and experts 32.4% 31.0%Technicians and office workers 16.0% 17.5%Waiters and shop assistants 10.7% 10.1%Tradesmen & industrial specialists 6.9% 8.1%Machinists/workers/seamen/farmers 7.5% 7.9%Students 13.5% 13.8%Not employed outside the home 13.1% 11.7%
WERE TRIPS UNDERTAKEN IN ICELAND OR OVERSEAS 2012 (%)Around nine of ten Icelanders travelled in Iceland in 2012, a similarproportion as the year before. A similar number also travelledoverseas in 2012 as in 2011, or approximately 63%.
- DOMESTIC TRAVELS -
IN WHICH MONTH WERE TRIPS¹ UNDERTAKEN IN ICELAND (%)As before, July was by far the most popular month for travelling.June and August followed closely in popularity. Fewer travelled atother times.
1Travel away from home and staying away for one or more nights.
29.4
30.2
4.9
6.1
58.4
57.5
7.3
6.2
2011
2012
Only within Iceland Only overseas Both within Iceland and overseas Did not travel
12 1518
24 24
52
7263
2620
14 1712
16 1923
27
52
6961
2420
15 16
J F M A M J J A S O N D
2011 2012
8/13/2019 Tourism in Iceland in Figures April 2013
http://slidepdf.com/reader/full/tourism-in-iceland-in-figures-april-2013 18/21
17
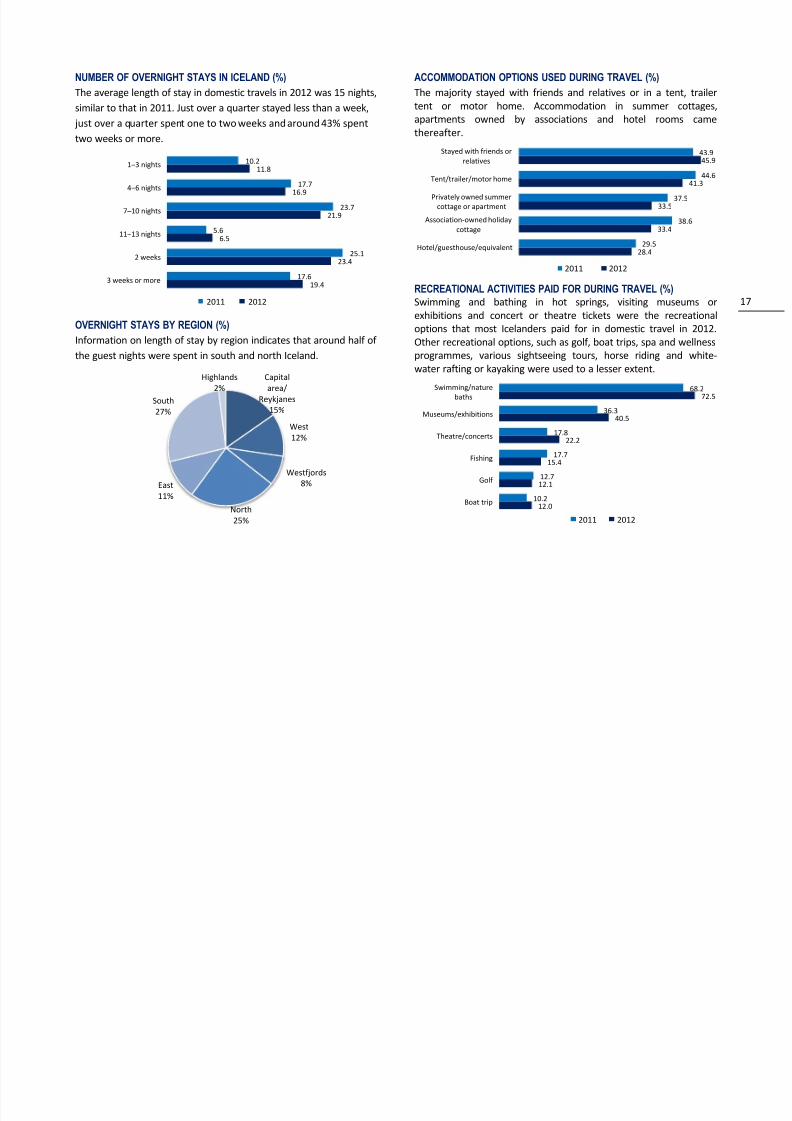
NUMBER OF OVERNIGHT STAYS IN ICELAND (%)The average length of stay in domestic travels in 2012 was 15 nights,similar to that in 2011. Just over a quarter stayed less than a week, just over a quarter spent one to two weeks and around 43% spent
two weeks or more.
OVERNIGHT STAYS BY REGION (%)Information on length of stay by region indicates that around half ofthe guest nights were spent in south and north Iceland.
ACCOMMODATION OPTIONS USED DURING TRAVEL (%)The majority stayed with friends and relatives or in a tent, trailertent or motor home. Accommodation in summer cottages,apartments owned by associations and hotel rooms camethereafter.
RECREATIONAL ACTIVITIES PAID FOR DURING TRAVEL (%)Swimming and bathing in hot springs, visiting museums orexhibitions and concert or theatre tickets were the recreationaloptions that most Icelanders paid for in domestic travel in 2012.Other recreational options, such as golf, boat trips, spa and wellnessprogrammes, various sightseeing tours, horse riding and white-water rafting or kayaking were used to a lesser extent.
19.4
23.4
6.5
21.9
16.9
11.8
17.6
25.1
5.6
23.7
17.7
10.2
3 weeks or more
2 weeks
11 –13 nights
7 –10 nights
4 –6 nights
1 –3 nights
2011 2012
Capitalarea/
Reykjanes15%
West12%
Westfjords8%
North25%
East11%
South27%
Highlands2%
28.4
33.4
33.5
41.3
45.9
29.5
38.6
37.5
44.6
43.9
Hotel/guesthouse/equivalent
Association-owned holidaycottage
Privately owned summercottage or apartment
Tent/trailer/motor home
Stayed with friends orrelatives
2011 2012
12.0
12.1
15.4
22.2
40.5
72.5
10.2
12.7
17.7
17.8
36.3
68.2
Boat trip
Golf
Fishing
Theatre/concerts
Museums/exhibitions
Swimming/naturebaths
2011 2012
8/13/2019 Tourism in Iceland in Figures April 2013
http://slidepdf.com/reader/full/tourism-in-iceland-in-figures-april-2013 19/21
18
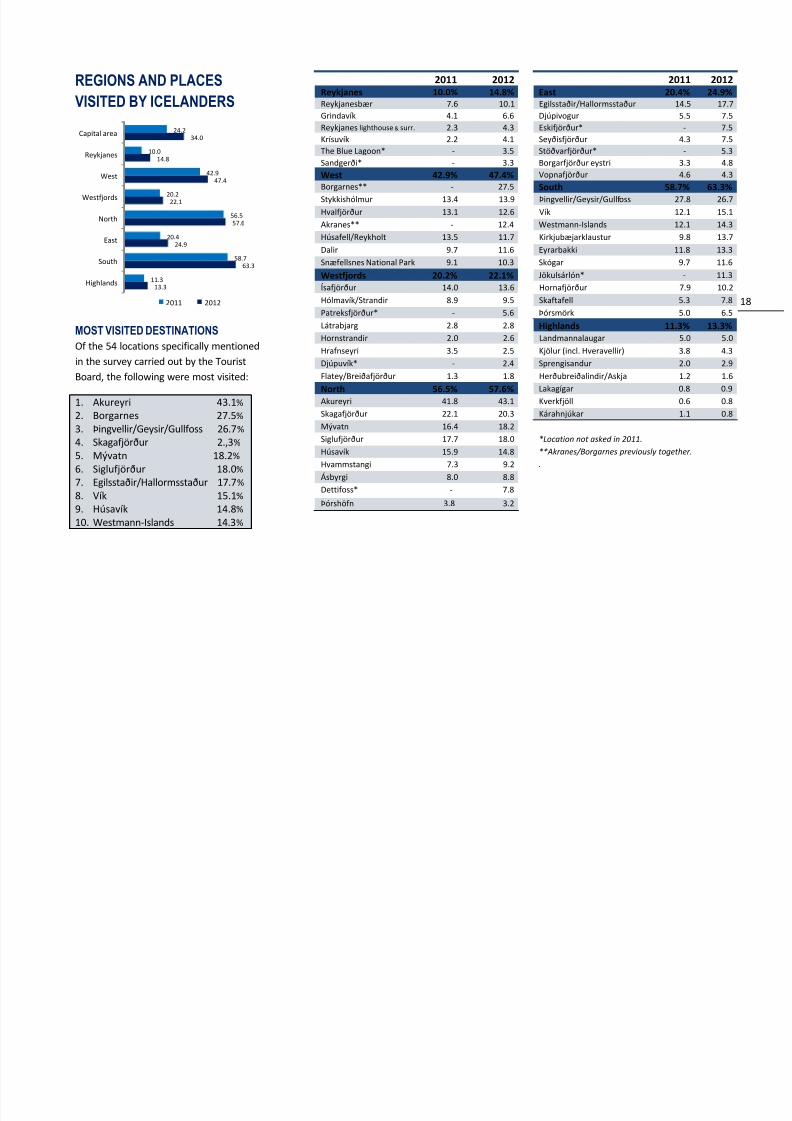
REGIONS AND PLACESVISITED BY ICELANDERS
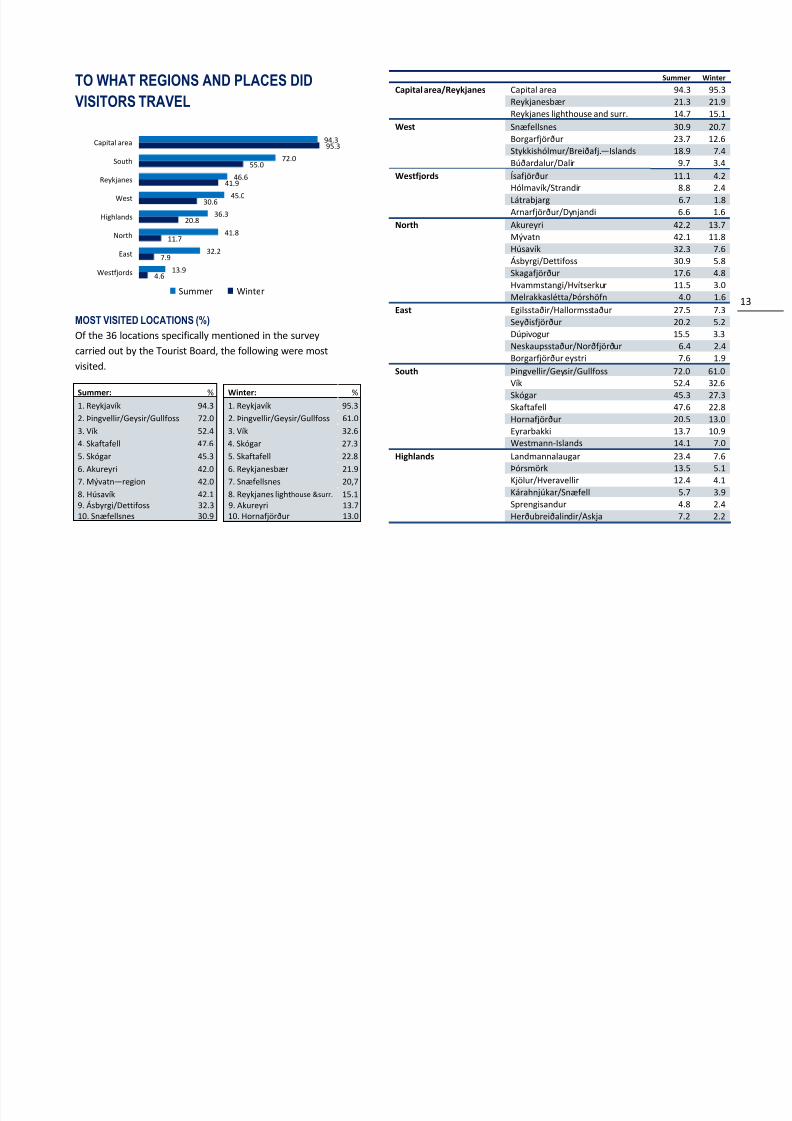
MOST VISITED DESTINATIONSOf the 54 locations specifically mentionedin the survey carried out by the TouristBoard, the following were most visited:
1. Akureyri 43.1%
2. Borgarnes 27.5% 3. Þingvellir/Geysir/Gullfoss 26.7% 4. Skagafjörður 2.,3% 5. Mývatn 18.2% 6. Siglufjörður 18.0% 7. Egilsstaðir/Hallormsstaður 17.7% 8. Vík 15.1% 9. Húsavík 14.8% 10. Westmann-Islands 14.3 %
2011 2012 2011 2012Reykjanes 10.0% 14.8% East 20.4% 24.9%Reykjanesbær 7.6 10.1 Egilsstaðir/Hallormsstaður 14.5 17.7Grindavík 4.1 6.6 Djúpivogur 5.5 7.5Reykjanes lighthouse & surr. 2.3 4.3 Eskifjörður* - 7.5
Krísuvík 2.2 4.1 Seyðisfjörður 4.3 7.5The Blue Lagoon* - 3.5 Stöðvarfjörður* - 5.3Sandgerði* - 3.3 Borgarfjörður eystri 3.3 4.8West 42.9% 47.4% Vopnafjörður 4.6 4.3Borgarnes** - 27.5 South 58.7% 63.3%Stykkishólmur 13.4 13.9 Þingvellir/Geysir/Gullfoss 27.8 26.7Hvalfjörður 13.1 12.6 Vík 12.1 15.1Akranes** - 12.4 Westmann-Islands 12.1 14.3Húsafell/Reykholt 13.5 11.7 Kirkjubæjarklaustur 9.8 13.7Dalir 9.7 11.6 Eyrarbakki 11.8 13.3Snæfellsnes National Park 9.1 10.3 Skógar 9.7 11.6
Westfjords 20.2% 22.1% Jökulsárlón* - 11.3Ísafjörður 14.0 13.6 Hornafjörður 7.9 10.2Hólmavík/Strandir 8.9 9.5 Skaftafell 5.3 7.8Patreksfjörður* - 5.6 Þórsmörk 5.0 6.5Látrabjarg 2.8 2.8 Highlands 11.3% 13.3%Hornstrandir 2.0 2.6 Landmannalaugar 5.0 5.0Hrafnseyri 3.5 2.5 Kjölur (incl. Hveravellir) 3.8 4.3Djúpuvík* - 2.4 Sprengisandur 2.0 2.9Flatey/Breiðafjörður 1.3 1.8 Herðubreiðalindir/Askja 1.2 1.6North 56.5% 57.6% Lakagígar 0.8 0.9Akureyri 41.8 43.1 Kverkfjöll 0.6 0.8
Skagafjörður 22.1 20.3 Kárahnjúkar 1.1 0.8Mývatn 16.4 18.2Siglufjörður 17.7 18.0 *Location not asked in 2011. Húsavík 15.9 14.8 **Akranes/Borgarnes previously together.Hvammstangi 7.3 9.2 . Ásbyrgi 8.0 8.8Dettifoss* - 7.8Þórshöfn 3.8 3.2
13.3
63.3
24.9
57.6
22.1
47.4
14.8
34.0
11.3
58.7
20.4
56.5
20.2
42.9
10.0
24.2
Highlands
South
East
North
Westfjords
West
Reykjanes
Capital area
2011 2012
8/13/2019 Tourism in Iceland in Figures April 2013
http://slidepdf.com/reader/full/tourism-in-iceland-in-figures-april-2013 20/21
19
- DOMESTIC DAY TRIPS -
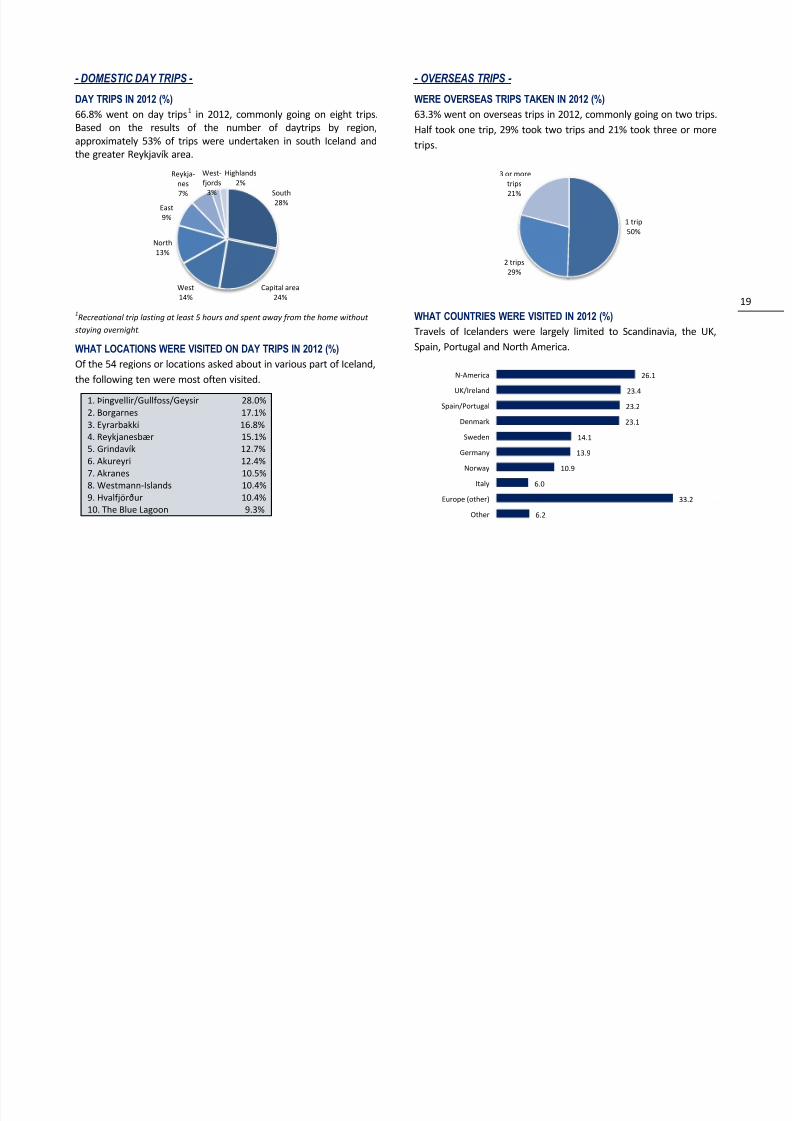
DAY TRIPS IN 2012 (%)66.8% went on day trips1 in 2012, commonly going on eight trips.Based on the results of the number of daytrips by region,
approximately 53% of trips were undertaken in south Iceland andthe greater Reykjavík area.
1Recreational trip lasting at least 5 hours and spent away from the home withoutstaying overnight.
WHAT LOCATIONS WERE VISITED ON DAY TRIPS IN 2012 (%)Of the 54 regions or locations asked about in various part of Iceland,the following ten were most often visited.
1. Þingvellir/Gullfoss/Geysir 28.0%
2. Borgarnes 17.1%3. Eyrarbakki 16.8%4. Reykjanesbær 15.1%5. Grindavík 12.7%6. Akureyri 12.4%7. Akranes 10.5%8. Westmann-Islands 10.4%9. Hvalfjörður 10.4%10. The Blue Lagoon 9.3%
- OVERSEAS TRIPS -
WERE OVERSEAS TRIPS TAKEN IN 2012 (%)63.3% went on overseas trips in 2012, commonly going on two trips.Half took one trip, 29% took two trips and 21% took three or moretrips.
WHAT COUNTRIES WERE VISITED IN 2012 (%)Travels of Icelanders were largely limited to Scandinavia, the UK,Spain, Portugal and North America.
South28%
Capital area24%
West14%
North13%
East9%
Reykja-nes7%
West-fjords
3%
Highlands2%
1 trip50%
2 trips29%
3 or moretrips21%
6.2
33.2
6.0
10.9
13.9
14.1
23.1
23.2
23.4
26.1
Other
Europe (other)
Italy
Norway
Germany
Sweden
Denmark
Spain/Portugal
UK/Ireland
N-America
8/13/2019 Tourism in Iceland in Figures April 2013
http://slidepdf.com/reader/full/tourism-in-iceland-in-figures-april-2013 21/21
20
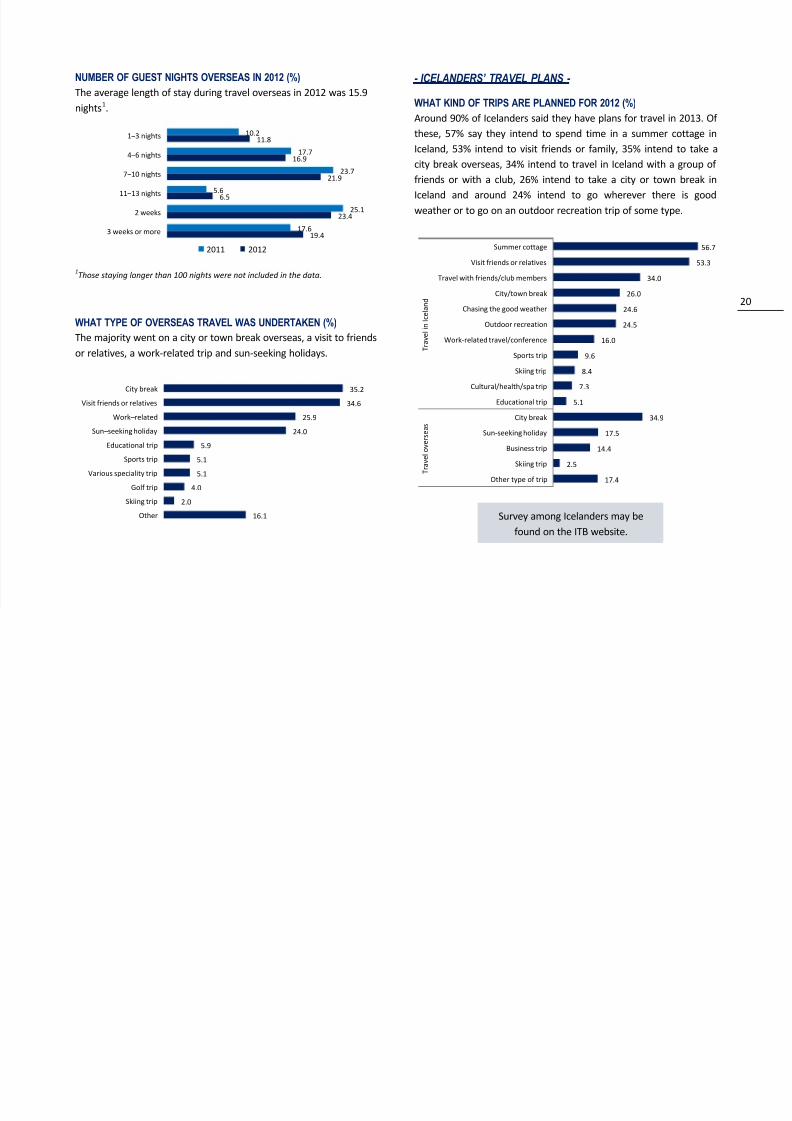
NUMBER OF GUEST NIGHTS OVERSEAS IN 2012 (%)The average length of stay during travel overseas in 2012 was 15.9nights1.
1
Those staying longer than 100 nights were not included in the data.
WHAT TYPE OF OVERSEAS TRAVEL WAS UNDERTAKEN (%)The majority went on a city or town break overseas, a visit to friendsor relatives, a work-related trip and sun-seeking holidays.
- ICELANDERS’ TRAVEL PLANS -
WHAT KIND OF TRIPS ARE PLANNED FOR 2012 (%)
Around 90% of Icelanders said they have plans for travel in 2013. Ofthese, 57% say they intend to spend time in a summer cottage inIceland, 53% intend to visit friends or family, 35% intend to take acity break overseas, 34% intend to travel in Iceland with a group offriends or with a club, 26% intend to take a city or town break inIceland and around 24% intend to go wherever there is goodweather or to go on an outdoor recreation trip of some type.
19.4
23.4
6.5
21.9
16.9
11.8
17.6
25.1
5.6
23.7
17.7
10.2
3 weeks or more
2 weeks
11 –13 nights
7 –10 nights
4 –6 nights
1 –3 nights
2011 2012
16.1
2.0
4.0
5.1
5.1
5.9
24.025.9
34.6
35.2
Other
Skiing trip
Golf trip
Various speciality trip
Sports trip
Educational trip
Sun –seeking holidayWork –related
Visit friends or relatives
City break
17.4
2.5
14.4
17.534.9
5.1
7.3
8.4
9.6
16.0
24.5
24.6
26.034.0
53.3
56.7
Other type of trip
Skiing trip
Business trip
Sun-seeking holidayCity break
Educational trip
Cultural/health/spa trip
Skiing trip
Sports trip
Work-related travel/conference
Outdoor recreation
Chasing the good weather
City/town breakTravel with friends/club members
Visit friends or relatives
Summer cottage
T r a v e
l o v e r s e a s
T r a v e
l i n
I c e
l a n
d
Survey among Icelanders may befound on the ITB website.