Embed Size (px)
Citation preview
South AustraliaRegional TourismSatellite Accounts2013-14
Tourism Research Australia
August 2015
South Australian Regional Tourism Satellite Accounts 2013-14
iDeloitte Access Economics
ContentsExecutive Summary .................................................................................................................. v
1 Introduction ................................................................................................................... 11.1 Industry context ................................................................................................................ 11.2 Satellite accounting........................................................................................................... 11.3 Accounting concepts ......................................................................................................... 31.4 Regional context ............................................................................................................... 41.5 Report structure ............................................................................................................... 5
2 Summary of Results ........................................................................................................ 62.1 Key tourism aggregates ..................................................................................................... 62.2 Tourism consumption ....................................................................................................... 72.3 Tourism output ................................................................................................................. 92.4 Tourism Gross Value Added ............................................................................................ 112.5 Tourism employment ...................................................................................................... 142.6 Detailed comparison data ............................................................................................... 17
3 Key trends in tourism.................................................................................................... 223.1 Adelaide ......................................................................................................................... 223.2 Regional South Australia ................................................................................................. 233.3 Regional trends ............................................................................................................... 253.4 Relative industry performance ........................................................................................ 26
4 Regional profiles ........................................................................................................... 31
Appendix A : Explanatory notes .............................................................................................. 58
Appendix B : Glossary ............................................................................................................. 59
Appendix C : Indirect trade flows ............................................................................................ 59
References ............................................................................................................................. 59Limitation of our work ............................................................................................................... 60
ChartsChart 2.1 : Tourism contribution to Adelaide and South Australian regional economies, 2013-147
Chart 2.2 : Regional tourism consumption at purchasers prices, 2013-14.................................. 7
Chart 2.3 : Domestic and international contribution to tourism consumption, 2013-14 ............ 8
Chart 2.4 : Regional direct tourism output at basic prices, 2013-14 ........................................... 9
Chart 2.5 : Relative contribution of direct and indirect tourism output, 2013-14 ..................... 11
Chart 2.6 : Regional direct tourism GVA at basic prices, 2013-14 ............................................ 12
Chart 2.7 : Domestic and international contribution to direct tourism GVA, 2013-14 ............. 12
Chart 2.8 : Source market contribution to direct GVA, 2013-14............................................... 13
Chart 2.9 : Contribution of tourism GVA to each regional economy, 2013-14 .......................... 14
South Australian Regional Tourism Satellite Accounts 2013-14
iiDeloitte Access Economics
Chart 2.10 : Regional direct tourism employed persons, 2013-14 ........................................... 15
Chart 2.11 : Status breakdown of persons directly employed in tourism industry, 2013-14 ..... 15
Chart 2.12 : Direct tourism contribution to each regional economy, 2013-14.......................... 18
Chart 2.13 : Indirect tourism contribution to each regional economy, 2013-14 ....................... 18
Chart 2.14 : Total tourism contribution to each regional economy, 2013-14 ........................... 19
Chart 3.1 : Adelaide’s comparative GVA growth, 2006-07 to 2013-14 (Indexed: 2006=100) .... 22
Chart 3.2 : Adelaide’s direct tourism GVA and employment, 2006-07 to 2013-14 ................... 23
Chart 3.3 : Tourism’s share of GRP and Employment, Adelaide, 2006-07 to 2013-14............... 23
Chart 3.4 : Regional SA comparative GVA growth, 2006-07 to 2013-14 (Indexed: 2006=100) .. 24
Chart 3.5 : Regional SA direct tourism GVA and employment, 2006-07 to 2013-14 ................. 24
Chart 3.6 : Tourism’s share of GRP and Employment, regional SA, 2006-07 to 2013-14 ........... 25
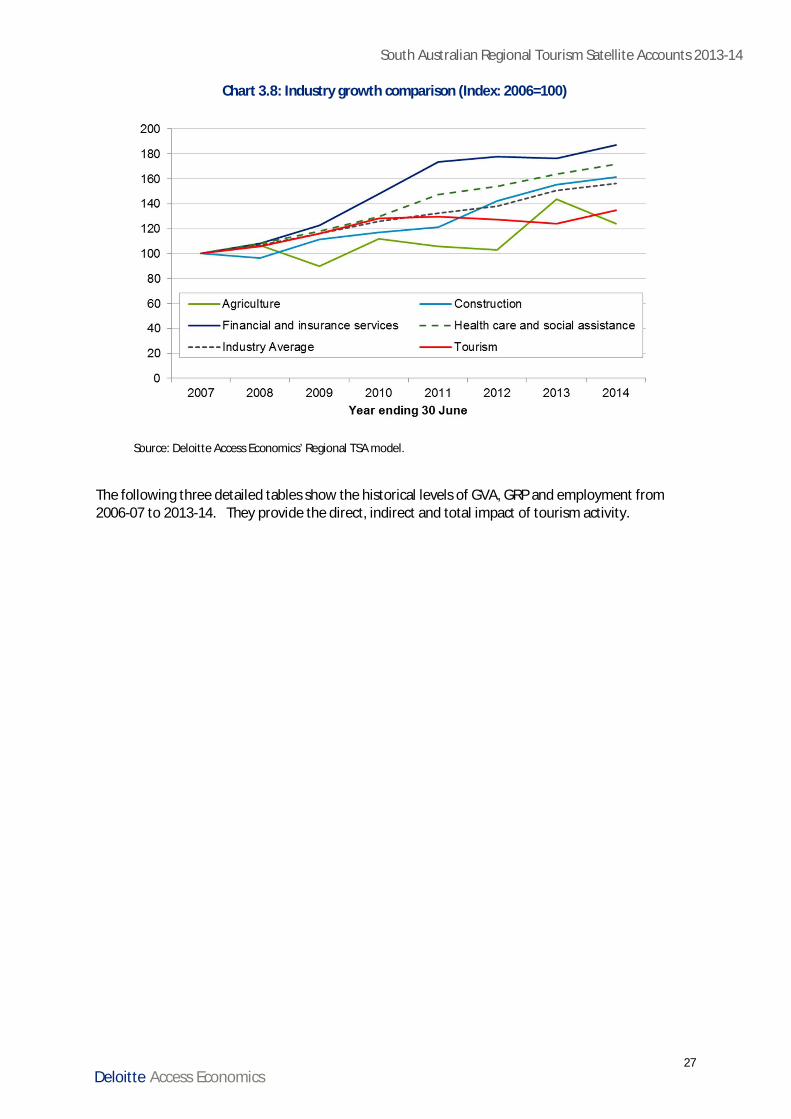
Chart 3.8 : Industry growth comparison (Index: 2006=100) ..................................................... 27
Chart 4.1 : Tourism’s contribution to the regional economy, Adelaide, 2013-14 ..................... 32
Chart 4.2 : Contribution of tourism to employment, Adelaide, 2013-14 .................................. 33
Chart 4.3 : Direct tourism employed persons, Adelaide, 2013-14 ........................................... 33
Chart 4.4 : Tourism’s contribution to the regional economy, Adelaide Hills, 2013-14 .............. 34
Chart 4.5 : Contribution of tourism to employment, Adelaide Hills, 2013-14 ........................... 35
Chart 4.6 : Direct tourism employed persons, Adelaide Hills, 2013-14..................................... 35
Chart 4.7 : Tourism’s contribution to the regional economy, Barossa, 2013-14 ....................... 36
Chart 4.8 : Contribution of tourism to employment, Barossa, 2013-14 .................................... 37
Chart 4.9 : Direct tourism employed persons, Barossa, 2013-14............................................. 37
Chart 4.10 : Tourism’s contribution to the regional economy, Clare Valley, 2013-14 ............... 38
Chart 4.11 : Contribution of tourism to employment, Clare Valley, 2013-14............................ 39
Chart 4.12 : Direct tourism employed persons, Clare Valley, 2013-14 ..................................... 39
Chart 4.13 : Tourism’s contribution to the regional economy, Eyre Peninsula, 2013-14 .......... 40
Chart 4.14 : Contribution of tourism to employment, Eyre Peninsula, 2013-14 ....................... 41
Chart 4.15 : Direct tourism employed persons, Eyre Peninsula, 2013-14 ................................. 41
Chart 4.16 : Tourism’s contribution to the regional economy, Fleurieu Peninsula, 2013-14 ..... 42
Chart 4.17 : Contribution of tourism to employment, Fleurieu Peninsula, 2013-14 ................. 43
Chart 4.18 : Direct tourism employed persons, Fleurieu Peninsula, 2013-14 ........................... 43
Chart 4.19 : Tourism’s contribution to the regional economy, Flinders Ranges and Outback, 2013-14 44
Chart 4.20 : Contribution of tourism to employment, Flinders Ranges and Outback, 2013-14 . 45
Chart 4.21 : Direct tourism employed persons, Flinders Ranges and Outback, 2013-14 ........... 45
Chart 4.22 : Tourism’s contribution to the regional economy, Kangaroo Island, 2013-14 ........ 46
Chart 4.23 : Contribution of tourism to employment, Kangaroo Island, 2013-14 ..................... 47
Chart 4.24 : Direct tourism employed persons, Kangaroo Island, 2013-14 ............................... 47
South Australian Regional Tourism Satellite Accounts 2013-14
iiiDeloitte Access Economics
Chart 4.25 : Tourism’s contribution to the regional economy, Murraylands, 2013-14 ............. 48
Chart 4.26 : Contribution of tourism to employment, Murraylands, 2013-14 .......................... 49
Chart 4.27 : Direct tourism employed persons, Murraylands, 2013-14 .................................... 49
Chart 4.28 : Tourism’s contribution to the regional economy, Limestone Coast, 2013-14 ....... 50
Chart 4.29 : Contribution of tourism to employment, Limestone Coast, 2013-14 .................... 51
Chart 4.30 : Direct tourism employed persons, Limestone Coast, 2013-14 .............................. 51
Chart 4.31 : Tourism’s contribution to the regional economy, Riverland, 2013-14 .................. 52
Chart 4.32 : Contribution of tourism to employment, Riverland, 2013-14 ............................... 53
Chart 4.33 : Direct tourism employed persons, Riverland, 2013-14 ......................................... 53
Chart 4.34 : Tourism’s contribution to the regional economy, Yorke Peninsula, 2013-14 ........ 54
Chart 4.35 : Contribution of tourism to employment, Yorke Peninsula, 2013-14 ..................... 55
Chart 4.36 : Direct tourism employed persons, Yorke Peninsula, 2013-14 ............................... 55
TablesTable 2.1 : Regional economy key aggregates, 2013-14 .......................................................... 17
Table 2.2 : Comparative importance of tourism to local economies, 2013-14 ......................... 17
Table 2.3 : Contribution of tourism by region, 2013-14 ........................................................... 20
Table 2.4 : Importance of tourism to South Australia’s regions, 2013-14 ................................. 21
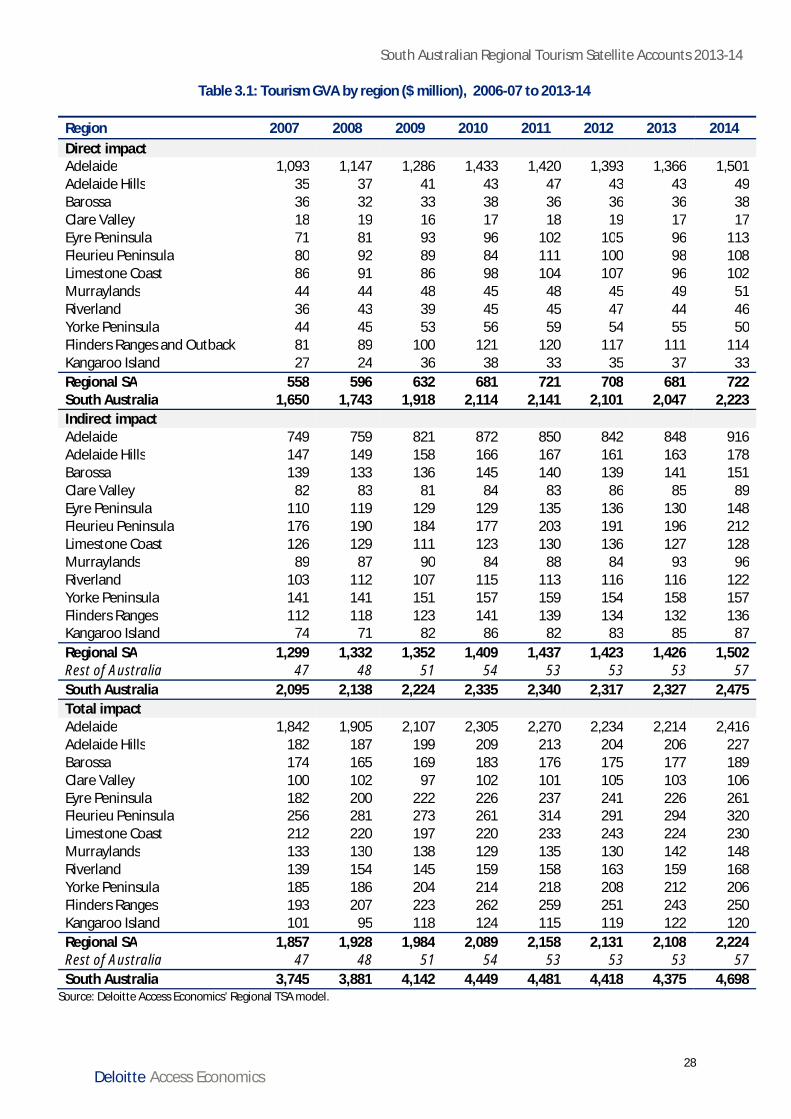
Table 3.1 : Tourism GVA by region ($ million), 2006-07 to 2013-14 ........................................ 28
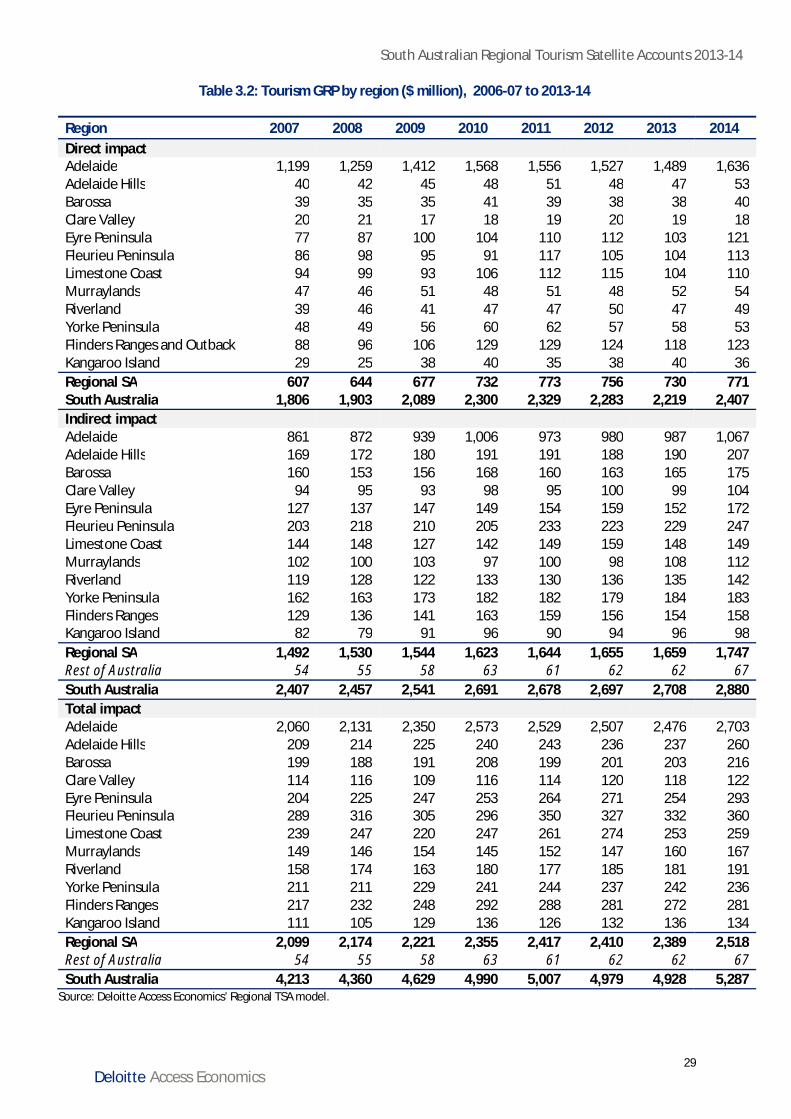
Table 3.2 : Tourism GRP by region ($ million), 2006-07 to 2013-14 ........................................ 29
Table 3.3 : Tourism employment by region, 2006-07 to 2013-14 ............................................ 30
Table 4.1 : Key tourism aggregates ($ million) - Adelaide ........................................................ 32
Table 4.2 : Tourism activity summary - Adelaide ..................................................................... 33
Table 4.3 : Key tourism aggregates – Adelaide Hills ($ million) ................................................ 34
Table 4.4 : Tourism activity summary – Adelaide Hills ............................................................. 35
Table 4.5 : Key tourism aggregates ($ million) - Barossa .......................................................... 36
Table 4.6 : Tourism activity summary - Barossa ....................................................................... 37
Table 4.7 : Key tourism aggregates ($ million) – Clare Valley ................................................... 38
Table 4.8 : Tourism activity summary – Clare Valley ................................................................ 39
Table 4.9 : Key tourism aggregates ($ million) – Eyre Peninsula .............................................. 40
Table 4.10 : Tourism activity summary – Eyre Peninsula ......................................................... 41
Table 4.11 : Key tourism aggregates ($ million) – Fleurieu Peninsula ....................................... 42
Table 4.12 : Tourism activity summary – Fleurieu Peninsula.................................................... 43
Table 4.13 : Key tourism aggregates ($ million) – Flinders Ranges and Outback ...................... 44
Table 4.14 : Tourism activity summary – Flinders Ranges and Outback ................................... 45
Table 4.15 : Key tourism aggregates ($ million) – Kangaroo Island .......................................... 46
South Australian Regional Tourism Satellite Accounts 2013-14
ivDeloitte Access Economics
Table 4.16 : Tourism activity summary – Kangaroo Island ....................................................... 47
Table 4.17 : Key tourism aggregates ($ million) – Murraylands ............................................... 49
Table 4.18 : Tourism activity summary - Murraylands ............................................................. 49
Table 4.19 : Key tourism aggregates ($ million) – Limestone Coast ......................................... 50
Table 4.20 : Tourism activity summary – Limestone Coast ...................................................... 51
Table 4.21 : Key tourism aggregates ($ million) - Riverland ..................................................... 52
Table 4.22 : Tourism activity summary - Riverland .................................................................. 53
Table 4.23 : Key tourism aggregates ($ million) – Yorke Peninsula .......................................... 54
Table 4.24 : Tourism activity summary – Yorke Peninsula ....................................................... 55
FiguresFigure 1.1 : South Australian Tourism Regions .......................................................................... 4
Figure C.1 : Significant supply flows for the retail, accommodation and food sectors .............. 59
South Australian Regional Tourism Satellite Accounts 2013-14
vDeloitte Access Economics
Executive SummaryTourism is a valuable contributor to the South Australia economy. The latest state Tourism SatelliteAccount (TSA) published by Tourism Research Australia indicates that in 2013-14 the tourismindustry directly contributed $2.4 billion to South Australia’s economy and directly employedapproximately 32,100 people. As tourism is an industry with strong links to other sectors of theeconomy, the indirect impacts brought the industry’s total contribution to the economy to anestimated $5.3 billion, or 5.9% of gross state product.
The findings presented in this report go beyond these state-wide findings to examine the role andcontribution of the tourism industry at a regional level. The analysis is underpinned by benchmarkindustry data sourced from Tourism Research Australia and a modelling framework consistent withthat employed in the derivation of the national and state TSA. The contribution of tourism to keyeconomic metrics such as employment and gross regional product is estimated for South Australiatourism regions.
Headline findings
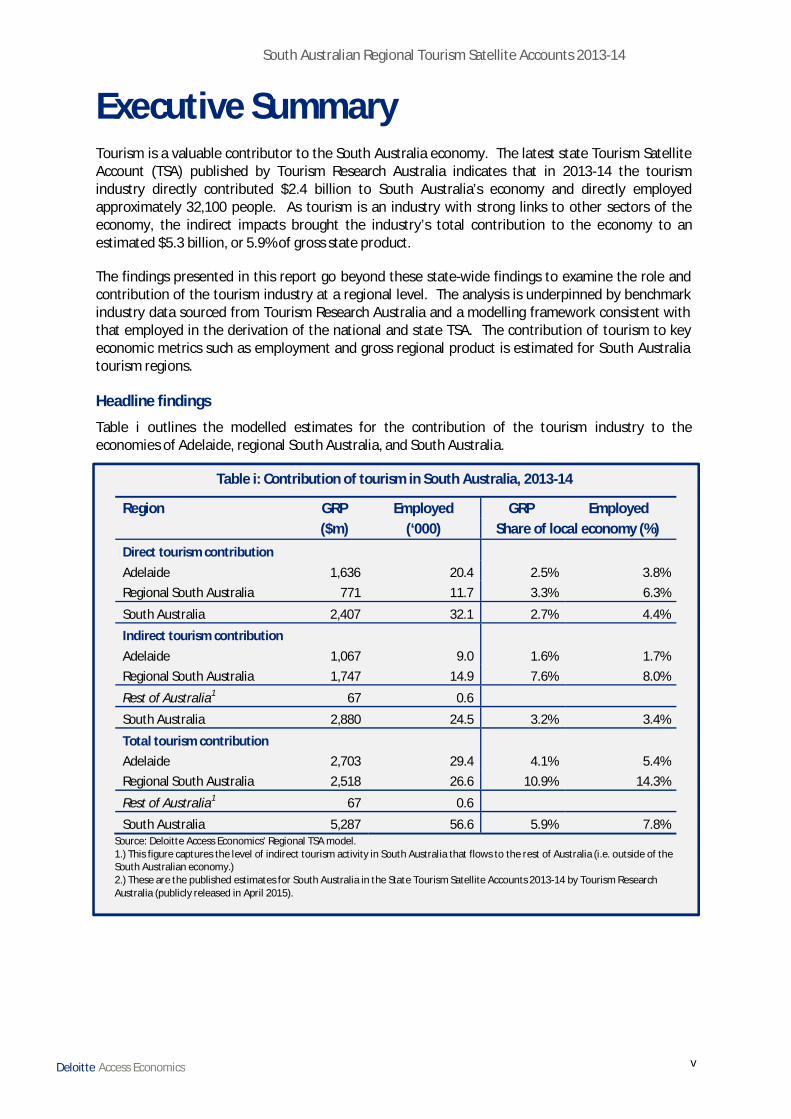
Table i outlines the modelled estimates for the contribution of the tourism industry to theeconomies of Adelaide, regional South Australia, and South Australia.
Table i: Contribution of tourism in South Australia, 2013-14
Region GRP Employed GRP Employed ($m) (‘000) Share of local economy (%)
Direct tourism contributionAdelaide 1,636 20.4 2.5% 3.8%Regional South Australia 771 11.7 3.3% 6.3%
South Australia 2,407 32.1 2.7% 4.4%
Indirect tourism contributionAdelaide 1,067 9.0 1.6% 1.7%Regional South Australia 1,747 14.9 7.6% 8.0%
Rest of Australia1 67 0.6
South Australia 2,880 24.5 3.2% 3.4%
Total tourism contributionAdelaide 2,703 29.4 4.1% 5.4%Regional South Australia 2,518 26.6 10.9% 14.3%
Rest of Australia1 67 0.6
South Australia 5,287 56.6 5.9% 7.8%Source: Deloitte Access Economics’ Regional TSA model.1.) This figure captures the level of indirect tourism activity in South Australia that flows to the rest of Australia (i.e. outside of theSouth Australian economy.)2.) These are the published estimates for South Australia in the State Tourism Satellite Accounts 2013-14 by Tourism ResearchAustralia (publicly released in April 2015).
South Australian Regional Tourism Satellite Accounts 2013-14
viDeloitte Access Economics
The results demonstrate that in 2013-14, the tourism industry contributed, in total:
· $2.7 billion to Adelaide’s GRP (4.1% of total) and employed an estimated 29,400 people in theAdelaide area (5.4% of employment); and
· $2.5 billion to regional South Australia’s GRP (10.9% of total) and employed an estimated 26,600people in regional South Australia (14.3% of employment).
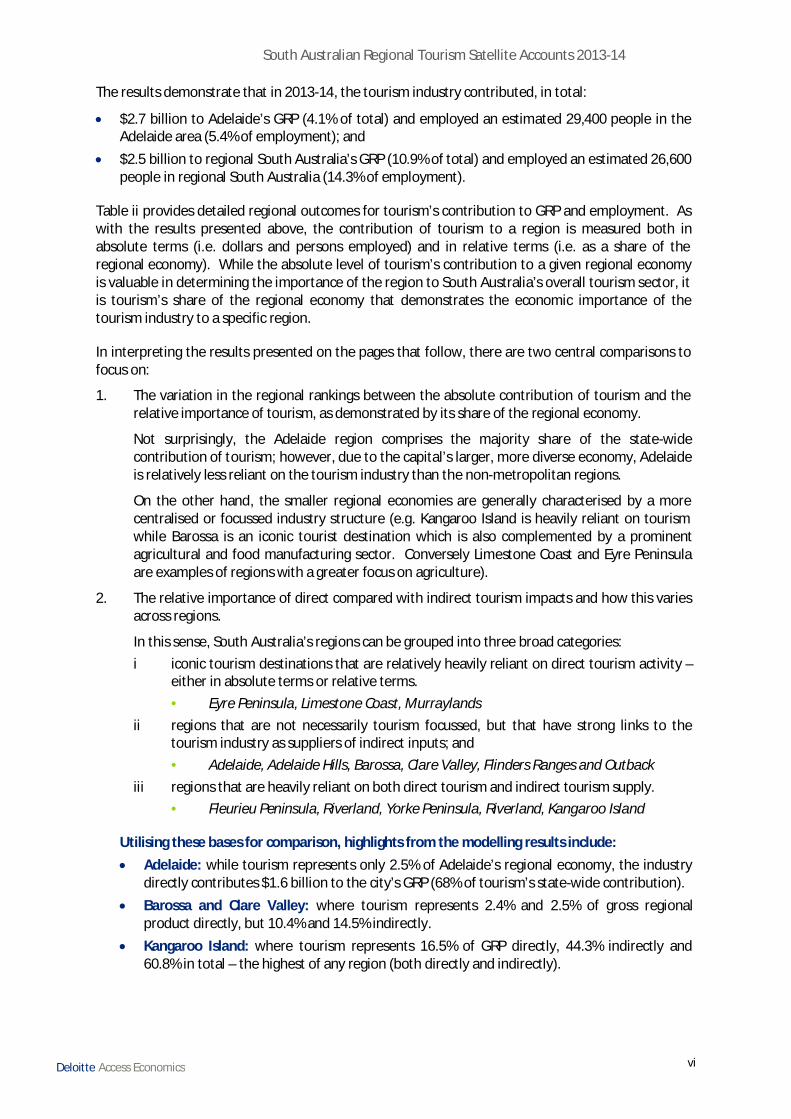
Table ii provides detailed regional outcomes for tourism’s contribution to GRP and employment. Aswith the results presented above, the contribution of tourism to a region is measured both inabsolute terms (i.e. dollars and persons employed) and in relative terms (i.e. as a share of theregional economy). While the absolute level of tourism’s contribution to a given regional economyis valuable in determining the importance of the region to South Australia’s overall tourism sector, itis tourism’s share of the regional economy that demonstrates the economic importance of thetourism industry to a specific region.
In interpreting the results presented on the pages that follow, there are two central comparisons tofocus on:
1. The variation in the regional rankings between the absolute contribution of tourism and therelative importance of tourism, as demonstrated by its share of the regional economy.
Not surprisingly, the Adelaide region comprises the majority share of the state-widecontribution of tourism; however, due to the capital’s larger, more diverse economy, Adelaideis relatively less reliant on the tourism industry than the non-metropolitan regions.
On the other hand, the smaller regional economies are generally characterised by a morecentralised or focussed industry structure (e.g. Kangaroo Island is heavily reliant on tourismwhile Barossa is an iconic tourist destination which is also complemented by a prominentagricultural and food manufacturing sector. Conversely Limestone Coast and Eyre Peninsulaare examples of regions with a greater focus on agriculture).
2. The relative importance of direct compared with indirect tourism impacts and how this variesacross regions.
In this sense, South Australia’s regions can be grouped into three broad categories:i iconic tourism destinations that are relatively heavily reliant on direct tourism activity –
either in absolute terms or relative terms.• Eyre Peninsula, Limestone Coast, Murraylands
ii regions that are not necessarily tourism focussed, but that have strong links to thetourism industry as suppliers of indirect inputs; and• Adelaide, Adelaide Hills, Barossa, Clare Valley, Flinders Ranges and Outback
iii regions that are heavily reliant on both direct tourism and indirect tourism supply.• Fleurieu Peninsula, Riverland, Yorke Peninsula, Riverland, Kangaroo Island
Utilising these bases for comparison, highlights from the modelling results include:· Adelaide: while tourism represents only 2.5% of Adelaide’s regional economy, the industry
directly contributes $1.6 billion to the city’s GRP (68% of tourism’s state-wide contribution).· Barossa and Clare Valley: where tourism represents 2.4% and 2.5% of gross regional
product directly, but 10.4% and 14.5% indirectly.· Kangaroo Island: where tourism represents 16.5% of GRP directly, 44.3% indirectly and
60.8% in total – the highest of any region (both directly and indirectly).
South Australian Regional Tourism Satellite Accounts 2013-14
viiDeloitte Access Economics
Table ii: Contribution of tourism to South Australian regional economies, 2013-14
Region GRP Employment GRP Employment ($m) (‘000) Share of economy (%)Direct tourism contributionAdelaide 1,636 20.4 2.5% 3.8%Adelaide Hills 53 1.1 2.5% 5.5%Barossa 40 0.6 2.4% 4.3%Clare Valley 18 0.3 2.5% 5.4%Eyre Peninsula 121 1.5 3.9% 6.4%Fleurieu Peninsula 113 2.1 5.0% 9.5%Limestone Coast 110 1.8 2.9% 5.7%Murraylands 54 0.7 4.2% 6.4%Riverland 49 0.7 3.3% 5.4%Yorke Peninsula 53 0.9 3.2% 6.6%Flinders Ranges and Outback 123 1.4 2.6% 5.2%Kangaroo Island 36 0.5 16.5% 22.9%Regional South Australia 771 11.7 3.3% 6.3%South Australia 2,407 32.1 2.7% 4.4%Indirect tourism contributionAdelaide 1,067 9.0 1.6% 1.7%Adelaide Hills 207 1.7 9.9% 8.8%Barossa 175 1.5 10.4% 10.3%Clare Valley 104 0.9 14.5% 15.2%Eyre Peninsula 172 1.5 5.6% 6.1%Fleurieu Peninsula 247 2.1 10.9% 9.6%Limestone Coast 149 1.3 3.9% 4.0%Murraylands 112 0.9 8.6% 8.1%Riverland 142 1.2 9.3% 8.9%Yorke Peninsula 183 1.5 10.9% 11.3%Flinders Ranges and Outback 158 1.3 3.4% 5.0%Kangaroo Island 98 0.9 44.3% 42.0%Regional South Australia 1,747 14.9 7.6% 8.0%Rest of Australia 67 0.6South Australia 2,880 24.5 3.2% 3.4%Total tourism contributionAdelaide 2,703 29.4 4.1% 5.4%Adelaide Hills 260 2.8 12.4% 14.3%Barossa 216 2.2 12.8% 14.6%Clare Valley 122 1.2 16.9% 20.6%Eyre Peninsula 293 3.0 9.5% 12.4%Fleurieu Peninsula 360 4.2 15.9% 19.2%Limestone Coast 259 3.1 6.7% 9.8%Murraylands 167 1.7 12.8% 14.5%Riverland 191 1.9 12.6% 14.3%Yorke Peninsula 236 2.4 14.1% 17.9%Flinders Ranges and Outback 281 2.7 6.0% 10.2%Kangaroo Island 134 1.3 60.8% 64.9%Regional South Australia 2,518 26.6 10.9% 14.3%Rest of Australia 67 0.6South Australia 5,287 56.6 5.9% 7.8%
Source: Deloitte Access Economics’ Regional TSA model.
South Australian Regional Tourism Satellite Accounts 2013-14
viiiDeloitte Access Economics
Drivers of indirect trade flows
When considering the direct and indirect impacts, upstream trade flows generated by tourismactivity have a significant impact on the regional economy. Accordingly, understanding the factorsthat influence these flows is important to understanding the regional TSA results.
Indirect trade flows are driven by demand for inputs to the tourism sector. For example, when arestaurant meal is served, produce, cutlery and plates must be procured. When the tourism sectoris analysed at a regional level, the availability of such inputs in different areas determines the level ofinter-regional trade that occurs. To again use the restaurant example, if produce can be sourcedlocally, then the indirect impact of the restaurant meals accrues to the local region. However, if thisis not possible – e.g. if the region does not have a fresh produce industry – then these inputs mustbe imported from other regions.
The overarching drivers of indirect trade from a particular region, therefore, are (1) presence of theindustry that produces the input required, and (2) a relatively small trading distance between thesupply and demand regions.
Reflecting the major area of tourism expenditure, a significant portion of the indirect flows fromregional South Australia is related to tourism spend on the accommodation, food, and retail sectorsin Adelaide. Regions such as the Barossa, Clare Valley, Adelaide Hills and Fleurieu Peninsula havesignificant indirect flows from tourism industry activity due to the prominence of their agricultureand manufacturing sectors and due to their close proximity to Adelaide.
The contribution of individual market segments
The Tourism Satellite Accounts present the contribution of the tourism industry under three broadvisitor groups, based on their place of origin (or source market): same-day visitors, domesticovernight visitors and international visitors.
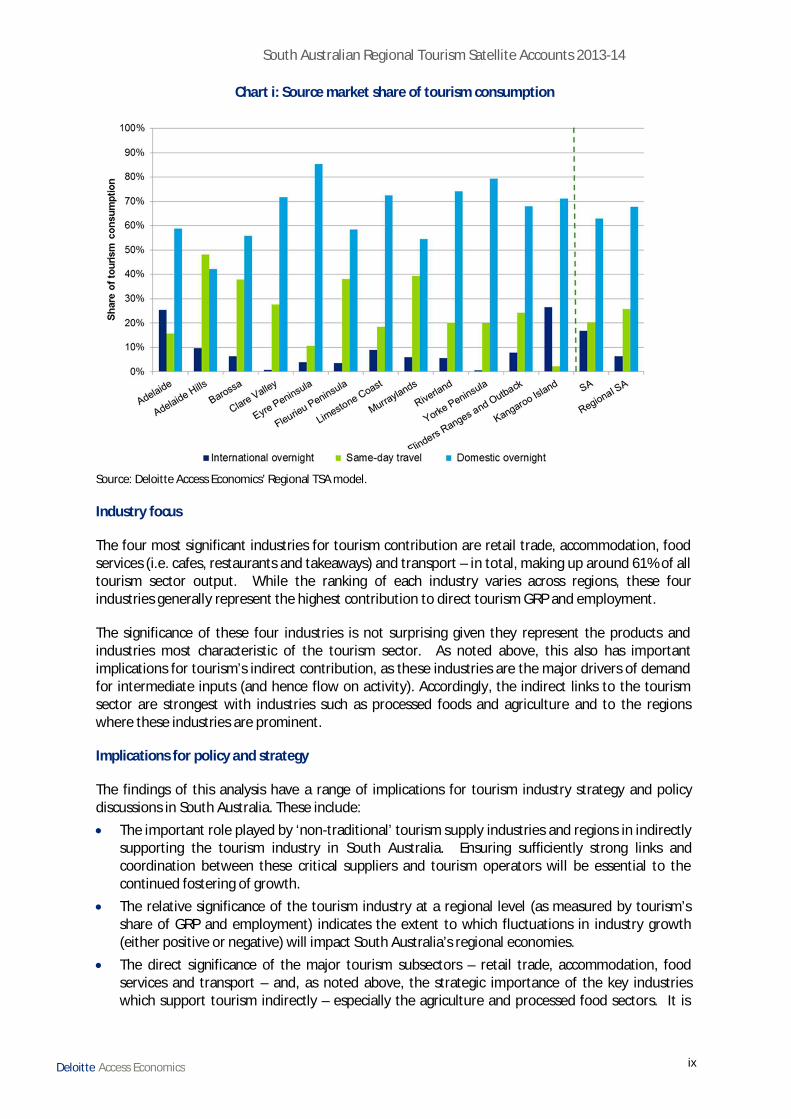
Chart i on the following page shows that international visitors make up 25% of total tourismconsumption in Adelaide, compared to an average of 6% for regional South Australia. Among thenon-metropolitan regions, Kangaroo Island has the greatest reliance on international visitation,making 27% of total tourism consumption in the region. Reflecting this, the vast majority of allinternational tourism consumption – 83% or $926 million – occurs in Adelaide.
Adelaide also catches the majority of domestic overnight visitor consumption for the state, with 51%or $2.1 billion. Additionally, 42% of all same day tourism consumption occurs in the capital withFleurieu Peninsula being the next highest, contributing $229 million or 17% of same dayexpenditure. The regions that are most reliant on same day travel are Adelaide Hills (48% of totaltourism consumption) and Murraylands (39% of total tourism consumption).
South Australian Regional Tourism Satellite Accounts 2013-14
ixDeloitte Access Economics
Chart i: Source market share of tourism consumption
Source: Deloitte Access Economics’ Regional TSA model.
Industry focus
The four most significant industries for tourism contribution are retail trade, accommodation, foodservices (i.e. cafes, restaurants and takeaways) and transport – in total, making up around 61% of alltourism sector output. While the ranking of each industry varies across regions, these fourindustries generally represent the highest contribution to direct tourism GRP and employment.
The significance of these four industries is not surprising given they represent the products andindustries most characteristic of the tourism sector. As noted above, this also has importantimplications for tourism’s indirect contribution, as these industries are the major drivers of demandfor intermediate inputs (and hence flow on activity). Accordingly, the indirect links to the tourismsector are strongest with industries such as processed foods and agriculture and to the regionswhere these industries are prominent.
Implications for policy and strategy
The findings of this analysis have a range of implications for tourism industry strategy and policydiscussions in South Australia. These include:· The important role played by ‘non-traditional’ tourism supply industries and regions in indirectly
supporting the tourism industry in South Australia. Ensuring sufficiently strong links andcoordination between these critical suppliers and tourism operators will be essential to thecontinued fostering of growth.
· The relative significance of the tourism industry at a regional level (as measured by tourism’sshare of GRP and employment) indicates the extent to which fluctuations in industry growth(either positive or negative) will impact South Australia’s regional economies.
· The direct significance of the major tourism subsectors – retail trade, accommodation, foodservices and transport – and, as noted above, the strategic importance of the key industrieswhich support tourism indirectly – especially the agriculture and processed food sectors. It is
South Australian Regional Tourism Satellite Accounts 2013-14
xDeloitte Access Economics
through the coordinated fostering of growth in both of these groups of industries that thefortunes of the tourism sector will most effectively be advanced.
· The reliance of South Australia’s non-metropolitan regions on intrastate overnight and same-daytravel and the regional development opportunity that lies in the continuing to support growth inthese visitor segments.
· The significant untapped potential of international tourism to regional South Australia. If agreater proportion of international visitors to Adelaide can be encouraged to prolong their stayin South Australia for the purposes of visiting the various regional destinations this would resultin material benefits to regional South Australia’s visitor economy.
As the Australian tourism industry continues its pursuit of the 2020 Stretch Goal (Industry Potential),information and analysis such as that presented in this regional TSA report will provide importantevidence to inform policy and industry decision making and, ultimately, to ensure the industry isappropriately positioned to continue to grow its contribution to the South Australian economy.
Deloitte Access Economics
South Australian Regional Tourism Satellite Accounts 2013-14
1Deloitte Access Economics
1 Introduction1.1 Industry context
Tourism is a valuable contributor to the South Australia economy. The latest state Tourism SatelliteAccount (TSA) published by Tourism Research Australia indicates that in 2013-14 the tourismindustry directly contributed $2.4 billion to South Australia’s economy and directly employedapproximately 32,100 people. As tourism is an industry with strong links to other sectors of theeconomy, the indirect impacts brought the industry’s total contribution to the economy to anestimated $5.3 billion, or 5.9% of gross state product.
Adelaide accounts for approximately 84% of all international visitor nights. The remaining portion isdistributed relatively among the other regions. In terms of domestic visitation, Adelaide accounts for43% of domestic nights to the State. Other popular regions are Fleurieu Peninsula (with iconicvineyards and surf spots), Flinders Ranges and Outback, and the Peninsula region (popular amongAdelaide residents for short trips).
In general, those regions that are closer to Adelaide typically attract more visitors and are expectedto receive relatively more of the indirect flow-on effects from direct tourism trade in Adelaide.
Although Adelaide accounts for the most significant portion of tourism expenditure, tourism isrelatively more important to regional South Australia. That is, expenditure related to tourism ismore significant component of all expenditure that occurs in regional South Australia, thanexpenditure that occurs in Adelaide. While the total quantum of tourism activity in Adelaide issignificant, the city is a large and diverse economy. In contrast, South Australia’s regional economiesare significantly smaller and activity will be more focused around fewer industries.
Going forward, there is growing demand for developing a consistent and reliable set of regional leveltourism contribution estimates to improve the information flow for local investment, planning andpolicy. This is the second time Deloitte Access Economics has used this approach to measuring thecontribution of tourism at a regional level and while this methodology is fairly well developed, theprocess of calculating tourism’s contribution to regions should be part of an ongoing discussion.Thus, the analysis and content presented in this publication should act as a spring board for theongoing evaluation of the impact of tourism on the regional economies in South Australia and theother Australian States and Territories. This information will be critical in guiding tourismdevelopment, investment, planning and policy in South Australia, and Australia more broadly.
1.2 Satellite accountingTourism is a unique industry. Unlike most sectors which are characterised by the nature ofproduction (e.g. mining, manufacturing, agriculture), tourism is characterised by the origin of theconsumers. That is, there exists a range of goods and services that are consumed by both locals andvisitors, with the portion that is consumed by visitors being defined as ‘tourism industry’expenditure. Thus, while all the goods that are produced and consumed in meeting tourism demandare embedded in the System of National Accounts, they are not readily apparent because 'tourism' isnot identified as a conventional production industry.
Satellite accounts are an expansion of the national accounts for selected areas of interest (while stillmaintaining the concepts and structures of the core accounts). Tourism Satellite Accounts (TSAs)evaluate tourism industry performance within a national accounting framework, by combining the
South Australian Regional Tourism Satellite Accounts 2013-14
2Deloitte Access Economics
contribution of each of the products and services that make up the industry. Adherence to nationalaccounting techniques makes it possible for TSA estimates to be compared against conventionalindustries such as mining and manufacturing.
The current State and National TSA estimates are based on an internationally recognised andstandardised methodology that has been set by the United Nations World Tourism Organisation(UNWTO) and endorsed by global peak economic and tourism entities. This approach ensures thatAustralian tourism statistics are reliable, relevant and comparable with the tourism statistics of othernations. The regional estimates presented in this report also adhere to the international framework.
Put simply, a TSA measures the direct and indirect impact of tourism on the economy and includesmetrics such as Gross Value Added (GVA), Gross Regional Product (GRP) and employment. It alsoprovides information about tourism consumption, output, taxation and the composition of thetourism industry and its interaction with other industries.
The 'direct' impact of tourism refers to the contribution generated by trade between the visitor andproducer for a good or service that involves a direct physical or economic relationship (e.g. roomrates and additional services provided to visitors staying in a hotel). 'Indirect' impacts represent theflow-on effects created by the demand for inputs from those industries directly supplying goods andservices to visitors (e.g. the hotel industry requirement for fresh and processed food produce for in-house restaurants, as well as bed linen, towels and room furnishings).
1.2.1 State Tourism Satellite Account
The latest State TSAs were produced by TRA (released in April 2015), is the fourth time TRA hasproduced State TSA since it took over from Centre for Economics and Policy (CEP), in 2010, as theprimary reporting agency on State TSAs.
Deloitte Access Economics understands that the data sources and techniques used by TRA have beenconsistent over the three reporting years. However, prior to 2009-10 the CEP and the CooperativeResearch Centre for Sustainable Tourism (STCRC) produced the State TSAs. The modellingtechniques employed by the CEP and STCRC differ to those adopted by TRA. Thus, pre 2009-10 StateTSAs are not directly comparable to current day issues prepared by TRA.
TRA State TSAs go beyond the scope of the National TSA by measuring both the direct and indirectcontribution of the tourism industry. The direct contribution of tourism is strictly measuredaccording to TSA framework defined by UNWTO. However, because the national framework is notdesigned to measure the indirect contribution of tourism, TRA has introduced a second tier to TSAtechnical standards by estimating the economic impacts of indirect effects using input-output (I-O)benchmark modelling techniques.
1.2.2 Regional Tourism Satellite Accounts
The new suite of Regional TSA measures for each of South Australia’s tourism regions complementsboth the national and state technical standards by ensuring consistency with current TSA practices indirect and indirect quantification. The regional nature of the exercise, however, requires a third tierto be introduced to TSA technical standards in order to appropriately determine cross region andcross border trade flows.
Simply applying an economic multiplier to direct tourism value added at a regional level wouldoverstate the sector’s role in some regions and understate it in others. For example, it wouldoverstate the indirect impacts – and therefore the size of the sector – in regions that do not orcannot supply intermediate tourism industry inputs locally, but rather source them from otherregions.
South Australian Regional Tourism Satellite Accounts 2013-14
3Deloitte Access Economics
Effectively and accurately accounting for cross-region trade flows is challenging as reliable data oninter-regional trade arrangements is not currently maintained. Economic models – known as gravitymodels – are typically employed and currently regarded as a best practice approach.
Gravity modelling is a widely applied and empirically tested economic technique to estimating cross-regional trade flows when confronted with incomplete data. The framework is based on economicdemand and supply theory for each commodity, and is impacted by the distance between tworegions as a barrier to trade (e.g. regions with an oversupply of processed foods are more likely toprovide these goods to bordering or closely proximate regions with an excess demand for processedfoods). Deloitte Access Economics employed a gravity modelling technique to develop a concise setof benchmark multipliers that reflect bi-lateral trade flows between South Australia’s regions.
1.3 Accounting conceptsThere are a number of complex steps required to calculate the tourism industry's contribution to aregional economy. Each step is briefly summarised in the following:
1. Derive estimated domestic and international tourism consumption by tourism characteristicexpenditure item . The richest source of data relating to economic activity in the tourismsector is the expenditure patterns of visitors in terms of how much they spend and what theypurchase. The gap in the information is where in Australia the good was purchased. Thus,some manipulation of the available data is required to develop robust regional expenditureprofiles.
2. Isolate taxes and subsidies, and cost of imports sold directly to tourists to derive a ‘clean’profile of tourism consumption at basic prices . The ABS National Accounts: Input-OutputTables (Product Details) (Cat. No. 5215.055.001) contains household final consumption byproduct information, at purchasers’ prices and basic prices, and includes details on net taxes,imports and margins at this level. This Input-Output Product Classification (IOPC) can bedirectly (one-to-one) mapped to tourism characteristic and connected products.
3. Link each of the tourism characteristic (and connected) products to conventional,production-defined industries. That is, to effectively estimate the size of the tourismindustry’s contribution to the economy at a given geographical level requires mapping eachconsumption item to ABS ANZSIC defined production industries. In some cases this is clear cut(e.g. expenditure on hotel accommodation); in others it is not (e.g. expenditure onentertainment and recreation is often poorly defined).
4. Exclude the supply of goods by producers who do not have a direct relationship withconsumers (i.e. cost to retailers of domestic goods sold directly to visitors, including wholesaleand transport margins) using benchmark ratios (derived from ABS input-output (I-O) tables) toderive direct tourism output.
5. Distribute direct tourism output across related supply industries using regional input-outputmultiplier tables, to derive direct tourism value added, regional product and employment .The direct tourism contribution is summed across all industries to calculate the tourismindustry’s contribution to the regional economy.
6. Finally, indirect impacts must also be appropriately represented . At the regional level this is acomplex issue due to the need to account for cross-region trade flows. Simply applying aneconomic multiplier to direct tourism consumption at a regional level would overstate thesector’s role in some regions and understate it in others. To account for these systemdynamics, Deloitte Access Economics has employed a gravity modelling approach to define amatrix of benchmark ratios for deriving indirect effects.
South Australian Regional Tourism Satellite Accounts 2013-14
4Deloitte Access Economics
For consistency and assurance, the regional results are calibrated against the reported 2013-14 StateTSA data for each key output.
Caveat: in order to produce estimates at such a detailed level of granularity, a numberof data manipulations and assumptions are made. The assumptions underlying themodel may have some effect on the quality of the outputs. To limit the potentialimpact, Deloitte Access Economics has employed best practice accounting techniquesand the best available data to provide a robust set of TSA estimates.
For a more detailed understanding of the underlying methodology and concepts to regional tourismsatellite accounting, please refer to the Regional Tourism Satellite Account: Specification Documentand the glossary of terms at the back of this report .
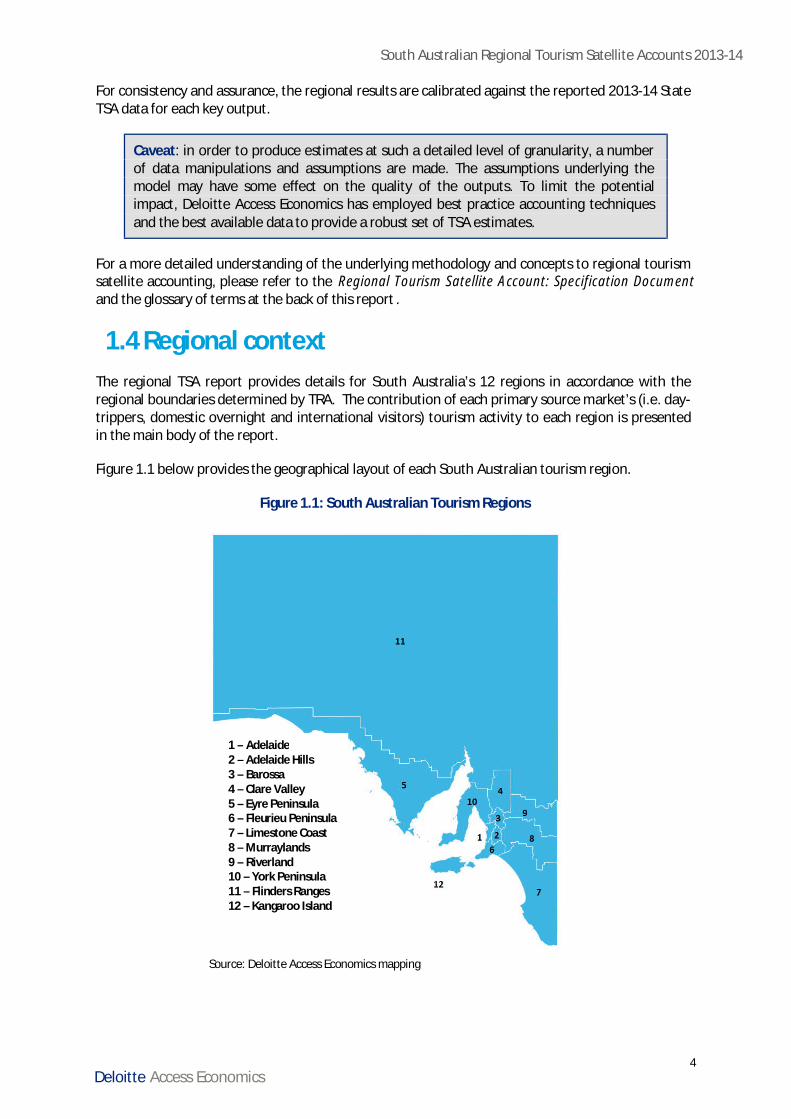
1.4 Regional contextThe regional TSA report provides details for South Australia’s 12 regions in accordance with theregional boundaries determined by TRA. The contribution of each primary source market’s (i.e. day-trippers, domestic overnight and international visitors) tourism activity to each region is presentedin the main body of the report.
Figure 1.1 below provides the geographical layout of each South Australian tourism region.
Figure 1.1: South Australian Tourism Regions
Source: Deloitte Access Economics mapping
1 – Adelaide2 – Adelaide Hills3 – Barossa4 – Clare Valley5 – Eyre Peninsula6 – Fleurieu Peninsula7 – Limestone Coast8 – Murraylands9 – Riverland10 – York Peninsula11 – Flinders Ranges12 – Kangaroo Island
South Australian Regional Tourism Satellite Accounts 2013-14
5Deloitte Access Economics
1.5 Report structureThe remainder of the report is structured as follows:· Section 2: Summary of results : Summarises the key economic aggregates for tourism industry
activity in South Australia’s regions, and provides a ranking of the relative importance oftourism’s contribution to each of the regions.
· Section 3: Key trends in tourism : presents the key historical trends in tourism’s contribution toSouth Australia’s tourism regions, between 2006-07 and 2013-14.
· Section 4: Regional profiles : presents regional profiles for each of the State’s regions. Eachregional profile draws together the key outcomes for tourism’s contribution to the economy in asuccinct, standalone report.
· Appendices: Provides supporting information for the TSA methodology, concepts and definitionsof economic terms.
South Australian Regional Tourism Satellite Accounts 2013-14
6Deloitte Access Economics
2 Summary of ResultsThe primary goal of the research is to quantify the economic contribution of tourism, both direct andindirect, to each region in South Australia for the 2013-14 financial year. The estimates of tourismcontribution presented in this report are in 2013-14 prices. The key indicators presented are:· Gross Regional Product (GRP);· Gross Value Added (GVA);· Employment (both part time and full time employed persons); and· Tourism consumption and output.
For further information on how these indicators are defined, refer to the glossary at the back of thisreport.
2.1 Key tourism aggregatesIn 2013-14 tourism consumption in South Australia totalled $6.7 billion, with Adelaide contributing55% or $3.6 billion and regional South Australia contributing the remaining 45% or $3.0 billion. Thisconsumption generated:· $2.9 billion and $2.2 billion in direct and indirect tourism output, producing $5.1 billion in total
contribution to Adelaide; and $1.4 billion and $3.6 billion in direct and indirect tourism output,producing $5.0 billion in total contribution to regional South Australia;
· $1.5 billion and $0.9 billion in direct and indirect tourism GVA, producing $2.4 billion in totalcontribution to Adelaide; and $0.7 billion and $1.5 billion in direct and indirect tourism GVA,producing $2.2 billion in total contribution to regional South Australia
· $1.6 billion and $1.1 billion in direct and indirect tourism GRP, producing $2.7 billion in totalcontribution to Adelaide; and $0.8 billion and $1.7 billion in direct and indirect tourism GRP,producing $2.5 billion in total contribution to regional South Australia; and
· 20,400 jobs for people employed directly by the tourism industry in Adelaide, with 9,000indirect jobs and a total employment impact in Adelaide of 29,400 people; plus 11,700 jobs forpeople employed directly by the tourism industry in regional South Australia, with 14,900indirect jobs and a total employment impact in regional South Australia of 26,600 people.
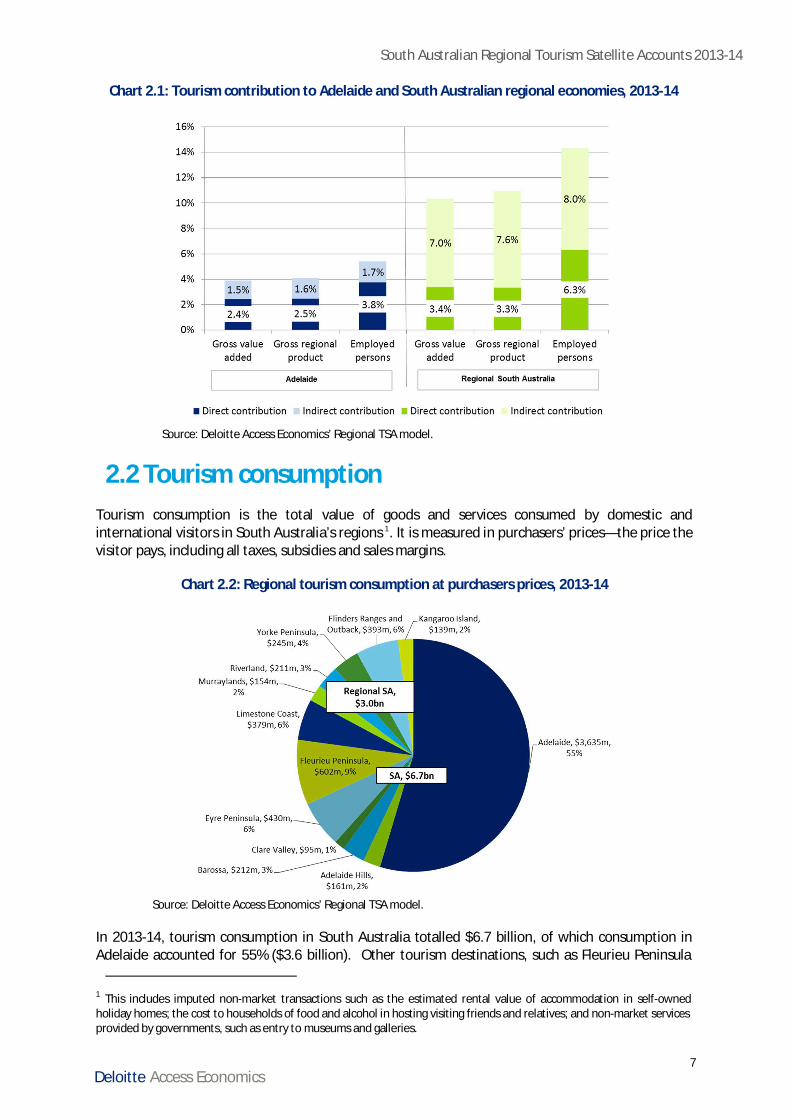
As Adelaide is a large and diverse economy, it is less reliant on any one industry (see Chart 2.1). Thiscontrasts with regional South Australia where activity is clustered around a few industries that arecritical to the area.
While the State’s iconic tourism regions, such as Fleurieu Peninsula and Eyre Peninsula, are relativelyreliant on the tourism industry, the emerging narrative of the contribution tourism makes toregional economies is more complex. This is a result of the strong links between tourism and theindustries, such as agriculture and food manufacturing, which supply intermediate inputs.
South Australian Regional Tourism Satellite Accounts 2013-14
7Deloitte Access Economics
Chart 2.1: Tourism contribution to Adelaide and South Australian regional economies, 2013-14
Source: Deloitte Access Economics’ Regional TSA model.
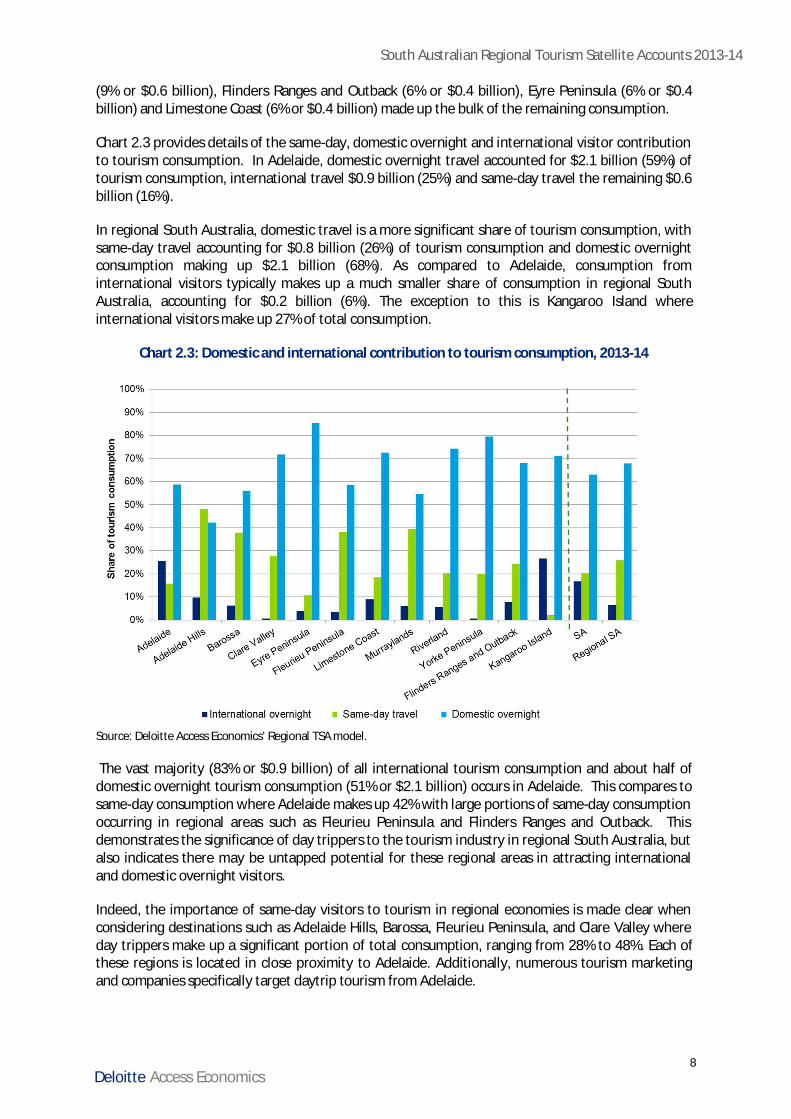
2.2 Tourism consumptionTourism consumption is the total value of goods and services consumed by domestic andinternational visitors in South Australia’s regions 1. It is measured in purchasers’ prices—the price thevisitor pays, including all taxes, subsidies and sales margins.
Chart 2.2: Regional tourism consumption at purchasers prices, 2013-14
Source: Deloitte Access Economics’ Regional TSA model.
In 2013-14, tourism consumption in South Australia totalled $6.7 billion, of which consumption inAdelaide accounted for 55% ($3.6 billion). Other tourism destinations, such as Fleurieu Peninsula
1 This includes imputed non-market transactions such as the estimated rental value of accommodation in self-ownedholiday homes; the cost to households of food and alcohol in hosting visiting friends and relatives; and non-market servicesprovided by governments, such as entry to museums and galleries.
South Australian Regional Tourism Satellite Accounts 2013-14
8Deloitte Access Economics
(9% or $0.6 billion), Flinders Ranges and Outback (6% or $0.4 billion), Eyre Peninsula (6% or $0.4billion) and Limestone Coast (6% or $0.4 billion) made up the bulk of the remaining consumption.
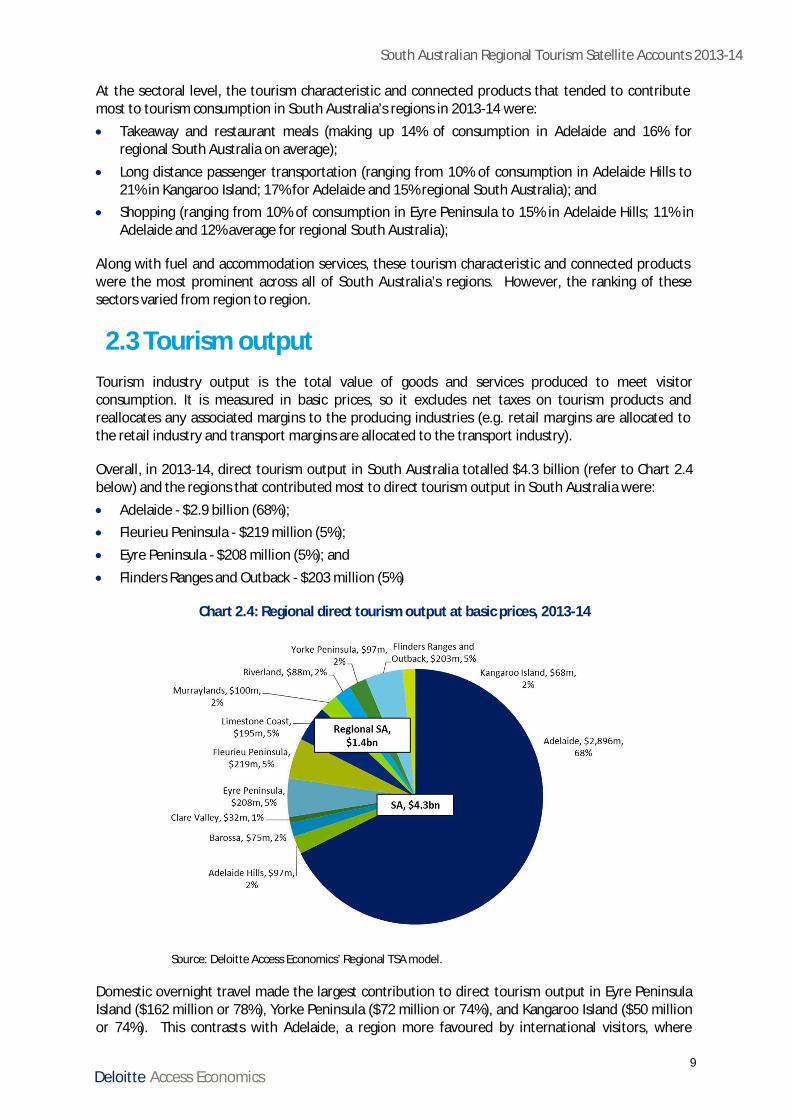
Chart 2.3 provides details of the same-day, domestic overnight and international visitor contributionto tourism consumption. In Adelaide, domestic overnight travel accounted for $2.1 billion (59%) oftourism consumption, international travel $0.9 billion (25%) and same-day travel the remaining $0.6billion (16%).
In regional South Australia, domestic travel is a more significant share of tourism consumption, withsame-day travel accounting for $0.8 billion (26%) of tourism consumption and domestic overnightconsumption making up $2.1 billion (68%). As compared to Adelaide, consumption frominternational visitors typically makes up a much smaller share of consumption in regional SouthAustralia, accounting for $0.2 billion (6%). The exception to this is Kangaroo Island whereinternational visitors make up 27% of total consumption.
Chart 2.3: Domestic and international contribution to tourism consumption, 2013-14
Source: Deloitte Access Economics’ Regional TSA model.
The vast majority (83% or $0.9 billion) of all international tourism consumption and about half ofdomestic overnight tourism consumption (51% or $2.1 billion) occurs in Adelaide. This compares tosame-day consumption where Adelaide makes up 42% with large portions of same-day consumptionoccurring in regional areas such as Fleurieu Peninsula and Flinders Ranges and Outback. Thisdemonstrates the significance of day trippers to the tourism industry in regional South Australia, butalso indicates there may be untapped potential for these regional areas in attracting internationaland domestic overnight visitors.
Indeed, the importance of same-day visitors to tourism in regional economies is made clear whenconsidering destinations such as Adelaide Hills, Barossa, Fleurieu Peninsula, and Clare Valley whereday trippers make up a significant portion of total consumption, ranging from 28% to 48%. Each ofthese regions is located in close proximity to Adelaide. Additionally, numerous tourism marketingand companies specifically target daytrip tourism from Adelaide.
South Australian Regional Tourism Satellite Accounts 2013-14
9Deloitte Access Economics
At the sectoral level, the tourism characteristic and connected products that tended to contributemost to tourism consumption in South Australia’s regions in 2013-14 were:· Takeaway and restaurant meals (making up 14% of consumption in Adelaide and 16% for
regional South Australia on average);· Long distance passenger transportation (ranging from 10% of consumption in Adelaide Hills to
21% in Kangaroo Island; 17% for Adelaide and 15% regional South Australia); and· Shopping (ranging from 10% of consumption in Eyre Peninsula to 15% in Adelaide Hills; 11% in
Adelaide and 12% average for regional South Australia);
Along with fuel and accommodation services, these tourism characteristic and connected productswere the most prominent across all of South Australia’s regions. However, the ranking of thesesectors varied from region to region.
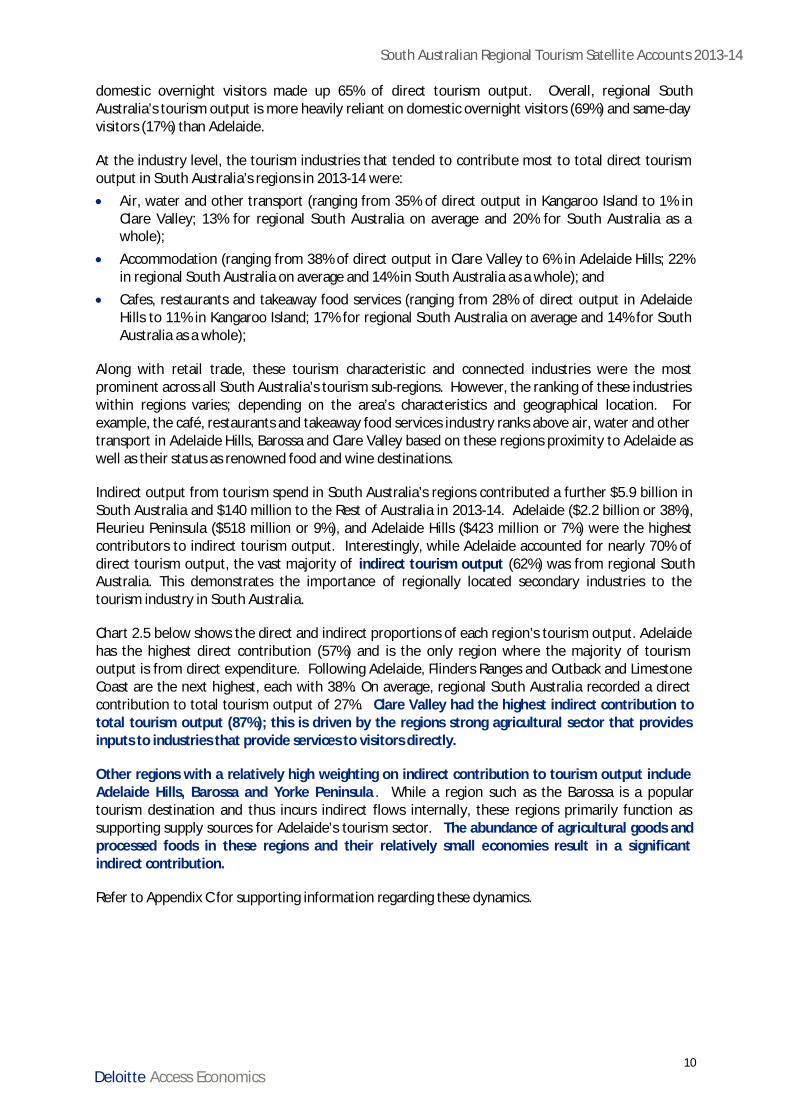
2.3 Tourism outputTourism industry output is the total value of goods and services produced to meet visitorconsumption. It is measured in basic prices, so it excludes net taxes on tourism products andreallocates any associated margins to the producing industries (e.g. retail margins are allocated tothe retail industry and transport margins are allocated to the transport industry).
Overall, in 2013-14, direct tourism output in South Australia totalled $4.3 billion (refer to Chart 2.4below) and the regions that contributed most to direct tourism output in South Australia were:· Adelaide - $2.9 billion (68%);· Fleurieu Peninsula - $219 million (5%);· Eyre Peninsula - $208 million (5%); and· Flinders Ranges and Outback - $203 million (5%)
Chart 2.4: Regional direct tourism output at basic prices, 2013-14
Source: Deloitte Access Economics’ Regional TSA model.
Domestic overnight travel made the largest contribution to direct tourism output in Eyre PeninsulaIsland ($162 million or 78%), Yorke Peninsula ($72 million or 74%), and Kangaroo Island ($50 millionor 74%). This contrasts with Adelaide, a region more favoured by international visitors, where
South Australian Regional Tourism Satellite Accounts 2013-14
10Deloitte Access Economics
domestic overnight visitors made up 65% of direct tourism output. Overall, regional SouthAustralia’s tourism output is more heavily reliant on domestic overnight visitors (69%) and same-dayvisitors (17%) than Adelaide.
At the industry level, the tourism industries that tended to contribute most to total direct tourismoutput in South Australia’s regions in 2013-14 were:· Air, water and other transport (ranging from 35% of direct output in Kangaroo Island to 1% in
Clare Valley; 13% for regional South Australia on average and 20% for South Australia as awhole);
· Accommodation (ranging from 38% of direct output in Clare Valley to 6% in Adelaide Hills; 22%in regional South Australia on average and 14% in South Australia as a whole); and
· Cafes, restaurants and takeaway food services (ranging from 28% of direct output in AdelaideHills to 11% in Kangaroo Island; 17% for regional South Australia on average and 14% for SouthAustralia as a whole);
Along with retail trade, these tourism characteristic and connected industries were the mostprominent across all South Australia’s tourism sub-regions. However, the ranking of these industrieswithin regions varies; depending on the area’s characteristics and geographical location. Forexample, the café, restaurants and takeaway food services industry ranks above air, water and othertransport in Adelaide Hills, Barossa and Clare Valley based on these regions proximity to Adelaide aswell as their status as renowned food and wine destinations.
Indirect output from tourism spend in South Australia’s regions contributed a further $5.9 billion inSouth Australia and $140 million to the Rest of Australia in 2013-14. Adelaide ($2.2 billion or 38%),Fleurieu Peninsula ($518 million or 9%), and Adelaide Hills ($423 million or 7%) were the highestcontributors to indirect tourism output. Interestingly, while Adelaide accounted for nearly 70% ofdirect tourism output, the vast majority of indirect tourism output (62%) was from regional SouthAustralia. This demonstrates the importance of regionally located secondary industries to thetourism industry in South Australia.
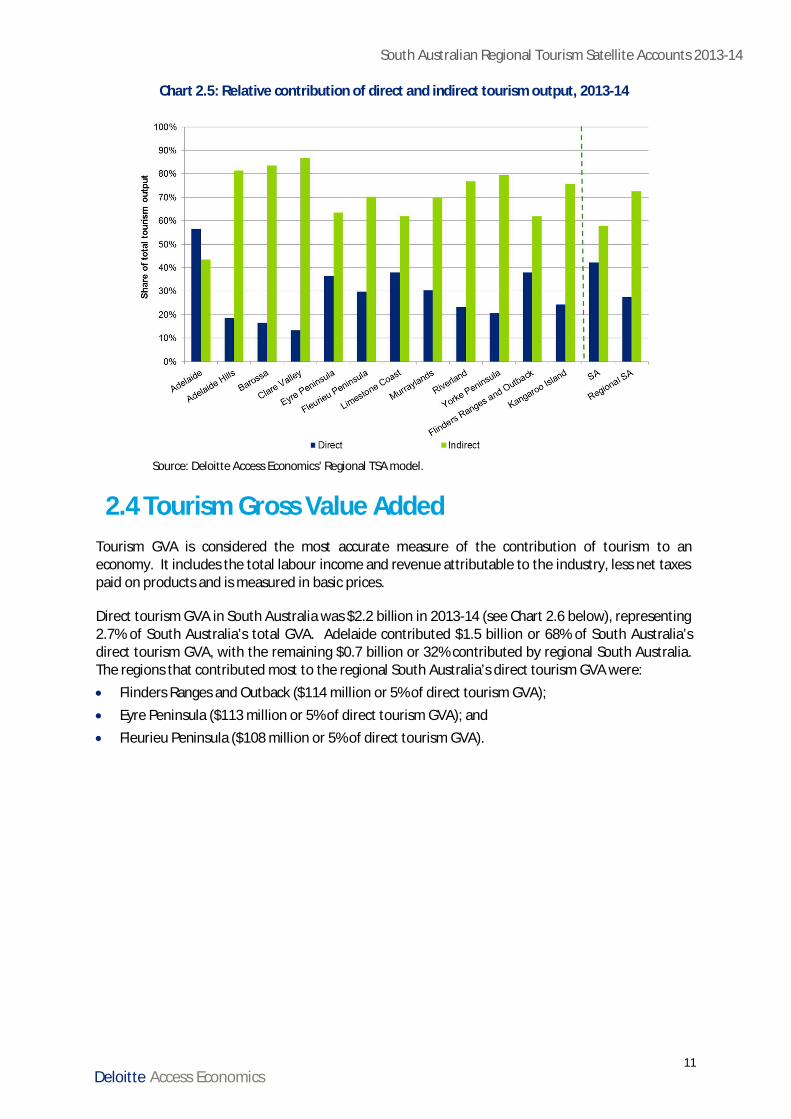
Chart 2.5 below shows the direct and indirect proportions of each region’s tourism output. Adelaidehas the highest direct contribution (57%) and is the only region where the majority of tourismoutput is from direct expenditure. Following Adelaide, Flinders Ranges and Outback and LimestoneCoast are the next highest, each with 38%. On average, regional South Australia recorded a directcontribution to total tourism output of 27%. Clare Valley had the highest indirect contribution tototal tourism output (87%); this is driven by the regions strong agricultural sector that providesinputs to industries that provide services to visitors directly.
Other regions with a relatively high weighting on indirect contribution to tourism output includeAdelaide Hills, Barossa and Yorke Peninsula . While a region such as the Barossa is a populartourism destination and thus incurs indirect flows internally, these regions primarily function assupporting supply sources for Adelaide’s tourism sector. The abundance of agricultural goods andprocessed foods in these regions and their relatively small economies result in a significantindirect contribution.
Refer to Appendix C for supporting information regarding these dynamics.
South Australian Regional Tourism Satellite Accounts 2013-14
11Deloitte Access Economics
Chart 2.5: Relative contribution of direct and indirect tourism output, 2013-14
Source: Deloitte Access Economics’ Regional TSA model.
2.4 Tourism Gross Value AddedTourism GVA is considered the most accurate measure of the contribution of tourism to aneconomy. It includes the total labour income and revenue attributable to the industry, less net taxespaid on products and is measured in basic prices.
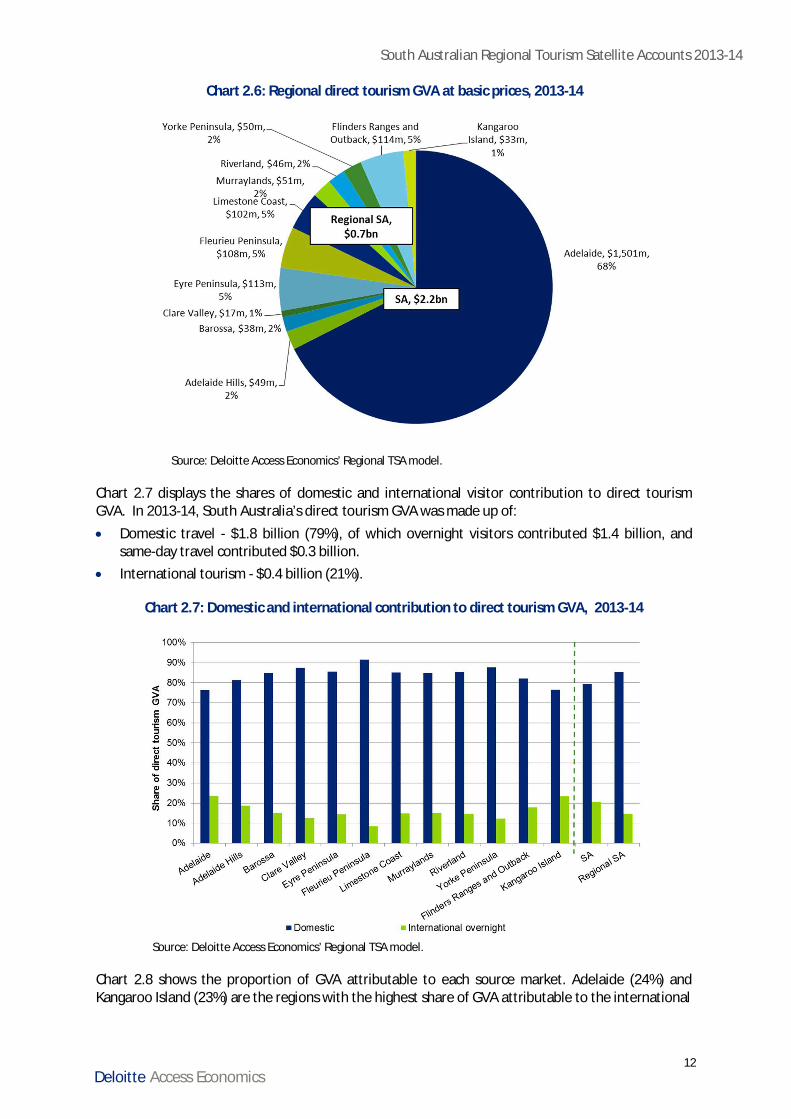
Direct tourism GVA in South Australia was $2.2 billion in 2013-14 (see Chart 2.6 below), representing2.7% of South Australia’s total GVA. Adelaide contributed $1.5 billion or 68% of South Australia’sdirect tourism GVA, with the remaining $0.7 billion or 32% contributed by regional South Australia.The regions that contributed most to the regional South Australia’s direct tourism GVA were:· Flinders Ranges and Outback ($114 million or 5% of direct tourism GVA);· Eyre Peninsula ($113 million or 5% of direct tourism GVA); and· Fleurieu Peninsula ($108 million or 5% of direct tourism GVA).
South Australian Regional Tourism Satellite Accounts 2013-14
12Deloitte Access Economics
Chart 2.6: Regional direct tourism GVA at basic prices, 2013-14
Source: Deloitte Access Economics’ Regional TSA model.
Chart 2.7 displays the shares of domestic and international visitor contribution to direct tourismGVA. In 2013-14, South Australia’s direct tourism GVA was made up of:· Domestic travel - $1.8 billion (79%), of which overnight visitors contributed $1.4 billion, and
same-day travel contributed $0.3 billion.· International tourism - $0.4 billion (21%).
Chart 2.7: Domestic and international contribution to direct tourism GVA, 2013-14
Source: Deloitte Access Economics’ Regional TSA model.
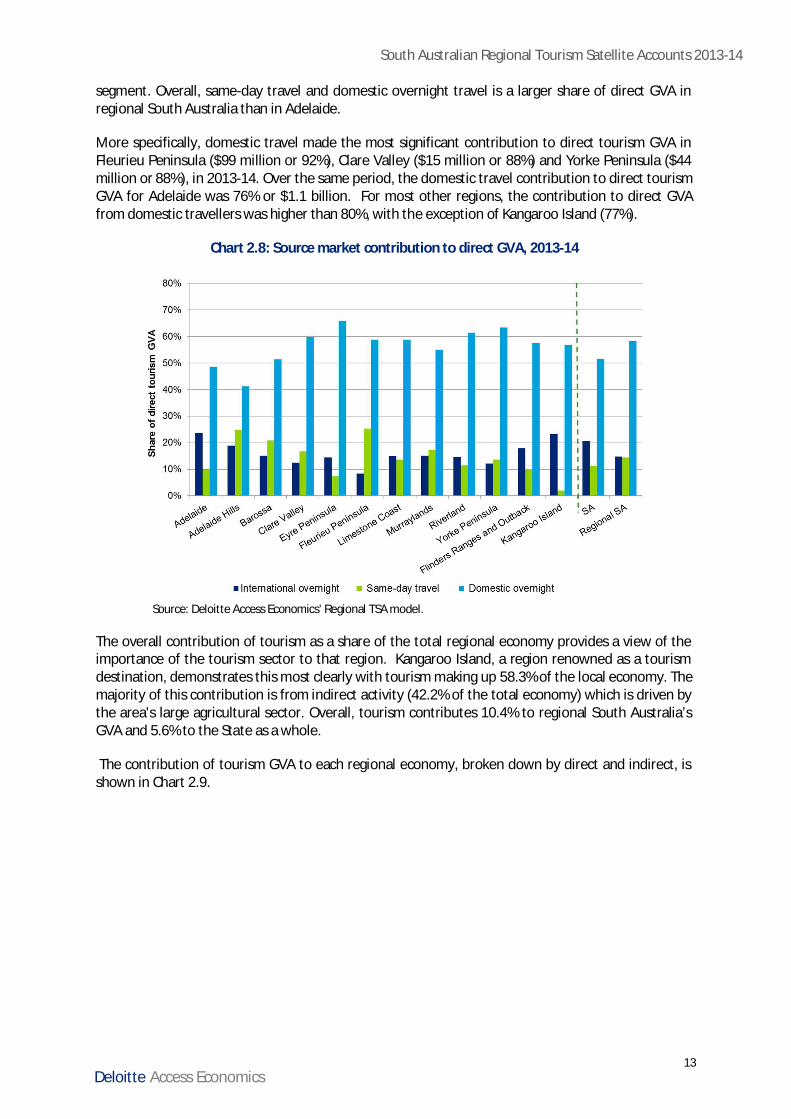
Chart 2.8 shows the proportion of GVA attributable to each source market. Adelaide (24%) andKangaroo Island (23%) are the regions with the highest share of GVA attributable to the international
South Australian Regional Tourism Satellite Accounts 2013-14
13Deloitte Access Economics
segment. Overall, same-day travel and domestic overnight travel is a larger share of direct GVA inregional South Australia than in Adelaide.
More specifically, domestic travel made the most significant contribution to direct tourism GVA inFleurieu Peninsula ($99 million or 92%), Clare Valley ($15 million or 88%) and Yorke Peninsula ($44million or 88%), in 2013-14. Over the same period, the domestic travel contribution to direct tourismGVA for Adelaide was 76% or $1.1 billion. For most other regions, the contribution to direct GVAfrom domestic travellers was higher than 80%, with the exception of Kangaroo Island (77%).
Chart 2.8: Source market contribution to direct GVA, 2013-14
Source: Deloitte Access Economics’ Regional TSA model.
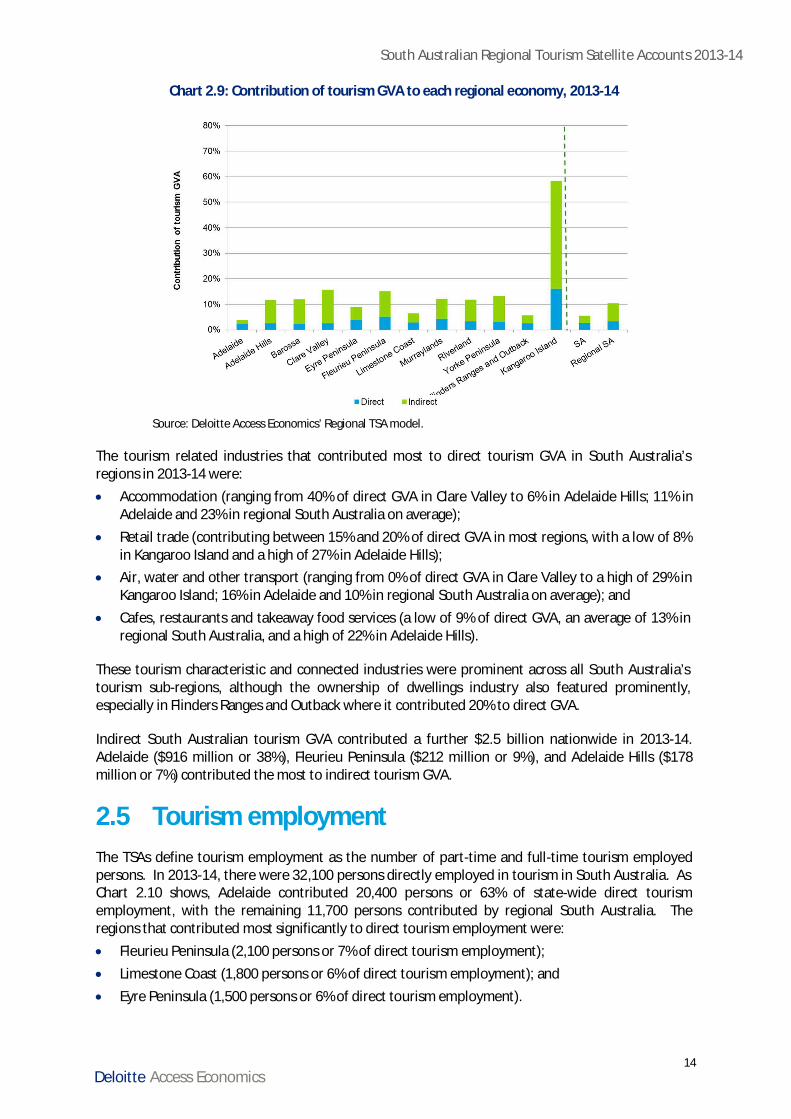
The overall contribution of tourism as a share of the total regional economy provides a view of theimportance of the tourism sector to that region. Kangaroo Island, a region renowned as a tourismdestination, demonstrates this most clearly with tourism making up 58.3% of the local economy. Themajority of this contribution is from indirect activity (42.2% of the total economy) which is driven bythe area’s large agricultural sector. Overall, tourism contributes 10.4% to regional South Australia’sGVA and 5.6% to the State as a whole.
The contribution of tourism GVA to each regional economy, broken down by direct and indirect, isshown in Chart 2.9.
South Australian Regional Tourism Satellite Accounts 2013-14
14Deloitte Access Economics
Chart 2.9: Contribution of tourism GVA to each regional economy, 2013-14
Source: Deloitte Access Economics’ Regional TSA model.
The tourism related industries that contributed most to direct tourism GVA in South Australia’sregions in 2013-14 were:· Accommodation (ranging from 40% of direct GVA in Clare Valley to 6% in Adelaide Hills; 11% in
Adelaide and 23% in regional South Australia on average);· Retail trade (contributing between 15% and 20% of direct GVA in most regions, with a low of 8%
in Kangaroo Island and a high of 27% in Adelaide Hills);· Air, water and other transport (ranging from 0% of direct GVA in Clare Valley to a high of 29% in
Kangaroo Island; 16% in Adelaide and 10% in regional South Australia on average); and· Cafes, restaurants and takeaway food services (a low of 9% of direct GVA, an average of 13% in
regional South Australia, and a high of 22% in Adelaide Hills).
These tourism characteristic and connected industries were prominent across all South Australia’stourism sub-regions, although the ownership of dwellings industry also featured prominently,especially in Flinders Ranges and Outback where it contributed 20% to direct GVA.
Indirect South Australian tourism GVA contributed a further $2.5 billion nationwide in 2013-14.Adelaide ($916 million or 38%), Fleurieu Peninsula ($212 million or 9%), and Adelaide Hills ($178million or 7%) contributed the most to indirect tourism GVA.
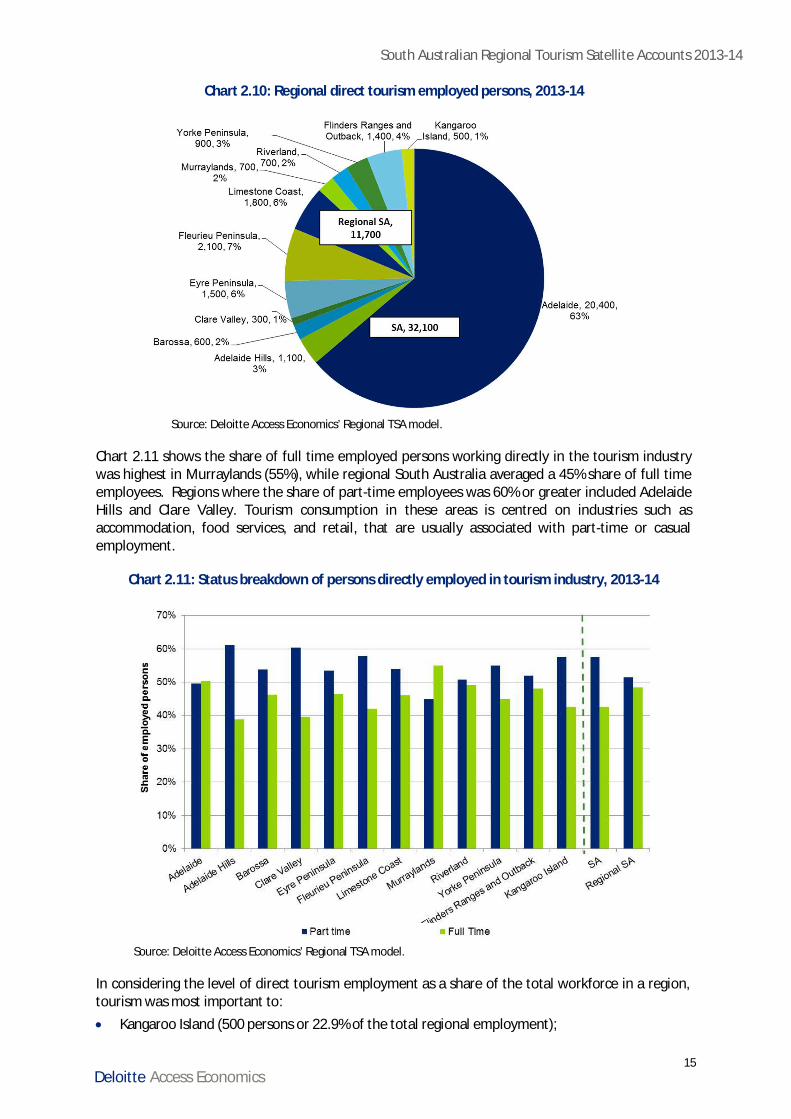
2.5 Tourism employmentThe TSAs define tourism employment as the number of part-time and full-time tourism employedpersons. In 2013-14, there were 32,100 persons directly employed in tourism in South Australia. AsChart 2.10 shows, Adelaide contributed 20,400 persons or 63% of state-wide direct tourismemployment, with the remaining 11,700 persons contributed by regional South Australia. Theregions that contributed most significantly to direct tourism employment were:· Fleurieu Peninsula (2,100 persons or 7% of direct tourism employment);· Limestone Coast (1,800 persons or 6% of direct tourism employment); and· Eyre Peninsula (1,500 persons or 6% of direct tourism employment).
South Australian Regional Tourism Satellite Accounts 2013-14
15Deloitte Access Economics
Chart 2.10: Regional direct tourism employed persons, 2013-14
Source: Deloitte Access Economics’ Regional TSA model.
Chart 2.11 shows the share of full time employed persons working directly in the tourism industrywas highest in Murraylands (55%), while regional South Australia averaged a 45% share of full timeemployees. Regions where the share of part-time employees was 60% or greater included AdelaideHills and Clare Valley. Tourism consumption in these areas is centred on industries such asaccommodation, food services, and retail, that are usually associated with part-time or casualemployment.
Chart 2.11: Status breakdown of persons directly employed in tourism industry, 2013-14
Source: Deloitte Access Economics’ Regional TSA model.
In considering the level of direct tourism employment as a share of the total workforce in a region,tourism was most important to:· Kangaroo Island (500 persons or 22.9% of the total regional employment);
South Australian Regional Tourism Satellite Accounts 2013-14
16Deloitte Access Economics
· Fleurieu Peninsula (2,100 persons or 9.5% of the total regional employment); and· Yorke Peninsula (900 persons or 6.6% of the total regional employment).
While employment in the following economies was relatively less reliant on the tourism industry:· Adelaide (20,400 persons or 3.8% of the total regional employment); and· Barossa (600 persons or 4.3% of the total regional employment).
Additionally, a further 9,000 and 14,900 people were employed indirectly in Adelaide and regionalSouth Australia respectively – with a further 600 indirectly employed throughout the Rest ofAustralia - as a result of supply services to tourism industry activity in 2013-14. Combined withdirect tourism employment, this represented total employment from tourism of 29,400 or 5.4% ofall employment in Adelaide and 26,600 or 14.3% of total employment in regional South Australia.
South Australian Regional Tourism Satellite Accounts 2013-14
17Deloitte Access Economics
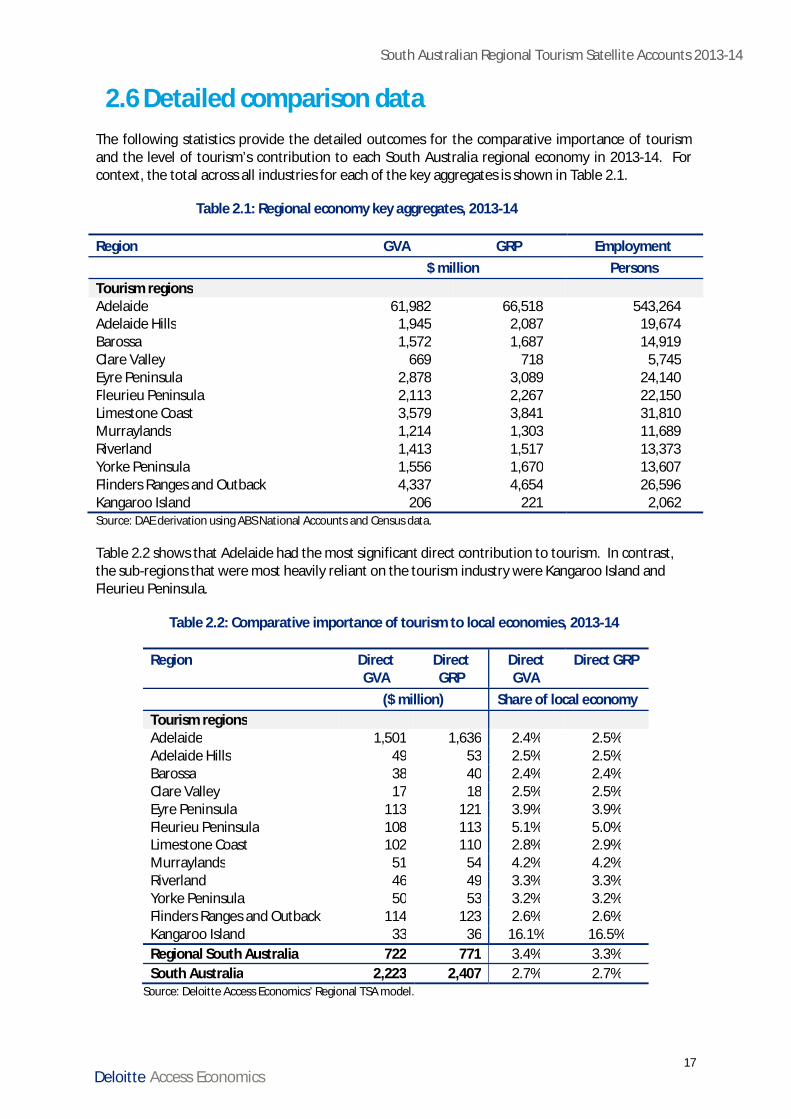
2.6 Detailed comparison dataThe following statistics provide the detailed outcomes for the comparative importance of tourismand the level of tourism’s contribution to each South Australia regional economy in 2013-14. Forcontext, the total across all industries for each of the key aggregates is shown in Table 2.1.
Table 2.1: Regional economy key aggregates, 2013-14
Region GVA GRP Employment $ million PersonsTourism regionsAdelaide 61,982 66,518 543,264Adelaide Hills 1,945 2,087 19,674Barossa 1,572 1,687 14,919Clare Valley 669 718 5,745Eyre Peninsula 2,878 3,089 24,140Fleurieu Peninsula 2,113 2,267 22,150Limestone Coast 3,579 3,841 31,810Murraylands 1,214 1,303 11,689Riverland 1,413 1,517 13,373Yorke Peninsula 1,556 1,670 13,607Flinders Ranges and Outback 4,337 4,654 26,596Kangaroo Island 206 221 2,062Source: DAE derivation using ABS National Accounts and Census data.
Table 2.2 shows that Adelaide had the most significant direct contribution to tourism. In contrast,the sub-regions that were most heavily reliant on the tourism industry were Kangaroo Island andFleurieu Peninsula.
Table 2.2: Comparative importance of tourism to local economies, 2013-14
Region DirectGVA
DirectGRP
DirectGVA
Direct GRP
($ million) Share of local economyTourism regionsAdelaide 1,501 1,636 2.4% 2.5%Adelaide Hills 49 53 2.5% 2.5%Barossa 38 40 2.4% 2.4%Clare Valley 17 18 2.5% 2.5%Eyre Peninsula 113 121 3.9% 3.9%Fleurieu Peninsula 108 113 5.1% 5.0%Limestone Coast 102 110 2.8% 2.9%Murraylands 51 54 4.2% 4.2%Riverland 46 49 3.3% 3.3%Yorke Peninsula 50 53 3.2% 3.2%Flinders Ranges and Outback 114 123 2.6% 2.6%Kangaroo Island 33 36 16.1% 16.5%Regional South Australia 722 771 3.4% 3.3%South Australia 2,223 2,407 2.7% 2.7%
Source: Deloitte Access Economics’ Regional TSA model.
South Australian Regional Tourism Satellite Accounts 2013-14
18Deloitte Access Economics
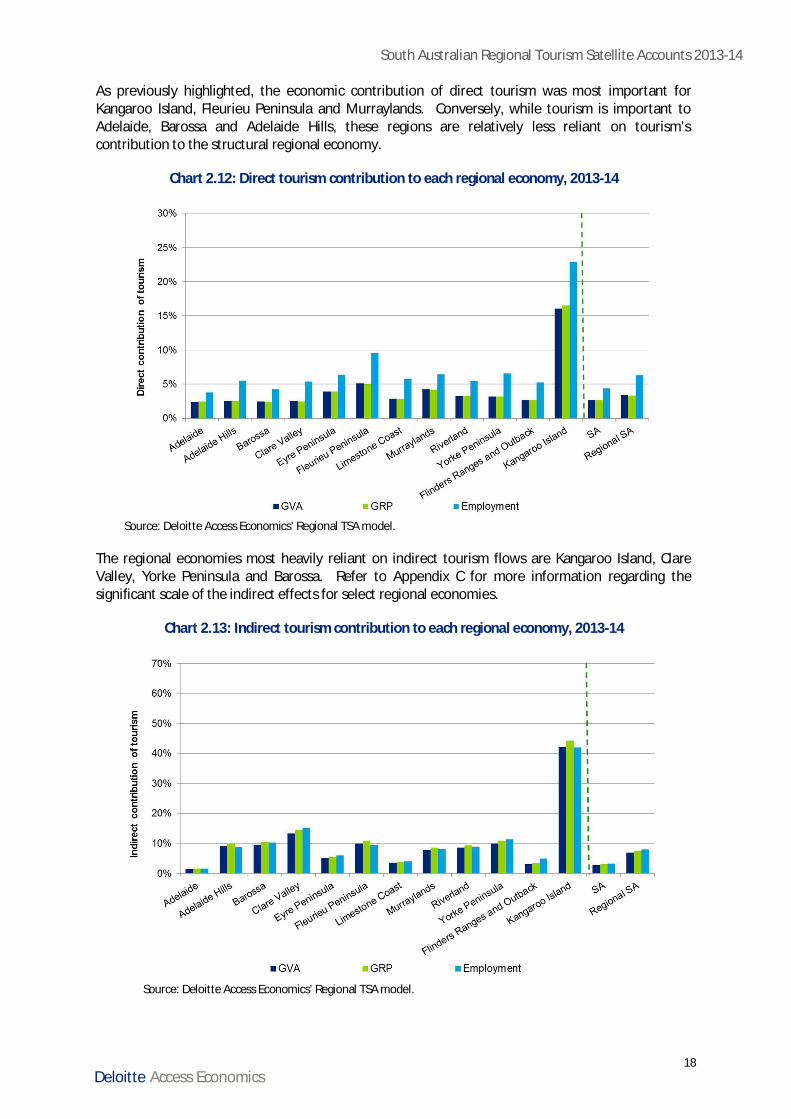
As previously highlighted, the economic contribution of direct tourism was most important forKangaroo Island, Fleurieu Peninsula and Murraylands. Conversely, while tourism is important toAdelaide, Barossa and Adelaide Hills, these regions are relatively less reliant on tourism’scontribution to the structural regional economy.
Chart 2.12: Direct tourism contribution to each regional economy, 2013-14
Source: Deloitte Access Economics’ Regional TSA model.
The regional economies most heavily reliant on indirect tourism flows are Kangaroo Island, ClareValley, Yorke Peninsula and Barossa. Refer to Appendix C for more information regarding thesignificant scale of the indirect effects for select regional economies.
Chart 2.13: Indirect tourism contribution to each regional economy, 2013-14
Source: Deloitte Access Economics’ Regional TSA model.
South Australian Regional Tourism Satellite Accounts 2013-14
19Deloitte Access Economics
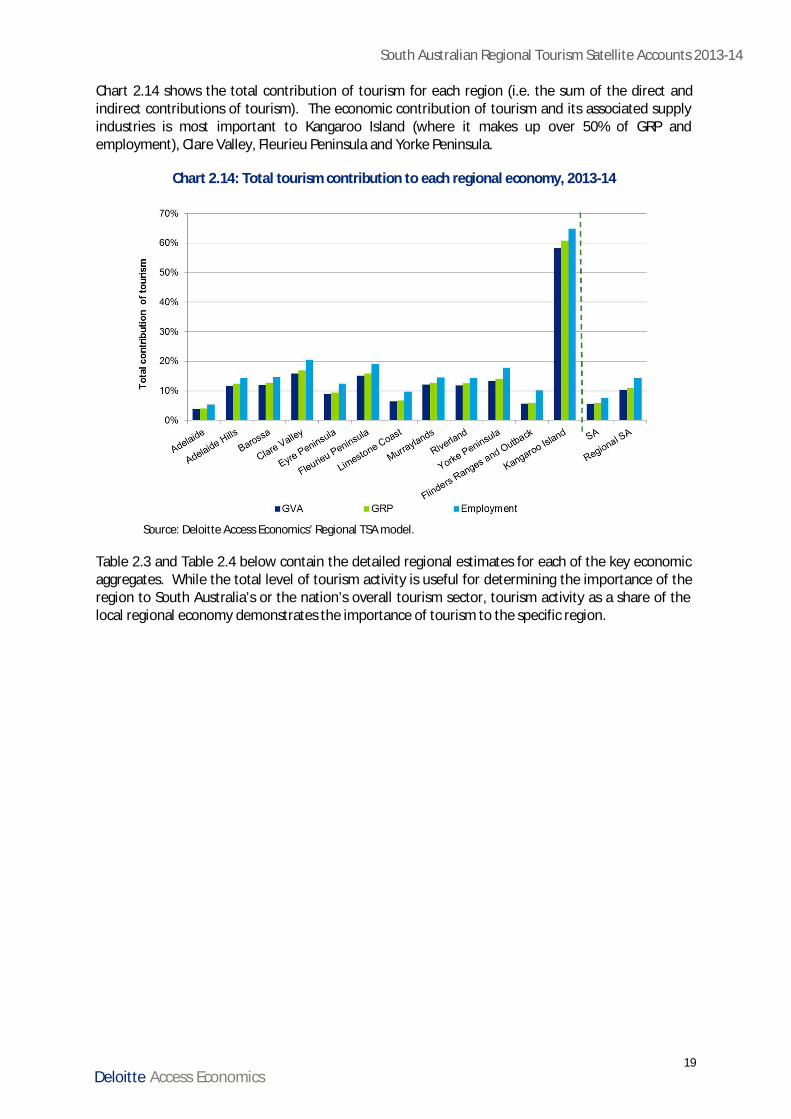
Chart 2.14 shows the total contribution of tourism for each region (i.e. the sum of the direct andindirect contributions of tourism). The economic contribution of tourism and its associated supplyindustries is most important to Kangaroo Island (where it makes up over 50% of GRP andemployment), Clare Valley, Fleurieu Peninsula and Yorke Peninsula.
Chart 2.14: Total tourism contribution to each regional economy, 2013-14
Source: Deloitte Access Economics’ Regional TSA model.
Table 2.3 and Table 2.4 below contain the detailed regional estimates for each of the key economicaggregates. While the total level of tourism activity is useful for determining the importance of theregion to South Australia’s or the nation’s overall tourism sector, tourism activity as a share of thelocal regional economy demonstrates the importance of tourism to the specific region.
South Australian Regional Tourism Satellite Accounts 2013-14
20Deloitte Access Economics
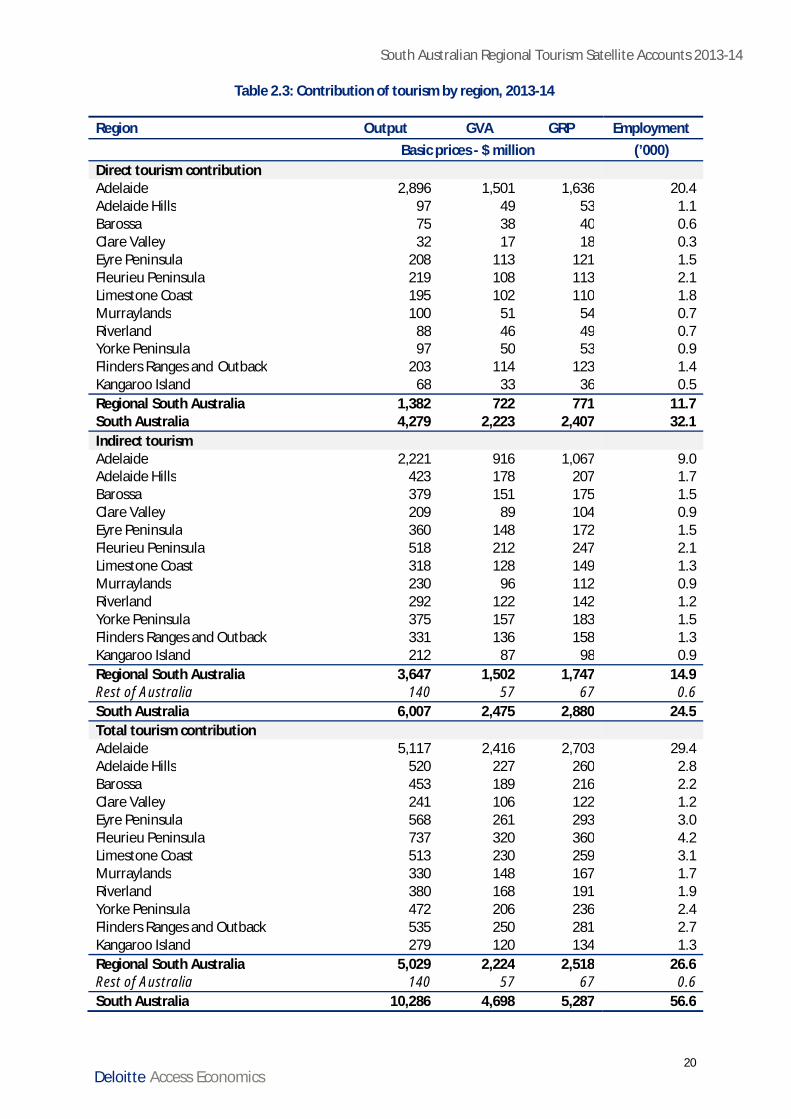
Table 2.3: Contribution of tourism by region, 2013-14
Region Output GVA GRP Employment Basic prices - $ million (’000)Direct tourism contributionAdelaide 2,896 1,501 1,636 20.4Adelaide Hills 97 49 53 1.1Barossa 75 38 40 0.6Clare Valley 32 17 18 0.3Eyre Peninsula 208 113 121 1.5Fleurieu Peninsula 219 108 113 2.1Limestone Coast 195 102 110 1.8Murraylands 100 51 54 0.7Riverland 88 46 49 0.7Yorke Peninsula 97 50 53 0.9Flinders Ranges and Outback 203 114 123 1.4Kangaroo Island 68 33 36 0.5Regional South Australia 1,382 722 771 11.7South Australia 4,279 2,223 2,407 32.1Indirect tourismAdelaide 2,221 916 1,067 9.0Adelaide Hills 423 178 207 1.7Barossa 379 151 175 1.5Clare Valley 209 89 104 0.9Eyre Peninsula 360 148 172 1.5Fleurieu Peninsula 518 212 247 2.1Limestone Coast 318 128 149 1.3Murraylands 230 96 112 0.9Riverland 292 122 142 1.2Yorke Peninsula 375 157 183 1.5Flinders Ranges and Outback 331 136 158 1.3Kangaroo Island 212 87 98 0.9Regional South Australia 3,647 1,502 1,747 14.9Rest of Australia 140 57 67 0.6South Australia 6,007 2,475 2,880 24.5Total tourism contributionAdelaide 5,117 2,416 2,703 29.4Adelaide Hills 520 227 260 2.8Barossa 453 189 216 2.2Clare Valley 241 106 122 1.2Eyre Peninsula 568 261 293 3.0Fleurieu Peninsula 737 320 360 4.2Limestone Coast 513 230 259 3.1Murraylands 330 148 167 1.7Riverland 380 168 191 1.9Yorke Peninsula 472 206 236 2.4Flinders Ranges and Outback 535 250 281 2.7Kangaroo Island 279 120 134 1.3Regional South Australia 5,029 2,224 2,518 26.6Rest of Australia 140 57 67 0.6South Australia 10,286 4,698 5,287 56.6
South Australian Regional Tourism Satellite Accounts 2013-14
21Deloitte Access Economics
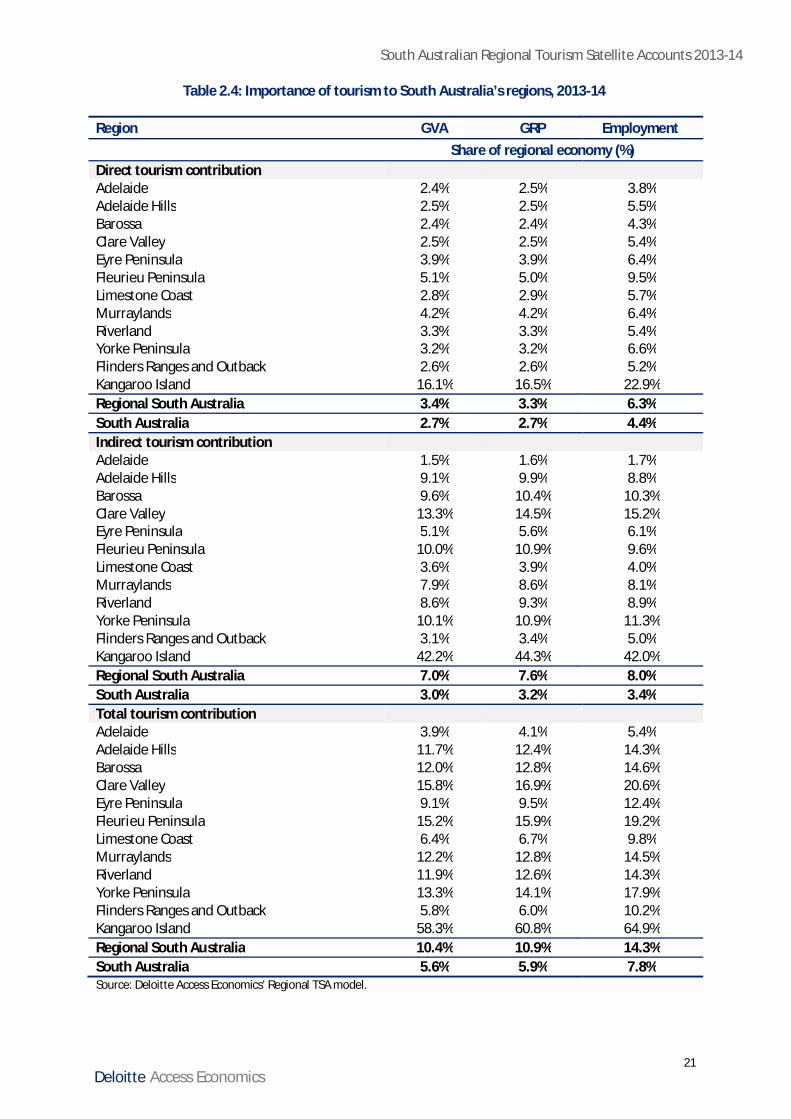
Table 2.4: Importance of tourism to South Australia’s regions, 2013-14
Region GVA GRP Employment Share of regional economy (%)Direct tourism contributionAdelaide 2.4% 2.5% 3.8%Adelaide Hills 2.5% 2.5% 5.5%Barossa 2.4% 2.4% 4.3%Clare Valley 2.5% 2.5% 5.4%Eyre Peninsula 3.9% 3.9% 6.4%Fleurieu Peninsula 5.1% 5.0% 9.5%Limestone Coast 2.8% 2.9% 5.7%Murraylands 4.2% 4.2% 6.4%Riverland 3.3% 3.3% 5.4%Yorke Peninsula 3.2% 3.2% 6.6%Flinders Ranges and Outback 2.6% 2.6% 5.2%Kangaroo Island 16.1% 16.5% 22.9%Regional South Australia 3.4% 3.3% 6.3%South Australia 2.7% 2.7% 4.4%Indirect tourism contributionAdelaide 1.5% 1.6% 1.7%Adelaide Hills 9.1% 9.9% 8.8%Barossa 9.6% 10.4% 10.3%Clare Valley 13.3% 14.5% 15.2%Eyre Peninsula 5.1% 5.6% 6.1%Fleurieu Peninsula 10.0% 10.9% 9.6%Limestone Coast 3.6% 3.9% 4.0%Murraylands 7.9% 8.6% 8.1%Riverland 8.6% 9.3% 8.9%Yorke Peninsula 10.1% 10.9% 11.3%Flinders Ranges and Outback 3.1% 3.4% 5.0%Kangaroo Island 42.2% 44.3% 42.0%Regional South Australia 7.0% 7.6% 8.0%South Australia 3.0% 3.2% 3.4%Total tourism contributionAdelaide 3.9% 4.1% 5.4%Adelaide Hills 11.7% 12.4% 14.3%Barossa 12.0% 12.8% 14.6%Clare Valley 15.8% 16.9% 20.6%Eyre Peninsula 9.1% 9.5% 12.4%Fleurieu Peninsula 15.2% 15.9% 19.2%Limestone Coast 6.4% 6.7% 9.8%Murraylands 12.2% 12.8% 14.5%Riverland 11.9% 12.6% 14.3%Yorke Peninsula 13.3% 14.1% 17.9%Flinders Ranges and Outback 5.8% 6.0% 10.2%Kangaroo Island 58.3% 60.8% 64.9%Regional South Australia 10.4% 10.9% 14.3%South Australia 5.6% 5.9% 7.8%Source: Deloitte Access Economics’ Regional TSA model.
South Australian Regional Tourism Satellite Accounts 2013-14
22Deloitte Access Economics
3 Key trends in tourism3.1 Adelaide
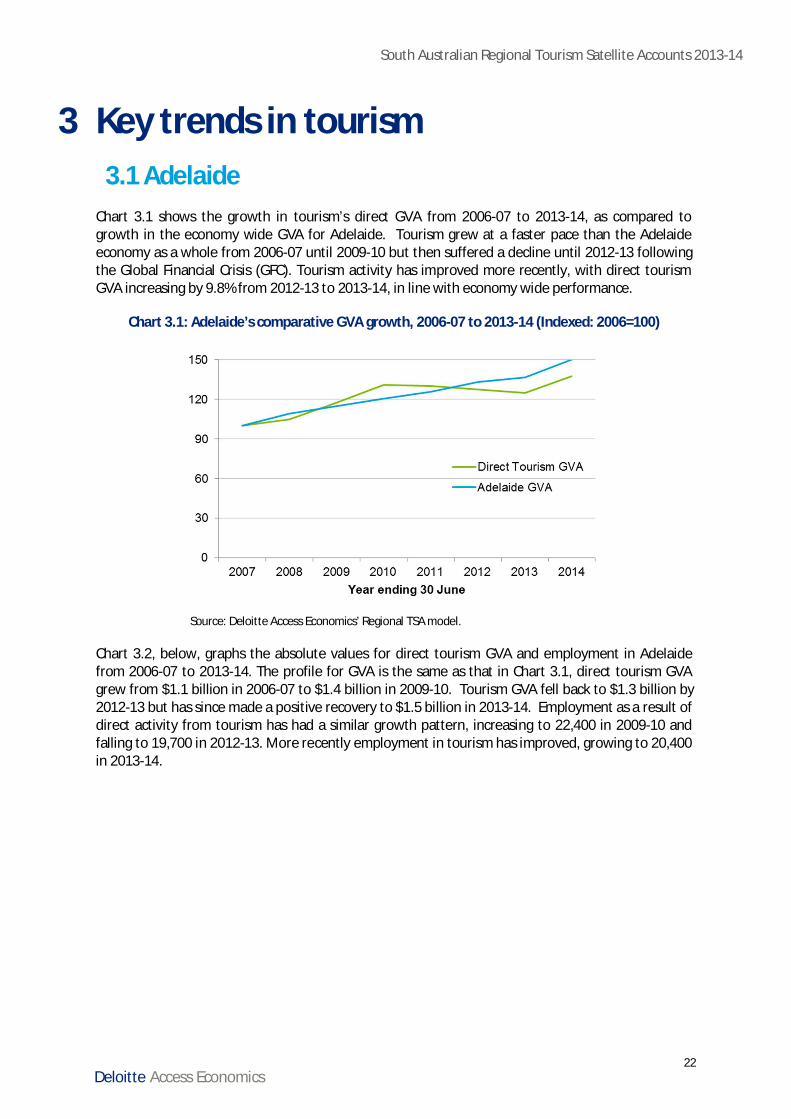
Chart 3.1 shows the growth in tourism’s direct GVA from 2006-07 to 2013-14, as compared togrowth in the economy wide GVA for Adelaide. Tourism grew at a faster pace than the Adelaideeconomy as a whole from 2006-07 until 2009-10 but then suffered a decline until 2012-13 followingthe Global Financial Crisis (GFC). Tourism activity has improved more recently, with direct tourismGVA increasing by 9.8% from 2012-13 to 2013-14, in line with economy wide performance.
Chart 3.1: Adelaide’s comparative GVA growth, 2006-07 to 2013-14 (Indexed: 2006=100)
Source: Deloitte Access Economics’ Regional TSA model.
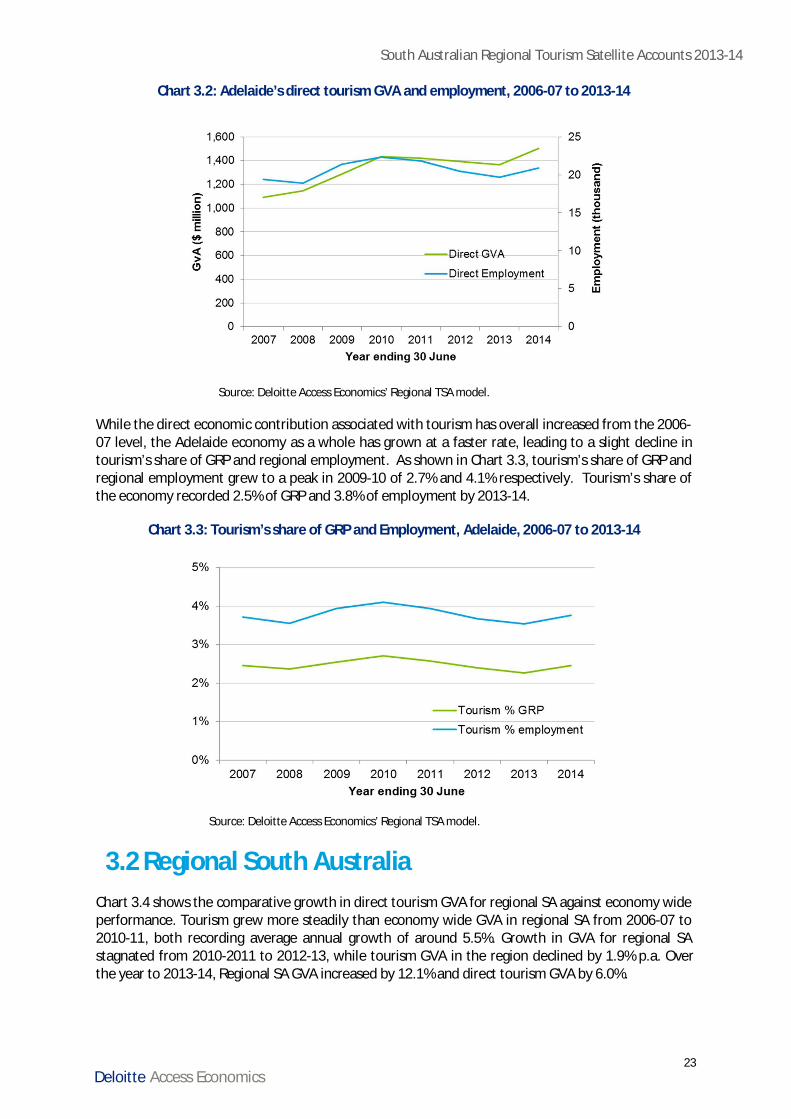
Chart 3.2, below, graphs the absolute values for direct tourism GVA and employment in Adelaidefrom 2006-07 to 2013-14. The profile for GVA is the same as that in Chart 3.1, direct tourism GVAgrew from $1.1 billion in 2006-07 to $1.4 billion in 2009-10. Tourism GVA fell back to $1.3 billion by2012-13 but has since made a positive recovery to $1.5 billion in 2013-14. Employment as a result ofdirect activity from tourism has had a similar growth pattern, increasing to 22,400 in 2009-10 andfalling to 19,700 in 2012-13. More recently employment in tourism has improved, growing to 20,400in 2013-14.
South Australian Regional Tourism Satellite Accounts 2013-14
23Deloitte Access Economics
Chart 3.2: Adelaide’s direct tourism GVA and employment, 2006-07 to 2013-14
Source: Deloitte Access Economics’ Regional TSA model.
While the direct economic contribution associated with tourism has overall increased from the 2006-07 level, the Adelaide economy as a whole has grown at a faster rate, leading to a slight decline intourism’s share of GRP and regional employment. As shown in Chart 3.3, tourism’s share of GRP andregional employment grew to a peak in 2009-10 of 2.7% and 4.1% respectively. Tourism’s share ofthe economy recorded 2.5% of GRP and 3.8% of employment by 2013-14.
Chart 3.3: Tourism’s share of GRP and Employment, Adelaide, 2006-07 to 2013-14
Source: Deloitte Access Economics’ Regional TSA model.
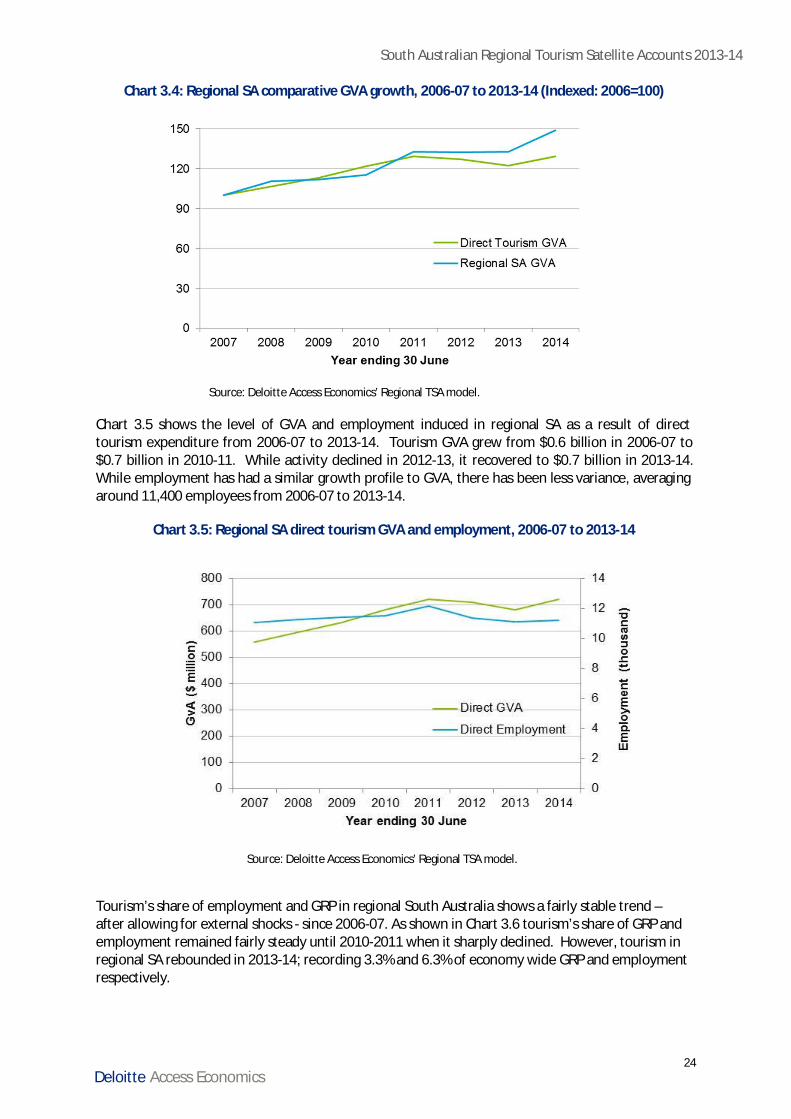
3.2 Regional South AustraliaChart 3.4 shows the comparative growth in direct tourism GVA for regional SA against economy wideperformance. Tourism grew more steadily than economy wide GVA in regional SA from 2006-07 to2010-11, both recording average annual growth of around 5.5%. Growth in GVA for regional SAstagnated from 2010-2011 to 2012-13, while tourism GVA in the region declined by 1.9% p.a. Overthe year to 2013-14, Regional SA GVA increased by 12.1% and direct tourism GVA by 6.0%.
South Australian Regional Tourism Satellite Accounts 2013-14
24Deloitte Access Economics
Chart 3.4: Regional SA comparative GVA growth, 2006-07 to 2013-14 (Indexed: 2006=100)
Source: Deloitte Access Economics’ Regional TSA model.
Chart 3.5 shows the level of GVA and employment induced in regional SA as a result of directtourism expenditure from 2006-07 to 2013-14. Tourism GVA grew from $0.6 billion in 2006-07 to$0.7 billion in 2010-11. While activity declined in 2012-13, it recovered to $0.7 billion in 2013-14.While employment has had a similar growth profile to GVA, there has been less variance, averagingaround 11,400 employees from 2006-07 to 2013-14.
Chart 3.5: Regional SA direct tourism GVA and employment, 2006-07 to 2013-14
Source: Deloitte Access Economics’ Regional TSA model.
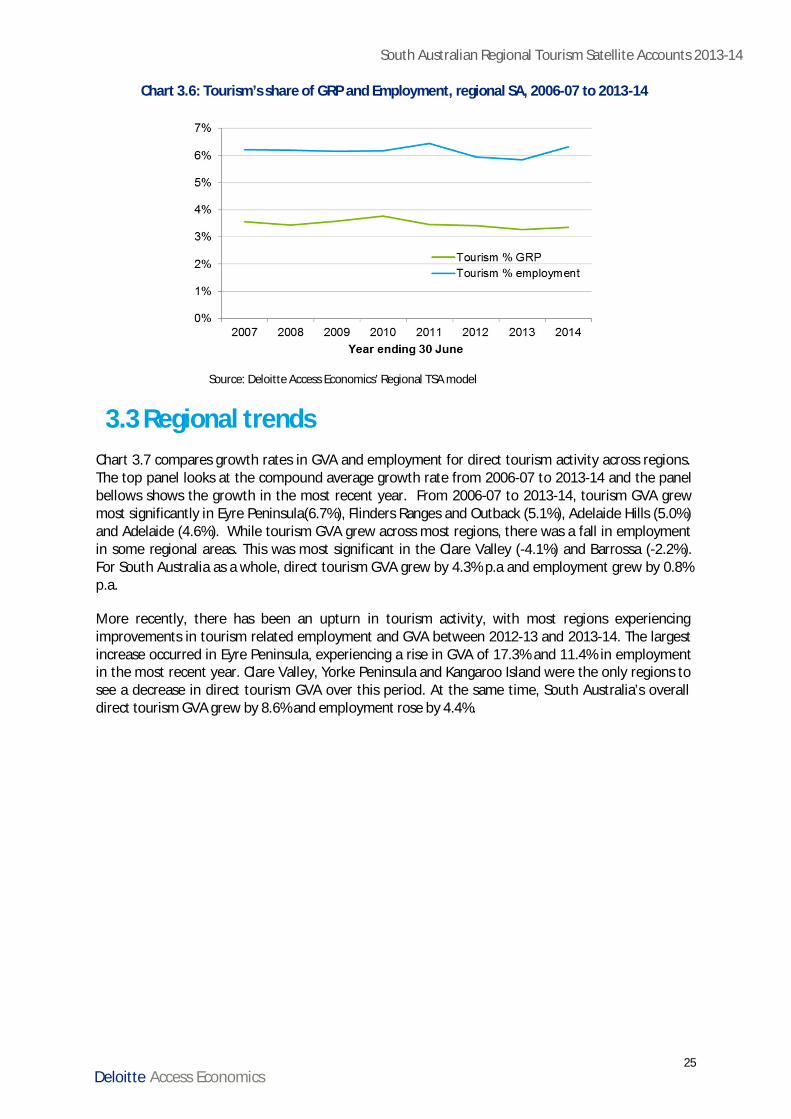
Tourism’s share of employment and GRP in regional South Australia shows a fairly stable trend –after allowing for external shocks - since 2006-07. As shown in Chart 3.6 tourism’s share of GRP andemployment remained fairly steady until 2010-2011 when it sharply declined. However, tourism inregional SA rebounded in 2013-14; recording 3.3% and 6.3% of economy wide GRP and employmentrespectively.
South Australian Regional Tourism Satellite Accounts 2013-14
25Deloitte Access Economics
Chart 3.6: Tourism’s share of GRP and Employment, regional SA, 2006-07 to 2013-14
Source: Deloitte Access Economics’ Regional TSA model
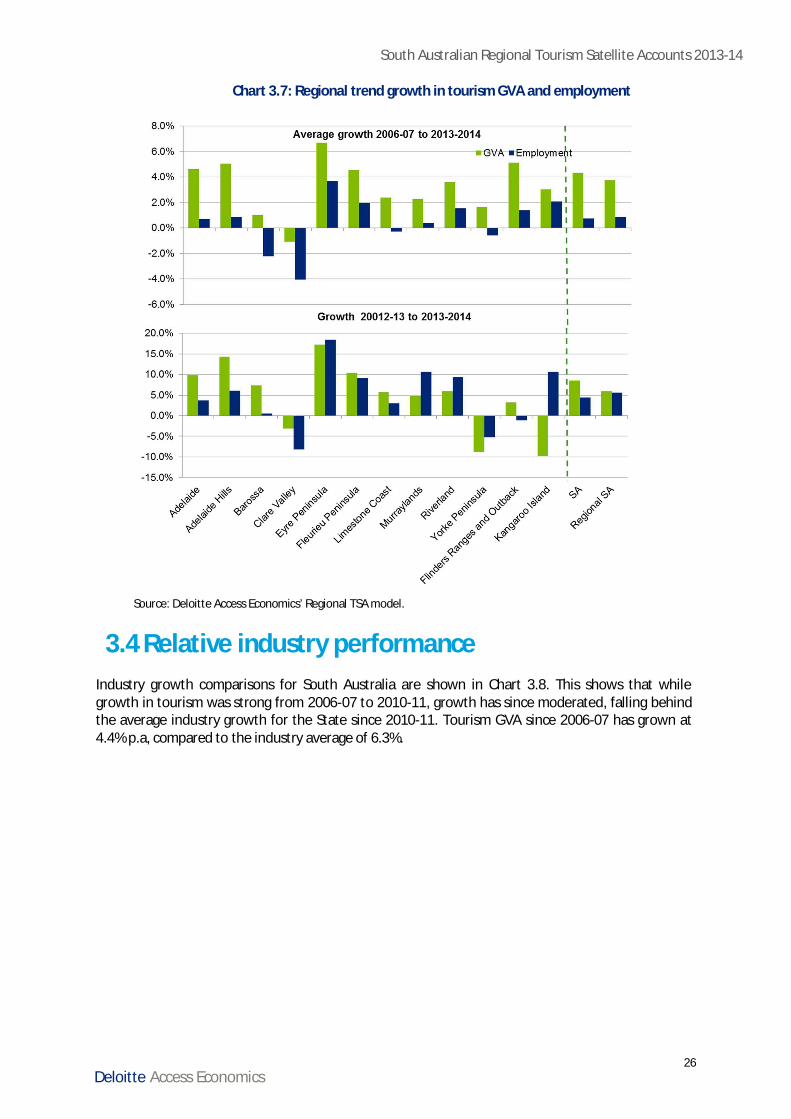
3.3 Regional trendsChart 3.7 compares growth rates in GVA and employment for direct tourism activity across regions.The top panel looks at the compound average growth rate from 2006-07 to 2013-14 and the panelbellows shows the growth in the most recent year. From 2006-07 to 2013-14, tourism GVA grewmost significantly in Eyre Peninsula(6.7%), Flinders Ranges and Outback (5.1%), Adelaide Hills (5.0%)and Adelaide (4.6%). While tourism GVA grew across most regions, there was a fall in employmentin some regional areas. This was most significant in the Clare Valley (-4.1%) and Barrossa (-2.2%).For South Australia as a whole, direct tourism GVA grew by 4.3% p.a and employment grew by 0.8%p.a.
More recently, there has been an upturn in tourism activity, with most regions experiencingimprovements in tourism related employment and GVA between 2012-13 and 2013-14. The largestincrease occurred in Eyre Peninsula, experiencing a rise in GVA of 17.3% and 11.4% in employmentin the most recent year. Clare Valley, Yorke Peninsula and Kangaroo Island were the only regions tosee a decrease in direct tourism GVA over this period. At the same time, South Australia’s overalldirect tourism GVA grew by 8.6% and employment rose by 4.4%.
South Australian Regional Tourism Satellite Accounts 2013-14
26Deloitte Access Economics
Chart 3.7: Regional trend growth in tourism GVA and employment
Source: Deloitte Access Economics’ Regional TSA model.
3.4 Relative industry performanceIndustry growth comparisons for South Australia are shown in Chart 3.8. This shows that whilegrowth in tourism was strong from 2006-07 to 2010-11, growth has since moderated, falling behindthe average industry growth for the State since 2010-11. Tourism GVA since 2006-07 has grown at4.4% p.a, compared to the industry average of 6.3%.
South Australian Regional Tourism Satellite Accounts 2013-14
27Deloitte Access Economics
Chart 3.8: Industry growth comparison (Index: 2006=100)
Source: Deloitte Access Economics’ Regional TSA model.
The following three detailed tables show the historical levels of GVA, GRP and employment from2006-07 to 2013-14. They provide the direct, indirect and total impact of tourism activity.
South Australian Regional Tourism Satellite Accounts 2013-14
28Deloitte Access Economics
Table 3.1: Tourism GVA by region ($ million), 2006-07 to 2013-14
Region 2007 2008 2009 2010 2011 2012 2013 2014Direct impactAdelaide 1,093 1,147 1,286 1,433 1,420 1,393 1,366 1,501Adelaide Hills 35 37 41 43 47 43 43 49Barossa 36 32 33 38 36 36 36 38Clare Valley 18 19 16 17 18 19 17 17Eyre Peninsula 71 81 93 96 102 105 96 113Fleurieu Peninsula 80 92 89 84 111 100 98 108Limestone Coast 86 91 86 98 104 107 96 102Murraylands 44 44 48 45 48 45 49 51Riverland 36 43 39 45 45 47 44 46Yorke Peninsula 44 45 53 56 59 54 55 50Flinders Ranges and Outback 81 89 100 121 120 117 111 114Kangaroo Island 27 24 36 38 33 35 37 33Regional SA 558 596 632 681 721 708 681 722South Australia 1,650 1,743 1,918 2,114 2,141 2,101 2,047 2,223Indirect impactAdelaide 749 759 821 872 850 842 848 916Adelaide Hills 147 149 158 166 167 161 163 178Barossa 139 133 136 145 140 139 141 151Clare Valley 82 83 81 84 83 86 85 89Eyre Peninsula 110 119 129 129 135 136 130 148Fleurieu Peninsula 176 190 184 177 203 191 196 212Limestone Coast 126 129 111 123 130 136 127 128Murraylands 89 87 90 84 88 84 93 96Riverland 103 112 107 115 113 116 116 122Yorke Peninsula 141 141 151 157 159 154 158 157Flinders Ranges 112 118 123 141 139 134 132 136Kangaroo Island 74 71 82 86 82 83 85 87Regional SA 1,299 1,332 1,352 1,409 1,437 1,423 1,426 1,502Rest of Australia 47 48 51 54 53 53 53 57South Australia 2,095 2,138 2,224 2,335 2,340 2,317 2,327 2,475Total impactAdelaide 1,842 1,905 2,107 2,305 2,270 2,234 2,214 2,416Adelaide Hills 182 187 199 209 213 204 206 227Barossa 174 165 169 183 176 175 177 189Clare Valley 100 102 97 102 101 105 103 106Eyre Peninsula 182 200 222 226 237 241 226 261Fleurieu Peninsula 256 281 273 261 314 291 294 320Limestone Coast 212 220 197 220 233 243 224 230Murraylands 133 130 138 129 135 130 142 148Riverland 139 154 145 159 158 163 159 168Yorke Peninsula 185 186 204 214 218 208 212 206Flinders Ranges 193 207 223 262 259 251 243 250Kangaroo Island 101 95 118 124 115 119 122 120Regional SA 1,857 1,928 1,984 2,089 2,158 2,131 2,108 2,224Rest of Australia 47 48 51 54 53 53 53 57South Australia 3,745 3,881 4,142 4,449 4,481 4,418 4,375 4,698
Source: Deloitte Access Economics’ Regional TSA model.
South Australian Regional Tourism Satellite Accounts 2013-14
29Deloitte Access Economics
Table 3.2: Tourism GRP by region ($ million), 2006-07 to 2013-14
Region 2007 2008 2009 2010 2011 2012 2013 2014Direct impactAdelaide 1,199 1,259 1,412 1,568 1,556 1,527 1,489 1,636Adelaide Hills 40 42 45 48 51 48 47 53Barossa 39 35 35 41 39 38 38 40Clare Valley 20 21 17 18 19 20 19 18Eyre Peninsula 77 87 100 104 110 112 103 121Fleurieu Peninsula 86 98 95 91 117 105 104 113Limestone Coast 94 99 93 106 112 115 104 110Murraylands 47 46 51 48 51 48 52 54Riverland 39 46 41 47 47 50 47 49Yorke Peninsula 48 49 56 60 62 57 58 53Flinders Ranges and Outback 88 96 106 129 129 124 118 123Kangaroo Island 29 25 38 40 35 38 40 36Regional SA 607 644 677 732 773 756 730 771South Australia 1,806 1,903 2,089 2,300 2,329 2,283 2,219 2,407Indirect impactAdelaide 861 872 939 1,006 973 980 987 1,067Adelaide Hills 169 172 180 191 191 188 190 207Barossa 160 153 156 168 160 163 165 175Clare Valley 94 95 93 98 95 100 99 104Eyre Peninsula 127 137 147 149 154 159 152 172Fleurieu Peninsula 203 218 210 205 233 223 229 247Limestone Coast 144 148 127 142 149 159 148 149Murraylands 102 100 103 97 100 98 108 112Riverland 119 128 122 133 130 136 135 142Yorke Peninsula 162 163 173 182 182 179 184 183Flinders Ranges 129 136 141 163 159 156 154 158Kangaroo Island 82 79 91 96 90 94 96 98Regional SA 1,492 1,530 1,544 1,623 1,644 1,655 1,659 1,747Rest of Australia 54 55 58 63 61 62 62 67South Australia 2,407 2,457 2,541 2,691 2,678 2,697 2,708 2,880Total impactAdelaide 2,060 2,131 2,350 2,573 2,529 2,507 2,476 2,703Adelaide Hills 209 214 225 240 243 236 237 260Barossa 199 188 191 208 199 201 203 216Clare Valley 114 116 109 116 114 120 118 122Eyre Peninsula 204 225 247 253 264 271 254 293Fleurieu Peninsula 289 316 305 296 350 327 332 360Limestone Coast 239 247 220 247 261 274 253 259Murraylands 149 146 154 145 152 147 160 167Riverland 158 174 163 180 177 185 181 191Yorke Peninsula 211 211 229 241 244 237 242 236Flinders Ranges 217 232 248 292 288 281 272 281Kangaroo Island 111 105 129 136 126 132 136 134Regional SA 2,099 2,174 2,221 2,355 2,417 2,410 2,389 2,518Rest of Australia 54 55 58 63 61 62 62 67South Australia 4,213 4,360 4,629 4,990 5,007 4,979 4,928 5,287
Source: Deloitte Access Economics’ Regional TSA model.
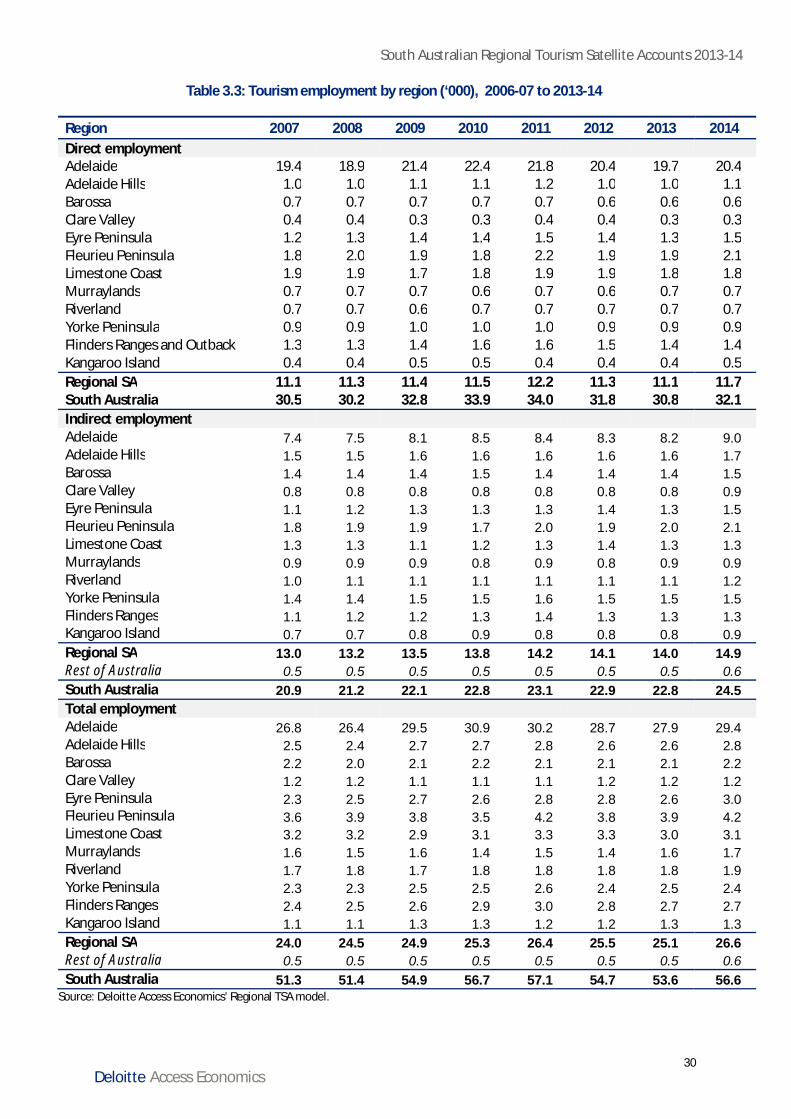
South Australian Regional Tourism Satellite Accounts 2013-14
30Deloitte Access Economics
Table 3.3: Tourism employment by region (‘000), 2006-07 to 2013-14
Region 2007 2008 2009 2010 2011 2012 2013 2014Direct employmentAdelaide 19.4 18.9 21.4 22.4 21.8 20.4 19.7 20.4Adelaide Hills 1.0 1.0 1.1 1.1 1.2 1.0 1.0 1.1Barossa 0.7 0.7 0.7 0.7 0.7 0.6 0.6 0.6Clare Valley 0.4 0.4 0.3 0.3 0.4 0.4 0.3 0.3Eyre Peninsula 1.2 1.3 1.4 1.4 1.5 1.4 1.3 1.5Fleurieu Peninsula 1.8 2.0 1.9 1.8 2.2 1.9 1.9 2.1Limestone Coast 1.9 1.9 1.7 1.8 1.9 1.9 1.8 1.8Murraylands 0.7 0.7 0.7 0.6 0.7 0.6 0.7 0.7Riverland 0.7 0.7 0.6 0.7 0.7 0.7 0.7 0.7Yorke Peninsula 0.9 0.9 1.0 1.0 1.0 0.9 0.9 0.9Flinders Ranges and Outback 1.3 1.3 1.4 1.6 1.6 1.5 1.4 1.4Kangaroo Island 0.4 0.4 0.5 0.5 0.4 0.4 0.4 0.5Regional SA 11.1 11.3 11.4 11.5 12.2 11.3 11.1 11.7South Australia 30.5 30.2 32.8 33.9 34.0 31.8 30.8 32.1Indirect employmentAdelaide 7.4 7.5 8.1 8.5 8.4 8.3 8.2 9.0Adelaide Hills 1.5 1.5 1.6 1.6 1.6 1.6 1.6 1.7Barossa 1.4 1.4 1.4 1.5 1.4 1.4 1.4 1.5Clare Valley 0.8 0.8 0.8 0.8 0.8 0.8 0.8 0.9Eyre Peninsula 1.1 1.2 1.3 1.3 1.3 1.4 1.3 1.5Fleurieu Peninsula 1.8 1.9 1.9 1.7 2.0 1.9 2.0 2.1Limestone Coast 1.3 1.3 1.1 1.2 1.3 1.4 1.3 1.3Murraylands 0.9 0.9 0.9 0.8 0.9 0.8 0.9 0.9Riverland 1.0 1.1 1.1 1.1 1.1 1.1 1.1 1.2Yorke Peninsula 1.4 1.4 1.5 1.5 1.6 1.5 1.5 1.5Flinders Ranges 1.1 1.2 1.2 1.3 1.4 1.3 1.3 1.3Kangaroo Island 0.7 0.7 0.8 0.9 0.8 0.8 0.8 0.9Regional SA 13.0 13.2 13.5 13.8 14.2 14.1 14.0 14.9Rest of Australia 0.5 0.5 0.5 0.5 0.5 0.5 0.5 0.6South Australia 20.9 21.2 22.1 22.8 23.1 22.9 22.8 24.5Total employmentAdelaide 26.8 26.4 29.5 30.9 30.2 28.7 27.9 29.4Adelaide Hills 2.5 2.4 2.7 2.7 2.8 2.6 2.6 2.8Barossa 2.2 2.0 2.1 2.2 2.1 2.1 2.1 2.2Clare Valley 1.2 1.2 1.1 1.1 1.1 1.2 1.2 1.2Eyre Peninsula 2.3 2.5 2.7 2.6 2.8 2.8 2.6 3.0Fleurieu Peninsula 3.6 3.9 3.8 3.5 4.2 3.8 3.9 4.2Limestone Coast 3.2 3.2 2.9 3.1 3.3 3.3 3.0 3.1Murraylands 1.6 1.5 1.6 1.4 1.5 1.4 1.6 1.7Riverland 1.7 1.8 1.7 1.8 1.8 1.8 1.8 1.9Yorke Peninsula 2.3 2.3 2.5 2.5 2.6 2.4 2.5 2.4Flinders Ranges 2.4 2.5 2.6 2.9 3.0 2.8 2.7 2.7Kangaroo Island 1.1 1.1 1.3 1.3 1.2 1.2 1.3 1.3Regional SA 24.0 24.5 24.9 25.3 26.4 25.5 25.1 26.6Rest of Australia 0.5 0.5 0.5 0.5 0.5 0.5 0.5 0.6South Australia 51.3 51.4 54.9 56.7 57.1 54.7 53.6 56.6
Source: Deloitte Access Economics’ Regional TSA model.
South Australian Regional Tourism Satellite Accounts 2013-14
31Deloitte Access Economics
4 Regional profilesThe following regional profiles present and rank the economic contribution of tourism to each of the12 tourism regions in South Australia, both in absolute level terms and as a share of the regionaleconomy. Each profile is designed to be a standalone factsheet that could be readily interpretedindependently from the main consolidated report. For this reason, some components of the text arerepeated for each regional profile.
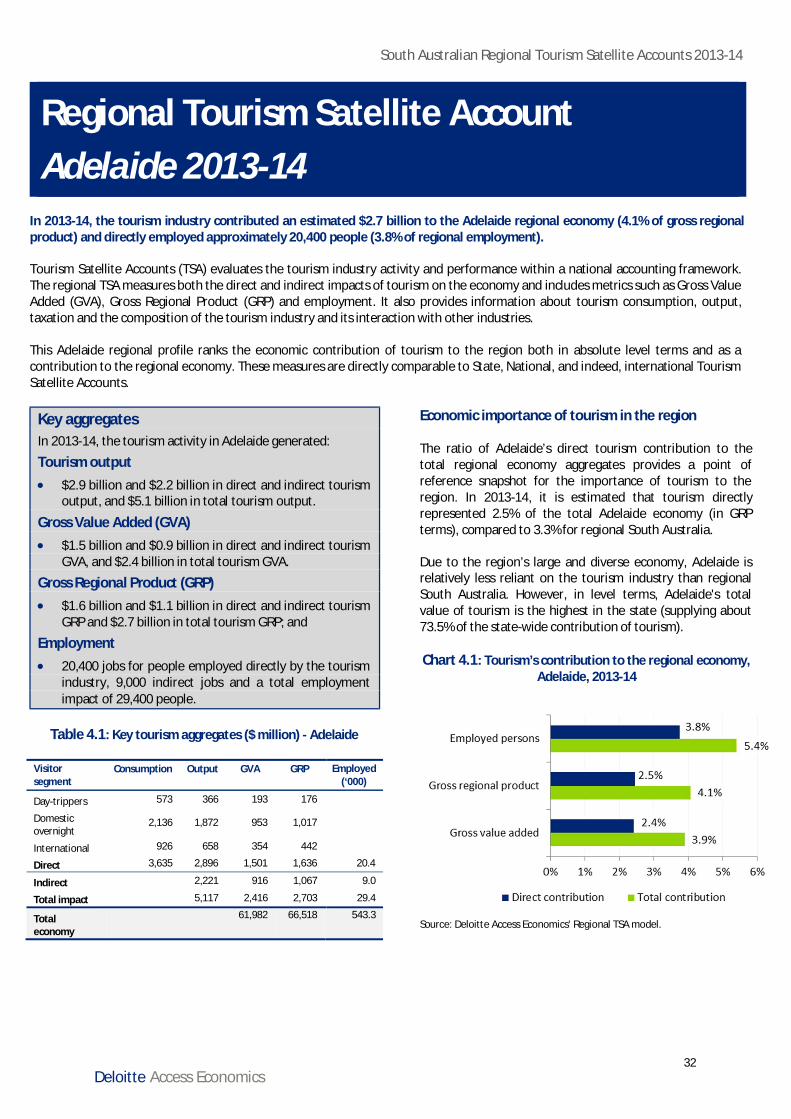
South Australian Regional Tourism Satellite Accounts 2013-14
32Deloitte Access Economics
Regional Tourism Satellite AccountAdelaide 2013-14
In 2013-14, the tourism industry contributed an estimated $2.7 billion to the Adelaide regional economy (4.1% of gross regionalproduct) and directly employed approximately 20,400 people (3.8% of regional employment).
Tourism Satellite Accounts (TSA) evaluates the tourism industry activity and performance within a national accounting framework.The regional TSA measures both the direct and indirect impacts of tourism on the economy and includes metrics such as Gross ValueAdded (GVA), Gross Regional Product (GRP) and employment. It also provides information about tourism consumption, output,taxation and the composition of the tourism industry and its interaction with other industries.
This Adelaide regional profile ranks the economic contribution of tourism to the region both in absolute level terms and as acontribution to the regional economy. These measures are directly comparable to State, National, and indeed, international TourismSatellite Accounts.
Key aggregatesIn 2013-14, the tourism activity in Adelaide generated:
Tourism output· $2.9 billion and $2.2 billion in direct and indirect tourism
output, and $5.1 billion in total tourism output.
Gross Value Added (GVA)· $1.5 billion and $0.9 billion in direct and indirect tourism
GVA, and $2.4 billion in total tourism GVA.
Gross Regional Product (GRP)· $1.6 billion and $1.1 billion in direct and indirect tourism
GRP and $2.7 billion in total tourism GRP; and
Employment· 20,400 jobs for people employed directly by the tourism
industry, 9,000 indirect jobs and a total employmentimpact of 29,400 people.
Table 4.1: Key tourism aggregates ($ million) - Adelaide
Visitorsegment
Consumption Output GVA GRP Employed(‘000)
Day-trippers 573 366 193 176
Domesticovernight
2,136 1,872 953 1,017
International 926 658 354 442
Direct 3,635 2,896 1,501 1,636 20.4
Indirect 2,221 916 1,067 9.0
Total impact 5,117 2,416 2,703 29.4
Totaleconomy
61,982 66,518 543.3
Economic importance of tourism in the region
The ratio of Adelaide’s direct tourism contribution to thetotal regional economy aggregates provides a point ofreference snapshot for the importance of tourism to theregion. In 2013-14, it is estimated that tourism directlyrepresented 2.5% of the total Adelaide economy (in GRPterms), compared to 3.3% for regional South Australia.
Due to the region’s large and diverse economy, Adelaide isrelatively less reliant on the tourism industry than regionalSouth Australia. However, in level terms, Adelaide's totalvalue of tourism is the highest in the state (supplying about73.5% of the state-wide contribution of tourism).
Chart 4.1: Tourism’s contribution to the regional economy,Adelaide, 2013-14
Source: Deloitte Access Economics’ Regional TSA model.
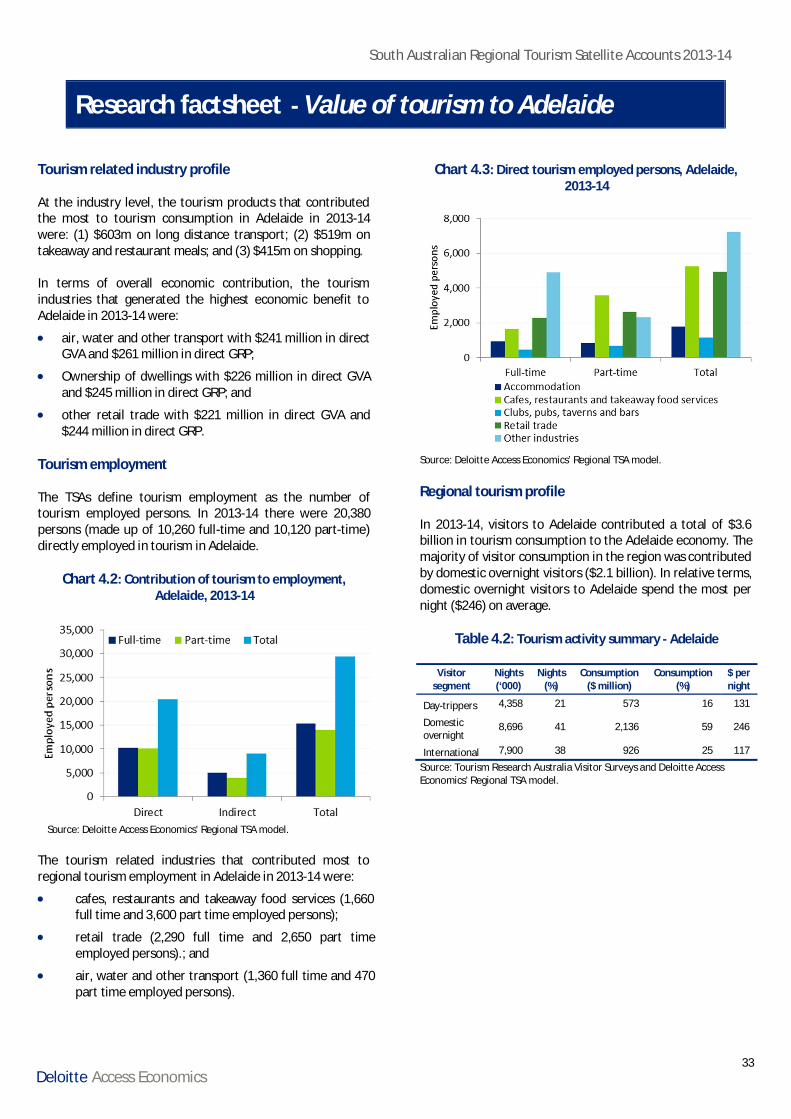
South Australian Regional Tourism Satellite Accounts 2013-14
33Deloitte Access Economics
Research factsheet - Value of tourism to Adelaide
Tourism related industry profile
At the industry level, the tourism products that contributedthe most to tourism consumption in Adelaide in 2013-14were: (1) $603m on long distance transport; (2) $519m ontakeaway and restaurant meals; and (3) $415m on shopping.
In terms of overall economic contribution, the tourismindustries that generated the highest economic benefit toAdelaide in 2013-14 were:
· air, water and other transport with $241 million in directGVA and $261 million in direct GRP;
· Ownership of dwellings with $226 million in direct GVAand $245 million in direct GRP; and
· other retail trade with $221 million in direct GVA and$244 million in direct GRP.
Tourism employment
The TSAs define tourism employment as the number oftourism employed persons. In 2013-14 there were 20,380persons (made up of 10,260 full-time and 10,120 part-time)directly employed in tourism in Adelaide.
Chart 4.2: Contribution of tourism to employment,Adelaide, 2013-14
Source: Deloitte Access Economics’ Regional TSA model.
The tourism related industries that contributed most toregional tourism employment in Adelaide in 2013-14 were:
Chart 4.3: Direct tourism employed persons, Adelaide,2013-14
Source: Deloitte Access Economics’ Regional TSA model.
Regional tourism profile
In 2013-14, visitors to Adelaide contributed a total of $3.6billion in tourism consumption to the Adelaide economy. Themajority of visitor consumption in the region was contributedby domestic overnight visitors ($2.1 billion). In relative terms,domestic overnight visitors to Adelaide spend the most pernight ($246) on average.
Table 4.2: Tourism activity summary - Adelaide
Visitorsegment
Nights(‘000)
Nights(%)
Consumption($ million)
Consumption(%)
$ pernight
Day-trippers 4,358 21 573 16 131
Domesticovernight
8,696 41 2,136 59 246
International 7,900 38 926 25 117
Source: Tourism Research Australia Visitor Surveys and Deloitte AccessEconomics’ Regional TSA model.
· cafes, restaurants and takeaway food services (1,660full time and 3,600 part time employed persons);
· retail trade (2,290 full time and 2,650 part timeemployed persons).; and
· air, water and other transport (1,360 full time and 470part time employed persons).
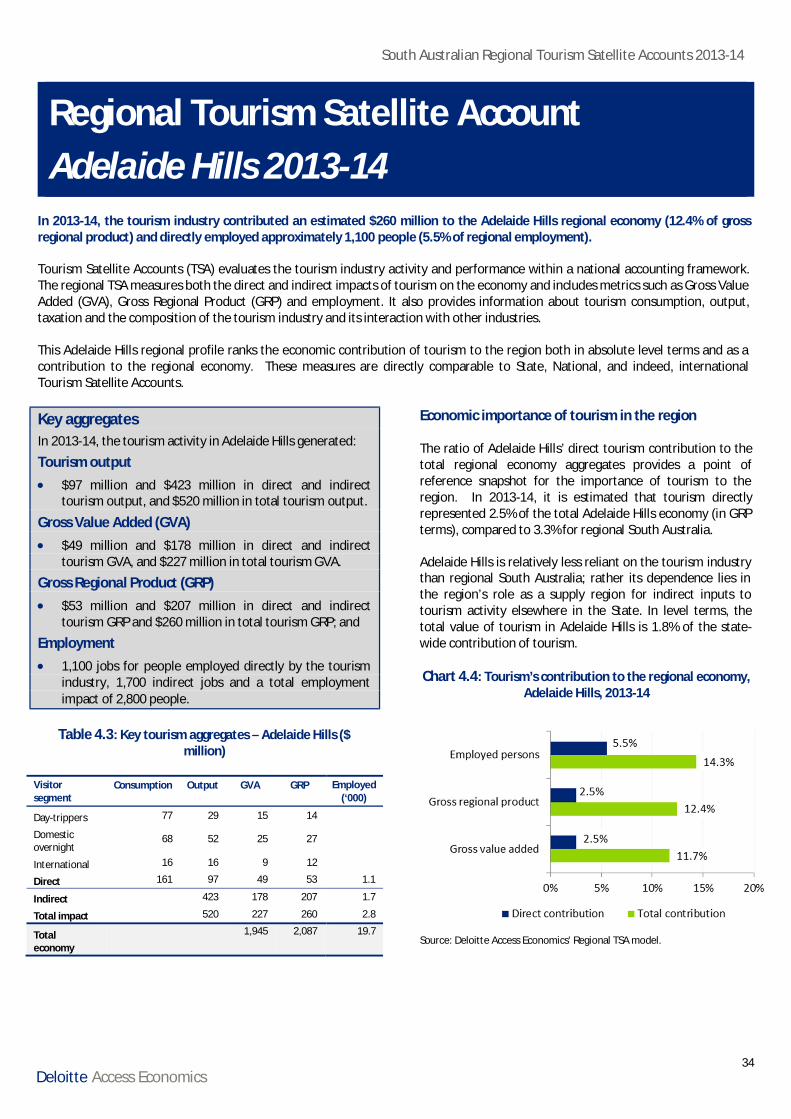
South Australian Regional Tourism Satellite Accounts 2013-14
34Deloitte Access Economics
Regional Tourism Satellite AccountAdelaide Hills 2013-14
In 2013-14, the tourism industry contributed an estimated $260 million to the Adelaide Hills regional economy (12.4% of grossregional product) and directly employed approximately 1,100 people (5.5% of regional employment).
Tourism Satellite Accounts (TSA) evaluates the tourism industry activity and performance within a national accounting framework.The regional TSA measures both the direct and indirect impacts of tourism on the economy and includes metrics such as Gross ValueAdded (GVA), Gross Regional Product (GRP) and employment. It also provides information about tourism consumption, output,taxation and the composition of the tourism industry and its interaction with other industries.
This Adelaide Hills regional profile ranks the economic contribution of tourism to the region both in absolute level terms and as acontribution to the regional economy. These measures are directly comparable to State, National, and indeed, internationalTourism Satellite Accounts.
Key aggregatesIn 2013-14, the tourism activity in Adelaide Hills generated:
Tourism output· $97 million and $423 million in direct and indirect
tourism output, and $520 million in total tourism output.
Gross Value Added (GVA)· $49 million and $178 million in direct and indirect
tourism GVA, and $227 million in total tourism GVA.
Gross Regional Product (GRP)· $53 million and $207 million in direct and indirect
tourism GRP and $260 million in total tourism GRP; and
Employment· 1,100 jobs for people employed directly by the tourism
industry, 1,700 indirect jobs and a total employmentimpact of 2,800 people.
Table 4.3: Key tourism aggregates – Adelaide Hills ($million)
Visitorsegment
Consumption Output GVA GRP Employed(‘000)
Day-trippers 77 29 15 14
Domesticovernight
68 52 25 27
International 16 16 9 12
Direct 161 97 49 53 1.1
Indirect 423 178 207 1.7
Total impact 520 227 260 2.8
Totaleconomy
1,945 2,087 19.7
Economic importance of tourism in the region
The ratio of Adelaide Hills’ direct tourism contribution to thetotal regional economy aggregates provides a point ofreference snapshot for the importance of tourism to theregion. In 2013-14, it is estimated that tourism directlyrepresented 2.5% of the total Adelaide Hills economy (in GRPterms), compared to 3.3% for regional South Australia.
Adelaide Hills is relatively less reliant on the tourism industrythan regional South Australia; rather its dependence lies inthe region’s role as a supply region for indirect inputs totourism activity elsewhere in the State. In level terms, thetotal value of tourism in Adelaide Hills is 1.8% of the state-wide contribution of tourism.
Chart 4.4: Tourism’s contribution to the regional economy,Adelaide Hills, 2013-14
Source: Deloitte Access Economics’ Regional TSA model.
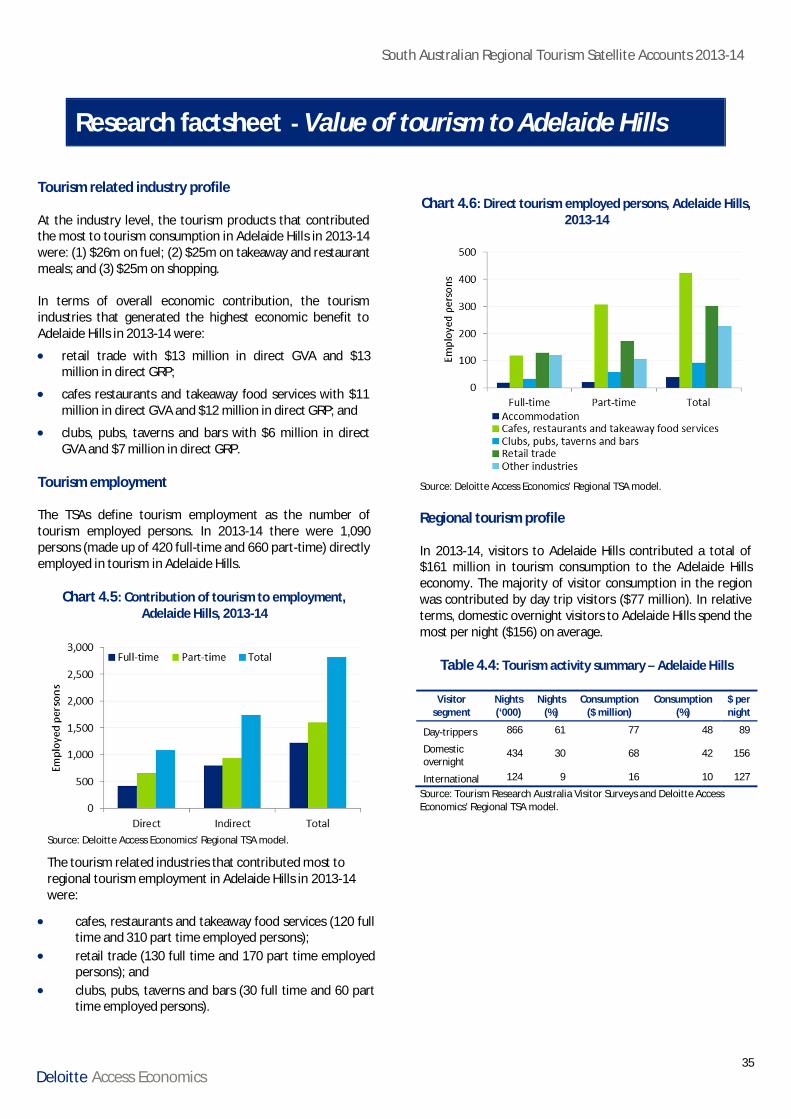
South Australian Regional Tourism Satellite Accounts 2013-14
35Deloitte Access Economics
Research factsheet - Value of tourism to Adelaide Hills
Tourism related industry profile
At the industry level, the tourism products that contributedthe most to tourism consumption in Adelaide Hills in 2013-14were: (1) $26m on fuel; (2) $25m on takeaway and restaurantmeals; and (3) $25m on shopping.
In terms of overall economic contribution, the tourismindustries that generated the highest economic benefit toAdelaide Hills in 2013-14 were:
· retail trade with $13 million in direct GVA and $13million in direct GRP;
· cafes restaurants and takeaway food services with $11million in direct GVA and $12 million in direct GRP; and
· clubs, pubs, taverns and bars with $6 million in directGVA and $7 million in direct GRP.
Tourism employment
The TSAs define tourism employment as the number oftourism employed persons. In 2013-14 there were 1,090persons (made up of 420 full-time and 660 part-time) directlyemployed in tourism in Adelaide Hills.
Chart 4.5: Contribution of tourism to employment,Adelaide Hills, 2013-14
Source: Deloitte Access Economics’ Regional TSA model.
The tourism related industries that contributed most toregional tourism employment in Adelaide Hills in 2013-14were:
Chart 4.6: Direct tourism employed persons, Adelaide Hills,2013-14
Source: Deloitte Access Economics’ Regional TSA model.
Regional tourism profile
In 2013-14, visitors to Adelaide Hills contributed a total of$161 million in tourism consumption to the Adelaide Hillseconomy. The majority of visitor consumption in the regionwas contributed by day trip visitors ($77 million). In relativeterms, domestic overnight visitors to Adelaide Hills spend themost per night ($156) on average.
Table 4.4: Tourism activity summary – Adelaide Hills
Visitorsegment
Nights(‘000)
Nights(%)
Consumption($ million)
Consumption(%)
$ pernight
Day-trippers 866 61 77 48 89
Domesticovernight
434 30 68 42 156
International 124 9 16 10 127
Source: Tourism Research Australia Visitor Surveys and Deloitte AccessEconomics’ Regional TSA model.
· cafes, restaurants and takeaway food services (120 fulltime and 310 part time employed persons);
· retail trade (130 full time and 170 part time employedpersons); and
· clubs, pubs, taverns and bars (30 full time and 60 parttime employed persons).
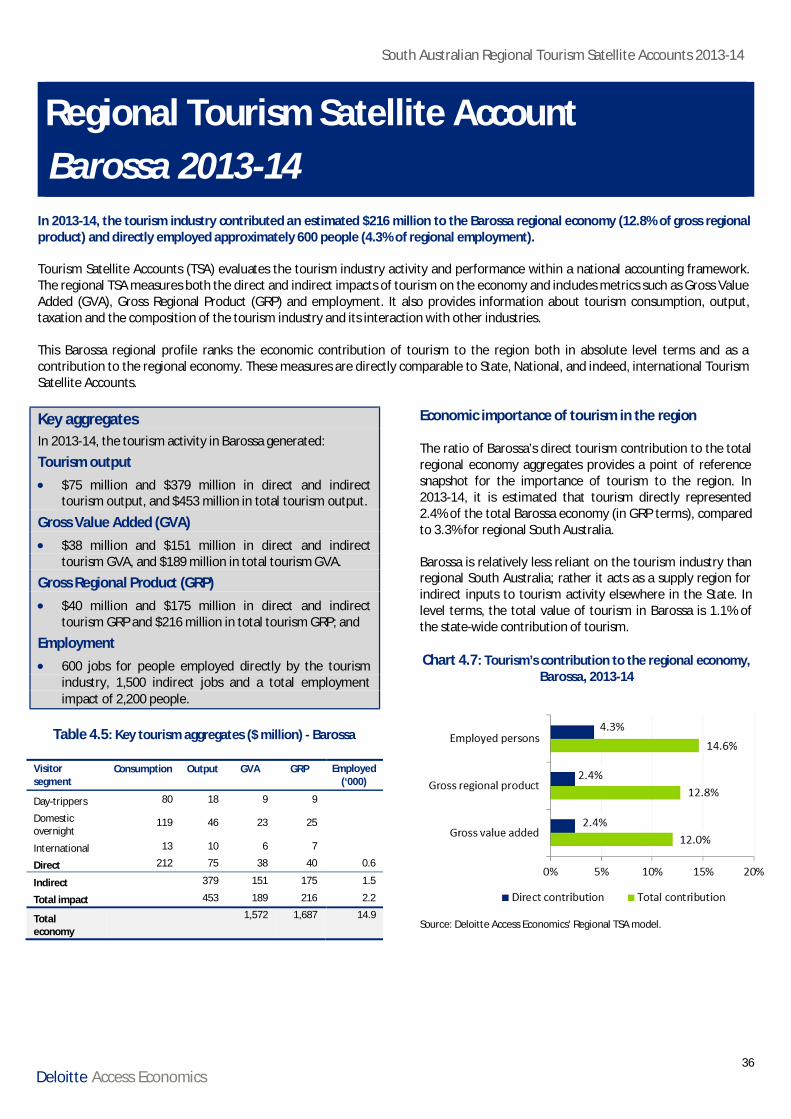
South Australian Regional Tourism Satellite Accounts 2013-14
36Deloitte Access Economics
Regional Tourism Satellite AccountBarossa 2013-14
In 2013-14, the tourism industry contributed an estimated $216 million to the Barossa regional economy (12.8% of gross regionalproduct) and directly employed approximately 600 people (4.3% of regional employment).
Tourism Satellite Accounts (TSA) evaluates the tourism industry activity and performance within a national accounting framework.The regional TSA measures both the direct and indirect impacts of tourism on the economy and includes metrics such as Gross ValueAdded (GVA), Gross Regional Product (GRP) and employment. It also provides information about tourism consumption, output,taxation and the composition of the tourism industry and its interaction with other industries.
This Barossa regional profile ranks the economic contribution of tourism to the region both in absolute level terms and as acontribution to the regional economy. These measures are directly comparable to State, National, and indeed, international TourismSatellite Accounts.
Key aggregatesIn 2013-14, the tourism activity in Barossa generated:
Tourism output· $75 million and $379 million in direct and indirect
tourism output, and $453 million in total tourism output.
Gross Value Added (GVA)· $38 million and $151 million in direct and indirect
tourism GVA, and $189 million in total tourism GVA.
Gross Regional Product (GRP)· $40 million and $175 million in direct and indirect
tourism GRP and $216 million in total tourism GRP; and
Employment· 600 jobs for people employed directly by the tourism
industry, 1,500 indirect jobs and a total employmentimpact of 2,200 people.
Table 4.5: Key tourism aggregates ($ million) - Barossa
Visitorsegment
Consumption Output GVA GRP Employed(‘000)
Day-trippers 80 18 9 9
Domesticovernight
119 46 23 25
International 13 10 6 7
Direct 212 75 38 40 0.6
Indirect 379 151 175 1.5
Total impact 453 189 216 2.2
Totaleconomy
1,572 1,687 14.9
Economic importance of tourism in the region
The ratio of Barossa’s direct tourism contribution to the totalregional economy aggregates provides a point of referencesnapshot for the importance of tourism to the region. In2013-14, it is estimated that tourism directly represented2.4% of the total Barossa economy (in GRP terms), comparedto 3.3% for regional South Australia.
Barossa is relatively less reliant on the tourism industry thanregional South Australia; rather it acts as a supply region forindirect inputs to tourism activity elsewhere in the State. Inlevel terms, the total value of tourism in Barossa is 1.1% ofthe state-wide contribution of tourism.
Chart 4.7: Tourism’s contribution to the regional economy,Barossa, 2013-14
Source: Deloitte Access Economics’ Regional TSA model.
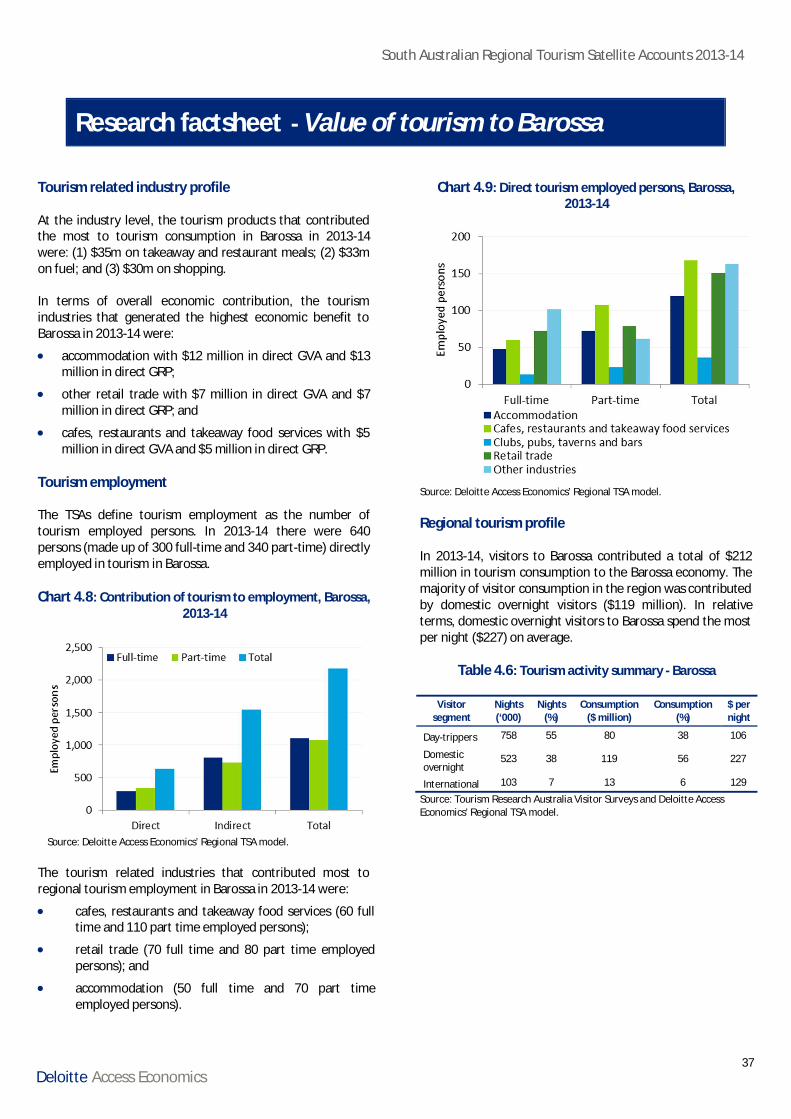
South Australian Regional Tourism Satellite Accounts 2013-14
37Deloitte Access Economics
Research factsheet - Value of tourism to Barossa
Tourism related industry profile
At the industry level, the tourism products that contributedthe most to tourism consumption in Barossa in 2013-14were: (1) $35m on takeaway and restaurant meals; (2) $33mon fuel; and (3) $30m on shopping.
In terms of overall economic contribution, the tourismindustries that generated the highest economic benefit toBarossa in 2013-14 were:
· accommodation with $12 million in direct GVA and $13million in direct GRP;
· other retail trade with $7 million in direct GVA and $7million in direct GRP; and
· cafes, restaurants and takeaway food services with $5million in direct GVA and $5 million in direct GRP.
Tourism employment
The TSAs define tourism employment as the number oftourism employed persons. In 2013-14 there were 640persons (made up of 300 full-time and 340 part-time) directlyemployed in tourism in Barossa.
Chart 4.8: Contribution of tourism to employment, Barossa,2013-14
Source: Deloitte Access Economics’ Regional TSA model.
The tourism related industries that contributed most toregional tourism employment in Barossa in 2013-14 were:
Chart 4.9: Direct tourism employed persons, Barossa,2013-14
Source: Deloitte Access Economics’ Regional TSA model.
Regional tourism profile
In 2013-14, visitors to Barossa contributed a total of $212million in tourism consumption to the Barossa economy. Themajority of visitor consumption in the region was contributedby domestic overnight visitors ($119 million). In relativeterms, domestic overnight visitors to Barossa spend the mostper night ($227) on average.
Table 4.6: Tourism activity summary - Barossa
Visitorsegment
Nights(‘000)
Nights(%)
Consumption($ million)
Consumption(%)
$ pernight
Day-trippers 758 55 80 38 106
Domesticovernight
523 38 119 56 227
International 103 7 13 6 129
Source: Tourism Research Australia Visitor Surveys and Deloitte AccessEconomics’ Regional TSA model.
· cafes, restaurants and takeaway food services (60 fulltime and 110 part time employed persons);
· retail trade (70 full time and 80 part time employedpersons); and
· accommodation (50 full time and 70 part timeemployed persons).
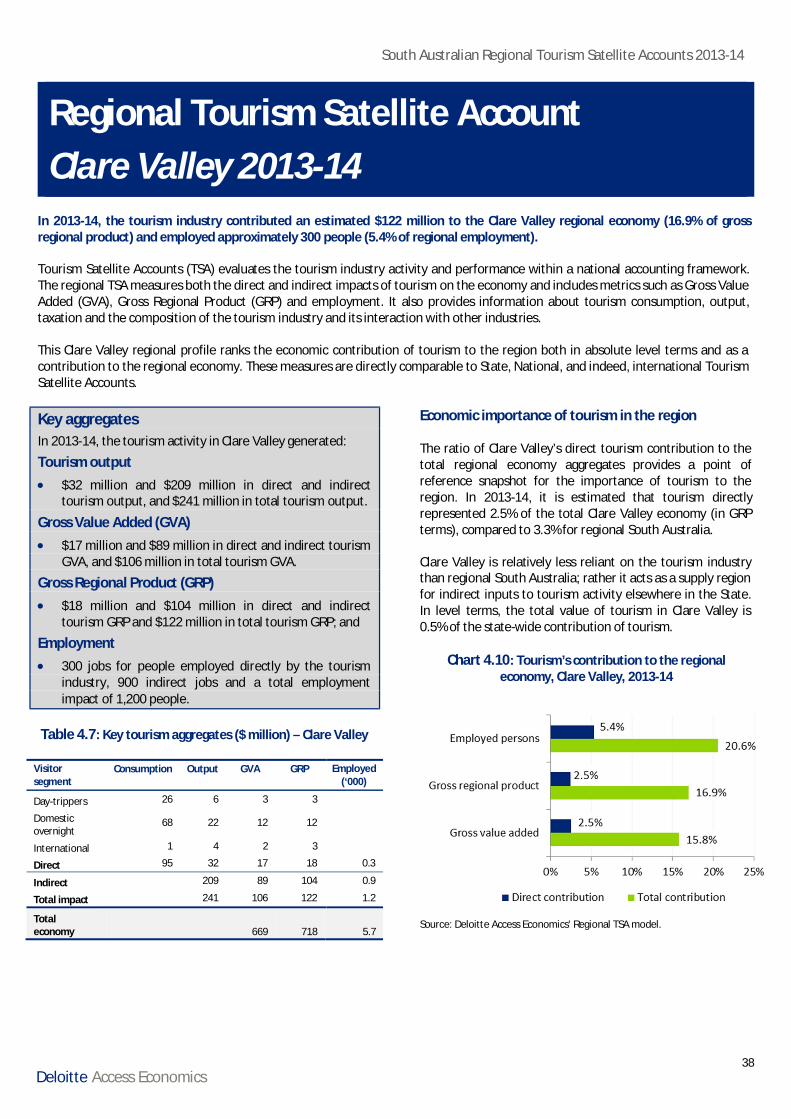
South Australian Regional Tourism Satellite Accounts 2013-14
38Deloitte Access Economics
Regional Tourism Satellite AccountClare Valley 2013-14
In 2013-14, the tourism industry contributed an estimated $122 million to the Clare Valley regional economy (16.9% of grossregional product) and employed approximately 300 people (5.4% of regional employment).
Tourism Satellite Accounts (TSA) evaluates the tourism industry activity and performance within a national accounting framework.The regional TSA measures both the direct and indirect impacts of tourism on the economy and includes metrics such as Gross ValueAdded (GVA), Gross Regional Product (GRP) and employment. It also provides information about tourism consumption, output,taxation and the composition of the tourism industry and its interaction with other industries.
This Clare Valley regional profile ranks the economic contribution of tourism to the region both in absolute level terms and as acontribution to the regional economy. These measures are directly comparable to State, National, and indeed, international TourismSatellite Accounts.
Key aggregatesIn 2013-14, the tourism activity in Clare Valley generated:
Tourism output· $32 million and $209 million in direct and indirect
tourism output, and $241 million in total tourism output.
Gross Value Added (GVA)· $17 million and $89 million in direct and indirect tourism
GVA, and $106 million in total tourism GVA.
Gross Regional Product (GRP)· $18 million and $104 million in direct and indirect
tourism GRP and $122 million in total tourism GRP; and
Employment· 300 jobs for people employed directly by the tourism
industry, 900 indirect jobs and a total employmentimpact of 1,200 people.
Table 4.7: Key tourism aggregates ($ million) – Clare Valley
Visitorsegment
Consumption Output GVA GRP Employed(‘000)
Day-trippers 26 6 3 3
Domesticovernight
68 22 12 12
International 1 4 2 3
Direct 95 32 17 18 0.3
Indirect 209 89 104 0.9
Total impact 241 106 122 1.2
Totaleconomy 669 718 5.7
Economic importance of tourism in the region
The ratio of Clare Valley’s direct tourism contribution to thetotal regional economy aggregates provides a point ofreference snapshot for the importance of tourism to theregion. In 2013-14, it is estimated that tourism directlyrepresented 2.5% of the total Clare Valley economy (in GRPterms), compared to 3.3% for regional South Australia.
Clare Valley is relatively less reliant on the tourism industrythan regional South Australia; rather it acts as a supply regionfor indirect inputs to tourism activity elsewhere in the State.In level terms, the total value of tourism in Clare Valley is0.5% of the state-wide contribution of tourism.
Chart 4.10: Tourism’s contribution to the regionaleconomy, Clare Valley, 2013-14
Source: Deloitte Access Economics’ Regional TSA model.
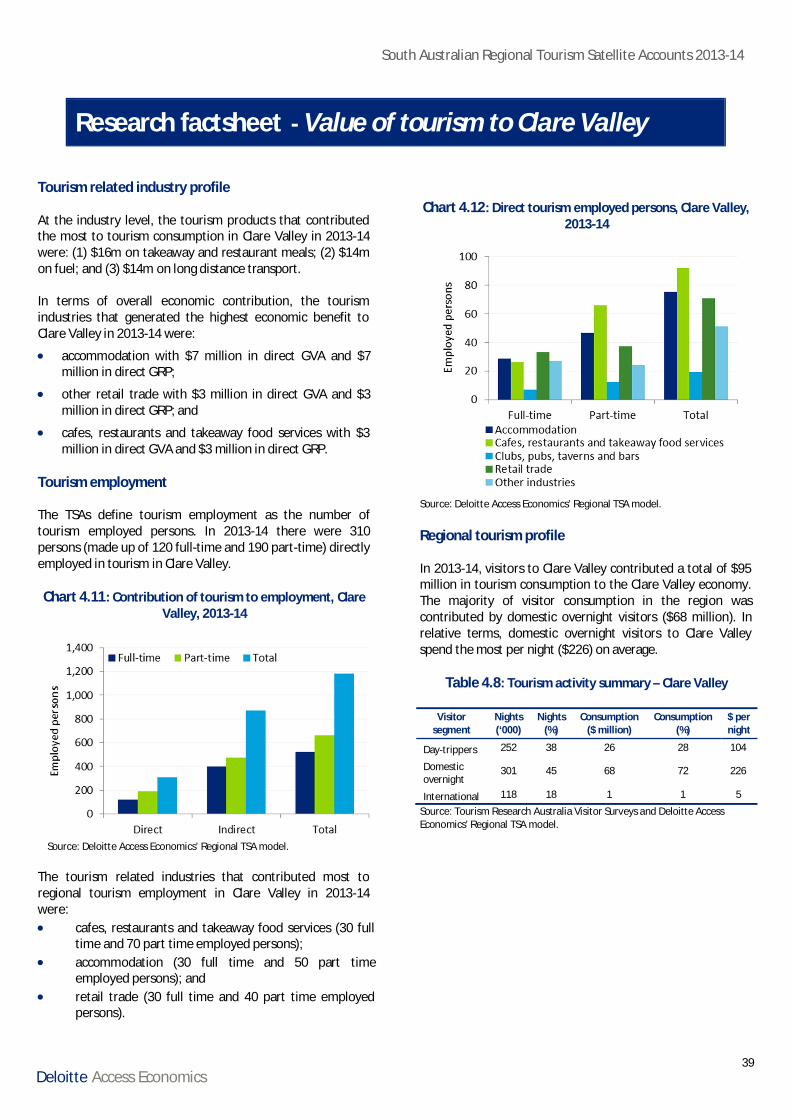
South Australian Regional Tourism Satellite Accounts 2013-14
39Deloitte Access Economics
Research factsheet - Value of tourism to Clare Valley
Tourism related industry profile
At the industry level, the tourism products that contributedthe most to tourism consumption in Clare Valley in 2013-14were: (1) $16m on takeaway and restaurant meals; (2) $14mon fuel; and (3) $14m on long distance transport.
In terms of overall economic contribution, the tourismindustries that generated the highest economic benefit toClare Valley in 2013-14 were:
· accommodation with $7 million in direct GVA and $7million in direct GRP;
· other retail trade with $3 million in direct GVA and $3million in direct GRP; and
· cafes, restaurants and takeaway food services with $3million in direct GVA and $3 million in direct GRP.
Tourism employment
The TSAs define tourism employment as the number oftourism employed persons. In 2013-14 there were 310persons (made up of 120 full-time and 190 part-time) directlyemployed in tourism in Clare Valley.
Chart 4.11: Contribution of tourism to employment, ClareValley, 2013-14
Source: Deloitte Access Economics’ Regional TSA model.
The tourism related industries that contributed most toregional tourism employment in Clare Valley in 2013-14were:
Chart 4.12: Direct tourism employed persons, Clare Valley,2013-14
Source: Deloitte Access Economics’ Regional TSA model.
Regional tourism profile
In 2013-14, visitors to Clare Valley contributed a total of $95million in tourism consumption to the Clare Valley economy.The majority of visitor consumption in the region wascontributed by domestic overnight visitors ($68 million). Inrelative terms, domestic overnight visitors to Clare Valleyspend the most per night ($226) on average.
Table 4.8: Tourism activity summary – Clare Valley
Visitorsegment
Nights(‘000)
Nights(%)
Consumption($ million)
Consumption(%)
$ pernight
Day-trippers 252 38 26 28 104
Domesticovernight
301 45 68 72 226
International 118 18 1 1 5
Source: Tourism Research Australia Visitor Surveys and Deloitte AccessEconomics’ Regional TSA model.
· cafes, restaurants and takeaway food services (30 fulltime and 70 part time employed persons);
· accommodation (30 full time and 50 part timeemployed persons); and
· retail trade (30 full time and 40 part time employedpersons).
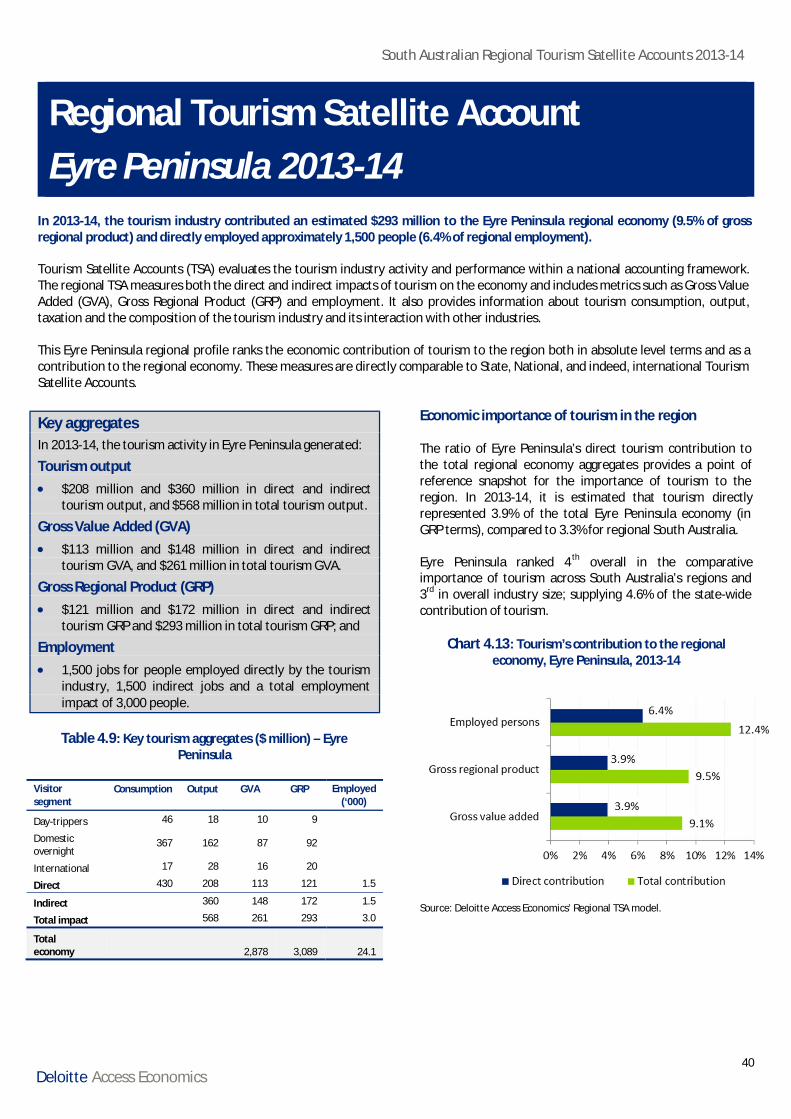
South Australian Regional Tourism Satellite Accounts 2013-14
40Deloitte Access Economics
Regional Tourism Satellite AccountEyre Peninsula 2013-14
In 2013-14, the tourism industry contributed an estimated $293 million to the Eyre Peninsula regional economy (9.5% of grossregional product) and directly employed approximately 1,500 people (6.4% of regional employment).
Tourism Satellite Accounts (TSA) evaluates the tourism industry activity and performance within a national accounting framework.The regional TSA measures both the direct and indirect impacts of tourism on the economy and includes metrics such as Gross ValueAdded (GVA), Gross Regional Product (GRP) and employment. It also provides information about tourism consumption, output,taxation and the composition of the tourism industry and its interaction with other industries.
This Eyre Peninsula regional profile ranks the economic contribution of tourism to the region both in absolute level terms and as acontribution to the regional economy. These measures are directly comparable to State, National, and indeed, international TourismSatellite Accounts.
Key aggregatesIn 2013-14, the tourism activity in Eyre Peninsula generated:
Tourism output· $208 million and $360 million in direct and indirect
tourism output, and $568 million in total tourism output.
Gross Value Added (GVA)· $113 million and $148 million in direct and indirect
tourism GVA, and $261 million in total tourism GVA.
Gross Regional Product (GRP)· $121 million and $172 million in direct and indirect
tourism GRP and $293 million in total tourism GRP; and
Employment· 1,500 jobs for people employed directly by the tourism
industry, 1,500 indirect jobs and a total employmentimpact of 3,000 people.
Table 4.9: Key tourism aggregates ($ million) – EyrePeninsula
Visitorsegment
Consumption Output GVA GRP Employed(‘000)
Day-trippers 46 18 10 9
Domesticovernight
367 162 87 92
International 17 28 16 20
Direct 430 208 113 121 1.5
Indirect 360 148 172 1.5
Total impact 568 261 293 3.0
Totaleconomy 2,878 3,089 24.1
Economic importance of tourism in the region
The ratio of Eyre Peninsula’s direct tourism contribution tothe total regional economy aggregates provides a point ofreference snapshot for the importance of tourism to theregion. In 2013-14, it is estimated that tourism directlyrepresented 3.9% of the total Eyre Peninsula economy (inGRP terms), compared to 3.3% for regional South Australia.
Eyre Peninsula ranked 4th overall in the comparativeimportance of tourism across South Australia’s regions and3rd in overall industry size; supplying 4.6% of the state-widecontribution of tourism.
Chart 4.13: Tourism’s contribution to the regionaleconomy, Eyre Peninsula, 2013-14
Source: Deloitte Access Economics’ Regional TSA model.
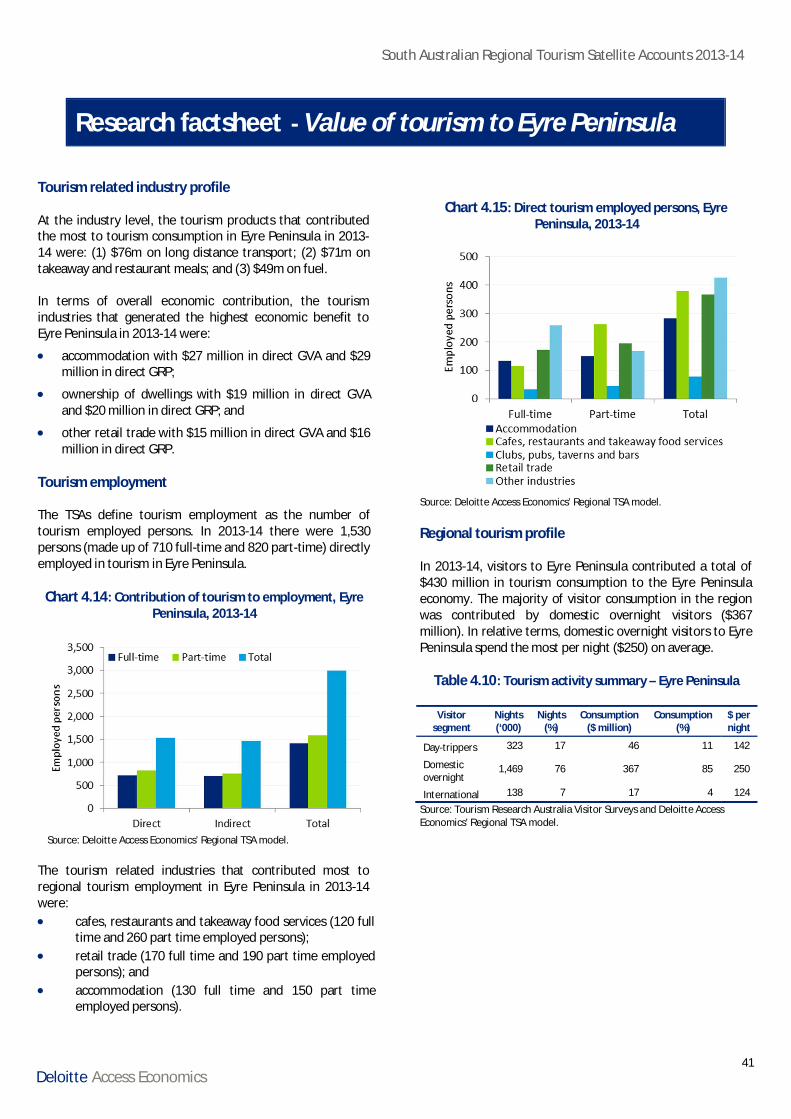
South Australian Regional Tourism Satellite Accounts 2013-14
41Deloitte Access Economics
Research factsheet - Value of tourism to Eyre Peninsula
Tourism related industry profile
At the industry level, the tourism products that contributedthe most to tourism consumption in Eyre Peninsula in 2013-14 were: (1) $76m on long distance transport; (2) $71m ontakeaway and restaurant meals; and (3) $49m on fuel.
In terms of overall economic contribution, the tourismindustries that generated the highest economic benefit toEyre Peninsula in 2013-14 were:
· accommodation with $27 million in direct GVA and $29million in direct GRP;
· ownership of dwellings with $19 million in direct GVAand $20 million in direct GRP; and
· other retail trade with $15 million in direct GVA and $16million in direct GRP.
Tourism employment
The TSAs define tourism employment as the number oftourism employed persons. In 2013-14 there were 1,530persons (made up of 710 full-time and 820 part-time) directlyemployed in tourism in Eyre Peninsula.
Chart 4.14: Contribution of tourism to employment, EyrePeninsula, 2013-14
Source: Deloitte Access Economics’ Regional TSA model.
The tourism related industries that contributed most toregional tourism employment in Eyre Peninsula in 2013-14were:
Chart 4.15: Direct tourism employed persons, EyrePeninsula, 2013-14
Source: Deloitte Access Economics’ Regional TSA model.
Regional tourism profile
In 2013-14, visitors to Eyre Peninsula contributed a total of$430 million in tourism consumption to the Eyre Peninsulaeconomy. The majority of visitor consumption in the regionwas contributed by domestic overnight visitors ($367million). In relative terms, domestic overnight visitors to EyrePeninsula spend the most per night ($250) on average.
Table 4.10: Tourism activity summary – Eyre Peninsula
Visitorsegment
Nights(‘000)
Nights(%)
Consumption($ million)
Consumption(%)
$ pernight
Day-trippers 323 17 46 11 142
Domesticovernight
1,469 76 367 85 250
International 138 7 17 4 124
Source: Tourism Research Australia Visitor Surveys and Deloitte AccessEconomics’ Regional TSA model.
· cafes, restaurants and takeaway food services (120 fulltime and 260 part time employed persons);
· retail trade (170 full time and 190 part time employedpersons); and
· accommodation (130 full time and 150 part timeemployed persons).
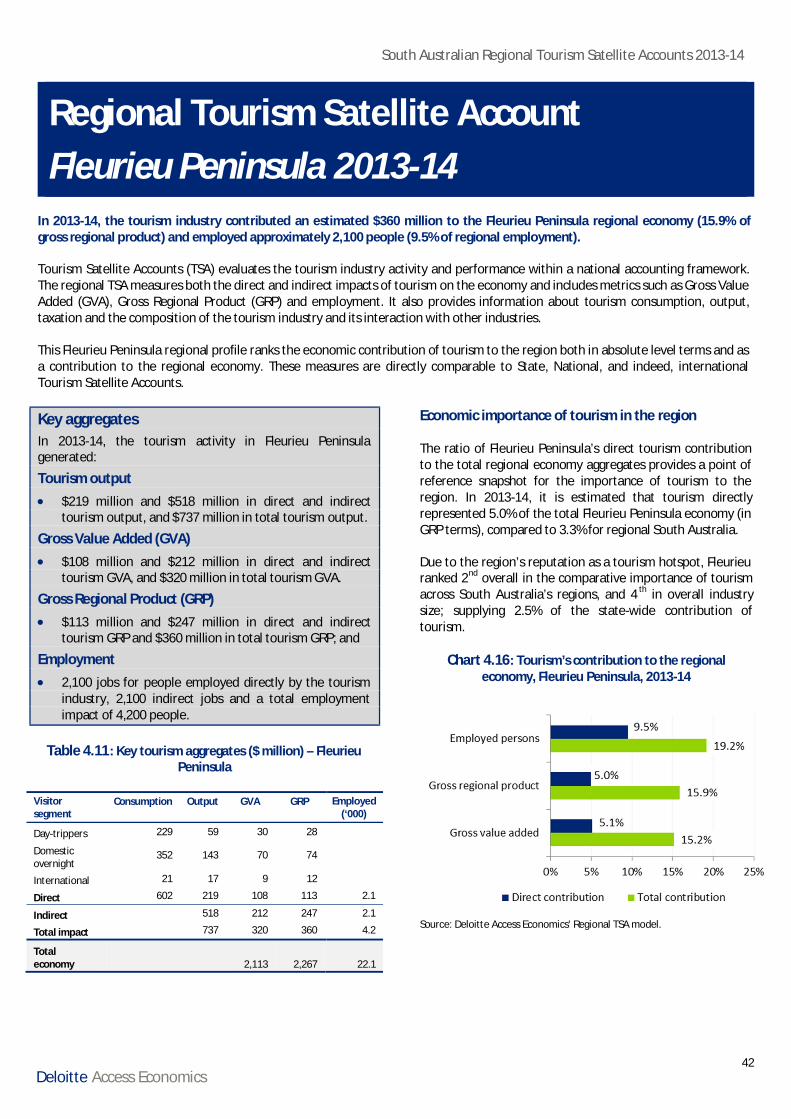
South Australian Regional Tourism Satellite Accounts 2013-14
42Deloitte Access Economics
Regional Tourism Satellite AccountFleurieu Peninsula 2013-14
In 2013-14, the tourism industry contributed an estimated $360 million to the Fleurieu Peninsula regional economy (15.9% ofgross regional product) and employed approximately 2,100 people (9.5% of regional employment).
Tourism Satellite Accounts (TSA) evaluates the tourism industry activity and performance within a national accounting framework.The regional TSA measures both the direct and indirect impacts of tourism on the economy and includes metrics such as Gross ValueAdded (GVA), Gross Regional Product (GRP) and employment. It also provides information about tourism consumption, output,taxation and the composition of the tourism industry and its interaction with other industries.
This Fleurieu Peninsula regional profile ranks the economic contribution of tourism to the region both in absolute level terms and asa contribution to the regional economy. These measures are directly comparable to State, National, and indeed, internationalTourism Satellite Accounts.
Key aggregatesIn 2013-14, the tourism activity in Fleurieu Peninsulagenerated:
Tourism output· $219 million and $518 million in direct and indirect
tourism output, and $737 million in total tourism output.
Gross Value Added (GVA)· $108 million and $212 million in direct and indirect
tourism GVA, and $320 million in total tourism GVA.
Gross Regional Product (GRP)· $113 million and $247 million in direct and indirect
tourism GRP and $360 million in total tourism GRP; and
Employment· 2,100 jobs for people employed directly by the tourism
industry, 2,100 indirect jobs and a total employmentimpact of 4,200 people.
Table 4.11: Key tourism aggregates ($ million) – FleurieuPeninsula
Visitorsegment
Consumption Output GVA GRP Employed(‘000)
Day-trippers 229 59 30 28
Domesticovernight
352 143 70 74
International 21 17 9 12
Direct 602 219 108 113 2.1
Indirect 518 212 247 2.1
Total impact 737 320 360 4.2
Totaleconomy 2,113 2,267 22.1
Economic importance of tourism in the region
The ratio of Fleurieu Peninsula’s direct tourism contributionto the total regional economy aggregates provides a point ofreference snapshot for the importance of tourism to theregion. In 2013-14, it is estimated that tourism directlyrepresented 5.0% of the total Fleurieu Peninsula economy (inGRP terms), compared to 3.3% for regional South Australia.
Due to the region’s reputation as a tourism hotspot, Fleurieuranked 2nd overall in the comparative importance of tourismacross South Australia’s regions, and 4 th in overall industrysize; supplying 2.5% of the state-wide contribution oftourism.
Chart 4.16: Tourism’s contribution to the regionaleconomy, Fleurieu Peninsula, 2013-14
Source: Deloitte Access Economics’ Regional TSA model.
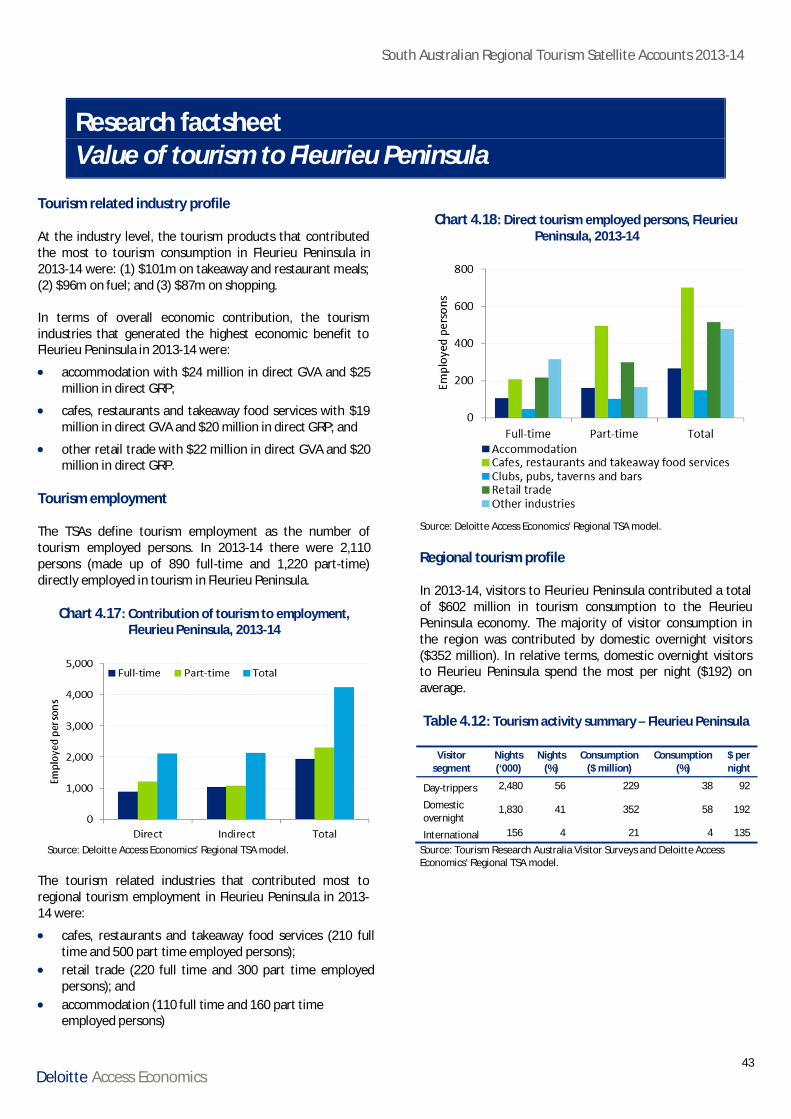
South Australian Regional Tourism Satellite Accounts 2013-14
43Deloitte Access Economics
Research factsheetValue of tourism to Fleurieu Peninsula
Tourism related industry profile
At the industry level, the tourism products that contributedthe most to tourism consumption in Fleurieu Peninsula in2013-14 were: (1) $101m on takeaway and restaurant meals;(2) $96m on fuel; and (3) $87m on shopping.
In terms of overall economic contribution, the tourismindustries that generated the highest economic benefit toFleurieu Peninsula in 2013-14 were:
· accommodation with $24 million in direct GVA and $25million in direct GRP;
· cafes, restaurants and takeaway food services with $19million in direct GVA and $20 million in direct GRP; and
· other retail trade with $22 million in direct GVA and $20million in direct GRP.
Tourism employment
The TSAs define tourism employment as the number oftourism employed persons. In 2013-14 there were 2,110persons (made up of 890 full-time and 1,220 part-time)directly employed in tourism in Fleurieu Peninsula.
Chart 4.17: Contribution of tourism to employment,Fleurieu Peninsula, 2013-14
Source: Deloitte Access Economics’ Regional TSA model.
The tourism related industries that contributed most toregional tourism employment in Fleurieu Peninsula in 2013-14 were:
Chart 4.18: Direct tourism employed persons, FleurieuPeninsula, 2013-14
Source: Deloitte Access Economics’ Regional TSA model.
Regional tourism profile
In 2013-14, visitors to Fleurieu Peninsula contributed a totalof $602 million in tourism consumption to the FleurieuPeninsula economy. The majority of visitor consumption inthe region was contributed by domestic overnight visitors($352 million). In relative terms, domestic overnight visitorsto Fleurieu Peninsula spend the most per night ($192) onaverage.
Table 4.12: Tourism activity summary – Fleurieu Peninsula
Visitorsegment
Nights(‘000)
Nights(%)
Consumption($ million)
Consumption(%)
$ pernight
Day-trippers 2,480 56 229 38 92
Domesticovernight
1,830 41 352 58 192
International 156 4 21 4 135
Source: Tourism Research Australia Visitor Surveys and Deloitte AccessEconomics’ Regional TSA model.
· cafes, restaurants and takeaway food services (210 fulltime and 500 part time employed persons);
· retail trade (220 full time and 300 part time employedpersons); and
· accommodation (110 full time and 160 part timeemployed persons)
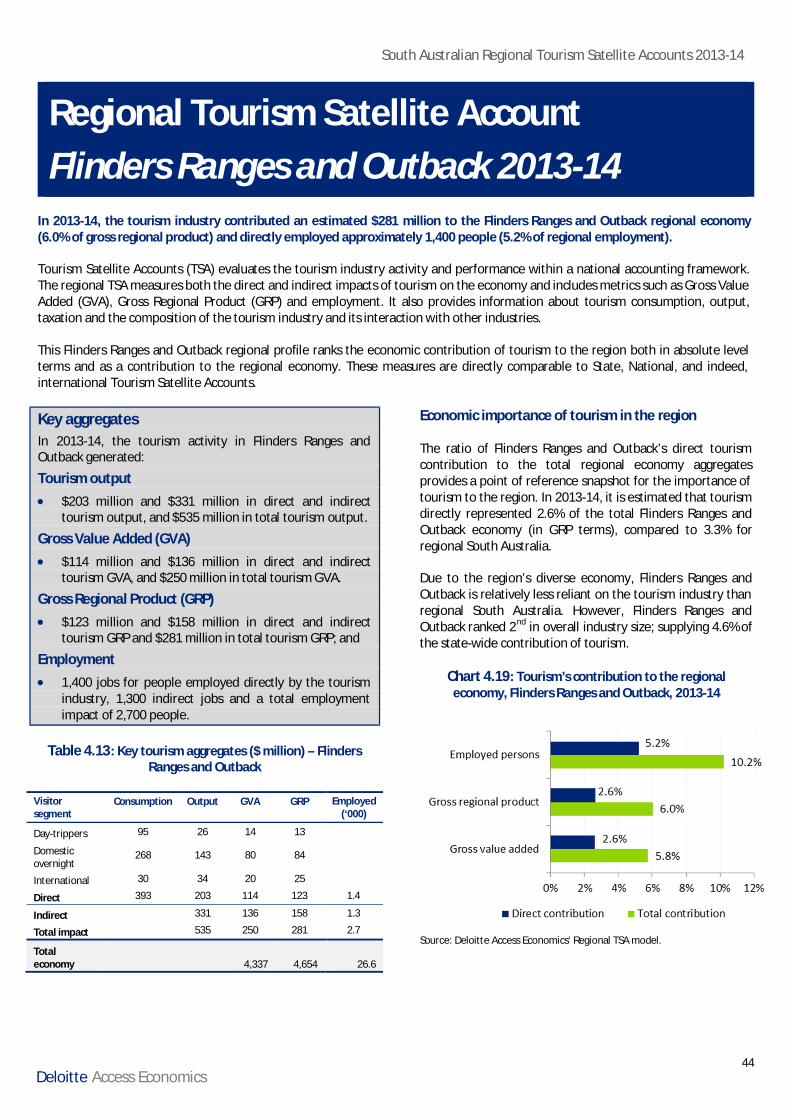
South Australian Regional Tourism Satellite Accounts 2013-14
44Deloitte Access Economics
Regional Tourism Satellite AccountFlinders Ranges and Outback 2013-14
In 2013-14, the tourism industry contributed an estimated $281 million to the Flinders Ranges and Outback regional economy(6.0% of gross regional product) and directly employed approximately 1,400 people (5.2% of regional employment).
Tourism Satellite Accounts (TSA) evaluates the tourism industry activity and performance within a national accounting framework.The regional TSA measures both the direct and indirect impacts of tourism on the economy and includes metrics such as Gross ValueAdded (GVA), Gross Regional Product (GRP) and employment. It also provides information about tourism consumption, output,taxation and the composition of the tourism industry and its interaction with other industries.
This Flinders Ranges and Outback regional profile ranks the economic contribution of tourism to the region both in absolute levelterms and as a contribution to the regional economy. These measures are directly comparable to State, National, and indeed,international Tourism Satellite Accounts.
Key aggregatesIn 2013-14, the tourism activity in Flinders Ranges andOutback generated:
Tourism output· $203 million and $331 million in direct and indirect
tourism output, and $535 million in total tourism output.
Gross Value Added (GVA)· $114 million and $136 million in direct and indirect
tourism GVA, and $250 million in total tourism GVA.
Gross Regional Product (GRP)· $123 million and $158 million in direct and indirect
tourism GRP and $281 million in total tourism GRP; and
Employment· 1,400 jobs for people employed directly by the tourism
industry, 1,300 indirect jobs and a total employmentimpact of 2,700 people.
Table 4.13: Key tourism aggregates ($ million) – FlindersRanges and Outback
Visitorsegment
Consumption Output GVA GRP Employed(‘000)
Day-trippers 95 26 14 13
Domesticovernight
268 143 80 84
International 30 34 20 25
Direct 393 203 114 123 1.4
Indirect 331 136 158 1.3
Total impact 535 250 281 2.7
Totaleconomy 4,337 4,654 26.6
Economic importance of tourism in the region
The ratio of Flinders Ranges and Outback’s direct tourismcontribution to the total regional economy aggregatesprovides a point of reference snapshot for the importance oftourism to the region. In 2013-14, it is estimated that tourismdirectly represented 2.6% of the total Flinders Ranges andOutback economy (in GRP terms), compared to 3.3% forregional South Australia.
Due to the region’s diverse economy, Flinders Ranges andOutback is relatively less reliant on the tourism industry thanregional South Australia. However, Flinders Ranges andOutback ranked 2nd in overall industry size; supplying 4.6% ofthe state-wide contribution of tourism.
Chart 4.19: Tourism’s contribution to the regionaleconomy, Flinders Ranges and Outback, 2013-14
Source: Deloitte Access Economics’ Regional TSA model.
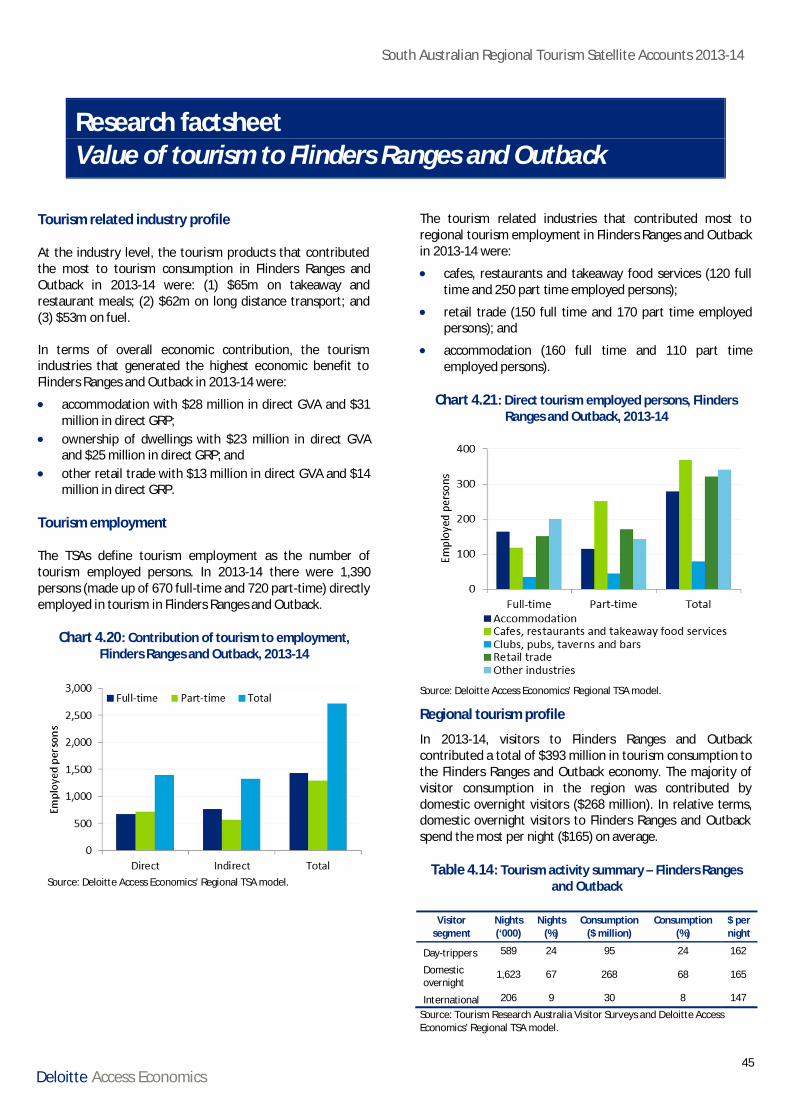
South Australian Regional Tourism Satellite Accounts 2013-14
45Deloitte Access Economics
Research factsheetValue of tourism to Flinders Ranges and Outback
Tourism related industry profile
At the industry level, the tourism products that contributedthe most to tourism consumption in Flinders Ranges andOutback in 2013-14 were: (1) $65m on takeaway andrestaurant meals; (2) $62m on long distance transport; and(3) $53m on fuel.
In terms of overall economic contribution, the tourismindustries that generated the highest economic benefit toFlinders Ranges and Outback in 2013-14 were:
· accommodation with $28 million in direct GVA and $31million in direct GRP;
· ownership of dwellings with $23 million in direct GVAand $25 million in direct GRP; and
· other retail trade with $13 million in direct GVA and $14million in direct GRP.
Tourism employment
The TSAs define tourism employment as the number oftourism employed persons. In 2013-14 there were 1,390persons (made up of 670 full-time and 720 part-time) directlyemployed in tourism in Flinders Ranges and Outback.
Chart 4.20: Contribution of tourism to employment,Flinders Ranges and Outback, 2013-14
Source: Deloitte Access Economics’ Regional TSA model.
The tourism related industries that contributed most toregional tourism employment in Flinders Ranges and Outbackin 2013-14 were:
· cafes, restaurants and takeaway food services (120 fulltime and 250 part time employed persons);
· retail trade (150 full time and 170 part time employedpersons); and
· accommodation (160 full time and 110 part timeemployed persons).
Chart 4.21: Direct tourism employed persons, FlindersRanges and Outback, 2013-14
Source: Deloitte Access Economics’ Regional TSA model.
Regional tourism profile
In 2013-14, visitors to Flinders Ranges and Outbackcontributed a total of $393 million in tourism consumption tothe Flinders Ranges and Outback economy. The majority ofvisitor consumption in the region was contributed bydomestic overnight visitors ($268 million). In relative terms,domestic overnight visitors to Flinders Ranges and Outbackspend the most per night ($165) on average.
Table 4.14: Tourism activity summary – Flinders Rangesand Outback
Visitorsegment
Nights(‘000)
Nights(%)
Consumption($ million)
Consumption(%)
$ pernight
Day-trippers 589 24 95 24 162
Domesticovernight
1,623 67 268 68 165
International 206 9 30 8 147
Source: Tourism Research Australia Visitor Surveys and Deloitte AccessEconomics’ Regional TSA model.
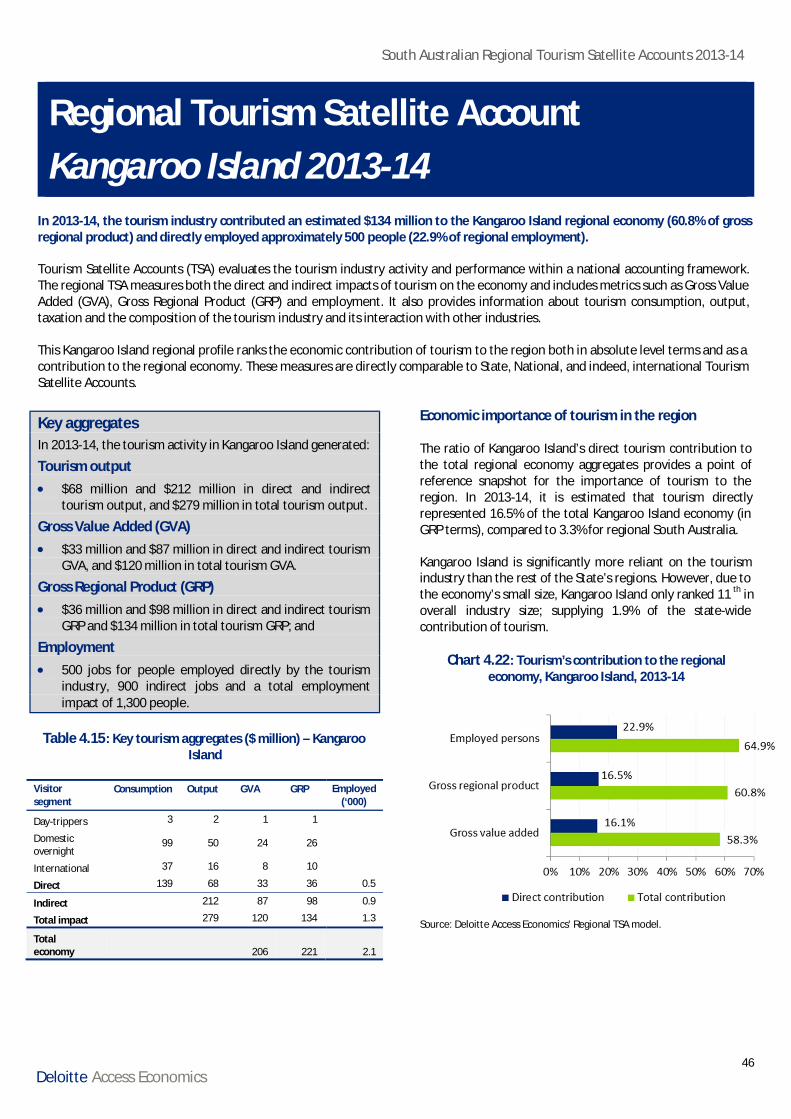
South Australian Regional Tourism Satellite Accounts 2013-14
46Deloitte Access Economics
Regional Tourism Satellite AccountKangaroo Island 2013-14
In 2013-14, the tourism industry contributed an estimated $134 million to the Kangaroo Island regional economy (60.8% of grossregional product) and directly employed approximately 500 people (22.9% of regional employment).
Tourism Satellite Accounts (TSA) evaluates the tourism industry activity and performance within a national accounting framework.The regional TSA measures both the direct and indirect impacts of tourism on the economy and includes metrics such as Gross ValueAdded (GVA), Gross Regional Product (GRP) and employment. It also provides information about tourism consumption, output,taxation and the composition of the tourism industry and its interaction with other industries.
This Kangaroo Island regional profile ranks the economic contribution of tourism to the region both in absolute level terms and as acontribution to the regional economy. These measures are directly comparable to State, National, and indeed, international TourismSatellite Accounts.
Key aggregatesIn 2013-14, the tourism activity in Kangaroo Island generated:
Tourism output· $68 million and $212 million in direct and indirect
tourism output, and $279 million in total tourism output.
Gross Value Added (GVA)· $33 million and $87 million in direct and indirect tourism
GVA, and $120 million in total tourism GVA.
Gross Regional Product (GRP)· $36 million and $98 million in direct and indirect tourism
GRP and $134 million in total tourism GRP; and
Employment· 500 jobs for people employed directly by the tourism
industry, 900 indirect jobs and a total employmentimpact of 1,300 people.
Table 4.15: Key tourism aggregates ($ million) – KangarooIsland
Visitorsegment
Consumption Output GVA GRP Employed(‘000)
Day-trippers 3 2 1 1
Domesticovernight
99 50 24 26
International 37 16 8 10
Direct 139 68 33 36 0.5
Indirect 212 87 98 0.9
Total impact 279 120 134 1.3
Totaleconomy 206 221 2.1
Economic importance of tourism in the region
The ratio of Kangaroo Island’s direct tourism contribution tothe total regional economy aggregates provides a point ofreference snapshot for the importance of tourism to theregion. In 2013-14, it is estimated that tourism directlyrepresented 16.5% of the total Kangaroo Island economy (inGRP terms), compared to 3.3% for regional South Australia.
Kangaroo Island is significantly more reliant on the tourismindustry than the rest of the State’s regions. However, due tothe economy’s small size, Kangaroo Island only ranked 11 th inoverall industry size; supplying 1.9% of the state-widecontribution of tourism.
Chart 4.22: Tourism’s contribution to the regionaleconomy, Kangaroo Island, 2013-14
Source: Deloitte Access Economics’ Regional TSA model.
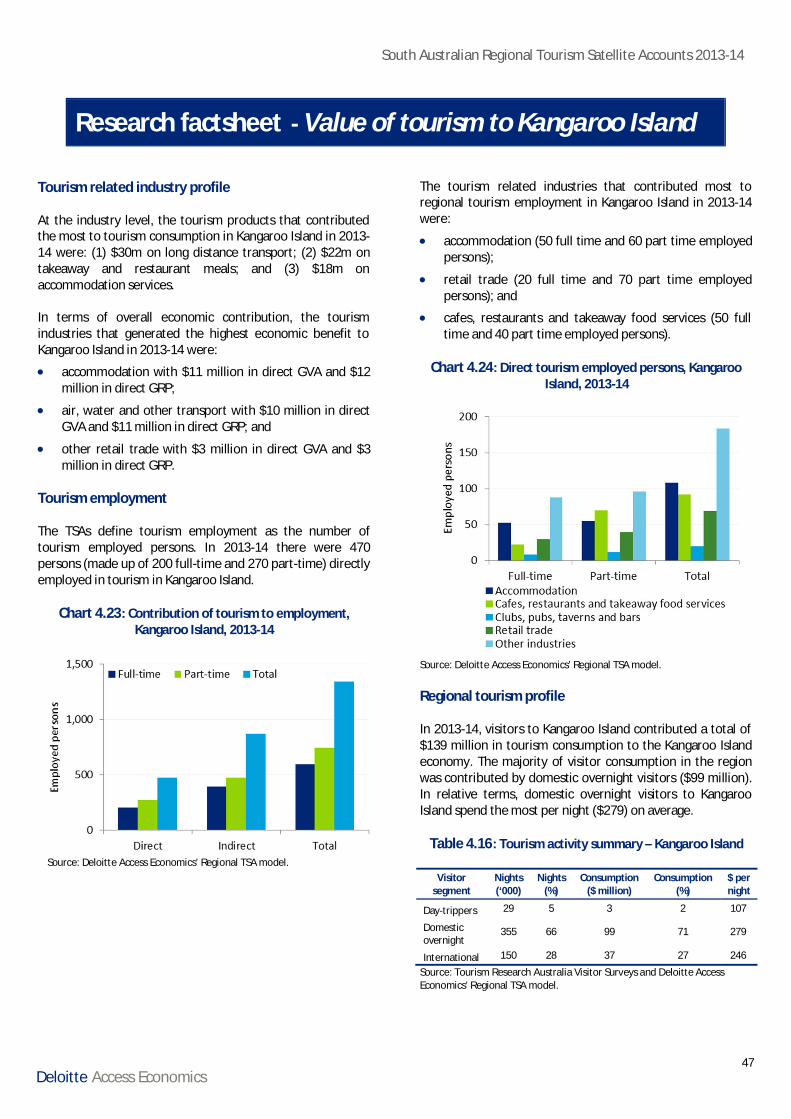
South Australian Regional Tourism Satellite Accounts 2013-14
47Deloitte Access Economics
Research factsheet - Value of tourism to Kangaroo Island
Tourism related industry profile
At the industry level, the tourism products that contributedthe most to tourism consumption in Kangaroo Island in 2013-14 were: (1) $30m on long distance transport; (2) $22m ontakeaway and restaurant meals; and (3) $18m onaccommodation services.
In terms of overall economic contribution, the tourismindustries that generated the highest economic benefit toKangaroo Island in 2013-14 were:
· accommodation with $11 million in direct GVA and $12million in direct GRP;
· air, water and other transport with $10 million in directGVA and $11 million in direct GRP; and
· other retail trade with $3 million in direct GVA and $3million in direct GRP.
Tourism employment
The TSAs define tourism employment as the number oftourism employed persons. In 2013-14 there were 470persons (made up of 200 full-time and 270 part-time) directlyemployed in tourism in Kangaroo Island.
Chart 4.23: Contribution of tourism to employment,Kangaroo Island, 2013-14
Source: Deloitte Access Economics’ Regional TSA model.
The tourism related industries that contributed most toregional tourism employment in Kangaroo Island in 2013-14were:
· accommodation (50 full time and 60 part time employedpersons);
· retail trade (20 full time and 70 part time employedpersons); and
· cafes, restaurants and takeaway food services (50 fulltime and 40 part time employed persons).
Chart 4.24: Direct tourism employed persons, KangarooIsland, 2013-14
Source: Deloitte Access Economics’ Regional TSA model.
Regional tourism profile
In 2013-14, visitors to Kangaroo Island contributed a total of$139 million in tourism consumption to the Kangaroo Islandeconomy. The majority of visitor consumption in the regionwas contributed by domestic overnight visitors ($99 million).In relative terms, domestic overnight visitors to KangarooIsland spend the most per night ($279) on average.
Table 4.16: Tourism activity summary – Kangaroo Island
Visitorsegment
Nights(‘000)
Nights(%)
Consumption($ million)
Consumption(%)
$ pernight
Day-trippers 29 5 3 2 107
Domesticovernight
355 66 99 71 279
International 150 28 37 27 246
Source: Tourism Research Australia Visitor Surveys and Deloitte AccessEconomics’ Regional TSA model.
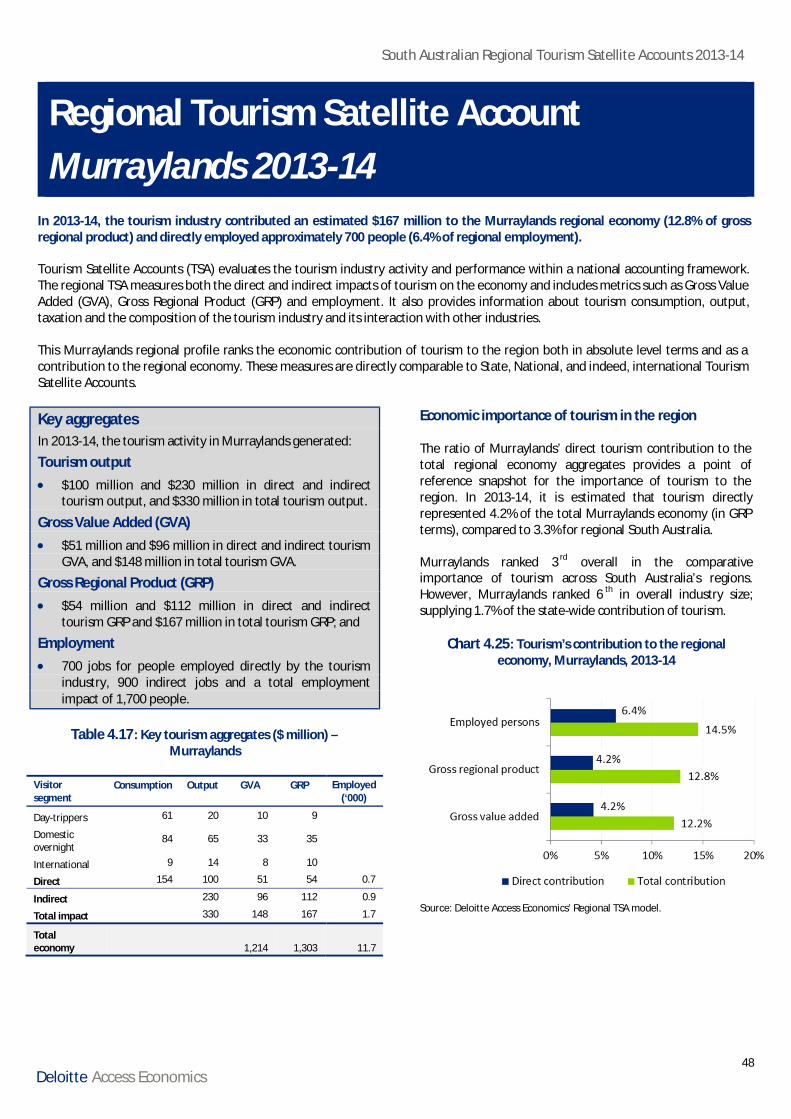
South Australian Regional Tourism Satellite Accounts 2013-14
48Deloitte Access Economics
Regional Tourism Satellite AccountMurraylands 2013-14
In 2013-14, the tourism industry contributed an estimated $167 million to the Murraylands regional economy (12.8% of grossregional product) and directly employed approximately 700 people (6.4% of regional employment).
Tourism Satellite Accounts (TSA) evaluates the tourism industry activity and performance within a national accounting framework.The regional TSA measures both the direct and indirect impacts of tourism on the economy and includes metrics such as Gross ValueAdded (GVA), Gross Regional Product (GRP) and employment. It also provides information about tourism consumption, output,taxation and the composition of the tourism industry and its interaction with other industries.
This Murraylands regional profile ranks the economic contribution of tourism to the region both in absolute level terms and as acontribution to the regional economy. These measures are directly comparable to State, National, and indeed, international TourismSatellite Accounts.
Key aggregatesIn 2013-14, the tourism activity in Murraylands generated:
Tourism output· $100 million and $230 million in direct and indirect
tourism output, and $330 million in total tourism output.
Gross Value Added (GVA)· $51 million and $96 million in direct and indirect tourism
GVA, and $148 million in total tourism GVA.
Gross Regional Product (GRP)· $54 million and $112 million in direct and indirect
tourism GRP and $167 million in total tourism GRP; and
Employment· 700 jobs for people employed directly by the tourism
industry, 900 indirect jobs and a total employmentimpact of 1,700 people.
Table 4.17: Key tourism aggregates ($ million) –Murraylands
Visitorsegment
Consumption Output GVA GRP Employed(‘000)
Day-trippers 61 20 10 9
Domesticovernight
84 65 33 35
International 9 14 8 10
Direct 154 100 51 54 0.7
Indirect 230 96 112 0.9
Total impact 330 148 167 1.7
Totaleconomy 1,214 1,303 11.7
Economic importance of tourism in the region
The ratio of Murraylands’ direct tourism contribution to thetotal regional economy aggregates provides a point ofreference snapshot for the importance of tourism to theregion. In 2013-14, it is estimated that tourism directlyrepresented 4.2% of the total Murraylands economy (in GRPterms), compared to 3.3% for regional South Australia.
Murraylands ranked 3 rd overall in the comparativeimportance of tourism across South Australia’s regions.However, Murraylands ranked 6 th in overall industry size;supplying 1.7% of the state-wide contribution of tourism.
Chart 4.25: Tourism’s contribution to the regionaleconomy, Murraylands, 2013-14
Source: Deloitte Access Economics’ Regional TSA model.
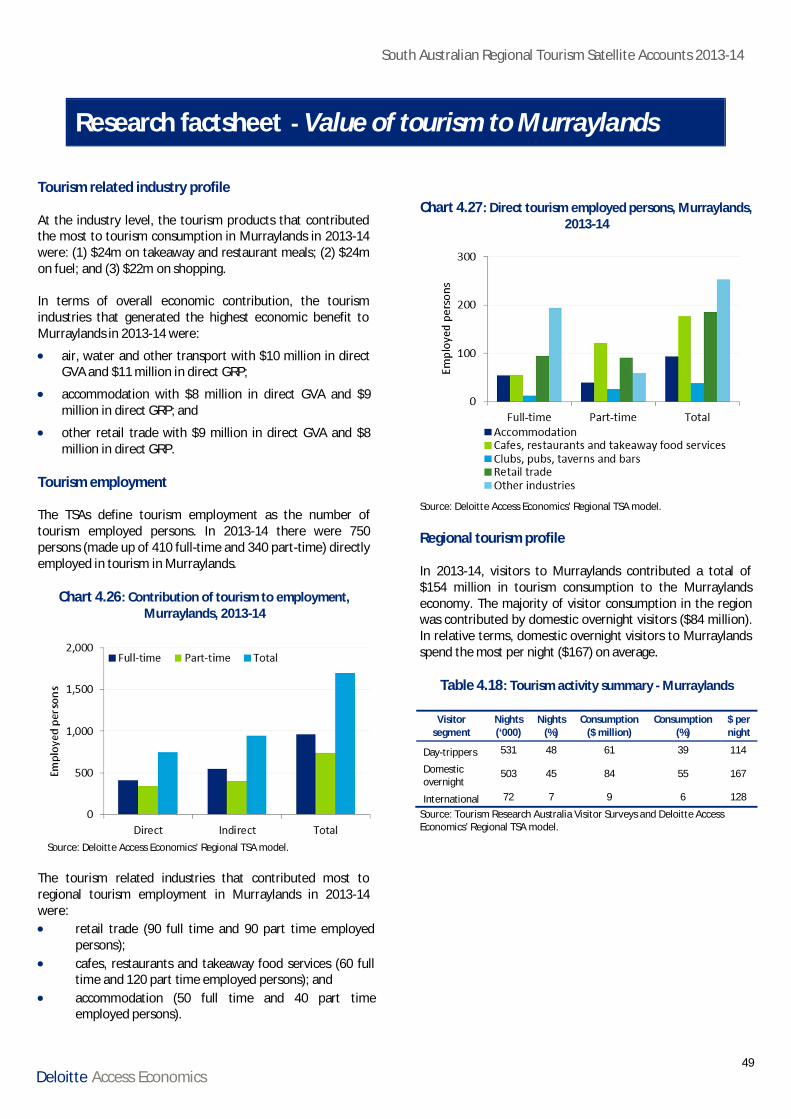
South Australian Regional Tourism Satellite Accounts 2013-14
49Deloitte Access Economics
Research factsheet - Value of tourism to Murraylands
Tourism related industry profile
At the industry level, the tourism products that contributedthe most to tourism consumption in Murraylands in 2013-14were: (1) $24m on takeaway and restaurant meals; (2) $24mon fuel; and (3) $22m on shopping.
In terms of overall economic contribution, the tourismindustries that generated the highest economic benefit toMurraylands in 2013-14 were:
· air, water and other transport with $10 million in directGVA and $11 million in direct GRP;
· accommodation with $8 million in direct GVA and $9million in direct GRP; and
· other retail trade with $9 million in direct GVA and $8million in direct GRP.
Tourism employment
The TSAs define tourism employment as the number oftourism employed persons. In 2013-14 there were 750persons (made up of 410 full-time and 340 part-time) directlyemployed in tourism in Murraylands.
Chart 4.26: Contribution of tourism to employment,Murraylands, 2013-14
Source: Deloitte Access Economics’ Regional TSA model.
The tourism related industries that contributed most toregional tourism employment in Murraylands in 2013-14were:
Chart 4.27: Direct tourism employed persons, Murraylands,2013-14
Source: Deloitte Access Economics’ Regional TSA model.
Regional tourism profile
In 2013-14, visitors to Murraylands contributed a total of$154 million in tourism consumption to the Murraylandseconomy. The majority of visitor consumption in the regionwas contributed by domestic overnight visitors ($84 million).In relative terms, domestic overnight visitors to Murraylandsspend the most per night ($167) on average.
Table 4.18: Tourism activity summary - Murraylands
Visitorsegment
Nights(‘000)
Nights(%)
Consumption($ million)
Consumption(%)
$ pernight
Day-trippers 531 48 61 39 114
Domesticovernight
503 45 84 55 167
International 72 7 9 6 128
Source: Tourism Research Australia Visitor Surveys and Deloitte AccessEconomics’ Regional TSA model.
· retail trade (90 full time and 90 part time employedpersons);
· cafes, restaurants and takeaway food services (60 fulltime and 120 part time employed persons); and
· accommodation (50 full time and 40 part timeemployed persons).
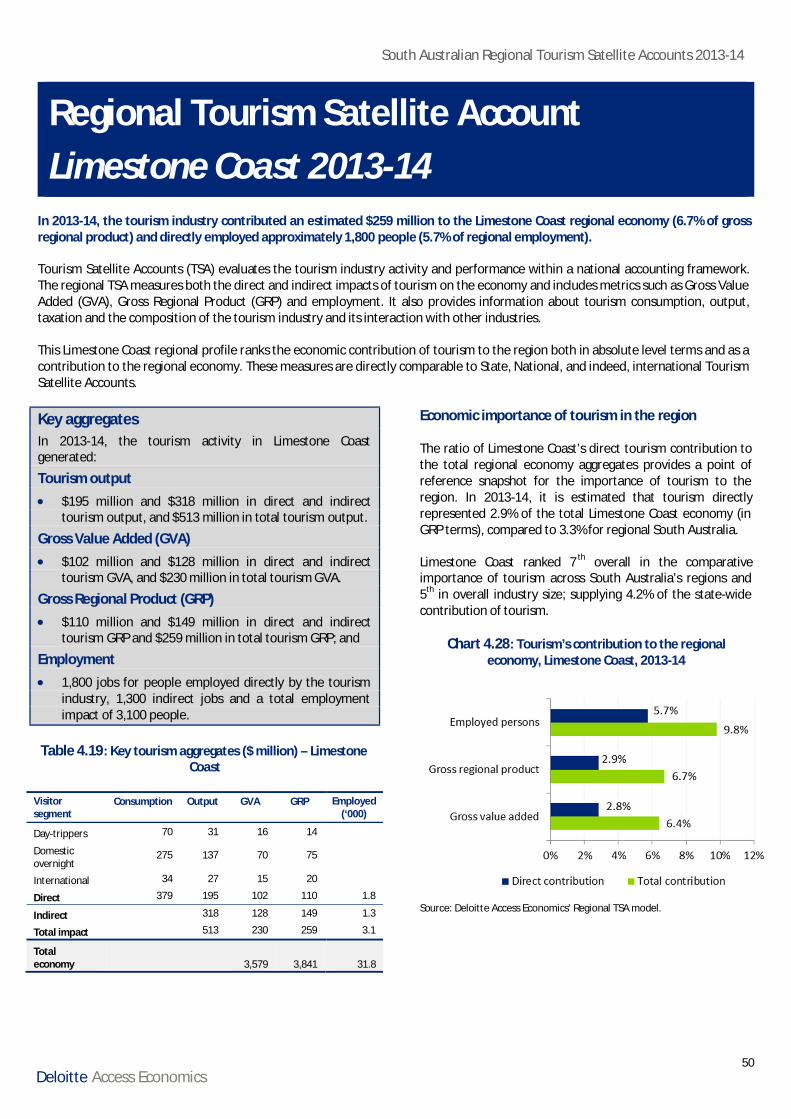
South Australian Regional Tourism Satellite Accounts 2013-14
50Deloitte Access Economics
Regional Tourism Satellite AccountLimestone Coast 2013-14
In 2013-14, the tourism industry contributed an estimated $259 million to the Limestone Coast regional economy (6.7% of grossregional product) and directly employed approximately 1,800 people (5.7% of regional employment).
Tourism Satellite Accounts (TSA) evaluates the tourism industry activity and performance within a national accounting framework.The regional TSA measures both the direct and indirect impacts of tourism on the economy and includes metrics such as Gross ValueAdded (GVA), Gross Regional Product (GRP) and employment. It also provides information about tourism consumption, output,taxation and the composition of the tourism industry and its interaction with other industries.
This Limestone Coast regional profile ranks the economic contribution of tourism to the region both in absolute level terms and as acontribution to the regional economy. These measures are directly comparable to State, National, and indeed, international TourismSatellite Accounts.
Key aggregatesIn 2013-14, the tourism activity in Limestone Coastgenerated:
Tourism output· $195 million and $318 million in direct and indirect
tourism output, and $513 million in total tourism output.
Gross Value Added (GVA)· $102 million and $128 million in direct and indirect
tourism GVA, and $230 million in total tourism GVA.
Gross Regional Product (GRP)· $110 million and $149 million in direct and indirect
tourism GRP and $259 million in total tourism GRP; and
Employment· 1,800 jobs for people employed directly by the tourism
industry, 1,300 indirect jobs and a total employmentimpact of 3,100 people.
Table 4.19: Key tourism aggregates ($ million) – LimestoneCoast
Visitorsegment
Consumption Output GVA GRP Employed(‘000)
Day-trippers 70 31 16 14
Domesticovernight
275 137 70 75
International 34 27 15 20
Direct 379 195 102 110 1.8
Indirect 318 128 149 1.3
Total impact 513 230 259 3.1
Totaleconomy 3,579 3,841 31.8
Economic importance of tourism in the region
The ratio of Limestone Coast’s direct tourism contribution tothe total regional economy aggregates provides a point ofreference snapshot for the importance of tourism to theregion. In 2013-14, it is estimated that tourism directlyrepresented 2.9% of the total Limestone Coast economy (inGRP terms), compared to 3.3% for regional South Australia.
Limestone Coast ranked 7 th overall in the comparativeimportance of tourism across South Australia’s regions and5th in overall industry size; supplying 4.2% of the state-widecontribution of tourism.
Chart 4.28: Tourism’s contribution to the regionaleconomy, Limestone Coast, 2013-14
Source: Deloitte Access Economics’ Regional TSA model.
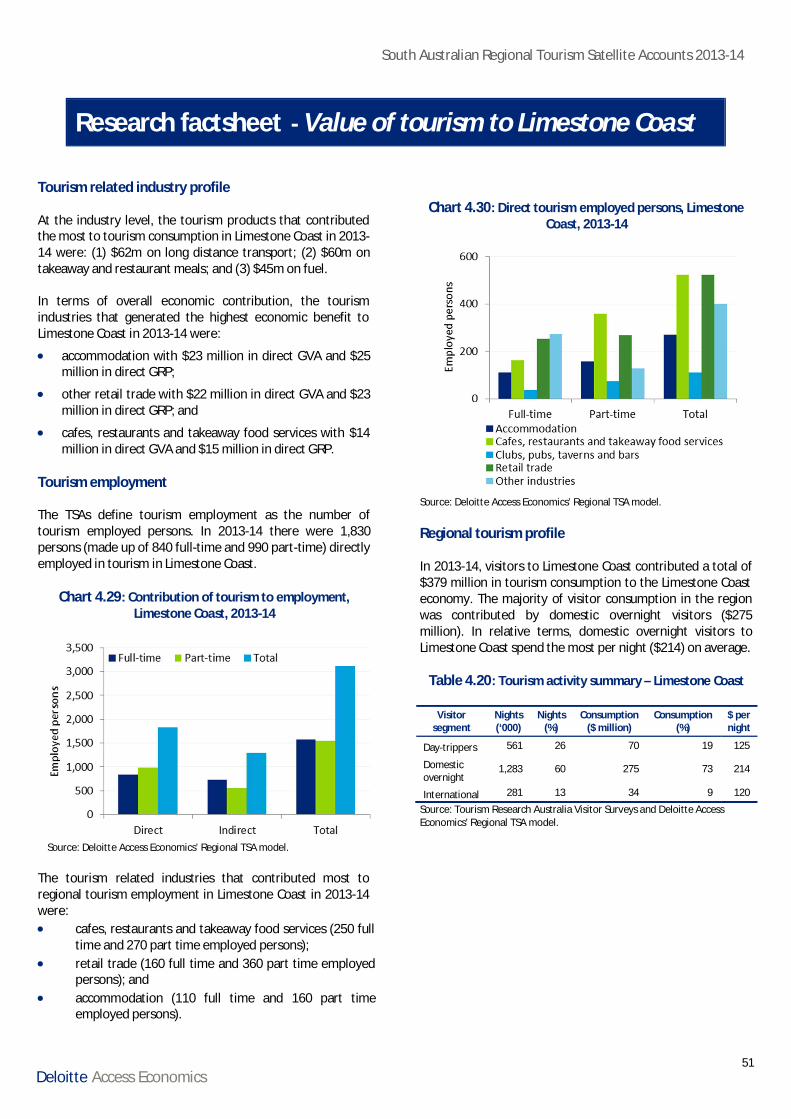
South Australian Regional Tourism Satellite Accounts 2013-14
51Deloitte Access Economics
Research factsheet - Value of tourism to Limestone Coast
Tourism related industry profile
At the industry level, the tourism products that contributedthe most to tourism consumption in Limestone Coast in 2013-14 were: (1) $62m on long distance transport; (2) $60m ontakeaway and restaurant meals; and (3) $45m on fuel.
In terms of overall economic contribution, the tourismindustries that generated the highest economic benefit toLimestone Coast in 2013-14 were:
· accommodation with $23 million in direct GVA and $25million in direct GRP;
· other retail trade with $22 million in direct GVA and $23million in direct GRP; and
· cafes, restaurants and takeaway food services with $14million in direct GVA and $15 million in direct GRP.
Tourism employment
The TSAs define tourism employment as the number oftourism employed persons. In 2013-14 there were 1,830persons (made up of 840 full-time and 990 part-time) directlyemployed in tourism in Limestone Coast.
Chart 4.29: Contribution of tourism to employment,Limestone Coast, 2013-14
Source: Deloitte Access Economics’ Regional TSA model.
The tourism related industries that contributed most toregional tourism employment in Limestone Coast in 2013-14were:
Chart 4.30: Direct tourism employed persons, LimestoneCoast, 2013-14
Source: Deloitte Access Economics’ Regional TSA model.
Regional tourism profile
In 2013-14, visitors to Limestone Coast contributed a total of$379 million in tourism consumption to the Limestone Coasteconomy. The majority of visitor consumption in the regionwas contributed by domestic overnight visitors ($275million). In relative terms, domestic overnight visitors toLimestone Coast spend the most per night ($214) on average.
Table 4.20: Tourism activity summary – Limestone Coast
Visitorsegment
Nights(‘000)
Nights(%)
Consumption($ million)
Consumption(%)
$ pernight
Day-trippers 561 26 70 19 125
Domesticovernight
1,283 60 275 73 214
International 281 13 34 9 120
Source: Tourism Research Australia Visitor Surveys and Deloitte AccessEconomics’ Regional TSA model.
· cafes, restaurants and takeaway food services (250 fulltime and 270 part time employed persons);
· retail trade (160 full time and 360 part time employedpersons); and
· accommodation (110 full time and 160 part timeemployed persons).
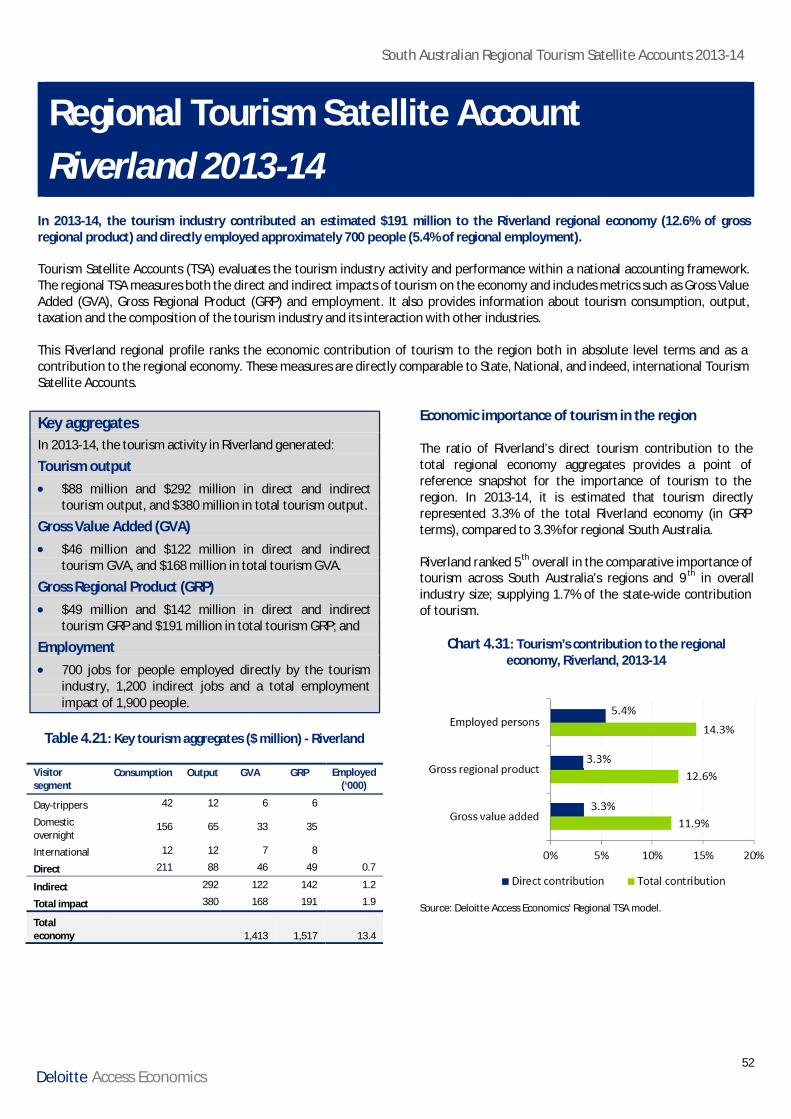
South Australian Regional Tourism Satellite Accounts 2013-14
52Deloitte Access Economics
Regional Tourism Satellite AccountRiverland 2013-14
In 2013-14, the tourism industry contributed an estimated $191 million to the Riverland regional economy (12.6% of grossregional product) and directly employed approximately 700 people (5.4% of regional employment).
Tourism Satellite Accounts (TSA) evaluates the tourism industry activity and performance within a national accounting framework.The regional TSA measures both the direct and indirect impacts of tourism on the economy and includes metrics such as Gross ValueAdded (GVA), Gross Regional Product (GRP) and employment. It also provides information about tourism consumption, output,taxation and the composition of the tourism industry and its interaction with other industries.
This Riverland regional profile ranks the economic contribution of tourism to the region both in absolute level terms and as acontribution to the regional economy. These measures are directly comparable to State, National, and indeed, international TourismSatellite Accounts.
Key aggregatesIn 2013-14, the tourism activity in Riverland generated:
Tourism output· $88 million and $292 million in direct and indirect
tourism output, and $380 million in total tourism output.
Gross Value Added (GVA)· $46 million and $122 million in direct and indirect
tourism GVA, and $168 million in total tourism GVA.
Gross Regional Product (GRP)· $49 million and $142 million in direct and indirect
tourism GRP and $191 million in total tourism GRP; and
Employment· 700 jobs for people employed directly by the tourism
industry, 1,200 indirect jobs and a total employmentimpact of 1,900 people.
Table 4.21: Key tourism aggregates ($ million) - Riverland
Visitorsegment
Consumption Output GVA GRP Employed(‘000)
Day-trippers 42 12 6 6
Domesticovernight
156 65 33 35
International 12 12 7 8
Direct 211 88 46 49 0.7
Indirect 292 122 142 1.2
Total impact 380 168 191 1.9
Totaleconomy 1,413 1,517 13.4
Economic importance of tourism in the region
The ratio of Riverland’s direct tourism contribution to thetotal regional economy aggregates provides a point ofreference snapshot for the importance of tourism to theregion. In 2013-14, it is estimated that tourism directlyrepresented 3.3% of the total Riverland economy (in GRPterms), compared to 3.3% for regional South Australia.
Riverland ranked 5th overall in the comparative importance oftourism across South Australia’s regions and 9 th in overallindustry size; supplying 1.7% of the state-wide contributionof tourism.
Chart 4.31: Tourism’s contribution to the regionaleconomy, Riverland, 2013-14
Source: Deloitte Access Economics’ Regional TSA model.
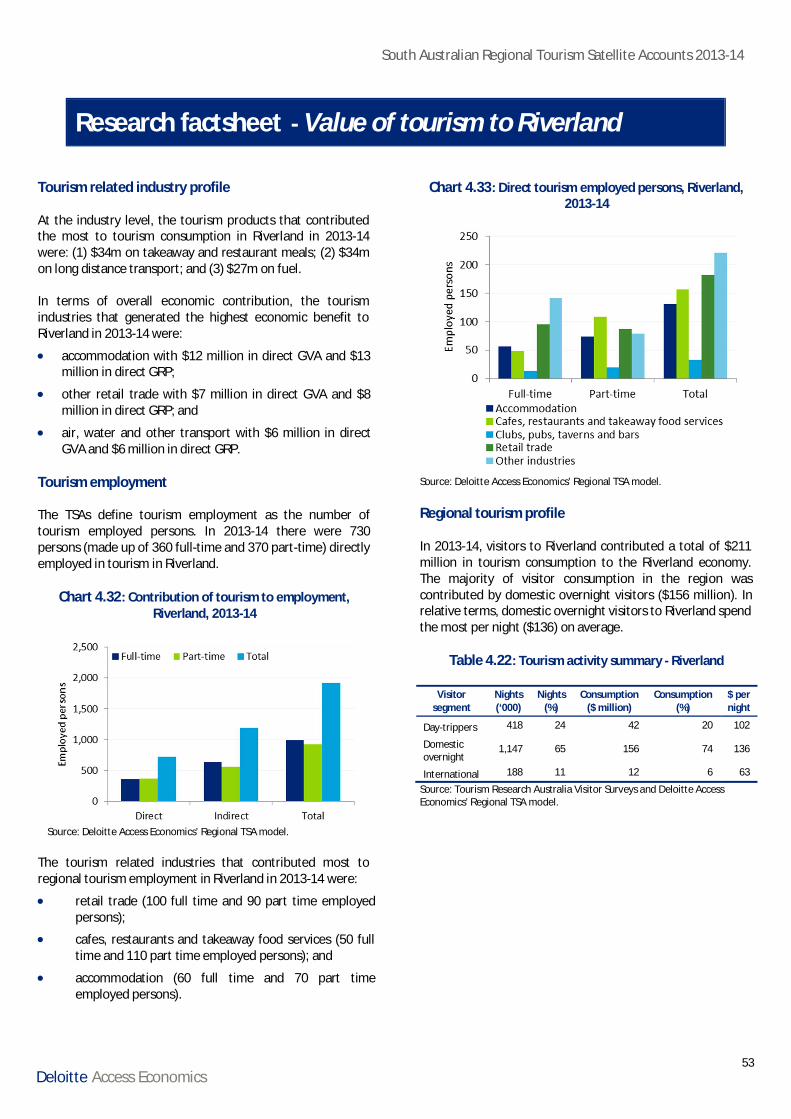
South Australian Regional Tourism Satellite Accounts 2013-14
53Deloitte Access Economics
Research factsheet - Value of tourism to Riverland
Tourism related industry profile
At the industry level, the tourism products that contributedthe most to tourism consumption in Riverland in 2013-14were: (1) $34m on takeaway and restaurant meals; (2) $34mon long distance transport; and (3) $27m on fuel.
In terms of overall economic contribution, the tourismindustries that generated the highest economic benefit toRiverland in 2013-14 were:
· accommodation with $12 million in direct GVA and $13million in direct GRP;
· other retail trade with $7 million in direct GVA and $8million in direct GRP; and
· air, water and other transport with $6 million in directGVA and $6 million in direct GRP.
Tourism employment
The TSAs define tourism employment as the number oftourism employed persons. In 2013-14 there were 730persons (made up of 360 full-time and 370 part-time) directlyemployed in tourism in Riverland.
Chart 4.32: Contribution of tourism to employment,Riverland, 2013-14
Source: Deloitte Access Economics’ Regional TSA model.
The tourism related industries that contributed most toregional tourism employment in Riverland in 2013-14 were:
Chart 4.33: Direct tourism employed persons, Riverland,2013-14
Source: Deloitte Access Economics’ Regional TSA model.
Regional tourism profile
In 2013-14, visitors to Riverland contributed a total of $211million in tourism consumption to the Riverland economy.The majority of visitor consumption in the region wascontributed by domestic overnight visitors ($156 million). Inrelative terms, domestic overnight visitors to Riverland spendthe most per night ($136) on average.
Table 4.22: Tourism activity summary - Riverland
Visitorsegment
Nights(‘000)
Nights(%)
Consumption($ million)
Consumption(%)
$ pernight
Day-trippers 418 24 42 20 102
Domesticovernight
1,147 65 156 74 136
International 188 11 12 6 63
Source: Tourism Research Australia Visitor Surveys and Deloitte AccessEconomics’ Regional TSA model.
· retail trade (100 full time and 90 part time employedpersons);
· cafes, restaurants and takeaway food services (50 fulltime and 110 part time employed persons); and
· accommodation (60 full time and 70 part timeemployed persons).

South Australian Regional Tourism Satellite Accounts 2013-14
54Deloitte Access Economics
Regional Tourism Satellite AccountYorke Peninsula 2013-14
In 2013-14, the tourism industry contributed an estimated $236 million to the Yorke Peninsula regional economy (14.1% of grossregional product) and directly employed approximately 900 people (6.6% of regional employment).
Tourism Satellite Accounts (TSA) evaluates the tourism industry activity and performance within a national accounting framework.The regional TSA measures both the direct and indirect impacts of tourism on the economy and includes metrics such as Gross ValueAdded (GVA), Gross Regional Product (GRP) and employment. It also provides information about tourism consumption, output,taxation and the composition of the tourism industry and its interaction with other industries.
This Yorke Peninsula regional profile ranks the economic contribution of tourism to the region both in absolute level terms and as acontribution to the regional economy. These measures are directly comparable to State, National, and indeed, international TourismSatellite Accounts.
Key aggregatesIn 2013-14, the tourism activity in Yorke Peninsula generated:
Tourism output· $97 million and $375 million in direct and indirect
tourism output, and $472 million in total tourism output.
Gross Value Added (GVA)· $50 million and $157 million in direct and indirect
tourism GVA, and $206 million in total tourism GVA.
Gross Regional Product (GRP)· $53 million and $183 million in direct and indirect
tourism GRP and $236 million in total tourism GRP; and
Employment· 900 jobs for people employed directly by the tourism
industry, 1,500 indirect jobs and a total employmentimpact of 2,400 people.
Table 4.23: Key tourism aggregates ($ million) – YorkePeninsula
Visitorsegment
Consumption Output GVA GRP Employed(‘000)
Day-trippers 49 15 8 7
Domesticovernight
195 72 36 38
International 1 10 6 8
Direct 245 97 50 53 0.9
Indirect 375 157 183 1.5
Total impact 472 206 236 2.4
Totaleconomy 1,556 1,670 13.6
Economic importance of tourism in the region
The ratio of Yorke Peninsula’s direct tourism contribution tothe total regional economy aggregates provides a point ofreference snapshot for the importance of tourism to theregion. In 2013-14, it is estimated that tourism directlyrepresented 3.2% of the total Yorke Peninsula economy (inGRP terms), compared to 3.3% for regional South Australia.
Yorke Peninsula ranked 6th overall in the comparativeimportance of tourism across South Australia’s region and 7 th
in overall industry size; supplying 1.8% of the state-widecontribution of tourism.
Chart 4.34: Tourism’s contribution to the regionaleconomy, Yorke Peninsula, 2013-14
Source: Deloitte Access Economics’ Regional TSA model.
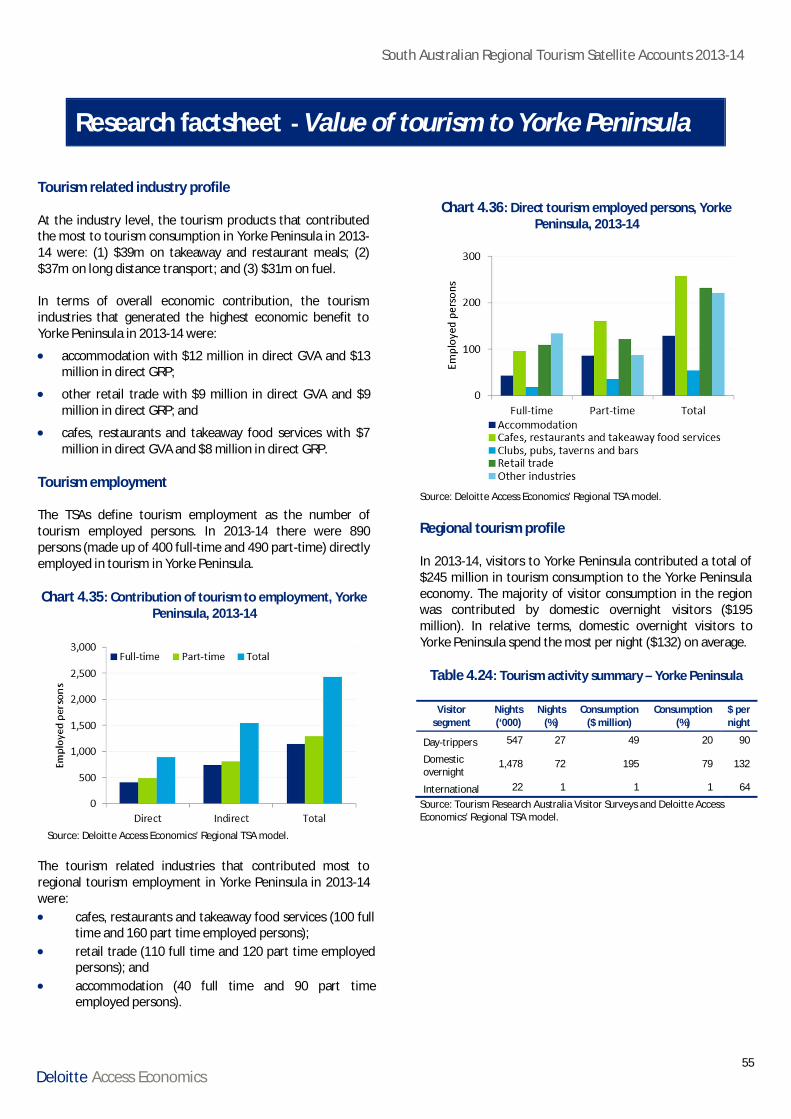
South Australian Regional Tourism Satellite Accounts 2013-14
55Deloitte Access Economics
Research factsheet - Value of tourism to Yorke Peninsula
Tourism related industry profile
At the industry level, the tourism products that contributedthe most to tourism consumption in Yorke Peninsula in 2013-14 were: (1) $39m on takeaway and restaurant meals; (2)$37m on long distance transport; and (3) $31m on fuel.
In terms of overall economic contribution, the tourismindustries that generated the highest economic benefit toYorke Peninsula in 2013-14 were:
· accommodation with $12 million in direct GVA and $13million in direct GRP;
· other retail trade with $9 million in direct GVA and $9million in direct GRP; and
· cafes, restaurants and takeaway food services with $7million in direct GVA and $8 million in direct GRP.
Tourism employment
The TSAs define tourism employment as the number oftourism employed persons. In 2013-14 there were 890persons (made up of 400 full-time and 490 part-time) directlyemployed in tourism in Yorke Peninsula.
Chart 4.35: Contribution of tourism to employment, YorkePeninsula, 2013-14
Source: Deloitte Access Economics’ Regional TSA model.
The tourism related industries that contributed most toregional tourism employment in Yorke Peninsula in 2013-14were:
Chart 4.36: Direct tourism employed persons, YorkePeninsula, 2013-14
Source: Deloitte Access Economics’ Regional TSA model.
Regional tourism profile
In 2013-14, visitors to Yorke Peninsula contributed a total of$245 million in tourism consumption to the Yorke Peninsulaeconomy. The majority of visitor consumption in the regionwas contributed by domestic overnight visitors ($195million). In relative terms, domestic overnight visitors toYorke Peninsula spend the most per night ($132) on average.
Table 4.24: Tourism activity summary – Yorke Peninsula
Visitorsegment
Nights(‘000)
Nights(%)
Consumption($ million)
Consumption(%)
$ pernight
Day-trippers 547 27 49 20 90
Domesticovernight
1,478 72 195 79 132
International 22 1 1 1 64
Source: Tourism Research Australia Visitor Surveys and Deloitte AccessEconomics’ Regional TSA model.
· cafes, restaurants and takeaway food services (100 fulltime and 160 part time employed persons);
· retail trade (110 full time and 120 part time employedpersons); and
· accommodation (40 full time and 90 part timeemployed persons).
South Australian Regional Tourism Satellite Accounts 2013-14
56Deloitte Access Economics
Research factsheet - Value of tourism to Yorke Peninsula
Methodology
Tourism and Events South Australia has workedwith Deloitte Access Economics to produceconsistent and comparable regional TourismSatellite Account (TSA) estimates of the value oftourism to South Australia’s regions.
Tourism Satellite Accounts are used to estimatethe contribution of tourism to a region bycombining the contributions of the various goodsand services that make up the industry. Theregional, state and national estimates are basedon an internationally recognised and standardisedframework (although regional TSA methodologyhas been extended to determine the indirectimpact of cross region trade flows).
There are a number of steps required to calculatethe tourism industry’s contribution to YorkePeninsula’s economy. To start, a regional tourismconsumption bundle is derived from TRA visitorsurvey data and adjusted to remove any priceeffects that are not directly attributed to the sellerof the good or service (e.g. taxes, transportmargins, pre-manufactured inputs etc.). The directand indirect contributions of tourism areestimated by using regional input-outputmultiplier tables, derived from ABS data.
For consistency and assurance, the regional resultsare calibrated against the reported 2013-14 stateTSA data.
Tourism Standard Reporting
For consistency in reporting, when referring to theoverall size or contribution of the tourism industryin a region, the appropriate measure is GRP. GVAshould be used when comparing the tourismindustry against another industry within the sameregion.
Glossary
Direct contribution of tourism: The contributiongenerated by transactions between the visitor andproducer for a good or service that involves adirect physical or economic relationship.
Indirect contribution of tourism: The subsequentflow-on effects created by the requirement forinputs from those industries supplying goods andservices to visitors. For example, in the case of thehotel industry this might include the fresh producesupplied to a hotel and the electricity used.
Input-output table: An input-output table is ameans of presenting a detailed analysis of theprocess of production and the associated use ofgoods and services and income generated.National input-output tables are producedannually by the Australian Bureau of Statistics.
Tourism gross regional product: Tourism GRP istourism GVA plus net taxes on products that areattributable to the tourism industry. As such directtourism GRP will generally have a higher valuethan direct tourism GVA. Direct tourism GRP is asatellite account construct to enable a directcomparison with the most widely recognisednational accounting aggregate, gross domestic (orregional) product.
Tourism gross value added: Considered the mostaccurate measure of the contribution of theindustry to the economy. It includes the totallabour income and capital revenue received by theindustry and the net taxes that governmentreceived from the production. This measure isdirectly comparable with the value added of‘conventional’ industries such as mining andmanufacturing and can also be used forcomparisons across countries.
Tourism output: The total value of goods andservices produced in Australia to satisfy visitorconsumption. It is measured in basic prices, so itexcludes net taxes on tourism products.
South Australian Regional Tourism Satellite Accounts 2013-14
57Deloitte Access Economics
Appendix A: Explanatory notesTourism Satellite Account Framework
The Australian Bureau of Statistics supply and use tables for the Australian economy provide thefoundation for which data of visitor expenditure (demand) and industry output (supply) areintegrated and made consistent with national accounts through benchmarking. The derived regionalmultipliers provide the means by which direct tourism gross value added, GRP and employment canbe calculated. These regional input-output tables provide a robust tool for further analysis andeconomic modelling of the sub-regional impact of tourism.
Direct contribution of tourism
A direct impact occurs where there is a direct relationship, both physical and economic, between thevisitor and the producer of the good or service. Direct tourism output is essentially tourismconsumption at basic prices less the intermediate costs to retailers of domestic goods sold directlyto visitors (including wholesale and transport margins for domestic supply).
In the case of retail goods purchased by visitors, only the retail margin contributes to direct tourismoutput, value added and Gross Regional Product. This is because it is deemed that only the retailerhas a direct relationship with the visitor and is therefore part of the tourism industry. As aconsequence the output, and consequently value added, attributed to other (than retail) industriesis excluded from the value of direct tourism output. Direct tourism output is therefore equal tointernal tourism consumption at basic prices less the cost to retailers of domestic goods sold directlyto visitors.
The implication of this treatment is that only the value added generated from retail trade activitiesprovided to visitors will be considered as a direct effect. All other trade flows will form part of thenet indirect impacts for each region.
Regional tourism activity data from the TRA International Visitor Survey (IVS) and National VisitorSurvey (NVS) is used to derive itemised tourism consumption, or demand, in each region. DAE’sregional IO database (derived from the ABS’ national 2006-07 IO tables and data from the Census ofPopulation and Housing) provides the cost structure and all required information to derive thesupply side of the tourism sector in the regional TSAs.
The aggregate regional supply and demand elements are then calibrated to the state TSA data, suchthat the summing conditions between regions and State are satisfied.
Direct tourism gross value added and direct tourism GRP are the major economic aggregates derivedin the regional TSA.
Direct tourism gross value added shows only the 'value' which a producer adds to the raw materialgoods and services it purchases in the process of producing its own output. Direct tourism grossvalue added is measured as the value of the output of tourism products by industries in a directrelationship with visitors less the value of the inputs used in producing these tourism products.
South Australian Regional Tourism Satellite Accounts 2013-14
58Deloitte Access Economics
Direct tourism GRP, on the other hand, measures the value added of the tourism industry atpurchasers' (market) prices. It therefore includes taxes paid less subsidies associated with theproductive activity attributable to tourism. While direct tourism GRP is useful for comparisonagainst the national accounts, it is not comparable across industries or between countries (due tothe inclusion of taxes).
Indirect contribution of tourism
The indirect effect of tourism consumption is a broad notion that covers downstream and suppliereffects of tourism demand. Intermediate inputs represent those goods and service which supportthe supply of the tourism product – the cleaning services that are inputted to the hotel sector; thefuel that is inputted to the aviation industry; the fruit and vegetables that are inputted to therestaurant industry. Together with any downstream impacts, it is these flow-on effects whichdetermine the tourism industry’s indirect contribution.
Whether flow-on economic impacts are captured at the local level hinges on the region’s capacity tosupply intermediate inputs to the tourism sector. In order to assess this – and, therefore, torigorously quantify the indirect impacts at a regional level –DAE has utilised a gravity modellingtechnique based on parameters that define the intermediate inputs relevant to each ‘tourismcharacteristic ‘ANZSIC industry and a corresponding analysis of the local industry base in eachTourism Region.
The inclusion of indirect effects in the regional TSA framework provides a more complete view of thetotal contribution of tourism to regional South Australia. Both the direct and indirect effects havebeen calculated using input-output analysis methods. The IO analysis method provides a breakdownof the supply and demand of commodities in the regional economy. As the tourism sector by naturedoes not have its own multiplier, a correspondence between the tourism consumption bundle andproduction industries is used to calculate a weighted tourism industry multiplier.
The multipliers measure the individual contribution of the supply industries and thus provide thebenchmark for estimating direct and flow-on effects for tourism output, GVA, GRP and employment.
Regional expenditure
TRA regional tourism profiles are used to inform, where possible, ‘cost indicators’ (i.e. averageexpenditure per visitor) for South Australian tourism regions. These cost indicators are used todevelop a set of regional cost differentials relative to the state average and are then multiplied outto allow for total annual regional visitation.
The itemised expenditure bundles are the foundation of the regional TSA framework. The estimatesderived from the regional expenditure allocation show considerable differences in expenditureprofiles across regions and are a key contributor in shaping the patterns that individualise theregions.
However, in order to produce estimates at such a detailed level of granularity, a number of datamanipulations and assumptions must be made. Indeed, some of the data has been stretched to thelimits of its intended capability. Statistical variability and confidence issues result in a number ofgaps in regional expenditure estimates. It is important to note, that the assumptions underlying thedata transformations may have an effect on the quality of the outputs.
South Australian Regional Tourism Satellite Accounts 2013-14
59Deloitte Access Economics
Tourism consumption
Consumption represents the demand side of tourism and thus reflects the visitors’ payment forgoods and services. Thus consumption in tourism satellite accounting is generally measured inpurchasers’ prices to reflect the price impact on visitors. The calibrated regional tourism expenditurebundles are used to measure regional consumption at purchasers’ prices. This includes componentsthat are not directly related to industries producing goods and services for tourism purposes:· Imports· Product taxes and subsidies· Wholesale and retail margins
Therefore in order to measure the indirect effects correctly, it is necessary to adjust purchasers’consumption estimates for the non-direct components of the product supply. Only at basic prices isconsumption equal to output of the producing industry, as all additional components paid by theconsumers are removed.
Furthermore, basic price measures allow for comparisons between industries and across countriesbecause they are free of the distorting (and variable) effects of taxes and subsidies on products.Notably, the tax and subsidy component of a product's sale price does not represent value added bythe industry producing that product and flow-on effects would be further over-estimated by theinclusion of values such as imports which are not related directly to domestic production.
South Australian Regional Tourism Satellite Accounts 2013-14
60Deloitte Access Economics
Appendix B: GlossaryABS Australian Bureau of Statistics
ANZSIC Australian and New Zealand Standard IndustrialClassification
CEP Centre of Economics and Policy
CGE Computable General Equilibrium
DAE Deloitte Access Economics
GFC Global Financial Crisis
GRP Gross Regional Product
GSP Gross State Product
GVA Gross Value Added
I-O Input - Output
LGA Local Government Area
MMRF Monash Multi-Regional Forecasting
STCRC Sustainable Tourism Cooperative Research Council
TRA Tourism Research Australia
TSA Tourism Satellite Account
Basic price: The amount receivable by the producer from the purchaser for a unit of a good orservice produced as output, prior to any additional costs such as net taxes or margins requiredto facilitate transfer of the goods and services from the producer to the visitors. Theseadditional costs are paid by consumers but received by other industries (e.g. transport) andgovernment (e.g. tax revenue).
Current prices: The estimates of tourism consumption and contribution presented in this reportare recorded at current prices (i.e. the prevailing prices in the period to which the observationrelates). Therefore, changes over time are a result of changes in prices as well as underlyingsystemic changes in the real level of economic activity.
Direct contribution of tourism: The contribution generated by transactions between the visitorand producer for a good or service that involves a direct physical or economic relationship. Forexample, the direct effects of an increase in the number of visitors staying in hotelaccommodation are the sales and any associated changes in payments for wages and salaries,taxes and supplies and services.
Employed person: A person aged 15 years or over who during the reference week worked forone hour or more for pay, profit, commission, or payment in kind in a job or business or on afarm, or work for one hour or more without pay in a family business or on a farm. Direct andindirect tourism employment is measured separately using the TSA framework, and IO andgravity modelling techniques respectively. Combined they provide an estimate of total tourismemployment.
South Australian Regional Tourism Satellite Accounts 2013-14
61Deloitte Access Economics
Imputed tourism consumption: Consists of imputations made for the consumption by visitorsof certain goods and services for which they do not make a payment. Imputation is confined toa small number of cases where a reasonably satisfactory basis for the valuation of the impliedtransaction is available (such as imputed rent on dwellings).
Indirect contribution of tourism: The subsequent flow-on effects created by the requirementfor inputs from those industries supplying goods and services to visitors. For example, in thecase of the hotel industry this might include the fresh produce supplied to a hotel and theelectricity used.
Input-output table: An input-output table is a means of presenting a detailed analysis of theprocess of production and the use of goods and services (products) and the income generatedin the production process. National input-output tables are produced annually by the AustralianBureau of Statistics.
International tourism: Short-term overseas visitors to Australia for a period of less than 12months. The one year rule for length of stay for an international visitor is consistent with theprinciple applied in determining residency in the balance of payments, which generally requiresthe length of stay in an economic territory to be less than one year to qualify as a non-resident.
Interstate travel: Domestic overnight travel where a visitor travels to a State or Territory otherthan that of their usual environment. The usual environment is made up of one or more areas inwhich a person undertakes their regular activities such as their place of residence, place ofwork, place of study and other places frequented.
Intrastate travel: Domestic overnight travel where a visitor travels to a location within the Stateor Territory in which they reside.
Margin: The margin is the difference between the resale price of a good and the cost to theretailer or wholesaler of the good sold. A transport margin consists of the transport chargesinvoiced separately by the producer in the delivery of a good.
Net taxes on products: The combined taxes and subsidies on a product, payable per unit of agood or service. The tax or subsidy may be a specific amount of money per unit of quantity of agood or service, or it may be calculated ad valorem as a specified percentage of the price perunit or value of the goods or services transacted. A tax or subsidy usually becomes payablewhen the product is sold or imported but may also become payable in other circumstances suchas when a good is exported.
Other taxes on production: All taxes that enterprises incur as a result of engaging in product,except taxes on products. These include taxes related to the payroll or workforce numbers;taxes paid by the employees themselves out of their wages or salaries; recurrent taxes on land,buildings or other structures; business and professional licenses where no service is provided bythe Government in return; taxes on the use of fixed assets or other activities; stamp duties;taxes on pollution and the environment; and taxes on international transactions.
Purchasers’ price: the amount payable by the purchaser, excluding any deductible tax, to takedelivery of a unit of a good or service at the time and place required by the purchaser. Thisincludes any transport charges paid separately to take delivery of the good or service.
South Australian Regional Tourism Satellite Accounts 2013-14
62Deloitte Access Economics
Same-day travel: Domestic travel involving a round trip distance of at least 50 kilometres and atleast four hours, and no nights spent away from home. Same-day travel as part of overnighttravel is excluded, as is routine travel such as commuting between work or school and home.
Total contribution of tourism: The sum of the direct and indirect effects of tourismconsumption (see direct contribution of tourism and indirect contribution of tourism).
Tourism characteristic industries : Industries that would either cease to exist in their presentform or would be significantly affected if tourism were to cease. Under the international TSAstandards, core lists of tourism characteristic industries, based on the significance of their linkto tourism in the worldwide context, are recommended to facilitate international comparison.The core list of tourism characteristic industries is consistent with the newly revisedinternational classification of industries, namely the International Standard IndustrialClassification, Revision 4 (ISIC Rev. 4), which aligns closely with ANZSIC 2006. In the AustralianTSA, for an industry to be a country-specific tourism characteristic industry, at least 25 per centof its output must be consumed by visitors.
Tourism characteristic products: Products that would either cease to exist in meaningfulquantity or for which sales would be significantly reduced in the absence of tourism. Under theinternational TSA standards, core lists of tourism characteristic products, based on thesignificance of their link to tourism in the worldwide context, are recommended to facilitateinternational comparison. In the Australian TSA, for a product to be a country-specific tourismcharacteristic product, at least 25 per cent of the output of the product must be consumed byvisitors.
Tourism connected industries: Industries, other than tourism characteristic industries, forwhich a tourism related product is directly identifiable (primary) and where the products areconsumed by visitors in volumes which are significant for the visitor and/or the producer. For anindustry to be tourism related it must serve the visitor themselves, that is, there must be adirect relationship between the provider of the product and the consumer. All other industriesare classified as ‘all other industries’, though some of their products may be consumed byvisitors and are included in the calculation of direct tourism GVA and GRP.
Tourism connected products: Products that are consumed by visitors but are not consideredtourism characteristic products.
Tourism consumption: The total value of tourism goods and services consumed by residentsand visitors from overseas in Australia. It consists of tourism expenditure plus imputedconsumption by resident and non-resident visitors on tourism related products. It includeshousehold, business and government tourism consumption. It represents the price paid by thevisitor (which therefore includes taxes and subsidies) and is measured in purchasers’ prices.
Tourism expenditure: The amount paid by a visitor or on behalf of a visitor for and duringhis/her trip and stay at the destination.
South Australian Regional Tourism Satellite Accounts 2013-14
63Deloitte Access Economics
Tourism gross regional product: Tourism GRP is tourism GVA plus net taxes on products thatare attributable to the tourism industry. As such direct tourism GRP will generally have a highervalue than direct tourism GVA. Direct tourism GRP is a satellite account construct to enable adirect comparison with the most widely recognised national accounting aggregate, grossdomestic (or regional) product. Direct and indirect flow-on GRP are measured separately usingthe TSA framework, and IO and gravity modelling techniques respectively. Combined theyprovide an estimate for total tourism GRP.
Tourism gross value added: Considered the most accurate measure of the contribution of theindustry to the economy. It includes the total labour income and capital revenue received bythe industry and the net taxes that government received from the production, and is measuredin basic prices. This measure is directly comparable with the value added of ‘conventional’industries such as mining and manufacturing and can also be used for comparisons acrosscountries. Direct and indirect GVA are measured separately using the TSA framework, and IOand gravity modelling techniques respectively. Combined they provide an estimate of totaltourism GVA.
Tourism output: The total value of goods and services produced in Australia to satisfy visitorconsumption. It is measured in basic prices, so it excludes net taxes on tourism products.
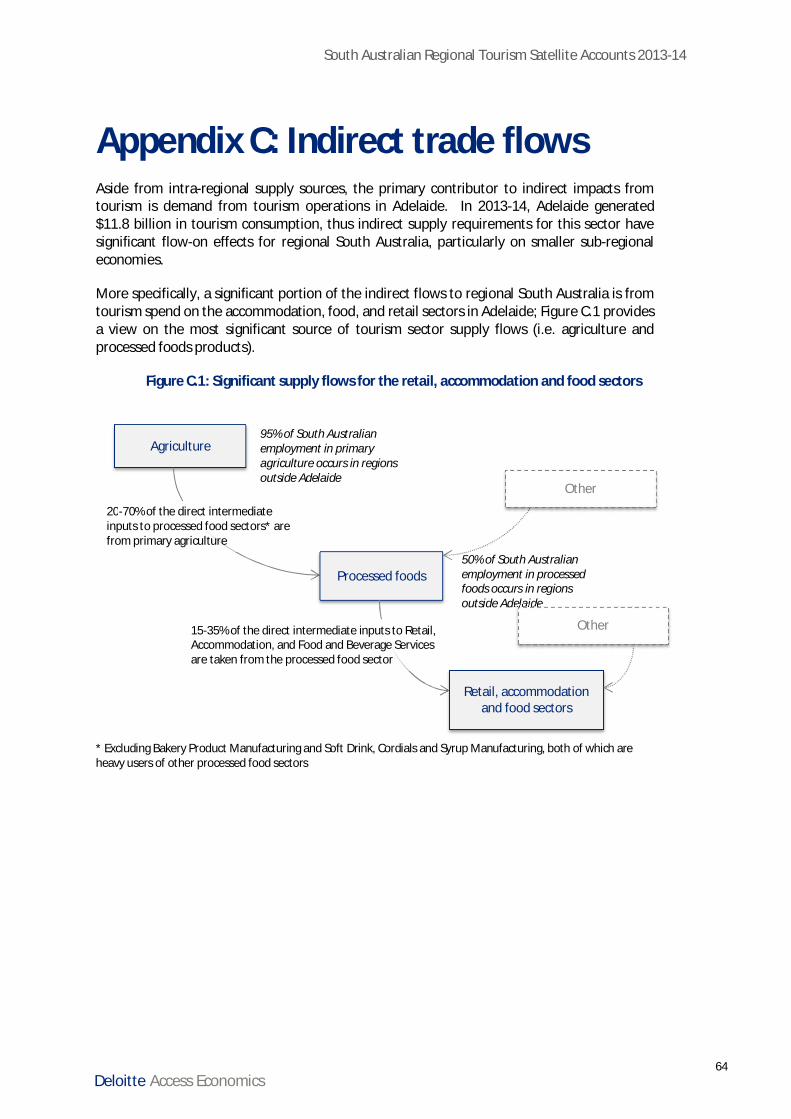
South Australian Regional Tourism Satellite Accounts 2013-14
64Deloitte Access Economics
Appendix C: Indirect trade flowsAside from intra-regional supply sources, the primary contributor to indirect impacts fromtourism is demand from tourism operations in Adelaide. In 2013-14, Adelaide generated$11.8 billion in tourism consumption, thus indirect supply requirements for this sector havesignificant flow-on effects for regional South Australia, particularly on smaller sub-regionaleconomies.
More specifically, a significant portion of the indirect flows to regional South Australia is fromtourism spend on the accommodation, food, and retail sectors in Adelaide; Figure C.1 providesa view on the most significant source of tourism sector supply flows (i.e. agriculture andprocessed foods products).
Figure C.1: Significant supply flows for the retail, accommodation and food sectors
* Excluding Bakery Product Manufacturing and Soft Drink, Cordials and Syrup Manufacturing, both of which areheavy users of other processed food sectors
Agriculture95% of South Australianemployment in primaryagriculture occurs in regionsoutside Adelaide
Processed foods50% of South Australianemployment in processedfoods occurs in regionsoutside Adelaide
20-70% of the direct intermediateinputs to processed food sectors* arefrom primary agriculture
Other
Other
Retail, accommodationand food sectors
15-35% of the direct intermediate inputs to Retail,Accommodation, and Food and Beverage Servicesare taken from the processed food sector
South Australian Regional Tourism Satellite Accounts 2013-14
65Deloitte Access Economics
ReferencesAustralian Bureau of Statistics (ABS 2011), 2011 Census of Population and Housing, Canberra,
August 2012.
Australian Bureau of Statistics (ABS 2006), 2006 Census of Population and Housing, Canberra,August 2007.
Australian Bureau of Statistics (ABS 2012), Australian National Accounts: Input-Output Tables,2008-09, cat. no. 5209.0.55.001, Canberra, September 2012.
Australian Bureau of Statistics (ABS 2011a), Tourism Region Maps and Correspondence Files,Australia, 2011, cat. no. 9503.0.55.001, Canberra, August 2011.
Australian Bureau of Statistics (ABS 2011b), Australia’s National Accounts: Tourism SatelliteAccount, 2013-14, cat. no. 5249.0, Canberra, December 2011.
Australian Bureau of Statistics (ABS 2011c), Australia’s National Accounts: State Accounts, 2013-14 cat. no. 5220.0, Canberra, November 2011.
The Centre for Economics and Policy (CEP 2011), Tourism Satellite Accounts 2008-09: SummarySpreadsheets; The Economic Contribution of Tourism to Australian States and Territories .
Deloitte Access Economics for Tourism South Australia, Regional South Australian TourismSatellite Account: Specification Document, Canberra 2012.
Organisation of Economic Co-operation and Development (OECD 2000), Measuring the Role ofTourism in OECD Economies: The OECD Manual on Tourism Satellite Accounts andEmployment, Paris 2000.
Tourism Research Australia (TRA 2011), Regional Tourism Profiles 2013-14, Canberra, December2011.
Tourism Research Australia (TRA 2012), State Tourism Satellite Accounts 2009-10, Canberra,June 2012.
Tourism Research Australia (TRA 2012b), State Tourism Satellite Accounts 2013-14, Canberra,June 2012.
Tourism Research Australia (NVS 2011), Travel by Australians June 2011: Quarterly Results ofthe National Visitor Survey, Canberra, December 2011.
Tourism Research Australia (IVS 2011), International Visitors in Australia June 2011: QuarterlyResults of the International Visitor Survey , Canberra, September 2011.
Tourism South Australia (2009), Regional Tourism Action Plan 2009-2012, Adelaide, 2009.
United Nations Department of Economic and Social Affairs (2008), Tourism Satellite Account:Recommended Methodological Framework 2008, Luxembourg, Madrid, New York, Paris,2010.
South Australian Regional Tourism Satellite Accounts 2013-14
66Deloitte Access Economics
United Nations Statistics Division, World Tourism Organisation , International Recommendationsfor Tourism Statistics, Luxembourg, Madrid, New York, Paris, 2008.
Limitation of our workGeneral use restriction
This report is prepared solely for the use of South Australia Tourism Commission. This report is notintended to and should not be used or relied upon by anyone else and we accept no duty of care to anyother person or entity. The report has been prepared for the purpose of providing a rigorous regionalanalysis and information platform for sub-regional tourism planning, marketing and development. Youshould not refer to or use our name or the advice for any other purpose.
Contact usDeloitte Access EconomicsACN: 149 633 116
Level 19 Sydney AvenueBarton ACT 2600PO Box 6334Kingston ACT 2604 Australia
Tel: +61 2 6175 2000Fax: +61 2 6175 2001
www.deloitteaccesseconomics.com.au
Deloitte Access Economics is Australia’s pre-eminent economics advisory practice and amember of Deloitte's global economicsgroup. The Directors and staff of AccessEconomics joined Deloitte in early 2011.
Deloitte refers to one or more of Deloitte ToucheTohmatsu Limited, a UK private company limitedby guarantee, and its network of member firms,each of which is a legally separate andindependent entity. Please seewww.deloitte.com/au/about for a detaileddescription of the legal structure of DeloitteTouche Tohmatsu Limited and its member firms.
About Deloitte
Deloitte provides audit, tax, consulting, andfinancial advisory services to public and privateclients spanning multiple industries. With aglobally connected network of member firms inmore than 150 countries, Deloitte brings world-class capabilities and deep local expertise to helpclients succeed wherever they operate. Deloitte'sapproximately 170,000 professionals arecommitted to becoming the standard ofexcellence.
About Deloitte Australia
In Australia, the member firm is the Australianpartnership of Deloitte Touche Tohmatsu. As oneof Australia’s leading professional services firms.Deloitte Touche Tohmatsu and its affiliates provideaudit, tax, consulting, and financial advisoryservices through approximately 5,400 peopleacross the country. Focused on the creation ofvalue and growth, and known as an employer ofchoice for innovative human resources programs,we are dedicated to helping our clients and ourpeople excel. For more information, please visitour web site at www.deloitte.com.au.
Liability limited by a scheme approved underProfessional Standards Legislation.
Member of Deloitte Touche Tohmatsu Limited
© 2015 Deloitte Access Economics Pty Ltd