Embed Size (px)
Citation preview

TOURISM SATELLITE ACCOUNT
SUMMARY OF KEY RESULTS
2015–16
TOURISM SATELLITEACCOUNT
ACKNOWLEDGMENTS
The Australian Tourism Satellite Account is published each year and provides measures of Tourism Gross Value Added, Tourism Gross Domestic Product, tourism employment and tourism trade. This enables government and industry to compare the value of tourism with other industries in the economy.
The Australian Tourism Satellite Account is prepared by the Australian Bureau of Statistics and is funded by the Australian Trade and Investment Commission (Austrade).
Tourism Research Australia Australian Trade and Investment Commission (Austrade) GPO Box 1564 Canberra ACT 2601 ABN 46 252 861 927
Email: [email protected] Web: www.tra.gov.au
Publication date: December 2016
This work is licensed under a Creative Commons Attribution 3.0 Australia licence. To the extent that copyright subsists in third party quotes and diagrams it remains with the original owner and permission may be required to reuse the material.
This work should be attributed as Tourism Satellite Account 2015–16: Summary of Key Results Tourism Research Australia, Canberra.
Inquiries regarding the licence and any use of work by Tourism Research Australia are welcome at [email protected]
Cover image: Sydney Shopping Image courtesy of Tourism Australia.
STATE TOURISM SATELLITE ACCOUNTS TOURISM RESEARCH AUSTRALIAii
CONTENTS
ACKNOWLEDGMENTS ............................................................................ I
SUMMARY OF KEY RESULTS ..................................................................1
TOURISM’S ECONOMIC IMPACT .............................................................4
SPENDING BY TOURISTS .......................................................................6
AUSTRALIA’S TOURISM WORKFORCE ...................................................10
GLOSSARY OF TERMS .........................................................................12

iii
FIGURES
FIGURE 1: THE GROWTH OF TOURISM, 2000–01 TO 2015–16 ...........................................4
FIGURE 2: YEAR-ON-YEAR GROWTH IN TOURISM INDUSTRY GDP, 1999–2000 TO 2015–16 ..................................................................................................5
FIGURE 3: ECONOMIC CONTRIBUTION OF TOURISM, 2015–16 ...........................................5
FIGURE 4: TOURISM CONTRIBUTION BY SECTOR, 2015–16 ..............................................6
FIGURE 5: CONSUMPTION EXPENDITURE BY VISITOR TYPE, 2015–16 ...............................6
FIGURE 6: CONTRIBUTION OF KEY TOURISM PRODUCTS TO TOTAL VISITOR CONSUMPTION EXPENDITURE, 2015–16 ..........................................7
FIGURE 7: VISITOR CONSUMPTION EXPENDITURE ON TOURISM PRODUCTS ($ MILLION), 2015–16 .................................................................8
FIGURE 8: TOURISM EXPORTS, IMPORTS AND NET TRADE, 2000–01 TO 2015–16 .............9
FIGURE 9: DIRECT TOURISM EMPLOYMENT (PERSONS), 2000–01 TO 2015–16 ...............10
FIGURE 10: TOURISM EMPLOYMENT BY SECTOR, 2015–16 .............................................11
TABLE 1: KEY TOURISM AGGREGATES, 2014–15 AND 2015–16 .......................................11
STATE TOURISM SATELLITE ACCOUNTS TOURISM RESEARCH AUSTRALIA1
SUMMARY OF KEY RESULTS
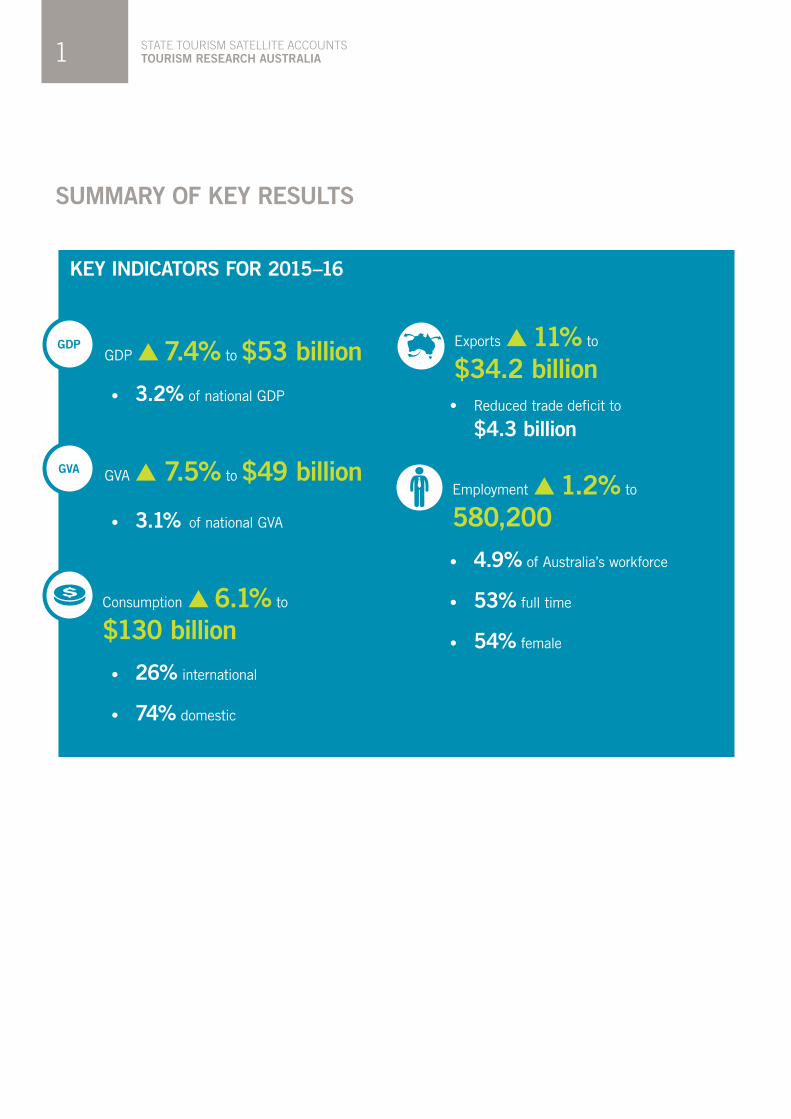
KEY INDICATORS FOR 2015–16
GDP 7.4% to $53 billion
• 3.2% of national GDP
GVA 7.5% to $49 billion
• 3.1% of national GVA
Consumption 6.1% to
$130 billion
• 26% international
• 74% domestic
Exports 11% to
$34.2 billion• Reduced trade deficit to
$4.3 billion
Employment 1.2% to
580,200
• 4.9% of Australia’s workforce
• 53% full time
• 54% female
GVA
GDP
2
DEMAND– SIDE DATA
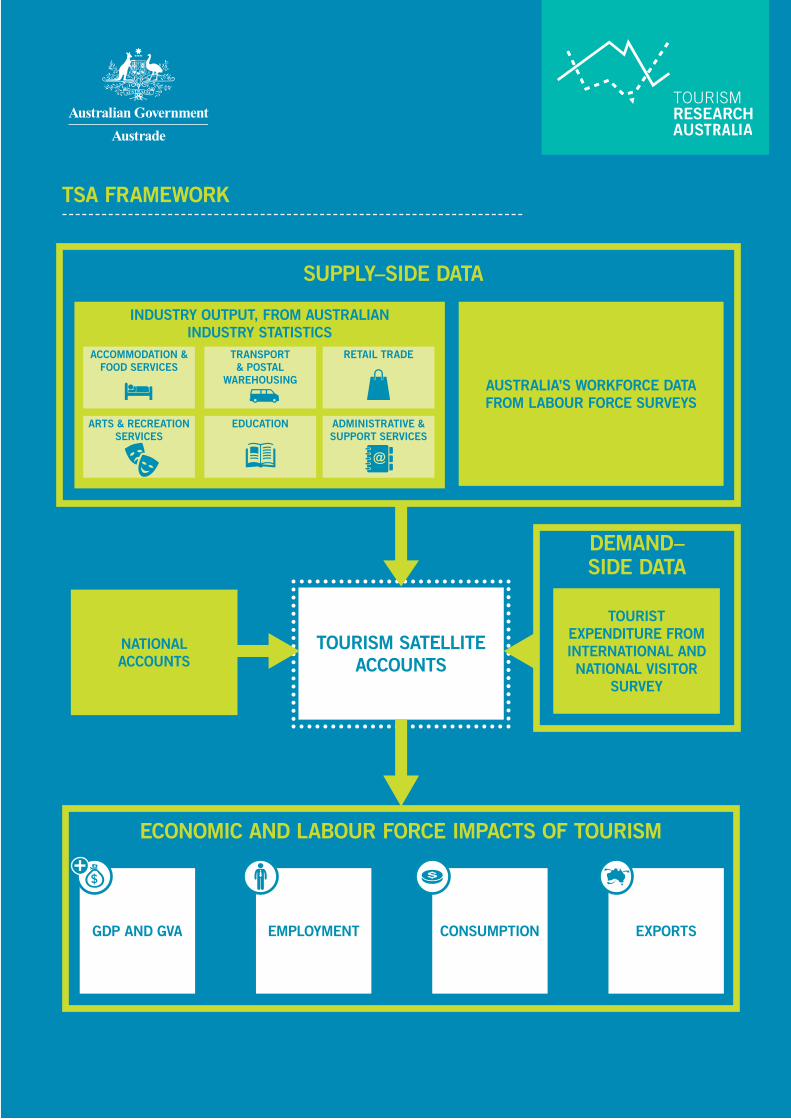
TSA FRAMEWORK
SUPPLY–SIDE DATA
INDUSTRY OUTPUT, FROM AUSTRALIAN INDUSTRY STATISTICS
ACCOMMODATION & FOOD SERVICES
TRANSPORT & POSTAL
WAREHOUSING
RETAIL TRADE
ARTS & RECREATION SERVICES
EDUCATION ADMINISTRATIVE & SUPPORT SERVICES
AUSTRALIA’S WORKFORCE DATA FROM LABOUR FORCE SURVEYS
TOURISM SATELLITE ACCOUNTS
NATIONAL ACCOUNTS
TOURIST EXPENDITURE FROM INTERNATIONAL AND NATIONAL VISITOR
SURVEY
ECONOMIC AND LABOUR FORCE IMPACTS OF TOURISM
GDP AND GVA EMPLOYMENT CONSUMPTION EXPORTS
STATE TOURISM SATELLITE ACCOUNTS TOURISM RESEARCH AUSTRALIA3
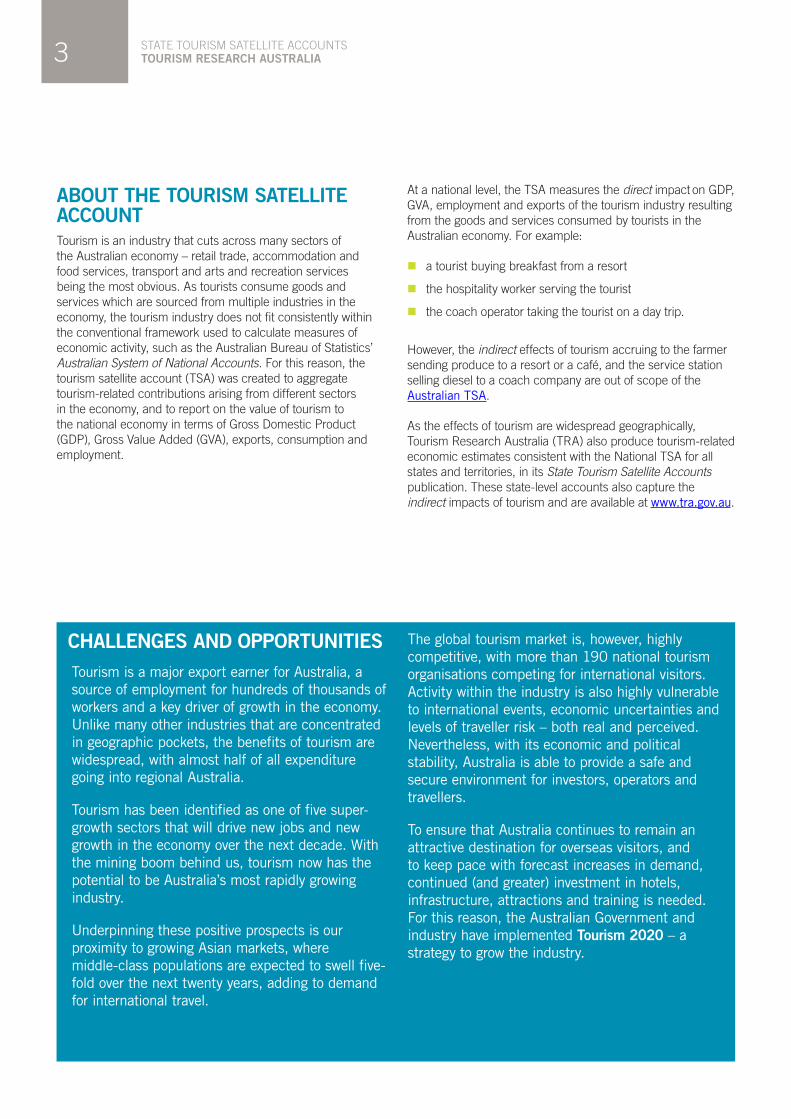
ABOUT THE TOURISM SATELLITE ACCOUNT Tourism is an industry that cuts across many sectors of the Australian economy – retail trade, accommodation and food services, transport and arts and recreation services being the most obvious. As tourists consume goods and services which are sourced from multiple industries in the economy, the tourism industry does not fit consistently within the conventional framework used to calculate measures of economic activity, such as the Australian Bureau of Statistics’ Australian System of National Accounts. For this reason, the tourism satellite account (TSA) was created to aggregate tourism-related contributions arising from different sectors in the economy, and to report on the value of tourism to the national economy in terms of Gross Domestic Product (GDP), Gross Value Added (GVA), exports, consumption and employment.
CHALLENGES AND OPPORTUNITIESTourism is a major export earner for Australia, a source of employment for hundreds of thousands of workers and a key driver of growth in the economy. Unlike many other industries that are concentrated in geographic pockets, the benefits of tourism are widespread, with almost half of all expenditure going into regional Australia.
Tourism has been identified as one of five super-growth sectors that will drive new jobs and new growth in the economy over the next decade. With the mining boom behind us, tourism now has the potential to be Australia’s most rapidly growing industry.
Underpinning these positive prospects is our proximity to growing Asian markets, where middle-class populations are expected to swell five-fold over the next twenty years, adding to demand for international travel.
The global tourism market is, however, highly competitive, with more than 190 national tourism organisations competing for international visitors. Activity within the industry is also highly vulnerable to international events, economic uncertainties and levels of traveller risk – both real and perceived. Nevertheless, with its economic and political stability, Australia is able to provide a safe and secure environment for investors, operators and travellers.
To ensure that Australia continues to remain an attractive destination for overseas visitors, and to keep pace with forecast increases in demand, continued (and greater) investment in hotels, infrastructure, attractions and training is needed. For this reason, the Australian Government and industry have implemented Tourism 2020 – a strategy to grow the industry.
At a national level, the TSA measures the direct impact on GDP, GVA, employment and exports of the tourism industry resulting from the goods and services consumed by tourists in the Australian economy. For example:
n a tourist buying breakfast from a resort
n the hospitality worker serving the tourist
n the coach operator taking the tourist on a day trip.
However, the indirect effects of tourism accruing to the farmer sending produce to a resort or a café, and the service station selling diesel to a coach company are out of scope of the Australian TSA.
As the effects of tourism are widespread geographically, Tourism Research Australia (TRA) also produce tourism-related economic estimates consistent with the National TSA for all states and territories, in its State Tourism Satellite Accounts publication. These state-level accounts also capture the indirect impacts of tourism and are available at www.tra.gov.au.
4
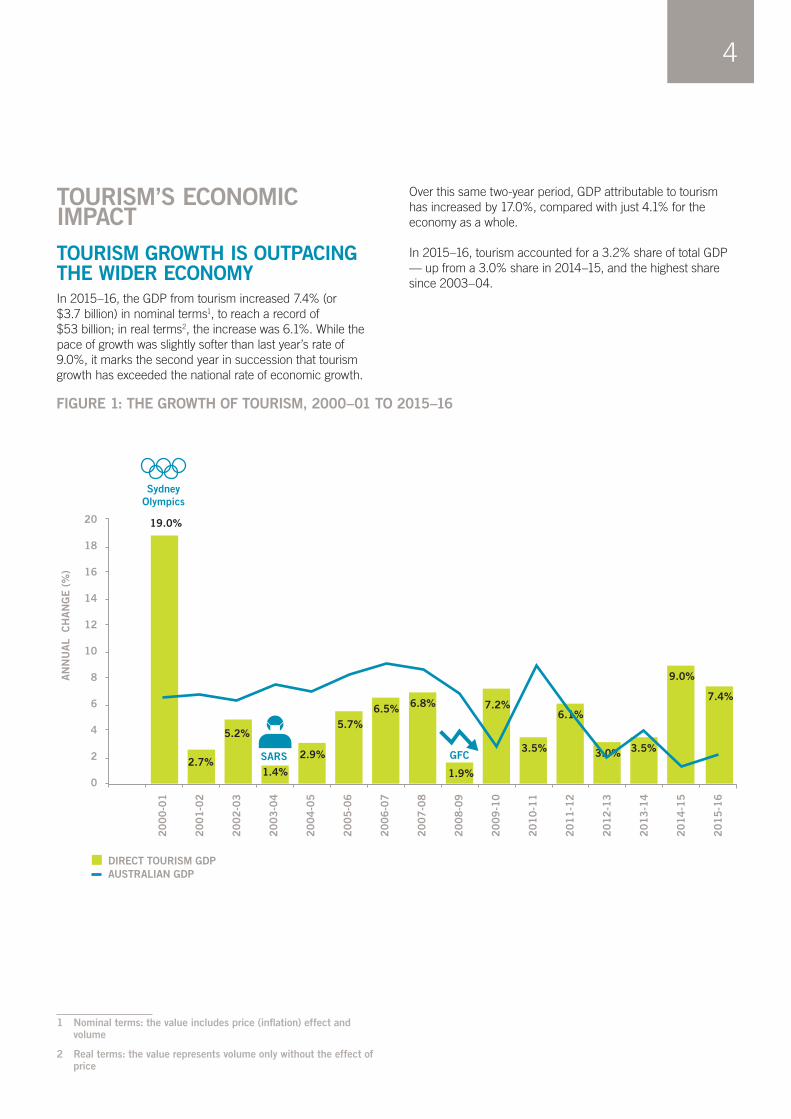
TOURISM’S ECONOMIC IMPACTTOURISM GROWTH IS OUTPACING THE WIDER ECONOMY In 2015–16, the GDP from tourism increased 7.4% (or $3.7 billion) in nominal terms1, to reach a record of $53 billion; in real terms2, the increase was 6.1%. While the pace of growth was slightly softer than last year’s rate of 9.0%, it marks the second year in succession that tourism growth has exceeded the national rate of economic growth.
1 Nominal terms: the value includes price (inflation) effect and volume
2 Real terms: the value represents volume only without the effect of price
Over this same two-year period, GDP attributable to tourism has increased by 17.0%, compared with just 4.1% for the economy as a whole.
In 2015–16, tourism accounted for a 3.2% share of total GDP — up from a 3.0% share in 2014–15, and the highest share since 2003–04.
FIGURE 1: THE GROWTH OF TOURISM, 2000–01 TO 2015–16
20
00
-01
20
01
-02
20
02
-03
20
03
-04
20
04
-05
20
05
-06
20
06
-07
20
07
-08
20
08
-09
20
09
-10
20
10
-11
20
11
-12
20
12
-13
20
13
-14
20
14
-15
20
18
16
14
12
10
8
6
4
2
0
AN
NU
AL
CH
AN
GE
(%
)
Sydney Olympics
SARS GFC
DIRECT TOURISM GDPAUSTRALIAN GDP
2.7%1.4%
5.7%6.5% 6.8%
1.9%
7.2%
3.5%
6.1%
3.0%
9.0%
20
15
-16
7.4%
5.2%
19.0%
2.9% 3.5%
STATE TOURISM SATELLITE ACCOUNTS TOURISM RESEARCH AUSTRALIA5
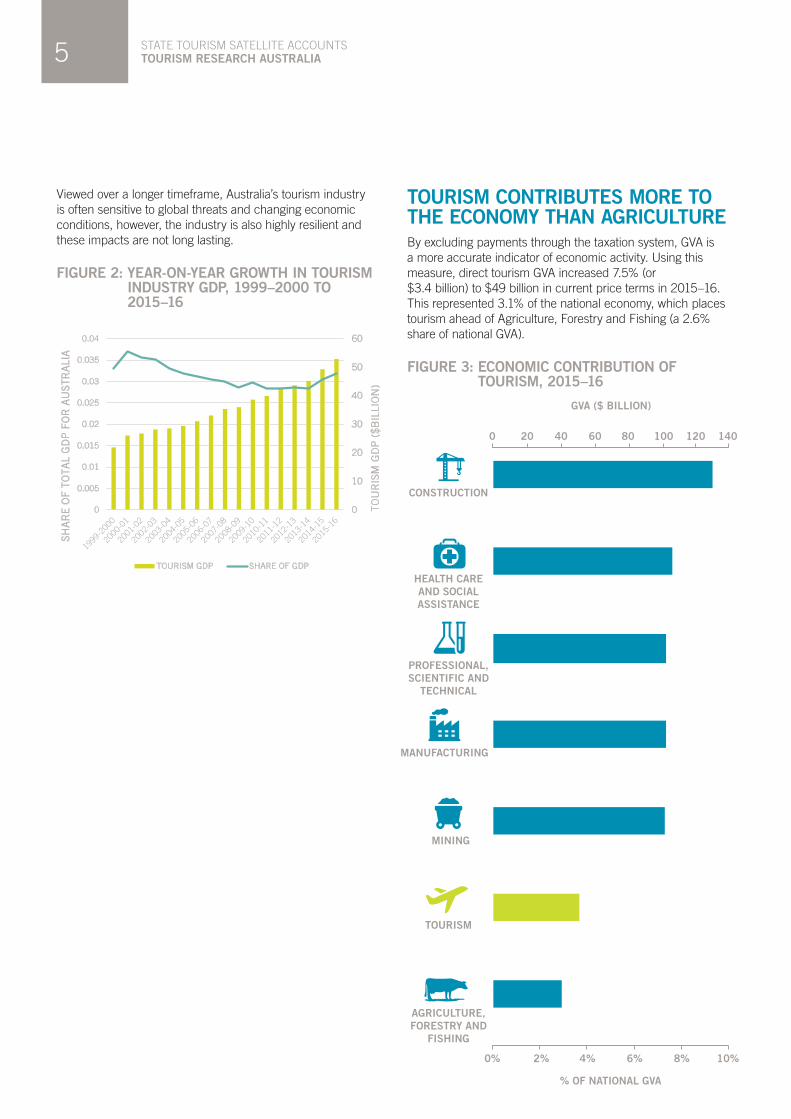
Viewed over a longer timeframe, Australia’s tourism industry is often sensitive to global threats and changing economic conditions, however, the industry is also highly resilient and these impacts are not long lasting.
FIGURE 2: YEAR-ON-YEAR GROWTH IN TOURISM INDUSTRY GDP, 1999–2000 TO 2015–16
TOURISM CONTRIBUTES MORE TO THE ECONOMY THAN AGRICULTUREBy excluding payments through the taxation system, GVA is a more accurate indicator of economic activity. Using this measure, direct tourism GVA increased 7.5% (or $3.4 billion) to $49 billion in current price terms in 2015–16. This represented 3.1% of the national economy, which places tourism ahead of Agriculture, Forestry and Fishing (a 2.6% share of national GVA).
FIGURE 3: ECONOMIC CONTRIBUTION OF TOURISM, 2015–16
GVA ($ BILLION)
0
CONSTRUCTION
HEALTH CARE AND SOCIAL ASSISTANCE
PROFESSIONAL, SCIENTIFIC AND
TECHNICAL
MANUFACTURING
MINING
TOURISM
AGRICULTURE, FORESTRY AND
FISHING
20 40 60 80 100 120 140
% OF NATIONAL GVA
0% 2% 4% 6% 8% 10%
0
10
20
30
40
50
60
0
0.005
0.01
0.015
0.02
0.025
0.03
0.035
0.04
TOU
RIS
M G
DP
($B
ILLI
ON
)
SHA
RE
OF
TOTA
L G
DP
FO
R A
UST
RA
LIA
Tourism's economic contribution
TOURISM GDP SHARE OF GDP
6
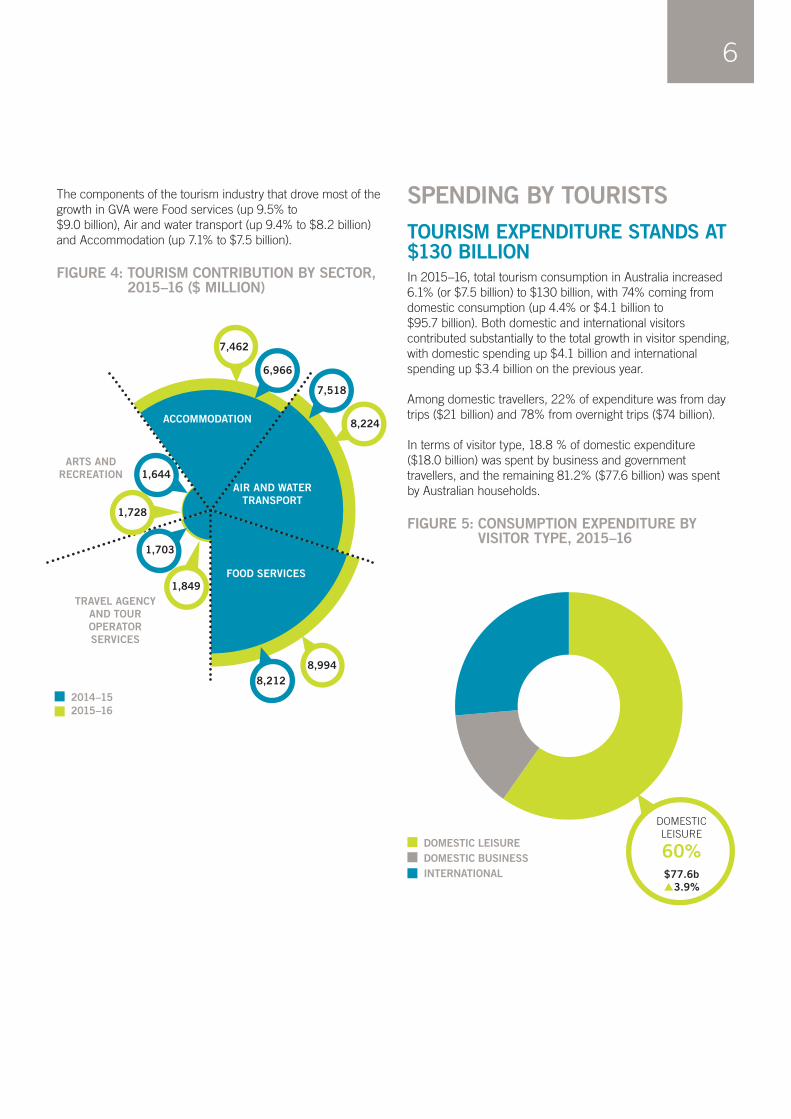
The components of the tourism industry that drove most of the growth in GVA were Food services (up 9.5% to $9.0 billion), Air and water transport (up 9.4% to $8.2 billion) and Accommodation (up 7.1% to $7.5 billion).
FIGURE 4: TOURISM CONTRIBUTION BY SECTOR, 2015–16 ($ MILLION)
SPENDING BY TOURISTSTOURISM EXPENDITURE STANDS AT $130 BILLION In 2015–16, total tourism consumption in Australia increased 6.1% (or $7.5 billion) to $130 billion, with 74% coming from domestic consumption (up 4.4% or $4.1 billion to $95.7 billion). Both domestic and international visitors contributed substantially to the total growth in visitor spending, with domestic spending up $4.1 billion and international spending up $3.4 billion on the previous year.
Among domestic travellers, 22% of expenditure was from day trips ($21 billion) and 78% from overnight trips ($74 billion).
In terms of visitor type, 18.8 % of domestic expenditure ($18.0 billion) was spent by business and government travellers, and the remaining 81.2% ($77.6 billion) was spent by Australian households.
FIGURE 5: CONSUMPTION EXPENDITURE BY VISITOR TYPE, 2015–16
DOMESTIC LEISUREDOMESTIC BUSINESSINTERNATIONAL
DOMESTIC LEISURE
60%$77.6b3.9%
ACCOMMODATION
AIR AND WATER TRANSPORT
FOOD SERVICES
TRAVEL AGENCY AND TOUR OPERATOR SERVICES
ARTS AND RECREATION
2014–152015–16
8,224
7,518
8,2128,994
1,703
7,462
6,966
1,849
1,644
1,728
STATE TOURISM SATELLITE ACCOUNTS TOURISM RESEARCH AUSTRALIA7
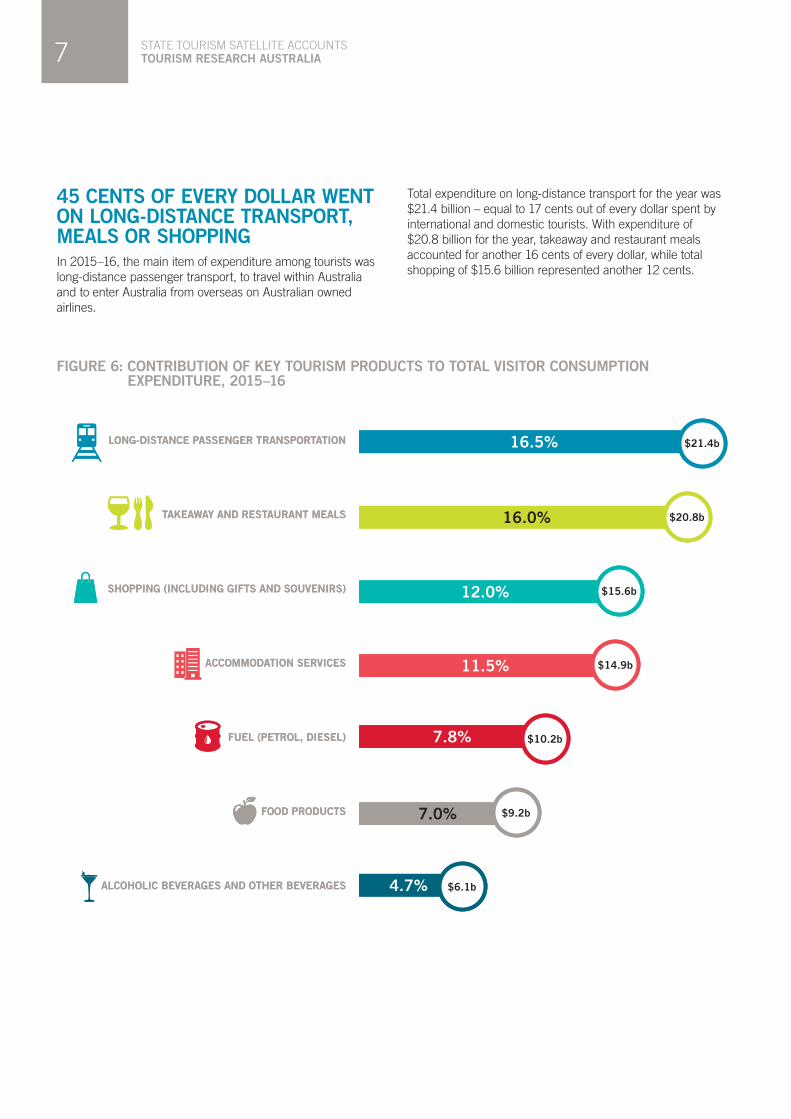
45 CENTS OF EVERY DOLLAR WENT ON LONG-DISTANCE TRANSPORT, MEALS OR SHOPPINGIn 2015–16, the main item of expenditure among tourists was long-distance passenger transport, to travel within Australia and to enter Australia from overseas on Australian owned airlines.
Total expenditure on long-distance transport for the year was $21.4 billion – equal to 17 cents out of every dollar spent by international and domestic tourists. With expenditure of $20.8 billion for the year, takeaway and restaurant meals accounted for another 16 cents of every dollar, while total shopping of $15.6 billion represented another 12 cents.
FIGURE 6: CONTRIBUTION OF KEY TOURISM PRODUCTS TO TOTAL VISITOR CONSUMPTION EXPENDITURE, 2015–16
LONG-DISTANCE PASSENGER TRANSPORTATION
TAKEAWAY AND RESTAURANT MEALS
SHOPPING (INCLUDING GIFTS AND SOUVENIRS)
ACCOMMODATION SERVICES
FUEL (PETROL, DIESEL)
FOOD PRODUCTS
ALCOHOLIC BEVERAGES AND OTHER BEVERAGES
16.5% $21.4b
16.0% $20.7b
11.5% $14.9b
12.0% $15.6b
7.8% $10.2b
7.0% $9.2b
4.7% $6.1b
LONG-DISTANCE PASSENGER TRANSPORTATION
TAKEAWAY AND RESTAURANT MEALS
SHOPPING (INCLUDING GIFTS AND SOUVENIRS)
ACCOMMODATION SERVICES
FUEL (PETROL, DIESEL)
FOOD PRODUCTS
ALCOHOLIC BEVERAGES AND OTHER BEVERAGES
16.5% $21.4b
16.0% $20.8b
11.5% $14.9b
12.0% $15.6b
7.8% $10.2b
7.0% $9.2b
4.7% $6.1b

8
INTERNATIONAL VISITORS SPENT 13 TIMES MORE PER TRIP THAN DOMESTIC TRAVELLERSInternational visitors spent an average of $4,361 per trip in 2015–16 – 1.0% more than was spent in 2014–15. Consumption by domestic travellers was $347 per trip – 4.5% lower than it was in 2014–15. Due to the costs of accommodation, expenditure by domestic travellers varies substantially between day trips and overnight trips – average spend per overnight trip was $837 in 2015–16 compared with $114 per average day trip.
… AND THEY SPENT IT DIFFERENTLYThere are substantial variations in expenditure patterns between domestic and international tourists.
For every dollar spent by international tourists, 14 cents is spent on accommodation, 17 cents on long distance transport, 14 cents on shopping and 12 cents on takeaway and restaurant meals.
Although domestic visitors consume more tourism-related products than international visitors, international visitors are the main consumers of Education services, with $5 billion spent in 2015–16. This is equivalent to 14 cents in every dollar going on education services, with demand especially high from Asian markets.
Among domestic travellers, the main items of expenditure in 2015–16 were eating out, long-distance passenger transport and shopping – accounting for 17, 16 and 11 cents of every dollar spent.
INTERNATIONAL DOMESTIC
ACCOMMODATION AND MEALS
10,069 31,010
TRANSPORT
6,993 18,684
TRAVEL AGENCY AND TOUR OPERATOR SERVICES
4,355
ARTS AND RECREATION SERVICES
5,027
SHOPPING, GIFTS AND SOUVENIRS
4,670 10,905
FOOD AND DRINKS
4,275 11,003
EDUCATION SERVICES
4,830
OTHER GOODS AND SERVICES
2,038 14,267
344
420
FIGURE 7: VISITOR CONSUMPTION EXPENDITURE ON TOURISM PRODUCTS ($ MILLION), 2015–16
1,001
STATE TOURISM SATELLITE ACCOUNTS TOURISM RESEARCH AUSTRALIA9
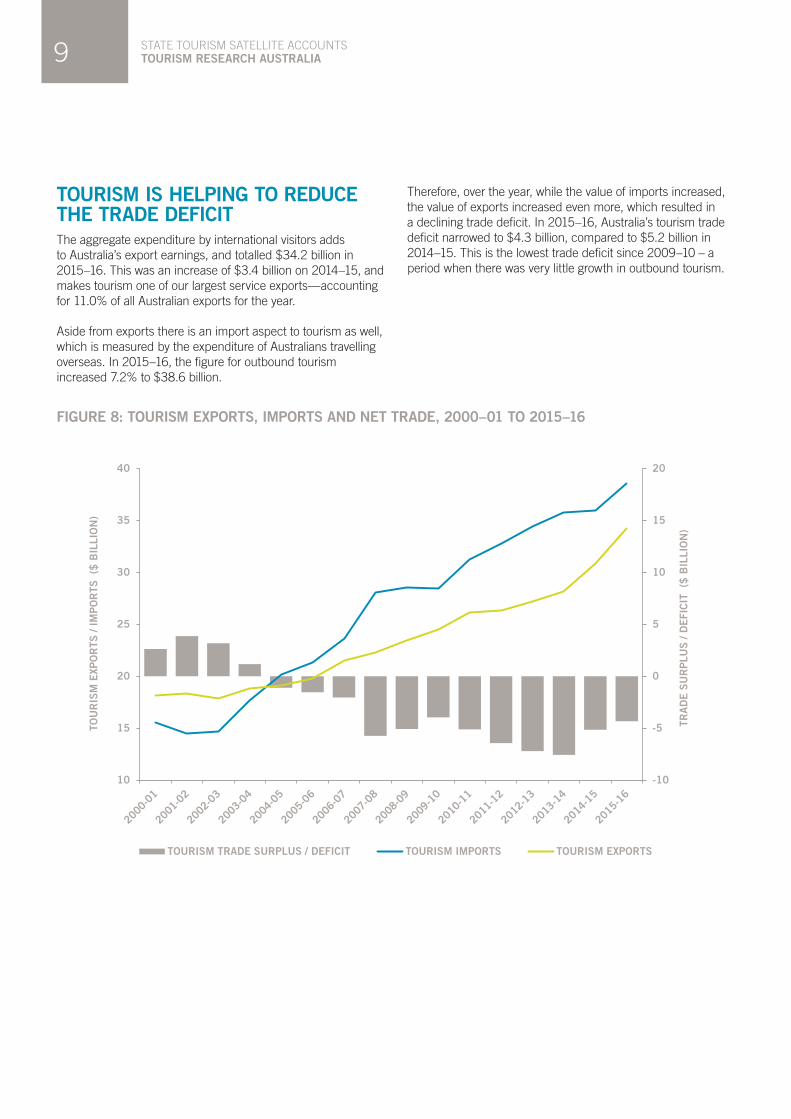
TOURISM IS HELPING TO REDUCE THE TRADE DEFICITThe aggregate expenditure by international visitors adds to Australia’s export earnings, and totalled $34.2 billion in 2015–16. This was an increase of $3.4 billion on 2014–15, and makes tourism one of our largest service exports—accounting for 11.0% of all Australian exports for the year.
Aside from exports there is an import aspect to tourism as well, which is measured by the expenditure of Australians travelling overseas. In 2015–16, the figure for outbound tourism increased 7.2% to $38.6 billion.
Therefore, over the year, while the value of imports increased, the value of exports increased even more, which resulted in a declining trade deficit. In 2015–16, Australia’s tourism trade deficit narrowed to $4.3 billion, compared to $5.2 billion in 2014–15. This is the lowest trade deficit since 2009–10 – a period when there was very little growth in outbound tourism.
FIGURE 8: TOURISM EXPORTS, IMPORTS AND NET TRADE, 2000–01 TO 2015–16
-10
-5
0
5
10
15
20
10
15
20
25
30
35
40
TRA
DE
SU
RP
LUS
/ D
EFI
CIT
($
BIL
LIO
N)
TOU
RIS
M E
XPO
RTS
/ IM
PO
RTS
($
BIL
LIO
N)
TOURISM TRADE SURPLUS / DEFICIT TOURISM IMPORTS TOURISM EXPORTS
10
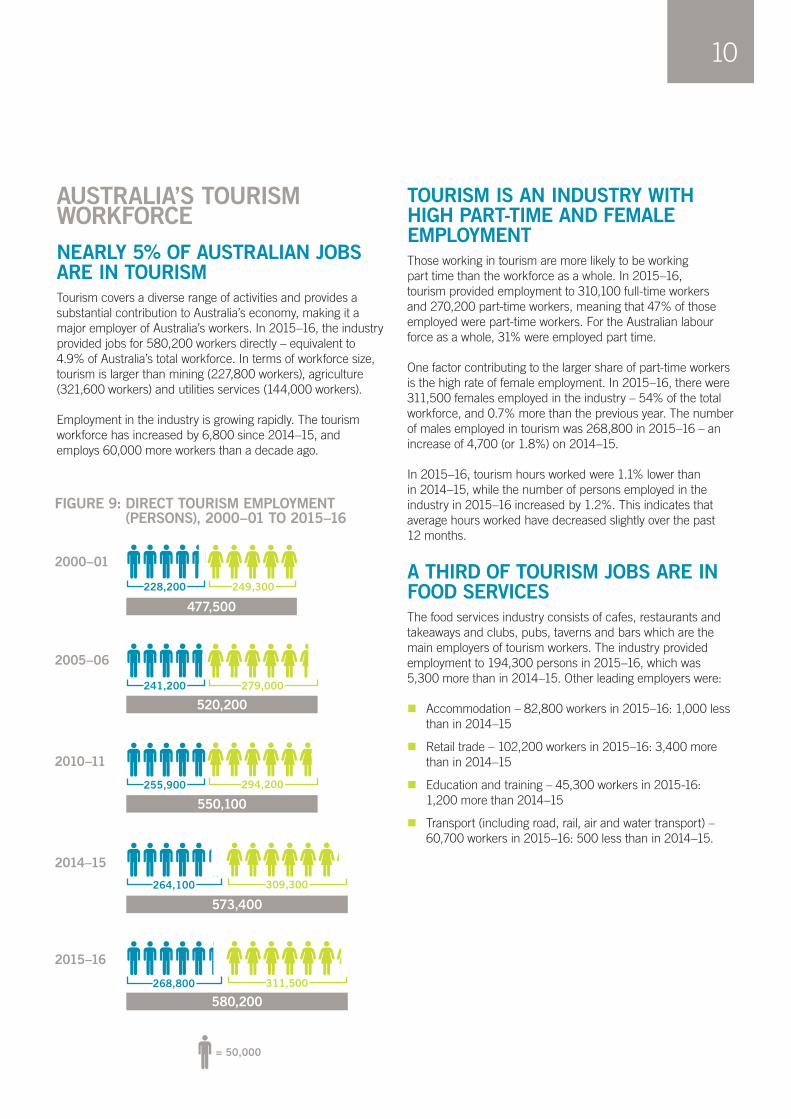
AUSTRALIA’S TOURISM WORKFORCENEARLY 5% OF AUSTRALIAN JOBS ARE IN TOURISMTourism covers a diverse range of activities and provides a substantial contribution to Australia’s economy, making it a major employer of Australia’s workers. In 2015–16, the industry provided jobs for 580,200 workers directly – equivalent to 4.9% of Australia’s total workforce. In terms of workforce size, tourism is larger than mining (227,800 workers), agriculture (321,600 workers) and utilities services (144,000 workers).
Employment in the industry is growing rapidly. The tourism workforce has increased by 6,800 since 2014–15, and employs 60,000 more workers than a decade ago.
FIGURE 9: DIRECT TOURISM EMPLOYMENT (PERSONS), 2000–01 TO 2015–16
2000–01
477,500
228,200 249,300
2005–06
241,200 279,000
2010–11
255,900 294,200
2015–16
268,800 311,500
2014–15
264,100 309,300
= 50,000
TOURISM IS AN INDUSTRY WITH HIGH PART-TIME AND FEMALE EMPLOYMENTThose working in tourism are more likely to be working part time than the workforce as a whole. In 2015–16, tourism provided employment to 310,100 full-time workers and 270,200 part-time workers, meaning that 47% of those employed were part-time workers. For the Australian labour force as a whole, 31% were employed part time.
One factor contributing to the larger share of part-time workers is the high rate of female employment. In 2015–16, there were 311,500 females employed in the industry – 54% of the total workforce, and 0.7% more than the previous year. The number of males employed in tourism was 268,800 in 2015–16 – an increase of 4,700 (or 1.8%) on 2014–15.
In 2015–16, tourism hours worked were 1.1% lower than in 2014–15, while the number of persons employed in the industry in 2015–16 increased by 1.2%. This indicates that average hours worked have decreased slightly over the past 12 months.
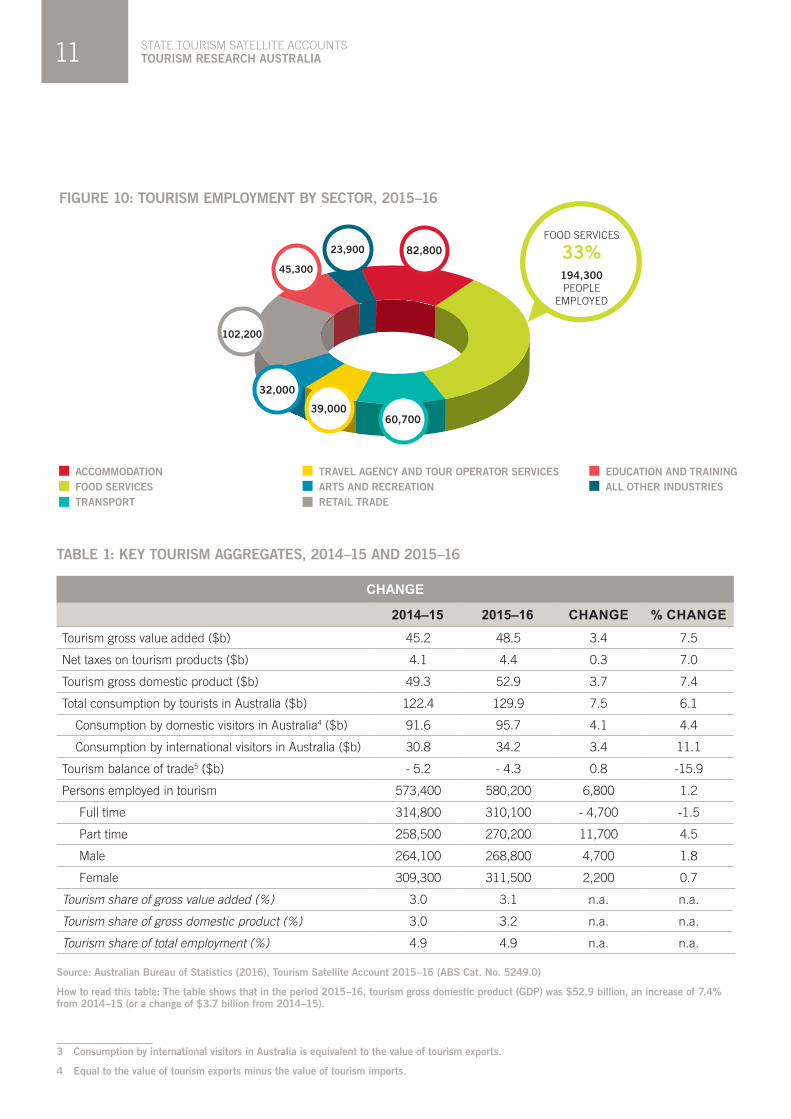
A THIRD OF TOURISM JOBS ARE IN FOOD SERVICESThe food services industry consists of cafes, restaurants and takeaways and clubs, pubs, taverns and bars which are the main employers of tourism workers. The industry provided employment to 194,300 persons in 2015–16, which was 5,300 more than in 2014–15. Other leading employers were:
n Accommodation – 82,800 workers in 2015–16: 1,000 less than in 2014–15
n Retail trade – 102,200 workers in 2015–16: 3,400 more than in 2014–15
n Education and training – 45,300 workers in 2015-16: 1,200 more than 2014–15
n Transport (including road, rail, air and water transport) – 60,700 workers in 2015–16: 500 less than in 2014–15.
520,200
550,100
573,400
580,200
STATE TOURISM SATELLITE ACCOUNTS TOURISM RESEARCH AUSTRALIA11
TABLE 1: KEY TOURISM AGGREGATES, 2014–15 AND 2015–16
CHANGE
2014–15 2015–16 CHANGE % CHANGETourism gross value added ($b) 45.2 48.5 3.4 7.5
Net taxes on tourism products ($b) 4.1 4.4 0.3 7.0
Tourism gross domestic product ($b) 49.3 52.9 3.7 7.4
Total consumption by tourists in Australia ($b) 122.4 129.9 7.5 6.1
Consumption by domestic visitors in Australia4 ($b) 91.6 95.7 4.1 4.4
Consumption by international visitors in Australia ($b) 30.8 34.2 3.4 11.1
Tourism balance of trade5 ($b) - 5.2 - 4.3 0.8 -15.9
Persons employed in tourism 573,400 580,200 6,800 1.2
Full time 314,800 310,100 - 4,700 -1.5
Part time 258,500 270,200 11,700 4.5
Male 264,100 268,800 4,700 1.8
Female 309,300 311,500 2,200 0.7
Tourism share of gross value added (%) 3.0 3.1 n.a. n.a.
Tourism share of gross domestic product (%) 3.0 3.2 n.a. n.a.
Tourism share of total employment (%) 4.9 4.9 n.a. n.a.
Source: Australian Bureau of Statistics (2016), Tourism Satellite Account 2015–16 (ABS Cat. No. 5249.0)
How to read this table: The table shows that in the period 2015–16, tourism gross domestic product (GDP) was $52.9 billion, an increase of 7.4% from 2014–15 (or a change of $3.7 billion from 2014–15).3 4
3 Consumption by international visitors in Australia is equivalent to the value of tourism exports.
4 Equal to the value of tourism exports minus the value of tourism imports.
FIGURE 10: TOURISM EMPLOYMENT BY SECTOR, 2015–16
ACCOMMODATION FOOD SERVICESTRANSPORT
TRAVEL AGENCY AND TOUR OPERATOR SERVICES ARTS AND RECREATIONRETAIL TRADE
EDUCATION AND TRAINING ALL OTHER INDUSTRIES
FOOD SERVICES
33%194,300 PEOPLE
EMPLOYED
82,800
60,70039,000
32,000
102,200
45,300
23,900

12
GLOSSARY OF TERMS5 DIRECT TOURISM INDICATORSAggregates in the TSA refer only to the tourism direct impact on the economy, as indirect effects of tourism consumption are out of scope in the satellite account. A direct impact occurs where there is a direct relationship between the visitor and the supplier. The tourism indirect estimates including flow-on effects of tourism demand in the chain of supply of goods and services to visitors are published in the State Tourism Satellite Account (STSA) available at www.tra.gov.au.
TOURISM GROSS DOMESTIC PRODUCT (GDP)Tourism GDP and tourism Gross Value Added are the major economic aggregates derived in the TSA. Those aggregates are not the same and are used in different contexts. Direct tourism GDP measures the value added of the tourism industry at purchasers’ (market) prices. As such, it includes taxes paid (less subsidies) associated with the productive activity. It enables a direct comparison with the national aggregate of GDP and is useful in this macroeconomic context. However, when making comparisons with other industries or between countries, the direct tourism Gross Value Added measure should be used.
TOURISM GROSS VALUE ADDED (GVA)Tourism GVA shows only the ‘value’ added by the producer to the raw material goods before any addition of taxes, such as GST or wholesale sales taxes. It also excludes excise duties on goods supplied to visitors. Measured at this ‘basic price’, tourism GVA is directly comparable with other industries’ GVA because it is free of the effects of taxes and subsidies on products which can vary between industries (and countries) and over time. Also, the tax and subsidy component of a product’s sale price does not represent value added by the producer.
TOURISMThe term ‘tourism’ in the international standards is not restricted to leisure activity. It includes travel for business or other reasons, such as education, provided the destination is outside the person’s usual environment (see ‘Visitors’).
5 For a full glossary of terms used in compiling the Tourism Satellite Account, please see Australian Bureau of Statistics (2016), Tourism Satellite Account 2015–16 (ABS Cat. No. 5249.0) available on the ABS website – www.abs.gov.au
TOURISM CONSUMPTIONConsists of tourism expenditure plus imputed consumption by domestic, inbound and outbound visitors on tourism-related products, including those sold at prices that are not economically significant. It is measured in purchasers’ prices – the price that visitors pay.
n Domestic tourism consumption consists of the tourism consumption by domestic visitors on tourism-related products within Australia. It is the sum of household tourism consumption and business and government tourism consumption.
n International tourism consumption consists of the tourism consumption within Australia by inbound visitors on tourism-related products. Also referred to as internal tourism consumption by international visitors.
n Outbound tourism consumption consists of the tourism consumption by Australian outbound visitors outside of Australia while on an international trip. Also referred to as tourism imports.
n Internal tourism consumption is equal to tourism expenditure made by all visitors, both resident and non-resident in Australia. It also includes adjustments for imputed consumption, such as imputed rents on vacation homes, or a visit to a museum or art gallery where entry is free. Internal tourism consumption estimates are different to Tourism Research Australia’s estimates for visitor expenditure due to the imputation, the treatment of outbound expenditure within Australia or with Australian firms, and some other adjustments detailed in the explanatory notes of the TSA.
TOURISM EMPLOYMENTRefers to the persons employed in tourism-related industries. Those are industries that would either cease to exist in their present form, or would be significantly affected if tourism were to cease.
TOURISM EXPENDITURERefers to the amount paid by a visitor or on behalf of a visitor for and during his/her trip and stay at the destination.
TOURISM EXPORTSRefers to the value of domestically produced goods and services purchased by non-residents on inbound trips.
TOURISM IMPORTSAlso known as ‘outbound tourism consumption’, consists of the tourism consumption by Australian outbound visitors outside of Australia while on an international trip.
STATE TOURISM SATELLITE ACCOUNTS TOURISM RESEARCH AUSTRALIA13
TOURISM-RELATED INDUSTRIES n Tourism-characteristic industries are defined as those
industries that would either cease to exist in their present form, or would be significantly affected if tourism were to cease.
n Tourism-connected industries are those (other than tourism-characteristic industries), for which a tourism-related product is directly identifiable (primary) and consumed in volumes which are significant for the visitor and/or the producer.
TOURISM-RELATED PRODUCTS n Tourism-characteristic products are defined as those
products which would cease to exist in meaningful quantity, or for which sales would be significantly reduced, in the absence of tourism.
n Tourism-connected products define those products that are consumed by visitors but are not considered as tourism-characteristic products.
VISITORSTourism comprises the activities of visitors. A visitor is defined as any person
‘taking a trip to a main destination outside his/her usual environment, for less than a year, for any main purpose (business, leisure or other personal purpose) other than to be employed by a resident entity in the country or place visited’.
As a result, the term ‘tourism’ in the international standards is not restricted to leisure activity. It also includes travel for business or other reasons, such as education, provided the destination is outside the person’s usual environment.

TOU
RISM
SATELLITE AC
CO
UN
T | 2015–16