Embed Size (px)
Citation preview

Telling Canada’s story in numbers
Demi Kotsovos
National Economic Accounts Division
Statistics Canada
Regional Workshop on the Compilation
of the Tourism Satellite Account
June 20, 2017
Tourism Satellite Account: Demand-Supply Reconciliation
www.statcan.gc.ca

Outline
• Setting the framework
• Understanding data sources
• Defining tourism commodities
• Defining tourism industries
• Measuring tourism domestic
supply
• Reconciling supply and
demand
• Measuring tourism’s
economic contribution
06/07/20172 STATISTICS CANADA • STATISTIQUE CANADA

06/07/20173
Understanding data sources
STATISTICS CANADA • STATISTIQUE CANADA
• What is the source of your data?• administrative source
• business survey
• household survey
• tax data
• How reliable are they?• Coverage or timing issues?
• Census versus sample?
• Regular versus irregular?
• Are they available on consistent basis over time?
• Do definitions match the concepts?
• What was the purpose behind the data• Are data designed for one purpose but used for another?
• How large is the demand / supply discrepancy?
• What do other indicators reveal?
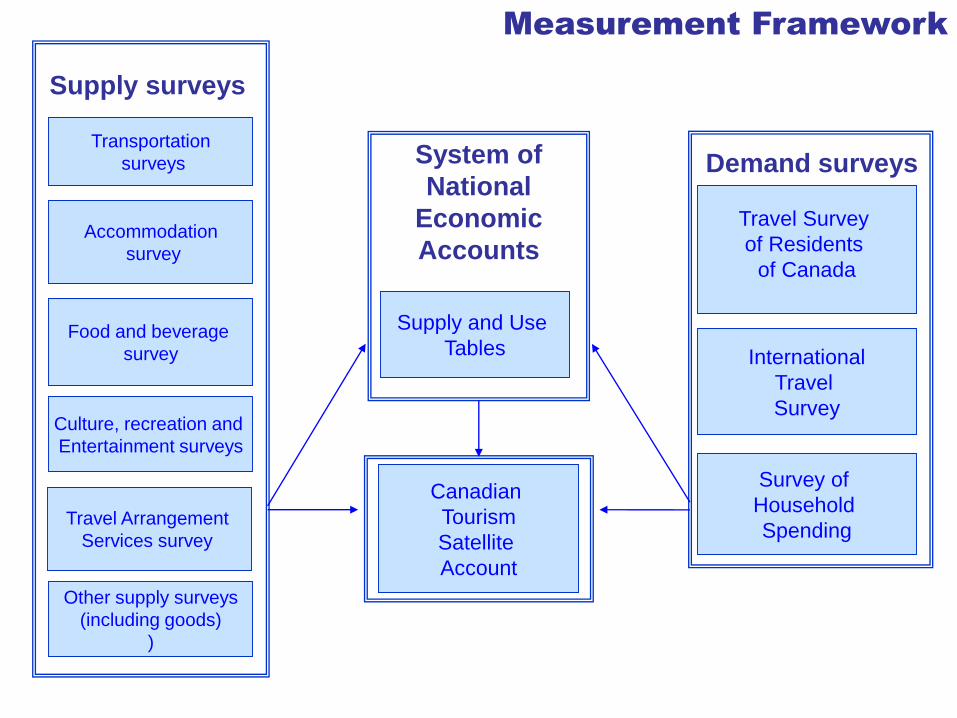
Measurement Framework
Culture, recreation and
Entertainment surveys
Canadian
Tourism
Satellite
Account
Survey of
Household
Spending
Travel Survey
of Residents
of Canada
International
Travel
Survey
Demand surveys
Supply and Use
Tables
Travel Arrangement
Services survey
Food and beverage
survey
Accommodation
survey
Transportation
surveys
Supply surveys
System of
National
Economic
Accounts
Other supply surveys
(including goods)
)

06/07/20175
Tourism Commodities
STATISTICS CANADA • STATISTIQUE CANADA
• Tourism commodities in CTSA• comparable with list in IRTS 2008
• Exclude: vacation homes, tourist guide/information services
• Some are country-specific for Canada• vehicle fuel, repairs and parts, motion picture exhibition
• significant part of the demand in Canada comes from visitors
• Include tourism-single purpose consumer durable goods• Comparable with list in TSA:RMF
• Except: planes and boats
• Also include non-tourism commodities often purchased by visitors
TSA commodities reflect merging of demand
and supply side classifications
• Limited details on demand side
• Some differences in commodity categories
• Considerable detail on supply side
• Need to convert to a common commodity classification for
the TSA
• This requires:• Splitting out more detail on the demand side
• Aggregating details on the supply side
06/07/2017STATISTICS CANADA • STATISTIQUE CANADA6
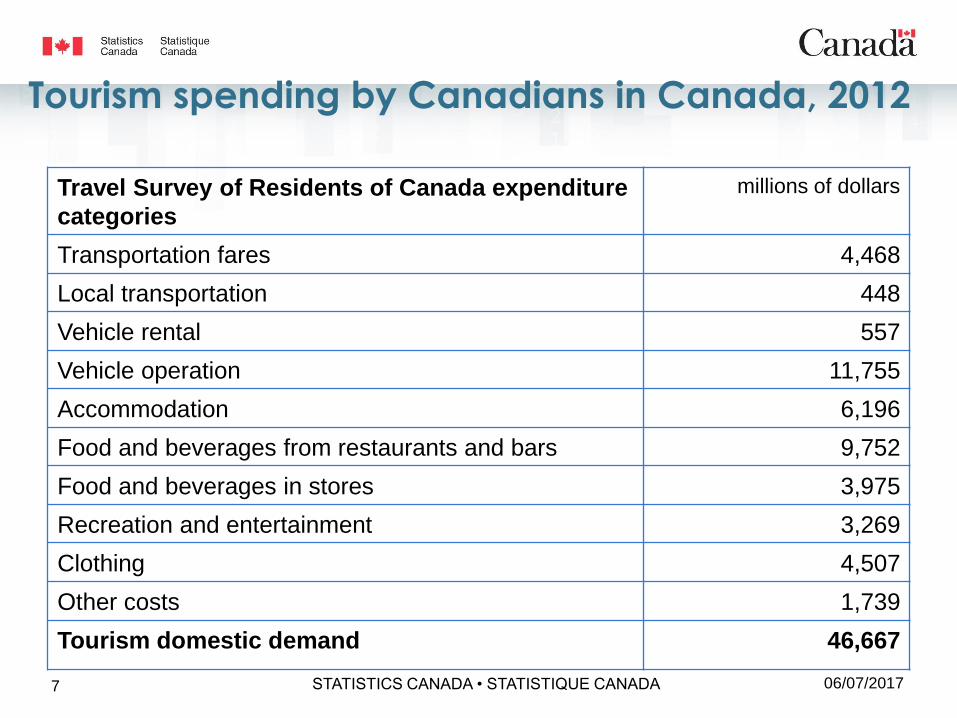
Tourism spending by Canadians in Canada, 2012
06/07/2017STATISTICS CANADA • STATISTIQUE CANADA7
Travel Survey of Residents of Canada expenditure
categories
millions of dollars
Transportation fares 4,468
Local transportation 448
Vehicle rental 557
Vehicle operation 11,755
Accommodation 6,196
Food and beverages from restaurants and bars 9,752
Food and beverages in stores 3,975
Recreation and entertainment 3,269
Clothing 4,507
Other costs 1,739
Tourism domestic demand 46,667
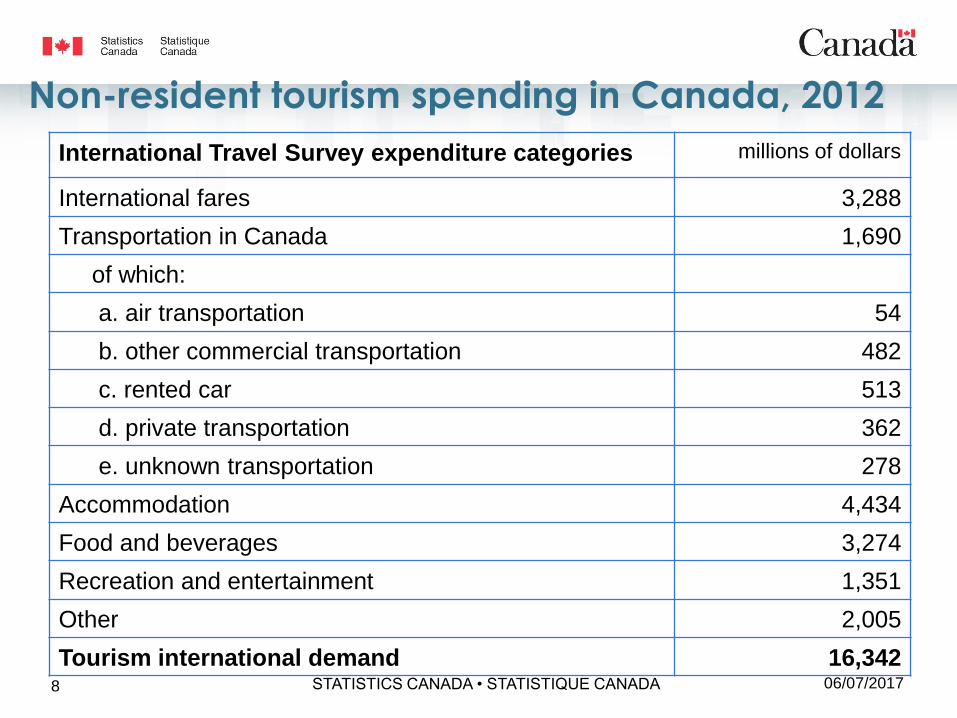
Non-resident tourism spending in Canada, 2012
06/07/2017STATISTICS CANADA • STATISTIQUE CANADA8
International Travel Survey expenditure categories millions of dollars
International fares 3,288
Transportation in Canada 1,690
of which:
a. air transportation 54
b. other commercial transportation 482
c. rented car 513
d. private transportation 362
e. unknown transportation 278
Accommodation 4,434
Food and beverages 3,274
Recreation and entertainment 1,351
Other 2,005
Tourism international demand 16,342
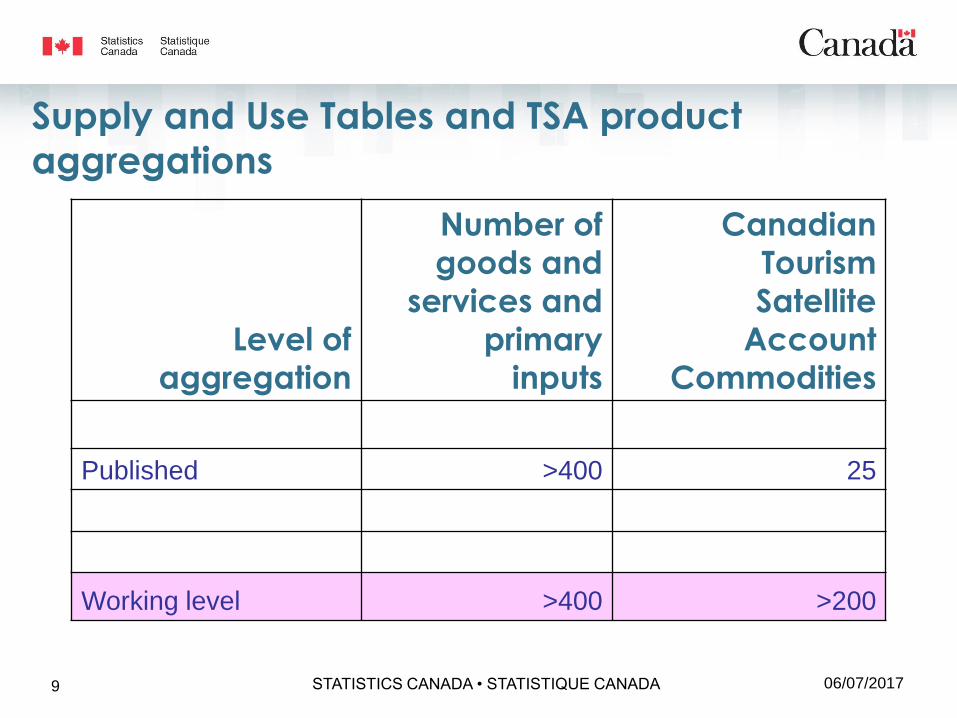
Supply and Use Tables and TSA product
aggregations
06/07/2017STATISTICS CANADA • STATISTIQUE CANADA9
Level of
aggregation
Number of
goods and
services and
primary
inputs
Canadian
Tourism
Satellite
Account
Commodities
Published >400 25
Working level >400 >200

Products of the Canadian Tourism Satellite Account
06/07/2017STATISTICS CANADA • STATISTIQUE CANADA10
Total Transportation
Passenger air
Passenger rail
Passenger water
Interurban, charter and tour bus
Taxis
Vehicle rental
Vehicle repairs and parts
Vehicle fuel
Total Accommodation
Hotels
Motels
Camping
Other accommodation
Total Food and Beverage Services
Meals from accommodation
Meals from restaurants
Alcoholic beverages from accommodation
Alcoholic beverages from restaurants
Meals and alcoholic beverages from other tourism industries
Total Other Tourism Commodities
Recreation and entertainment
Travel agency services
Convention fees
Single purpose consumer durables
Total Other Commodities Purchased By Tourists
Groceries
Beer, wine & liquor from stores
Urban transit & parking
Miscellaneous commodities
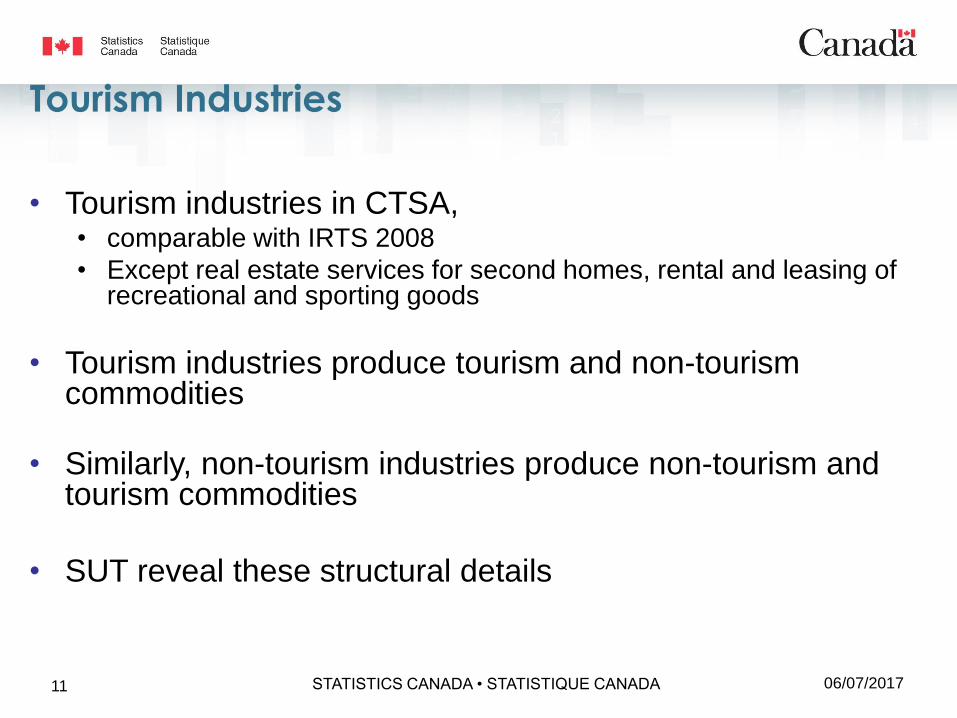
Tourism Industries
• Tourism industries in CTSA, • comparable with IRTS 2008
• Except real estate services for second homes, rental and leasing of recreational and sporting goods
• Tourism industries produce tourism and non-tourism commodities
• Similarly, non-tourism industries produce non-tourism and tourism commodities
• SUT reveal these structural details
06/07/2017STATISTICS CANADA • STATISTIQUE CANADA11

Supply and Use Tables – TSA industries
06/07/2017STATISTICS CANADA • STATISTIQUE CANADA12
Level of
aggregation
Number of
industries
Canadian
Tourism
Satellite
Account
Industries
Published 236 14
Working level 236 77
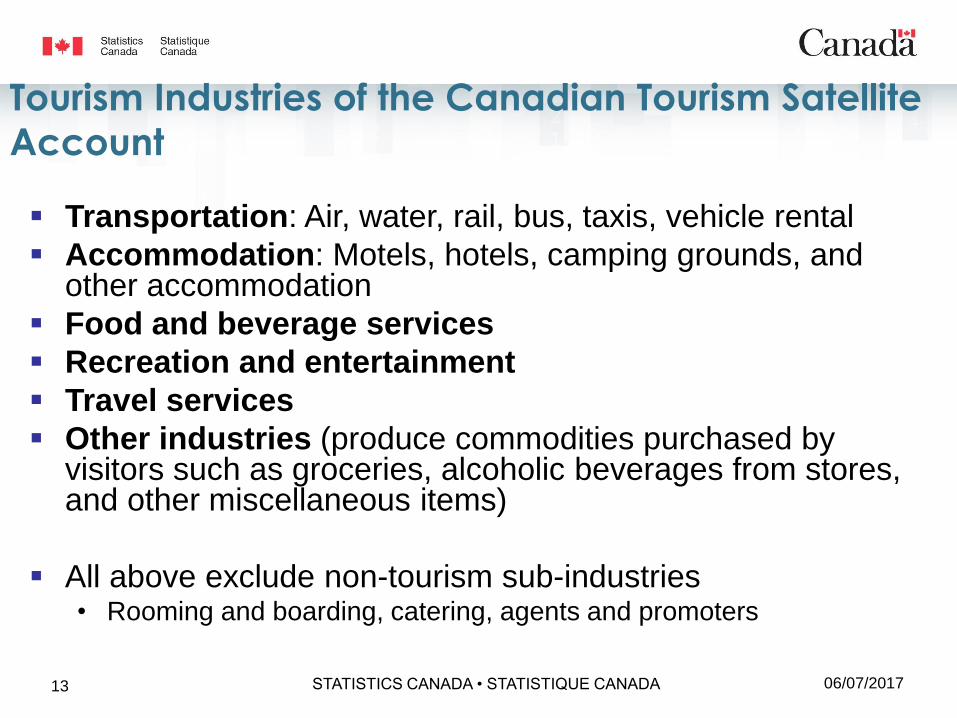
Tourism Industries of the Canadian Tourism Satellite
Account
Transportation: Air, water, rail, bus, taxis, vehicle rental
Accommodation: Motels, hotels, camping grounds, and other accommodation
Food and beverage services
Recreation and entertainment
Travel services
Other industries (produce commodities purchased by visitors such as groceries, alcoholic beverages from stores, and other miscellaneous items)
All above exclude non-tourism sub-industries• Rooming and boarding, catering, agents and promoters
06/07/2017STATISTICS CANADA • STATISTIQUE CANADA13

Measuring tourism supply
• Tourism domestic supply defined as the total production in Canada of tourism goods and services
• Note that tourism domestic supply excludes:
• Services in Canada from non-resident producers
• example, passenger air from NR carriers in Canada not included
• Tourism services from NT industries are also excluded
• example: accommodation services from rooming houses
• assumption here is that rooming houses serve only non-visitors
• Aim of these exclusions:
• to reconcile better with estimates of internal tourism consumption
06/07/2017STATISTICS CANADA • STATISTIQUE CANADA14
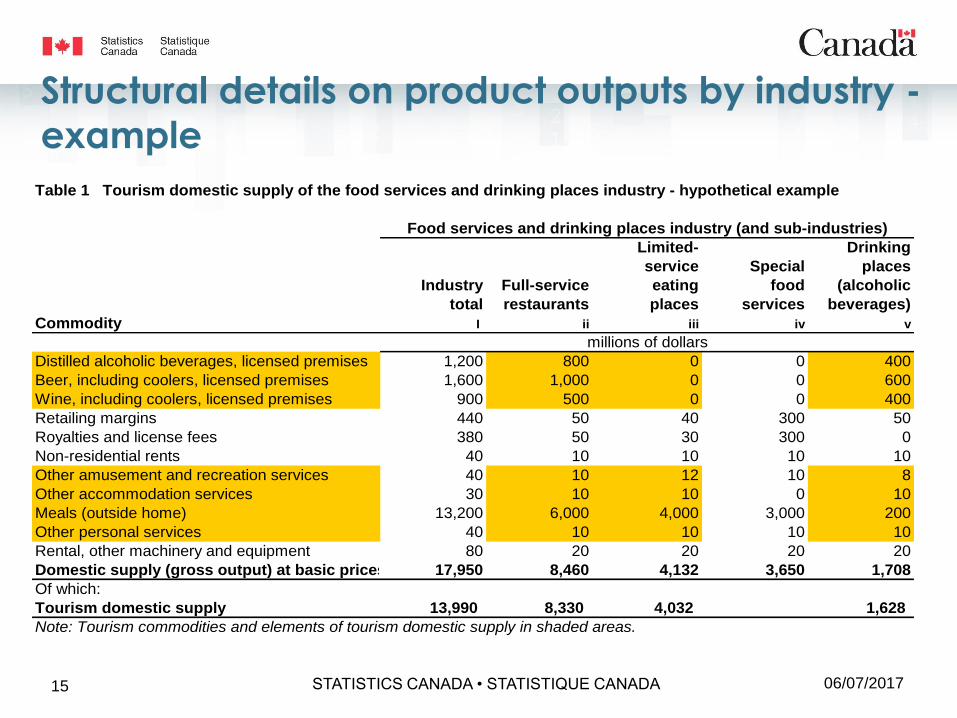
Structural details on product outputs by industry -
example
06/07/2017STATISTICS CANADA • STATISTIQUE CANADA15
Table 1 Tourism domestic supply of the food services and drinking places industry - hypothetical example
Limited- Drinking
service Special places
Industry Full-service eating food (alcoholic
total restaurants places services beverages)
Commodity I ii iii iv v
Distilled alcoholic beverages, licensed premises 1,200 800 0 0 400
Beer, including coolers, licensed premises 1,600 1,000 0 0 600
Wine, including coolers, licensed premises 900 500 0 0 400
Retailing margins 440 50 40 300 50
Royalties and license fees 380 50 30 300 0
Non-residential rents 40 10 10 10 10
Other amusement and recreation services 40 10 12 10 8
Other accommodation services 30 10 10 0 10
Meals (outside home) 13,200 6,000 4,000 3,000 200
Other personal services 40 10 10 10 10
Rental, other machinery and equipment 80 20 20 20 20
Domestic supply (gross output) at basic prices 17,950 8,460 4,132 3,650 1,708
Of which:
Tourism domestic supply 13,990 8,330 4,032 1,628
Note: Tourism commodities and elements of tourism domestic supply in shaded areas.
Food services and drinking places industry (and sub-industries)
millions of dollars

06/07/2017STATISTICS CANADA • STATISTIQUE CANADA16
Toward reconciliation
Several calculations are made to make demand consistent with supply to fill data gaps and to adhere to SNA and international TSA standards
Domestic portion of international trips
Canadian fares of international trips
Domestic tourism of the residents of the territories
Travel agents commission
Tourism single-purpose consumer durable goods
Demand to supply reconciliation
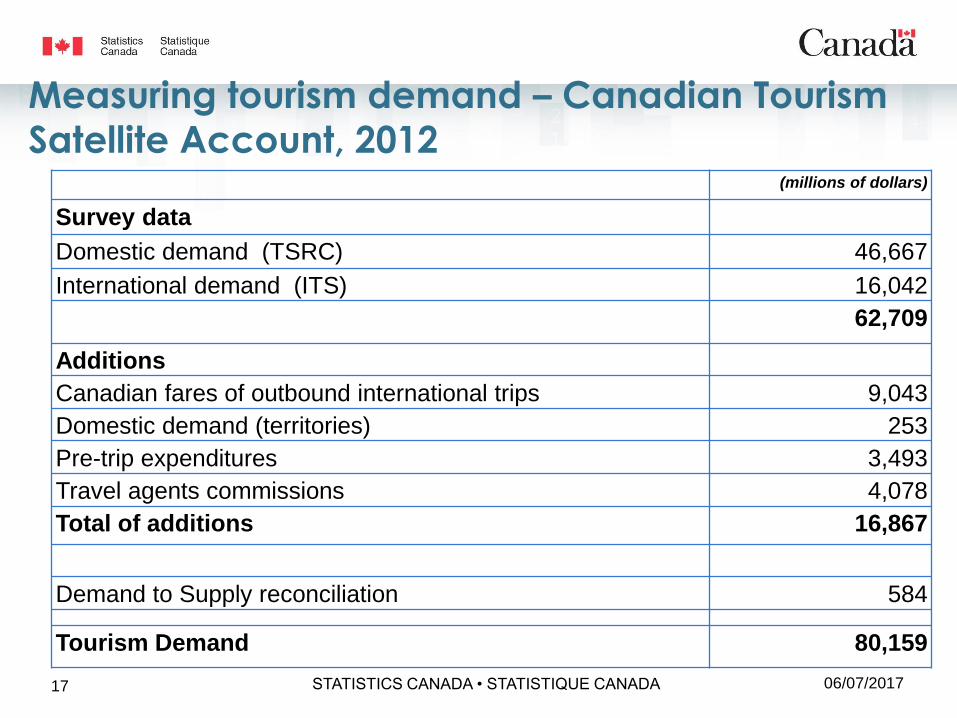
Measuring tourism demand – Canadian Tourism
Satellite Account, 2012
06/07/2017STATISTICS CANADA • STATISTIQUE CANADA17
(millions of dollars)
Survey data
Domestic demand (TSRC) 46,667
International demand (ITS) 16,042
62,709
Additions
Canadian fares of outbound international trips 9,043
Domestic demand (territories) 253
Pre-trip expenditures 3,493
Travel agents commissions 4,078
Total of additions 16,867
Demand to Supply reconciliation 584
Tourism Demand 80,159
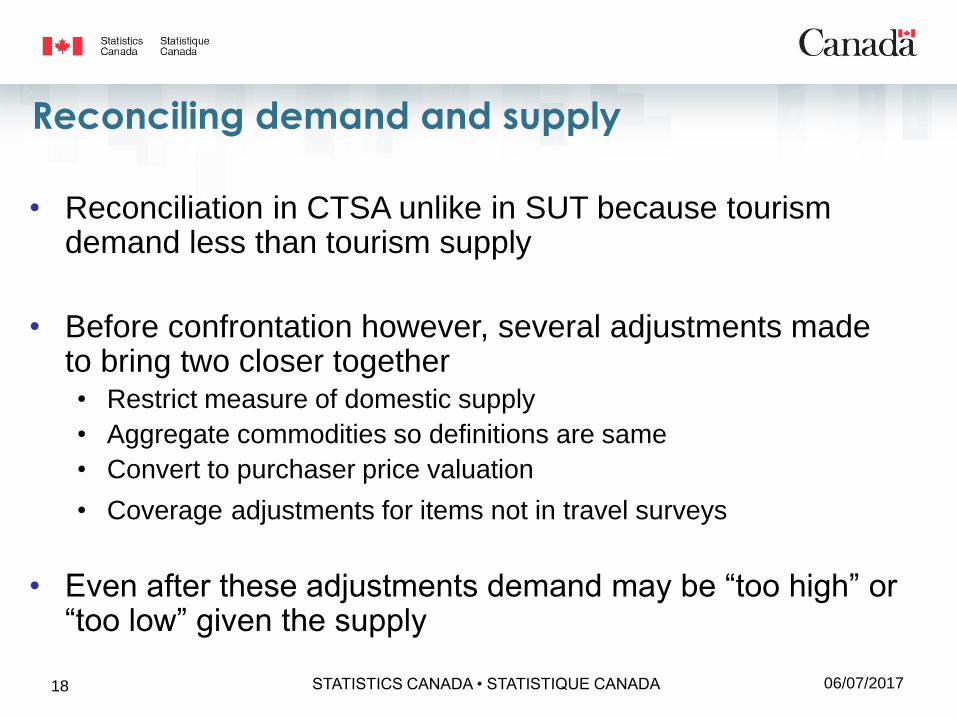
Reconciling demand and supply
• Reconciliation in CTSA unlike in SUT because tourism demand less than tourism supply
• Before confrontation however, several adjustments made to bring two closer together• Restrict measure of domestic supply
• Aggregate commodities so definitions are same
• Convert to purchaser price valuation
• Coverage adjustments for items not in travel surveys
• Even after these adjustments demand may be “too high” or “too low” given the supply
06/07/2017STATISTICS CANADA • STATISTIQUE CANADA18
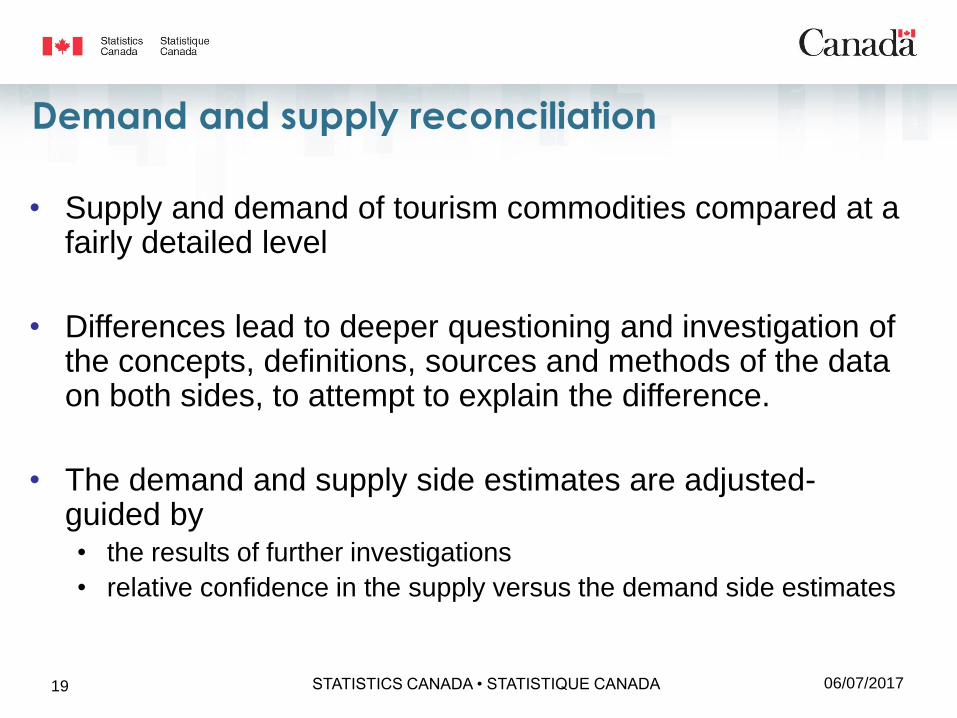
Demand and supply reconciliation
• Supply and demand of tourism commodities compared at a fairly detailed level
• Differences lead to deeper questioning and investigation of the concepts, definitions, sources and methods of the data on both sides, to attempt to explain the difference.
• The demand and supply side estimates are adjusted-guided by • the results of further investigations
• relative confidence in the supply versus the demand side estimates
06/07/2017STATISTICS CANADA • STATISTIQUE CANADA19
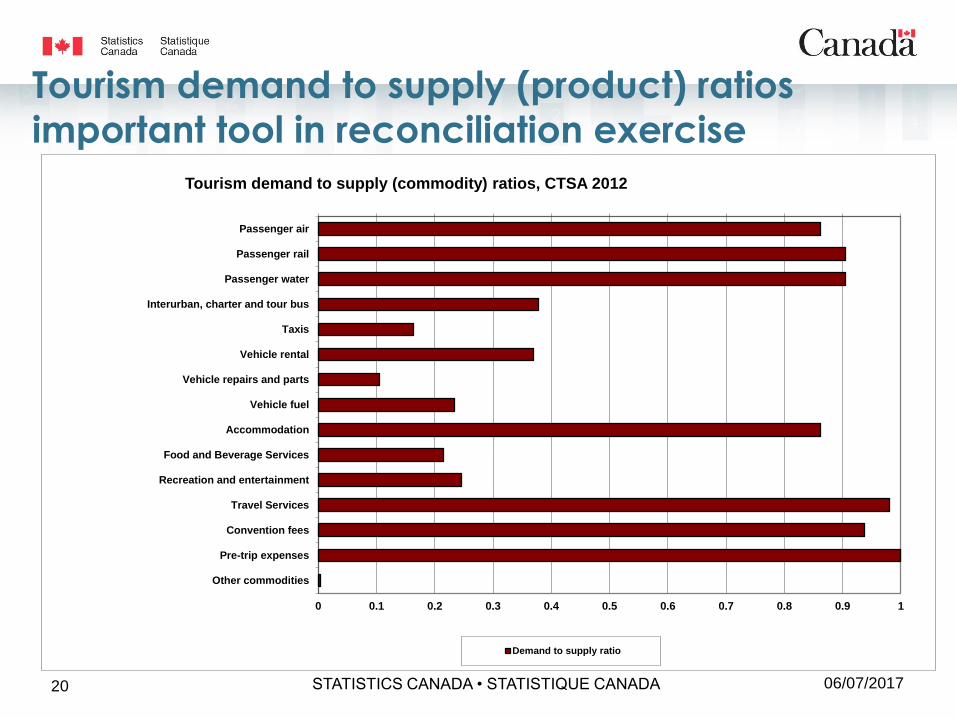
Tourism demand to supply (product) ratios
important tool in reconciliation exercise
06/07/2017STATISTICS CANADA • STATISTIQUE CANADA20
0 0.1 0.2 0.3 0.4 0.5 0.6 0.7 0.8 0.9 1
Passenger air
Passenger rail
Passenger water
Interurban, charter and tour bus
Taxis
Vehicle rental
Vehicle repairs and parts
Vehicle fuel
Accommodation
Food and Beverage Services
Recreation and entertainment
Travel Services
Convention fees
Pre-trip expenses
Other commodities
Tourism demand to supply (commodity) ratios, CTSA 2012
Demand to supply ratio
06/07/2017STATISTICS CANADA • STATISTIQUE CANADA21
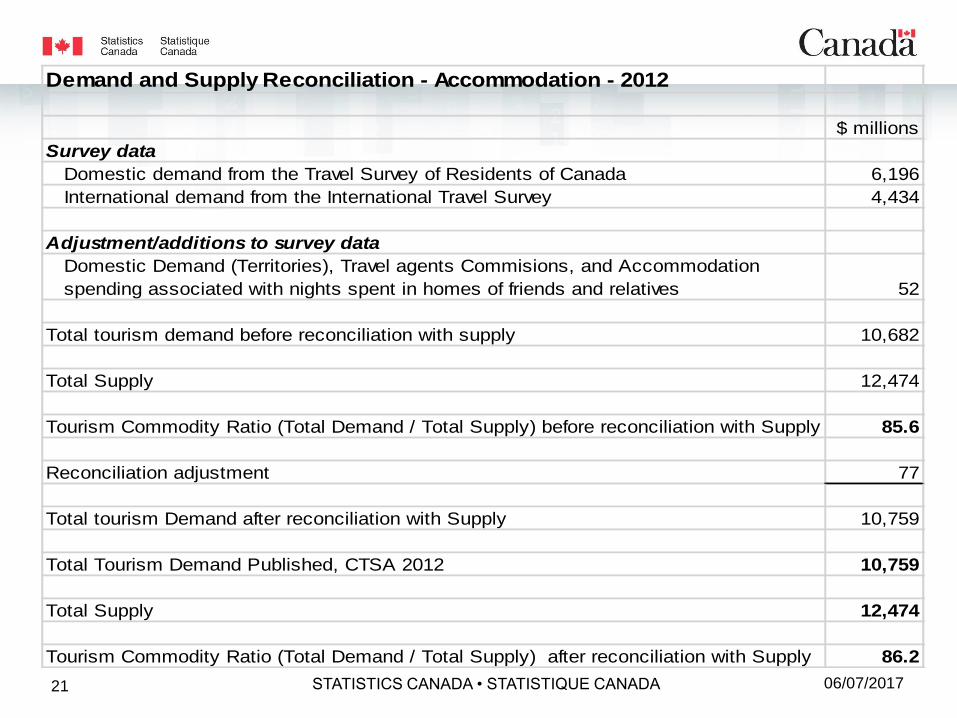
Demand and Supply Reconciliation - Accommodation - 2012
$ millions
Survey data
Domestic demand from the Travel Survey of Residents of Canada 6,196
International demand from the International Travel Survey 4,434
Adjustment/additions to survey data
Domestic Demand (Territories), Travel agents Commisions, and Accommodation
spending associated with nights spent in homes of friends and relatives 52
Total tourism demand before reconciliation with supply 10,682
Total Supply 12,474
Tourism Commodity Ratio (Total Demand / Total Supply) before reconciliation with Supply 85.6
Reconciliation adjustment 77
Total tourism Demand after reconciliation with Supply 10,759
Total Tourism Demand Published, CTSA 2012 10,759
Total Supply 12,474
Tourism Commodity Ratio (Total Demand / Total Supply) after reconciliation with Supply 86.2
Tourism’s economic contribution
• Measure the direct effects of visitor spending on industry
value added at basic prices in CTSA
• Lack information on visitor spending by industry
• Structural details of SUT used to convert visitor spending
by commodity to industry basis
• Then determine fraction of industry gross output sold to visitors
• Apply this ratio to industry value added
06/07/2017STATISTICS CANADA • STATISTIQUE CANADA22
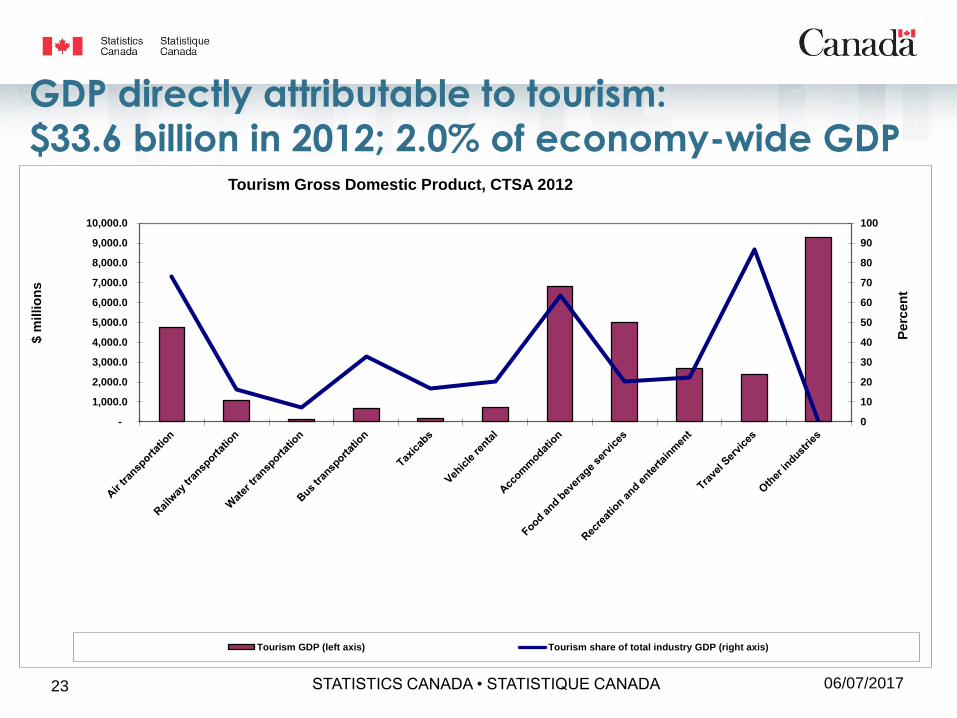
GDP directly attributable to tourism:
$33.6 billion in 2012; 2.0% of economy-wide GDP
06/07/2017STATISTICS CANADA • STATISTIQUE CANADA23
0
10
20
30
40
50
60
70
80
90
100
-
1,000.0
2,000.0
3,000.0
4,000.0
5,000.0
6,000.0
7,000.0
8,000.0
9,000.0
10,000.0
Perc
en
t
$ m
illio
ns
Tourism Gross Domestic Product, CTSA 2012
Tourism GDP (left axis) Tourism share of total industry GDP (right axis)
Demand and supply reconciliation
• The Demand-Supply reconciliation is an important step in
the final derivation of demand estimates in the CTSA.
• The process performs a check on the various data
sources.
06/07/2017STATISTICS CANADA • STATISTIQUE CANADA24
06/07/2017STATISTICS CANADA • STATISTIQUE CANADA25
Thank you
www.statcan.gc.ca