Embed Size (px)
Citation preview

Financial Support
Thermal Comfort
Towards a Brazilian Standard on Thermal
Comfort
Research Report
Roberto Lamberts ¹, Christhina Candido ², Richard de Dear ² and Renata De Vecchi ¹ ¹ Federal University of Santa Catarina (LabEEE)
² University of Sydney (IEQ Lab)
2013

2
Summary
1 INTRODUCTION ..................................................................................................................... 3
2 ISO STANDARDS .................................................................................................................... 7
3 ASHRAE RESEARCH REPORTS ................................................................................................. 8
4 ASHRAE STANDARD 55 ........................................................................................................ 10
4.1 IMPLEMENTATION OF HIGHER AIR SPEEDS WITH LOCAL CONTROL ....................................................... 13
4.2 THE RUNNING MEAN .................................................................................................................. 13
5 EUROPEAN STANDARDS AND RESEARCH PROJECTS .............................................................. 15
6 BRAZIL ................................................................................................................................ 17
7 BRAZILIAN THERMAL COMFORT FIELD EVIDENCE ................................................................. 19
8 DISCUSSION ........................................................................................................................ 23
9 CONCLUSION....................................................................................................................... 25
10 REFERENCES ........................................................................................................................ 28
APPENDIX 1 – SPECIAL ISSUES OF ENERGY AND BUILDINGS (1992 AND 2002) ............................... 35
APPENDIX 2 – WINDSOR PAPER THAT ORIGINATED THIS DISCUSSION .......................................... 48
APPENDIX 3 – LIST AND ABSTRACT OF ASHRAE RESEARCH REPORTS ON THERMAL COMFORT ...... 59
APPENDIX 4 – THE BRAZILIAN STANDARD NBR 16401-2 ............................................................... 73
APPENDIX 5 – THE BRAZILIAN STANDARD NR 17 .......................................................................... 75
APPENDIX 6 – ASHRAE 55 APPENDIX H – BIBLIOGRAPHY.............................................................. 76
APPENDIX 7 – THE PROPOSED BRAZILIAN STANDARD (IN PORTUGUESE) ...................................... 81

3
1 INTRODUCTION
According to the IPCC Special Report publication Managing the Risks of Extreme Events and
Disasters to Advance Climate Change Adaptation (IPCC, 2012):
“It is virtually certain that increases in the frequency and magnitude of
warm daily temperature extremes and decreases in cold extremes will
occur in the 21st century at the global scale.”
According to the International Energy Agency (IEA, 2010), buildings currently account for 40%
of the energy consumption in most countries and a significant part of it is used to heat and cool
them in order to bring comfort to the user. Using less energy to heat and cool buildings is high
on the international agenda due to its potential to reduce environmental pressure.
Understanding thermal comfort preferences of users can help us to save a lot of energy.
Developing nations should be conscious of the high energy impacts of unnecessary heating and
cooling of buildings commonly occurring all over the world. If the developing world would
follow the example given by the developed world that we need higher temperatures during
winter so we do not need to wear heavy clothes and cooler temperatures in summer so we can
still work with suit and ties or even sleep with a duvet in hot summer night, there will simply not
be enough energy for everybody. Good examples of possible adaptation have been given by
Japan with the Cool Biz of 2005, where public buildings had to use a set point of 28 °C during
summer (Tanabe, Iwahashi and Tsushima, 2012), and recently the Setsuden, a campaign in
response to the nuclear crisis post Tōhoku earthquake and the Tsunami on 2011. With these
new campaigns in place, studies shown that it is possible to achieve good levels of acceptability
(above 85%) with internal temperatures between 28.4 and 29.9 °C (Indraganti, Ooka and Rijal,
2013). Natural ventilation had to be used and workers could use lighter clothes and no ties. This
has also inspired a similar attitude by United Nations in 2008, Cool UN, where summer
temperatures set points were changed from 22.2 to 25 °C. The idea has also spread to other
countries like China, Hong Kong, Korea and UK.
But unfortunately bad examples can be found all over the world with office and home
temperatures too low during summer and too hot during winter. An example comes from
Malaysia and is reported by Jaafar and Croxford (2010). Air conditioning split systems are being
installed in bedrooms and people are buying thick blankets instead of adjusting the thermostat

4
and this is considered a social economic status symbol. Similar behaviour can also be observed
in Brazil.
Although most of the international standards have not seen much changing in recent years, the
ASHRAE and European standards have evolved based on field research showed that people
adapt to different climates and prefer different temperatures when in buildings that run more
connected to the external environment.
The adaptive model construes building occupants as active agents within the indoor
environment and not only passive recipients of predetermined thermal conditions, as one would
expect in air-conditioning buildings. The original work started in the 70’s by Humphreys and
Nicol and continued to be developed in different continents. It has been noted that thermal
environmental conditions perceived as unacceptable by the occupants of centrally air-
conditioned buildings can be regarded as perfectly acceptable, if not preferable, in a naturally
ventilated buildings (Fountain et al., 1994). Widening the adaptive opportunities i.e. allowing
people to make the environmental adjustments themselves such as opening or closing a window,
turning on a local fan, or adjusting an air diffuser as part of their adaptive opportunities, can be
perceived as a ‘bonus’ for occupants (Kim and de Dear, 2012).
Until the end of the 90’s the thermal comfort world was divided: PMV versus Adaptive. The
Windsor Conference of 2001 and the associated special issue of Energy and Buildings on
Thermal Comfort Standards (vol. 34, issue 6, 2002) was an important event in this area where
we can find the paper by Fanger and Toftum proposing an extension of PMV for non-conditioned
buildings (including the expectancy factor), Olesen and Parson introducing the proposed
changes for new version of ISO 7730 that mentioned adaptation, de Dear and Brager bringing
the revision of ASHRAE Standard 55 including the adaptive model and Humphrey and Nicol
discussing the validity of PMV for predicting votes in field experiment and proposing a
correction factor for the PMV (see appendix 1 for a list of papers and abstracts).
Maintaining building temperatures within a narrow band (21.5 and 24 °C) is common all over
the world. In Australia for example the temperature of 22 °C is typically written in lease
contracts of commercial office spaces. Field studies have already established that occupants can
accept a wider range 16.5 to 25.5 °C for air conditioned buildings and 16.5 to 27.5 °C in naturally
ventilated and mixed mode buildings for 80% acceptability (Arens et al., 2009). When personal
environmental controls are used even wider ranges, 18 - 30 °C, can be acceptable (Zhang and
Zhao, 2009; Amai et al., 2005; Zhang and Zhao, 2008). Hoyt et al., (2009) shows that large

5
energy reductions are possible if indoor temperatures are allowed to drift across a wider dead-
band.
Figure 1. Thermal comfort air temperature thresholds for HVAC buildings with fans and Radiant sources. (Zhang, Arens and Pasut, 2011).
Stoops (2004) discussed the possible link between thermal comfort and health bringing the
question: Do we need to exercise our thermoregulatory system? He says that our buildings are
not satisfying the users, the two most frequent complaints are that the buildings are too cold or
too hot. He questions if we should not be exposed to periodic discomfort showing the cultural
acceptance and enjoyment of the Finnish sauna, the Turkish hamman, the Native American
sweat lodge or inipi, the Russian bania, the Japanese mushi-buro or furo, and we could add
diving in the cold sea after sunbathing in the beach.
Cândido and de Dear (2012) bring the discussion to the importance of thermal pleasure. The
emergent application of ‘thermal alliesthesia’ described by de Dear (2011) investigates
situations in which a peripheral thermal sensation can assume either positive or negative
hedonic tone, depending on the state of core temperature in relation to its thermo-neutral set
point. Alliesthesia can provide more insightful information about this complex and fascinating
interaction between physiology and pleasure. Clearly, a specific air speed has many possible
physiological and subjective effects ranging from a pleasant sense of coolness to an unpleasant
sense of draft, depending on the status of the other indoor climate variables and the occupants’
individual factors, including metabolic rate. Researching the interaction of peripheral and core
thermal states as they relate to thermal pleasure and displeasure holds considerable promise for
the design of energy-efficient indoor environments.
Thermal comfort research has undergone a dramatic intensification of activity in recent years
and a literature review of the last 20 years is presented by de Dear et al. (2013). This is indeed
an area that needs further research and can have a high impact on using less energy to run our

6
buildings, but from the research findings so far we can already implement some changes into our
thermal comfort standards.
In Brazil the National Energy Plan for 2030 is asking that 10% of the energy demand forecast
should be provided by energy efficiency. We still have a lot of naturally ventilated buildings and
when looking into the Bioclimatic Zoning of Brazil (ABNT, 2005), natural ventilation is the most
important bioclimatic strategy to be used in most of the country.
Energy efficiency labelling for residential and commercial buildings was launched recently
(Brasil, 2010; Brasil, 2012) and it already establishes that thermal comfort is a precondition of
energy efficiency, yet Brazil still lacks a thermal comfort standard. Choosing the correct one is
very important at this point in the country’s history. The objective of this report is to review the
best practices in terms of thermal comfort standards worldwide, and propose the text of a
Brazilian Standard for Thermal Comfort to initiate discussion in Brazil. The initial ideas were
presented in a conference paper in Windsor 2010 (Cândido et al., 2010, see appendix 2) and
expanded in the BRI paper (Cândido et al., 2011).
This report starts with the analysis of the international standards, presents what exists in Brazil
in terms of standards and field experiments on thermal comfort and brings a discussion to what
is recommended for the Brazilian Standard.

7
2 ISO STANDARDS
In the international scene there is the ISO 7730 (2005 - with previous versions in 1984 and
1994) in the series on ergonomics of the thermal environment, dealing with the analytical
determination and interpretation of thermal comfort the PMV and PPD indices and limits to local
thermal discomfort criteria. ISO 7726 (1998 - with previous version in 1985) came from the
same series deals with the instruments for measuring physical quantities of indoor climate.
ISO 7730 uses the PMV model developed by Fanger to predict the thermal sensation of a group
of people and the Predicted Percentage Dissatisfied for the degree of thermal discomfort. It also
includes consideration of local thermal discomforts, unwanted heating or cooling of part of the
body, caused by draft, thermal gradient between head and ankle, hot or cold floors and thermal
radiant asymmetry.
The 2005 edition of ISO 7730, first presented in Windsor 2001, shows many evolutions in
relation to the 1994 edition, such as recognition that adaptation to different climates exists (item
10) and also that air velocity can be used to offset the sensation of warmth (annex G), but it also
strongly infers that a better controlled environment with tight, centralized temperature control
(e.g. with summer temperatures between 23.5 and 25.5°C) equate to higher levels of occupant
satisfaction than with less tight temperature control (e.g. with summer temperatures between
22 and 27 °C). Buildings with a narrower band of PMV variation (+/- 0.2 PMV) are implicitly
superior (Category A). The class categories apply to the variables PMV, draught, vertical air
temperature difference, floor temperature, and radiant temperature asymmetry.
It should be said that it is virtually impossible to measure an environment to this accuracy and
only the normal clothing preferences of different people have a higher impact on the PMV. Based
on objectively measured indoor environmental parameters in actual office buildings, the
assumption of significant differences in terms of thermal acceptability between the three classes
were categorically dismissed by Arens et al., 2010. Therefore caution should be taken to adopt
ISO 7730 (2005) as the basis for the Brazilian Standard.

8
3 ASHRAE RESEARCH REPORTS
A quick literature search on “Thermal Comfort“ in the ASHRAE research report repository shows
40 results. This shows the importance that this subject has accorded by the American Society of
Heat Refrigerating and Air Conditioning Engineers in the sponsored research throughout its
history. The projects range from the early studies conducted by Rohles, Mcnall and Nevis in the
seventies at Kansas State University (RRP-43; Rohles, 1970) to the more recent research on
Under Floor Air Distribution Systems (RRP-1522; Jiang and Chen, 2012). It goes into the
connections between visual and thermal comfort (RRP-243; Rohles, Bennett and Milliken, 1980),
noise and thermal comfort (RRP-1128; Tiller et al., 2009), the effect of glass and windows (RRP-
1071; Chapman, 2003); RRP-1162, (Chapman, 2004), thermal transients (RRP-198; Rohles,
Milliken and Krstic, 1979), impact of humidity during step changes (RRP-503; de Dear, et al.,
1997), response of disabled people (RRP-885; Giorgi et al., 1996), response of the elderly (RRP-
421; Cena and Spotila, 1984), radiant heating and cooling (RRP-1037; Chapman and Wang,
2003); RRP-98 (Faucett and Govan, 1997); RRP-394, (Howell, 1987), air jet cooling (RRP-518;
Melikov et al., 1997). For a list of these reports with its abstracts see appendix 3. The series of
research projects on field studies of occupants comfort started with the San Francisco Bay area
(RRP-462; Schiller et al., 1988) and continued with others in hot humid climates (RRP-702; de
Dear et al., 1993), cold climates (RRP-821, Donnini et al., 1996) and hot and arid climates (RRP-
921; Cena and de Dear, 1998) and were seminal to understand the sensation of occupants in real
offices and real climates, and leading to the development of the adaptive model of thermal
comfort preferences (RRP-884; de Dear, Brager and Cooper, 1997).
Report 884 “Developing an Adaptive Model of Thermal Comfort and Preference” main objective
was the proposal of a variable temperature standard based on the adaptive approach. It discusses that
thermal adaptation is comprised of 3 interrelated processes: behavioural (using operable
windows, fans, doors, awnings etc), physiological (acclimatization) and psychological (adjusting
comfort expectations towards climatic conditions prevailing indoors and outdoors), and reconciles
the adaptive with the static thermal comfort approaches.
It makes clear that thermal preference is different from thermal neutrality and people prefer to
use words like ‘cooler’ in warmer climates and warmer in cold climates. It mentions a special
issue of Energy and Buildings (Kempton and Lutzenhiser, 1992; see appendix 1 for a list of
papers and abstract) focused on non-thermal issues and how individuals and cultures vary in

9
their perceived need for and expectations of air conditioning. It ends with a proposal for
modifying ASHRAE Standard 55 to include the adaptive approach. Report 884 and the associated
database allowed a series of papers with different analysis on adaptive opportunities. The initial
and highly cited one is in ASHRAE Transaction, de Dear e Brager (1998).

10
4 ASHRAE STANDARD 55
Looking into the history of thermal comfort standards, ASHRAE Standard 55 was first published
in 1966 and has been under periodic review, producing updated versions in 1974, 1981, 1992
and 2004. From 2004 onwards, ASHRAE has been updated on more frequent basis, as a result of
its continuous review from its committee. The last version released in 2012 comprises 9
approved addenda (a, b, c, d, e, f, g, h, j). Due to its on-going review process, ASHRAE Standard 55
is certainly the most up-to-date standard to date, reflecting the most recent scientific findings
from the thermal comfort research field.
The standard specifies acceptable thermal environmental conditions for healthy adults
occupying indoor spaces for not less than 15 minutes at atmospheric pressure equivalent to
altitudes up to 3000m. The standard defines thermal comfort conditions, compliance and
evaluation methods for indoor environments.
The method for determining acceptable thermal conditions in occupied spaces is described in
item 5 from ASHRAE Standard 55 (2010) and this item is divided into 2 parts: part one is for air
conditioned spaces and part two for naturally ventilated spaces. The first part, for air-
conditioned space is further divided into the following sub-items:
Operative temperature. This sub-item refers to 2 methods when defining operative
temperature limits: (1) by using comfort zone contours from the psychometric chart
depicted in Figure 2 and (2) or by using a computer model based on PMV presented
in appendix D which is the same used on ISO 7730 (2005).
Humidity limits. This sub-item also refers to the psychometric chart depicted in
Figure 2 and it specifies that humidity ratio should be below 0.012, which
corresponds to a water vapour pressure of 1.910 kPa. This looks rather strange as
above this upper limit the computer model is still accepted despite the fact that this
model is not sensitive to such humidity levels.
Elevated air speeds. Higher air speed can be used to increase the acceptable
maximum operative temperature under certain conditions. To this end, two figures
were in use two figures were in use until 2012: (1) air speed required to offset
increased air and radiant temperatures (figure 5.2.3.1 from ASHRAE Standard 55)
and (2) acceptable range of operative temperatures and air speeds for comfort zone

11
at humidity ratio of 0.010 (represented on figure 5.2.3.2 from ASHRAE Standard 55).
After the release of the addendum in 2012, only figure 5.2.3.1 was kept and it is
illustrated here on Figure 3.
Local thermal discomfort. This sub-item deals with radiant temperature asymmetry,
draft, vertical temperature difference and floor surface temperature.
Temperature variations. This sub-item defines the allowable temporal variations,
including cyclic variations, drifts and ramps.
Figure 2. The Graphic Comfort Zone Method: Acceptable range of operative temperature and humidity for spaces that meet the criteria specified in Section 5.2.1.1 (1.1 met; 0.5 and 1.0 clo) SI (ANSI/ASHRAE 55, 2010).
Figure 3. Acceptable range of operative temperature and air speeds for the comfort zone shown in Figure 1, at humidity ratio 0.010 (ANSI/ASHRAE 55, 2010).

12
The second part for determining thermal comfort conditions indoors deals with naturally
conditioned spaces and it is based on the adaptive model de Dear and Brager (1998) in which
acceptable indoor temperatures are linked to the mean outdoor temperatures. Figure 4 shows
the upper and lower limits for 80 and 90% acceptability levels. If the operative temperature is
higher than 25°C, then the ASHARE’s adaptive comfort standard allows for an increase of 1.2°C
of the upper temperature limits in Figure 4, as long as an air speed of 0.6 m/s is provided. This
upper limit can also be extended by 1.8°C for an air speed provision of 0.9 m/s and 2.2°C for air
speeds of 1.2 m/s. This is not very clear as it is not plotted over the graph of Figure 4 and one
would expect that the higher the operative temperature the higher the allowed air speed.
Figure 4. Acceptable operative temperature ranges for naturally conditioned spaces (80% bounds are normative, 90% bounds are informative). (ASHRAE STANDARD 55-2010, 2010).
The ASHRAE Standard 55 (2010) also has additional appendices (nine in total) dedicated to
activity levels values, clothing insulation values, acceptable approximation for operative
temperature, a computer model for PMV-PPD calculations, templates for thermal environment
surveys, procedures for evaluating the cooling effect of elevated air speeds using SET,
compliance documents, bibliography and other addenda descriptions.
New addenda are currently under discussion and it comprises potential improvements on air
speed recommendations for summer comfort conditions, design compliance (part 6) and the
evaluation of existing environments where compliance limits are not yet defined by the standard
(part 7).

13
Probably the two most important amendments introduced in the 2010’s version are (1) the
implementation of higher air speeds with local control and (2) the replacement of the mean
monthly outdoor temperature by a weighted daily mean temperature (i.e. the running mean).
4.1 IMPLEMENTATION OF HIGHER AIR SPEEDS WITH LOCAL CONTROL
Over the last decade, it has been established that draft discomfort predictions tend to
overestimate occupant’s dissatisfaction observed in naturally ventilated buildings. In fact it has
been argued that there may be a zone of temperatures and air velocities in which occupants can
be exposed to an ‘appreciable draft’ and feel comfortable (Tanabe, 1988; Toftum, 2004; Zhang et
al., 2007; Arens et al., 2009; Cândido et al., 2011).
A recent review of the ASHRAE RP-884 database carried out by Arens et al. (2009) focusing on
air movement preferences confirmed that draft limits should not be applied when people feel
‘neutral to warm’ and in fact, higher air speed values should be encouraged. During the same
review, the authors found that, if some degree of control over the immediate indoor
environment is provided to occupants, air speed limits can be extended to 0.8m/s.
The addenda include personal control requirements and this rationale is intrinsically linked
with the new air speed provisions. The proposed two-step process of ASHRAE Standard 55
(2010) considers temperature, radiant heat, humidity and air movement and it encourages
elevated air speeds in combination with the standard effective temperature (SET) provided that
some degree of control is offered to occupants. These new provisions were designed to “allow
designers to use fans, stack effects, or window ventilation to offset mechanical cooling, or in
some climates, supplement it entirely” (Arens et al., 2009). Hopefully these new provisions will
encourage more control availability and greater degrees of freedom for occupants when
adapting their immediate indoor conditions.
4.2 THE RUNNING MEAN
The ASHRAE’s adaptive model originally used monthly mean outdoor air temperature as its
reference for prevailing outdoors temperature (as either a climatological calendar month or 30-
day running mean). This input parameter was largely based on pragmatic considerations at the
time – climatic data are readily available as mean monthly temperatures for most locations

14
around the world. But there was also an analytic constraint on the choice of outdoor
temperature in the ASHRAE adaptive model. To understand this one needs to remember how
the ASHRAE adaptive model was derived, namely by regressing building neutralities (the
dependent variable) on prevailing outdoor temperature (the independent variable). But each
building’s neutrality going into the adaptive meta-analysis was derived by regressing the
comfort votes registered by hundreds (or even thousands) of occupants over several days to
weeks, on the operative temperatures recorded at the same time and place as each
questionnaire response was made. Therefore neutrality of a building in the RP-884 database
does not correspond to an instant in time, and so the correct expression for prevailing outdoor
temperature in the adaptive model cannot be temperature of any particular day, but rather
something spanning a comparable time-period as the questionnaire survey used to generate the
neutrality. The new addenda include a weighted mean daily temperature (and not monthly).
Unfortunately, during ASHRAE’s internal approval process the exponentially weighted running
mean of daily external temperatures was deleted by mistake from the definitions list introduced
by addendum c (but this has recently been rectified).

15
5 EUROPEAN STANDARDS AND RESEARCH PROJECTS
In response to the European Parliament’s 2003 EPBD, there are about 30 new standards
including CEN ISO 7730 - 2005 (ISO, 2005) and the CEN 15251 - 2007 (EN, 2007) that deals with
the indoor environmental input parameters for design and assessment of energy performance of
buildings addressing indoor air quality, thermal environment, lighting and acoustics. It includes
specification of methods for long-term evaluation of indoor environment obtained by calculation
or measurements in appendix F, recommended criteria for acceptable deviations in appendix G
and recommended subjective evaluations in appendix H. It specifies categories of indoor
environment (I, II, III and IV) and introduced the adaptive thermal comfort concept for non-
mechanically cooled buildings in the appendix A.2 based on a regression of operative
temperature and the external running mean temperature (exponentially weighted running mean
of daily mean external temperatures) specifying 3 categories (I, II and III) and allowing the
inclusion of air speed increases for summer comfort and control should be included (Figure A2).
The lines in this standard are similar with the ones on ASHRAE Standard 55 with a difference of
about 1K on the intercept as shown by de Dear et al., 2013.
Figure 5. Comfort zone for levels I, II and II based on operative temperature versus running outdoor mean temperature. (EN, 2007).

16
Figure 6. Air speed requirements to offset increased temperature based on ISO 7730. (EN, 2007).
The European Project ThermCo (Fraunhofer ISE, 2009) did a comparison of the thermal comfort
evaluation of 12 low energy non-residential buildings according to EN 15251-2007-08, EN ISO
7730-2005 and discusses the difficulty in classifying buildings into mechanically cooled and non-
mechanically cooled due to the variety of heating and cooling concepts of new low energy
buildings. It also presents interesting considerations about seasonal evaluation and tolerance
range. Regarding summer season it is recommended that the entire season is evaluated and
defines summer as the period with external temperatures above 15 °C of running mean. It
recommends evaluation only during occupied hours and defines a tolerance of 3 to 5%
acceptable exceedance.

17
6 BRAZIL
In Brazil, the safety and health standards from the Ministry of Labour is the standard NR 17 –
Ergonomics from 1990 (NR 17, 1990) present the acceptable thermal comfort conditions
indoors by defining the limits of effective temperature between 20 and 23 °C, air velocity is set
to be less than 0.75 m/s and humidity should be above 40% (Figure 7).
During the first national standards workshop for thermal comfort and energy efficiency in
buildings organized back in 1991, the need of establishing thermal comfort zones to account for
the vast climatic variability in Brazil was mentioned. Roriz and Basso (1991) ignited a discussion
about this topic by comparing 10 different thermal comfort zones in Brazil, followed by a
proposition by Bueno e Lamberts (1991) to use PMV in an attempt to define a thermal comfort
zone using the psychometric chart and introducing allowances for clothing metabolism and air
speed adjustments.
Figure 7. Brazilian Graphic Comfort Zone: Acceptable range of temperatures and air velocity stipulated by NR 17 (1990), plotted on bioclimatic chart.
10
20
15
10 15 20
THERMAL COMFORT CONDITIONS NR 17 Ergonomics (1990)
- Should be implemented adequate HVAC systems that allow an homogeneous distribution of temperatures and air flows;
- Local or sectored control strategies to air temperature, velocity
and flow directions should be used if necessary.
These parameters are valid for workplaces where intellectual activ ities and constant attention are requested:
25
100 80 60
40
20
RELATIVE HUMIDITY (%)
.026
.024
.022
.020
.018
.016
.014
.012
.010
.008
.006
.004
.002
.000
HU
MID
ITY
RAT
IO (
Kg
H
O / K
g)
2 A
R S
EC
O
DRY BULB TEMPERATURE (°C)
25 30 35
AIR VELOCITY
Thermal Comfort Zone
Zone extension for higher air velocity
(upper limit: 0.75 m/s)

18
The HVAC systems design standard - NBR 16401 – 2008 (ABNT, 2008), presents thermal
comfort conditions air-conditioned indoor environments. It is much more detailed document
than the NR 17 and it mostly based on the ASHRAE Handbook of Fundamentals from 2005. The
document defines summer indoor operative temperatures varying between 22.5 to 25.5 °C at
65% humidity, and 23 to 26 °C with humidity of 35% assuming a clo value of 0.5. Air speed
should be below 0.2 m/s for normal air distributions systems and below 0.25m/s for
displacement ventilation. For winter, operative temperature is allowed to vary between 21 to
23.5 °C at a 60% humidity level and from 21.5 to 24 °C if humidity is set on 30% considering a
clo value of 0.9. Air speed should be below 0.15m/s for normal air distribution systems and
below 0.2 m/s for displacement ventilation (Figure 8).
Based on the PMV model, these limits can be increased by 1.4 K/met for indoor environments
with people developing activities with higher metabolic rates than sedentary. Changes in clo also
result in 0.6 K/ 0.1 clo. Air velocities can also be used to offset an increase of 3K for air speeds up
to 0.8 m/s as long as local control is made available to building occupants. This standard also
considers the limits of temperature gradients and asymmetry to avoid local thermal discomfort
as presented in ASHRAE Standard 55.
Figure 8. Brazilian Graphic Comfort Zone: Acceptable range of operative temperature and humidity from NBR 16401/2008 (ABNT, 2008) plotted on bioclimatic chart.
10
15
25
100 80 60
40
20
RELATIVE HUMIDITY (%)
.026
.024
.022
.020
.018
.016
.014
.012
.010
.008
.006
.004
.002
.000
HU
MID
ITY
RA
TIO
(K
g
H
O /
Kg
)2
AR
SE
CO
OPERATIVE TEMPERATURE (°C)(½ Dry Bulb + ½ MRT For still Air)
10 15 20 25 30 35
AIR VELOCITY UPPER LIMIT
Summer:
- 0.20m/s for normal air distribution systems- 0.25 for displacement ventilation
Winter:- 0.15m/s for normal air distribution systems
- 0.2 m/s for displacement ventilation
THERMAL COMFORT CONDITIONS NBR Standard 16401/2008
These environmental parameters are susceptible to thermal
acceptability of 80% of occupants.
These parameters are valid for homogeneous groups using
typical c lothing (0.5 clo for summer and 0.9 clo for winter) in sedentary or light activ ity (1.0 to 1.2 met)
20
Winter Zone
0.9 clo
Summer Zone
0.5 clo

19
7 BRAZILIAN THERMAL COMFORT FIELD EVIDENCE
The history of thermal comfort studies in Brazil goes back to 1931, with the first field study
being conducted by Paulo Sá in Rio de Janeiro, and Benjamim Ribeiro in 1939 in São Paulo
(Oliveira, 2003). Their experiments were conducted in school buildings and the data were used
later by Michael Humphreys’s first adaptive publication which compared thermal comfort field
studies from around the world (Humphreys, 1976). Paulo Sá’s research already presented
consistent evidence of the adaptive thermal comfort, when this author stated that comfort
temperature doesn’t follow a static pattern, but a dynamic one, that changes over the seasons of
the year (Sá, 1936).However, it was in 1981 that Francisco Romeu Landi, in his thesis analyzing
inaccuracies of human sensitivity in respect to physical variables involved in thermal comfort
prediction, looked for a better understanding in human body's adaptation to usual
temperatures, and how it actually works. According to the author, human body adapts faster to
indoor environments within the comfort zone than when these thermal conditions are pushed
beyond its limits (Landi, 1976).
Since there was no Brazilian thermal comfort standard available for workplaces, studies carried
out during the 90’s and 00’s were vastly influenced by the ISO 7730’s procedures, which is based
on Fanger’s PMV/PPD equation. The few available studies attempting to establish thermal
comfort zones spanning across different climatic zones in Brazil revealed significant differences
in terms of the percentage of dissatisfied people when Fanger’s PPD was used, particularly in hot
and humid climates.
From 1989 to 1995, Araújo (1996) conducted thermal comfort measurements in naturally
ventilated school buildings in Natal/RN, located on the hot and humid northern coast of Brazil.
In the study, the author defined a comfort zone for the studied city and its climate, based on data
collected from 1.862 votes, which was plotted on the psychometric chart. Moreover, the author
found that even though the study has a good response to usual comfort models, the data from
the studied area exceeded the upper limit of temperature and humidity from different models,
including Olgyay (1963), the Effective Temperature zone bounded by Koenigsberger et al.,
(1977), Standard Effective Temperature, and Givoni’s model adapted by González and Elke,
(1986). When data were analyzed taking into account Fanger’s model, the author observed a
predicted percentage of dissatisfied (PPD) considerably higher than actual votes cast in hot
environments, which indicated the limitations of the model when used in hot and humid
climates.

20
Xavier (1999) collected thermal comfort data in classrooms of Florianópolis/SC - southern coast
of Brazil - and found different results from those presented by Araújo (1996). However, when
applying Fanger's model, this author’s research findings also indicated an overestimation of
dissatisfaction when PPD was applied – with PPD predicting 20% of dissatisfaction against only
5% from the field surveys results. Later Ruas, 1999 developed a survey to evaluate thermal
comfort conditions indoors which aimed to clarify the method proposed by ISO 7730 (1994).
The author discussed the uncertainties related to clothing and metabolic rate and its influence
when applied in the thermal comfort calculation (PMV / PPD).
In Belo Horizonte/MG, Gonçalves (2000) interviewed 570 students in order to define
comfortable temperature ranges accepted by these subjects and later compare the survey
results with to international standards. As in previous studies, the author found a PPD well
above observed values in the thermal neutral condition (25%) when compared to the Fanger’s
model (5%). During this research, the adaptive mechanisms’ influence in thermal comfort was
also analyzed, emphasizing the differences between the ranges of comfort temperatures when
investigated different populations adapted to their local climates. In the same year, Xavier
(2000) conducted experiments in three cities of different climate conditions (Florianópolis/SC,
Brasília/DF and Recife/PE), with and without artificial conditioning. The author has developed
an algorithm for metabolism estimative based on individual oxygen consumption, and concluded
that even using this new algorithm in PMV, the heat and cold sensation was still higher than
reality.
Later, Barbosa (2004) analyzed the furniture industry workers thermal comfort in Itatiba/SP,
and Gouvêa (2004) in the clothing industry located at Amparo/SP. The studies highlighted the
lack of adequate metabolic rate data relevant to the Brazilian industry. The survey in Itatiba/SP
resulted in a thermal comfortable temperature very similar to that found by Xavier (2000).
Facing the reported discrepancies between previous studies and PMV/PPD model, Andreasi
(2009) established an alternative model to thermal comfort evaluation in hot and humid
climates. The research was conducted on military context, interviewing uniformed new recruits
and veterans. Throughout the study, two new equations from applied biostatistics were
formulated; one for naturally ventilated and another one to air-conditioning environments.
Recently, Cândido (2010) and De Vecchi (2011) carried out experiments in university
classrooms resulting in large survey samples focusing on occupants’ thermal acceptability and
in particular air movement acceptability. The experiments were carried-out in different regions
21
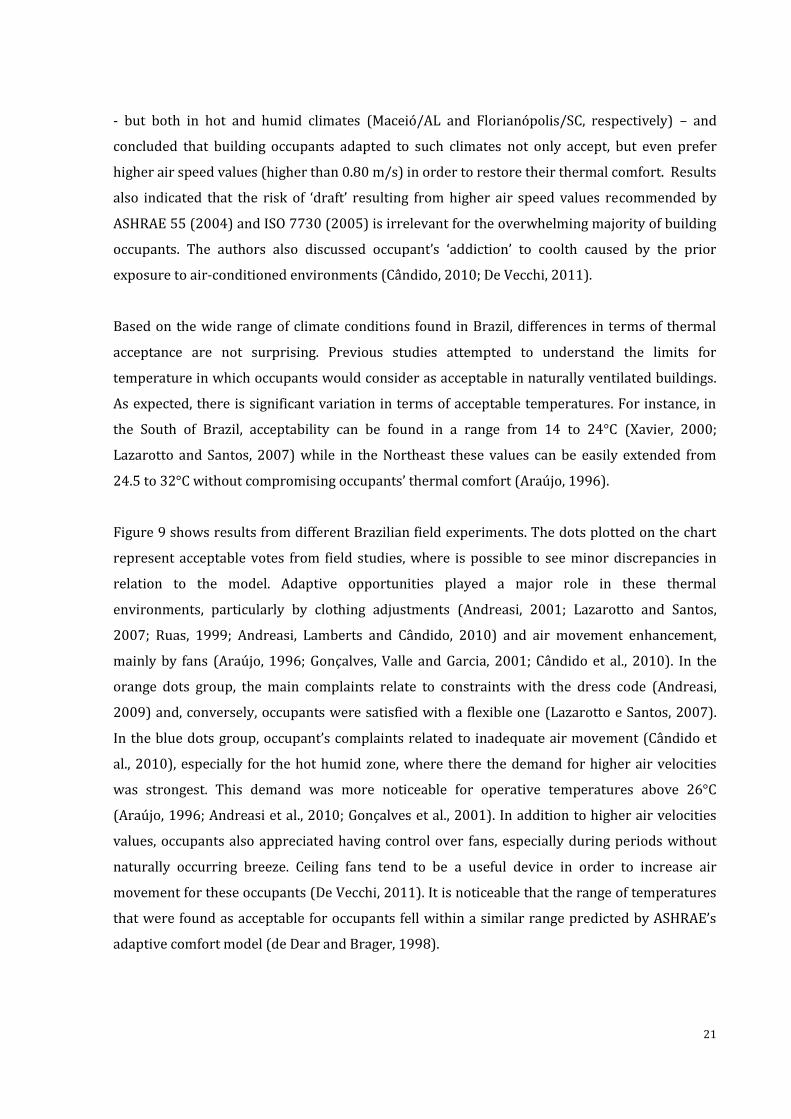
- but both in hot and humid climates (Maceió/AL and Florianópolis/SC, respectively) – and
concluded that building occupants adapted to such climates not only accept, but even prefer
higher air speed values (higher than 0.80 m/s) in order to restore their thermal comfort. Results
also indicated that the risk of ‘draft’ resulting from higher air speed values recommended by
ASHRAE 55 (2004) and ISO 7730 (2005) is irrelevant for the overwhelming majority of building
occupants. The authors also discussed occupant’s ‘addiction’ to coolth caused by the prior
exposure to air-conditioned environments (Cândido, 2010; De Vecchi, 2011).
Based on the wide range of climate conditions found in Brazil, differences in terms of thermal
acceptance are not surprising. Previous studies attempted to understand the limits for
temperature in which occupants would consider as acceptable in naturally ventilated buildings.
As expected, there is significant variation in terms of acceptable temperatures. For instance, in
the South of Brazil, acceptability can be found in a range from 14 to 24°C (Xavier, 2000;
Lazarotto and Santos, 2007) while in the Northeast these values can be easily extended from
24.5 to 32°C without compromising occupants’ thermal comfort (Araújo, 1996).
Figure 9 shows results from different Brazilian field experiments. The dots plotted on the chart
represent acceptable votes from field studies, where is possible to see minor discrepancies in
relation to the model. Adaptive opportunities played a major role in these thermal
environments, particularly by clothing adjustments (Andreasi, 2001; Lazarotto and Santos,
2007; Ruas, 1999; Andreasi, Lamberts and Cândido, 2010) and air movement enhancement,
mainly by fans (Araújo, 1996; Gonçalves, Valle and Garcia, 2001; Cândido et al., 2010). In the
orange dots group, the main complaints relate to constraints with the dress code (Andreasi,
2009) and, conversely, occupants were satisfied with a flexible one (Lazarotto e Santos, 2007).
In the blue dots group, occupant’s complaints related to inadequate air movement (Cândido et
al., 2010), especially for the hot humid zone, where there the demand for higher air velocities
was strongest. This demand was more noticeable for operative temperatures above 26°C
(Araújo, 1996; Andreasi et al., 2010; Gonçalves et al., 2001). In addition to higher air velocities
values, occupants also appreciated having control over fans, especially during periods without
naturally occurring breeze. Ceiling fans tend to be a useful device in order to increase air
movement for these occupants (De Vecchi, 2011). It is noticeable that the range of temperatures
that were found as acceptable for occupants fell within a similar range predicted by ASHRAE’s
adaptive comfort model (de Dear and Brager, 1998).

22
Figure 9. Thermal acceptability for naturally ventilated buildings (after de Dear and Brager, 1998) with Brazilian field data (after Cândido et al., 2010).
Based upon these results, occupants in naturally ventilated buildings accept temperature swings
during the day and year, and prefer higher air velocities if controls and fans are provided. These
results can be easily related to the three categories of adaptive responses that occupants
undertake in order to re-establish thermal comfort, summarized by de Dear et al. (1997):
behavioural, physiological and psychological adaptation.

23
8 DISCUSSION
On the basis of this short review, the latest version of ASHRAE Standard 55 (2010) emerges as
the best inspiration for any thermal comfort standard worldwide. ASHARE’s continuous
maintenance and review aligns this standard’s recommendations with the most recent findings
from the thermal comfort research and also needs of its end-users – engineers and architects.
However, the authors noticed that due to the relatively frequent amendments; the resulting text
is sometimes confusing, which in turn may affect its uptake by researchers and practitioners.
Also, ASHRAE Standard 55 recommends that the adaptive model should only be used in
buildings without a HVAC system and therefore precluding this model’s application in mixed-
mode building, seriously limiting the potential environmental benefits of mixed-mode strategies.
However, emerging field evidence supports the adaptive model’s application in such buildings
when the HVAC system is not in use. The standard should consider having one section dedicated
for artificially air-conditioned buildings, one for naturally conditioned and another for mixed
mode buildings. For the section on air conditioned buildings, the PMV approach has been found
to work well and with the up-to-date approach by ASHRAE Standard 55, innovative design with
higher air speeds for energy efficiency and other personal control systems can be
accommodated.
For the section on naturally conditioned (mixed-mode included), also the ASHRAE approach
based on RP 884 (de Dear and Brager, 1998) has a sound scientific basis and has been critically
tested and verified in many field studies of real buildings around the world. The mean outside
temperature has to be used to define the preferred limits for the inside operative temperature,
and it begs the question as to what kind of outside mean temperatures should be used.
EN15251’s exponentially weighted, running mean temperature Trm for any given day is
expressed in the following equation by Nicol and Humphreys (2010).
𝑇𝑟𝑚 = (1−∝)(𝑇𝑜𝑑−1+∝ 𝑇𝑜𝑑−2 +∝2 𝑇𝑜𝑑−3 +∝3 𝑇𝑜𝑑−4 … )
(eq1)
Where α is a constant (<1) and Tod-1 is yesterday’s daily mean temperature, the day before (Tod-2),
the day before that (Tod-3), etc.

24
EN 15251 recommends that α =0.8 based on the studies of Nicol and Humphreys (2010) from
free-running building neutralities contained in their SCATs database. Addendum C in ASHRAE
2010 accepts the concept of a running mean outdoor temperature, but offers a range of decay
settings in eq2 from α =0.6 up to α = 0.9 (at which point the mean outdoor temperature function
resembles an unweighted 30-day running mean). The geographic scope of input data to ASHRAE
Standard 55 (2004) was global whereas EN15251 relied on exclusively European field study
data. Secondly, the sizes of the two databases are significantly different. About 9,000 of the
21,000 questionnaires inside ASHRAE’s global database were from 36 naturally ventilated
buildings out of the total 160 building database. The European SCATs project produced 4,655
sets of indoor environmental and subjective questionnaire data, of which only 1,449 were
obtained while the office buildings were in free-running mode and these were the basis of
EN15251.
To simplify the calculations we adopted the following 7-day running mean function proposed by
de Dear (2011b) as a very close approximation to the EN15251 Trm (α =0.6) function listed in
eq.2 above:
𝑇𝑟𝑚 = 0.34𝑇𝑜𝑑−1 + 0.23𝑇𝑜𝑑−2 + 0.16𝑇𝑜𝑑−3 + 0.11𝑇0𝑑−4 + 0.08𝑇𝑜𝑑−5 + 0.05𝑇𝑜𝑑−6 + 0.03𝑇𝑜𝑑−7
(eq2)
Where Tod-1 refers to the day before, Tod-2 refers to the day before that, and so on.
Sections 6 and 7 of ASHRAE Standard 55 deal with compliance but we think that section 6
should be better called Design Compliance, while 7 is better described by Compliance of Real
Environments and should present limits in terms of pass/fail. Exceedence limits should also be
included as recommended.

25
9 CONCLUSION
The latest version of ASHRAE Standard 55 (2010), in conjunction with its addenda, was used as
the main inspiration for the proposed Brazilian Thermal Comfort Standard (Appendix 7). Some
changes have been introduced in order to make the standard more understandable and
accessible to the practitioners and other end-users. The structure of the proposed Brazilian
Standard closely resembles that of ASHRAE 55:
1. INTRODUCTION
2. PURPOSE
3. SCOPE
4. DEFINITIONS
5. GENERAL REQUIREMENTS
6. THERMAL COMFORT REQUIRED CONDITIONS
6.1 Introduction
6.2 General Requirements
6.2.1 Operative Temperature
6.2.2 Humidity Limits
6.2.3 Elevated Air Speed
6.2.3.1 Limits to Air Speed with Local Control
6.2.3.2 Limits to Air Speed without Local Control
6.2.4 Local Thermal Discomfort
6.2.4.1 Radiant Temperature Asymmetry
6.2.4.2 Draft
6.2.4.3 Vertical Air Temperature Difference
6.2.4.4 Floor Surface Temperature
6.2.5 Temperature Variations with Time.
6.2.5.1 Cyclic Variations.
6.2.5.2 Drifts or Ramps.
6.3 Determining Acceptable Thermal Conditions in Occupied and Artificially Conditioned
Spaces
6.3.1 General Requirements
6.3.2 Analytical Method for Typical Indoor Environments
6.3.3 Computer Model Method for General Indoor Application
6.4 Determining Acceptable Thermal Conditions in Occupant-Controlled Naturally
Conditioned Spaces.
6.4.1 General Requirements
26
6.4.2 Evaluation Method
6.5 Determining Acceptable Thermal Conditions in Mixed-Mode Buildings
6.5.1. General Requirements
6.5.2 Evaluation Method
7. Method to Assess Thermal Comfort through Measurements
7.1 Comfort from the User Perception
7.1.1 Satisfaction Surveys
7.1.2 Acceptability, Sensations and Preference Surveys
7.1.3 Analysis Method
7.1.3.1 Satisfaction Surveys
7.1.3.2 Acceptability, Sensations and Preference Surveys
7.2 Comfort Prediction from Environmental and Personal Measurements
7.2.1 Air Temperature
7.2.1.1 Air Temperature Sensor
7.2.1.2 Precautions to take in Air Temperature Measurement
7.2.1.3 Local Air Temperature
7.2.2 Mean Radiant Temperature
7.2.2.1 Measurement Principles and calculation
7.2.2.2 Precautions to take when using the Black Globe
7.2.3 Air Speed
7.2.3.1 Air Speed Sensors and Measurements
7.2.4 Humidity
7.2.5 Spatial Position to Measurements
7.2.6 Measurement frequency
7.2.7 Measurements using Simplified Building Automation Systems
7.3 Thermal Comfort Index
7.3.1 Assessments in a Moment of Time
7.3.2 Assessments in a Time Interval
8. DESIGN COMPLIANCE
8.1 Design
8.2 Documentation
9. EXISTING BUILDINGS COMPLIANCE
NORMATIVE APPENDIX A - ACTIVITY LEVELS
NORMATIVE APPENDIX B - CLOTHING INSULATION
NORMATIVE APPENDIX C - COMPUTER PROGRAM FOR CALCULATION OF PMV-PPD
INFORMATIVE APPENDIX D - THERMAL ENVIRONMENT SURVEY

27
We recommend an introductory section describing the main variables involved when analysing
thermal conditions indoors. This text was based on an initial discussion that was sent to
appendix 2, which should be read at the beginning to avoid repetitions within the Standard
proper. Section 5.4 was also eliminated.
We recommend the addition of Section 7 in the Brazilian Standard document, called “Method to
Assess Thermal Comfort through Measurements“. The section 8 was called “Design Compliance”
and Section 9 “Existing Buildings Compliance”.
We added, instead of referencing ISO 7726, an extract of the important parts about how to
measure the variables involved in the comfort environmental assessment.
We recommend that buildings running in mixed mode (part of the year using HVAC and part not
using) were evaluated using a proper method, that alternates between static and adaptive
approach as described in Section 6.5.
Personal control should be compulsory for buildings running higher air speeds to achieve
thermal comfort, as already present in ASHRAE Standard 55.
Appendix C, which dealt with acceptable approaches for operative temperature calculation, had
been excluded and the definition of the appropriate equation included in the text of the Standard
in the Section 7.3 - Thermal Comfort Index.
As Brazilian standards do not allow a bibliographic list, we included the appendix H of ASHRAE
Standard 55 in the appendix 6 of this document, which contains a collection of important
references for people looking into the original sources of information.
We recommend that NBR 16401 should be modified to be in syntony with ASHRAE Standard 55
for buildings using HVAC systems and NR 17 in syntony with the new proposed standard.
The proposed Brazilian standard (in Portuguese) was presented in appendix 7.

28
10 REFERENCES
ABNT. Desempenho térmico de edificações, parte 3: zoneamento bioclimático brasileiro e
diretrizes construtivas para habitações unifamiliares de interesse social, NBR 15220-3. Rio de
Janeiro: Associação Brasileira de Normas Técnicas: 2005.
ABNT. Instalações de ar-condicionado - Sistemas centrais e unitários - Parte 2: Parâmetros de
conforto térmico, NBR 16401-2. Rio de Janeiro: Associação Brasileira de Normas Técnicas, 2008.
AMAI, H.; TANABE, S.; AKIMOTO, T.; GENMA, T. Thermal sensation and comfort with different
task conditioning system. Building and Environment, v. 42, n. 12, p. 3955–3964, 2007.
ANDREASI, W. Impact assessment of bioclimatic strategies on internal temperature at Passo do
Lontra - Pantanal, Mato Grosso do Sul (Avaliação do impacto de estratégias bioclimáticas na
temperatura interna no Passo do Lontra, Pantanal do estado de Mato Grosso do Sul).MPhil
Thesis. Department of Civil Engineering, Federal University of Santa Catarina. Florianópolis, 2001.
134p. 2001.
ANDREASI, W. Thermal comfort evaluation method in a hot and humid region weather located
in Brazil (Método para avaliação de conforto térmico em região de clima quente e úmido do
Brasil). PhD Thesis. Department of Civil Engineering, Federal University of Santa Catarina.
Florianópolis, 2009. p. 204
ANDREASI, W.; LAMBERTS, R.; CÂNDIDO, C. Thermal acceptability assessment in buildings
located in hot humid regions in Brazil. Building and Environment, v. 45, p. 1225–1232, 2010.
ARAÚJO, V. M. D. Thermal comfort parameters to occupants in school buildings at the
northeastern Brazilian coast. (Parâmetros de conforto térmico para usuários de edificações
escolares no litoral nordestino brasileiro). PhD Thesis. Department of Architecture and Urbanismo,
University of São Paulo. São Paulo, 1996. 179p. 1996.
ARENS, E.; HUMPHREYS, M.; DE DEAR, R.; ZHANG, H. Are “class A” temperature requirements
realistic or desirable? Building and Environment, v. 45, n. 1, p. 4–10, 2010.
ARENS, E.; TURNER, S.; ZHANG, H.; PALIAGA, G. Moving air for comfort. ASHRAE Journal,
v. 51, n. 5, p. 18–29, 2009.
ASHRAE STANDARD 55-2010. Thermal Environmental Conditions for Human Occupancy.
Atlanta, Georgia: American Society of Heating, Refrigerating and Air-Conditioning Engineers, 2010.
BARBOSA, M. M. P. Thermal comfort evaluation in a furniture industry located in Itatiba, SP
(Avaliação de conforto térmico na indústria moveleira de Itatiba, SP). MPhil Thesis. Faculty of
Civil Engineering and Architecture. State University of Campinas. Campinas, 2004. 125pp.

29
BRASIL. Requisitos técnicos da qualidade para o nível de eficiência energética de edifícios
comerciais, de serviçoes e públicos (RTQ-C). Rio de Janeiro: Ministério do Desenvolvimento,
Indústria e Comércio Exterior. Instituto Nacional de Metrologia, Normalização e Qualidade Industrial
- INMETRO. Portaria n. Portaria n.o 372, de 17 de setembro de 2010, 2010.
BRASIL. Regulamento técnico da qualidade para o nível de eficiência energética de edificações
residenciais (RTQ-R). Rio de Janeiro: Ministério do Desenvolvimento, Indústria e Comércio
Exterior. Instituto Nacional de Metrologia, Normalização e Qualidade Industrial - INMETRO. Portaria
n.o 18, de 16 de janeiro de 2012, 2012.
BUENO, A.; LAMBERTS, R. Proposal for a thermal comfort zone in the psychrometric chart
(Proposta de zona de conforto na carta psicrométrica). In: I ENCONTRO NACIONAL SOBRE
NORMALIZAÇÃO LIGADA AO USO RACIONAL DE ENERGIA E AO CONFORTO TÉRMICO
EM EDIFICAÇÕES. Anais... Florianópolis, Brazil: 1991.
CÂNDIDO, C. Indoor air movement acceptability and thermal confort in hot-humid climates.
PhD Thesis. Department of Civil Engineering, Federal University of Santa Catarina. Florianópolis,
2010: 2010.
CÂNDIDO, C.; DE DEAR, R. From thermal boredom to thermal pleasure: a brief literature review.
Ambiente Construído, v. 12, n. 1, p. 81–90, 2012.
CÂNDIDO, C.; LAMBERTS, R.; DE DEAR, R.; BITTENCOURT, L. Towards a Brazilian standard
for naturally ventilated buildings: guidelines for thermal and air movement acceptability. In:
PROCEEDINGS OF 6TH WINDSOR CONFERENCE: ADAPTING TO CHANGE: NEW
THINKING ON COMFORT. Anais... Cumberland Lodge, Windsor, UK. 9-11 April 2010. London:
2010.
CÂNDIDO, C.; LAMBERTS, R.; DE DEAR, R.; DE VECCHI, R. Towards a Brazilian standard for
naturally ventilated buildings: guidelines for thermal and air movement acceptability. Building
Research & Information, v. 39, n. 2, p. 145–153, 2011.
CENA, K.; DE DEAR, R. Field study of occupant comfort and office thermal environments in a
hot arid climate: Final Report on ASHRAE RP - 921. Sydney, Australia. 160pp.: 1998.
CENA, K.; SPOTILA, J. Thermal comfort of the elderly: effect of indoor microclimate, clothing,
activity level and socioeconomics: Final Report on ASHRAE RP - 421. Hamilton, Ontario. 107pp.:
1984.
CHAPMAN, K. Methodology to incorporate the effect of wavelength dependency of thermal and
optical properties of window glass into in-space thermal comfort calculations: Final Report on
ASHRAE RP - 1071. Manhattan, Kansas. 38pp: 2003.

30
CHAPMAN, K. Window performance for human thermal comfort: Final Report on ASHRAE
RP - 1162. Manhattan, Kansas. 94pp.: 2004.
CHAPMAN, K.; WANG, W. Development of a simplified methodology to incorporate radiant
heaters over 300°F into thermal comfort calculations: Final Report on ASHRAE RP - 1037.
Manhattan, Kansas. 54pp.: 2003.
DE DEAR, R. et al. Impact of air humidity on thermal comfort during step changes: Final
Report on ASHRAE RP - 503. Technical University of Denmark. 131pp.: 1997.
DE DEAR, R. Revisiting an old hypothesis of human thermal perception: alliesthesia. Building
Research & Information, v. 39, n. 2, p. 108–117, 2011a.
DE DEAR, R. Recent enhancements to the adaptive comfort standard in ASHRAE 55-2010. In:
PROCEEDINGS OF THE 45TH ANNUAL CONFERENCE OF THE ARCHITECTURAL SCIENCE
ASSOCIATION. Anais... Sydney, Australia: ANZAScA, 2011b.
DE DEAR, R.; BRAGER, G. Developing an adaptive model of thermal comfort and preference.
ASHRAE Trans, v. 104, p. 145–167, 1998.
DE DEAR, R.; BRAGER, G.; COOPER, D. Developing an adaptive model of thermal comfort and
preference: Final Report on ASHRAE RP - 884. Sydney: MRL, 1997. p. 312
DEAR, R. DE; ET AL. Progress in Thermal Comfort Research Over the Last Twenty Years.
Paper accepted for publication at Indoor Air., 2013.
DE DEAR, R.; FOUNTAIN, M.; POPOVIC, S.; WATKINS, S.; BRAGER, G.; ARENS, E.;
BENTON, C. A Field Study of Occupant Comfort and Office Thermal Environments in a Hot-
Humid Climate: Final Report on ASHRAE RP - 702. MRL: Sydney, 162pp, 1993.
DE VECCHI, R. Condições de conforto térmico e aceitabilidade da velocidade do ar em salas de
aula com ventiladores de teto para o clima de Florianópolis/SC. Dissertação de Mestrado.
Departamento de Engenharia Civil, Universidade Federal de Santa Catarina. Florianópolis, 2011.: p.
142.
DONNINI, G. et al. Field study of occupant comfort and office thermal environments in a cold
climate: Final Report on ASHRAE RP - 821. Montreal, Canada. 258pp., 1996.
EN. Indoor environmental input parameters for design and assessment of energy performance
of buildings addressing indoor air quality, thermal environment, lighting and acoustics, CEN
Standard 15251. Bruxelas: European committee for Standardisation, 2007.
FAUCETT, J.; GOVAN, F. Field evaluation of high- intensity infrared space heating systems:
Final Report on ASHRAE RP - 98. York Research Corp, 72pp.: 1997.

31
FOUNTAIN, M.; ARENS, E.; DE DEAR, R.; BAUMAN, F.; MIURA, K. Locally controlled air
movement preferred in hot isothermal environments. ASHRAE Trans, v. 100, n. 2, p. 937–952, 1994.
FRAUNHOFER ISE. Comparative evaluation of thermal comfort in non-residential building.
european project thermCo. thermal comfort in buildings with low-energy cooling. Avaliable in:
<http://www.thermco.org/cms/upload/Publications_public/ThermCo_BestPractice_LowEnergyCoolin
g.pdf>.
GIORGI, G.; MEGRI, A.; DONNINI, G.; HAGHIGHAT, F. Responses of disabled persons to
thermal environments: Final Report on ASHRAE RP - 885. Montreal, Canada. 186pp.: 1996.
GONÇALVES, W. Thermal comfort index study evaluated, based on student population in the
metropolitan region of Belo Horizonte/MG(Estudo de índice de conforto térmico, avaliados com
base em população universitária na região metropolitana de Belo Horizonte/MG). MPhil Thesis.
Department of Mechanical Engineering,Federal University of Minas Gerais. Belo Horizonte, 2000.
GONÇALVES, W.; VALLE, R. M.; GARCIA, E. The role of adaptive mechanisms on university
students’ thermal comfort from Belo Horizonte - MG (O papel de mecanismos adaptativos no conforto
térmico de estudantes universitários em Belo Horizonte – MG). In: VI ENCONTRO NACIONAL
SOBRE CONFORTO NO AMBIENTE CONSTRUÍDO. Anais... 2001.
GONZÁLEZ, E.; ELKE, H. Proyecto clima y arquitectura. Volume 1 ed. México: Universidad Del
Zulia, Facultad de Arquitectura, Instituto de Investigaciones de Arquitectura y Sistemas Ambientales,
1986.
GOUVÊA, T. C. Thermal comfort evaluation: an experience on clothing industry (Avaliação do
conforto térmico: uma experiência na indústria da confecção). MPhil Thesis. Faculty of Civil
Engineering and Architecture. State University of Campinas. Campinas, 2004. 164pp.: 2004.
HOWELL, R. A study to determine methods for designing radiant heating and cooling systems:
Final Report on ASHRAE RP - 394. University of Missouri-Rolla, MO. 345pp.: 1987.
HOYT, T.; HO, K.; ZHANG, H.; ARENS, E.; WEBSTER, T. Energy savings from extended air
temperature setpoints and reductions in room air mixing. In: PROCEEDINGS OF INTERNATIONAL
CONFERENCE ON ENVIRONMENTAL ERGONOMICS. Anais... August 2-7, Boston: 2009.
HUMPHREYS, M. Field studies of thermal comfort compared and applied. Building Research
Station, v. 44, p. 5–27, 1976.
IEA. Energy performance certification of buildings. Avaliable in:
<http://www.iea.org/publications/freepublications/publication/buildings_certification.pdf; Last access:
17/12/2012>.

32
INDRAGANTI, M.; OOKA, R.; RIJAL, H. B. Thermal comfort in offices in summer: findings from a
field study under the “setsuden” conditions in Tokyo, Japan. Building and Environment, v. 61, p.
114–132, 2013.
IPCC. Managing the Risks of Extreme Events and Disasters to Advance Climate Change
Adaptation. A Special Report of Working Groups I and II of the Intergovernmental Panel on
Climate Change. Cambridge University Press, Cambridge, UK and New York, NY, USA, 582pp.,
2012.
ISO. Ergonomics of the thermal environments - instruments for measuring physical quantities,
ISO 7726:2005. Geneva, Switzerland: International Organization for Standardization, 1998.
ISO. Ergonomics of the thermal environment - Analytical determination and interpretation of
thermal comfort using calculation of the PMV and PPD indices and local thermal comfort
criteria, ISO 7730:2005. Geneva, Switzerland: International Organization for Standardization, 2005.
JAAFAR, Z.; CROXFORD, B. Adapting To Technology: The Case Of Air Conditioning Use In
Malaysian Homes. In: PROCEEDINGS OF 6TH WINDSOR CONFERENCE: ADAPTING TO
CHANGE: NEW THINKING ON COMFORT. Anais... Cumberland Lodge, Windsor, UK. 9-11 April
2010. London: 2010.
JIANG, Z.; CHEN, Q. Establishment of design procedures to predict room airflow requirements
in partially mixed room air distribution systems: Final Report on ASHRAE RP - 1522. West
Lafayette, USA,134pp: 2012.
KEMPTON, W.; LUTZENHISER, L. Introduction. Energy and Buildings, v. 18, n. 3-4, p. 171–176,
1992.
KIM, J.; DE DEAR, R. How does occupant perception on specific IEQ factors affect overall
satisfaction? In: PROCEEDINGS OF 7TH WINDSOR CONFERENCE: THE CHANGING
CONTEXT OF COMFORT IN AN UNPREDICTABLE WORLD. Anais... Cumberland Lodge,
Windsor, UK. 12-15 April 2012. London.: 2012.
KOENIGSBERGER, O. T.; INGERSOLL, T. G.; MAYHEW, A.; SZOKOLAY, S. Vivienda y
edificios en zonas cálidas y tropicales. Madrid: Paraninfo, 1977.
LANDI, F. R. Man’s thermal physiological adaptation to environment and thermal comfort
imprecise measures (A adaptação térmica fisiológica do homem ao meio e a imprecisão das
medidas das condições de conforto térmico). Full Professor Thesis, University of São Paulo
Polytechnic School. São Paulo, SP., 1976.
LAZAROTTO, N.; SANTOS, J. C. P. Studies thermal comfort evaluation from elementary school in
northwestern, RS (Avaliação do conforto térmico de estudantes do ensino fundamental na região
33
noroeste do RS). In: ENCONTRO NACIONAL NO AMBIENTE CONSTRUÍDO, ENCAC. Anais...
Ouro Preto, MG: 2007.
MELIKOV, A.; HALKJAER, L.; ARAKELIAN, R.; FANGER, P. O. Human response to cooling
with air jets: Final Report on ASHRAE RP - 518. Technical University of Denmark. 229pp.: 1997.
NICOL, F.; HUMPHREYS, M. Derivation of the equations for comfort in free-running buildings in
CEN Standard EN15251, Special Issue Section: International Symposium on the Interaction Human
and Building Environment. Building and Environment, v. 45, n. 1, p. 11–17, 2010.
NR 17. Ergonomics (Ergonomia). Brasília/DF, BR: Ministério do Trabalho, 1990.
OLGYAY, V. Design With Climate. New Jersey: Princeton University, 1963.
OLIVEIRA, M. The first thermal comfort studies in Brazil: Paulo Sá’s contribution (Os
primeiros estudos sobre conforto térmico no Brasil: a contribuição de Paulo Sá). MPhil Thesis.
Faculty of Civil Engineering and Architecture. State University of Campinas. Campinas, 2003.
173pp.: 2003.
ROHLES, F. Thermal sensation of sedentary man in moderate temperatures: Final Report on
ASHRAE RP - 43. Manhattan, Kansas, 131pp: 1970.
ROHLES, F.; BENNETT, C.; MILLIKEN, G. The interaction of the Visual and Thermal
Environments on the Comfort and Acceptance of Indoor Space: Final Report on ASHRAE RP -
243. Manhattan, Kansas, 71pp: 1980.
ROHLES, F.; MILLIKEN, G.; KRSTIC, I. Optimizing thermal transients for comfort and energy
use: Final Report on ASHRAE RP - 198. Manhattan, Kansas. 188pp: 1979.
RUAS, A. C. Thermal comfort evaluation - contribution to international standards
implementation (Avaliação de conforto térmico – contribuição à aplicação das normas
internacionais). hitecture. State University of Campinas. Campinas, 1999. 78pp.: 1999.
SÁ, P. Studies about thermal and visual comfort in Brazil (Estudos sobre o conforto thérmico e o
conforto visual no Brasil). Rio de Janeiro: Instituto Nacional de Technologia. 43pp., 1936.
SCHILLER, G.; ARENS, E.; BAUMAN, F.; BENTON, C.; FOUNTAIN, M.; DOHERTY, T. A study
to establish a data base on existing thermal environments in office buildings: Final Report on
ASHRAE RP - 462. University of California, Berkeley. 174pp.: 1988.
STOOPS, J. A possible connection between thermal comfort and health. [S.l.]: Lawrence Berkeley
National Laboratory, 2004.
TANABE, S. Thermal comfort requirements in Japan. PhD Thesis - Waseda University, Tokyo.
1988.

34
TANABE, S.; IWAHASHI, Y.; TSUSHIMA, S. Thermal comfort and productivity in offices under
mandatory electricity savings after great east japan earthquake. In: PROCEEDINGS OF 7TH
WINDSOR CONFERENCE: THE CHANGING CONTEXT OF COMFORT IN AN
UNPREDICTABLE WORLD. Anais... Cumberland Lodge, Windsor, UK. 12-15 April 2012. London:
2012.
TILLER, D.; WANG, L.; MUSSER, A.; BULLON, R.; RADIK, M.; DECKER, N.; PLAMP, S.
Combined Effects of noise and temperature on human comfort and performance: Final Report
on ASHRAE RP - 1128. Omaha, NE, USA. 327pp.: [s.n.], 2009.
TOFTUM, J. Air movement - good or bad? Indoor Air, v. 14, p. 40–45, 2004.
XAVIER, A. Thermal comfort conditions for 2nd grade students from Florianópolis’ region
(Condições de conforto térmico para estudantes de 2° grau da região de Florianópolis). MPhil
Thesis. Department of Civil Engineering, Federal University of Santa Catarina. Florianópolis, 1999.,
1999.
XAVIER, A. Thermal comfort prediction indoors with sedentary activity - physical theory
combined with field studies (Predição de conforto térmico em ambientes internos com atividade
sedentária - teoria física aliada à estudos de campo). PhD Thesis. Department of Civil Engineering,
Federal University of Santa Catarina. Florianópolis, 2000.
ZHANG, H.; ARENS, E.; FARD, S. A.; HUIZENGA, C.; PALIAGA, G.; BRAGER, G.; ZAGREUS,
L. Air movement preferences observed in office buildings. International journal of Biometeorology,
v. 51, p. 349–360, 2007.
ZHANG, H.; ARENS, E.; PASUT, W. Air temperature thresholds for indoor comfort and perceived
air quality. Building Research & Information, v. 39, n. 2, p. 134–144, 2011.
ZHANG, Y.; ZHAO, R. Overall thermal sensation, acceptability and comfort. Building and
Environment, v. 43, n. 1, p. 44–50, 2008.
ZHANG, Y.; ZHAO, R. Relationship between thermal sensation and comfort in non-uniform and
dynamic environments. Building and Environment, v. 44, n. 7, p. 1386–1391, 2009.

35
APPENDIX 1 – SPECIAL ISSUES OF ENERGY AND BUILDINGS (1992 AND 2002)
Special Issues on the Social and Cultural Aspects of Cooling
Energy and Buildings, Vol.18 (3-4): 171-291 (1992)
“I always turn it on super”: user decisions about when and how to operate room air conditioners Willett Kempton Center for Energy and Environmental Studies, Princeton University, Princeton, NJ 08544 USA
Daniel Feuermann Center for Energy and Environmental Physics, Blaustein Institute for Desert Research, Sede Boqer Campus, Midreshet Ben-Gurion, Israel
Arthur E. McGarity Department of Engineering, Swarthmore College, Swarthmore, PA 19081, USA
DOI: http://dx.doi.org/10.1016/0378-7788(92)90012-6
Abstract Room air-conditioner operation was studied in order to understand how energy consumption and peak power demand are determined by user needs, concepts, and behavior. In a multi-family building in New Jersey, thirteen room air conditioners were instrumented in eight apartments, and the residents were interviewed about their cooling needs, decisions about when to turn on their air-conditioning, and their conceptions and operations of the units. Residents were not billed separately for electricity. They nevertheless limited their use of air-conditioning on the basis of many non-economic factors, including: daily schedule, folk theories about how air conditioners function and the body's heat tolerance, personal strategies for dealing with all machines, and beliefs and preferences concerning health, thermal comport, and alternative cooling strategies. Across physically similar apartments, seasonal air-conditioner energy consumption varied by two to three orders of magnitude while interior temperature varied by only 2.4 °C to 3.7 °C (4.3–6.7 °F). The least-frequent users were effectively achieving comport at greatly reduced energy consumption, but they were not reducing peak demand since they ran their units only on peak hours of the hottest days of the summer. Three-quarters of the residents did not use their thermostats, controlling cooling instead by switching their units on and off manually. Only one resident consistently let his air conditioner operate thermostatically, and many were not aware that their units had thermostats. The prevailing non-thermostatic mode was initially thought to indicate a need for user education. Further investigation suggests that the cause is in fact a startling mismatch of existing room air-conditioner controls to user needs, with a corresponding opportunity for fundamental redesign of controls.
A question of control: alternative patterns of room air-conditioner use Loren Lutzenhiser Sociology and Rural Sociology, Washington State University, Pullman, WA 99164-4020 USA DOI: http://dx.doi.org/10.1016/0378-7788(92)90013-7 Abstract A study of room air-conditioner use in 279 California apartments discovered distinct manual and automatic patterns of control, with most users opting for a manual control strategy. Manual

36
control seems to be an effective alternative to the thermostatic control intended by the manufacturer. Users of both strategies are sometimes guided by theories of air-conditioner operation and control that are not in agreement with engineering accounts of the machine's design. When various control strategies are compared, we find that most fit quite well with user experience - although some may result in cooling outcomes and energy costs that users do not intend. The energy consumption levels resulting from competing approaches are also compared, and the research and policy implications of the analysis are considered.
Utility control of residential cooling: resident-perceived effects and potential program improvements Willett Kempton, Cathy Reynolds, Margaret Fels Center for Energy and Environmental Studies, Princeton University, Princeton, NJ 08544 USA
David Hull Department of Statistics, Stanford University, Stanford, CA 94305 USA
DOI: http://dx.doi.org/10.1016/0378-7788(92)90014-8 Abstract In a pilot utility direct load control (DLC) program in New Jersey, air conditioners of volunteer household were remotely cycled in order to reduce electric load demand. The resulting load savings and comfort effects of the program are analyzed. A discomfort-from-cycling index is constructed from participant logs of cooling adequacy. Load reductions are calculated from 5-min consumption data. Based on both the discomfort index and reported internal temperatures, the DLC cycling did not create a comfort problem for most participants. When the DLC equipment was activated, participants reported only slight increases in temperature (from 78.4 to 79.0°F) and discomfort (increasing from 7% to 15%). Also, participants achieving higher load savings were not significantly more likely to report discomfort. Two variables which did significantly predict load savings were duty cycle and frequency of thermostatic cycling. Current DLC equipment uses a preset cycle-off time, typically 25% to 50%. This cycle-off percentage can be matched to average characteristics in a utility service area. However, since the percentage is preset it cannot be matched to the diversity in natural thermostatic cycling across houses. For example, this study finds that 16% of the houses had duty cycles below 0.50 on the hottest summer days during the hours selected for duty cycling. These houses cannot provide load savings with a DLC controller preset to 50% or less off-time. Fully 60% of the houses had duty cycles below 0.75 for this period, yielding no savings at 25% off-time and half the expected savings at 50% off-time. Two methods are proposed for improving efficiency of DLC programs: pre-screening based on measured duty cycle, and adoption of advanced DLC controllers. For the study sample, pre-screening is found to be not economical if it requires a separate site visit - surprisingly, it is cheaper to install equipment even in residences which will not yield by any load savings than to pay for screening visits. A more satisfactory improvement in DLC program efficiency would result from advanced DLC controllers with redesigned cycling logic. In place of the current fixed cycle-off percentage, an advanced controller is proposed which would choose the best cycle-off time based on each individual house's natural thermostatic duty cycle. The results indicate that this advanced controller would reduce program costs per kW saved by 29%. Such a controller would also achieve load savings more equitably, spreading cooling reductions more evenly across participants, and eliminate current programs' perverse incentive to oversize cooling equipment.

37
Japanese residential air-conditioning: natural cooling and intelligent systems Haruyuki Fujii Shimizu Corporation, Institute of Technology, Tokyo Japan
Loren Lutzenhiser Sociology and Rural Sociology, Washington State University, Pullman, WA 99164-4020 USA
DOI: http://dx.doi.org/10.1016/0378-7788(92)90015-9 Abstract Japanese residential heap pumps (which commonly combine cooling, dehumidifying and heating in a single system) are unlike American room air conditioners in a variety of ways. A key to the difference follows from the traditional Japanese focus on heating or cooling persons rather than spaces. When this focus is coupled with the widespread use of inverter technology, solid-state electronics, Japanese cultural norms, the constraints of house form, and the islands' climate, the result is a sophisticated system unlike anything available elsewhere. In addition to a large number of standard remote-control options, some Japanese systems can perceive and learn user preferences, while others can generate pre-recorded and algorithmic fluctuations of wind and temperature. We discuss some of the implications (both for users and for energy consumption) of these innovations. We also consider the results of a small survey of Japanese air-conditioner owners in which we found that despite the sophistication of their heat pump systems a significant majority prefers natural cooling. Most, for example, open windows and pursue other natural cooling strategies before using their air conditioners. While they view the devices as urban necessities, they also report limited knowledge of their machines' advanced features. This research examines the design, cultural context and use of Japanese air-conditioning systems, along with some of the behavioral and theoretical issues raised by their unique form. After discussing traditional Japanese housing and heating and cooling technologies, we describe contemporary Japanese heating/ cooling systems, speculate about the differences between US and Japanese systems, and present preliminary findings on Japanese cooling behavior from a small sample of Japanese air-conditioner owners.
A tale of two populations: thermal comfort in air-conditioned and naturally ventilated offices in Thailand John F. Busch Energy Analysis Program, Applied Science Division, Lawrence Berkeley Laboratory, Berkeley, CA 94720 USA.
DOI: http://dx.doi.org/10.1016/0378-7788(92)90016-A Abstract A field study of thermal comfort was conducted in Bangkok, Thailand, in which over 1100 office workers responded to a questionnaire while simultaneous physical measurements were taken. In this study we explore whether there is justification for adopting a comfort standard that differs from those developed for office workers accustomed to more temperate climates. Both air-conditioned and naturally ventilated offices were surveyed. Participants cast votes on standard subjective thermal rating scales and these were correlated with temperature indices that variously account for the thermal impacts of humidity, radiant temperature, air velocity, and clothing levels. Following the criteria used in developing a widely adopted thermal comfort standard, it was found that the upper temperature bound for a Thai comfort standard, instead of being the currently accepted level of 26.1 °C for those accustomed to air-conditioning accustomed to naturally ventilated spaces, and as high as 28 °C for those accustomed to air-conditioning. Comparing the responses from the naturally ventilated buildings with both those
38
from the air-conditioned buildings and from studies conducted in the temperate regions provides convincing evidence of acclimatization. These and other findings of this study suggest that interior spaces in Thailand can be cooled to a far lesser degree without sacrificing comfort.
On condis and coolth Gwyn Prins Emmanuel College, University of Cambridge, Cambridge UK
DOI: http://dx.doi.org/10.1016/0378-7788(92)90017-B Abstract This essay is about the cultural as well as the technical origins of society's large-scale conditioning of air. It argues that by the application of semiotic and anthropological analysis, it is possible to use air-conditioning as a particularly efficient instrument with which to investigate some basic features of modern American culture. The essay argues that air-conditioning is essentially like an act of potlatch of which modern American quick food cuisine is another important example. It also suggests that the desire for air-conditioned air is addictive, with important consequences in moral and political philosophy as well as for the strategic minimum energy requirements of the Republic. The essay concludes by suggesting that the same cultural and technological roots in American history which created the addiction to coolth also contain the means to move on to cleverer, more environment-friendly “post-coolth” technologies.
Alternatives to compressor cooling in residences Helmut Feustel Indoor Environment Program, Lawrence Berkeley Laboratory, Berkeley, CA 4720, USA
Anibal de Almeida Department of Electrical Engineering, University of Coimbra, Coimbra, Portugal
Carl Blumstein Universitywide Energy Research Group, University of California, Berkeley, CA 94720, USA
DOI: http://dx.doi.org/10.1016/0378-7788(92)90026-D Abstract Alternatives to compressor-driven air conditioners for cooling residences are reviewed. Methods reviewed include direct and indirect evaporative cooling, desiccant cooling, absorption cooling, natural and induced ventilation, radiative cooling, shading with vegetation, architectural shading, improved glazing, reflective coatings, radiant barriers, sensible and latent heat storage, and earth cooling. Emphasis is given to recent research results, methods for simulating performance, and problems that need to be addressed in future research. A concluding section examines the reasons for the current dominance of compressor technology and identifies research and development needed to make alternative cooling methods more competitive.

39
Special Issues on Thermal Comfort Standards Energy and Buildings, Vol.34 (6): 529-686 (2002)
Special issue on thermal comfort standards Fergus Nicol Ken Parsons (Editors to Special Issue) School of Architecture, Oxford Centre for Sustainable Development, Oxford Brookes University, Gipsy Lane, Oxford OX3 0BP, UK.
DOI: http://dx.doi.org/10.1016/S0378-7788(02)00002-6 Some among the readers of Energy and Buildings may wonder why the editors have agreed to this special issue dedicated to the study of standards for thermal comfort. Is the specification of the exact temperatures to be delivered by buildings really that important? What interest is there in the detailed physics of clothing or the way questions are framed in comfort surveys? Anyway, haven’t we got perfectly good standards already? So, how to justify this special issue? Firstly the energy consumption of buildings is critically dependent on the indoor temperatures which the building and its services must deliver. The sensitivity of occupants to the indoor climate also has implications for how closely we need to control the environment—again with energy implications. Secondly the research which underpins the science of thermal comfort is very diverse—ranging from climatology and building design, through simulation and the physics of clothing to physiology and psychophysics. The results of this research are widely spread in the literature and difficult to draw together; a single volume representing the major strands of thought is therefore attractive. The recent conference Moving Thermal Comfort Standards into the 21st Century held in Windsor, England—on which this issue is based—revealed the breadth of research and the depth of controversy which continues to inspire interest in this subject. The full range of papers is available in the proceedings of the conference. In this special issue we have tried to give a flavor of the papers presented through a representative selection of the best.
Extension of the PMV model to non-air-conditioned buildings in warm climates P. Ole Fanger Jørn Toftum Department of Energy Engineering, International Centre for Indoor Environment and Energy, Technical University of Denmark, Building 402, DK-2800 Lyngby, Denmark.
DOI: http://dx.doi.org/10.1016/S0378-7788(02)00003-8 Abstract The PMV model agrees well with high-quality field studies in buildings with HVAC systems, situated in cold, temperate and warm climates, studied during both summer and winter. In non-air-conditioned buildings in warm climates, occupants may sense the warmth as being less severe than the PMV predicts. The main reason is low expectations, but a metabolic rate that is estimated too high can also contribute to explaining the difference. An extension of the PMV model that includes an expectancy factor is introduced for use in non-air-conditioned buildings in warm climates. The extended PMV model agrees well with quality field studies in non-air-conditioned buildings of three continents.

40
Introduction to thermal comfort standards and to the proposed new version of EN ISO 7730 B.W. Olesen Wirsbo-VELTA GmbH, 22851 Norderstedt, Germany
K.C. Parsons Loughborough University, Loughborough, UK
DOI: http://dx.doi.org/10.1016/S0378-7788(02)00004-X, Abstract This paper describes existing International Standards Organization (ISO) standards and current activity concerned with thermal comfort. It describes how an ISO standard is produced from a new work item proposal to publication as an International Standard. ISO Standards should be valid, reliable, useable, and with sufficient scope for practical application. The existing thermal comfort standard—EN ISO 7730—is considered in terms of these criteria as well as ISO 8996 (metabolic rate) and ISO 9920 (clothing). The work of ISO/TC 159 SC5, ‘ergonomics of the physical environment’, is presented in Appendix A. The proposed revision of EN ISO 7730 is presented in detail. The revised standard will be based on requirements for general thermal comfort (predicted mean vote (PMV), operative temperature) and local thermal discomfort (radiant temperature asymmetry, draught, vertical air temperature differences, floor surface temperatures). One critical issue is the effect of air velocity. Increased air velocity has a beneficial effect at warm temperatures, but it may result in draught sensation in cooler temperatures. Another issue is the extent to which requirements of humidity need to be included in a standard for thermal comfort. Several recent research projects dealing with adaptation, influence of air velocity and the effect of humidity have been responsible for keeping the standards up to date.
Thermal comfort in naturally ventilated buildings: revisions to ASHRAE Standard 55 Richard J. de Dear Division of Environmental and Life Sciences, Macquarie University, Sydney, NSW 2109, Australia
Gail S. Brager Center for Environmental Design Research, University of California, Berkeley, CA 94720-1839, USA
DOI: http://dx.doi.org/10.1016/S0378-7788(02)00005-1 Abstract Recently accepted revisions to ASHRAE Standard 55—thermal environmental conditions for human occupancy, include a new adaptive comfort standard (ACS) that allows warmer indoor temperatures for naturally ventilated buildings during summer and in warmer climate zones. The ACS is based on the analysis of 21,000 sets of raw data compiled from field studies in 160 buildings located on four continents in varied climatic zones. This paper summarizes this earlier adaptive comfort research, presents some of its findings for naturally ventilated buildings, and discusses the process of getting the ACS incorporated into Standard 55. We suggest ways the ACS could be used for the design, operation, or evaluation of buildings, and for research applications. We also use GIS mapping techniques to examine the energy-savings potential of the ACS on a regional scale across the US. Finally, we discuss related new directions for researchers and practitioners involved in the design of buildings and their environmental control systems.

41
Adaptive thermal comfort and sustainable thermal standards for buildings J.F. Nicol M.A. Humphreys Oxford Centre for Sustainable Development, School of Architecture, Oxford Brookes University, Gipsy Lane, Oxford OX3 0BP, UK
DOI: http://dx.doi.org/10.1016/S0378-7788(02)00006-3 Abstract The origin and development of the adaptive approach to thermal comfort is explained. A number of recent developments in the application of the theory are considered and the origin of the differences between adaptive thermal comfort and the ‘rational’ indices is explored. The application of the adaptive approach to thermal comfort standards is considered and recommendations made as to the best comfort temperature, the range of comfortable environments and the maximum rate of change of indoor temperature. The application of criteria of sustainability to thermal standards for buildings is also considered.
Displacement ventilation environments with chilled ceilings: thermal comfort design within the context of the BS EN ISO7730 versus adaptive debate D.L. Loveday Department of Civil and Building Engineering, Loughborough University, Loughborough, UK
K.C. Parsons Department of Human Sciences, Loughborough University, Loughborough, UK
A.H. Taki School of Architecture, De Montfort University, Leicester, UK
S.G. Hodder Department of Human Sciences, Loughborough University, Loughborough, UK
DOI: http://dx.doi.org/10.1016/S0378-7788(02)00007-5 Abstract The current design standard BS EN ISO7730 [Moderate thermal environments—determination of the PMV and PPD indices and specification of the conditions for thermal comfort, International Standards Organization (1995)] is based upon the work of Fanger, and essentially comprises a steady-state human heat balance model that leads to a prediction of the sensation of human thermal comfort for a given set of thermal conditions. The model was derived from laboratory-based measurements conducted in the mid-1960s in relatively ‘conventional’ environments. However, a chilled ceiling operated in combination with displacement ventilation represents a more sophisticated environment as compared with the original conditions in which the Fanger model was derived. This raised a question about the applicability of the current standard when designing for thermal comfort in offices equipped with chilled ceiling/displacement ventilation systems. This paper presents findings from an EPSRC-funded study that sought to answer the above question. Human test subjects (184 in total) carried out sedentary office-type work in a well-controlled environmental test room that simulated an office fitted with the above system. Measurements of environmental variables were taken at a number of locations near the subjects, each of whom wore a typical office clothing ensemble. The reported thermal comfort sensations were compared with values predicted from BS EN ISO7730 over a range of system operating conditions. It was shown that the current standard BS EN ISO7730 may be used, without modification, when designing for the thermal comfort of sedentary workers in offices equipped with chilled ceiling/displacement ventilation systems. These findings are interpreted within the context of a proposed modification to thermal comfort

42
design standards that includes adaptive effects, and the influence of BS EN ISO7730 on the development of other radiant surface/displacement ventilation configurations is discussed.
Personal factors in thermal comfort assessment: clothing properties and metabolic heat production George Havenitha Ingvar Holmérb Ken Parsonsa aDepartment of Human Sciences, Human Thermal Environments Laboratory, Loughborough University, Ashby Road, Loughborough, Leicester LE11 3TU, UK bClimate Research Group, National Institute for Working Life, Solna, Sweden
DOI: http://dx.doi.org/10.1016/S0378-7788(02)00008-7 Abstract In the assessment of thermal comfort in buildings, the use of the Predicted Mean Vote (PMV) model is very popular. For this model, data on the climate, on clothing and on metabolic heat production are required. This paper discusses the representation and measurement of clothing parameters and metabolic rate in the PMV context. Several problems are identified and for some of these solutions are provided. For clothing insulation it was shown that effects of body motion and air movement are so big that they must be accounted for in comfort prediction models to be physically accurate. However, effects on dry heat exchange are small for stationary, light work at low air movement. Also algorithms for convective heat exchange in prediction models should be reconsidered. For evaporative heat resistance of the clothing worn, which is currently not an input factor in the PMV model, it was shown that in cases where special clothing with high vapor resistance is worn (e.g. clean-room clothing), comfort may be limited by the clothing as it will induce a high skin wetness. Thus, for such cases clothing vapor resistance should not be neglected in the calculation of comfort using the PMV model, or the induced skin wetness should be calculated separately. The effects on thermal comfort of reductions in vapor resistance due to air and body movements are also shown to have a substantial impact on the comfort limits in terms of skin wetness and cannot be neglected either. For metabolic heat production it was concluded that for precise comfort assessment a precise measure of metabolic rate is needed. In order to improve metabolic rate estimation based on ISO 8996, more data and detail is needed for activities with a metabolic rate below 2 MET. Finally, it was shown that the methods for determining metabolic rate provided in ISO 8996 (typically used in comfort assessment and evaluations) do not provide sufficient accuracy to allow determination of comfort (expressed as PMV) in sufficient precision to classify buildings to within 0.3 PMV units as proposed in the upcoming revision of ISO 7730.
The effects of gender, acclimation state, the opportunity to adjust clothing and physical disability on requirements for thermal comfort K.C. Parsons Human Thermal Environments Laboratory, Department of Human Sciences, Loughborough University, Loughborough, Leicestershire LE11 3TU, UK
DOI: http://dx.doi.org/10.1016/S0378-7788(02)00009-9 Abstract A program of laboratory studies into thermal comfort requirements is presented. Two studies used groups of 16 subjects over a range of conditions (warm to cool) to investigate the effects of gender over 3 h exposures in simulated living room/office environments. It was found that for identical levels of clothing and activity, there were only small differences in the thermal comfort

43
responses of male and female subjects for neutral and slightly warm conditions. For cool conditions, female subjects tended to be cooler than males. An experiment to investigate the effects of heat acclimation on thermal comfort requirements involved six male subjects providing thermal comfort responses in neutral and slightly warm environments over 2 days. They then carried out an acclimatization program over 4 days, for 2 h per day, exercising in a hot (45 °C, 40% relative humidity) environment. Thermal comfort responses were then recorded in two sessions over 2 days in identical conditions to the pre-acclimation session. It was found that changes in thermal comfort responses were small and likely to be of little practical significance. An investigation into the behavior of people to maintain thermal comfort by adjusting their clothing was conducted using eight male and eight female subjects. Seated subjects reduced or increased their clothing level by using a wardrobe of clothing that was familiar to them. It was found that subjects can adjust their clothing to maintain thermal comfort, but within limits. Upper limits (clothing off) will be determined by modesty and acceptability. Lower limits (clothing on) will be determined by clothing design and acceptability. A low air temperature limit of 18 °C in freely available clothing may provide a working hypothesis. A laboratory study of thermal comfort requirements for people with physical disabilities compared responses with those of people without physical disabilities. It was found that there are few group differences between thermal comfort requirements of people with and without physical disabilities. However, there is a greater necessity to consider individual requirements for people with physical disability.
Human response to combined indoor environment exposures Jørn Toftum International Centre for Indoor Environment and Energy, Technical University of Denmark, Building 402, Lyngby, Denmark
DOI: http://dx.doi.org/10.1016/S0378-7788(02)00010-5 Abstract Most thermal comfort standards and guidelines presume sedentary, light activity and a neutral overall thermal sensation when predicting local thermal discomfort. In addition, current standards specify criteria for separate aspects of the indoor environment, e.g. thermal climate, air quality or noise, with only little consideration of possible interactions between the different types of exposure. The studies summarized in this article found a clear impact of activity and overall thermal sensation on human sensitivity to air movement, whereas no interaction effects of exposure to several local thermal discomfort factors were observed. Limited evidence was found of significant interactions between different aspects of the indoor environment. Only for the effect of air temperature and air humidity on sensory air quality were well-established relationships available.
A comparative analysis of short-term and long-term thermal comfort surveys in Iran Shahin Heidari, Steve Sharples School of Environment and Development, Centre for the Built Environment, Sheffield Hallam University, Unit 9 Science Park, Howard Street, Sheffield S1 1WB, UK
DOI: http://dx.doi.org/10.1016/S0378-7788(02)00011-7 Abstract This paper describes two field studies of thermal comfort conducted in Ilam, a city located in western Iran. The first study consisted of two short-term surveys carried out during two

44
climatically extreme periods—a hot summer and a cold winter—in 1998. The second study consisted of a long-term survey that collected data throughout the whole of 1999. Both studies were performed in naturally ventilated buildings. This paper shows some comparative analysis between the findings from the short-and long-term studies. For the hot season the neutral temperatures from the short-and long-term studies were 28.4 and 26.7 °C, respectively. For the cold season the short-and long-term neutral temperatures were 20.8 and 21.2 °C, respectively. The results show a very good agreement between both studies in Iran. The main points of interest from the studies were the variability of acceptable conditions, a good relationship between neutral temperature and room temperatures and also, more importantly, between indoor comfort and outdoor conditions. The findings reveal that the people in the study could achieve comfort at higher indoor air temperatures compared with the recommendations of international standards such as ISO 7730.
Differences in perception of indoor environment between Japanese and non-Japanese workers Junta Nakanoa Shin-ichi Tanabea, Ken-ichi Kimurab a Department of Architecture, Waseda University, Waseda, Japan b Advanced Research Institute for Science and Engineering, Waseda University, Waseda, Japan
DOI: http://dx.doi.org/10.1016/S0378-7788(02)00012-9 Abstract Field surveys were conducted at an office with multinational workers in Japan to investigate the differences in the way groups of occupants perceive the environment under real working conditions. Returned questionnaires, 406 in total, were classified into three groups according to their nationality and sex. Only 26% of workers reported their working environment to be comfortable. A significant neutral temperature difference of 3.1 °C was observed between the Japanese female group and the non-Japanese male group under their usual working conditions. Japanese females reported a higher frequency of sick building syndrome related symptoms compared to other groups. Occupant comfort and reported frequency of SBS symptoms were closely related to deviation of the thermal sensation vote from neutral. The thermal environment was found to be a major factor affecting occupant comfort in the concerned office. Differences in the perception of the indoor environment were negatively affecting the ratings of their working environment.
Developing an adaptive control algorithm for Europe Kathryn J McCartney, J Fergus Nicol Oxford Centre for Sustainable Development, School of Architecture, Oxford Brookes University, Gipsy Lane Campus, Headington, Oxford OX3 0BP, UK
DOI: http://dx.doi.org/10.1016/S0378-7788(02)00013-0 Abstract An adaptive control algorithm (ACA) has been developed as an alternative to fixed temperature setpoint controls within buildings. This paper describes both the theory behind the ACA and the findings from an EU-funded research project, smart controls and thermal comfort (SCATs), from which the form of the ACA was developed. The ACA was also tested in two air-conditioned buildings as part of the SCATs project and the results are presented. The results show that use of

45
the ACA has potential for energy savings in the climate-control services of a building with no reduction in the perceived thermal comfort levels of that building’s occupants. Further refinement and testing of the ACA is required before it can be marketed.
Evaluation of thermal comfort using combined multi-node thermoregulation (65MN) and radiation models and computational fluid dynamics (CFD) Shin-ichi Tanabea Kozo Kobayashib Junta Nakanoa Yoshiichi Ozekib Masaaki Konishib a Department of Architecture, Waseda University, Tokyo, Japan b Asahi Glass Corporation, Research Center, Kanagawa, Japan
DOI: http://dx.doi.org/10.1016/S0378-7788(02)00014-2 Abstract The 65-node thermoregulation model was developed, based on the Stolwijk model. The model has 16 body segments corresponding to the thermal manikin, each consisting of four layers for core, muscle, fat and skin. The 65th node in the model is the central blood compartment, which exchanges convective heat with all other nodes via the blood flow. Convective and radiant heat transfer coefficients and clothing insulation were derived from the thermal manikin experiments. A thermoregulation model combined with radiation exchange model and computational fluid dynamics (CFD) is proposed. The comprehensive simulation method is described.
Sensory evaluation of heating and air conditioning systems Françoise Evin Edouard Siekierski Electricité de France, Research and Development Division, Les Renardières, 77818 Moret Sur Loing, France
DOI: http://dx.doi.org/10.1016/S0378-7788(02)00015-4 Abstract Existing standards and models, such as ISO 7730 or the work of Fanger [Thermal Comfort], are not sufficient to characterize the satisfaction and pleasantness of end-users provided by heating or air conditioning systems. For this reason Electricité de France (EDF) has initiated a project with the aim of using sensory evaluation techniques in the design of HVAC systems. Sensory evaluation has been used for more than 30 years in the food industry, and now involves the cosmetics, the phone and the automotive industries. It is based on a dual evaluation: Sensation measurements carried out by a small panel of trained expert assessors; Preference studies performed by a large panel of representative consumers. A correlation between the data of both studies is then used to explain the preferences in terms of sensations (preference mapping). The first experiments performed in 1999 and 2000 have provided lists of descriptors of thermal sensation and acoustic sensation associated with heating and air conditioning appliances. They show that it is possible to define discriminative descriptors, to train a panel and to reliably quantify these descriptors. It is then possible to draw the sensory profiles of different HVAC systems. The future experimental laboratory that EDF has decided to build is also presented, where the trained panels and end-users will evaluate the sensations and the preferences of real

46
systems in eight “realistic environmental chambers” designed, furnished and decorated like offices and flats.
Capabilities and limitations of thermal models for use in thermal comfort standards Byron W. Jones Institute for Environmental Research, Kansas State University, Manhattan, KS 66506, USA
DOI: http://dx.doi.org/10.1016/S0378-7788(02)00016-6 Abstract Thermal models of the human body and its interactions with the surrounding thermal environment are often proposed, and to some extent are used, as the basis for thermal comfort standards. These models range from simple, one-dimensional, steady-state simulations to complex, transient, finite element codes with thousands of nodes. The models are potentially very useful in that they provide a straightforward means to incorporate the numerous physical variables that affect comfort. Some models can be applied to complex situations which would be difficult, if not impossible, to reflect in simple charts or equations. Whether simple or complex, all of these models have limitations for use in standards. These limitations include the accuracy of the physical simulation and the accuracy of the inputs to the model. Perhaps, the biggest limitation is the accuracy with which comfort perceptions can be related to the physiological variables simulated in the thermal models.
Different aspects of assessing indoor and outdoor thermal comfort Peter Höppe Institute and Outpatient Clinic for Occupational and Environmental Medicine, Ludwig-Maximilians-University, Ziemssenstr. 1, D-80336 Munich, Germany
DOI: http://dx.doi.org/10.1016/S0378-7788(02)00017-8 Abstract As people spend most of their time indoors, steady state models may be appropriate for thermal comfort assessments there, while, for the relatively short times spent outdoors (mostly less than 1 h), those models tend to overestimate discomfort. This discrepancy is larger for cool outdoor conditions than for warm ones. For example, for a person leaving a room in thermal comfort (Tsk=33.5°C, Tcore=37°C) into cold winter outdoor conditions (Ta=Tmrt=0°C, VP=5 hPa, v=1 m/s) obtaining steady state will take many hours, while leaving into hot conditions (Ta=30°C, Tmrt=60°C, VP=15 hPa, v=0.5 m/s) it will be reached within less than 30 min. Consequently, especially for outdoor thermal comfort assessments in cold conditions, non-steady state models should be applied. This, among other new aspects, will be considered in a new internationally standardized Universal Thermal Climate Index (UTCI), which is currently being developed by a working group of the International Society of Biometeorology. Besides such physical/physiological approaches, psychological factors also have to be considered, i.e. diverging thermal expectations indoors and outdoors. Consequently, different approaches are necessary for assessing indoor or outdoor thermal comfort.
47
The validity of ISO-PMV for predicting comfort votes in every-day thermal environments Michael A Humphreys J Fergus Nicol School of Architecture, Oxford Brookes University, Gipsy Lane Campus, Headington, Oxford OX3 0BP, UK
DOI: http://dx.doi.org/10.1016/S0378-7788(02)00018-X Abstract One of the uses of ISO 7730 (predicted mean vote, PMV) is to predict the thermal sensations of people in buildings. This application is examined, using the ASHRAE database of field-studies. Taking these world-wide data as a single distribution, PMV is free from serious bias. There exist, however, underlying biases in relation to all contributing variables, and a further bias related to the outdoor temperature. These biases often combine to produce a substantial bias in PMV. In surveys of individual buildings, PMV often differs markedly and systematically from the actual mean vote, both for naturally ventilated (NV) and for air-conditioned (AC) spaces. Possible origins of the biases are discussed, and it is shown that it would be possible to modify PMV substantially to reduce them. Environmental consequences of the use of PMV are discussed. It is concluded that ISO 7730 in its present form can be seriously misleading when used to estimate thermal comfort conditions in buildings.

48
APPENDIX 2 – WINDSOR PAPER THAT ORIGINATED THIS DISCUSSION
Proceedings of Conference: Adapting to Change: New Thinking on Comfort Cumberland Lodge, Windsor, UK, 9-11 April 2010. London: Network for Comfort and Energy Use in Buildings, http://nceub.org.uk
Towards a Brazilian standard for naturally ventilated buildings: guidelines for thermal and air movement acceptability. Christhina Cândido1, 2, Roberto Lamberts1, Richard de Dear3 and Leonardo Bittencourt4
1 Federal University of Santa Catarina, Florianópolis – Brazil 2 Macquarie University of Sydney, Sydney – Australia 3 The University of Sydney, Sydney – Australia 4 Federal University of Alagoas, Maceió/AL – Brazil
*Corresponding author’s email: [email protected] Abstract
In 2001, Brazil suffered an electricity energy crisis as a result of meteorological conditions and poor strategic investments. One of the most important outcomes was the establishment of the energy efficiency law by the Federal Government, after long ten years of politic process. After this landmark event, the Brazilian Government has been promoting energy conservation initiatives including the Thermal Performance in Buildings – Brazilian Bioclimatic Zones and Building Guidelines for Low-Cost Houses (ABNT, NBR 15220-3, 2005) and the Federal Regulation for Voluntary Labeling of Energy Efficiency Levels in Commercial, Public and Service Buildings (Carlo and Lamberts, 2008). These new regulations summarize an immense effort in order to provide guidelines based on Brazil’s climate requirements for designers with specific items related to lighting systems, HVAC and building’s thermal envelope. Yet requirements for naturally ventilated indoor environments appear as an open category. This paper summarizes a first attempt in order to define guidelines for naturally ventilated environments in which specifications for thermal and air movement acceptability goals must be achieved.
Keywords: thermal acceptability, air movement acceptability, standard, natural ventilation, thermal comfort, energy conservation.
Introduction
The building sector potential in terms of energy conservation is a fact (IPCC, 2007). In order to achieve this, technical solutions are commonly indicated as the main mitigation path, such as insulation, cooling and heating systems, efficiency in appliances, etc. Behavioral change, however can deliver faster and long-lasting results. Baring this concept, designers are beginning to shift their attention to how they widen the range of the opportunities available in a building to provide comfort for occupants, both in new-build and retrofit contexts. This in turn has re-awakened an interest in the role of natural ventilation in the provision of comfort also in terms of regulations and standards worldwide (ASHRAE, 2004, van der Liden, 2006).

49
In Brazil, where there is a broad range of climatic differences, the idea of a unified standard that takes into consideration both technical and behavioral issues is a challenge. Much of Brazil’s territory is classified as having a hot humid climate. In such regions, natural ventilation combined with solar protection are the most effective building bioclimatic design strategy in order to improve thermal comfort by passive means. Despite these favorable conditions, the number of buildings relaying in active systems as the main cooling design strategy continues increasing inexorably.
In 2001, Brazil suffered an electricity energy crises as a result of meteorological conditions (lack of rain for the hydroelectricity based system) and poor strategic investments (transmission lines and backup generation plans). As consequence, the imposed consumption reduction was 20% for all country and some of this reduction became permanent as a result of government actions and population engagement (Lamberts, 2008). One of the most important outcomes was the establishment of the energy efficiency law by the Federal Government, after long ten years of politic process.
After this landmark event, the Brazilian Government has been promoting energy conservation initiatives including the Thermal Performance in Buildings – Brazilian Bioclimatic Zones and Building Guidelines for Low-Cost Houses (ABNT, NBR 15220-3, 2005) and the Federal Regulation for Voluntary Labeling of Energy Efficiency Levels in Commercial, Public and Service Buildings (Carlo and Lamberts, 2008). These new regulations summarize an immense effort in order to provide guidelines based on Brazil’s climate requirements for designers with specific items related to lighting systems, HVAC and building’s thermal envelope. Yet requirements for naturally ventilated indoor environments appear as an open category. This paper summarizes a first attempt in order to define guidelines for naturally ventilated environments in which specifications for thermal and air movement acceptability goals must be achieved.
Revisiting Brazilian energy efficiency initiatives
The energy matrix in Brazil is based mainly on hydroelectricity but there was a considerable increase in coal usage during the recent years (Ministério de Minas e Energia, 2007). Investments in a more sustainable energy matrix are essential for a developing country like Brazil, however it is important to bear in mind that there are other areas needing scarce financial resources such as educational and health programs. Therefore investments cannot be wasted and there ample opportunities for energy conservation.
Based upon this, the Federal Government released a National Policy of Conversation and Rational Use of Energy focusing on energy efficient buildings and equipment. Despite de fact that these actions were mainly focused on electricity use, its impact was undoubtedly significant considering that 23% of the hydroelectricity is dedicated to commercial and public buildings and approximately 22% to residential sector (Ministério de Minas e Energia, 2007). Among the several actions on energy efficiency promoted by the Brazilian government there are two that might be highlighted: design guidelines for residential sector and the labeling system for commercial buildings.
For the residential sector the “Thermal performance in buildings – Brazilian Bioclimatic Zones and Building Guidelines for Low-Cost Houses” (ABNT, NBR 15220-3, 2005) is the main reference. The requirements were related to thermal envelope, lighting and acoustics, along with minimum requirements for ventilation and opening areas. Currently the energy efficiency labeling for residential buildings is in progress and it will be made public later in 2010. One important contribution of this document was the definition of bioclimatic zones and Figure 1

50
shows their definitions. Eight zones were defined according to its climate characteristics from 330 cities across Brazil. Based upon this division, a set of specific bioclimatic design strategies was indicated focusing its application during the early design stage.
For commercial and public buildings, there is a newly released “Federal Regulation for Voluntary Labeling of Energy Efficiency Levels in Commercial, Public and Service Buildings”. This new regulation is based on a study focusing on Brazil’s climate requirements for designers in general with specific items related to lighting system, HVAC and building envelope. In similar fashion to the residential sector, the eight bioclimatic zones and design strategies are intended as a reference for designers and architects. Currently it is voluntary but it will become mandatory in 2013 with scheduled reviews every 5 five years (Carlo and Lamberts, 2008).
Figure 1. (a) Bioclimatic zoning and (b) bioclimatic chart (ABNT, NBR 15220-3, 2005).
Figure 2 shows different bioclimatic strategies and recommended ventilation pattern for zones 1 to 8. Three different patterns for natural ventilation are provided. The first is “cross ventilation” which is self-explanatory, indicating necessity of airflow through the indoor environments for Zones 2, 3 and 5. The second one is called “selective ventilation” and its application is specific during warmer seasons and/or when the indoor temperature is superior to the outdoor temperature for Zones 4, 6 and 7. The third and last pattern is “permanent” ventilation and it is suggested to Zone 8 where there is the strongest dependence on natural ventilation for occupants’ thermal comfort. The only bioclimatic zone where ventilation is not indicated is the number 1, corresponding to the coldest regions.

51
Figure 2. Bioclimatic design strategies and ventilation pattern for different zones (ABNT, NBR 15220-3, 2005).
These two regulations were an important contribution for energy efficiency in buildings and it will be possible to quantify this within the next years. These regulations established a consistent amount of technical information about building’s thermal envelope. In terms of naturally ventilated environments, however, there is a gap willing to be fulfilled. Naturally ventilated buildings receive high incentives as far as it is proved that they provide thermal comfort to the occupants. Natural ventilation is frequently associated with a strong concern about airflow distribution in indoor environments, hence the recommendations related to opening areas and ventilation pattern (ABNT, NBR 15220-3, 2005). This is also the traditional reference for regional buildings’ codes all over Brazil. These requirements are undoubtedly a contribution to occupant’s thermal comfort but a more accurate relationship with thermal indoor environments is necessary. Thermal acceptance in general is not completely fulfilled in existing regulations. Field experiments developed in Brazil offer more insight into this necessity and will be presented in the next section of this paper. Considering that natural ventilation is indicated in seven of the eight bioclimatic zones in Brazil, a set of standards that focuses on air movement enhancement in combination to thermal comfort is therefore necessary.
Adapting a model for Brazilian occupants
1. Field experiments’ evidence
Based on the wide range of climate conditions found in Brazil, differences in terms of thermal acceptance is not surprising. Previous studies attempted to understand the limits for temperature in which occupants would consider as acceptable in naturally ventilated buildings.

52
As expected, there is a significant variation in terms of acceptable temperatures. For instance, in the South of Brazil, acceptability can be found in a range from 14 to 24°C (Xavier, 2000; Lazarotto et al, 2007) while in the Northeast these values can be easily extended from 24.5 to 32°C without however compromising occupants’ thermal comfort (Araújo,1996).
Figure 3 shows results from different field experiments. The red dots represent results from the experiments and it is possible to see minor discrepancies in relation to the model. Adaptive opportunities played a major role in these thermal environments particularly by means of clothing adjustments (Lazarotto et al, 2007; Andreasi et al, 2010) and air movement enhancement, especially by use of fans (Gonçalves, 2001). It is noticeable that the range of temperatures that were found as acceptable for occupants felt in similar range predicted by the adaptive model (de Dear and Brager, 1998).
Figure 3. Thermal acceptability for naturally ventilated buildings (after de Dear and Brager, 1998).
Interestingly, discrepancies were found also related to occupant’s adaptive opportunities, again here in terms of clothing insulation (Ruas, 1999; Andreasi, 2001) and air movement (Araújo, 1996, Cândido et al, 2010). In the first case, the main complains are derived from the degree of freedom within the dress code (Andreasi, 2009) and, conversely, occupants were satisfied with a flexible one (Lazarotto et al, 2007). The second case, occupant’s complains were related to the preference for more air movement (Cândido et al, 2010), especially for the hot humid zone, where there is the strongest demand for higher air velocities. This demand was more noticeable for operative temperatures above 26°C (Araújo, 1996; Andreasi et al, 2010; Gonçalves, 2001). In addition to higher air velocities values, occupants also appreciated having control over fans as complementary source of ventilation, especially for periods without breeze. Ceiling fans tend to be a useful device in order to increase air movement for these occupants (Gonçalves, 2010).
Based upon these results, occupants in naturally ventilated buildings (i) accept temperature swings during the day and year, (ii) prefer higher air velocities if (iii) control and fans are provided. These results can be easily related to the three categories of responses that occupants undertake in order to reestablish thermal comfort summarized by de Dear et al (1997): behavioral, physiological and psychological adaptation.

53
2. General requirements
The general guidelines suggested in this paper are related to naturally ventilated environments and it comprises two main items: adaptive capacity opportunities and acceptable indoor conditions, including specific requirements for thermal and air movement acceptability. This is a first attempt in order to provide indicators and start a discussion about future standard for naturally ventilated buildings in Brazil.
General requirements are related to occupant’s activities and adaptive opportunities regarding specifically openings and control over fans. Occupants must be developing sedentary activity (1.0 to 1.3 met) for at least thirty minutes and they must be able to actively modify their thermal indoor environment at least in terms of garments and openings.
Windows must be accessible and controllable primarily by the occupants and they might be combined fans in order enhance air velocity. In addition, specific requirements will be determined in terms of number of occupants and their access to control of fans.
i. Adaptive capacity potential
Into this section, buildings will be assessed in terms of their “adaptive capacity potential” (Kwog and Rajkovich, 2010). The adaptive potential can be defined as “ a design approach that relies on an implicit understanding of the ecological and physical context of the site, orientation, site planning, passive heating and cooling design strategies, openings in the envelope for optimal daylighting; natural ventilation, shading, insulation, and envelope strategies” (Kwog and Rajkovich, 2010). Buildings’ design must be in compliance with bioclimatic strategies for its specific zone. The following items will be assessed as minimal design requirements in order to be in accordance to the adaptive capacity potential:
Orientation;
Site planning;
Bioclimatic design strategies applied according to specific zone;
Openings design: location, dimension and detailed information of its operability;
Complementary devices for ventilation enhancement: wind catchers, ventilated sills, pergolas, verandahs, etc) in combination with daylighting and shading systems;
Complementary mechanical devices i.e. ceiling and/or desk fans and its distribution inside indoor environment and occupants control (individual or group).
There will be no grading of adaptive capacity potential and all buildings must provide design evidences of at least the above-mentioned strategies. In this level, buildings will be assessed in a qualitative way, in order to offer the highest adaptive opportunities potential for occupants of these thermal environments. Buildings complying with this item will be considered for subsequent analysis regarding acceptable indoor conditions.
ii. Acceptable thermal conditions
A combination of thermal and air movement acceptability will be considered in order to evaluate thermal indoor environmental conditions. The following items will provide more details about these requirements.

54
a. Indoor operative temperatures
The acceptable thermal conditions applied will be established according to the adaptive model (de Dear and Brager, 1998). Allowable indoor operative temperatures will be presented as a variation of mean monthly outdoor temperatures and it was based on field experiments carried out in different regions in Brazil presented before in Figure 2. Thermal acceptability goals will be 80 and 90%. Extensions of the neutral temperature will be of ±2.5°C for 90% of thermal acceptability and ±3.5°C for 80% of thermal acceptability. Specific air movement requirements will be necessary for operative temperatures higher than 26°C. Minimal air velocity values will be required and complementary mechanical cooling devices will be requested. These complementary requirements aim to enhance adaptive opportunities for the occupants into these environments.
b. Air movement
Air velocity values are recognized as one of the essential variables to improve occupant’s thermal comfort and it has been considered in comfort standards worldwide. Typically, maximum limits are established in order to avoid dissatisfaction, especially due draft. This might be true in cold climates, but questionable for warm environments (Arens et al, 1998, Khedari et al, 2000, Tanabe and Kimura, 1989, Zhang et al, 2007). This discussion has been revived due to occupant’s complaints, often related to preferences for “more air movement” (Toftum, 2004, Zhang et al, 2007). Revisions to limits have been proposed considering also more specific requirements for occupant’s control (Arens et al, 2009).
For this Brazilian standard, air movement acceptability must be considered and the target values will be for 80 and 90%. In order achieve these targets indoor environments must fulfill minimal air velocity requirements according to Figure 4. The air velocity requirements must be achieved during the occupied period. For operative temperatures higher than 26°C, complementary ventilation will be required.
Figure 4. Minimal values for air velocity corresponding to 80 and 90% air movement acceptability.
Complementary ventilation can be achieved by use of fans and are encouraged in order to supply airflow for occupants especially during periods of absence of exterior wind or/and areas with
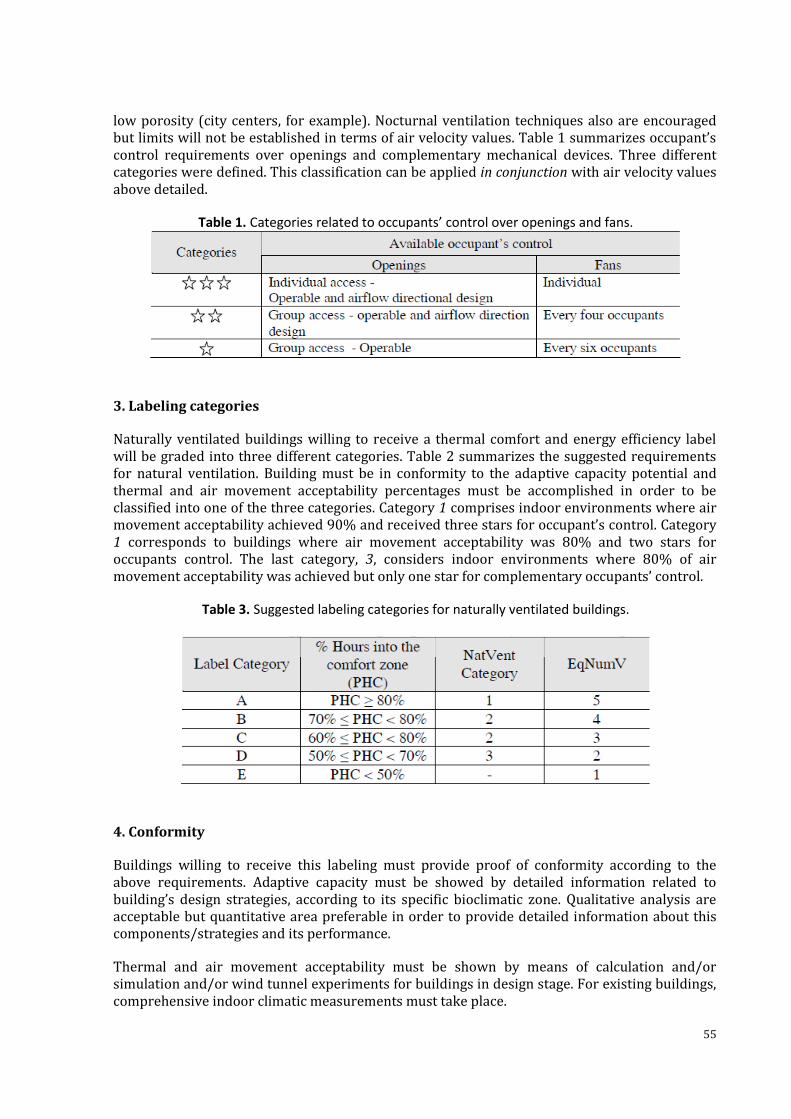
55
low porosity (city centers, for example). Nocturnal ventilation techniques also are encouraged but limits will not be established in terms of air velocity values. Table 1 summarizes occupant’s control requirements over openings and complementary mechanical devices. Three different categories were defined. This classification can be applied in conjunction with air velocity values above detailed.
Table 1. Categories related to occupants’ control over openings and fans.
3. Labeling categories
Naturally ventilated buildings willing to receive a thermal comfort and energy efficiency label will be graded into three different categories. Table 2 summarizes the suggested requirements for natural ventilation. Building must be in conformity to the adaptive capacity potential and thermal and air movement acceptability percentages must be accomplished in order to be classified into one of the three categories. Category 1 comprises indoor environments where air movement acceptability achieved 90% and received three stars for occupant’s control. Category 1 corresponds to buildings where air movement acceptability was 80% and two stars for occupants control. The last category, 3, considers indoor environments where 80% of air movement acceptability was achieved but only one star for complementary occupants’ control.
Table 3. Suggested labeling categories for naturally ventilated buildings.
4. Conformity
Buildings willing to receive this labeling must provide proof of conformity according to the above requirements. Adaptive capacity must be showed by detailed information related to building’s design strategies, according to its specific bioclimatic zone. Qualitative analysis are acceptable but quantitative area preferable in order to provide detailed information about this components/strategies and its performance.
Thermal and air movement acceptability must be shown by means of calculation and/or simulation and/or wind tunnel experiments for buildings in design stage. For existing buildings, comprehensive indoor climatic measurements must take place.
56
Simulations/experiments must represent:
Indoor operative temperature ranges within the thermal comfort zone;
Air velocity values and airflow distribution within the occupied zones.
Air velocity provided by the complementary mechanical devices and occupant’s control pattern applied;
Complete plans, descriptions, detailed information for maintenance and operation must be provided and kept during building’s life occupancy.
Identification and distribution of all mechanical cooling devices must be indicated and detailed, especially in terms of occupant’s control.
Field experiments must be in compliance with the minimal requirements specified into the measurement protocol detailed in this guideline. In this document, the method will be described including step-by-step measurement procedures, instrumentation and questionnaires. Indoor environmental data must consider, but not be limited to air temperature, mean radiant temperature, humidity, air speed, outdoor temperature, occupants’ clothing and activity. More detailed information will be provided in the guidelines.
Conclusions
This paper presented guidelines for a Brazilian standard for naturally ventilated buildings. The main variables of indoor environmental quality considered in these guidelines were a combination of thermal and air movement acceptability. Based upon this, operative temperature ranges were based on the adaptive model and minimal air velocity requirements were also determined. Specific occupant’s control over openings and fans were also considered. Finally, an energy conservation labeling system was proposed.
This is a first attempt to combine guidelines for naturally ventilated buildings in Brazil and more detailed information is therefore necessary. Future comfort field experiments will be undoubtedly a crucial source of information for further refinements of these guidelines.
However, there are enough indications that providing occupants with control and requiring an active behavior over passive design techniques will be a successful path towards more healthy, stimulating and sustainable buildings in Brazil.
References
ABNT, NBR 15220-3 – Desempenho térmico de edificações – Parte 3: Zoneamento bioclimático brasileiro e diretrizes construtivas para habitações unifamiliares de interesse social, 2005, 23 pp.
Andreasi, W. (2001). Avaliação do impacto de estratégias bioclimáticas na temperatura interna no Passo do Lontra, Pantanal do estado de Mato-Grosso do Sul. MPhil thesis. Federal University of Santa Catarina, Florianópolis, 2001. 134pp.
Andreasi, W. Lamberts, R. Cândido, C. (2010) Thermal acceptability assessment in buildings located in hot humid regions in Brazil. Building and Environment, V.45, 1225-1232.

57
Araújo, V. M. D. de (1996) Parâmetros de conforto térmico para usuários de edificações escolares no litoral nordestino brasileiro. PhD thesis. University of São Paulo, São Paulo, 1996. 179pp.
Arens E. A., Xu T, Miura K, Zhang H., Fountain M.E., Bauman F. (1998) A study of occupant cooling by personally controlled air movement. Build Energy 27:45–59.
Arens, E., Turner, S., Zhang, H., Paliaga, G. (2009) Moving air for comfort. ASHRAE Journal, 2009, pp. 18-29.
ASHRAE (2004). Standard 55: Thermal environmental conditions for human occupancy. ASHRAE: Atlanta.
Cândido, C., de Dear, R., Lamberts, R., Bittencourt, L. S. (2010) Air movement acceptability limits and thermal comfort in Brazil's hot humid climate zone. Building and Environment, V.45, pp. 222-229.
Cândido, C., de Dear, R., Lamberts, R., Bittencourt, L. S. (2010) Cooling exposure in hot humid climates: are occupants “addicted”? Architectural Science Review, V.53, pp 1-6.
Carlo, J., Lamberts, R. (2008) Development of energy efficiency labels for commercial buildings: Effects of different variables on electricity consumption. Energy and Buildings 40: p 2002-2008.
de Dear, R.J. and Brager, G.S. (2002).Thermal comfort in naturally ventilated buildings: revisions to ASHRAE Standard 55, Energy and Buildings 34 (2002) (6), pp. 549–561.
de Dear, R., Brager, G., Cooper, D. (1997). Developing an Adaptive Model of Thermal Comfort and Preference: Final Report ASHRAE RP-884 Project. Available online: http://sydney.edu.au/architecture/documents/staff/richard_de_dear/RP884_Final_Report.pdf.
Gomes, C. H. de G. (2003) Análise dos níveis de conforto térmico em um edifício de escritórios na cidade de Maringá. MPhil thesis. Federal University of Santa Catarina, Florianópolis, 2003. 129pp.
Gonçalves, W., Valle, R. M. Garcia, E. S., O papel de mecanismos adaptativos no conforto térmico de estudantes universitários em Belo Horizonte – MG. ENCAC 2001, São Pedro – SP, Brazil. pp. 1 – 8.
Goulart, S, Lamberts, R., Firmino, S. (1997) Dados climáticos para projeto e avaliação energética em edificações para 14 cidades brasileiras, Florianópolis, 1997, 345 pp.
Ho, S.H., Rosario, L., Rahman, M.M. (2009) Thermal comfort enhancement by using ceiling fan. Applied Thermal Engineering, V 29, pp. 1648-1656.
IPCC. Summary for policymakers. In: Metz B, Davidson O, Bosch P, Dave R, Meyer L, editors. Climate change 2007: mitigation of climate change. Contribution of working group III to the fourth assessment report of the intergovernmental panel on climate change. Cambridge, United Kingdom and New York, NY, USA: Cambridge University Press; 2007.

58
Khedari, J., Yamtraipt, N., Prantintong, N., Hirunlabh, J. (2000) Thailand ventilation comfort chart. Energy and Buildings, V.32, pp 245-249.
Kwok, A. Rajkovich, N. B. (2010). Adressing climate change in comfort standards. Building and Environment V.45, pp. 18-22.
Lamberts, R. (2008). Trends in Brazilian building ventilation market and drives for change. Ventilation Information Paper V23, pp. 1-4.
Lazarotto, N. Santos, J. C. P. (2007) Avaliação do conforto térmico de estudantes do ensino fundamental na região noroeste do RS. ENCAC 2007, Ouro Preto – MG, Brazil. pp.1038 – 1046.
Lei n. 10295, de 17 de outubro de 2001: Dispõe sobre a Política Nacional de Conservação e Uso Racional de Energia, Diário Oficial da União, Brasília, 2001, available at www.inmetro.gov.br/qualidade/lei10295.pdf, access on: March 17, 2003.
Ministério das Minas e Energia, Balanço Energético Nacional, 2007, available at http://www.mme.gov.br, access on: 25 January, 2010.
PROCEL, Plano de ação para eficiência energética em edificações, Eletrobrás, Rio de Janeiro, 2003, 39 pp.
Roriz, M., Ghisi, E., Lamberts, R. (1999) Bioclimatic zoning of Brazil: A proposal based in Givoni and Mahoney methods. Sustaining the Future: Energy, Ecology, Architecture: Plea '99 - the 16th International Conference Plea (Passive and Low Energy Architecture). pp. 211 – 217, PLEA International, Brisbane, Australia.
Ruas, A. C. (1999) Avaliação de conforto térmico: Contribuição à prática das normas internacionais. MPhil thesis. State University of Campinas, Campinas, 1999.78pp.
Tanabe S, Kimura K (1989) Thermal comfort requirements under hot and humid conditions. Proceedings of the First ASHRAE Far East Conference on Air Conditioning in Hot Climates, Singapore, ASHRAE, 3–21.
Toftum, J. (2004). Air movement – good or bad? Indoor Air: 14, pp. 40-45.
Xavier, A. A. de P. (1999) Condições de conforto térmico para estudantes de 2° grau na região de Florianópolis. MPhil thesis. Federal University of Santa Catarina, Florianópolis, 1999. 197pp.
van der Linden, A.C., Boerstra, A.C., Raue, A.K., Kurvers, S.R., de Dear, R.J. (2006) Adaptive temperature limits: A new guideline in The Netherlands. A new approach for the assessment of building performance with respect to thermal indoor climate. Energy and building, v38 pp 8-17.
Xavier, A.A. de P. (2000) Predição de conforto térmico em ambientes internos com atividades sedentárias – teoria física aliada a estudos de campo. PhD thesis. Federal University of Santa Catarina, Florianópolis, 2000. 251pp.
Zhang, H., Arens, E., Fard, S. A., Huizenga, C., Paliaga, G., Brager, G., Zagreus, L. (2007) Air movement preferences observed in office buildings. Int J Biometeorol: 51, 349 – 360.

59
APPENDIX 3 – LIST AND ABSTRACT OF ASHRAE RESEARCH REPORTS ON
THERMAL COMFORT
3 Oct 2012, 4:10:36 GMT Searched for: Thermal comfort Results 1 - 40 of 40. Search took 0.20 seconds. Sort by: Highest Rank First | Lowest Rank First Page 1 of 1 Results per page: 5 | 10 | 20 | 50 RP-243 -- Interaction of the Visual and Thermal Environment on the Comfort and Acceptance of Indoor Space [Relevance: 3.40]. The effect of color, (orange, blue) lighting (daylight, cool-white, warm-white) and wall treatments (light or dark) on thermal comfort was determined for 432 control subjects who were exposed in an environmental chamber which was devoid of these features and for 432 experimental subjects who were exposed in the same chamber after it had been modified to simulate an open landscape office. Two temperatures were involved, 68 FET* and 78 FET* and the exposure was for 3 hours. Skin temperatures were measured and affective responses were recorded on a thermal sensation scale and a thermal comfort scale that was developed from this study. The results showed that the thermal sensation is not affected by the "starkness" or "richness" of the surrounds, however, thermal comfort was greater in the "rich" environment than in the stark environment. Thermal comfort also was greater in the orange work stations then in the blue work stations. In addition, in a cooler-than-comfortable temperature, lighting with a warm-white fluorescent lamp created a more comfortable environment then lighting with a cool-white lamp. When the environment was illuminated with a cool-white or daylight fluorescent lamps preference was expressed for a warmer temperature and when the environment was illuminated with warm-white lamps, there was a tendency to prefer a cooler temperature. The greatest amount of comfort was experienced in the orange work station when the walls were dark. Because of these results, simulating real-world settings in the laboratory is suggested as the preferred approach for measuring thermal comfort. RP-194 -- Thermal Comfort Following Discrete Exposures of Different Durations to three Thermal Conditions [Relevance: 3.00]. Thermal comfort is defined as that condition of mind that expresses satisfaction with the thermal environment. Similarly, a thermal sensation is defined as a conscious experience resulting from exposure to a class of variables making up the thermal environment. This project describes two experiments to test thermal comfort. In some of the experiments subjects are dressed in uniform clothing and enter an environmental chamber whose thermal conditions are systematically varied. In other studies, the subjects increase or decrease one of the environmental constituents (dry bulb temperature) until they feel comfortable. But regardless of the procedure, neither of these designs examines the environmental antecedents or events and conditions that occur prior to the exposure. Moreover, from what we know about the subtleties of the affective thermal response, it is not at all unlikely that one or more of these factors may affect the subsequent responses of the subjects while in the environmental chamber. Because of this, the present study was undertaken with the purpose being to examine the effects of environmental antecedents on comfort. In the first study, the effects of earlier exposure to different temperatures were studied, and in the second study the effects of the room decor on comfort was investigated.

60
RP-1071 -- Methodology to Incorporate the Effect of Wavelength Dependency of Thermal and Optical Properties of Window Glass into In-Space Thermal Comfort Calculations [Relevance: 2.40]. Thermal comfort is affected by several environmental components, namely radiant asymmetry, air temperature, relative humidity, and air motion. Earlier research resulted in a methodology that incorporates mean radiant temperature into thermal comfort calculations. This steady-state methodology, referred to as the Building Comfort Analysis Program (BCAP), predicts the effect of radiative and convective heat transfer rates on the occupant based on design inputs of room geometry, radiative and convective heating systems, and outdoor design conditions, but does not include the complete effect of windows on thermal comfort predictions. The objective of this research project is to develop a window model that accurately accounts for the transmission of long and short wave radiation from low and high temperature radiant heaters. The objective is to develop a stand-alone model that can be implemented in a variety of modular energy programs. The methodology, similar in scope to the BCAP methodology, will be used to incorporate the effect of window glass wavelength dependency on human thermal comfort calculations. The methodology must consider the wavelength dependency of glass, as well as the temperature of the energy source. The methodology should incorporate the effect of window transmissivity into the calculated mean radiant and operative temperature fields throughout a room as a function of time and space, and include the effects of room geometry, outdoor temperature conditions, and the size and location of radiative and convective heating systems. RP-198 -- Optimizing Thermal Transients for Comfort and Energy Use [Relevance: 2.40]. In order to determine the effect of cyclical temperature fluctuations on thermal comfort, 804 subjects were exposed to various basal temperatures (64, 67, 73, 79 and 85° FET*) which fluctuated at different amplitudes, A, (2, 4, 6, 8 and 10°F) at rates of 2, 4, 6, and 8°F/hr. From their responses, equations were developed which enabled the prediction of the thermal sensation votes at the high and low points of the cycle both when the temperatures were increasing and decreasing from the basal condition. The results showed that in order to achieve thermal comfort, the basal temperatures should range from 72°F, (A = 2°F; initial rate: +/-2°F/hr) to 82°F, A = 2°F, initial rate: +/-6°F/hr); the conditions most conducive for comfort were 74°F, A = 2°F, rates: 2, 4, 6°F/hr; 76°F, A = 2°F and 4°F, rates: 2, 4 and 6°F/hr; and 78°F, A - 28F and 4°F, rates: 2, 4, and 6°F/hr. The equations were also used to predict the thermal sensations under ramp conditions. For achieving comfort under ascending ramps the basal temperature should range from 70°F to 80°F with the most acceptable being 70°F, 72°F, and 74°F at the rate of l°F/hr. For decreasing ramps, the basal temperature should range from 88°F to 72°F with the most acceptable being 84°F, 82°F, 80°F, and 78°F at a rate of -l°F/hr. The major finding of the study showed that a thermal sensation cannot be associated with a given temperature condition unless we define "how" in terms of time, the subjects arrived at that temperature; by this is meant, a fast temperature rise to a particular temperature results in a thermal sensation that is different from one resulting from a slow rise. Moreover, the same temperature may be related to as many as three sensation votes, depending on the temporal dimension involved in reaching that temperature. RP-503 -- Impact of Air Humidity on Thermal Comfort during Step Changes [Relevance: 2.20]. Current standards on conditions for human thermal comfort assign relatively low importance to humidity in the comfort zone. However such standards are intended for use only in steady-state conditions. Humidity transients can be expected to have much larger impacts on thermal comfort because of changes in moisture content and associated heats of absorption and desorption in the skin and clothing layer. The behavior of no hygroscopic polyester and

61
hygroscopic wool clothing ensembles during humidity step-changes and the associated impacts on the dry heat exchanges of the wearer were examined with a thermal manikin. Two adjacent climate chambers, one with 20%, the other with 80% RH, and both with 25°C operative temperature were used for this purpose. Woolen ensembles absorbed or desorbed up to 110g of moisture two hours after a humidity step, whereas the polyester ensembles absorbed or desorbed less than 6g under the same conditions. These large changes of woolen fiber regain were associated with sorption heats that significantly changed the dry-heat balance of the thermal manikin by up to 66 kJ/m two hours after the humidity step-change. This heat-loss effect experienced by the manikin represented about 40% of the total sorption heat being evolved/required in the wool clothing. Humidity step-change experiments were also conducted with 12 human subjects going between 20% and 80% RH or vice versa. Weight changes, rectal temperatures, and mean skin temperatures were recorded continuously from two of the subjects, while thermal sensations were monitored continuously from the whole sample. Clothing consisted of two wool and two polyester ensembles, one each at 0.6 and 1.0 clo insulation. Experiments with nude subjects were also conducted as control studies. RP-885 -- Responses of Disabled Persons to Thermal Environment [Relevance: 1.80]. Many studies on thermal comfort have been carried out throughout the world. However, these studies concern a homogeneous population with similar physical characteristics (neither ill nor old). Age, race, habits, health, origin, are some parameters which must be taken into account when the thermal comfort of the human body is considered. Increasing concern over thermal comfort for persons with physical disabilities has been put to light by many health care professionals. A brief review of the different types of thermal comfort predictive models has been carried out. A critical literature review is followed by a comparative study of the results collected from different experimental studies and the ASHRAE Standard 55. RP-821 -- Field Study of Occupant Comfort and Office Thermal Environments in a Cold Climate [Relevance: 1.80]. This report presents the findings of ASHRAE research project RP-821; a field study of occupant comfort and office thermal environments in 12 mechanically ventilated office buildings in southern Quebec. This study is the third of a series of ASHRAE projects (RP-462 and RP-702) which investigated the indoor environment in temperate and hot-humid climates. A total of 877 subjects were surveyed during the hot summer months of June, July, and August and the cold winter months of January, February, and March. Each interview provided a set of responses to a questionnaire and a set of physical indoor climatic measurements (from mobile instrumentation). Metabolic rate and clothing insulation estimates were based on the methods of ANSI/ASHRAE Standard 55-92. Since all subjects were seated, the incremental effect of chairs was included in the clo value estimates. The measured and calculated thermal environmental results were compared with the ANSI/ASHRAE Standard 55-1992 and with the ISO 7730 guidelines. Thermal neutrality, thermal preference, and thermal acceptability results were compared with existing models (laboratory-based) and standards. Gender, ethnicity, season, length of residence in Canada, health, and acclimatization were examined as to their effect on thermal response to the indoor climate. Job satisfaction and perceived levels of environmental control were also examined with respect to subjective assessments of indoor climatic conditions. Thermal neutrality on the ASHRAE seven-point sensation scale occurred at about 24.1°C in the summer/hot season and at about 22.8°C in the winter/cold season. The preferred temperature was 23°C in the summer/hot season and 22°C in the winter/cold season. Direct assessments of thermal acceptability peaked at 90% and fell at 23°C. These observed temperature optima are somewhat consistent with the predictions of comfort models and standards based on mid-latitude climate chamber experimental data. They differ by as much as -2°C from the earlier Townsville project's findings, yet are relatively similar to those from the yet earlier San Francisco project's findings. Most of this offset can be explained by differences in clothing. The

62
Montreal subjects' thermal sensation and acceptability ratings were much less accepting of non-neutral temperatures than either PPD index or Standard 55 predicted. The only exception is for the operative temperature range of 22 - 24°C, where the PPD index matched the direct acceptability vote by the subjects. About 14 - 18 % of the Montreal subjects who were exposed to thermal environments within the ANSI/ASHRAE Standard 55's summer and winter comfort zones expressed thermal dissatisfaction, whereas the Standard's margins correspond to only 10 % whole-body thermal dissatisfaction. About 1 to 3 % of those expressing dissatisfaction experienced uncomfortable vertical temperature gradients. However, there was a consistent request for higher air velocity (55 to 89%). RP-1162 -- Window Performance for Human Thermal Comfort [Relevance: 1.60] Anyone who has ever sat near a cold window on a winter day or in direct sunlight on a hot day recognizes that windows can cause thermal discomfort. In spite of this broad recognition there is no standard method to quantify the extent of such discomfort. The purpose of this study was two: firstly, review the literature to identify relevant work relating to windows and thermal comfort; secondly, develop an improved understanding of the impact of windows on thermal comfort and to propose an analytical method for evaluating this impact. The method could form the basis for a future NFRC window comfort rating method that could be used by both designers and consumers. RP-1037 -- Development of a Simplified Methodology to Incorporate Radiant Heaters Over 300°F into Thermal Comfort Calculations [Relevance: 1.60]. ASHRAE Standard 55-92 defines thermal comfort conditions for several applications; however, there is no information about thermal comfort delivery calculations or sizing for high temperature radiant heater applications. The use of high temperature radiant heaters is becoming common, yet practical sizing and performance calculation tools are not available to the designer. Such information is essential to meeting governmental guidelines and standards as well as to provide information to meet building and design performance contracts. The objective of this research project is to develop a simplified methodology to effectively model the thermal comfort delivered by high temperature radiant heaters. The methodology will be capable of calculating the mean radiant and operative temperature fields throughout a room as a functional space, include the effects of room geometry, outdoor temperature conditions, and the size and location of radioactive and convective heating systems. The radiant heat transfer calculations will build on the methodology developed in 657-RP or an equally accurate new methodology. RP-921 -- Field Study of Occupant Comfort and Office Thermal Environments in a Hot Arid Climate [Relevance: 1.60]. This project is an extension of similar projects (ASHRAE 462-RP, 702-RP, and 821-RP) carried out in 1986-95 under the supervision of TC 2.1. All three projects measured the indoor thermal environments and occupant responses to those environments in office buildings in moderate, hot-humid and cold climate regions respectively. The measurements were repeated in summer and winter, resulting in several types of information. These were: typical conditions in modern offices, the match of the ASHRAE Std 55-81 comfort zone and of various comfort indices to occupant comfort perceptions, the effect of season change on comfort requirements, and a range of other physical and psychological attributes affecting the occupants' acceptance of the work environment. To accomplish this, the projects, developed protocols for measuring the detailed physical environment of the occupants' workstations, and for surveying the occupants for their opinions and relevant personal data. The objective of this research is to provide information on office thermal environments and occupant response in a climate with a hot dry summer, with four or more months having normal (average) daily maximum temperatures at or above 25.5C (78F) and morning relative humidity below 40 per cent. The winter conditions could be hot, temperate, or cold, depending on the region. To allow intercomparison with studies in other

63
climate regions, the study should at a minimum follow the methods used for measurement and analysis in the earlier studies. Principal Investigator: Kris Cena, Murdoch University. Conducted: January 1997 - October 1998
RP-98 -- Field Evaluation of High- Intensity Infrared Spaces Heating Systems [Relevance: 1.60]. The primary objective of this program was to measure the performance of high-intensity, electric and gas-fired infrared space heating systems in order to determine thermal comfort level, and energy consumption to confirm the conclusions of ASHRAE Research Project RP-41. Briefly stated the conclusions of RP-41 are as follows: 1. For environmental conditions with varying ambient temperatures and radiant heat, comfort may be described by the operative temperature; 2. Comfort is not described by any single temperature level, but usually falls in a wide range of operative or ambient temperatures; 3. Physiological factors, such as metabolic rate, evaporative loss and the vascular regulation of peripheral blood flow, can each affect the level of thermal equilibrium and perhaps comfort by 2 to 4 degrees Fahrenheit; 4. A normal physiological state is not necessarily the most comfortable to an individual; 5. A method has been presented showing how much radiant heat may be required to balance out the discomfort of low ambient air temperatures. RP-1269 -- Occupant Responses and Energy Use in Buildings with Moderately Drifting Temperatures [Relevance: 1.60]. Objectives of the research: Earlier studies conducted in climate chambers have examined a large range of temperature ramps from ñ0.5 K/h to ñ5 K/h (ñ0.9°F/h to ñ9°F/h), but their focus was mostly on establishing temperature limits for acceptable thermal comfort with non-steady-state temperatures. Thus, when this ASHRAE funded research was initiated in 2005 knowledge was lacking on how the intensity of building related symptoms, the perception of air quality and the performance of office work were affected by exposure to non-steady-state temperatures. ASHRAE Standard 55 (2004) provides recommendations for maximum rates of temperature change to avoid discomfort, but these recommendations are based mostly on engineering judgment and to some extent on results of earlier thermal comfort research. New approaches to reducing the consumption of energy for climate conditioning in buildings are often associated with indoor temperatures that drift somewhat during the day, and there was a need to extend the scope of the recommendations to cover not only thermal comfort, but also health and productivity. RP-927 -- Simplified Methodology to Factor Room Air Movement and the Impact on Thermal Comfort into Design of Radiative, Convective and Hybrid Heating and Cooling Systems [Relevance: 1.40]. Research is needed to develop a simplified air movement computer program that may be incorporated into existing building energy analysis programs, such as BCAP (Building Comfort Analysis Program) and to validate the program with existing information from the literature. The objective of this research project is to 1) develop a simplified airflow program to be incorporated into existing building energy analysis programs; 2) validate the program with new experimental data and existing information from the literature; 3) incorporate the simplified air movement model into an energy analysis program having thermal comfort capabilities, and 4) to exercise the coupled energy/thermal comfort/air movement model by analyzing five heating and cooling system designs such as a warehouse, a room in an office building, a home, a factory with individual work stations, and an aircraft hangar. Principal Investigator: Dr. Qingyan Chen, Massachusetts Institute of Technology. Conducted: September 1997 - January 1999

64
RP-1332 - Revisions to the ASHRAE Thermal Comfort Tool to maintain Consistency with Standard 55-2004 [Relevance: 1.40]. In 1997 ASHRAE published the ASHRAE Thermal Comfort Tool to provide a simplified, consistent method for evaluating thermal comfort under a range of thermal conditions. The software is consistent with ASHRAE Standard 55-1992 and indicates whether a set of environmental conditions is in compliance with that standard. ASHRAE subsequently published ASHRAE Standard 55-2004, which incorporates several important changes from Standard 55-1992. The purpose of this project was to make several important changes to the existing ASHRAE software so that it is consistent with the 2010 version of the standard. The most fundamental changes to the software were to change the basis for compliance with Standard 55-2010 to PMV rather than ET and to include the adaptive model, however many changes were made to the software to make it consistent with 55-2010 and to improve the user interface. RP-1522 - Establishment of Design Procedures to Predict Room Airflow Requirements in Partially Mixed Room Air Distribution Systems [Relevance: 1.40]. Partially-mixed air distribution systems such as Under-Floor Air Distribution (UFAD) systems have been known to provide indoor air quality improvement and energy saving potential. The conditioned air is supplied directly from the floor-mounted diffusers to the occupied zone and warmed up by the room heat sources. The exhaust is normally located in the ceiling for air return. Therefore, thermal stratification within the occupied zone can be generated and well-mixed condition can be expected in the upper region. The major challenge for UFAD design is estimating the thermal gradient between head and ankle of a standing person. The thermal gradient is strongly linked to thermal comfort and total airflow rate requirement of the UFAD systems. Thus, designers must be careful to ensure acceptable thermal gradient and to determine the required airflow rate at the same time. This investigation first reviewed the literature concerning the thermal stratification of the UFAD systems. As a result, key design parameters selected were diffuser number and air temperature difference between supply diffuser and return with three different diffusers: square diffusers, swirl diffusers, and linear diffusers. The indoor spaces selected were offices, conference rooms, and classrooms in both interior and exterior zones. When building a test plan with the design parameters selected, this investigation considered both of literature review and the results from the orthogonal test. Then, experimental cases in the test plan were first conducted to understand the nature of the UFAD systems. Indoor spaces with high cooling created a low thermal gradient. Also, swirl diffusers created the largest thermal gradient but provided the lowest air temperature in the occupied zone while the linear diffusers maintained uniform conditions. The experimental data was also used to validate a CFD program for studying the UFAD systems. This investigation then used the validated CFD program to further study the thermal stratification the UFAD systems for different indoor spaces and design parameters. The study found that the swirl diffuser created the highest thermal gradient, while the linear diffuser created the lowest, which were the same found by the experimental test. The more diffusers used, the higher thermal stratification would be. With a lower supply air temperature, the thermal stratification became higher. This investigation also found that the air temperature difference between air supply and return and indoor space type (or cooling load) were the most important parameters. A database was established containing 108 cases of the parametric study results. With this database, this investigation developed an advanced design tool for the UFAD systems. Linear regression analysis was conducted to correlate the empirical equations for the thermal stratification model. For room heat transfer, heat balance analysis was conducted for each room surface. A heat transfer model was used in this investigation to estimate the ratio of heat gain inside the supply plenum. The thermal stratification model can be coupled with the room heat

65
transfer model to provide comprehensive information for UFAD design. With using the thermal stratification model, a graphical design interface was developed for the convenient use of the UFAD engineers and validated by using the database. The Newton-Raphson method was implemented for solving the nonlinear design equations. RP-1114 -- Develop Simplified Methodology to Incorporate Thermal Comfort factors for Temperature Setback/Setup into In-Space Heating and Cooling Design Calculations [Relevance: 1.20]. The proposed work enhances earlier work related to the Building Comfort Analysis Program (BCAP). In this research project, the objective is to modify the BCAP methodology by adding time-dependent calculations. The developed methodology would be an add-on module to the already-existing heat transfer model used in the BCAP methodology. The modified version of BCAP will then be usable as a design tool to assess the effect of temperature setback and setup as well as the effect of thermal mass on thermal comfort. This research report contains: 1) a literature review of the experimental and numerical study of the dynamic radiant heating or cooling behavior; 2) an explanation of the developed transient model and solution technique; 3) an illustration of the numerical approach and the validation of the developed model; and 4) case studies where the model is applied. RP-884 -- Developing an Adaptive Model of Thermal Comfort and Preference [Relevance: 1.20]. Current comfort standards prescribe a static "ideal" temperature that is to be maintained uniformly over space and constant over time. Such a static temperature standard can require significant quantities of energy to maintain. However, a person's satisfaction with the thermal environment can depend on time, building form and function, the relationship of the indoor and outdoor climates, social conditioning, cultural expectations, and other contextual factors in addition to the immediate physical environment. This complexity implies that a variable standard is needed which takes all these factors into account. The objective of this final reports project is to collate data from field experiments conducted across different climatic regions of the world, to develop an adaptive model of thermal comfort based on the cumulative results of these field investigations and to propose a variable temperature standard that might supplement ASHRAE Standard 55-92. Principal Investigator: Richard de Dear, Macquarie Research, Ltd. Conducted: September 1995 - March 1997 RP-734 -- Building Characteristics and Control Strategies for Using Building Thermal Mass in Cooling [Relevance: 1.20]. Conventional cooling strategies largely ignore the thermal capacitance of the building structure. Simulations and experiments have shown that significant operating savings can be realized when control strategies are used that precools the mass of the building. These savings result from lower utility rates and improved equipment performance at nighttime. Testing has also shown that the control strategy must be matched to the application to achieve these savings. Effective control strategies can be developed by simulating the building and using optimization techniques to minimize the operating costs. Unfortunately, this is not practical for most applications. By examining optimal cooling results covering a wide range of buildings, cooling plants, weather, utility rates, and internal gains, simplifications were developed which significantly reduced the dimensionality of the optimal control problem. Two simplified approaches are presented which each employ two control variables while the building is unoccupied in conjunction with a set of rules for the occupied period. The rules were expressed in terms of occupant comfort. The simplifications achieved 95% and 97%, respectively, of the optimal savings relative to conventional control. Using hourly time-steps, the daily optimization problem was reduced from

66
24 to 2 variables. In addition to reducing the computational requirements to study optimal control and develop building specific control strategies, these simplifications could be used in the development of an on-line controller. A simplified control strategy for precooling with night ventilation was also developed. The algorithm was derived from a simplified cost function which considers the efficiency of precooling. The savings over night setup control were demonstrated using both daily and seasonal simulations. For a wide range of systems and operating conditions, the ventilation precooling algorithm was found to achieve 89% of the optimal daily savings possible with ventilation precooling. The algorithm showed seasonal savings of up to 32% when compared to the cooling cost under night setup control. The savings were highly dependent on geographical location and building construction. The best performance was found to occur in heavy construction buildings located in climates characterized by dry cool summers. High time-of-day electric rate multipliers provided the highest potential savings over night setup control, however the algorithm resulted in savings in applications with no time-of-day utility rates. Occupant comfort was also calculated and found to be comparable to comfort levels achieved under night setup control. RP-1129 -- Thermal Comfort Models and "Call-Out" (Complaint) Frequencies [Relevance: 1.00]. Previous research describes a model that can be used to assign economic cost to thermal discomfort. This is a subject of unquestionable importance to ASHRAE. More research is needed to establish the accuracy of this model so that it may gain acceptance as an economic analysis tool. The results of this research will impact ASHRAE Standard 55 as follows. The model can be used to optimize building temperature to either minimizing total cost (energy plus service call cost) or to minimizing complaint frequency. These two temperatures could be used as a new basis for the upper and lower limits of the comfort zone. Unlike the existing upper and lower limits, these limits would have an economic basis. The objective of this research project is to evaluate the accuracy of the complaint model recently proposed. RP-43 -- Thermal Sensations of Sedentary Man in Moderate Temperatures [Relevance: 1.00]. In an attempt to determine the range of thermal conditions at which sedentary subjects report feeling comfortable, 1600 college age students were exposed in groups of 10 subjects each, five men and five women, to 20 dry bulb temperatures ranging from 60°F to 98°F in increments of 2°F at each of eight relative humidity: 15, 25, 35, 45, 55, 65, 75, and 85 percent, and were required to report their thermal sensations on a ballot every half hour. The results showed that for sedentary subjects in standard clothing with an insulated value of 0.6 clo for three hours, the "comfortable" votes ranged from 62°F to 98°F. In addition, it was found that men feel warmer than women during their first hour at a given temperature and that humidity plays a significantly more important role in how men feel than how women feel. RP-518 -- Human Response to Cooling With Air Jets [Relevance: 1.00] Results of this study showed that spot cooling improved significantly the thermal conditions for the occupants and increased the acceptance of the thermal environment. Heat strain on the subjects decreased. Mean skin temperature of 33°C and sweat evaporation rate 35 g.h*1.m"2 were found to correspond to neutral thermal sensation and comfortable vote. Relationship between subjects* rating of the thermal environment and predictions by PMV and ET* indices showed good correlation but the individual differences were large. Sweat evaporation rate measured was higher than sweat evaporation rate calculated by SRindex

67
RP-1140 -- Establishing a Baseline Data Set for the Evaluation of Hybrid (Radiant/Convective) HVAC Systems [Relevance: 0.80]. ASHRAE Technical Committee 6.5 sponsored this Research Project to aid the developers of radiant simulation modules. If radiant panels are to gain widespread use, a reliable simulation tool is necessary for use by the design profession. This report is useful to researchers, simulation developers, and design engineers. The project successfully demonstrates the use of radiant panels for both heating and cooling, in conjunction with ventilation/dehumidification units, to achieve thermal comfort in a residence. The performance data from over a 2-year period provides a performance baseline against which simulation results can be compared. The project also demonstrates that radiant panel cooling/heating combined with envelope thermal mass has benefits for comfort and cost performance in a hot arid climate. RP-702 -- Field Study of Occupant Comfort and Office Thermal Environments in a Hot-Humid Climate [Relevance: 0.80]. This monograph presents the findings of ASHRAE research project RP-702; a field investigation of indoor climates and occupant comfort in 12 air-conditioned office buildings in Townsville, located in Australia's tropical north. The project replicates an earlier ASHRAE investigation in San Francisco (RP-462), with the primary aim being to examine the effects of a hot-humid climatic context on human thermal response to the indoor climates of air-conditioned buildings. RP-421 -- Thermal Comfort of the Elderly: Effect of Indoor Microclimate, Clothing, Activity level and Socioeconomics [Relevance: 0.80]. We conducted a field survey of the effects of indoor climate, clothing insulation and activity level on the thermal comfort of elderly persons of different socioeconomic groups during the winter of 1984. Ninety-nine subjects from Buffalo, New York, and 112 subjects from Hamilton, Ontario, participated in the study. RP-460 -- Thermal Comfort of the Elderly: Behavioral Strategies and the Effect of Activity [Relevance: 0.80]. We conducted a field survey to determine the effects of behavioral patterns and activity level on the thermal comfort of healthy elderly persons living independently during the winter of 1985-1986. One hundred and one subjects of good health from Hamilton, Ontario participated in the study. The mean clothing insulation was 0.8 clo and was virtually constant. The subjects scored 83.5 on the Self-Evaluation of Life Function (SELF) Scale and did not differ significantly from a reference group of healthy elderly subjects from Miami, Florida. The mean activity level at rest was 1.5 met and during periods of light exercise (walking at 1.3 mph, 2 km hr ) and light domestic household work was 1.9 met. RP-833 -- Demonstration of Knowledge Base to Aid Building Operators in Responding to Real-Time Pricing Electricity Rates ... [Relevance: 0.80] This report describes work performed to develop a demonstration knowledge base and implement it in a software system to aid building operators in minimizing energy costs under real-time pricing electricity rates. The knowledge base and associated calculations, as implemented in a demonstration software package, cover the major electrical end-uses of a hotel, which should provide a super-set of the end-uses in office buildings and most other commercial facilities. The software system is written in Visual Basic, which provides the development platform for a Windows-based user interface, along with the M4 KBS shell and a database program. Operators are first asked to provide detailed information about conventional and RTP rates and then to describe whole-building electrical load shapes. In the sample provided with the software, care is taken to adjust raw rate data from a utility to account for revenue reconciliation. From these data, an analysis is performed to calculate a cost duration curve and pin-point hours of high costs. Because on-site generation is typically the first choice of

68
RTP control strategies in buildings so equipped, the software then asks for generator operating information and calculates a threshold electricity price above which the generator should be run, the reduction in electricity costs and off-setting generator costs associated with generator operation. For lights, a knowledge base is used to help operators assess the importance of the service provided by the lights and to recommend a threshold price above which lights would be dimmed, stepped down or turned off. Service assessment is based on the type of space, the extent to which the space is used for essential activity, and the occupancy. This assessment is performed for each of three shifts per day. With a threshold and control action determined, savings from light control can then be estimated. A knowledge base is also used to guide building operators in estimating an appropriate swing in indoor temperatures. Larger swings have more impact on occupant comfort but make it possible to shift chiller operation to a larger extent by letting the indoor temperature rise when prices are high and pre- or post-cooling when prices are lower. The use of thermal storage systems' is similar to that of on-site generation, in that occupant comfort is not affected. The storage system should be used to minimize operating costs. Algorithms used in this project for thermal storage and for control of space temperatures perform a first-order approximation to an optimal solution by systematically shifting load from high-priced to low-priced hours. The last load considered in this project is a miscellaneous electrical load for which the user of the program must provide a load profile and a threshold price above which the load is curtailed. RP-1438 -- Simplified Thermal Model with Experiments to Design Optimized Chilled Ceiling and Displacement Ventilation System [Relevance: 0.80]. The basic objective of this work statement was to develop general design charts for sizing the chilled-ceiling and displacement ventilation (CC/DV) system using a simplified plume-multilayer thermal model of the conditioned space. The second objective was to optimize CC/DV system operational parameters against different control strategies to improve system response to transient changes in the load and reduce energy use while maintaining the thermal comfort and indoor air quality. Both the design charts and optimization tool were validated by experimentation. This final report is separated into five main parts. The first part is a short introduction of literature on design charts for CC/DV system operation. The second part describes the simplified wall-plume-multi-layer model and the discretization scheme. The model is the basis for developing the deign charts. The third part discusses the design charts development, validation by experimentation and 3-D simulations, and an example on how to use the charts for designing the two subsystems of chilled ceiling displacement ventilation. RP-1128 -- Combined Effects of Noise and Temperature on Human Comfort and Performance [Relevance: 0.80]. This project present the results from an experiment designed to investigate the combined effects of noise and temperature on human thermal comfort and task performance. Thirty subjects (16 females, 14 males) were exposed to all combinations of five thermal conditions (PMV +1 [79.6°F; 26.4°C], PMV +0.5 [75.8°F; 24.3°C], PMV 0 [72.1°F; 22.3°C], PMV -0.5 [68.3°F; 20.2°C], and PMV -1 [64.6°F; 18.1°C), three RC noise levels (RC-30, RC-40, and RC-50), and two sound qualities (neutral and rumbly): all sounds mimicked noise from building ventilation systems. After a one-hour adaptation period at each condition, subjects rated their thermal comfort using the ASHRAE Thermal Comfort Scale and the Tenant Survey Questionnaire, and then completed typing and number-checking tasks. There were no statistically significant effects of thermal condition, RC level, or sound quality on performance of the typing or number checking tasks. Statistical analyses showed that thermal comfort was affected by RC noise level, while ratings of building or office noise were not affected by the ambient temperature. There were also differences in the way males and females experienced the thermal and acoustical environments. Females rated lower temperatures

69
colder than males and higher temperatures more pleasant than males: thermal comfort composite ratings from males and females converged at about 72°F (22°C). RP-907 – Development of Design Factors for the Combination of Radiant and Convective In-Space Heating and Cooling Systems [Relevance: 0.60]. The effort of this project was to develop and present a set of design factors to assist HVAC (Heating, Ventilation, and Air-Conditioning) design engineers in sizing and placing combined radiative and convective in-space heating and cooling systems. Using these factors, the design engineer may maximize thermal comfort and minimize fuel consumption. The design factors were developed using the Building Comfort Analysis Program (BCAP) methodology. This methodology was developed through RP-657, "Simplified Method to Factor Mean Radiant Temperature (MRT) into Building and HVAC System Design" (Jones and Chapman, 1994). Many techniques and standards exist to accurately size forced-air heating systems to provide a design air temperature. Little information is available for sizing and placing radiative heating systems. Even less information is available for a combination convective and radiative system. In a combined system, the relative portions of in-space convective and radiative heating capacities will vary with building shapes and air infiltration rates. Therefore, any analysis method for this complex problem must accurately encompass building materials, heating systems, and operating conditions. RP-394 -- RP-394 -- A Study to Determine Methods for Designing Radiant Heating and Cooling Systems [Relevance: 0.60]. The goal of this study was to obtain design data and relevant manufacturers’ data concerning the design procedures for radiant heating and cooling systems. A comprehensive literature search was conducted which resulted in an annotated bibliography with over 250 entries. This bibliography was subdivided into the following sections: load analysis and modeling, convection coefficients, comfort conditions, radiant thermal comfort, floor panels, panel heating and cooling, infrared heating, design procedures, energy consumption, transient effects, controls, and spot heating and cooling. RP-462 -- A Study to Establish A Data Base on Existing Thermal Environments in Office Buildings [Relevance: 0.60]. The scope of this project was established by its original work statement and included the following activities: 1) Development of a detailed data base on the thermal environment and subjective responses of occupants in existing office buildings. This study measured buildings in two San Francisco Bay area climates: a cool coastal climate and a drier, more variable inland climate. Measurements were repeated in winter and summer. In addition to physical measurements of the thermal environment, concurrent thermal comfort assessment surveys polling the building occupants provided subjective data. The study included both old and new buildings, single and multiple tenant, as well as open plan and enclosed offices. At least 20 workstations were visited in each building. The collected data are available to other users on microcomputer diskette. 2) Documentation of comfort conditions in the monitored office environments. The field measurements were used to determine whether current comfort standards (ASHRAE Std. 55-81 and ISO Std. 7730) were being met in the buildings. 3) Analysis of the compiled data to identify relationships between physical, psychological, and demographic parameters. Commonly used temperature indices and derived comfort parameters were calculated from the measured data. Statistical analysis was used to identify significant correlations and trends between thermal conditions, comfort responses, and user characteristics. As part of this, the study looked at possible climatic effects on comfort responses. 4) Development of instrumentation, measurement procedures, and occupant survey techniques to assess thermal comfort. The project developed methods of collecting detailed thermal

70
measurements of the workstation conditions, eliciting subjective responses to the current thermal environment, and obtaining appropriate psychological background measures that may explain occupants' response patterns. These methods were evaluated for their suitability in establishing a standard thermal comfort assessment procedure for field future studies. RP-1313 -- Evaluation of Building Thermal Mass Savings [Relevance: 0.60] Building zone conditions are usually controlled to maintain constant temperature (and possibly humidity) set points that ensure acceptable comfort levels during occupancy. When unoccupied, the building energy equipment is turned off and the zone temperature is allowed to float. This strategy is coined nighttime setup control. However, in many commercial buildings the structural mass embodies a substantial thermal storage medium that can be harnessed to reduce operating costs in response to utility rate incentives. Utility rate incentives are offered in response to the growth in both population and the use of electrical equipment, and thus increased demand for power. Utilities must install and maintain additional power generating equipment to meet these demands; especially for peak electrical demand periods. Since the cooling of commercial buildings places a considerable burden on the electrical utility grid, the generating plants' electrical loads are typically highest during periods coincident with daily peak electrical loads in commercial buildings. Utilities encourage the flattening of electricity demand in these buildings by offering varying utility rate charges during distinct time periods, ensuring the costs associated with the additional equipment are recovered. The utilities' economic power generation is achieved by transferring costs to commercial building customers in the form of time-of-use (TOU) electrical energy rates [$/kWh] and monthly peak electrical demand charges [$/kW]. RP-1456 -- Assess and Implement Natural and Hybrid Ventilation Models in Whole-Building Energy Simulations [Relevance: 0.60]. Natural ventilation is one of the most fundamental techniques to reduce cooling energy usage in buildings. Energy-conscious designers harness the cooling capacity of ambient air to increase indoor thermal comfort and ultimately lessen the necessity for active space conditioning. Hybrid ventilation is the use of natural forces (wind and temperature) to condition a building, with the supplemental use of mechanical forces whenever natural forces are inadequate. The implementation of natural and hybrid ventilation represents an opportunity to make better use of energy consumption for HVAC, by utilizing free natural cooling as much as possible. The goal of this project is to advance the use of natural and hybrid ventilation concepts in building design by assessing the accuracy and usability of current thermal-ventilation models. RP-1036 -- Develop Simplified Methodology To Determine Heat Transfer Design Impacts Associated With Common Installation Alternatives For Radiant Conduit (Tubing, Cable, or Element) [Relevance: 0.40]. Relevant and accurate data pertaining to the effects of internal radiant panel heat transfer or acceptance characteristics will assist design engineers in predicting actual panel output required for thermal comfort, energy performance, and conformance with related laboratory, government, or code safety standards or requirements. The objective of this research project is the development of simplified heat transfer design information associated with the common installation alternatives for radiant conduit to enable the designer to select and design such installations. RP-983 -- Design Approaches to Industrial Ventilation [Relevance: 0.40] Practicing engineers lack important information that can help them to improve the design of industrial ventilation system and its elements. The relevant research data and practical recommendations based on the positive field experience are available internationally. Most of this information is published in different languages or is not presented in ready to use form. The
71
state-of-the-art information presented in this document will allow for better designs and increased good will from clients. Facility owners and managers will benefit by running more cost efficient systems and by increased workers’ productivity, and workers will enjoy better indoor air quality and thermal comfort. The target objective is to capture and make more widely available to the practicing engineer published information on the subject "Industrial General Ventilation and Air Supply." The objectives of the research project are: 1) Perform an extensive literature search, and translate the gathered information. 2) Summarize, compare and contrast the translated documents to show common approaches, design techniques and system successes. Based on this review, recommend changes to the ASHRAE Applications Handbook, will be made. Principal Investigator: William Stewart, InterMountain Research Conducted: Sept. 2000 - Oct. 2001 RP-876 -- Impact of Surface Characteristics On Radiant Panel Output [Relevance: 0.40]. Relevant and accurate data pertaining to the effects of surface characteristics on heat transfer on radiant panels will assist system designers in predicting the actual panel output required for thermal comfort as well as energy performance. This project involves the development of a reliable method appropriate for use in setting a standard while measuring and comparing the actual radiant heat output of panels with various surface characteristics. The objective of this project is to experimentally determine the impact of surface characteristics on radiant panel output. Principal Investigator: Curt Pedersen, University of Illinois Conducted: April 1995 - April 1996. RP-811 -- Method To Distribute Supply Air In Industrial Facilities [Relevance: 0.40]. The type of air distribution can greatly influence the cost of the HVAC system in addition to its performance. The degree of air movement in a space depends upon the initial outlet velocity and characteristics of the air outlet. The room temperature is greatly affected by the incoming air temperature differential. Often one must evaluate the use of larger quantities of ventilation air having an increased cost of ductwork, more expensive fan, etc. vs. using less air that is cooled creating an extra cost for refrigeration equipment. The objective of the project is to evaluate various means to distribute supply air in industrial buildings. The researcher will construct a test model, select a CFD model, and execute physical and computational simulations to determine the thermal comfort, air distribution effectiveness, energy use, and cost of selected air distribution systems. RP-695 -- RP-695 -- Effects of Temperature And Humidity On Perceived Indoor Air Quality, Phase I: Air Contaminated By Materials [Relevance: 0.40]. In present standards perceived air quality and ventilation requirements are considered independent of the thermal environment. To improve the design and operation of HVAC systems, it would be important to establish a model which predicts the impact of temperature and humidity on perceived air quality and on required ventilation. Based on such a model, the required ventilation may in future ventilation standards be specified as a function of indoor temperature and humidity. The model could also be a most useful tool for optimizing comfort and energy consumption in buildings. The objectives of this project are to study experimentally how temperature and humidity influence emission and perception of contaminants from typical materials occurring in non-industrial buildings, and to model the impact of temperature and humidity on perceived air quality and ventilation requirements in spaces contaminated by typical materials. It will also validate the temperature/humidity model in real buildings.

72
RP-1311 -- Improving Cooling Load Calculations for Fenestration with Shading Devices [Relevance: 0.40] Buildings account for about 50% of the greenhouse gas production and use about 40% of the energy consumed in the U.S. and Canada. Approximately 25% of this consumption can be attributed to windows. Good thermal design offers many possibilities for reduced energy consumption, peak load reduction, downsized equipment and increased comfort. Clearly, the potential for saving energy in this sector is enormous. The purpose of this project is to enable the straightforward and practical energy analysis of buildings that incorporate window shading attachments. This objective will be achieved with the following broad steps: Model development and validation. A comprehensive fenestration model, designated ASHWAT (ASHRAE Window Attachment models), will be assembled based on a combination of existing procedures and new work. It will be validated using existing and new experimental data. Reference implementation. ASHWAT will be fully implemented within the Heat Balance and Radiant Time Series formulations found in the ASHRAE Toolkit. Documentation and application guidelines. The models will be fully documented, including equation form. Application guidelines will specify input requirements and methods for estimating inputs that are not completely known. Tabular results for common systems will also be prepared by applying ASHWAT (a set of FORTRAN subroutines that models multi-layer complex fenestration systems ) to typical configurations. RP-1390 -- Short-Term Curtailment of HVAC Loads in Buildings [Relevance: 0.40]. Rapidly increasing requirements placed on utilities to reduce peak loads has led to utility customer incentives to shift peak demand to non-peak times or reduce peak loads when notified by the utility that the grid is close to capacity. This study investigates methods used to reduce building demand during a fixed time window near a utilities on-peak period. The objectives of this project are to identify and assess methods for managing peak loads in buildings via short-term adjustment of HVAC set points. The assessment was based on simulation, using a method that allowed comparison of results for multiple demands limiting strategies, geographical location, and building type. The specific objectives of the work are as follows: Review the literature to pin point what has been done to implement short-term load control via HVAC set-point adjustment. Specify the HVAC systems, building construction, thermal-comfort criteria to be assessed and the simulation package to be used for the assessment. Develop a simulation protocol to identify the specific combinations of systems, building types, and set-point adjustments that will be evaluated. Perform the simulations and analyze and present the results in a form that can be directly used by building operators, utility program managers and controls companies. Specify control logic and upgrades in typical HVAC system controls hardware needed to implement the simulated load control.

73
APPENDIX 4 – THE BRAZILIAN STANDARD NBR 16401-2
5 Parâmetros de Conforto
Esta parte da ABNT 16401 estipula os parâmetros ambientais suscetíveis de produzir sensação aceitável de conforto térmico em 80% ou mais das pessoas.
Os parâmetros estipulados em 6.1 e 6.2 são válidos para grupos homogêneos de pessoas, usando roupa típica da estação e em atividade sedentária ou leve (1,0 a 1,2 met).
Estes parâmetros se enquadram nas zonas de conforto estipuladas pela ASHRAE para estes mesmos fatores pessoais, conforme Referência Bibliográfica [2]1.
5.1 Verão (roupa típica – 0,5 clo)
Temperatura operativa e umidade relativa dentro da zona delimitada por:
22,5 °C a 23,5 °C e umidade relativa de 65%;
23,0 °C a 26,0 °C e umidade relativa de 35%;
A velocidade média do ar (não direcional) na zona de ocupação não deve ultrapassar:
0,20 m/s para distribuição de ar convencional (grau de turbulência 30% a 50%);
0,25 m/s para distribuição de ar por sistema de fluxo de deslocamento (grau de turbulência inferior a 10%);
5.2 Inverno (roupa típica 0,9 clo)
Temperatura operativa e umidade relativa dentro da zona delimitada por:
21,0 °C a 23,5 °C e umidade relativa de 60%;
21,5 °C a 24,0 °C e umidade relativa de 30%;
A velocidade média do ar (não direcional) na zona de ocupação não deve ultrapassar:
0,15m/s para distribuição do ar convencional (grau de turbulência 30% a 50%);
0,20 m/s para distribuição de ar por sistema de fluxo de deslocamento (grau de turbulência inferior a 10%).
5.3 Limitações
A diferença entre as temperaturas num plano vertical entre 0,1m e 1,1m do solo (entre tornozelos e cabeça de pessoas sentadas) deve ser inferior a 3 K.
A variação gradual e contínua da temperatura (passiva ou intencional) não deve ultrapassar a taxa de 0,5 K por hora, sendo que a temperatura final resultante não deve se distanciar dos limites de temperatura estipulados em 6.1 e 6.2em mais de 0,5 K, nem permanecer neste nível por mais de 1 hora.
1 ASHRAE Handbook Fundamentals 2005 – Cap. 8 – Thermal Comfort.

74
A assimetria de temperatura radiante admissível deve ser inferior a:
5 K para forro quente;
14 K para forro frio;
23K para parede quente;
10 K para parede fria.
Não pode haver correntes de ar localizadas, em direção à nuca ou aos tornozelos das pessoas, com velocidade superior à velocidade média estipulada em 6.1 ou 6.2.
5.4 Outras condições operacionais
5.4.1 Maior velocidade do ar
Uma elevação da velocidade do ar acima dos parâmetros estipulados nesta parte da ABNT NBR 16401 pode ser utilizada para compensar uma elevação do limite superior admissível da temperatura do ar.
A elevação do limite superior da temperatura não pode ultrapassar 3 K e a velocidade do ar não deve ser elevada acima de 0,8 m/s. É recomendável nestes casos que a velocidade do ar possa ser controlada diretamente pelas pessoas afetadas.
5.4.2 Maior nível de atividade e outros tipos de roupa
Os limites das zonas de conforto estipulados em 6.1 e 6.2 podem ser reduzidos em 1,4 K por met acima de 1,2 met.
Podem ser elevados em 0,6 K para cada redução na resistência térmica da roupa de 0,1 clo, ou reduzidos em 0,6 K para cada elevação de 0,1 clo.

75
APPENDIX 5 – THE BRAZILIAN STANDARD NR 17
17.5 Condições ambientais de trabalho.
17.5.1 As condições ambientais de trabalho devem estar adequadas às características psicofisiológicas dos trabalhadores e à natureza do trabalho a ser executado.
17.5.2 Nos locais de trabalho onde são executadas atividades que exijam solicitação intelectual e atenção constantes, tais como: salas de controle, laboratórios, escritórios, salas de desenvolvimento ou análise de projetos, dentre outros, são recomendadas as seguintes condições de conforto:
a) níveis de ruído de acordo com o estabelecido na NBR 10152, norma brasileira registrada no
INMETRO;
b) índice de temperatura efetiva entre 20°C (vinte) e 23°C (vinte e três graus centígrados);
c) velocidade do ar não superior a 0,75m/s;
d) umidade relativa do ar não inferior a 40 (quarenta) por cento.

76
APPENDIX 6 – ASHRAE 55 APPENDIX H – BIBLIOGRAPHY
ARENS, E., T. XU, K. MIURA, H. ZHANG, M. FOUNTAIN, AND F. BAUMAN. 1998. A study of occupant cooling by personally controlled air movement. Energy and Buildings 27:45–59. ASHRAE Standard 70-2006, Method of Testing for Rating the Performance of Air Outlets and Inlets. Atlanta: American Society of Heating, Refrigerating and Air-Conditioning Engineers, Inc. ASHRAE Standard 113-2009, Method of Testing for Room Air Diffusion. Atlanta: American Society of Heating, Refrigerating and Air-Conditioning Engineers, Inc. 2009 ASHRAE Handbook—Fundamentals. Atlanta: American Society of Heating, Refrigerating and Air-Conditioning Engineers, Inc. BERGLUND, L.G. 1979. Thermal acceptability. ASHRAE Transactions 85(2):825–34. BERGLUND, L.G., and R.R. GONZALEZ. 1978. Application of acceptable temperature drifts to build environments as a mode of energy conservation. ASHRAE Transactions 84(1):110–21. BERGLUND, L.G., and R.R. GONZALEZ. 1978. Occupant acceptability of eight-hour-long temperature ramps in the summer at low and high humidities. ASHRAE Transactions 84(2):278–84. BERGLUND, L.G., and A.P. GAGGE. 1979. Thermal comfort and radiant heat. Proceedings of the 3rd National Passive Solar Conference of The American Section of The International Solar Energy Society, Inc. BERGLUND, L.G., and A.P.R. FOBELETS. 1987. Subjective human response to low-level air currents and asymmetric radiation. ASHRAE Transactions 93(1):497–523. BLIGH, J., and K.G. JOHNSON. 1973. Glossary of terms for thermal physiology. J. Appl. Physiol. 35941–61. BREUNIS, K., and J.P. DEGROOT. 1987. Relative humidity of the air and ocular discomfort in a group of susceptible office workers. Proceedings of the Fourth International Conference on Indoor Air Quality and Climate 2:625–29. DE DEAR, R.J., and G.S. BRAGER. 1998. Developing an adaptive model of thermal comfort and preference. ASHRAE Transactions 104(1a):145–67. DE DEAR, R.J., and M.E. FOUNTAIN. 1994. Field experiments on occupant comfort and office thermal environments in a hot-humid climate. ASHRAE Transactions 100(2):457–75. DONNINI, G., J. MOLINA, C. MARTELLO, D.H.C. LAI, L.H. KIT, C.Y. CHANG, M. LAFLAMME, V.H. NGUYEN, and F. HAGHIGHAT. 1996. Field study of occupant comfort and office thermal environment in a cold climate. Final Report of RP-821. American Society of Heating, Refrigerating and Air-Conditioning Engineers, Inc., Atlanta.

77
FANG, L., G. CLAUSEN, and P.O. FANGER. 1998. Impact of temperature and humidity on the perception of indoor air quality during immediate and longer whole-body exposure. Indoor Air 8:276–84. FANGER, P.O. 1982. Thermal Comfort. Malabar, FL: Robert E. Krieger Publishing Co. FANGER, P.O., A.K. MELIKOV, H. HANZAWA, and J. RING. 1988. Air turbulence and sensation of draught. Energy and Buildings 12:21–9. FANGER, P.O., B.M. IPSEN, G. LANGKILDE, B.W. OLESEN, N.K. CHRISTENSEN, and S. TANABE. 1985. Comfort limits for asymmetric thermal radiation. Energy and Buildings 8:225–36. FANGER, P.O., B.W. OLESEN, G. LANGKILDE, and L. BANHIDI. 1980. Comfort limits for heated ceilings. ASHRAE Transactions 86(2):141–56. FANGER, P.O., A. K. MELIKOV, H. HANZAWA, and J. RING. 1988. Air turbulence and sensation of draught. Energy and Buildings 12:21–39. FANGER, P.O., and N.K. CHRISTENSEN. 1986. Perception of draught in ventilated spaces. Ergonomics 29:215–35. FISHMAN, D.S., and S.L. PIMBERT. 1979. Survey of subjective responses to the thermal environment in offices. Indoor Climate, P.O. Fanger and O. Valbjorn (eds.), Danish Building Research Institute, Copenhagen. FOBELETS, A.P.R., and A.P. GAGGE. 1988. Rationalization of the effective temperature, ET*, as a measure of the enthalpy of the human indoor environment. ASHRAE Transactions 94(1):12–31. FOUNTAIN, M., and E. ARENS. 1993. Air movement and thermal comfort. ASHRAE Journal August:26–30. FOUNTAIN, M., et al. 1996. An investigation of thermal comfort at high humidities. Final Report of RP-860. American Society of Heating, Refrigerating and Air-Conditioning Engineers, Inc., Atlanta. GAGGE, A.P., and R.G. NEVINS. 1976. Effect of energy conservation guidelines on comfort, acceptability and health, Final Report of Contract #CO-04-51891-00, Federal Energy Administration. GAGGE, A.P., Y. NISHI, and R.G. NEVINS. 1976. The role of clothing in meeting FEA energy conservation guidelines. ASHRAE Transactions 82(2):234–47. GRIFFITHS, I.D., and D.A. MCINTYRE. 1974. Sensitivity to temporal variations in thermal conditions. Ergonomics 17:499–507. GOLDMAN, R.F. 1978. The role of clothing in achieving acceptability of environmental temperatures between 65°F and 85°F (18°C and 30°C). Energy Conservation Strategies in Buildings, J.A.J. Stolwijk, (Ed.) Yale University Press, New Haven. GONG, N., K.W. THAM, A.K. MELIKOV, D.P. WYON, S.C. SEKHAR, and D.K.W CHEONG. 2005. Human perception of local air movement and the acceptable air velocity range for local air movement in the tropics. Proceedings of Indoor Air 2005, Beijing, China, pp. 452–56.

78
HANZAWA, H., A.K. MELIKOV, and P.O. FANGER. 1987. Airflow characteristics in the occupied zone of ventilated spaces. ASHRAE Transactions 93(1):524–39. ISO 7726:1998, Ergonomics of the Thermal Environment—Instruments for Measuring Physical Quantities. ISO 7730:2005, Ergonomics of the Thermal Environment- Analytical Determination and Interpretation of Thermal Comfort using Calculation of the PMV and PPD Indices and Local Thermal Comfort Criteria. JONES, B.W., K. HSIEH, and M. HASHINAGA. 1986. The effect of air velocity on thermal comfort at moderate activity levels. ASHRAE Transactions 92(2b):761–69. KNUDSEN, H.N., R.J. DE DEAR, J.W. RING, T.L. LI, T.W. PUENTENER, and P.O. FANGER. 1989. Thermal comfort in passive solar buildings, Final Report to the Commission of the European Communities, Directorate-General for Science, Research and Development. Research Project EN3S-0035-DK(B). (Lyngby Copenhagen: Technical University of Denmark). KUBO, H., N. ISODA, and H. ENOMOTO-KOSHIMIZU. 1997. Cooling effect of preferred air velocity in muggy conditions. Building and Environment 32(3):211–18. LAVIANA, J.E., F.H. ROHLES, and P.E. BULLOCK. 1988. Humidity, comfort and contact lenses. ASHRAE Transactions 94(1):3–11. LAMMERS, J.T.H., L.G. BERGLUND, and J.A.J. STOLWIJK. 1978. Energy conservation and thermal comfort in a New York City high rise office building. Environmental Management 2:113–17. MCCULLOUGH, E.A., and D.P. WYON. 1983. Insulation characteristics of winter and summer indoor clothing. ASHRAE Transactions 89(2b):614–33. MCCULLOUGH, E.A., B.W. JONES, and J. HUCK. 1985. A comprehensive data base for estimating clothing insulation. ASHRAE Transactions 91(2a):29–47. MCCULLOUGH, E.A., B.W. OLESEN, and S. HONG. 1994. Thermal insulation provided by chairs. ASHRAE Transactions 100(1):795–802. MCINTYRE, D.A. 1976. Overhead radiation and comfort. The Building Services Engineer 44:226–32. MCINTYRE, D.A. 1978. Preferred air speeds for comfort in warm conditions. ASHRAE Transactions 84(2):264–77. MCNALL, P.E., JR., and R.E. BIDDISON. 1970. Thermal and comfort sensations of sedentary persons exposed to asymmetric radiant fields. ASHRAE Transactions 76(1):123–36. MCNALL, P.E., JR., J. JAAX, F.H. ROHLES, R.G. NEVINS, and W. SPRINGER. 1967. Thermal comfort (thermally neutral) conditions for three levels of activity. ASHRAE Transactions 73(1):I.3.1-I.3.14. MELIKOV, A.K., H. HANZAWA, and P.O. FANGER. 1988. Airflow characteristics in the occupied zone of heated spaces without mechanical ventilation. ASHRAE Transactions 94(1):52–70.

79
NEVINS, R.G., and A.M. FEYERHERM. 1967. Effect of floor surface temperature on comfort: Part IV, cold floors. ASHRAE Transactions 73(2):III.2.1-III.2.8. NEVINS, R.G., K.B. MICHAELS, and A.M. FEYERHERM. 1964. The effect of floor surface temperature on comfort: Part II, College age females. ASHRAE Transactions 70:37–43. NEVINS, R.G., and P.E. MCNALL, JR. 1972. ASHRAE thermal comfort standards as performance criteria for buildings. CIB Commission W 45 Symposium, Thermal Comfort and Moderate Heat Stress, Watford, U.K. (Published by HMSO London 1973.) NIELSEN, B., I. ODDERSHEDE, A. TORP, and P.O. FANGER. 1979. Thermal comfort during continuous and intermittent work. Indoor Climate, P.O. Fanger and O. Valbjorn, eds., Danish Building Research Institute, Copenhagen, pp. 477–90. NILSSON, S.E., and L. ANDERSSON. 1986. Contact lens wear in dry environments. ACTA Ophthalmologica 64:221–25. NISHI, Y., and A.P. GAGGE. 1977. Effective temperature scale useful for hypo- and hyperbaric environments. Aviation, Space and Environmental Medicine 48:97–07. OLESEN, B.W. 1985. A new and simpler method for estimating the thermal insulation of a clothing ensemble. ASHRAE Transactions 91(2b):478–92. OLESEN, B.W. 1977. Thermal comfort requirements for floors. Proceedings of The Meeting of Commissions B1, B2, E1 of IIR, Belgrade, pp. 307–13. OLESEN, B.W. 1977. Thermal comfort requirements for floors occupied by people with bare feet. ASHRAE Transactions 83(2):41–57. OLESEN, S., P.O. FANGER, P.B. JENSEN, and O.J. NIELSEN. 1972. Comfort limits for man exposed to asymmetric thermal radiation. CIB Commission W 45 Symposium, Thermal Comfort and Moderate Heat Stress, Watford, U.K. (Published by HMSO London 1973). OLESEN, B.W., E. MORTENSEN, J. THORSHAUGE, and B. BERG-MUNCH. 1980. Thermal comfort in a room heated by different methods. ASHRAE Transactions 86(1):34–48. OLESEN, B.W., M. SCHOLER, and P.O. FANGER. 1979. Discomfort caused by vertical air temperature differences. Indoor Climate, P.O. Fanger and O. Valbjorn, eds., Danish Building Research Institute, Copenhagen. ROHLES, F.H., J.E. WOODS, and R.G. NEVINS. 1974. The effect of air speed and temperature on the thermal sensations of sedentary man. ASHRAE Transactions 80(1):101–19. ROHLES, F.H., S.A. KONZ, and B.W. JONES. 1983. Ceiling fans as extenders of the summer comfort envelope. ASHRAE Transactions 89(1a):245–63. ROHLES, F.H., G.A. MILLIKEN, D.E. SKIPTON, and I. KRSTIC. 1980. Thermal comfort during cyclical temperature fluctuations. ASHRAE Transactions 86(2):125–40. ROHLES, F.H., JR., J.E. WOODS, and R.G. NEVINS. 1973. The influence of clothing and temperature on sedentary comfort. ASHRAE Transactions 79:71–80.

80
SCHEATZLE, D.G., H. WU, and J. YELLOTT. 1989. Extending the summer comfort envelope with ceiling fans in hot, arid climates. ASHRAE Transactions 95(1):269–80. SCHIAVON, S., and A. K. MELIKOV. 2009. Introduction of a Cooling Fan Efficiency Index. HVACandR Research Journal 5 (6): 1121-1141. SCHILLER, G., E. ARENS, F. BAUMAN, C. BENTON, M. FOUNTAIN, and T. DOHERTY. 1988. A field study of thermal environments and comfort in office buildings. ASHRAE Transactions 94(2):280–308. SIMMONDS, P. 1992. The design, simulation and operation of a comfortable indoor climate for a standard office. ASHRAE/DOE/BTEC Conference Proceedings, Clearwater Beach, FL. SIMMONDS, P. 1993. Thermal comfort and optimal energy use. ASHRAE Transactions 99(1):1037–48. SIMMONDS, P. 1993. Designing comfortable office climates. ASHRAE Conference Proceedings, Building Design Technology and Occupant Well-Being in Temperate Climates, Brussels, Belgium, February. SIMMONDS, P. 2000. Using radiant cooled floors to condition large spaces and maintain comfort conditions. ASHRAE Transactions 106(1). SIMMONDS, P. 1994. Radiant heating and cooling systems. ASHRAE Transactions 100(2). SPRAGUE, C.H., and P.E. MCNALL, JR. 1971. Effects of fluctuating temperature and relative humidity on the thermal sensation (thermal comfort) of sedentary subjects. ASHRAE Transactions 77:183–99. TANABE, S., and K. KIMURA. 1989. Thermal comfort requirements under hot and humid conditions. Proceedings of the First ASHRAE Far East Conference on Air Conditioning in Hot Climates, Singapore, pp. 3–21. TOFTUM, J. 1997. Effect of airflow direction on human perception of draught. Proceedings of CLIMA 2000, Brusssels, Belgium. TOFTUM, J. 2004. Air movement—Good or bad? Indoor Air 14:40–5. WYON, D.P., TH. ASGEIRSDOTTIR, P. KJERULF-JENSEN, and P.O. FANGER. 1973. The effects of ambient temperature swings on comfort, performance and behavior. Arch. Sci. Physiol. 27:441–58. ZHANG, H., E. ARENS, S. ABBASZADEH FARD, C. HUIZENGA, G. PALIAGA, G. BRAGER, and L. ZAGREUS. 2007. Air movement preferences observed in office buildings. International Journal of Biometeorology 51:349–60.
ZHAO, R., S. SUN, and R. DING. 2004. Conditioning strategies of indoor environment in warm climates. Energy and Buildings 36:1281–86.
81
APPENDIX 7 – The proposed Brazilian Standard (in Portuguese)
Condições de conforto térmico humano em ambientes
Sumário
PAGE
1 Introdução
2 Objetivo
1
2
3 Escopo 2
4 Definições 3
5 Requisitos gerais 6
6 Condições requeridas de conforto térmico 6
7 Formas de avaliar conforto térmico através de medições 16
8 Comprovação de atendimento à norma na etapa de projeto 24
9 Comprovação de atendimento à norma de edificações existentes
10 Referências
24
25
Apêndice (Normativo) A: Níveis de atividade metabólica 26
Apêndice (Normativo) B: Isolamento térmico de vestimentas 28
Apêndice (Normativo) C: Programa computacional para o cálculo do PMV/PPD 33
Apêndice (Informativo)D: Levantamento e questionário para avaliação de ambientes térmicos 36
Esta norma foi desenvolvida com base na norma ASHRAE 55-2010 e nas
alterações/correções disponíveis até Fevereiro de 2013 (a, b, c, d, e, j).
1. INTRODUÇÃO
Conforto térmico é a condição da mente que expressa satisfação com o ambiente térmico.
Como existem grandes variações fisiológicas e psicológicas de pessoa para pessoa, é muito
difícil satisfazer todos em um mesmo ambiente. Por esse motivo, pode-se afirmar que as
condições ambientais que resultam em conforto não são as mesmas para todos. Existe hoje
um grande número de dados medidos em laboratório e em campo que embasam
estatisticamente a definição de condições nas quais uma percentagem de ocupantes se sentirá
termicamente confortável.
Variáveis de conforto térmico: São 6 as principais variáveis que devem ser consideradas na
definição de conforto térmico. Existem outras variáveis que afetam o conforto em algumas
circunstâncias, mas as principais são:
1. Taxa metabólica
2. Isolamento da vestimenta
3. Temperatura do ar
4. Temperatura radiante média
5. Umidade do ar
6. Velocidade do ar
As duas primeiras são variáveis relativas aos ocupantes (ver apêndices A e B para valores de
referência), e as demais ao ambiente térmico.
Variação entre ocupantes: Para cada ocupante devem ser atribuídos uma atividade
metabólica (expressa em ―met‖ ou W/m2- apêndice A), e um valor de vestimenta determinado
através do índice de isolamento de vestimentas (expresso em ―clo‖ ou m2 K/W– apêndice B).
Quando existirem diferenças substanciais entre a atividade metabólica e o isolamento da
vestimenta para ocupantes em um mesmo espaço, estas diferenças devem ser consideradas
82
conforme descrito nos apêndices A e B. Em alguns casos não será possível atingir condições
térmicas aceitáveis para todos os ocupantes devido às diferenças individuais, incluindo
atividade e vestimenta. Caso as condições não sejam aceitáveis para um conjunto de
ocupantes em um mesmo espaço, estes ocupantes devem ser pontualmente identificados,
juntos com as possíveis causas de desconforto.
Variação temporal: é possível que as 6 variáveis de conforto térmico se alterem com o
tempo. Esta norma é aplicável a conforto térmico em estado estacionário (com algumas
variações limitadas de temperatura no tempo na seção 6.2.5). Pessoas entrando em um
ambiente podem não considerá-lo confortável caso tenham sido expostas a um ambiente
termicamente diferente em um período anterior. Este efeito pode afetar a percepção de
conforto por aproximadamente 1 hora.
Desconforto térmico local: Ambientes não uniformes são analisados na seção 6.2.4 e estas
não uniformidades podem afetar a percepção de conforto térmico.
Variação no nível de atividade: A maioria dos estudos de conforto térmico foi realizada em
condições típicas de trabalho em escritórios, onde se realizavam atividades sedentárias. Esta
norma é apropriada para estas condições, podendo também ser utilizada para atividades
moderadamente maiores. A norma não se aplica a pessoas dormindo. Os estudos disponíveis
não contem informações a respeito das condições de conforto térmico de crianças, deficientes
físicos, doentes ou idosos.
Ambientes condicionados naturalmente: As condições de conforto em espaços
condicionados naturalmente não são obrigatóriamente as mesmas requeridas em ambientes
condicionados artificialmente. Estudos de campo mostraram que nestes ambientes, onde os
ocupantes têm o controle sobre a abertura das janelas, a noção subjetiva de conforto é
diferente devido às diferenças nas experiências térmicas e disponibilidade de controle,
resultando em alterações nas expectativas de conforto dos ocupantes.
Esta norma está dividida em nove partes principais e quatro apêndices. Nas partes 1, 2, 3, 4 e
5 são apresentados os textos introdutórios, onde são descritos o objetivo, escopo, definições e
os requisitos gerais para aplicação dos critérios normativos. Na parte 6 são determinadas as
condições térmicas aceitáveis de ambientes para usuários representativos de diferentes tipos
de espaços, sendo apresentados 3 métodos de avaliação: Método para determinação das
condições térmicas aceitáveis em ambientes ocupados e condicionados artificialmente;
Método para determinação das condições térmicas aceitáveis em ambientes condicionados
naturalmente e controlados pelos usuários; Método para determinação das condições térmicas
aceitáveis em ambientes híbridos (mixed-mode buildings). Na parte 7 são descritas as formas
de avaliar conforto térmico através de medições, como são medidas e calculadas as variáveis
ambientais envolvidas e os índices de conforto térmico utilizados. As partes 8 e 9 estão
dedicadas à comprovação de atendimento à norma na fase de projeto e de edificações
existente.
2. OBJETIVO
O objetivo desta norma é especificar combinações de variáveis térmicas ambientais e pessoais
que produzam condições aceitáveis para a maioria dos ocupantes em um determinado
ambiente.
3. ESCOPO
3.1 As variáveis térmicas ambientais mencionadas nesta norma são: temperatura do ar,
temperatura radiante media, umidade do ar e velocidade do ar; e as variáveis pessoais são:
atividade metabólica e isolamento térmico da roupa.

83
3.2 Espera-se que os critérios definidos nesta norma sejam aplicados de uma forma integrada,
já que conforto térmico no ambiente interno é complexo e é afetado por todas as variáveis
aqui relacionadas.
3.3 Esta norma especifica condições térmicas aceitáveis para adultos saudáveis expostos a
pressão atmosférica equivalente a altitudes de até 3000m, e em ambientes internos projetados
para ocupação humana considerando períodos superiores a 15 minutos.
3.4 Esta norma não cobre fatores não térmicos como qualidade do ar, acústica, iluminação ou
outros parâmetros físicos, químicos ou biológicos que possam afetar o conforto e a saúde.
4. DEFINIÇÕES
Aberturas controladas pelos ocupantes: Aberturas como janelas que são controladas pelos
ocupantes do espaço. Estas aberturas podem ser controladas manualmente ou via sistema de
automação sob o controle dos usuários.
Ambientes naturalmente condicionados, controlados pelos ocupantes: Ambientes onde as
condições térmicas são reguladas principalmente através da operação (abertura/fechamento)
de janelas e movimentação passiva do ar.
Ambiente térmico: Variáveis locais específicas ou aspectos de um ambiente térmico que
afetam as perdas de calor dos ocupantes.
Ambiente térmico aceitável: Um ambiente térmico onde a maioria das pessoas (percentual
igual ou maior que 80%) o classifique como termicamente aceitável.
Assimetria na temperatura radiante: A diferença entre as temperaturas radiantes planas de
dois lados opostos de um pequeno plano.
clo: Unidade usada para expressar o isolamento térmico de um item de roupa ou de uma
combinação de itens, onde 1 clo = 0,155 m2 K/W.
Condições externas de projeto: Condições ambientais externas representadas pelos dados
climáticos utilizados no projeto de sistemas de condicionamento (refrigeração ou
aquecimento) que mantêm as condições térmicas internas dentro das especificadas.
Constante de tempo: Tempo para que um instrumento de medição alcance 63% do valor real
final após uma mudança.
Dados climáticos: Dados climáticos horários específicos para um local incluindo temperatura
do ar, velocidade do vento, radiação solar e umidade. Em cidades ou regiões urbanas com
diversos dados de entrada, ou locais onde os dados climáticos não estão disponíveis, o
projetista deve selecionar os dados climáticos que melhor representem o clima local onde a
edificação está inserida.
Desconforto térmico local: Desconforto causado por condições específicas locais como:
gradiente de temperatura entre o tornozelo e a cabeça, campo radiante assimétrico,
resfriamento convectivo localizado (draft) ou contato com piso quente ou frio.
Convecção Localizada: Resfriamento local do corpo causado pela velocidade do ar.
Escala sétima de conforto térmico: Sensação térmica expressa nas categorias: muito frio,
frio, levemente frio, neutro, levemente quente, quente e muito quente.

84
Excedência de horas de desconforto (horas de desconforto): Número de horas ocupadas em
um período de tempo definido, quando as condições ambientais em um espaço estão fora dos
limites estipulados pela zona de conforto. Unidade: horas (ver Seção 7.3 para cálculo).
Isolamento térmico da vestimenta (Icl): Resistência térmica à troca de calor sensível
apresentada por uma vestimenta, expressa em unidades clo ou em resistência térmica
(m2.K/W). Nota: A definição de isolamento térmico da vestimenta está relacionada com a
transferência de calor do corpo como um todo e, portanto, inclui as partes não cobertas
como as mãos e a cabeça.
Isolamento térmico de peças de uma vestimenta (Iclu ): Resistência à troca de calor sensível
causada pela adição de uma peça de roupa no corpo nu, expressa em unidades clo ou em
resistência térmica (m2.K/W).
Temperatura média predominante do ar externo (tmpa(ext)): Quando usada como variável de
entrada na figura 6.3 para o modelo adaptativo, esta temperatura tem como base a média
ponderada das temperaturas dos sete últimos dias.
met: Unidade usada para descrever a energia gerada dentro do corpo humano através da
atividade metabólica. Cada unidade de met corresponde a 58,2 W/m2, que é igual a energia
produzida por unidade de superfície de uma pessoa média sentada em repouso.
(Nota: A área superficial de uma pessoa média é de 1,8 m2).
Modelo adaptativo: Modelo que relaciona as temperaturas internas aceitáveis com as
temperaturas externas.
Mudança de setpoint: Mudança progressiva de uma variável, tanto por meio de projeto ou
como resultado de um intervalo de tempo entre medições; tipicamente, uma mudança no
controle de setpoint.
Neutralidade térmica: Índice térmico interno que corresponde a um voto neutro na escala de
sensação térmica.
Ocupante representativo: Um indivíduo real ou composto pela média de vários indivíduos
que representa a população ocupante de um espaço por 15 minutos ou mais.
Percentagem de insatisfeitos (PD): Percentagem prevista de pessoas insatisfeitas devido ao
desconforto térmico local.
Percentagem predita de insatisfeitos (PPD): Índice determinado a partir do PMV que
estabelece a percentagem prevista de pessoas insatisfeitas.
Pressão parcial de vapor (pa): Pressão parcial de vapor de qualquer mistura de gás saturada
com água. A pressão parcial de vapor é uma função da temperatura.
Razão de umidade do ar: Razão entre a massa de água existente no ar e a massa de ar seco.
Sensação térmica: Expressão subjetiva consciente da percepção térmica de um ocupante em
relação a um ambiente, expressa na escala sétima de conforto térmico.
Severidade da excedência de horas de desconforto (graus-hora de desconforto): Número de
horas ocupadas (em um período de tempo definido) em que as condições ambientais estão
fora dos limites da zona de conforto térmico ponderadas pelo grau de excedência além do
limite. Unidade: escala PMV x horas; ou temperatura x horas. (para cálculo, ver Seção 7.3)

85
Taxa metabólica (M): Taxa de transformação da energia química em calor e trabalho
mecânico através da atividade metabólica dentro do organismo, expressa em unidades met ou
W/m2.
Temperatura de ponto de orvalho (tdp): Temperatura na qual o vapor de água em um volume
de ar úmido, a uma pressão barométrica constante, irá condensar na forma de água líquida.
Temperatura do ar (ta): Temperatura média do ar ao redor do ocupante.
Temperatura do piso (tf:): Temperatura da superfície do piso em contato com os sapatos dos
ocupantes.
Temperatura média diária externa (tmd(ext)): Média aritimética de um período de 24 horas
para ser utilizada na seção 6 no cálculo da média predominante da temperatura do ar externo.
Temperatura efetiva padrão (SET): Temperatura de um ambiente imaginário a 50% de
umidade relativa do ar, < 0,1 m/s de velocidade do ar, e tr = ta, no qual a perda total de calor
da pele de um ocupante imaginário com atividade metabólica de 1,0 met, e roupa de 0,6 clo, é
a mesma que da pessoa no ambiente real com roupa e atividade reais.
Temperatura radiante média (tr): Temperatura uniforme das superfícies de um ambiente
imaginário no qual o ocupante trocaria a mesma quantidade de calor por radiação que no
ambiente real não uniforme.
Temperatura operativa (to): Temperatura uniforme das superfícies de um ambiente
imaginário no qual o ocupante trocaria a mesma quantidade de calor por radiação mais
convecção que no ambiente real não uniforme.
Umidade: termo genérico para referenciar o teor de umidade no ar. É expressa em termos de
diversas variáveis termodinâmicas, incluindo a pressão de vapor d’água, temperatura de ponto
de orvalho, razão de umidade, e umidade relativa.
Velocidade do ar: Movimento do ar expresso em m/s, sem considerar a direção.
Velocidade do ar máxima: Maior valor de velocidade do ar nas três alturas típicas de
medição.
Velocidade média do ar: é a velocidade média do ar (temporal e local) ao redor de um
ocupante representativo. A média espacial deve considerar 3 alturas diferentes, assim como
na temperatura média do ar. A velocidade média do ar deve ser calculada considerando um
período não inferior a 1 minuto, nem superior a 3 minutos. Variações que ocorram em um
período maior de tempo devem ser tratadas como valores diferentes de velocidade do ar.
Voto médio predito (PMV): Índice que prevê o valor médio da sensação térmica de um
grande número de pessoas na escala sétima de sensação térmica.
Zona de conforto: Faixa de variação bi dimensional, geralmente representada sobre a carta
psicrométrica, da temperatura operativa e umidade relativa do ar na qual se prevê condições
de aceitabilidade térmica para valores particulares de velocidade do ar, taxa metabólica e
isolamento de vestimenta.
Zona ocupada: A zona normalmente ocupada por pessoas no ambiente, geralmente
considerada entre o piso e 1,8 m de altura, e a mais de 1,0 m de distância das paredes e
janelas externas ou equipamentos fixos de condicionamento ambiental, e 0,3 m de paredes
internas.

86
5. REQUISITOS GERAIS
5.1 A documentação das informações ligadas à aplicação desta norma devem ser feitas de
acordo com a seção 7 e 8.
5.2 Todos os espaços nos quais a norma está sendo aplicada e também aqueles para os quais
ela não será aplicada devem ser identificados.
5.3 Para cada tipo de espaço, pelo menos um ocupante representativo deve ser definido. Se
algum conjunto de ocupantes for excluído da análise, estes ocupantes também deverão ser
identificados.
5.4 Para cada ocupante representativo é necessário atribuir uma taxa metabólica (M) em met e
o isolamento da vestimenta (I) em clo.
5.5 As condições do ambiente requeridas para conforto térmico são determinadas de acordo
com a Seção 6 desta norma.
6. CONDIÇÕES REQUERIDAS DE CONFORTO TÉRMICO
6.1 Introdução
Esta seção deve ser usada para determinar as condições térmicas aceitáveis do ambiente para
cada usuário representativo de cada espaço. A percentagem de pessoas que classificarão o
ambiente como confortável deve ser identificada para cada ambiente.
As seis variáveis abaixo devem ser determinadas para definir as condições aceitáveis de
conforto térmico.
1. Taxa metabólica
2. Isolamento da vestimenta
3. Temperatura do ar
4. Temperatura radiante média
5. Umidade do ar
6. Velocidade do ar
Primeiramente são apresentadas as condições gerais requeridas de conforto térmico (Seção
6.2), e em seguida os métodos utilizados para definir as condições de aceitabilidade térmica
para ambientes condicionados artificialmente (Seção 6.3) para ambientes condicionados
naturalmente (Seção 6.4) e para ambientes operados em modo misto (Seção 6.5).
Nota: Pessoas que acabaram de entrar em um ambiente que atende aos requisistos de conforto
térmico desta norma podem não classificá-lo como ―confortável‖ se eles tiverem
experimentado diferentes condições ambientais imediatamente antes de trocarem de
ambiente. O efeito da exposição prévia ou do metabolismo pode afetar a percepção de
conforto em um intervalo de tempo aproximado de 1 hora.
6.2 Requisitos Gerais
6.2.1 Temperatura operativa
A zona de conforto é determinada em termos de uma variação de temperaturas operativas que
resultem em aceitabilidade térmica do ambiente, ou, em termos de uma combinação de
temperatura do ar e temperatura radiante média que as pessoas considerem termicamente
aceitável.
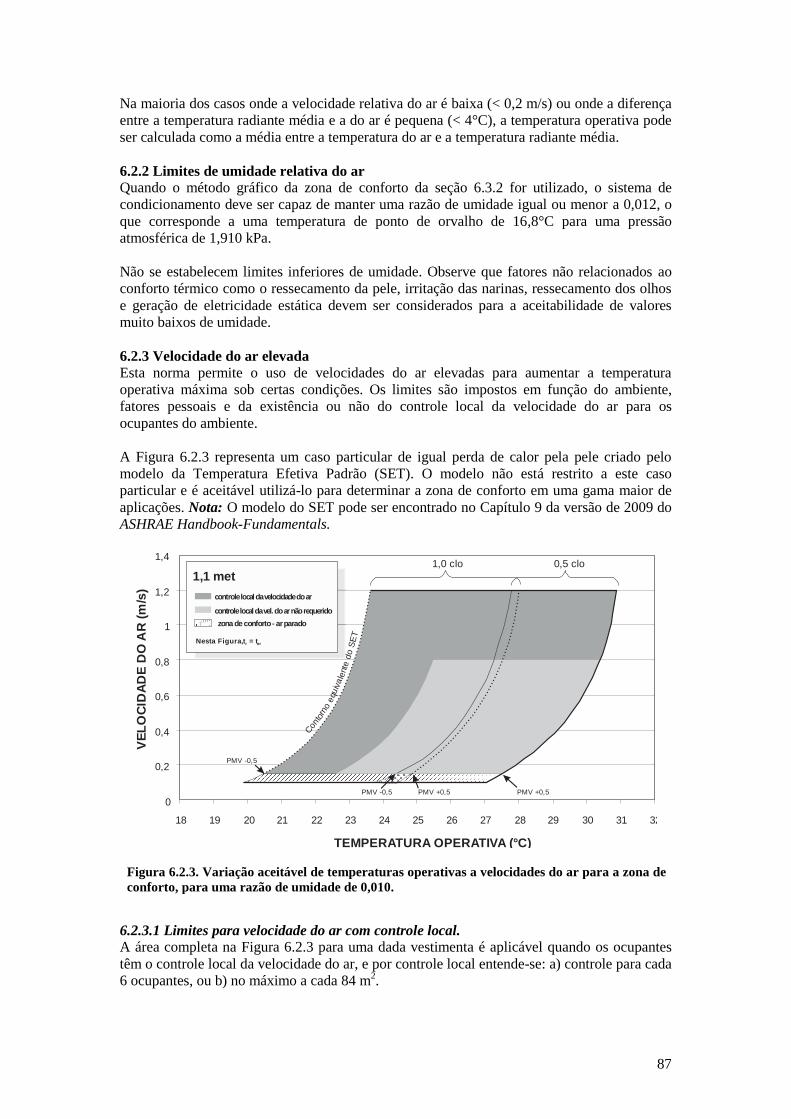
87
Na maioria dos casos onde a velocidade relativa do ar é baixa (< 0,2 m/s) ou onde a diferença
entre a temperatura radiante média e a do ar é pequena (< 4°C), a temperatura operativa pode
ser calculada como a média entre a temperatura do ar e a temperatura radiante média.
6.2.2 Limites de umidade relativa do ar
Quando o método gráfico da zona de conforto da seção 6.3.2 for utilizado, o sistema de
condicionamento deve ser capaz de manter uma razão de umidade igual ou menor a 0,012, o
que corresponde a uma temperatura de ponto de orvalho de 16,8°C para uma pressão
atmosférica de 1,910 kPa.
Não se estabelecem limites inferiores de umidade. Observe que fatores não relacionados ao
conforto térmico como o ressecamento da pele, irritação das narinas, ressecamento dos olhos
e geração de eletricidade estática devem ser considerados para a aceitabilidade de valores
muito baixos de umidade.
6.2.3 Velocidade do ar elevada
Esta norma permite o uso de velocidades do ar elevadas para aumentar a temperatura
operativa máxima sob certas condições. Os limites são impostos em função do ambiente,
fatores pessoais e da existência ou não do controle local da velocidade do ar para os
ocupantes do ambiente.
A Figura 6.2.3 representa um caso particular de igual perda de calor pela pele criado pelo
modelo da Temperatura Efetiva Padrão (SET). O modelo não está restrito a este caso
particular e é aceitável utilizá-lo para determinar a zona de conforto em uma gama maior de
aplicações. Nota: O modelo do SET pode ser encontrado no Capítulo 9 da versão de 2009 do
ASHRAE Handbook-Fundamentals.
Figura 6.2.3. Variação aceitável de temperaturas operativas a velocidades do ar para a zona de
conforto, para uma razão de umidade de 0,010.
6.2.3.1 Limites para velocidade do ar com controle local.
A área completa na Figura 6.2.3 para uma dada vestimenta é aplicável quando os ocupantes
têm o controle local da velocidade do ar, e por controle local entende-se: a) controle para cada
6 ocupantes, ou b) no máximo a cada 84 m2.
TEMPERATURA OPERATIVA (°C)
VE
LO
CID
AD
E D
O A
R (
m/s
)
1,4
1,2
1
0,8
0,6
0,4
0,2
0
18 19 20 21 22 23 24 25 26 27 28 29 30 31 32
1,0 clo 0,5 clo
PMV -0,5
PMV -0,5 PMV +0,5
Con
torn
o e
quiv
ale
nte d
o S
ET
1,1 met
controle local da velocidade do ar
controle local da vel. do ar não requerido
zona de conforto - ar parado
Nesta Figura, t = tr ar
PMV +0,5

88
A faixa de variação do controle deve prever velocidades do ar adequadas para pessoas em
atividade sedentária. O ajuste da velocidade do ar deve ser contínuo, ou no máximo em
intervalos de 0,25 m/s, considerando medições no local ocupado pelos usuários.
Exceção: Em ambientes ocupados por múltiplos usuários, para atividades em grupo, como
salas de aula e salas de conferência, pelo menos um controle deve estar disponível para cada
ambiente, independente do seu tamanho. Ambientes que podem ser subdivididos por paredes
móveis devem ter um controle para cada subdivisão.
6.2.3.2 Limites para velocidade do ar sem controle local
Caso os ocupantes não tenham controle sobre a velocidade do ar, os limites estabelecidos na
Figura 6.2.3 (área cinza clara) devem ser usados.
Exceção: limites de controle local não se aplicam para atividades cuja taxa metabólica excede
o valor de 1,3 met. Para atividades com 1,3 met ou mais, os limites aqui especificados são
conservativos, e velocidades do ar maiores podem ser usadas a critério do projetista.
• Para temperaturas operativas acima de 25,5 °C, o limite superior da velocidade do ar deve
ser 0,8 m/s;
• Para temperaturas operativas abaixo de 22,5 °C, o limite para a velocidade média do ar e
local máxima deve ser 0,15 m/s;
• Para temperaturas operativas entre 22,5 °C e 25,5 °C, a velocidade média do ar permitida
deve seguir a curva para 0,6 clo, 1,1 met e SET da Figura 6.2.3. É aceitável aproximar a
curva pela Equação 1 a seguir:
( ) ( )
(Equação 1)
As curvas da Figura 6.2.3 se deslocam para a esquerda ou direita de acordo com a mudança
do clo ou do met. Um aumento de 0,1 clo ou 0,1 met corresponde respectivamente a uma
redução de 0,8°C ou 0,5°C na temperatura operativa; da mesma forma, uma redução de 0,1
clo ou 0,1 met corresponde a um aumento de 0,8°C ou 0,5°C na temperatura operativa.
Nota: Para temperaturas operativas acima de 22,5°C a velocidade do ar deve ser medida
conforme especifica a Seção 7.2.3. Para temperaturas operativas abaixo de 22,5°C a
velocidade média do ar deve atender às especificações de medição da Seção 7.3.
6.2.4 Desconforto térmico local
O desconforto térmico local pode ser causado pela diferença na temperatura do ar entre a
altura dos pés e da cabeça, por assimetria no campo radiante, por resfriamento convectivo
localizado ou através do contato com pisos frios ou quentes. Os requisitos para os limites
destes valores são especificados nesta seção. Tais limites se aplicam a pessoas com roupas
leves (0,5 a 0,7 clo) que desenvolvem atividades sedentárias (1,0 a 1,3 met). Quando a taxa
metabólica é mais alta e o isolamento da vestimenta é maior, as pessoas ficam menos
sensíveis, e o risco de desconforto local é menor. Portanto é aceitável utilizar os limites aqui
estabelecidos para taxas metabólicas maiores e isolamentos de vestimenta maiores, pois os
valores dos limites serão conservativos.
É importante frisar que as pessoas são mais sensíveis ao desconforto local quando o corpo
está mais frio que o neutro, e menos sensíveis quando o corpo estiver mais quente que o
neutro. Os requisitos desta seção estão baseados em temperaturas mais próximas do centro da
zona de conforto. Os requisitos se aplicam a toda zona, mas serão mais conservativos perto

89
dos limites superiores de temperatura da zona de conforto, podendo subestimar perto dos
limites inferiores de temperatura da zona de conforto.
A Tabela 6.2.4 especifica o percentual esperado de insatisfeitos (PD) para cada tipo de
desconforto térmico local descrito nas Seções 6.2.4.1 até a 6.2.4.4. Todos os critérios de
desconforto local devem ser atendidos simultaneamente nos níveis especificados para que o
ambiente atenda a esta norma. Os limites esperados de desconforto para cada um dos critérios
devem ser especificados.
TABELA 6.2.4
Percentagem limite de insatisfeitos (PD) devido ao desconforto local
PD devido à
Convecção Localizada
para Temperaturas
Operativas abaixo de
22,5
PD devido ao
Gradiente na
Temperatura
Vertical
PD devido aos Pisos
Quentes ou Frios
PD devido à
Assimetria no
Campo Radiante
< 20% < 5% < 10% < 5%
6.2.4.1 Assimetria da temperatura radiante
O campo radiante ao redor da pessoa pode ser assimétrico devido às superfícies frias ou
quentes, ou radiação solar direta. Esta assimetria pode causar desconforto localizado e reduzir
a aceitabilidade térmica do ambiente. Em geral, as pessoas são mais sensíveis às assimetrias
causadas por tetos quentes do que às paredes quentes ou frias. A Figura 6.2.4.1 apresenta os
valores percentuais de ocupantes insatisfeitos em função da assimetria na temperatura
radiante causada por tetos quentes, paredes frias, tetos frios e paredes quentes.
Os limites para assimetria na temperatura radiante são especificados na Tabela 6.2.4.1.
Alternativamente pode-se usar a Figura 6.2.4.1 em conjunto com os limites de PD da Tabela
6.2.4 para determinação da assimetria permitida.
Figura 6.2.4.1 Desconforto térmico local causado pela assimetria na temperatura radiante.
ASSIMETRIA DE TEMPERATURA RADIANTE (°C)
INS
AT
ISF
EIT
OS
0 5 10 15 20 25 30 35 401
2
4
6
810
20
40
6080
%
DESCONFORTO TÉRMICO LOCAL CAUSADO PELA ASSIMETRIA DE RADIAÇÃO
PAREDES FRIAS
PAREDES QUENTES
TETOS FRIOS
TETOS QUENTES

90
TABELA 6.2.4.1
Assimetria máxima permitida na temperatura radiante
Assimetria na temperatura radiante °C
Teto quente Parede fria Teto frio Parede quente
< 5 < 10 < 14 < 23
6.2.4.2 Convecção localizada
O resfriamento localizado causado pelo deslocamento do ar quando o corpo está abaixo da
temperatura neutra pode causar desconforto. Este desconforto depende da velocidade do ar,
temperatura do ar, atividade e vestimenta. A sensitividade é maior onde a pele não tiver
cobertura da vestimenta (cabeça e pescoço).
Para temperaturas operativas abaixo de 22,5°C a velocidade máxima do ar para a zona de
conforto não deve exceder 0,15 m/s em qualquer local do corpo. Este limite se aplica ao
deslocamento do ar causado por janelas e sistema de ar condicionado. É aceitável que a
velocidade do ar exceda estes limites, desde que os ocupantes tenham controle local, como
estabelecido na Seção 6.2.3.1.
6.2.4.3 Gradiente vertical de temperatura
Estratificação térmica que resulta na temperatura mais alta ao nível da cabeça que dos
tornozelos, podendo causar desconforto térmico localizado. A Figura 6.2.4.3 apresenta o
percentual predito de insatisfeitos em função da diferença de temperatura entre a cabeça e os
tornozelos. Temperaturas mais baixas ao nível da cabeça são raras, e percebidas como
favoráveis pelos usuários, mas não são utilizadas nesta norma.
Existem duas opções para determinar a diferença aceitável entre a temperatura no nível da
cabeça e dos tornozelos: utilizando-se a Tabela 6.2.4.3, ou a Figura 6.2.4.3 em conjunto com
a Tabela 6.2.4.
Figura 6.2.4.3. Desconforto térmico local causado pelo gradiente de temperatura vertical.
TABELA 6.2.4.3
Gradiente de temperatura vertical permitido entre cabeça e tornozelos
Gradiente de temperatura vertical, °C
< 3
INS
AT
ISF
EIT
OS
DIFERENÇA DE TEMPERATURA DO AR ENTRE A CABEÇA E OS PÉS (°C)
0 2 4 6 8 101
2
4
68
10
20
40
6080%
DESCONFORTO TÉRMICO LOCAL CAUSADO PELO GRADIENTE VERTICAL DE TEMPERATURA
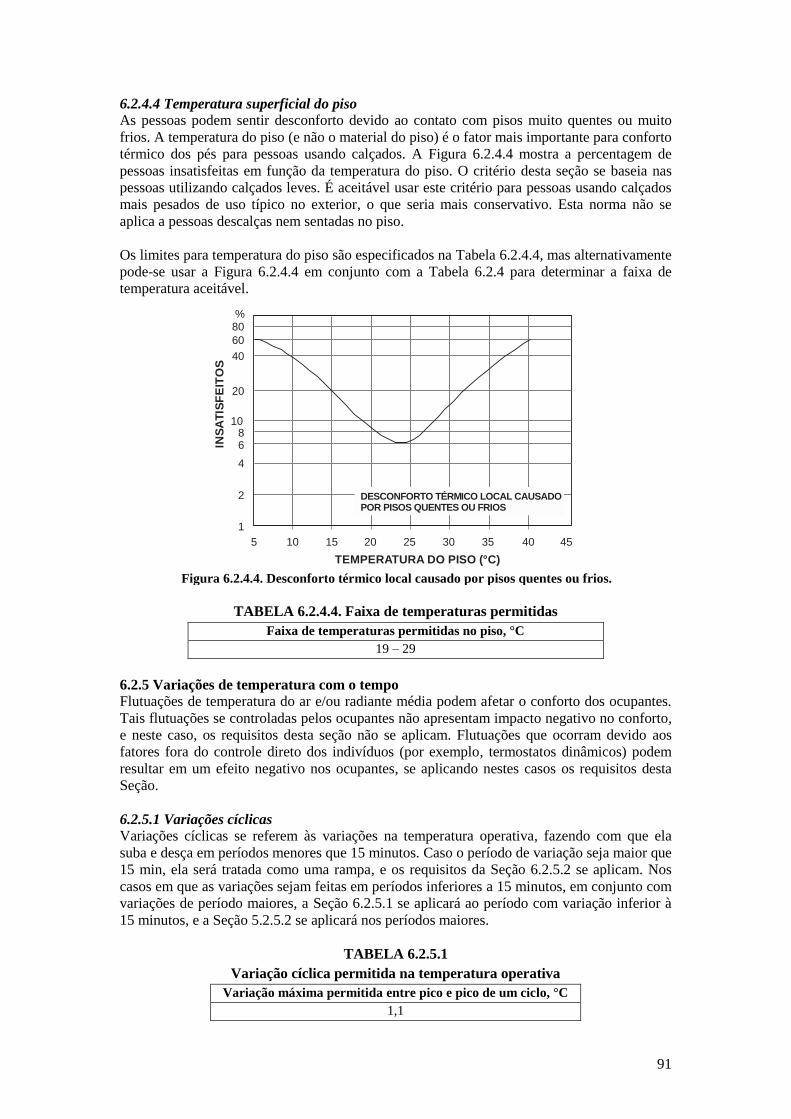
91
6.2.4.4 Temperatura superficial do piso
As pessoas podem sentir desconforto devido ao contato com pisos muito quentes ou muito
frios. A temperatura do piso (e não o material do piso) é o fator mais importante para conforto
térmico dos pés para pessoas usando calçados. A Figura 6.2.4.4 mostra a percentagem de
pessoas insatisfeitas em função da temperatura do piso. O critério desta seção se baseia nas
pessoas utilizando calçados leves. É aceitável usar este critério para pessoas usando calçados
mais pesados de uso típico no exterior, o que seria mais conservativo. Esta norma não se
aplica a pessoas descalças nem sentadas no piso.
Os limites para temperatura do piso são especificados na Tabela 6.2.4.4, mas alternativamente
pode-se usar a Figura 6.2.4.4 em conjunto com a Tabela 6.2.4 para determinar a faixa de
temperatura aceitável.
Figura 6.2.4.4. Desconforto térmico local causado por pisos quentes ou frios.
TABELA 6.2.4.4. Faixa de temperaturas permitidas
Faixa de temperaturas permitidas no piso, °C
19 – 29
6.2.5 Variações de temperatura com o tempo
Flutuações de temperatura do ar e/ou radiante média podem afetar o conforto dos ocupantes.
Tais flutuações se controladas pelos ocupantes não apresentam impacto negativo no conforto,
e neste caso, os requisitos desta seção não se aplicam. Flutuações que ocorram devido aos
fatores fora do controle direto dos indivíduos (por exemplo, termostatos dinâmicos) podem
resultar em um efeito negativo nos ocupantes, se aplicando nestes casos os requisitos desta
Seção.
6.2.5.1 Variações cíclicas
Variações cíclicas se referem às variações na temperatura operativa, fazendo com que ela
suba e desça em períodos menores que 15 minutos. Caso o período de variação seja maior que
15 min, ela será tratada como uma rampa, e os requisitos da Seção 6.2.5.2 se aplicam. Nos
casos em que as variações sejam feitas em períodos inferiores a 15 minutos, em conjunto com
variações de período maiores, a Seção 6.2.5.1 se aplicará ao período com variação inferior à
15 minutos, e a Seção 5.2.5.2 se aplicará nos períodos maiores.
TABELA 6.2.5.1
Variação cíclica permitida na temperatura operativa
Variação máxima permitida entre pico e pico de um ciclo, °C
1,1
TEMPERATURA DO PISO (°C)
INS
AT
ISF
EIT
OS
2
1
4
68
10
20
40
60
80%
5 10 15 20 25 30 35 40 45
DESCONFORTO TÉRMICO LOCAL CAUSADO POR PISOS QUENTES OU FRIOS

92
6.2.5.2 Rampas e alterações
Rampas de temperatura operativa são variações não cíclicas com períodos maiores que 15
minutos. As alterações se referem às mudanças passivas da temperatura do ambiente,
enquanto que as rampas são provocadas por mudanças controladas. Os requisitos desta seção
se aplicam alterações e rampas.
A Tabela 6.2.5.2 especifica a máxima alteração na temperatura operativa permitida em um
período de tempo. Para qualquer período de tempo, o requisito mais restritivo da Tabela
6.2.5.2 será aplicado. Por exemplo, a temperatura operativa não deve mudar mais que 2,2°C
durante o período de 1h; também não deve mudar mais que 1,1°C durante períodos de 0,25h
em um período total de 1h. Caso as variações sejam criadas através do controle do usuário,
valores maiores podem ser aceitos.
TABELA 6.2.5.2
Valores limites de rampas e variações
Período de tempo, h. 0,25 0,5 1 2 4
Máxima alteração permitida na
temperatura operativa, °C.
1,1
1,7
2,2
2,8
3,3
6.3 Método para determinação das condições térmicas aceitáveis em ambientes
ocupados e condicionados artificialmente.
6.3.1 Requisitos Gerais
Quando a seção 6.3 for usada para determinar as condições de conforto térmico, os requisitos
das subseções 6.2.1, 6.2.2, 6.2.3, 6.2.4 e 6.2.5 devem ser atendidos. Esta norma recomenda
uma porcentagem específica de ocupantes que classifiquem o ambiente como aceitável e as
condições ambientais térmicas associadas a esta porcentagem.
6.3.2 Método Analítico para determinação da zona de conforto para ambientes típicos
Este método deve ser utilizado apenas quando o usuário representativo tiver atividade
metabólica entre 1,0 e 1,3 met, isolamento térmico da vestimenta entre 0,5 e 1,0 clo, e em
espaços com velocidade do ar inferior a 0,2 m/s. A maioria dos escritórios está nesta situação.
A Figura 6.3.2 especifica a zona de conforto para ambientes que cumprem o critério acima.
Duas zonas estão desenhadas: uma para 0,5 clo (verão) de isolamento térmico de vestimentas
e outra para 1,0 clo (inverno). Esta zona prevê uma aceitabilidade de 80% pelos ocupantes.
Tal valor tem como base 10% de usuários termicamente insatisfeitos (considerando o corpo
como um todo e o índice PMV/PPD) mais um adicional de 10% de insatisfeitos devido ao
desconforto localizado. O apêndice C apresenta uma lista dos valores de entrada para o
cálculo das zonas destes gráficos com o programa de cálculo do PMV/PPD.
Zonas de conforto para valores intermediários de isolamento de vestimenta podem ser
determinados por interpolação linear entre os limites de 0,5 e 1,0 clo, usando as seguintes
Equações 2 e 3:
[( ) ( ) ]
(Equação 2)
[( ) ( ) ] (Equação 3)

93
Onde:
Tmax, Icl = limite superior da temperatura operativa para isolamento de vestimenta (Icl);
Tmin, Icl = limite inferior da temperatura operativa para isolamento de vestimenta (Icl);
Icl = isolamento térmico da vestimenta em questão (clo).
O limite superior da zona de conforto pode ser ampliado com velocidades do ar elevadas se os
critérios da seção 6.2.3 forem cumpridos.
Figura 6.3.2 Método Analítico para Zona de Conforto: Variações aceitáveis de temperatura
operativa e umidade para ambientes que cumprem o especificado na seção 6.2 (1,1 met; 0,5 e 1,0
clo).
6.3.3 Modelo Computacional para avaliação de ambientes internos
Este método pode ser aplicado em ambientes onde a atividade metabólica dos ocupantes
esteja entre 1,0 e 2,0 met, e o isolamento térmico da vestimenta for menor que 1,5 clo. Veja o
Apêndice A para estimativas de taxas metabólicas e apêndice B para estimativa do isolamento
de vestimentas.
A escala sétima que foi desenvolvida para quantificar a sensação térmica das pessoas é
definida abaixo:
+3 muito quente
+2 quente
+1 levemente quente
0 neutro
–1 levemente frio
–2 frio
–3 muito frio
TEMP
ERATU
RA
DE B
ULB
O Ú
MID
O (°C
)
100 80 60
40
20
353025201510
10
15
20
25
000
002
004
006
008
010
012
014
016
018
020
022
024
026
UMIDADE RELATIVA (%)
RA
ZÃ
O D
E U
MID
AD
E (K
g
)H
O / K
g A
R S
EC
O2
TEMPERATURA OPERATIVA (°C)(½ bulbo seco + ½ TMR - para ar parado)
Não é recomendado um limitemínimo de umidade para o método gráfico.
Veja a seção 5.2.2.
Zona de con forto se deslocará
para a esquerda quando:
- O clo fo r maio r
- A taxa de metabo lismo fo r maio r
- A temperatu ra rad ian te fo r maio r
(Veja a seção 5.2.1.1)
Zona 1,0 clo
Zona 0,5 clo
Para taxas de umidade superiores a 0.012,é requerida a utilização do Modelo Computacional.
Veja a seção 5.2.1.2.
Zona de con forto se deslocará
para a d ireita quando:
- O clo fo r menor
- A taxa de metabo lismo fo r menor
- A temperatu ra rad ian te fo r menor
(Veja a seção 5.2.1.1)
velo
cid
ade d
o a
r 1,2
m/s
Para a determinar o efeito resfriativo causado por valores mais altos de velocidade do ar, a Seção 5.2.3 deve ser aplicada.
Quando este Gráfico fo r ap licado com base na seção 5.2.1.1,
a segu in tes limitações devem ser consideradas:
- Ap licar u tilizando a Temperatu ra Operativa - este g ráfico não pode
ser u tilizado com base na temperatu ra de bu lbo seco sozinha.
(Ver apênd ice C para aproximações aceitáveis);
- Ap licar somente quando os requ isitos das seções 5.2.3 até
a 5.2.5.2 fo rem atend idos.
Outros caminhos para con formidade:
Ver a Seção 5.2.1.2 para u tilização do Método com o
Modelo Computacional e a Seção 5.3 para o MétodoOpcional para Espaços Ven tilados Natu ralmente.
Para requ isitos de con formidade ad icionais,ver as Seções 6 e 7.

94
O modelo do voto médio predito (PMV) usa o princípio do balanço de calor para relacionar as
6 variáveis principais de conforto térmico (listadas na Seção 6.1) com a resposta das pessoas
na escala acima. O índice PPD (percentagem predita de insatisfeitos) está relacionado com o
PMV como descrito na Figura 6.3.3, e se baseia no princípio de que as pessoas que votam
―+3‖, ―+2‖, ―2‖, ―-3‖ estão instatisfeitas. O PPD, de uma maneira simplificada, é simétrico ao
redor do PMV neutro.
A Tabela 6.3.3 define a faixa de valores recomendados para o PMV e PPD para aplicações
típicas, sendo também a base do Método Analítico da Seção 6.3.2. A zona de conforto é
definida pela combinação das seis variáveis de conforto térmico para as quais o PMV está
dentro dos limites apresentados na Tabela 6.3.3. O modelo do PMV deve ser calculado com
as seis variáveis, e se o valor do PMV estiver dentro das variações recomendadas, as
condições estarão dentro da zona de conforto.
O uso do modelo do PMV nesta norma é limitado às velocidades do ar inferiores a 0,20 m/s.
É aceitável usar velocidades acima deste valor (0,20 m/s) para ampliar o limite superior da
zona de conforto em algumas circunstâncias. A Seção 6.2.3 descreve o método e os critérios
requeridos para os ajustes necessários.
Existem vários programas computacionais para o cálculo do PMV/PPD. O código base do
apêndice C deve ser utilizado na aplicação desta norma. Caso outra versão seja utilizada,
deve-se verificar se a mesma produz resultados idênticos aos do apêndice C, documentando
esta verificação.
Figura 6.3.3. Percentagem predita de insatisfeitos (PPD) em função do voto médio predito
(PMV).
TABELA 6.3.3.
Ambiente termicamente aceitável para conforto térmico geral
PPD PMV
< 10 –0,5 < PMV < +0,5
6.4 Método para determinação das condições térmicas aceitáveis em ambientes
naturalmente condicionados controlados pelos usuários.
6.4.1 Requisitos Gerais
Este método se aplica em ambientes naturalmente condicionados, onde as janelas podem ser
operadas e ajustadas pelos ocupantes de acordo com suas necessidades. A utilização deste
método deve seguir os seguintes critérios:

95
6.4.1.1 Não deve existir nenhum sistema de condicionamento artificial operando em tempo
integral durante as horas ocupadas.
6.4.1.2 Ocupantes devem desenvolver atividades sedentárias com taxas metabólicas entre 1,0
e 1,3 met. (Ver apêndice A para estimativas de taxas metabólicas).
6.4.1.3 Ocupantes podem variar a sua vestimenta em uma faixa de 0,5 – 1,0 clo (Ver apêndice
B para estimativa de isolamento de vestimentas).
6.4.1.4 A temperatura média predominante do ar externo esteja entre 10 °C e 33,5 °C.
6.4.2 Método de avaliação
6.4.2.1 A temperatura operativa interna admissível deve ser determinada pela Figura 6.4.2,
usando 80% de aceitabilidade. Os limites de 90% são incluídos apenas para informação.
6.4.2.2 Pode-se usar a seguintes equações que correspondem à faixa de temperatura operativa
aceitável da Figura 6.4.2:
Limite superior de 80% de aceitabilidade (°C) = 0,31 tpma(out) + 21,3
Limite inferior de 80% de aceitabilidade (°C) = 0,31 tpma(out) + 14,3
6.4.2.3 Os efeitos de desconforto térmico local, roupa, atividade metabólica, umidade e
velocidade do ar não precisam ser analisados isoladamente, pois já foram considerados na
Figura 6.4.2.
Figura 6.4.2. Faixa de temperatura operativa aceitável para ambientes naturalmente
condicionados (os limites de 80% são normativos e os de 90% informativos).
6.4.2.4 Se t0 > 25°C, o aumento dos limites superiores de aceitabilidade na Figura 6.4.2 pelo
correspondente Δt0 na Tabela 6.4.2 deve ser permitido.
Temperatura média do ar externo predominante (°C)
5 10 15 20 25 30 35
14
16
18
20
22
24
26
28
30
32
Te
mp
era
tura
op
era
tiv
a i
nte
rna
(°C
)
limite 90% de aceitabilidade
limite 80% de aceitabilidade

96
TABELA 6.4.2
Aumento nos limites de temperatura operativa aceitável (Δt0) em ambientes
naturalmente condicionados (Figura 6.4.2) resultantes de velocidades do ar acima de
0,3 m/s.
Velocidade do ar
0,6 m/s
Velocidade do ar
0,9 m/s
Velocidade do ar
1,2 m/s
1,2°C 1,8°C 2,2°C
6.4.3 Temperatura média predominante do ar externo
Nos espaços que atendem os critérios estabelecidos no item 6.4, a faixa de temperatura
operativa permitida no interior do edifício deve ser determinada a partir da Figura 6.4.2,
sendo a temperatura média predominante do ar externo determinada com base nos sete
últimos dias antes do dia em questão. A temperatura média predominante do ar externo deve
ser calculada através da equação:
( )
(Equação 4)
Onde: ( ) é a temperatura média predominante do ar externo;
é a temperatura média do dia anterior ao dia em questão; é a temperatura média do dia
anterior ao dia anterior, e assim por diante.
A temperatura média do ar externo diária para cada um dos dias sequenciais ( ; )
deve ser uma média aritmética simples de todas as observações de temperatura de bulbo seco
ao ar livre considerando as 24 horas do dia.
Nota: quando os dados meteorológicos não estiverem disponíveis para o cálculo da
temperatura média predominante do ar externo, é satisfatória a utilização da temperatura
média mensal para o dia em questão.
6.5 Método para determinação das condições térmicas aceitáveis em ambientes híbridos
(mixed-mode buildings)
6.5.1 Requisitos Gerais
Quando a Seção 6.5 for utilizada para determinação das condições de conforto térmico, os
requisitos da Seção 6.3.1 e Seção 6.4.1 devem ser respeitados, de acordo com o modelo e
critério adotado durante a avaliação. Esta norma recomenda uma porcentagem específica de
ocupantes que classifiquem o ambiente como aceitável e as condições ambientais térmicas
associadas a esta porcentagem.
6.5.2 Método de avaliação
Este método deve ser utilizado quando o sistema de ventilação/climatização dos ambientes
avaliados operar de forma mista, alternando entre a ventilação natural proveniente de janelas
operáveis (manualmente ou automaticamente controladas) e sistemas mecânicos
(equipamentos de refrigeração e distribuição do ar).
Os sistemas de ventilação mista devem representar uma maneira adequada de combinação
entre os benefícios do ar condicionado e da ventilação natural, e para isso, sua avaliação deve
ser feita de forma criteriosa, utilizando os dois métodos separadamente, de acordo com a
condição predominante:

97
6.5.2.1 O método descrito na seção 6.3 deve ser utilizado sempre que a condição
predominante do ambiente for mecânica (sistemas de resfriamento ou aquecimento artificial),
considerando a estação (condições externas) e a média predominante da temperatura do ar
externo.
6.5.2.2 O método descrito pela Seção 6.4 deve ser utilizado sempre que a condição
predominante do ambiente for natural (ventiladores de teto ou de mesa podem ser inclusos
nesta condição para o incremento da velocidade do ar), considerando a estação (condições
externas) e a média predominante da temperatura do ar externo.
7. FORMAS DE AVALIAR CONFORTO TÉRMICO ATRAVÉS DE MEDIÇÕES
A avaliação das condições de conforto térmico em um edifício pode ser feita através da
consulta aos usuários ou através de medições das variáveis ambientais, estimativa das
variáveis pessoais e uso de um índice de conforto. Como as condições internas podem variar
em função das condições externas é sempre necessário dizer em quais condições o edifício foi
testado e apresenta condições de conforto térmico.
7.1 Conforto a partir da percepção do usuário
O termo ―Conforto Térmico‖ abrange diversos aspectos da percepção do usuário, sendo que
cada um destes aspectos é avaliado de forma diferente através de itens específicos contidos
em um questionário. A melhor maneira de se diagnosticar as condições de conforto térmico
oferecidas por uma edificação é através de perguntas e respostas que reflitam a real percepção
do usuário com relação aos parâmetros climáticos internos (ver apêndice D com um modelo
básico de questionário). As pesquisas de percepção do usuário podem ser instantâneas
(questionários aplicados ao mesmo tempo em que as variáveis ambientais são medidas) ou
longitudinais (primeiro são levantadas todas as características da edificação e depois os
usuários são entrevistados).
7.1.1 Pesquisas de satisfação:
A pesquisa de satisfação considera quão satisfeito o ocupante está com relação às condições
térmicas internas, considerando o período que os mesmos ocupam a edificação e o local de
trabalho. As pesquisas de satisfação devem usar uma escala sétima que varia de ―satisfeito‖
até ―insatisfeito‖, incluindo perguntas que possam levar à identificação das possíveis causas
da insatisfação.
7.1.2 Pesquisa de aceitabilidade, sensação e preferência
Na pesquisa de aceitabilidade as perguntas devem prever se o usuário considera as condições
ambientais ―aceitáveis‖ ou ―inaceitáveis. Para a verificação da sensação térmica deve ser
utilizada a escala sétima da ASHRAE, dividida da seguinte maneira: muito frio (-3), frio (-2),
levemente frio (-1), neutro (0), levemente quente (+1), quente (+2) e muito quente (+3). Com
relação à preferência, as pesquisas devem utilizar a escala: mais aquecido, não mudar ou mais
resfriado. As pesquisas devem ser aplicadas em toda a população ou em uma amostra
representativa, considerando condições representativas dos períodos de operação.
7.1.3 Formas de análise
O percentual de usuários insatisfeitos ou em desconforto térmico deve ser calculado e
comparado com os limites estabelecidos.
7.1.3.1 Pesquisas de satisfação
Calcular a percentagem dos votos nas categorias de apenas satisfeito até muito satisfeito em
relação ao total dos votos. Incluir no relato as questões ligadas à insatisfação e as
quantificações percentuais.

98
7.1.3.2 Pesquisa de aceitabilidade, sensação e preferência
Nas pesquisas de aceitabilidade deve ser calculado o percentual de usuários que consideram o
ambiente ―aceitável‖ ou ―inaceitável. O mesmo deve ser feito com os votos de preferência
térmica, respeitando a escala estipulada (mais aquecido, não mudar, mais resfriado). Nas
pesquisas de sensação térmicaos votos ―+1‖, ―0‖ e ―-1‖ devem ser considerados como
confortáveis, e devem ser divididos pelo total de votos em cada instante de medição.
7.2 Conforto a partir da medição das variáveis ambientais e estimativa das variáveis
pessoais
As quatro variáveis ambientais (temperatura do ar, temperatura radiante média, velocidade do
ar e umidade do ar) devem ser medidas com o auxílio de equipamentos adequados, e
devidamente calibrados. As duas variáveis pessoais (atividade metabólica e vestimenta)
devem ser estimadas através dos questionários, para que seja possível a aplicaçãode um índice
de conforto térmico. A estimativa das variáveis pessoais deve ser feita de acordo com os
anexos A e B desta norma. No caso do índice PMV/PPD, são utilizadas todas as 6 variáveis.
Já no caso do modelo adaptativo só serão utilizadas a temperatura do ar, a temperatura
radiante média e a velocidade do ar.
7.2.1. Medição da temperatura do ar
A temperatura do ar é determinada geralmente por medições de variáveis que são funções de
volumes de líquidos, resistências elétricas, força eletromotriz, etc. Qualquer que seja a
variável com a qual está sendo relacionada à temperatura, a leitura do sensor corresponde
somente à temperatura onde ele se encontra, podendo diferir ou não da temperatura do fluido
geral a ser medido.
Deve ser calculado um valor médio em função da localização do ocupante e do tempo de
exposição. Para o cálculo da média espacial devem ser considerados os valores de
temperatura do ar ao nível do tornozelo, cintura e altura da cabeça, cobrindo no mínimo
pontos pré-determinados que devem ser representativos da área ocupada. Estes níveis
correspondem respectivamente a: 0,10, 0,60 e 1,10 metros para ocupantes sentados e, 0,10,
1,10 e 1,70 metros para ocupantes em pé. Interposições com localizações igualmente
espaçadas também podem ser incluídas na média.
A média temporal é uma média que considera no mínimo 3 minutos de medição, e se aplica a
todas as localizações das médias espaciais, que deve considerar a posição dos usuários no
ambiente.
7.2.1.1 Tipos de sensores de temperatura do ar
Termômetros de expansão: Termômetros de expansão de líquidos (mercúrio, etc.), termômetros de expansão de sólidos.
Termômetros elétricos: Termômetros de resistência variada (resistor de platina,
termistor), termômetros baseados em geração de força eletromotriz (termopares).
Termomanômetros: Variação da pressão de um líquido em função da temperatura.
7.2.1.2 Precauções a serem tomadas na medição da temperatura do ar
Redução do efeito da radiação: Devem ser tomados cuidados para se proteger o
sensor utilizado contra os efeitos da radiação proveniente de superfícies vizinhas,
senão o valor medido não será o correto da temperatura do ar e sim um valor
intermediário entre a temperatura do ar e a temperatura radiante média. Estes
cuidados podem ser efetivados de diferentes maneiras:

99
Reduzindo a emissividade do sensor, utilizando um sensor polido quando o mesmo
for de metal, ou utilizando-se um sensor coberto por tinta reflexiva quando o mesmo
for do tipo isolante.
Reduzindo a diferença de temperatura entre o sensor e as paredes adjacentes a ele.
Quando essa redução não for possível, deve ser utilizada uma barreira radiante entre o
sensor e o ambiente (uma ou mais telas ou chapas refletivas finas, por exemplo, de
alumínio de 0,1 a 0,2 mm). Deve ser deixado um espaço entre a proteção e o sensor
para que haja convecção natural.
Aumentando-se o coeficiente de convecção através de um aumento da velocidade do
ar, utilizando-se ventilação forçada e reduzindo-se o tamanho do sensor.
Inércia térmica do sensor: O sensor requer um determinado tempo para indicar a
temperatura correta, já que a leitura não é instantânea. Uma medição não deve ser
concretizada em um período menor que 1,5 vezes o tempo de resposta (90%) do sensor.
Um sensor responderá mais rapidamente: quanto menor a temperatura do sensor e
mais baixo seu calor específico e, quanto melhor forem as trocas térmicas com o
ambiente.
7.2.1.3 Temperatura local do ar
Temperatura local do ar é definida da mesma forma que a temperatura do ar, exceto por se
referir a um mesmo nível (por exemplo, o nível da cabeça). É necessária pelo menos uma
localização neste nível. Para determinar uma melhor média, é aceitável incluir diversos
pontos ao redor do corpo.
7.2.2. Medição da temperatura radiante média
A temperatura radiante média é definida como a temperatura uniforme de um compartimento
negro (no sentido físico radiante) que troca com um ocupante a mesma quantidade de
radiação térmica que um ambiente real trocaria. É um valor único para todo o corpo, podendo
ser considerado como uma média espacial das superfícies circundantes ponderada por seus
respectivos fatores de forma com relação ao ocupante. O montante de calor radiante ganho ou
perdido pelo corpo pode ser considerado como a soma algébrica de todos os fluxos radiantes
trocados por suas partes expostas com as várias fontes de calor a seu redor. A radiação a que
está sujeita uma pessoa no interior de um ambiente pode ser determinada através das
dimensões do ambiente, suas características térmicas e a localização da pessoa no ambiente.
Este método pode, porém, ser complexo e bastante trabalhoso, uma vez que pode haver várias
fontes emissoras de radiação e de variados tipos.
Para fins da seção 6, a temperatura radiante média também deve ser calculada em função do
tempo. A média temporal deve ser uma média de no mínimo 3 minutos com pelo menos 18
pontos igualmente espaçados no tempo. Se necessário, é aceitável estender o período em até
15 minutos para médias de flutuações cíclicas.
Basicamente, a temperatura radiante média pode ser medida com o auxílio de um termômetro
de globo negro, que possui em seu centro um sensor de temperatura do tipo ―bulbo de
mercúrio‖, ―termopar‖ ou ―resistor‖. Existem globos de diversos diâmetros, mas para facilitar
o cálculo utilizando uma fórmula padrão (que depende do diâmetro), é recomendada a
medição utilizando um globo de 15cm. Quanto menor o diâmetro do globo, maior será o
efeito da temperatura e da velocidade do ar, o que pode levar a imprecisões dos resultados.
Como a superfície externa do globo deve absorver a radiação proveniente das paredes do
ambiente, sua superfície deve ser negra ou com cobertura eletroquímica, ou pintura com tinta
negra.

100
6.2.2.1 Princípios de medição e cálculo
O globo situado em um ambiente tende a um balanço térmico sob os efeitos das trocas
térmicas devido à radiação (proveniente de diferentes fontes do ambiente) e devido aos
efeitos da convecção. Nas medições de conforto térmico é necessário primeiramente
determinar o coeficiente de troca de calor por convecção do globo (Equações 5 e 6), para
depois adotar a equação mais adequada (Equação 7 ou 8), que deve ser aquela representada
pelo coeficiente de maior valor. A verificação do coeficiente de convecção deve ser feita a
partir das seguintes equações:
Convecção Natural:
√
(Equação 5)
Convecção Forçada:
(Equação 6)
Onde:
coeficiente de troca de calor por convecção do globo;
∆T diferença de temperatura (tg - ta);
D diâmetro do globo (normalmente 15 cm);
V velocidade do ar (m/s).
Determinado o maior coeficiente de convecção, as equações a serem adotadas são:
Convecção Natural:
√( ) ( ) √| |
( )
(Equação 7)
Convecção Forçada:
√( ) ( ) ( )
(Equação 8)
6.2.2.2 Precauções a serem tomadas quando se utiliza o globo negro
Como a radiação em um ambiente é um dos principais fatores causadores de desconforto
localizado, a determinação incorreta da temperatura radiante média pode resultar em grandes
erros de medições. As seguintes precauções devem então ser tomadas:
O tempo de resposta do termômetro de globo é de aproximadamente 20/30
minutos, de acordo com as características do globo e condições ambientais.
Leituras sucessivas permitirão que o equilíbrio seja alcançado de maneira mais
eficaz. Em ambientes com variações rápidas de temperatura, radiação e
velocidade do ar, o termômetro de globo não é considerado o instrumento mais
adequado para a medição devido à sua alta inércia térmica.

101
A precisão da medição da temperatura radiante média pode variar de acordo com
as precisões dos outros parâmetros ambientais medidos. A precisão com a qual
está se trabalhando deve ser sempre indicada.
O uso do termômetro de globo representa uma aproximação da temperatura
radiante média à que está sujeita uma pessoa devido à sua forma esférica, que não
corresponde a real forma do corpo humano. Em casos particulares de medição da
radiação proveniente do teto ou do piso, os valores medidos com o globo são
geralmente superestimados quando relacionados aos reais sentidos pelo usuário.
A utilização do termômetro de globo quando exposto à radiação de ondas curtas
(sol, por exemplo) requer uma pintura que apresente a mesma absortividade para
ondas curtas que as superfícies das roupas (cinza médio, por exemplo). Uma
possível alternativa é a realização do cálculo considerando a absortividade da
roupa utilizada pelo usuário.
7.2.3. Medição de velocidade do ar
A velocidade do ar é um parâmetro que deve ser levado em consideração quando se
analisam as trocas de calor por convecção e evaporação. É um parâmetro com grandes
dificuldades na medição devido às constantes flutuações em intensidade e direção no
tempo e espaço. É importante notar que em estudos de conforto térmico as flutuações da
velocidade do ar têm bastante efeito na sensação subjetiva da corrente de ar.
Durante a medição da velocidade do ar deve-se atentar à sensitividade do sensor com
relação à direção do fluxo e às flutuações na intensidade. Para a avaliação de conforto
térmico deve ser utilizado um valor médio de velocidade do ar, medido ao longo de um
intervalo de 1 a 3 minutos. As variações que ocorrem durante um período maior que 3
minutos devem ser tratadas como múltiplos valores de velocidade do ar.
O termo ―velocidade média do ar‖ também incorpora a variação média espacial de medições
realizadas nos 3 níveis prescritos, para pessoas sentadas ou em pé. O cálculo da média pode
ser ponderado pelo pesquisador/projetista da seguinte maneira: O modelo termo-fisiológico
SET se baseia na suposição de que o corpo está exposto a uma velocidade do ar uniforme; no
entanto, os espaços com sistemas ativos ou passivos que promovem condições não uniformes
de velocidade do ar podem promover de maneira mais eficaz a perda de calor sobre a
superfície da pele, o que pode não acontecer em espaços onde a velocidade do ar é uniforme;
portanto, o pesquisador/projetista deve decidir um valor médio apropriado de velocidade do
ar para ser utilizado no Método Gráfico (Figuras do ítem 5.2.3). Uma média adequada deve
incluir velocidades do ar incidentes em partes despidas do corpo (por exemplo, a cabeça), já
que tais partes possuem um maior potencial de resfriamento e de desconforto localizado.
7.2.3.1 Tipos de sensores de velocidade do ar e medição
De uma maneira geral, a velocidade do ar pode ser determinada:
Ou pela utilização de um instrumento omnidirecional, sensível à magnitude da
velocidade do ar independente da sua direção (esfera aquecida);
Ou utilizando 3 sensores direcionais, permitindo que os componentes da velocidade
do ar sejam medidos em 3 eixos perpendiculares. A velocidade do ar pode então ser
determinada através da Equação 9:
√

102
(Equação 9)
7.2.3.2 Precauções a serem tomadas na medição da velocidade do ar
Para a medição da velocidade do ar devem ser levados em consideração os
seguintes fatores: a calibração do instrumento, o tempo de resposta de sensor e o
período de medição (tempo).
Fluxos de ar com alta turbulência e baixa frequência das flutuações das
velocidades necessitam de períodos de medição maiores que os fluxos com baixa
intensidade de turbulência e alta frequência das flutuações das velocidades.
7.2.4. Medição da umidade do ar
A umidade de ar é um valor geral de referência para descrever o teor de umidade no ar. Este
valor é expresso em diversas variáveis termodinâmicas, incluindo a pressão de vapor,
temperatura de ponto de orvalho, e razão de umidade. A umidade absoluta do ar é sempre
considerada para o entendimento da troca de calor por evaporação de um usuário. A alta
umidade do ar reduz a evaporação do suor e conduz ao estresse térmico.
7.2.5 Posição espacial para medição das variáveis
Localização das medições: As medições das variáveis devem ser feitas em locais
ocupados, que sejam representativos de onde os usuários costumam ficar. Caso o
local de ocupação não seja conhecido, as medições devem incluir pelo menos os
seguintes pontos: 1.) o centro da zona e 2.) 1,0 m adentro do centro de cada parede
externa com janela, centralizado a partirdo meio da maior janela.
Medições também devem ser feitas em localizações que resultem em situações
críticas como perto de janelas, perto de saídas de difusores de ar, cantos e recessos.
Altura das medições: Temperatura do ar e velocidade do ar devem ser medidas a 0,1,
0,6, e 1,1 m de altura para ocupantes sentados e a 0,1, 1,1, e 1,7 m de altura para
ocupantes em pé. A temperatura operativa ou o PMV/PPD devem ser medidos ou
calculados a 0,6 m do chão para ocupantes sentados ou 1,1 m para ocupantes em pé.
Caso seja detectada alguma forma de desconforto localizado, as alturas a serem
utilizadas são as mesmas especificadas no item 6.2.4.
7.2.6 Frequência das medições
A frequência das medições deve representar uma amostra das horas ocupadas em um dado
período (ano, estação ou dia típico), ou, devem ser feitas em períodos onde acontecimentos
críticos são esperados. Se existem mudanças significativas na temperatura do ar medições
devem ser feitas a cada 5 minutos por pelo menos duas horas para verificar o atendimento dos
limites especificados em 7.2.5.1
7.2.7 Medições simplificadas usando sistemas de automação predial
Como grande parte dos edifícios novos possui sistema de automação, deve-se prever a
aquisição e armazenamento dos dados de temperatura (com precisão superior a 0,5°C) em
intervalos de 10 a 30 minutos.
7.3 Índices de conforto
Dois índices de conforto podem ser utilizados:
O PMV deve ser usado em ambientes continuamente condicionados e os limites
estabelecidos na Seção 6.3 estabelecem a zona de conforto para 2 tipos de vestimenta.
O movimento do ar pode modificar a zona de conforto como estabelecido em 6.2.3.

103
A temperatura operativa deve ser usada no modelo adaptativo descrito no item 6.3 em
ambientes não condicionados. O movimento do ar pode modificar a zona de conforto
como descrito na Tabela 6.4.2.
Tanto a temperatura operativa como o PMV devem ser calculados ou medidos nas alturas de
0,6 m para pessoas sentadas e 1,1 m para pessoas de pé.
A temperatura operativa deve ser determinada de acordo com o método proposto pelo
ASHRAE Handbook - Fundamentals, Capítulo ―Thermal Comfort‖. Seu cálculo leva em
consideração a temperatura do ar e a temperatura radiante média, utilizando a seguinte
equação:
( ) (Equação 10)
Onde:
é a temperatura operativa;
é a temperatura do ar;
é a temperatura radiante média.
O valor de A é determinado em função da velocidade do ar ( ), de acordo com a tabela
seguinte:
< 0,2 m/s 0,2 até 0,6 m/s 0,6 até 1,0 m/s
A 0,5 0,6 0,7
Na maioria dos casos onde a velocidade relativa do ar é baixa (< 0,2 m/s) ou onde a diferença
entre a temperatura radiante média e a do ar é pequena (< 4°C), a temperatura operativa pode
ser calculada como a média entre a temperatura do ar e a temperatura radiante média. Neste
caso, é imprenscidínvel que os ocupantes estejam realizando atividades físicas sedentárias
(com taxas metabólicas entre 1,0 e 1,3 met), e não estejam expostos à luz solar direta.
7.3.1 Avaliações em um instante de tempo
Estas avaliações podem ser feitas em condições de carga máxima, condições semelhantes à de
projeto, eventos especiais ou diagnostico de falhas ou reclamações.
7.3.2 Avaliações em um intervalo de tempo
Caso existam dados de um período de tempo (dia, estação ou ano) deve-se usar para o calculo
do numero de horas excedidas em que as condições ambientais estão for a da zona de
conforto. O numero de horas excedidas (EH) ou horas de desconforto, é calculado para o
PMV ou método adaptativo como segue:
Para aceitabilidade, sensação e preferencia, usar o EH:
Para o PMV:
EH = Σ Hdisc, onde Hdisc = 1 se |PMV| - 0,5 > 0 e 0 se o oposto ocorrer.
Para o modelo adaptativo:
EH = Σ (H > superior + H < inferior) onde H > superior = 1 se Top > Tsuperior e 0 se
o oposto, e H > inferior = 1 se Top < Tinferior e 0 se o oposto ocorrer.
É necessário fazer cada somatório sobre o número de horas ocupadas e os índices de conforto
para cada hora respectiva. A percentagem de horas excedidas (PEH) é calculada dividindo EH
pelo número de horas ocupadas.

104
A média ponderada do grau de severidade das horas excedidas corresponde ao número de
horas ocupadas em um período de tempo quando as condições estão fora da zona de conforto,
ponderada pelo valor de desvio da zona. As unidades são: PMV.h ou K.h (Kelvin horas)
Para aceitabilidade, sensação e preferencia, usar o SWEH:
Para o PMV:
SWEH = Σ Hdisc (|PMV| - 0,5) em PMV x h.
(Nota: usando a aproximação de Griffith, 0,5 PMV/K, pode-se converter PMV x h do
SWEHs para temperatura x h. A unidade para a média ponderada do desvio da
temperatura (TWEH) é K x h.).
Para o adaptativo:
SWEH = Σ (H> upper (Top – Tupper) + H< lower (Tlower – Top)) em K.h
É possível calcular a média ponderada destes valores de cada ambiente pelas áreas dos
mesmos, de forma a ter um valor único para o edifício.
8. COMPROVAÇÃO DE ATENDIMENTO À NORMA NA ETAPA DE PROJETO
8.1 Projeto
Os edifícios e seus sistemas de condicionamento e controle devem ser projetados para que as
condições de conforto térmico, sob condições climáticas referenciais, sejam mantidas. Esta
norma não trata do projeto destes sistemas, ela trata apenas dos requisitos de conforto térmico
aceitáveis para a maioria das pessoas. Deve-se estabelecer o percentual previsto de
insatisfeitos ou em desconforto térmico, o número de horas excedidas e a média ponderada do
grau de severidade das horas excedidas usando anos climáticos de referência ou típicos (TRY,
TMY) em climas com grandes variações anuais ou dias típicos para climas com pequenas
variações.
8.2 Documentação
O método e as condições de projeto para o uso do edifico devem ser selecionadas e
documentadas como segue:
Nota: Alguns dos requisitos nos itens 1-3 abaixo não se aplicam em ambientes naturalmente
condicionados ou mistos.
1. A temperatura operativa e a umidade (incluindo tolerâncias), as temperaturas externas
de projeto (ver a versão de 2009 do ASHRAE Handbook—Fundamentals, Chapter
14, ―Climatic Design Information‖), e as cargas internas devem ser listadas. As horas
e condições de não atendimento aos requisitos de projeto estabelecidos na Seção 6
devem ser documentadas. Em edifícios complexos e passivos, as horas de não
atendimento talvez tenham que ser calculadas com uso de simulação dinâmica horária
durante um ano.
2. Os valores assumidos no projeto como isolamento da vestimenta (clo) e o nível de
atividade metabólica (met) devem ser documentados, incluindo suas eventuais
variações sazonais.
3. O desconforto térmico local pode ser um fator de difícil análise devido às limitações
das ferramentas de simulação, mas uma narrativa sobre sua consideração na análise

105
deve ser incluída. Quando existirem janelas com área superior a 50% da área de
fachada, velocidade do ar mais alta e estratificação no deslocamento de ar, devem ser
apresentados os cálculos que demonstrem que o desconforto local se encontra dentro
dos limites estipulados na Seção 6.2.4.2.
Os limites a serem usados no cumprimento desta norma são:
- Para edifícios continuamente condicionados devem-se considerar os limites de PMV
+/- 0,5 ou os limites da Seção 6.3, apresentando o numero de horas excedidas (EH) e
a média ponderada do grau de severidade das horas excedidas (SWEH).
- Para edifícios sem condicionamento artificial deve-se considerar os limites da Seção
6.4, apresentando o número de horas excedidas (EH) e a média ponderada do grau de
severidade das horas excedidas (SWEH).
9. COMPROVAÇÃO DE ATENDIMENTO À NORMA DE EDIFICAÇÕES
EXISTENTES
Em edifícios existentes a comprovação pode ser feita para um dia crítico ou para um período
crítico. Deve-se estabelecer o percentual previsto de insatisfeitos ou em desconforto térmico,
o número de horas excedidas e a média ponderada do grau de severidade das horas excedidas
usando os dados disponíveis. Em climas com grandes variações anuais a análise deve cobrir
períodos representativos destas variações, e em climas com pequenas variações é possível
utilizar apenas os dias típicos.
9.1 Através da sensação dos usuários
Os limites a serem usados no cumprimento desta norma são:
EH (ver Seção 7.3.2)
SWEH (ver Seção 7.3.2)
8.2 Através de índices de conforto
Os limites a serem usados no cumprimento desta norma são:
- Para edifícios continuamente condicionados deve-se considerar os limites de PMV
+/- 0.5 ou os limites da Seção 6.3 (Método para determinação das condições térmicas
aceitáveis em ambientes ocupados e condicionados artidicialmente), apresentando o
número de horas excedidas (EH) e a média ponderada do grau de severidade das
horas excedidas (SWEH).
Para edifícios sem climatização artificial os limites da Seção 6.4 (Método para determinação
das condições térmicas aceitáveis em ambientes naturalmente condicionados controlados
pelos usuários) devem se considerados, apresentando o número de horas excedidas (EH) e a
média ponderada do grau de severidade das horas excedidas (SWEH).
10 REFERÊNCIAS
1. ISO 7726:1998, Ergonomics of the thermal environment — Instruments for measuring
physical quantities.
2. ISO 7730:2005, Ergonomics of the Thermal Environment — Analytical Determination
and Interpretation of Thermal Comfort using Calculation of the PMV and PPD Indices and
Local Thermal Comfort Criteria.
3. ASHRAE 2009 Handbook—Fundamentals.
4. Thermal Comfort Tool CD (ASHRAE Item Code 94030).
106
5. ASHRAE Standard 70-2006, Method of Testing for Rating the Performance of Air
Outlets and Inlets.
6. ASHRAE Standard 113-2009, Method of Testing for Room Air Diffusion.
(Este é um apêndice normativo, parte integrante desta norma).
APÊNDICE NORMATIVO A
NÍVEIS DE ATIVIDADE METABÓLICA
Utilização dos dados de taxa metabólica
Os dados apresentados na Tabela A1 foram reproduzidos do Capítulo 9 da versão 2009 do
ASHRAE Handbook-Fundamentals³. Os valores representam as taxas típicas de metabolismo
por unidade de área de superfície corporal de um adulto médio (área de DuBois = 1,8m2),
considerando as atividades desenvolvidas de modo contínuo. Este capítulo do Handbook
fornece informações adicionais para estimar e medir os níveis de atividade. A seguir,
orientações gerais para o uso destes dados.
Nem todas as atividades que podem ser consideradas de interesse estão inclusas na tabela. Os
usuários desta norma devem utilizar seu próprio julgamento para combinar as atividades a
serem consideradas com aquelas atividades similares encontradas na tabela. Alguns dos dados
apresentados nesta tabela são descritos em forma de intervalo, e outros como um valor único.
O formato para uma determinada entrada baseia-se na fonte de dados original, não sendo uma
indicação de quando um intervalo de valores deve ou não ser utilizado. Para qualquer
atividade, com exceção das atividades sedentárias, a taxa metabólica pode variar dependendo
da maneira como o indivíduo executa a tarefa e das circunstâncias em que a tarefa é
executada.
É permitido utilizar uma taxa metabólica média ponderada por um intervalo de tempo
considerando a atividade executada, que pode variar ao longo de um período de uma hora ou
menos. Por exemplo, uma pessoa que dentro de 1 hora costuma passar 30 minutos
―levantando/embalando‖, 15 minutos ―arquivando/de pé‖ e 15 minutos ―caminhando pelo
ambiente‖ tem uma taxa metabólica média de: 0,50 × 2,1 + 0,25 × 1,4 + 0,25 × 1,7 = 1,8 met.
Tal cálculo para encontrar o valor médio não deve ser aplicado quando o período de variação
for maior que uma hora. Por exemplo, uma pessoa que está ―levantando/embalando‖ durante

107
uma hora, e então ―arquivando/de pé‖ durante mais uma hora, deve ser considerada como
alguém que exerce duas atividades metabólicas distintas.
À medida que a taxa metabólica supera a marca de 1,0 met, a evaporação do suor se torna
crescentemente importante para atingir conforto térmico. O método do PMV não é adequado
para este tipo de analise, e esta norma não deve ser aplicada durante situações onde a taxa
metabólica média ponderada por um intervalo de tempo ultrapassa os 2,0 met.
A taxa metabólica média ponderada por um intervalo de tempo só se aplica a um indivíduo. A
taxa metabólica associada à atividade de um grupo de indivíduos dentro de um espaço não
pode ser ponderada para encontrar um valor único médio a ser aplicado em todo o espaço. A
gama de atividades de diferentes indivíduos em um espaço, e as condições ambientais
necessárias àquelas atividades devem ser consideradas na aplicação desta norma. Por
exemplo, os clientes de um restaurante podem ter uma taxa metabólica próxima de 1,0 met,
enquanto os garçons podem ter uma taxa metabólica próxima de 2,0 met. Cada um destes
grupos de ocupantes devem ser considerados separadamente quando forem determinadas as
condições requeridas de conforto térmico do espaço. Em alguns casos não será possível
promover um nível aceitável ou o mesmo padrão de conforto para todos os grupos de
ocupantes (por exemplo, os clientes de um restaurante e os garçons).
Os valores das taxas metabólicas desta tabela foram determinados nos períodos em que a
sensação térmica dos indivíduos avaliados estava próxima de neutra. Ainda não é conhecida a
correta proporção em que as pessoas possam modificar sua taxa metabólica de maneira que o
desconforto por calor possa ser amenizado.
TABELA A1 Taxas Metabólicas para Atividades Típicas
Atividade Taxa Metabólica
Unidades Met W/m2
Descansando
Dormindo 0,7 40
Deitado 0,8 45
Sentado, quieto 1,0 60
De pé, relaxado 1,2 70
Caminhando (em uma superfície plana)
0,9 m/s; 3,2 km/h; 2,0 115
1.2 m/s, 4.3 km/h, 2,6 150
1.8 m/s, 6.8 km/h, 3,8 220
Atividades de Escritório
Lendo, sentado 1,0 55
Escrevendo 1,0 60
Digitando 1,1 65
Arquivando, sentado 1,2 70
Arquivando, de pé 1,4 80
Caminhando pelo ambiente 1,7 100
Levantando/empacotando 2,1 120
Dirigindo/Voando
Automóvel 1,0 - 2,0 60 - 115
Aeronaves, rotina 1,2 70
Aeronaves, aterrisagem com instrumentos 1,8 105
Aeronaves, combate 2,4 140
Veículos 3,2 185

108
Atividades Ocupacionais Diversas
Cozinhando 1,6 - 2,0 95 - 115
Limpando a casa 2,0 - 3,4 115 - 200
Sentado, movimento pesado dos membros 2,2 130
Trabalho de Máquina
serrando (serra de mesa) 1,8 105
luz (indústria elétrica) 2,0 - 2,4 115 - 140
pesado 4,0 235
Manipulação, sacos de 50 kg 4,0 235
Trabalhos com picareta e pá 4,0 - 4,8 235 - 280
Atividades diversas de Lazer
Dançando, social 2,4 - 4,4 140 - 255
Musculação 3,0 - 4,0 175 - 235
Tênis, individual 3,6 - 4,0 210 - 270
Basquetebol 5,0 - 7,6 290 - 440
Luta Livre, competição 7,0 - 8,7 410 - 505
(Este é um apêndice normativo, parte integrante desta norma).
APÊNDICE NORMATIVO B
ISOLAMENTO DA VESTIMENTA
O montande de isolamento térmico que uma pessoa veste tem um impacto significativo no
conforto térmico, sendo uma variável importante para a aplicação desta norma. O isolamento
da vestimenta pode ser expresso de diversas maneiras. Nesta norma, o isolamento corporal
proveniente de um conjunto de roupas é expresso em um valor de ―clo‖ (Icl ). Para maiores
informações, usuários não familiarizados com a terminologia do isolamento da vestimenta
devem procurar a referência ao termo no Capítulo 9 da versão 2009 do ASHRAE Handbook –
Fundamentals³.
O isolamento proveniente da roupa pode ser determinado através de diversos meios, e se
dados precisos puderem ser encontrados através de outras fontes – tais como as medições com
manequins térmicos – eles podem ser considerados aceitáveis para o uso. Quando tal
informação não está disponível, é permitido utilizar os valores das tabelas deste apêndice para
estimar o isolamento da vestimenta valendo-se de um dos métodos descritos logo abaixo.
Independente da fonte do valor do isolamento da roupa, esta norma não deve ser utilizada
para conjuntos de roupa com isolamento superior a 1,5 clo. Esta norma não deve ser utilizada
com roupas altamente impermeáveis à passagem da umidade (por exemplo, roupas com
proteção química ou à chuva).
Três métodos para a estimativa do isolamento da vestimenta são apresentados. Os métodos
estão listados em ordem de acuracidade, e devem ser utilizados em ordem de preferência.
• Método 1: A Tabela B1 lista o isolamento proveniente de uma variedade de conjuntos de
roupas comuns. Se o conjunto considerado corresponder razoávelmente bem a um dos
conjuntos desta tabela, então o valor de Icl indicado deve ser usado.

109
• Método 2: A Tabela B2 apresenta o isolamento da vestimenta de uma variedade de peças
individuais de roupa. É aceitável adicionar ou subtrair peças de roupas dos conjuntos da
Tabela B1. Por exemplo, se roupas íntimas longas (ceroulas) forem adicionadas ao
conjunto 5 da Tabela B1, o isolamento resultante do conjunto será: Icl = 1,01 + 0,15 =
1,16 clo.
• Método 3: É aceitável definir um conjunto completo de vestimenta utilizando uma
combinação de roupas listada na Tabela B2. O isolamento de um conjunto é estimado
através do somatório de valores individuais listados na Tabela B2. Por exemplo, o
isolamento estimado de um conjunto composto por um macacão com camisa de flanela,
camiseta (T-shirt), cueca, botas e meias de comprimento médio, será: Icl = 0,30 + 0,34 +
0,08 + 0,04 + 0,10 + 0,03 = 0,89 clo.
As Tabelas B1 e B2 se aplicam para uma pessoa de pé. Uma postura sentada resulta em um
decréscimo no isolamento térmico da vestimenta devido à compressão das camadas de ar na
roupa. Este decrécimo pode ser compensado pelo isolamento proporcionado pela cadeira. A
Tabela B3 apresenta o efeito causado pelo isolamento da cadeira no montante do isolamento
de um conjunto de vestimentas. Este método é aceitável para ajustar o valor da vestimenta em
qualquer um dos 3 métodos citados acima. Por exemplo, o isolamento da vestimenta de uma
pessoa vestindo o Conjunto 3 da Tabela B1, sentada em uma cadeira executiva é de: 0,96 +
0,15 = 1,11 clo. Em muitas cadeiras, o efeito do ―sentar‖ corresponde à uma mudança mínima
no isolamento da vestimenta. Por esta razão, não é recomendado nenhum ajuste no clo
quando existe alguma incerteza com relação ao tipo da cadeira e/ou se a atividade do
indivíduo incluir ambos: sentar e ficar de pé.
As Tabelas B1 e B2 são para pessoas que não estão se movendo. O movimento do corpo
diminui o isolamento de um conjunto de vestimenta através de um movimento do ar pelas
aberturas das roupas, fazendo com que o ar circule. Este efeito pode variar significativamente,
o que depende da natureza do movimento (por exemplo, caminhar x levantar), e também da
natureza da roupa (uma roupa confortável e mais maleável ao corpo x uma roupa dura e
solta). Por causa dessa variação, a acuracidade no isolamento da vestimenta de uma pessoa
ativa se torna difícil, não se encontrando facilmente disponíveis, a não ser que medições
específicas sejam feitas para as condições em questão (por exemplo, com um manequin se
movimentando). Uma estimativa grosseira para o isolamento da vestimenta de uma pessoa se
movimentando pode ser feita através da seguinte expressão:
( )
Onde:
M: é a taxa metabólica em unidades de met;
Icl : é o isolamento da vestimenta sem a atividade física.
Para taxas metabólicas inferiores a 1,2 met, nenhum ajuste é recomendado.
Quando uma pessoa está dormindo ou descansando em uma postura reclinada, a cama e as
roupas de cama podem proporcionar um isolamento térmico considerável. Não é possível
determinar o isolamento térmico para a maioria das situações onde uma pessoa está dormindo
ou descansando, a não ser que o indivíduo esteja imóvel. Cada pessoa ajusta sua vestimenta
para dormir ou descansar de acordo com a sua preferência. As condições ambientais e a
vestimenta adequada ao sono e/ou descanso variam consideravelmente de pessoa para pessoa
e, portanto, não podem ser determinadas através dos métodos inclusos nesta norma.
A variabilidade das roupas entre os ocupantes em um mesmo espaço é uma consideração
importante na aplicação desta norma. Esta variabilidade assume duas formas; na primeira
forma, indivíduos diferentes utilizam vestimentas diferentes, independentemente das
condições térmicas (exemplos incluem as preferências pessoais entre homens e mulheres,

110
escritórios onde os gerentes usam ternos e os outros funcionários podem usar camisa de
mangas curtas); na segunda forma, a variabilidade entre as roupas é resultado da adaptação às
diferenças individuais em resposta ao ambiente térmico (por exemplo, algumas pessoas estão
vestindo blusas com mangas compridas enquanto outras podem estar vestindo camisetas -
dentro de um mesmo ambiente, desde que não existam restrições limitantes com relação à
vestimenta). A primeira forma de variabilidade pode resultar em diferenças nos requisitos de
conforto térmico entre diferentes ocupantes, e estas diferenças devem ser abordadas durante a
aplicação desta norma. Nesta situação, não é aceitável definir uma média de isolamento da
vestimenta de vários grupos de ocupantes para determinar as condições do ambiente
necessárias para todos os ocupantes. Cada grupo deve ser considerado separadamente.
Quando a variabilidade entre os grupos segue a segunda forma e é resultado apenas de
indivíduos que fazem ajustes na roupa livremente para atender suas preferências térmicas, é
aceitável a reprodução de um único valor médio que representa o isolamento da vestimenta de
todo o grupo.
Para atividades quase sedentárias onde a taxa metabólica é de aproximadamente 1,2 met, o
efeito da mudança de roupa no valor da temperatura operativa ótima é de aproximadamente 6
°C para cada unidade de clo. Por exemplo, a Tabela B2 indica que ao adicionar um suéter fino
manga longa em um conjunto de roupas, deve-se considerar aproximadamente um adicional
de 0,25 clo. A adição deste isolamento deve reduzir a temperatura operativa ótima em cerca
de: 6°C/clo × 0,25 clo = 1,5°C. O efeito é maior quando a taxa de metabolismo é maior.

111
TABELA B1
Isolamento da Vestimenta – Valores para Conjuntos de Roupas Típicosa
Descrição da
Vestimenta Roupas Inclusas
b
Icl
(clo)
Calças 1) Calça + Camisa manga curta 0,57
2) Calça + Camisa manga longa 0,61
3) #2 + Paletó 0,96
4) #2 + Paletó + Colete + Camiseta 1,14
5) #2 + Suéter manga longa + Camiseta 1,01
6) #5 + Paletó + Ceroula 1,30
Saias/Vestidos 7) Saia na altura dos joelhos + Camisa manga curta (sandálias) 0,54
8) Saia na altura dos joelhos + Camisa manga longa + Combinação íntima 0,67
9) Saia na altura dos joelhos + Camisa manga comprida + Meia combinação
íntima + Suéter manga comprida
1,10
10) Saia na altura dos joelhos + Camisa manga longa + Meia combinação
íntima + Paletó
1,04
11) Saia no comprimento do tornozelo + Camisa manga comprida + Paletó 1,10
Shorts 12) Shorts + Camisa manga curta 0,36
Macacões 13) Macacão manga comprida + Camiseta 0,72
14) Macacão + Camisa manga comprida + Camiseta 0,89
15) Macacão isotérmico + Roupa íntima comprida (térmica – corpo todo) 1,37
Atlética 16) Calça de moleton + Blusa de moleton manga longa 0,74
Pijamas 17) Camisa manga longa de pijama + Calça de pijama + Roupão ¾
(Chinelos, sem meias) 0,96
a Dados provenientes do Capítulo 9 da versão de 2009 do ASHRAE Handbook - Fundamentals.
3
b Todos os conjuntos de roupa, exceto onde indicado entre parênteses, incluem sapatos, meias, calcinhas
ou cuecas. Todos os conjuntos de saias/vestidos incluem meia-calça, sem meias adicionais.

112
TABELA B2
Isolamento das Roupasa
Descrição da Roupab Iclu(clo) Descrição da Roupa
b Iclu(clo)
Roupas Íntimas Vestidos e Saias c
Sutiã 0,01 Saia (fina) 0,14
Calcinha 0,03 Saia (grossa) 0,23
Cueca Masculina 0,04 Vestido fino, sem mangas 0,23
Camiseta 0,08 Vestido de malha, com mangas 0,27
Meia combinação Íntima 0,14 Vestido curto de algodão (estilo camisa) 0,29
Roupa Íntima Longa
(Ceroulas) 0,15 Vestido comprido com mangas (fino) 0,33
Combinação Íntima 0,16 Vestido comprido com mangas (grosso) 0,47
Ceroula Completa (corpo
todo) 0,20 Suéters
Calçados Colete/Suéter sem mangas (fino) d 0,13
Meia Soquetes 0,02 Colete/Suéter sem mangas (grosso) d 0,22
Meia-calça fina/Meias 7/8 0,02 Suéter manga longa (fino) 0,25
Sandálias/Chinelos 0,02 Suéter manga longa (grosso) 0,36
Sapatos 0,02 Paletós e Coletes
Sapatos semiabertos
(pantufas, sapatos de
couro)
0,03 Colete (fino) 0,10
Meias médias (algodão) 0,03 Colete (grosso) 0,17
Meias compridas (algodão) 0,06 Paletó (fino) 0,36
Botas 0,10 Paletó (grosso) 0,44
Camisas e Blusas Paletó fechado (fino) 0,42
Blusa sem mangas 0,12 Paletó fechado (grosso) 0,48
Camisa manga curta
esportiva (estilo pólo) 0,17 Pijamas e Robes
Camisa social manga curta 0,19 Camisola curta, sem mangas (fino) 0,18
Camisa social manga longa 0,25 Camisola comprida, sem mangas (fino) 0,20
Camisa de flanela manga
longa 0,34 Vestido manga curta de hospital 0,31
Moleton manga longa 0,34 Roupão de verão curto (fino) 0,34
Calças e Macacões Pijama manga curta (fino) 0,42
Shorts curto 0,06 Camisola de inverno comprida (grosso) 0,46
Shorts comprido 0,08 Robe manga longa de verão 0,48
Calça (fina) 0,15 Pijama de manda comprida (grosso) 0,57
Calça (grossa) 0,24 Robe manga comprida de inverno 0,69
Calça Moleton 0,28
Macacão (jardineira) 0,30
Macacão (fechado) 0,49
a Dados provenientes do Capítulo 9 da versão de 2009 do ASHRAE Handbook - Fundamentals.
3
b ―Fino‖ se refere às roupas feitas com tecido fino/leve, utilizadas normalmente durante o verão.
―Grosso‖ se refere às roupas feitas com tecido grosso/pesado, utilizado normalmente durante o inverno. c Saias no comprimento do joelho.
d Coletes forrados.
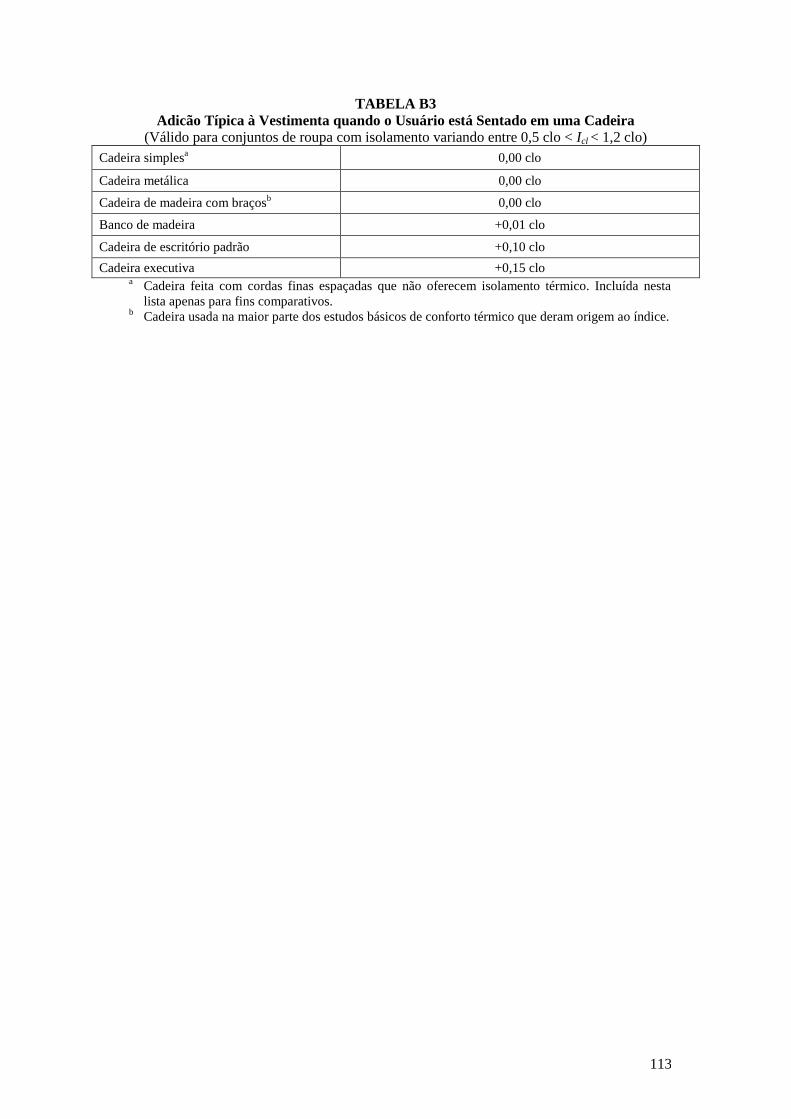
113
TABELA B3
Adicão Típica à Vestimenta quando o Usuário está Sentado em uma Cadeira
(Válido para conjuntos de roupa com isolamento variando entre 0,5 clo < Icl < 1,2 clo)
Cadeira simplesa 0,00 clo
Cadeira metálica 0,00 clo
Cadeira de madeira com braçosb 0,00 clo
Banco de madeira +0,01 clo
Cadeira de escritório padrão +0,10 clo
Cadeira executiva +0,15 clo a Cadeira feita com cordas finas espaçadas que não oferecem isolamento térmico. Incluída nesta
lista apenas para fins comparativos. b
Cadeira usada na maior parte dos estudos básicos de conforto térmico que deram origem ao índice.

114
(Este é um apêndice normativo, parte integrante desta norma).
APÊNDICE NORMATIVO C
PROGRAMA COMPUTACIONAL PARA O CÁLCULO DO PMV/PPD
As equações a seguir computam de forma básica os valores de PMV e o PPD para um dado
conjunto de variáveis. Diferentes linguagens de programação podem ser utilizadas, mas os
dados de saída devem ser verificados utilizando os valores de referência dados na Tabela C.1.
Variáveis Siglas no Programa
Isolamento da roupa, clo CLO
Metabolismo, met MET
Trabalho, met WME
Temperatura do Ar, °C TA
Temperatura Média Radiante, °C TR
Velocidade Relativa do Ar, m/s VEL
Umidade Relativa, % RH
Pressão parcial de vapor d’água, Pa PA
Equações básicas para o cálculo do Voto Médio Predito (PMV) e Percentagem de Insatisfeitos (PPD) com base nas equações da versão de 2009
do ASHARE Fundamentals Handbook e equações da ISO 7730 (2005)
1 Dados de entrada : unidade
2 Vestimenta : clo
3 Taxa metabólica : met
4 Trabalho : met
5 Temperatura do ar : °C
6 Temperatura radiante média : °C
7 Velocidade relativa do ar : m/s
9 Umidade relativa do ar : %
10 Pressão de vapor d’água : Pa
11 (
)
: pressão de vapor d’água saturado
12 : isolamento térmico da vestimenta em m²K/W
13 : taxa metabólica em W/m²
14 Se , então
15 Se outro,
16
17
18
19 ***** Cálculo da temperatura da superfície da roupa através de iteração *****
20 ( )
(( ( ))
21

115
22
23
24
25 (
)
26
27
28
29
30
31 Enquanto ( )
32 ( )
33
34
35 Se , então
36 Se outro,
37 ( ( ) )
( )
38
39
40 ***** Componentes da perda de calor *****
41 Diferença perda de calor através da pele:
42 ( )
43 Perda de calor através do suor:
44 Se , então ( )
45 Se outro,
46 Perda de calor latente através da respiração:
47 ( )
48 Perda de calor sensível através da respiração:
49 ( )
50 Perda de calor por radiação:
51 ( (
)
52 Perda de calor por convecção:

116
53 ( (
)
)
54 Dados de Saída: PMV e PPD
55 Coeficiente de Sensação Térmica
56 ( )
57 Se , então
58 Se , então
59 Se outro,
60 ( )
61
Tabela C.1 Exemplo de dados de Entrada/Saída
EXEMPLO – Valores utilizados para gerar conforto na edificação da Figura 5.2.1.1.
Run Temp. Ar RH Temp. Radiante Vel. Ar Met. CLO PMV
PPD
% # °C % °C m/s
1 19,6 86 19,6 0,10 1,1 1 -0,5 10
2 23,9 66 23,9 0,10 1,1 1 0,5 10
3 25,7 15 25,7 0,10 1,1 1 0,5 10
4 21,2 20 21,2 0,10 1,1 1 -0,5 10
5 23,6 67 23,6 0,10 1,1 0,5 -0,5 10
6 26,8 56 26,8 0,10 1,1 0,5 0,5 10
7 27,9 13 27,9 0,10 1,1 0,5 0,5 10
8 24,7 16 24,7 0,10 1,1 0,5 -0,5 10

117
(Este é um apêndice informativo, parte integrante desta norma).
APÊNDICE INFORMATIVO D
LEVANTAMENTO E QUESTIONÁRIO PARA AVALIAÇÃO DO AMBIENTE TÉRMICO
A utilização de questionários nas pesquisas de conforto térmico é uma forma aceitável de
avaliação para que se alcancem os limites de aceitabilidade discutidos nesta norma. Através
destas pesquisas é possível prever a porcentagem de ocupantes que estão ―satisfeitos‖ ou que
consideram o ambiente aceitável e/ou confortável. Através da aplicação de questionários é
possível se obterem resultados mais reais do que aqueles obtidos através dos modelos de
conforto. No entanto, estas pesquisas não podem ser feitas em todos os casos por exigirem
tempo, planejamento prévio e aborgadem de comunição. Uma boa pesquisa de campo deve
pesar a quantidade de tempo e frequência de medição.
As pesquisas devem buscar uma amostra de tamanho significativo, com uma taxa de resposta
de no mínimo 50%, buscando refletir todo o espaço ocupado do edifício. Uma boa
amostragem combinada a uma taxa de resposta adequada (≅ 75%) ajuda a diminuir o risco de
generalização quando o levantamento é feito em uma edificação com diversas instalações.
Embora nenhuma taxa de resposta seja especificada nesta norma, deve-se garantir que as
respostas venham de ocupantes representativos de toda a população de interesse.
Pesquisas de satisfação com relação ao ambiente térmico são ferramentas de grande valor na
avaliação de edifícios e instalações existentes, funcionando como uma espécie de diagnóstico
(voz do edifício), cujo objetivo é trazer ao projetista uma visão detalhada do que acontece
dentro da edificação no seu dia-a-dia, valendo-se do feedback dos ocupantes.
Existem dois tipos de pesquisas relacionadas ao ambiente térmico como se observa logo
abaixo. Em ambos os tipos as principais perguntas estão ligadas ao conforto térmico, mas
existem outras perguntas que podem ajudar a identificar problemas e formular possíveis
respostas.
1. As pesquisas ―instantâneas‖ ou ―point-in-time‖ são utilizadas para avaliação da
sensação térmica dos ocupantes em determinado ponto no tempo. Alguns
pesquisadores têm utilizado esse tipo de levantamento para correlacionar conforto
térmico com os fatores ambientais do PMV/PPD: taxa metabólica, a vestimenta,
temperatura do ar, temperatura radiante, velocidade do ar e umidade.
Uma amostra do questionário utilizado neste tipo de pesquisa está inclusa na Seção
D.1. O documento busca avaliar a sensação térmica dos ocupantes com base na
esacala de 7 pontos da ASHRAE (―muito quente‖ até ―muito frio‖). A sensação de
conforto ou a porcentagem predita de instatisfeitos (PPD) não levantados diretamente
pode ser extrapolada a partir dos votos de sensação térmica.
É possível, no entanto, perguntar diretamente ao ocupante: ―Este ambiente é
termicamente aceitável?‖ utilizando a escala ―aceitável‖ ou ―inaceitável‖, ou até
mesmo: ―Este ambiente é termicamente confortável?‖. Por vezes, as escalas de
preferência para temperatura e velocidade do ar são também utilizadas, sendo
comumente encontradas na base de dados do RP-884 da ASHRAE: ―Você prefere
estar: mais resfriado/não mudar/ mais aquecido‖ ou ―Você prefere: menos velocidade
de ar/não mudar/ mais velocidade do ar‖.
Para que os resultados da pesquisa sejam aplicáveis para a análise de intervalos de
aceitabilidade, é necessária a implementação do método sob várias condições
térmicas, ao longo do tempo e em diferentes modos de operação do edifício. A
118
dificuldade na organização de um número grande de dados provenientes da medição
instantânea em ambientes de trabalho normalmente limita a utilização deste método,
o que pode mudar com o advento de questionários onlines e aplicativos.
2. As pesquisas de ―satisfação‖ são utilizadas para avaliar as respostas dos ocupantes
com relação ao espaço em geral dentro de um intervalo de tempo determinado. Ao
invés de avaliar as sensações térmicas junto às medições das variáveis ambientais (e
indiretamente a porcentagem de pessoas insatisfeitas), este tipo de pesquisa foca nas
respostas de satisfação com relação ao ambiente térmico e instrumentos de controle.
Um modelo de questionário utilizado nas pesquisas de satisfação é apresentado na
Seção D.2. Nele, os ocupantes são solicitados a avaliar o ambiente térmico (com
respostas que variam entre ―satisfeito‖ a ―insatisfeito‖) considerando uma escala de 7
pontos de satisfação. A aceitabilidade é determinada através da porcentagem de
ocupantes que assinalaram sua resposta no intervalo que vai de ―neutro‖ até
―satisfeito‖.
A premissa básica deste tipo de pesquisa é a natureza das respostas dos ocupantes,
podendo recordar períodos ou casos de desconforto térmico, identificando padrões de
operação dos sistemas de climatização e envoltória. Desta maneira, os ocupantes
fornecem informações ―globais‖ ou ―gerais‖ de voto com relação ao conforto térmico
em seu ambiente. O inspetor que realiza a pesquisa deve indicar um espaço de tempo
para que os entrevistados considerem em suas respostas. Os resultados de uma
pesquisa realizada sob um modo de operação do edifício, ou em determinada estação
do ano, não devem ser extrapolados ou generalizados para diferentes modos de
operação ou ano.
Por considerar determinados ―espaços de tempo‖, esse tipo de pesquisa deve ser
realizada periodicamente, podendo ser feita a cada seis meses ou repetida nas
estações de aquecimento ou resfriamento. É recomendado que a primeira pesquisa de
satisfação seja feita pelo menos seis meses após a ocupação do edifício para que
sejam identificados, e assim evitados, os problemas e as reclamações decorrentes.
Nota: Quanto mais longo for o período coberto pela pesquisa, menor é a precisão dos
resultatos. Os ocupantes são solicitados a recordar suas experiências anteriores, sendo
suas respostas geralmente poderadas pelas suas experiências mais recentes.
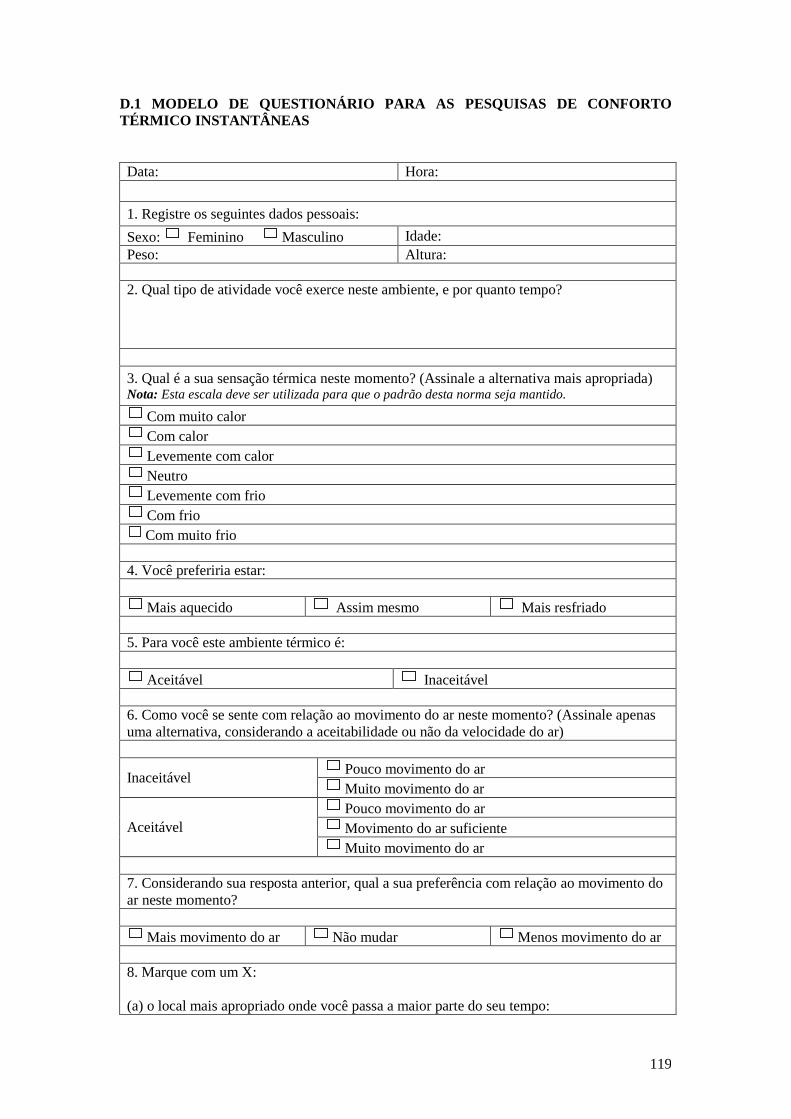
119
D.1 MODELO DE QUESTIONÁRIO PARA AS PESQUISAS DE CONFORTO
TÉRMICO INSTANTÂNEAS
Data: Hora:
1. Registre os seguintes dados pessoais:
Sexo: Feminino Masculino Idade:
Peso: Altura:
2. Qual tipo de atividade você exerce neste ambiente, e por quanto tempo?
3. Qual é a sua sensação térmica neste momento? (Assinale a alternativa mais apropriada) Nota: Esta escala deve ser utilizada para que o padrão desta norma seja mantido.
Com muito calor
Com calor
Levemente com calor
Neutro
Levemente com frio
Com frio
Com muito frio
4. Você preferiria estar:
Mais aquecido Assim mesmo Mais resfriado
5. Para você este ambiente térmico é:
Aceitável Inaceitável
6. Como você se sente com relação ao movimento do ar neste momento? (Assinale apenas
uma alternativa, considerando a aceitabilidade ou não da velocidade do ar)
Inaceitável Pouco movimento do ar
Muito movimento do ar
Aceitável
Pouco movimento do ar
Movimento do ar suficiente
Muito movimento do ar
7. Considerando sua resposta anterior, qual a sua preferência com relação ao movimento do
ar neste momento?
Mais movimento do ar Não mudar Menos movimento do ar
8. Marque com um X:
(a) o local mais apropriado onde você passa a maior parte do seu tempo:

120
Nota: deve ser fornecido um desenho em planta
que demonstre adequadamente o espaço da
pesquisa ou a edificação em questão.
(b) o local que melhor descreve a área da edificação onde você passa mais tempo:
Norte Sul Leste Oeste Central Não sei
9. Em qual andar da edificação seu local de trabalho está localizado?
1° Andar 2° Andar 3 ° Andar Outro. Especifique:
10. Você está próximo(a) de uma parede externa? (aprox.3 metros).
Sim Não
11. Você está próximo(a) de uma janela com abertura externa? (aprox. 3 metros).
Sim Não
12. Utilizando a relação abaixo, assinale cada item de roupa que você está usando agora: Nota: Esta lista pode ser ajustada de acordo com a necessidade.
Camisa manga curta Vestido social Macacão
Camisa manga longa Saia curta (joelho) Calcinha + Sutiã
Camiseta/Camisa Polo Saia longa (canela) Cueca
Suéter manga longa Shorts/Bermuda Meias de nylon
Suéter manga curta Calça Jeans Meias esportivas
Jaqueta/paletó fino Calça Social Botas
Jaqueta/Paletó grosso Calça moleton Tênis/Sapato
Colete Blusa moleton Sandálias
Outros. Especifique:
13. Qual o seu nível de atividade neste momento? (assinale a opção mais apropriada)
Sentado, atividade leve (relaxado, lendo)
Sentado, atividade moderada (digitando, arquivando)
Em pé, relaxado
Atividade leve em pé
Atividade moderada em pé
Atividade pesada
Outra. Especifique:
Amostra

121
14. Dentre as opções abaixo, quais estão disponíveis para o ajuste/controle pessoal da
temperatura neste momento? Nota: Esta lista pode ser ajustada de acordo com a necessidade.
Cortinas ou persianas Ar condicionado Aquecedor Portátil
Porta para interior Porta para exterior Ventilador de teto
Ventilador portátil Janelas operáveis Termostato
Saida de ar ajustável (chão, parede ou teto) Nenhuma das opções
Outras. Especifique:
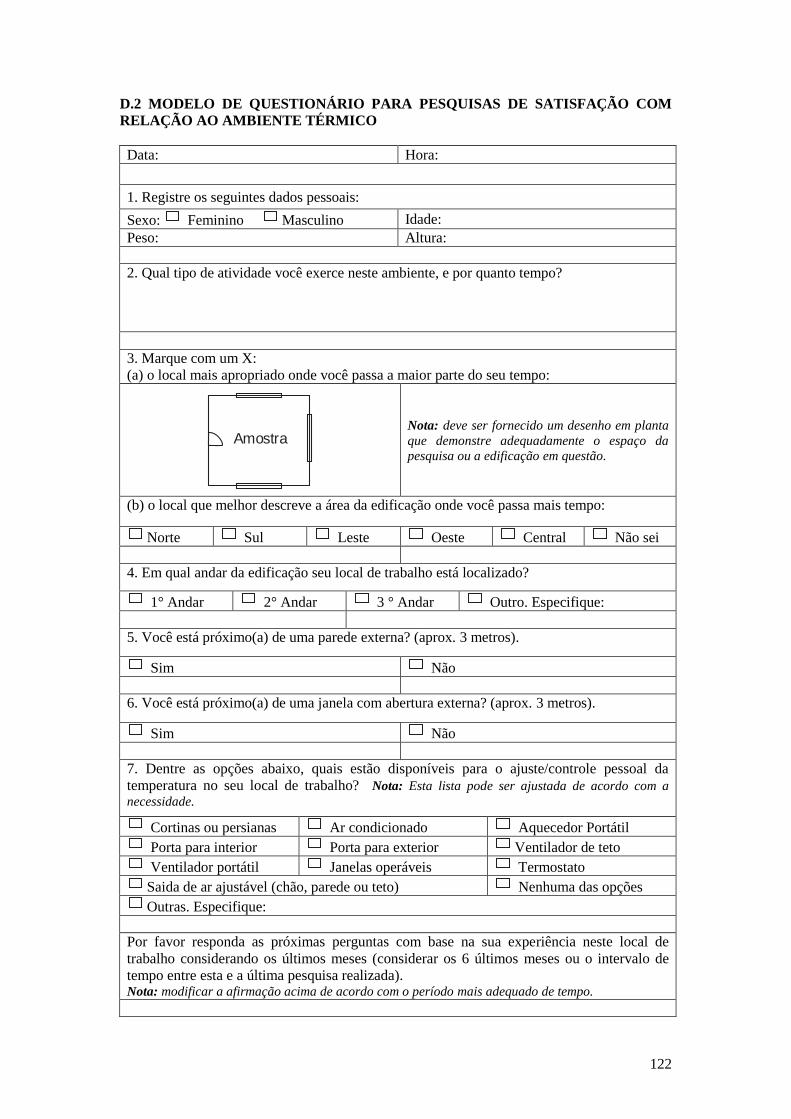
122
D.2 MODELO DE QUESTIONÁRIO PARA PESQUISAS DE SATISFAÇÃO COM
RELAÇÃO AO AMBIENTE TÉRMICO
Data: Hora:
1. Registre os seguintes dados pessoais:
Sexo: Feminino Masculino Idade:
Peso: Altura:
2. Qual tipo de atividade você exerce neste ambiente, e por quanto tempo?
3. Marque com um X:
(a) o local mais apropriado onde você passa a maior parte do seu tempo:
Nota: deve ser fornecido um desenho em planta
que demonstre adequadamente o espaço da
pesquisa ou a edificação em questão.
(b) o local que melhor descreve a área da edificação onde você passa mais tempo:
Norte Sul Leste Oeste Central Não sei
4. Em qual andar da edificação seu local de trabalho está localizado?
1° Andar 2° Andar 3 ° Andar Outro. Especifique:
5. Você está próximo(a) de uma parede externa? (aprox. 3 metros).
Sim Não
6. Você está próximo(a) de uma janela com abertura externa? (aprox. 3 metros).
Sim Não
7. Dentre as opções abaixo, quais estão disponíveis para o ajuste/controle pessoal da
temperatura no seu local de trabalho? Nota: Esta lista pode ser ajustada de acordo com a
necessidade.
Cortinas ou persianas Ar condicionado Aquecedor Portátil
Porta para interior Porta para exterior Ventilador de teto
Ventilador portátil Janelas operáveis Termostato
Saida de ar ajustável (chão, parede ou teto) Nenhuma das opções
Outras. Especifique:
Por favor responda as próximas perguntas com base na sua experiência neste local de
trabalho considerando os últimos meses (considerar os 6 últimos meses ou o intervalo de
tempo entre esta e a última pesquisa realizada). Nota: modificar a afirmação acima de acordo com o período mais adequado de tempo.
Amostra

123
8. Quão satisfeito você está com a temperatura no seu local de trabalho? (assinale no local
mais apropriado utilizando a escala abaixo e considerando o quadrado central como
―neutro‖).
Satisfeito Insatisfeito
9. Se você está instatisfeito com a temperatura no seu local de trabalho, qual das seguintes
alternativas contribui para a sua insatisfação?
a) Durante os meses/estações mais quentes, a temperatura no meu local de trabalho é:
Ocasionalmente fria Diversas vezes fria Sempre fria
Ocasional. quente Div. vezes quente Sempre quente
b) Durante os meses/estações mais frias, a temperatura no meu local de trabalho é:
Ocasionalmente muito fria Diversas vezes muito fria Sempre muito fria
Ocasional. muito quente Div. vezes muito quente Sempre muito quente
10. Em qual horário do dia este problema ocorre com maior frequência?
Pela manhã (antes das 11h) Meio-dia (entre 11 e 14h) Tarde (entre 14 e 18h)
Noite (após as 18h) Fins de semana/Feriados O tempo todo
Segunda-feira pela manhã Não existe hora certa Outra:
11. Qual(is) alternativa(s) melhor descreve a fonte deste desconforto? Marque mais de uma
opção, se necessário. Nota: Esta lista pode ser ajustada de acordo com a necessidade.
Umidade muito alta (úmido) Umidade muito baixa (seco)
Muita ventilação (velocidade do ar) Pouca ventilação (velocidade do ar)
Incidência de luz solar direta Calor proveniente de equipamentos
Corrente de ar proveniente das janelas Corrente de ar prov. de ventiladores
Meu espaço é mais quente/frio que os outros Janela é inoperável
Termostato ajustado por outra pessoa Termostato é inacessível
Uniforme (roupa) não pode ser ajustado Sistema de climatização deficiente
Outros. Especifique:
12. Por favor descreva qualquer outro problema com relação à temperatura no seu local de
trabalho: