Embed Size (px)
Citation preview

Towards an understanding of credit cycles: do all credit
booms cause crises? RayBarrell*‡ DilrubaKarim*
CorradoMacchiarelli*,‡
*BrunelUniversityLondon‡LondonSchoolofEconomicsandPoli9calScience
Cycles, Crises and Credit
• Formanyyears,themanagementoftheproperopera?onofthefinancialsystemwasacentraltaskassignedtoCentralBanks,alongwithmanagementofthecurrency.
• Nomajorfinancialcrisesintheadvancedeconomiesintheperiodfrom1940to1972.
• Systemicriskappearedtodisappear–yet,1970to2000decadebydecade,financialcrisesintheadvancedeconomiesbecamemorecommon.
• Thesewerenotseenasamajorfocusofpolicy(e.g.AllenandGale,2007).Prevailingviewthatriskwasexogenous,hencenotrequiringregula?on.
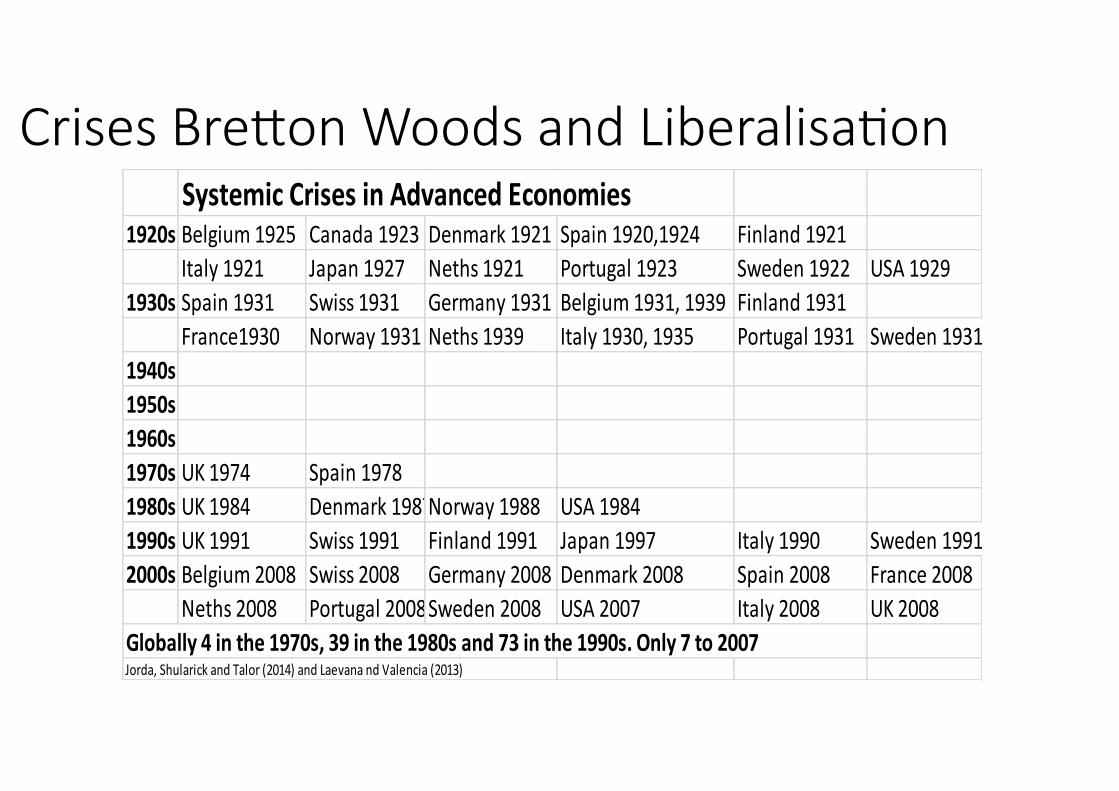
Crises Bre;on Woods and Liberalisa>on SystemicCrisesinAdvancedEconomies
1920s Belgium1925 Canada1923 Denmark1921 Spain1920,1924 Finland1921Italy1921 Japan1927 Neths1921 Portugal1923 Sweden1922 USA1929
1930s Spain1931 Swiss1931 Germany1931 Belgium1931,1939 Finland1931France1930 Norway1931 Neths1939 Italy1930,1935 Portugal1931 Sweden1931
1940s1950s1960s1970s UK1974 Spain19781980s UK1984 Denmark1987Norway1988 USA19841990s UK1991 Swiss1991 Finland1991 Japan1997 Italy1990 Sweden19912000s Belgium2008 Swiss2008 Germany2008 Denmark2008 Spain2008 France2008
Neths2008 Portugal2008Sweden2008 USA2007 Italy2008 UK2008Globally4inthe1970s,39inthe1980sand73inthe1990s.Only7to2007Jorda,ShularickandTalor(2014)andLaevanandValencia(2013)
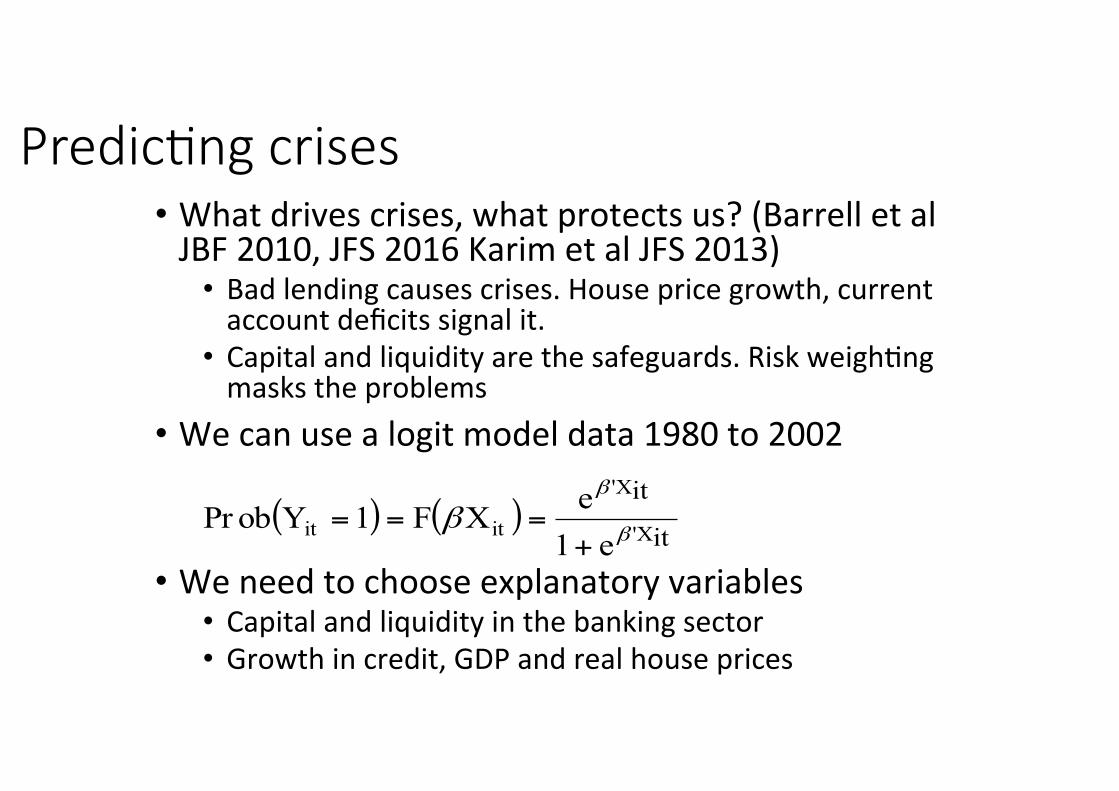
Predic>ng crises • Whatdrivescrises,whatprotectsus?(BarrelletalJBF2010,JFS2016KarimetalJFS2013)
• Badlendingcausescrises.Housepricegrowth,currentaccountdeficitssignalit.
• Capitalandliquidityarethesafeguards.Riskweigh?ngmaskstheproblems
• Wecanusealogitmodeldata1980to2002• Weneedtochooseexplanatoryvariables
• Capitalandliquidityinthebankingsector• Growthincredit,GDPandrealhouseprices
( ) ( )it
itX'
X'
itit e1eXF1YobPr
β
β
β+
===

Modelling Crises Es?ma?onPeriod 1980-2002
CapitalAdequacyRa?o(-2) -0.479(0.002)
LiquidityRa?o(-2) -0.084(0.054)
ΔRealHousePrice(-3) 0.079(0.054)
CurrentAccountBalance(%ofGDP)(-2) -0.455(0.005)
ΔRealDomes?cCredit(-2) -0.006(0.856)
RealInterestRate -0.046(0.5)
ΔGDP(-2) 0.11(0.541)TotalObserva9ons 280
Belgium Canada Denmark Finland France Germany Italy Japan Netherlands Norway Sweden Spain US UK 1980-2002 from Caprio and Klingebiel (2003)

Forecas>ng crises probabili>es from 2002 2002 2003 2004 2005 2006 2007 2008 2009Belgium 0.64 0.24 0.37 0.64 1.41 3.80 7.25 3.87Canada 1.03 0.82 1.90 2.22 1.78 2.39 2.49 5.49Denmark 0.94 1.77 0.95 2.04 1.36 4.20 11.11 3.40Finland 0.00 0.00 0.04 0.06 0.23 0.18 0.37 0.99France 2.14 2.30 3.07 6.25 17.22 18.25 17.73 14.54Germany 3.01 0.91 0.85 0.36 0.28 0.26 0.17 0.13Italy 1.19 1.90 2.40 3.10 3.38 6.21 1.33 1.64Japan 0.67 0.50 0.23 0.16 0.06 0.09 0.14 0.13Neths 7.88 4.09 0.86 0.38 0.75 0.28 0.67 2.42Norway 0.00 0.02 0.02 0.02 0.00 0.01 0.04 0.00Sweden 0.95 0.76 0.23 0.22 0.40 0.21 0.19 0.15
Spain 4.76 3.81 8.80 20.78 52.71 74.10 76.24 69.80US 18.20 7.91 15.48 18.53 21.58 20.32 19.70 14.60UK 5.02 7.75 11.06 7.98 10.66 10.03 5.30 1.91

The New Regulatory Framework
• Itwasobviousthatsystemwideshortageofcapitalledtobankfailuresandsystemiccollapse
• Newregula?onsincreased(slowly)capitalinbanks• Riskweightedcapitalrosetoaround7percentoftotalassets• Aconserva?onbufferof2.5percentofassetswasintroduced• Largebankshadtoholdmorecapital• Aleveragera?oof3percentwasintroduced
• Itwasknowthatcreditgrowthhadbeenamajorcauseofproblems• Acountercyclicalbufferbasedoncredithasbeenintroduced

But do all credit booms cause crises?
• Creditboomsmayincreasethelikelihoodoffinancialcrises,buttheycanalsobetheresultofsoundeconomicdevelopments,andperhapstwothirdsofcreditboomssince1970havenotbeenassociatedwithasubsequentfinancialcrisis(Dell’Aricciaetal.,2012).
• Thebestwaytolookattheassocia?onbetweencreditcycles,assetsboomsandfinancialcrisesistoinves?gatetheinterlinkages(e.g.,SchularickandTaylor,2012;Jorda,ShularickandTaylor,2011;2013).
• BIShaveinves?gatedtheCredittoGDPgap.Thisra?oclearlyrepresentaprac?caltoguidepolicygiventheobjec?veofthebuffer.
• Agrowingemergingliteraturesupportstheviewthatnotallcredit-to-GDPamplifica?onsare“creditboomsgonewrong”,underpinnedby“recklesslending”(SchularickandTaylor,2012;GortonandOrdoñex,2016).

What we will look at
• Wetestthehypothesisthatexcessivecredit-to-GDPgrowthcausesbankingcrisesin14OECDcountriesduring1980–2013,using:
• longseriesontotalcredittotheprivatenonfinancialsector(BIS)toconstructourcredit-to-GDPgaps.
• standarddataonbankingcrisis,macroeconomicandregulatorycontrolvariablesbasedonKarimetal(2013)Barrelletal.(2010,2016),includingcapitaladequacy,liquidity,currentaccountsandpropertypricegrowth.
• Wewishtoexaminetheusefulnessofcountercyclicalbuffersasregulatorytools
• Wecompare4waysofextrac?ngacredittoGDPgap• Weembedgapsinlogitmodelsofcrises
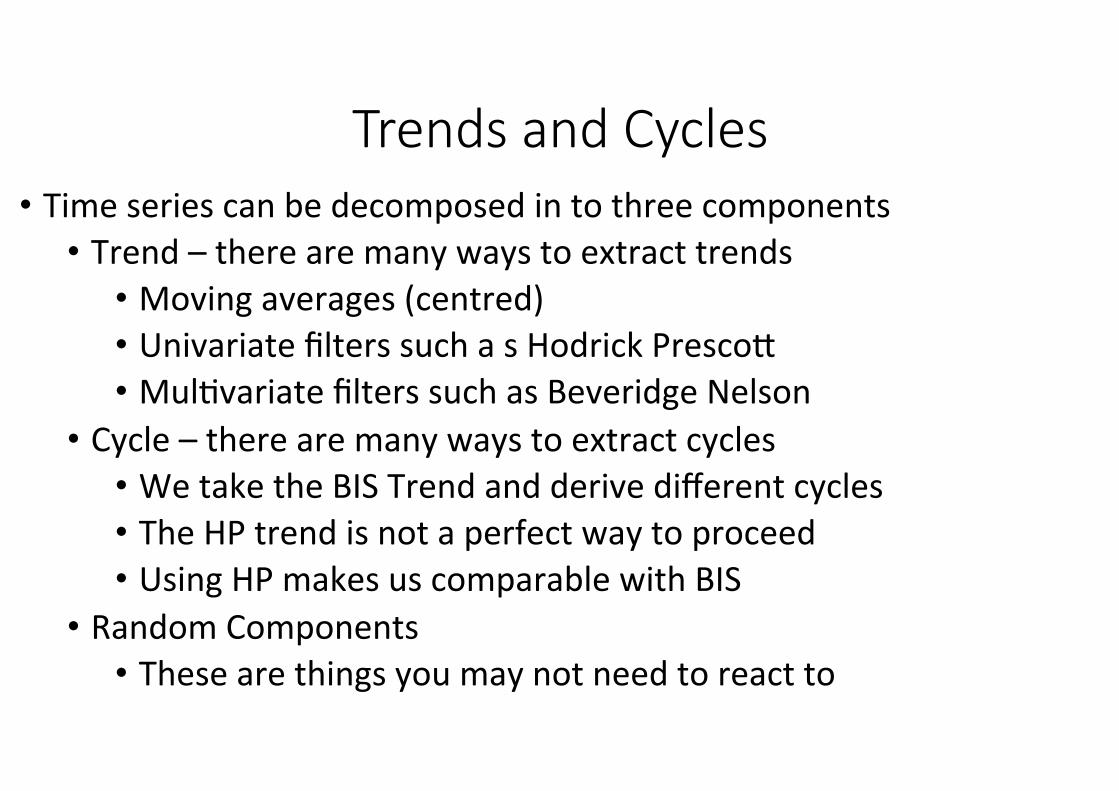
Trends and Cycles • Timeseriescanbedecomposedintothreecomponents
• Trend–therearemanywaystoextracttrends• Movingaverages(centred)• UnivariatefilterssuchasHodrickPrescon• Mul?variatefilterssuchasBeveridgeNelson
• Cycle–therearemanywaystoextractcycles• WetaketheBISTrendandderivedifferentcycles• TheHPtrendisnotaperfectwaytoproceed• UsingHPmakesuscomparablewithBIS
• RandomComponents• Thesearethingsyoumaynotneedtoreactto

Modelling cycles
Weusedatafor14OECDcountriesduring1980–2013,whileweu?liselongseriesontotalcredittotheprivatenonfinancialsectorfromtheBankofInterna?onalSenlementstoconstructourcredit-to-GDPgapsForthecycleweusethefollowingspecifica?ons:• Model1-Irregular:wherenoexplicitassump?onsonthecyclearemade(hence,theirregularorresidualcomponentisconsidered,matchingBorioandLowe,2002).
• Model2–Stochas9cHarvey(1997):wherethesta?s?calspecifica?onofthecycleisgivenbyastochas?ccycle
• Model3-AR(1):wherethesta?s?calspecifica?onofthecycleisdescribedbyanorder-1autoregressiveprocess.
• Model4-AR(2):wherethesta?s?calspecifica?onofthecycleisdescribedbyanorder-2autoregressiveprocess.

Comparing Filters for the Credit to GDP gap
• T=no.ofobserva?ons;p=parameters;SC=Schwarzcriterion;HQ=Hannan-QuinnCriterion;AIC=Akaikeinforma?oncriterion
Model T p log-
likelihood SC HQ AIC Model T p log-
likelihood SC HQ AIC CANADA JAPAN
Irregular 140 1 -291.020 4.1927 4.1803 4.1717 Irregular 140 1 -389.841 5.6045 5.592 5.5834 Harvey (1997) 140 3 -92.165 1.4225 1.3851 1.3595 Harvey (1997) 140 3 -122.174 1.8512* 1.8138* 1.7882* AR(1) 140 2 -99.776 1.496 1.471 1.4539 AR(1) 140 2 -134.405 1.9907 1.9657 1.9486 AR(2) 140 4 -86.879 1.3823* 1.3324* 1.2983* AR(2) 140 4 -132.416 2.0328 1.983 1.9488
BELGIUM NETHERLANDS Irregular 140 1 -309.420 4.4556 4.4431 4.4346 Irregular 140 1 -287.964 4.1491 4.1366 4.1281 Harvey (1997) 140 3 -106.908 1.6331 1.5957 1.5701 Harvey (1997) 140 3 -109.527 1.6706 1.6331* 1.6075* AR(1) 140 2 -109.501 1.6349 1.6099 1.5929 AR(1) 140 2 -111.758 1.6671* 1.6422 1.6251 AR(2) 140 4 -94.011 1.4842* 1.4343* 1.4002* AR(2) 140 4 -112.422 1.7472 1.6973 1.6632 GERMANY NORWAY
Irregular 138 1 -282.371 4.128 4.1154 4.1068 Irregular 140 1 -367.897 5.291 5.2785 5.27
Harvey (1997) 138 3 -40.462 0.69351* 0.65574* 0.62988* Harvey (1997) 140 3 -195.782 2.9028 2.8654 2.8397 AR(1) 138 2 -48.688 0.77703 0.75185 0.73461 AR(1) 140 2 -197.701 2.8949 2.87 2.8529 AR(2) 138 4 -43.345 0.77101 0.72064 0.68616 AR(2) 140 4 -192.485 2.8910* 2.8411* 2.8069*
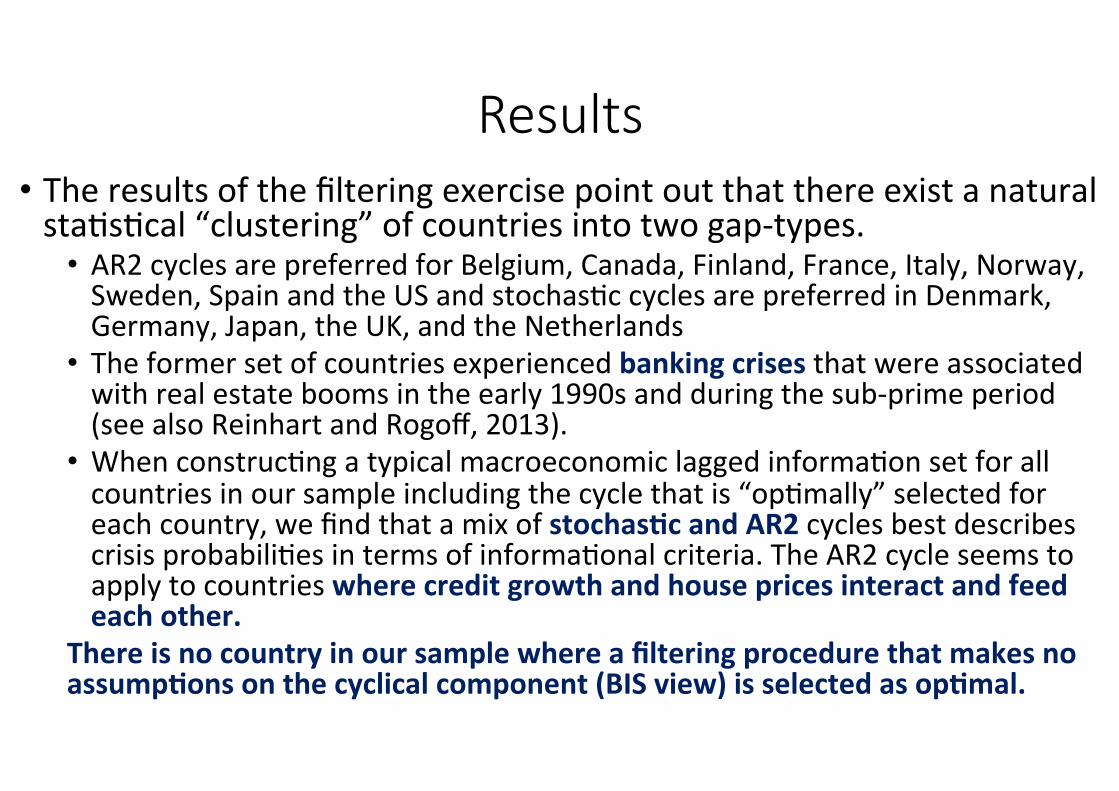
• Theresultsofthefilteringexercisepointoutthatthereexistanaturalsta?s?cal“clustering”ofcountriesintotwogap-types.
• AR2cyclesarepreferredforBelgium,Canada,Finland,France,Italy,Norway,Sweden,SpainandtheUSandstochas?ccyclesarepreferredinDenmark,Germany,Japan,theUK,andtheNetherlands
• Theformersetofcountriesexperiencedbankingcrisesthatwereassociatedwithrealestateboomsintheearly1990sandduringthesub-primeperiod(seealsoReinhartandRogoff,2013).
• Whenconstruc?ngatypicalmacroeconomiclaggedinforma?onsetforallcountriesinoursampleincludingthecyclethatis“op?mally”selectedforeachcountry,wefindthatamixofstochasIcandAR2cyclesbestdescribescrisisprobabili?esintermsofinforma?onalcriteria.TheAR2cycleseemstoapplytocountrieswherecreditgrowthandhousepricesinteractandfeedeachother.
ThereisnocountryinoursamplewhereafilteringprocedurethatmakesnoassumpIonsonthecyclicalcomponent(BISview)isselectedasopImal.
Results

Core variables in tes>ng • Wees?mateLOGITmodelsasabove.Wedonotuse‘signalextrac?on’methodswhichareatbest‘nonparametric’andcanbejustguesswork
• Capitalisabufferthatprotectsbanksagainstthevariabilityoflossesonnon-performingloanswhichareafunc?onofmacrorisks
• LiquidityraIosshowthedegreetowhichbanksarerobusttosuddendemandsforwithdrawalbydepositorsorthelackofwholesalefunds.
• ResidenIalpropertyprices-crisesareosentheresultofpoorqualitylendinginrealestatemarkets,asisdiscussedinReinhartandRogoff(2008).
• CurrentAccount-crisesareosenassociatedwiththegrowthofexternaldebt(ReinhartandRogoff,2008;Karimet.al,2013,Jordaet.al,2013)
• Creditgapmeasures–basedondifferentwaysofconstruc?ngthegap
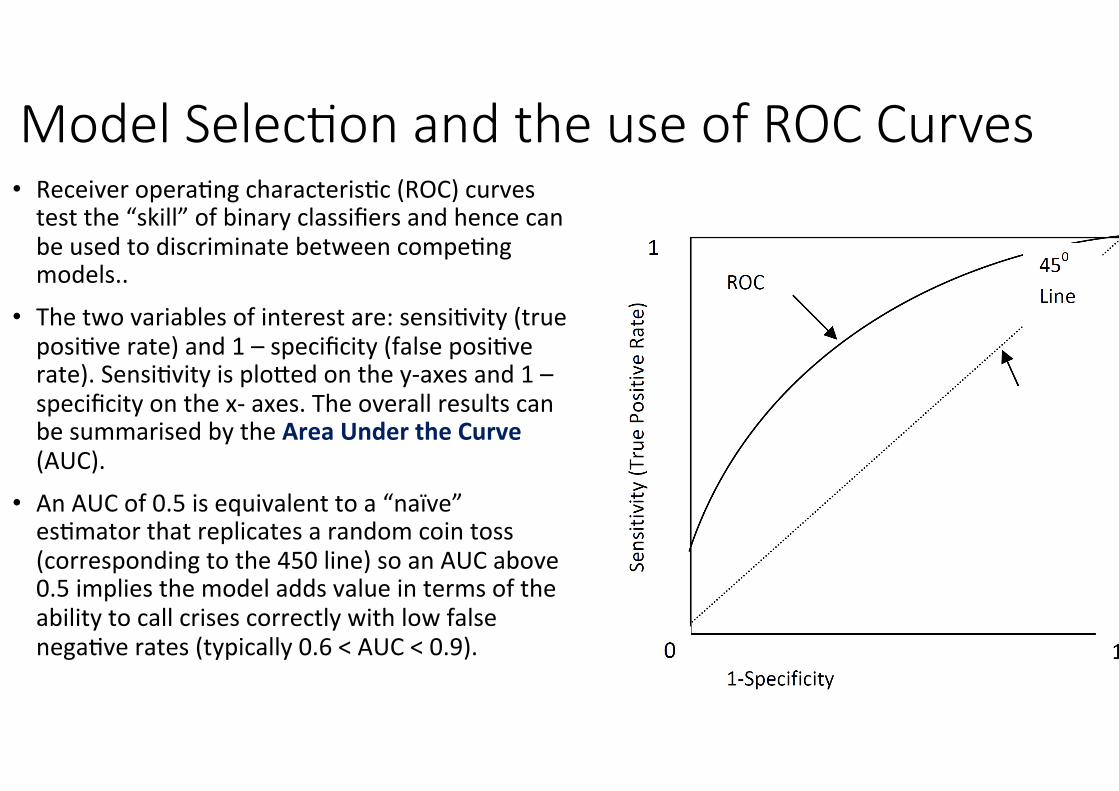
• Receiveropera?ngcharacteris?c(ROC)curvestestthe“skill”ofbinaryclassifiersandhencecanbeusedtodiscriminatebetweencompe?ngmodels..
• Thetwovariablesofinterestare:sensi?vity(trueposi?verate)and1–specificity(falseposi?verate).Sensi?vityisplonedonthey-axesand1–specificityonthex-axes.TheoverallresultscanbesummarisedbytheAreaUndertheCurve(AUC).
• AnAUCof0.5isequivalenttoa“naïve”es?matorthatreplicatesarandomcointoss(correspondingtothe450line)soanAUCabove0.5impliesthemodeladdsvalueintermsoftheabilitytocallcrisescorrectlywithlowfalsenega?verates(typically0.6<AUC<0.9).
Model Selec>on and the use of ROC Curves

Iden>fying crisis episodes • WeuseCaprioandKlingebeil(2003)fromHonohanandLaeven(2005)andDemirguc-KuntandDetragiache,(2005),
• Thedefini?onswereupdatedbyLaevenandValencia(2010)• Dateschange(egforJapan)dependingonwhichversionweuse.
• Thebankingcrisisdependentvariable,abinarybankingcrisisdummy,isdefinedintermsofobservablestressestoacountry’sbankingsystem:
• propor?onofnon-performingloanstototalbankingsystemassetsexceeding10%,• publicbailoutcostexceeded2%ofGDP,
• inLaevanandValencia2013thisisraisedto3%ofGDP• systemiccrisiscausedlargescalebankna?onalisa?on,• extensivebankrunswerevisibleandifnot,emergencygovernmentinterven?onwasvisible.
• Itmaynotalwayshavebeenobvioustothepublicthatacrisiswasunderway,especiallybeforetheeraofcentralbanktransparency

Where we have crises
Ourdatasetincludes23crisesinOECDcountriesovertheperiod1980to2010andourdataspans1980-2013.OverhalfthecrisesarefromtheWorldBankCrisisDatabasecovering1974-2002,(Caprioetal.,2003):• Canada(1983);Denmark(1987);US(1988);ItalyandNorway(1990);Finland,SwedenandJapan(1991);France(1994);UK(1984,1991,1995).
• Forthecrisesepisodesin2007and2008wehaveusedthecrisesdatesfromLaevenandValencia(2010):
• Belgium,Denmark,France,Germany,theNetherlands,SpainandSweden(2008);USandUK(2007).WetreattheUSandtheUKin2008asseparatecrisessinceitwasinducedbythecollapseofLehmanBrothers.
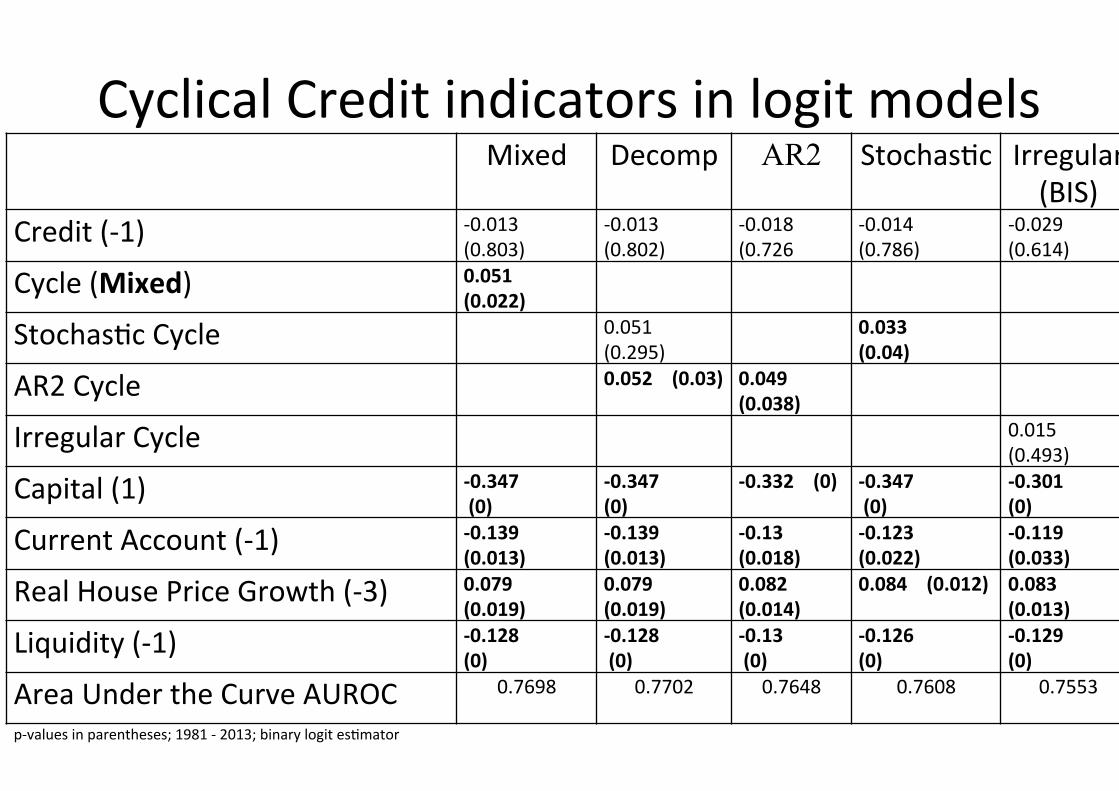
CyclicalCreditindicatorsinlogitmodels Mixed Decomp AR2 Stochas?c Irregular
(BIS) Credit(-1) -0.013
(0.803) -0.013(0.802)
-0.018(0.726
-0.014(0.786)
-0.029(0.614)
Cycle(Mixed) 0.051(0.022)
Stochas?cCycle 0.051(0.295)
0.033(0.04)
AR2Cycle 0.052(0.03) 0.049(0.038)
IrregularCycle 0.015(0.493)
Capital(1) -0.347(0)
-0.347(0)
-0.332(0) -0.347(0)
-0.301(0)
CurrentAccount(-1) -0.139(0.013)
-0.139(0.013)
-0.13(0.018)
-0.123(0.022)
-0.119(0.033)
RealHousePriceGrowth(-3) 0.079(0.019)
0.079(0.019)
0.082(0.014)
0.084(0.012) 0.083(0.013)
Liquidity(-1) -0.128(0)
-0.128(0)
-0.13(0)
-0.126(0)
-0.129(0)
AreaUndertheCurveAUROC 0.7698 0.7702 0.7648 0.7608 0.7553
p-valuesinparentheses;1981-2013;binarylogites?mator

Granger causality results GrangertestssuggestintheAR(2)countriesBelgium,Canada,Finland,France,Italy,Norway,Sweden,Spain,US,housepricegrowthraisedcollateralvalues,s?mula?ngmorecreditgrowthandfurtherhousepriceaccelera?on.Thisviscouscirclepropagatedriskylending,andwhenhousepricesstarttofallthecollapsefeedsitselfNotthecaseinoursecondgroupofcountriesGermany,Denmark,Japan,Netherlands,UKwherehousepricescausecredit,butthereversedoesnothold
Table 3: Granger Causality AR(2) Cycle F-Statistic Prob.
RHPG (X) → CRED (Y) 14.879 0.000
CRED (X) → RHPG (Y) 2.723 0.029
RHPG (X) → Cycle (Y) 18.002 0.000
Cycle (X) → RHPG (Y) 3.095 0.027
Table 4: Granger Causality Stochastic Cycle
F-Statistic Prob.
RHPG (X) → CRED (Y) 10.666 0.000
CRED (X) → RHPG (Y) 2.211 0.068
RHPG (X) → Cycle (Y) 2.506 0.059
Cycle (X) → RHPG (Y) 0.884 0.449

Changing Crisis Dummy Dates
• LaevanandValencia(2013):16crises(vs.23):loseallpre-2007UKcrisesandoneineachtheUS,FranceandCanada
• newcrisissetmoreheavilyweightedtoward2008,and?mingsofothercrisesalsodiffer
• resultsaregenerallyrobustevengivenalargechangeinthedependentvariable
• Inmanycountrieswithcrisesin2008therehadbeennohousepriceincreasescausingpoorlending
Credit(-1) -0.171(0)
Mixed 0.146(0)
Capital(-1) -0.121(0.038)
CurrentAccount(-1)-0.142(0.002)RealHousePriceGrowth(-3) 0.044(0.092)
Liquidity(-1) -0.104(0)p-valuesinparentheses;1981-2013;binarylogites?mator
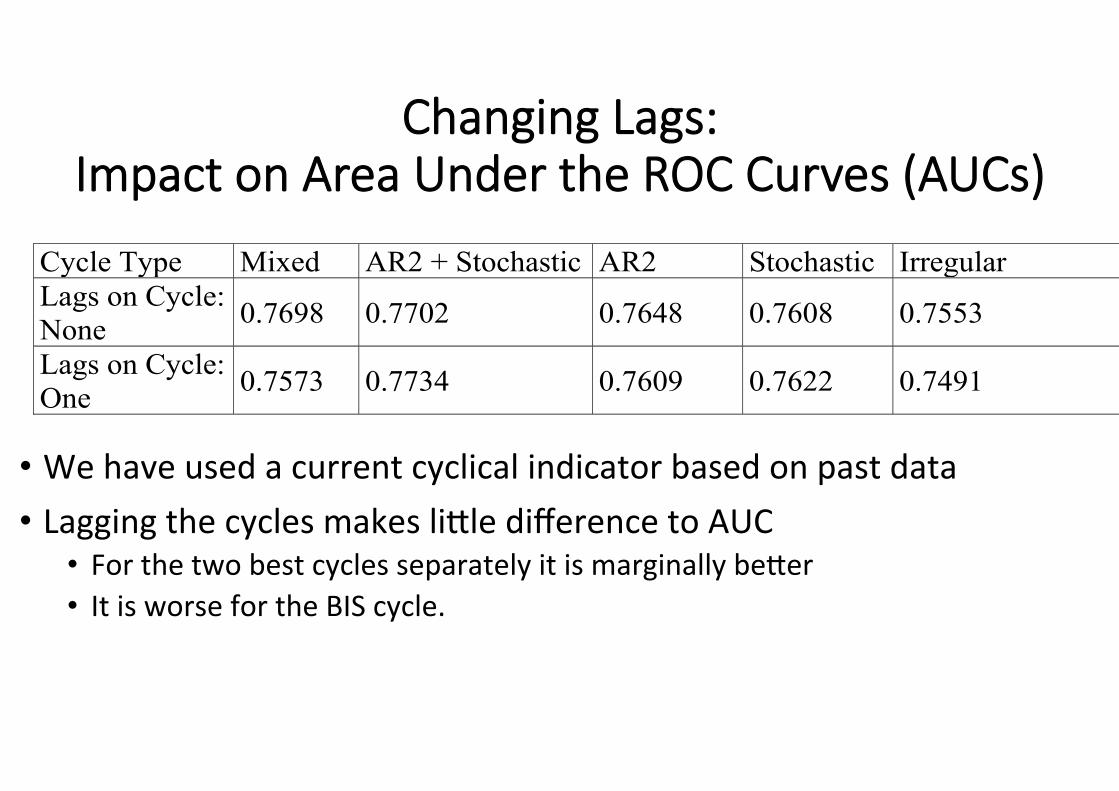
Changing Lags:
Impact on Area Under the ROC Curves (AUCs)
• Wehaveusedacurrentcyclicalindicatorbasedonpastdata• LaggingthecyclesmakeslinledifferencetoAUC
• Forthetwobestcyclesseparatelyitismarginallybener• ItisworsefortheBIScycle.
Cycle Type Mixed AR2 + Stochastic AR2 Stochastic Irregular Lags on Cycle: None 0.7698 0.7702 0.7648 0.7608 0.7553
Lags on Cycle: One 0.7573 0.7734 0.7609 0.7622 0.7491
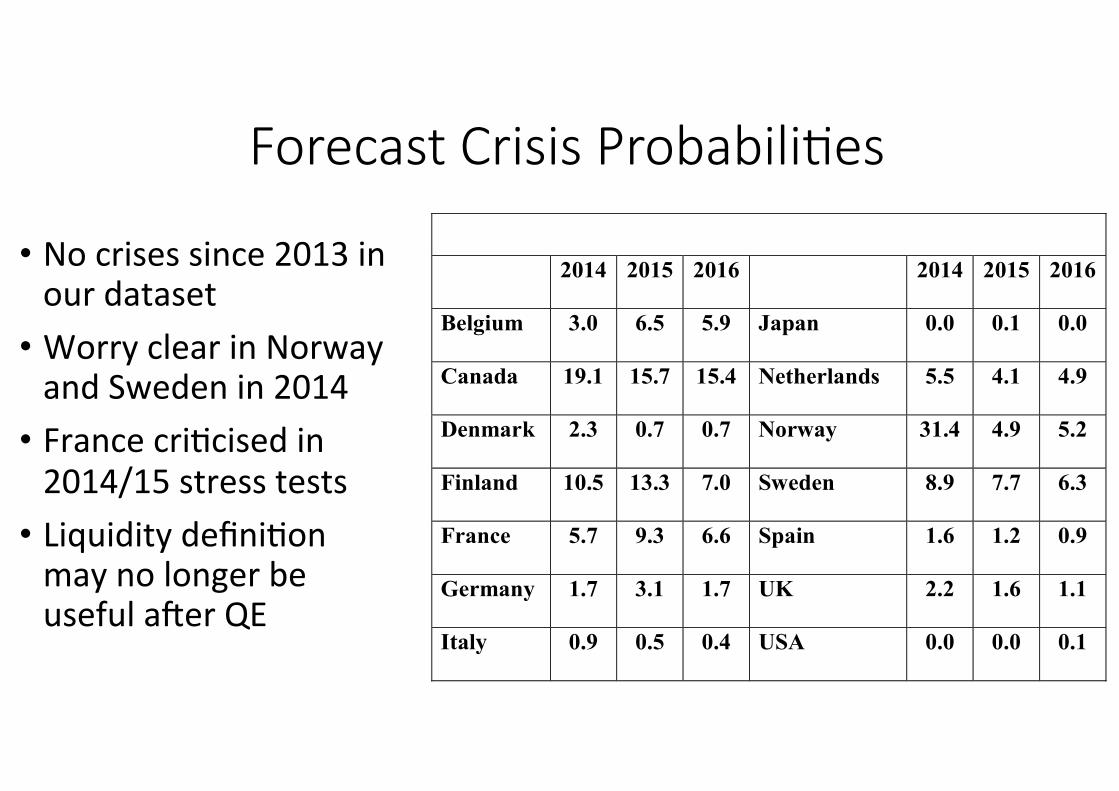
Forecast Crisis Probabili>es
• Nocrisessince2013inourdataset
• WorryclearinNorwayandSwedenin2014
• Francecri?cisedin2014/15stresstests
• Liquiditydefini?onmaynolongerbeusefulaserQE
2014 2015 2016 2014 2015 2016
Belgium 3.0 6.5 5.9 Japan 0.0 0.1 0.0
Canada 19.1 15.7 15.4 Netherlands 5.5 4.1 4.9
Denmark 2.3 0.7 0.7 Norway 31.4 4.9 5.2
Finland 10.5 13.3 7.0 Sweden 8.9 7.7 6.3
France 5.7 9.3 6.6 Spain 1.6 1.2 0.9
Germany 1.7 3.1 1.7 UK 2.2 1.6 1.1
Italy 0.9 0.5 0.4 USA 0.0 0.0 0.1

Can we always explain Crises: Italy 2017 AcallfromCommissarioBrunextotheVeniceCasinoDirector‘Ah,DonorBrunex’heheardtheDirectorsayinhisfriendliesttones,‘howmayIbeofservice?’‘DonorAlvino,’Brunexresponded,honeyinhisvoice,‘Ihopethingsarefinedownthere’‘Ah,’camethedrawnoutsigh,‘aswellascanbe’‘S?lllosingmoney?’Brunexasked,usinghisbestbedsidemanner.‘Unfortunately,yes.Noonecanexplainit’Brunexcould,butthiswasafriendlycall.DonnaLeon‘ByitsCover’p215
Conclusions • Creditgrowthissome?mesagoodindicatorofpotenIalproblemsbutnotethatthisisrestrictedtocaseswhereexcessivelendingfuelsacycleofrisinghousingcollateralwhichinturnpropagatesfurthercreditgrowth.
• Thistransmissionmechanismisunderstudiedandappearstobecapturedbyonlyoneofthefourgapmeasuresweuse.Hence,wesuggestthatthemostcommonlyusedindicatorscannotprovideusefulpolicyrulessincetheydonotdetectfinancialvulnerabili?es.
• Thisresultchallengestheprevailingviewthatexcessivecreditgrowth(definedbyadifferentgapmeasure)requiresbankstoholdexcessregulatorycapital.
• Regulatorsacknowledgethelinkbetweencredit-to-GDPgapsandcapitalbuffersisnotmechanical,butampleconsensusthatthecredit-to-GDPgapisarobustsingleindicatoroffinancialvulnerabili?es(DrehmannandTsatsaronis,2014).Ourfindingssuggestthisisnotalwaysthecase.