Embed Size (px)
Citation preview
Towards objective quantification of the Tinetti test
Lorenzo PanellaRemo Lombardi*,* *Angelo Buizza*Roberto Gandolfi*,* *Paola Pizzagalli
Functional Rehabilitation Service, IRCCS S. Matteo Hospital, Pavia;*Department of Computer Engineering and Systems Science, University of Pavia;**INFM - Italian Institute for the Physics of Matter,Pavia, Italy
Reprint requests to: Dr Lorenzo Panella, Servizio Recupero e Rieducazione Funzionale,IRCCS Policlinico S. Matteo, P.le Golgi 2, 27100 Pavia, ItalyE-mail: [email protected]
Accepted for publication: November 15, 2001
Summary
The Tinetti test is a widespread test for assessing mo-tor control in the elderly, which could also be usefullyapplied in neurology. At present it uses a qualitativemeasurement scale. As a first step towards its objec-tive quantification, trunk inclination was measured dur-ing the test by two inclinometers and quantified by de-scriptive parameters. The 95t h or 5t h percentiles of para-meter distributions in normal subjects (no.=150) weretaken as limits of normality, and parameters computedon 130 institutionalised elderly people were comparedto these limits, to test the parameters’ discriminatorypower. The distributions of many parameters were sta-tistically different in normal subjects and patients.These results suggest that this approach is a promis-ing tool for objective evaluation of the Tinetti test.
KEY WORDS: Elderly; measurement; risk of fall; standard; Tinetti test.
Introduction
In order to maintain postural stability when standingand/or walking, the brain must rapidly process signalsfrom the visual, vestibular and somatosensory systems.Because balance depends on multiple sensory inputs, itcan deteriorate when one or more of these systems fail.The combined loss of sensory signals from several sys -tems has been proposed as a common cause of imbal-ance (1). Some investigators have suggested that im-balance is a normal aging phenomenon that is most
likely the result of multiple conditions (2,3). In fact, dise-quilibrium in older people may have a number of differ-ent causes. Balance can be compromised by a de-crease in lower extremity range of motion, muscle flexi-bility, strength, endurance and general deconditioning.Poor or abnormal posture can also contribute to bal-ance impairment and may be a symptom of a localisedcentral nervous system lesion (4). The interest in bal-ance assessment in neurology is well known; indeed, aquick search in medical databases available on the In-ternet found dozens of papers concerned with postureand neurology. Balance control is most often assessedby conventional posturography, although the Tinetti test(5) offers a possible alternative. The Tinetti test is awidespread test for assessing motor control in the el-derly, but it could be usefully applied in other fields, too,including neurology. For instance, it has been used inthe evaluation of Parkinson’s disease (6) and of acutestroke patients (7). The Tinetti scale has 14 items(overall score up to 24) assessing balance and 10(overall score up to 16) assessing gait. It thus gives amaximum score of 40, with higher scores correspond-ing to better performance (5,8). It is the most widelyused of many other similar assessment scales (9-11).However, it still has some limitations, albeit shared byall the other measurement scales of its genre: i) its results depend on subjective judgments, whichmeans that it cannot provide internationally standard-ised measurements;ii) it is subject to floor-ceiling effects;iii) it uses a scale of integers, which limits its resolution. On the other hand, in geriatrics, the Tinetti test hasbeen shown to help in the clinical approach to the pa-tient. For instance, a recent study demonstrated that itdoes have predictive value for the identification of sub-jects at risk of falling, although “research should bedone into improving performance” (8). We thus endeav-oured to overcome the above measurement limitationsand to improve the performance of the test. Indeed, anad hoc measurement instrument has been developedthat allows objective quantification of a subject’s perfor-mance during the balance items of the Tinetti scale(12). This system (Evaluation System for the TinettiTest, ESTT) was designed according to criteria of tech-nical simplicity, cost-saving, adaptability, ease of useand versatility, and starting from the assumption that itmust be easy to use and to move, manageable by inex-pert personnel, and usable in centres, such as residen-tial nursing homes, that do not have large financial re-sources. The aim of this paper is to summarise the principle andthe characteristics of the ESTT and to present some re-sults obtained with its use. Moreover, it will be outlinedhow this system, providing a tool for the objective eval-uation of a subject’s performance according to interna-
Functional Neurology 2002; 17(1): 25-30 25
tional measurement standards criteria, overcomes thelimitations of conventional evaluation scales. A norma-tive basis for the measurements made using the ESTTis also proposed. These two points are both consistentwith quality system requirements of the Joint Commis-sion on Accreditation of Healthcare Organisations,which has called for the achievement of consensus onthe most recently developed tools, according to interna-tional measurement standards criteria.
Materials and methods
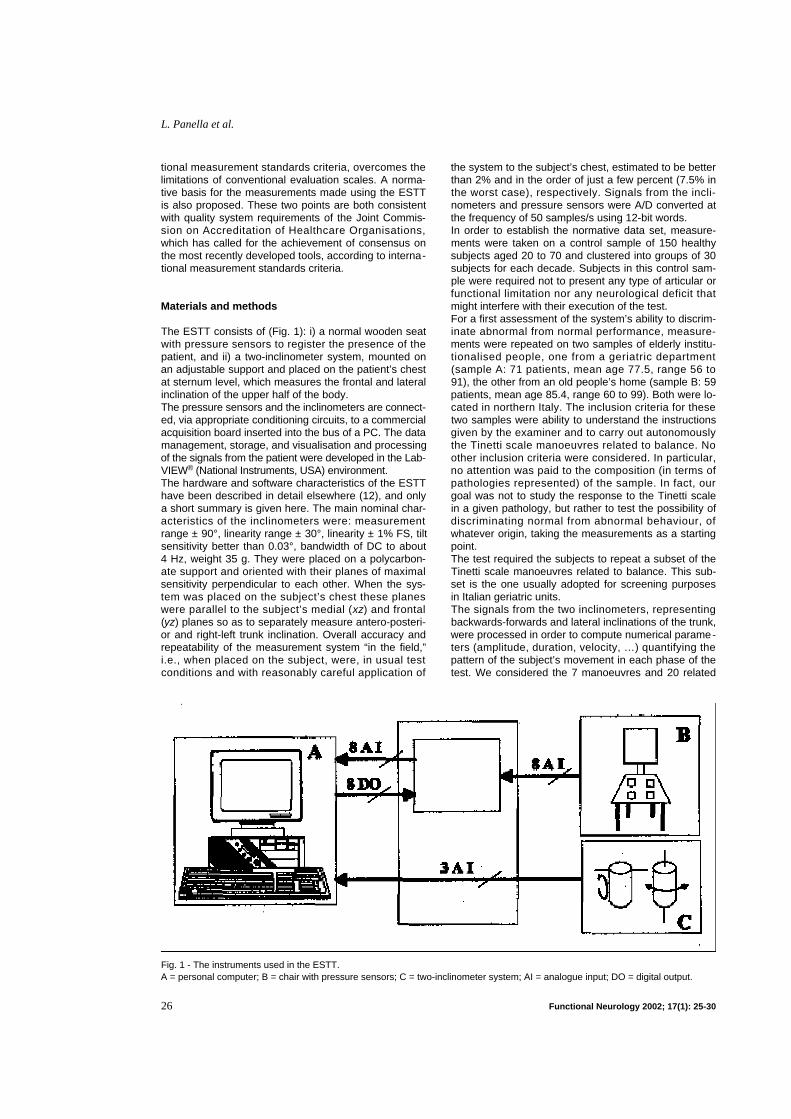
The ESTT consists of (Fig. 1): i) a normal wooden seatwith pressure sensors to register the presence of thepatient, and ii) a two-inclinometer system, mounted onan adjustable support and placed on the patient’s chestat sternum level, which measures the frontal and lateralinclination of the upper half of the body. The pressure sensors and the inclinometers are connect-ed, via appropriate conditioning circuits, to a commercialacquisition board inserted into the bus of a PC. The datamanagement, storage, and visualisation and processingof the signals from the patient were developed in the Lab-V I E W® (National Instruments, USA) environment. The hardware and software characteristics of the ESTThave been described in detail elsewhere (12), and onlya short summary is given here. The main nominal char-acteristics of the inclinometers were: measurementrange ± 90°, linearity range ± 30°, linearity ± 1% FS, tiltsensitivity better than 0.03°, bandwidth of DC to about4 Hz, weight 35 g. They were placed on a polycarbon-ate support and oriented with their planes of maximalsensitivity perpendicular to each other. When the sys-tem was placed on the subject’s chest these planeswere parallel to the subject’s medial (x z) and frontal(yz) planes so as to separately measure antero-posteri-or and right-left trunk inclination. Overall accuracy andrepeatability of the measurement system “in the field,”i.e., when placed on the subject, were, in usual testconditions and with reasonably careful application of
the system to the subject’s chest, estimated to be betterthan 2% and in the order of just a few percent (7.5% inthe worst case), respectively. Signals from the incli-nometers and pressure sensors were A/D converted atthe frequency of 50 samples/s using 12-bit words.In order to establish the normative data set, measure-ments were taken on a control sample of 150 healthysubjects aged 20 to 70 and clustered into groups of 30subjects for each decade. Subjects in this control sam-ple were required not to present any type of articular orfunctional limitation nor any neurological deficit thatmight interfere with their execution of the test.For a first assessment of the system’s ability to discrim-inate abnormal from normal performance, measure-ments were repeated on two samples of elderly institu-tionalised people, one from a geriatric department(sample A: 71 patients, mean age 77.5, range 56 to91), the other from an old people’s home (sample B: 59patients, mean age 85.4, range 60 to 99). Both were lo-cated in northern Italy. The inclusion criteria for thesetwo samples were ability to understand the instructionsgiven by the examiner and to carry out autonomouslythe Tinetti scale manoeuvres related to balance. Noother inclusion criteria were considered. In particular,no attention was paid to the composition (in terms ofpathologies represented) of the sample. In fact, ourgoal was not to study the response to the Tinetti scalein a given pathology, but rather to test the possibility ofdiscriminating normal from abnormal behaviour, ofwhatever origin, taking the measurements as a startingpoint.The test required the subjects to repeat a subset of theTinetti scale manoeuvres related to balance. This sub-set is the one usually adopted for screening purposesin Italian geriatric units. The signals from the two inclinometers, representingbackwards-forwards and lateral inclinations of the trunk,were processed in order to compute numerical parame-ters (amplitude, duration, velocity, …) quantifying thepattern of the subject’s movement in each phase of thetest. We considered the 7 manoeuvres and 20 related
26 Functional Neurology 2002; 17(1): 25-30
L. Panella et al.
Fig. 1 - The instruments used in the ESTT. A = personal computer; B = chair with pressure sensors; C = two-inclinometer system; AI = analogue input; DO = digital output.
parameters listed, respectively, in the first and secondcolumns of Table I (12).The parameter values of all the subjects, grouped intohomogenous samples (samples A, B and controls sub-divided by decades), were evaluated and submitted tostatistical analysis. First, the distributions of the values of each parameterin the various decades represented in the control sam-ple were compared to each other. Then, the distribu-tions of these parameters, relating to normal subjects,were compared to the corresponding distributions insamples A and B, as a first step in testing the capacityof each parameter to discriminate between different be-haviours or performances. On a qualitative level, thediscriminatory power of a parameter is shown by thedegree of separation between the distribution of its val-ues in different samples. In order to quantify this sepa-ration in a simple way, the median and interquartile in-terval (interval between the 25t h and 75t h p e r c e n t i l e s )were calculated for each parameter and each sample.Furthermore, for the parameters that measured the am-plitude of postural sway, the duration of the differentmovements, the inclinations of the trunk and the num-ber of steps needed to effect a full turn on the spot, thevalue corresponding to the 95 th percentile of the normal
distribution was computed, as was the percentage ofpatients whose performance was worse, i.e., in whomthe parameter value was higher than the 95 t h p e r-centile. For the parameters measuring the inclinationvelocities of the trunk, the 5th percentile of the normaldistribution and the percentage of patients who had avelocity lower than that percentile were evaluated. Thedecision to use the 95th (or 5th) percentiles was made inan attempt to filter out possible outliers by disregardingthe maximum (or minimum) values, which may well beproduced by artefacts. Thus, the 95 t h (or 5 t h) per-centiles of the parameter distributions in normal sub-jects were chosen as the cut-offs, or thresholds, againstwhich the performance of the elderly subject can bedeemed normal or otherwise. The use of this simplemethod is justified by the fact that only a judgment onthe normality of the individual performance, and not astatistical comparison between groups, was sought.
Results
First of all, we considered the results of the controlgroup (normal subjects) divided by age decades. A firstcomparison between the mean and standard deviation
Functional Neurology 2002; 17(1): 25-30 27
Quantification of the Tinetti test
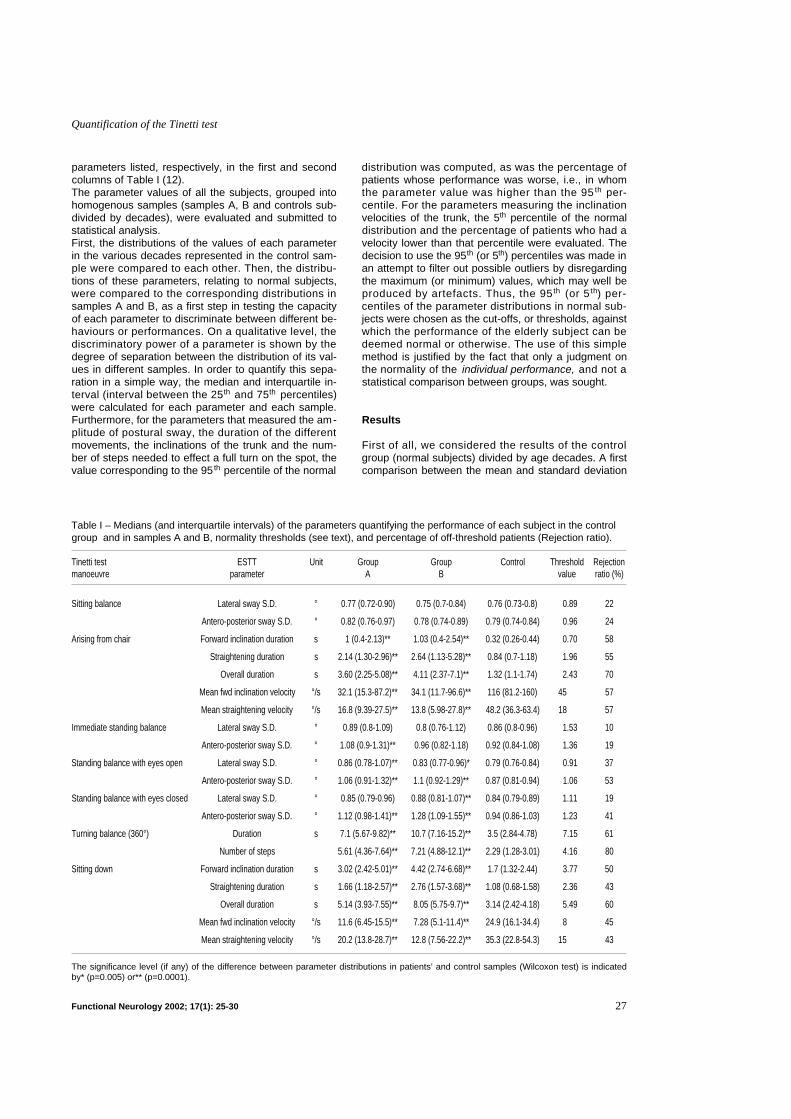
Table I – Medians (and interquartile intervals) of the parameters quantifying the performance of each subject in the controlgroup and in samples A and B, normality thresholds (see text), and percentage of off-threshold patients (Rejection ratio).
Tinetti test ESTT Unit Group Group Control Threshold Rejectionmanoeuvre parameter A B value ratio (%)
Sitting balance Lateral sway S.D. ° 0.77 (0.72-0.90) 0.75 (0.7-0.84) 0.76 (0.73-0.8) 0.89 22
Antero-posterior sway S.D. ° 0.82 (0.76-0.97) 0.78 (0.74-0.89) 0.79 (0.74-0.84) 0.96 24
Arising from chair Forward inclination duration s 1 (0.4-2.13)** 1.03 (0.4-2.54)** 0.32 (0.26-0.44) 0.70 58
Straightening duration s 2.14 (1.30-2.96)** 2.64 (1.13-5.28)** 0.84 (0.7-1.18) 1.96 55
Overall duration s 3.60 (2.25-5.08)** 4.11 (2.37-7.1)** 1.32 (1.1-1.74) 2.43 70
Mean fwd inclination velocity °/s 32.1 (15.3-87.2)** 34.1 (11.7-96.6)** 116 (81.2-160) 45 57
Mean straightening velocity °/s 16.8 (9.39-27.5)** 13.8 (5.98-27.8)** 48.2 (36.3-63.4) 18 57
Immediate standing balance Lateral sway S.D. ° 0.89 (0.8-1.09) 0.8 (0.76-1.12) 0.86 (0.8-0.96) 1.53 10
Antero-posterior sway S.D. ° 1.08 (0.9-1.31)** 0.96 (0.82-1.18) 0.92 (0.84-1.08) 1.36 19
Standing balance with eyes open Lateral sway S.D. ° 0.86 (0.78-1.07)** 0.83 (0.77-0.96)* 0.79 (0.76-0.84) 0.91 37
Antero-posterior sway S.D. ° 1.06 (0.91-1.32)** 1.1 (0.92-1.29)** 0.87 (0.81-0.94) 1.06 53
Standing balance with eyes closed Lateral sway S.D. ° 0.85 (0.79-0.96) 0.88 (0.81-1.07)** 0.84 (0.79-0.89) 1.11 19
Antero-posterior sway S.D. ° 1.12 (0.98-1.41)** 1.28 (1.09-1.55)** 0.94 (0.86-1.03) 1.23 41
Turning balance (360°) Duration s 7.1 (5.67-9.82)** 10.7 (7.16-15.2)** 3.5 (2.84-4.78) 7.15 61
Number of steps 5.61 (4.36-7.64)** 7.21 (4.88-12.1)** 2.29 (1.28-3.01) 4.16 80
Sitting down Forward inclination duration s 3.02 (2.42-5.01)** 4.42 (2.74-6.68)** 1.7 (1.32-2.44) 3.77 50
Straightening duration s 1.66 (1.18-2.57)** 2.76 (1.57-3.68)** 1.08 (0.68-1.58) 2.36 43
Overall duration s 5.14 (3.93-7.55)** 8.05 (5.75-9.7)** 3.14 (2.42-4.18) 5.49 60
Mean fwd inclination velocity °/s 11.6 (6.45-15.5)** 7.28 (5.1-11.4)** 24.9 (16.1-34.4) 8 45
Mean straightening velocity °/s 20.2 (13.8-28.7)** 12.8 (7.56-22.2)** 35.3 (22.8-54.3) 15 43
The significance level (if any) of the difference between parameter distributions in patients’ and control samples (Wilcoxon test) is indicatedby* (p=0.005) or** (p=0.0001).
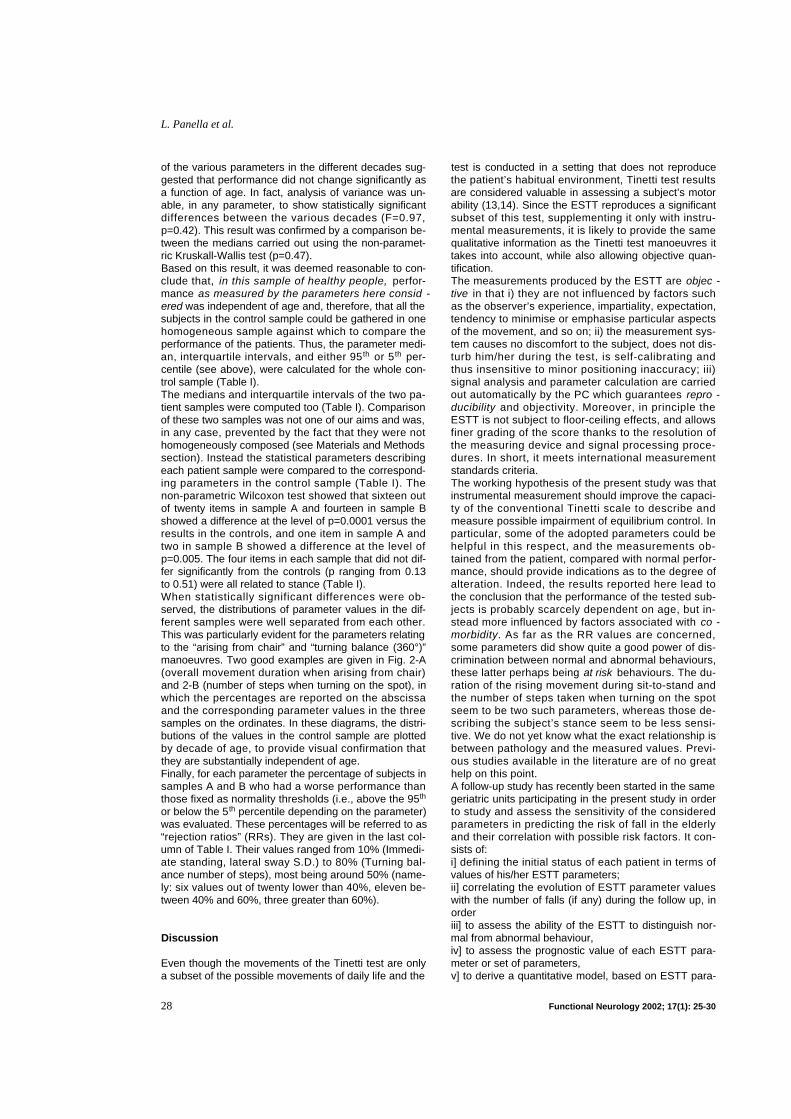
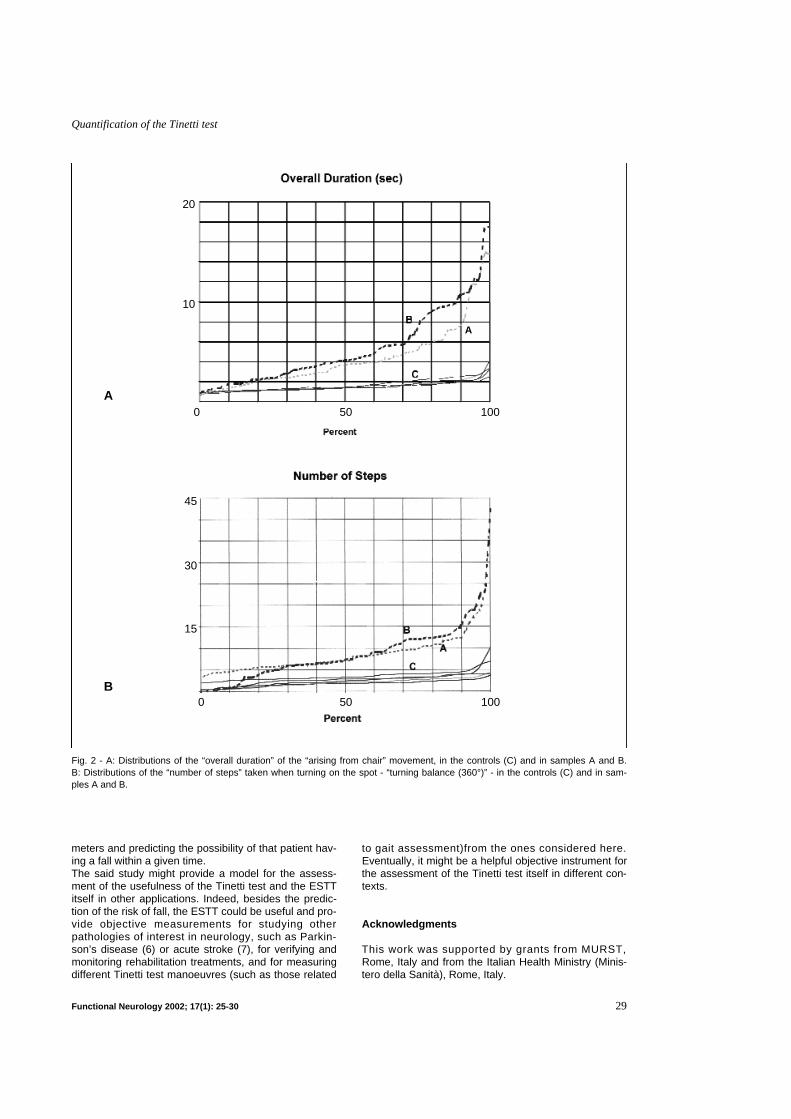
of the various parameters in the different decades sug-gested that performance did not change significantly asa function of age. In fact, analysis of variance was un-able, in any parameter, to show statistically significantdifferences between the various decades (F=0.97,p=0.42). This result was confirmed by a comparison be-tween the medians carried out using the non-paramet-ric Kruskall-Wallis test (p=0.47). Based on this result, it was deemed reasonable to con-clude that, in this sample of healthy people, p e r f o r-m a n c e as measured by the parameters here consid -ered was independent of age and, therefore, that all thesubjects in the control sample could be gathered in onehomogeneous sample against which to compare theperformance of the patients. Thus, the parameter medi-an, interquartile intervals, and either 95 t h or 5 t h p e r-centile (see above), were calculated for the whole con-trol sample (Table I). The medians and interquartile intervals of the two pa-tient samples were computed too (Table I). Comparisonof these two samples was not one of our aims and was,in any case, prevented by the fact that they were nothomogeneously composed (see Materials and Methodssection). Instead the statistical parameters describingeach patient sample were compared to the correspond-ing parameters in the control sample (Table I). Thenon-parametric Wilcoxon test showed that sixteen outof twenty items in sample A and fourteen in sample Bshowed a difference at the level of p=0.0001 versus theresults in the controls, and one item in sample A andtwo in sample B showed a difference at the level ofp=0.005. The four items in each sample that did not dif-fer significantly from the controls (p ranging from 0.13to 0.51) were all related to stance (Table I).When statistically significant differences were ob-served, the distributions of parameter values in the dif-ferent samples were well separated from each other.This was particularly evident for the parameters relatingto the “arising from chair” and “turning balance (360°)”manoeuvres. Two good examples are given in Fig. 2-A(overall movement duration when arising from chair)and 2-B (number of steps when turning on the spot), inwhich the percentages are reported on the abscissaand the corresponding parameter values in the threesamples on the ordinates. In these diagrams, the distri-butions of the values in the control sample are plottedby decade of age, to provide visual confirmation thatthey are substantially independent of age.Finally, for each parameter the percentage of subjects insamples A and B who had a worse performance thanthose fixed as normality thresholds (i.e., above the 95t h
or below the 5 t h percentile depending on the parameter)was evaluated. These percentages will be referred to as“rejection ratios” (RRs). They are given in the last col-umn of Table I. Their values ranged from 10% (Immedi-ate standing, lateral sway S.D.) to 80% (Turning bal-ance number of steps), most being around 50% (name-ly: six values out of twenty lower than 40%, eleven be-tween 40% and 60%, three greater than 60%).
Discussion
Even though the movements of the Tinetti test are onlya subset of the possible movements of daily life and the
test is conducted in a setting that does not reproducethe patient’s habitual environment, Tinetti test resultsare considered valuable in assessing a subject’s motorability (13,14). Since the ESTT reproduces a significantsubset of this test, supplementing it only with instru-mental measurements, it is likely to provide the samequalitative information as the Tinetti test manoeuvres ittakes into account, while also allowing objective quan-tification.The measurements produced by the ESTT are o b j e c -t i v e in that i) they are not influenced by factors suchas the observer’s experience, impartiality, expectation,tendency to minimise or emphasise particular aspectsof the movement, and so on; ii) the measurement sys-tem causes no discomfort to the subject, does not dis-turb him/her during the test, is self-calibrating andthus insensitive to minor positioning inaccuracy; iii)signal analysis and parameter calculation are carriedout automatically by the PC which guarantees r e p r o -d u c i b i l i t y and objectivity. Moreover, in principle theESTT is not subject to floor-ceiling effects, and allowsfiner grading of the score thanks to the resolution ofthe measuring device and signal processing proce-dures. In short, it meets international measurementstandards criteria.The working hypothesis of the present study was thatinstrumental measurement should improve the capaci-ty of the conventional Tinetti scale to describe andmeasure possible impairment of equilibrium control. Inparticular, some of the adopted parameters could behelpful in this respect, and the measurements ob-tained from the patient, compared with normal perfor-mance, should provide indications as to the degree ofalteration. Indeed, the results reported here lead tothe conclusion that the performance of the tested sub-jects is probably scarcely dependent on age, but in-stead more influenced by factors associated with c o -m o r b i d i t y. As far as the RR values are concerned,some parameters did show quite a good power of dis-crimination between normal and abnormal behaviours,these latter perhaps being at risk behaviours. The du-ration of the rising movement during sit-to-stand andthe number of steps taken when turning on the spotseem to be two such parameters, whereas those de-scribing the subject’s stance seem to be less sensi-tive. We do not yet know what the exact relationship isbetween pathology and the measured values. Previ-ous studies available in the literature are of no greathelp on this point. A follow-up study has recently been started in the samegeriatric units participating in the present study in orderto study and assess the sensitivity of the consideredparameters in predicting the risk of fall in the elderlyand their correlation with possible risk factors. It con-sists of: i] defining the initial status of each patient in terms ofvalues of his/her ESTT parameters; ii] correlating the evolution of ESTT parameter valueswith the number of falls (if any) during the follow up, inorder iii] to assess the ability of the ESTT to distinguish nor-mal from abnormal behaviour, iv] to assess the prognostic value of each ESTT para-meter or set of parameters, v] to derive a quantitative model, based on ESTT para-
28 Functional Neurology 2002; 17(1): 25-30
L. Panella et al.
meters and predicting the possibility of that patient hav-ing a fall within a given time. The said study might provide a model for the assess-ment of the usefulness of the Tinetti test and the ESTTitself in other applications. Indeed, besides the predic-tion of the risk of fall, the ESTT could be useful and pro-vide objective measurements for studying otherpathologies of interest in neurology, such as Parkin-son’s disease (6) or acute stroke (7), for verifying andmonitoring rehabilitation treatments, and for measuringdifferent Tinetti test manoeuvres (such as those related
to gait assessment)from the ones considered here.Eventually, it might be a helpful objective instrument forthe assessment of the Tinetti test itself in different con-texts.
Acknowledgments
This work was supported by grants from MURST,Rome, Italy and from the Italian Health Ministry (Minis-tero della Sanità), Rome, Italy.
Functional Neurology 2002; 17(1): 25-30 29
Quantification of the Tinetti test
Fig. 2 - A: Distributions of the “overall duration” of the “arising from chair” movement, in the controls (C) and in samples A and B. B: Distributions of the “number of steps” taken when turning on the spot - “turning balance (360°)” - in the controls (C) and in sam-ples A and B.
A
B
A
20
10
45
30
15
0 50 100
0 50 100
References
11. Kerber KA, Enrietto JA, Jacobson KM, Baloh RW.Disequilibrium in older people. A prospective study.Neurology 1998;51:574-580
12. Jenkins HA, Furman JM, Gulya AJ, Honrubia V,Linthicum FH, Mirka H. Dysequilibrium of aging.Otolaryngol Head Neck Surg 1989;100:272-282
13. Fife TD, Baloh RW. Disequilibrium of unknowncause in older people. Ann Neurol 1993;34:694-702
14. Parikh SS, Bid CV. Vestibular rehabilitation In:DeLisa JA, Gans BM eds Rehabilitation Medicine.Lippincott-Raven 1998; (ch. 71):1759-1778
15. Tinetti ME. Performance-oriented assessment ofmobility problems in elderly patients. J Am GeriatrSoc 1986;34:119-126
16. de Leest BJ, van der Aa GC. Een wankel evenwicht.Tijdschr Gerontol Geriatr 1997;28:209-212
17. Daly JJ, Ruff RL, Haycook K, Strasshofer B, Marso-lais EB, Dobos L. Feasibility of gait training for acutestroke patients using FNS with implanted elec-trodes. J Neurol Sci 2000; 179(S 1-2): 103-107
18. Raihe M, Hbert R, Prince F, Corriveau H. Screeningolder adults at risk of falling with the Tinetti balancescale. Lancet 2000;356:1001-1002
19. Prudham D, Evans JG. Factors associated with fallsin the elderly: a community study. Age Ageing1 9 8 1 ; 1 0 : 1 4 1 - 1 4 6
10. VanSwearingen JM, Paschal KA, Bonino P, ChenTW. Assessing recurrent fall risk of community-dwelling, frail older veterans using specific tests ofmobility and the physical performance test of func-tion. J Gerontol A Biol Sci Med Sci 1998;53: M457-M 4 6 4
11. Cwikel JG, Fried AV, Biderman A, Galinsky D. Vali-dation of a fall-risk screening test, the Elderly FallScreening Test (EFST), for community-dwelling el-derly. Disabil Rehabil 1998;20:161-167
12. Lombardi R, Buizza A, Gandolfi R, Vignarelli C,Guaita A, Panella L. Measurement on Tinetti test: in-strumentation and procedures. Technol Health Care2 0 0 1 ; 9 : 4 0 3 - 4 1 5
13. Thapa PB, Gideon P, Brockman KG, Fought RL,Ray WA. Clinical and biomechanical measures ofbalance as fall predictors in ambulatory nursinghome residents. J Gerontol A Biol Sci Med Sci1 9 9 6 ; 5 1 : M 2 3 9 - M 2 4 6
14. Tinetti ME, Williams TF, Mayewski R. Fall risk indexfor elderly patients based on number of chronic dis-abilities. Am J Med 1986;80:429-434
30 Functional Neurology 2002; 17(1): 25-30
L. Panella et al.