Embed Size (px)
Citation preview

THESIS FOR THE DEGREE OF LICENTIATE ENGINEERING
Towards Topography Characterization of
Additive Manufacturing Surfaces
AMOGH VEDANTHA KRISHNA
Department of Industrial and Materials Science
Chalmers University of Technology
Gothenburg, Sweden 2020
Towards topography characterization of additive manufacturing surfaces
AMOGH VEDANTHA KRISHNA
© AMOGH VEDANTHA KRISHNA, 2020.
Thesis for the degree of Licentiate of Engineering
Report no. IMS-2020-8
Published and distributed by:
Department of Industrial and Materials Science
Chalmers University of Technology
SE - 412 96 Gothenburg, Sweden
Printed in Sweden
Chalmers Digitaltryck
Gothenburg, Sweden 2020
Telephone + 46 (0)31-772 1000
I
Towards topography characterization of additive manufacturing surfaces
AMOGH VEDANTHA KRISHNA
Department of Industrial and Materials Science
Chalmers University of Technology
ABSTRACT
Additive Manufacturing (AM) is on the verge of causing a downfall to conventional
manufacturing with its huge potential in part manufacture. With an increase in demand for
customized product, on-demand production and sustainable manufacturing, AM is gaining a
great deal of attention from different industries in recent years. AM is redefining product design
by revolutionizing how products are made. AM is extensively utilized in automotive, aerospace,
medical and dental applications for its ability to produce intricate and lightweight structures.
Despite their popularity, AM has not fully replaced traditional methods with one of the many
reasons being inferior surface quality. Surface texture plays a crucial role in the functionality
of a component and can cause serious problems to the manufactured parts if left untreated.
Therefore, it is necessary to fully understand the surface behavior concerning the factors
affecting it to establish control over the surface quality.
The challenge with AM is that it generates surfaces that are different compared to
conventional manufacturing techniques and varies with respect to different materials,
geometries and process parameters. Therefore, AM surfaces often require novel
characterization approaches to fully explain the manufacturing process. Most of the previously
published work has been broadly based on two-dimensional parametric measurements. Some
researchers have already addressed the AM surfaces with areal surface texture parameters but
mostly used average parameters for characterization which is still distant from a full surface
and functional interpretation. There has been a continual effort in improving the
characterization of AM surfaces using different methods and one such effort is presented in this
thesis.
The primary focus of this thesis is to get a better understanding of AM surfaces to facilitate
process control and optimization. For this purpose, the surface texture of Fused Deposition
Modeling (FDM) and Laser-based Powder Bed Fusion of Metals (PBF-LB/M) have been
characterized using various tools such as Power Spectral Density (PSD), Scale-sensitive fractal
analysis based on area-scale relations, feature-based characterization and quantitative
characterization by both profile and areal surface texture parameters. A methodology was
developed using a Linear multiple regression and a combination of the above-mentioned
characterization techniques to identify the most significant parameters for discriminating
different surfaces and also to understand the manufacturing process. The results suggest that
the developed approaches can be used as a guideline for AM users who are looking to optimize
the process for gaining better surface quality and component functionality, as it works
effectively in finding the significant parameters representing the unique signatures of the
manufacturing process. Future work involves improving the accuracy of the results by
implementing improved statistical models and testing other characterization methods to
enhance the quality and function of the parts produced by the AM process.
Keywords: Additive manufacturing, Fused deposition modeling, Laser-based Powder bed
fusion, Power spectral density, Scale-sensitive fractal analysis, Feature-based characterization,
Profile parameters, Areal surface texture parameters, Multiple regression, Stylus profilometer,
Structured light projection, Confocal fusion.

II

III
ACKNOWLEDGEMENTS
I am grateful for the opportunity provided to me at Halmstad University and would like to take
this moment to thank all the people who supported and helped me during my licentiate thesis.
Firstly, I would like to express my deepest gratitude to my supervisor Prof. Bengt-Göran Rosén
for his continuous support, patience and encouragement throughout the development of this
research work. His immense knowledge, experience and timely guidance allowed me to grow
both personally and professionally.
My sincere thanks to my closest friend and colleagues, Vijeth Venkataram Reddy and Olena
Flys for their guidance, cooperation and contribution. I am grateful to all my collaborators and
co-authors for their inputs in my research.
I would like to extend my gratitude to all my colleagues at Halmstad University especially,
Henrik Barth, Sabina Rebeggiani, Zlate Dimkovski and Pär-Johan Lööf for their endless help
and valuable advice. Special mention to Johan Berglund from RISE for his guidance and
support. Many thanks to Prof. Tom R. Thomas for his valuable comments on my thesis report.
Furthermore, I wish to thank Stefan Rosén from Toponova AB for his insightful comments
and suggestions on surface metrology. Special thanks to Digital Surf for providing
MountainsMap surface image analysis and metrology software.
Finally, I would like to thank all my friends for their support, especially Rakshith for his help
with endless reasoning and guidance. I owe a debt of gratitude to my family, my mother, Meera
and my father, Vedantha Krishna for their implacable love, support and unwavering belief in
me. Without them, I would not be the person I am today. Above all, I would like to thank my
wife, Vidya, for her unparalleled love, patience and constant support. She kept me going during
my difficult times with never-ending motivation and kept me balanced during the past few
months, this work would not have been possible without her.

IV
V
LIST OF APPENDED PAPERS
Paper 1: Amogh V. Krishna, O. Flys, Vijeth V. Reddy, A. Leicht, L. Hammar and B.-G.
Rosén. (2018) Potential approach towards effective topography characterization of 316L
stainless steel components produced by selective laser melting process. In: European Society
for Precision Engineering and Nanotechnology, Conference Proceedings - 18th International
Conference and Exhibition, EUSPEN (pp. 259-260).
Paper 2: Amogh V. Krishna, O. Flys, Vijeth V. Reddy, J. Berglund and B.-G. Rosén. (2020)
Areal surface topography representation of as-built and post-processed samples produced by
powder bed fusion using laser beam melting. Journal of Surface Topography: Metrology and
Properties, Volume 8, 024012.
Paper 3: Amogh V. Krishna, M. Faulcon, B. Timmers, Vijeth V. Reddy, H. Barth, G.
Nilsson and B.-G. Rosén. (2020) Influence of different post-processing methods on surface
topography of fused deposition modelling samples. Journal of Surface Topography:
Metrology and Properties, Volume 8, 014001.
Paper 4: Vijeth V. Reddy, O. Flys, A. Chaparala, C. E. Berrimi, Amogh V. Krishna and B.-
G. Rosén. (2018) Study on surface texture of Fused Deposition Modeling. Procedia
Manufacturing, Volume 25, Pages 389-396, ISSN 2351-9789, 2018.

VI

VII
LIST OF ABBREVIATIONS AND SYMBOLS
AM Additive Manufacturing
FDM Fused Deposition Modeling
FFF Fused Filament Fabrication
ASTM American Society for Testing and Materials
ISO International Organization of Standardization
SLA Stereolithography
DLP Digital Light Processing
CLIP Continuous Light Interface Production
SGC Solid Ground Curing
LPS Liquid Phase Sintering
PBF-LB/P Laser-Based Powder Bed Fusion of Polymers
PBF-LB/M Laser-Based Powder Bed Fusion of Metals
PBF-EB/M Electron Beam Powder Bed Fusion of Metals
EBM Electron Beam Melting
EBAM Electron Beam Additive Manufacturing
SLS Selective Laser Sintering
DMLS Direct Metal Laser Sintering
SLM Selective Laser Melting
LOM Laminated Object Manufacturing
UAM Ultraviolet Additive Manufacturing
DED Directed Energy Deposition
LENS Laser Engineered Net Shaping
EBW Electron Beam Welding
IIOT Industrial Internet of Things
STL Standard Triangle Language
ABS Acrylonitrile Butadiene Styrene
CM Confocal Microscope
FV Focus Variation
FP Fringe Projection
CCD Charge-Coupled Device
CF Confocal Fusion
λs Low pass micro-roughness filter
λc High pass filter
P Primary
R Roughness
W Waviness
S Surface
V Volume
GPS Geometrical Product Specifications
PSD Power Spectral Density
ASME American Society of Mechanical Engineers
VIII
A Area
h(x, y) Surface height map
ℱ Fourier Transform
a Lateral displacement in the spatial frequency domain in the x-direction
b Lateral displacement in the spatial frequency domain in the y-direction
w Width of the pixel
l Length of the pixel
PSDF Power Spectral Density Function
ANOVA Analysis of Variance
R2 Coefficient of determination
Lt Layer thickness
α Build inclination
Ra Arithmetic mean deviation of roughness profile
Rp Maximum peak height of roughness profile
Rz Maximum height of roughness profile
Rdc Roughness profile Section Height difference
Rv Maximum valley depth of the roughness profile.
Rsm Mean width of roughness profile elements
Rpc Peak count on the roughness profile
Sa Average Roughness
Sq Root Mean Square Height
Smc Inverse Material Ratio
Sal Auto-Correlation Length
Str Texture Aspect Ratio
Sdq Root Mean Square Gradient
Sdr Developed Interfacial Area Ratio
Vmc Core Material Volume
Vvc Core Void Volume
Vv Void Volume
AVD Acetone Vapour Deposition
LAF Laser-Assisted Finishing
DOE Design of Experiments
S/N Signal to Noise ratio
LI Low Infill
MI Medium Infill
HI High Infill
HQ High Quality
MQ Medium Quality

IX
TABLE OF CONTENTS
ABSTRACT ............................................................................................................................... I
ACKNOWLEDGEMENTS .................................................................................................. III
LIST OF APPENDED PAPERS ............................................................................................ V
LIST OF ABBREVIATIONS AND SYMBOLS ............................................................... VII
1 INTRODUCTION ............................................................................................................. 1
1.1 Background .............................................................................................................................. 1
1.2 Aim of the thesis ...................................................................................................................... 2
1.3 Research Questions ................................................................................................................. 2
1.4 Approach ................................................................................................................................. 2
1.5 Delimitations ........................................................................................................................... 3
1.6 Thesis structure ....................................................................................................................... 4
2 ADDITIVE MANUFACTURING SYSTEMS ............................................................... 5
2.1 Introduction ............................................................................................................................. 5
2.1.1 Additive Manufacturing as Sustainable Manufacturing .................................................. 7
2.2 Laser-based Powder Bed Fusion of Metals (PBF-LB/M) .......................................................... 8
2.3 Fused Deposition Modeling ................................................................................................... 10
2.4 Post-processing ..................................................................................................................... 11
2.4.1 Shot-blasting .................................................................................................................. 11
2.4.2 Laser-assisted finishing .................................................................................................. 13
2.4.3 Acetone vapor finishing ................................................................................................. 13
3 SURFACE METROLOGY ............................................................................................ 15
3.1 Stylus Profilometer ................................................................................................................ 16
3.2 Structured light projection .................................................................................................... 16
3.3 Confocal microscopy ............................................................................................................. 17
3.4 Focus Variation ...................................................................................................................... 18
3.5 Confocal fusion ...................................................................................................................... 19
4 TOPOGRAPHY CHARACTERIZATION METHODS ............................................ 21
4.1 Parametric characterization .................................................................................................. 22
4.1.1 Profile roughness parameters ....................................................................................... 22
4.1.2 Areal surface texture parameters ................................................................................. 22
4.2 Advanced characterization .................................................................................................... 24
4.2.1 Power spectral density .................................................................................................. 24
4.2.2 Scale-sensitive fractal analysis ...................................................................................... 25
X
4.2.3 Feature-based characterization .................................................................................... 26
5 RESEARCH METHODOLOGY .................................................................................. 29
5.1 Identification of Significant parameters ................................................................................ 29
5.1.1 For scale-limited surfaces using linear multiple regression .......................................... 29
5.1.2 For Multi-scale surfaces using area-scale analysis ........................................................ 30
6 RESULTS AND DISCUSSION ..................................................................................... 33
6.1 Paper 1 – Feature-based characterization of SLM surfaces .................................................. 34
6.2 Paper 2 – Area-scale analysis & significant parameters ........................................................ 36
6.3 Paper 3 – Significant parameters using the statistical method and PSD .............................. 40
6.4 Paper 4 – Significant parameters using statistical methods and S/N ratio ........................... 44
7 CONCLUSIONS AND FUTURE WORK .................................................................... 47
7.1 Conclusions ............................................................................................................................ 47
7.2 Future work ........................................................................................................................... 48
REFERENCES ....................................................................................................................... 49
1
1 INTRODUCTION
1.1 Background
Over the past decade, Additive Manufacturing (AM) has gained a lot of prominence for its
ability to produce parts without geometrical limitations. Its potential to fabricate parts by
deposition of materials layer by layer has re-defined manufacturing. A growing number of
companies are leveraging AM to their advantage due to its several sustainability advantages.
Customization, reduction of lead time, no assembly requirement, reduced wastages, lower
energy intensity, reduced manufacturing costs, and reduced time-to-market are some of the
benefits of this technique [1]. AM has been extensively used in automotive [2], aerospace [3],
medical [4] and dental applications [5] for its ability to fabricate intricate lightweight designs
and internal structures. The disruptive nature of AM has the potential to replace conventional
manufacturing but mainly used as functional prototypes in many applications. This is mainly
due to its inability to match the standards set by conventional manufacturing in terms of high-
quality, reliability, performance and repeatability [6]. This has limited its widespread use in
industries especially in critical applications, however, technological advancements in recent
years have begun to slowly push AM from the prototyping stage to more advanced production
of high-quality end products. Nonetheless, it is important to address the challenges of AM for
encouraging its commercialization and for the realization of its economic benefits. One of the
challenges of AM pertaining to surface quality is addressed in this thesis.
Typically, surface effects can cause up to 10% of failure rate in manufactured parts and with
AM it can be even higher [7]. With an ever-increasing demand for manufactured goods, it is of
great importance to have an efficient production system of high-quality products. Hence, it is
necessary to fully comprehend the nature of AM surfaces to understand their manufacturing
process in order to establish control over the quality and function of fabricated products. To
achieve this, surfaces should be measured using appropriate metrology techniques and the
captured surfaces must be characterized (requiring to describe typical characteristics or nature
of surfaces) using various qualitative and quantitative methods.
The most widely adopted approach in extracting surface information is through a parametric
description. AM surfaces consist of several features and to achieve a complete description of
the surface, several parameters are often required. However, it must be realized that relatively
large changes in some of these parameters may not affect the surface quality or functional
performance of the parts [8]. In other words, every manufacturing processes generates unique
surface features denoting the process signatures which largely affect the surface quality and
function. Therefore, it is necessary to identify and analyze these significant features to
understand the manufacturing process and to enable process optimization for improving the
surface quality and function of the parts.
In the literature, the identification of significant surface features representing the
manufacturing process signatures are often missed and a general description of the surface is
provided through the use of average roughness parameters. This usually leads to an inadequate
understanding of the manufacturing process and often hinders the correlation between the
surface and its function. Hence, this thesis aims to address these research gaps by providing
improved methods for the characterization of complex AM surfaces. This is accomplished by
employing advanced characterization methods to get a better understanding of AM surfaces. It
assists in analyzing the surface features at various scales or as a function of spatial frequency
which are useful in identifying the most significant AM surface features. Furthermore,
statistical approaches in combination with parametric characterization can be critical in
2
identifying the most important surface parameters which provide a quantitative description of
significant surface features.
1.2 Aim of the thesis
The overall aim of this thesis is to establish the most effective approach towards topography
characterization of Additive Manufactured surfaces to facilitate a better understanding of the
manufacturing process for enabling process control and optimization. This is done by
a. Employing advanced surface topography characterization techniques to identify the
unique surface features representing the manufacturing process signature.
b. Employing statistical methods to understand the relationship between surface texture
and manufacturing process control variables.
c. Developing a methodology that uses both statistical and advanced methods to identify
the significant parameters to discriminate between various surfaces and in turn,
understand how the manufacturing process can assist in process optimization and
control.
1.3 Research Questions
This thesis is based on the following three research questions.
1. How can the overall representation of AM surfaces be improved by using advanced
surface topography characterization techniques?
2. How can statistical-based quantitative approaches and advanced methods towards
surface characterization contribute to improving the understanding of AM and post-
processes?
3. How can the developed research methodology interpret the scale-limited and multi-
scale surfaces to enable process optimization?
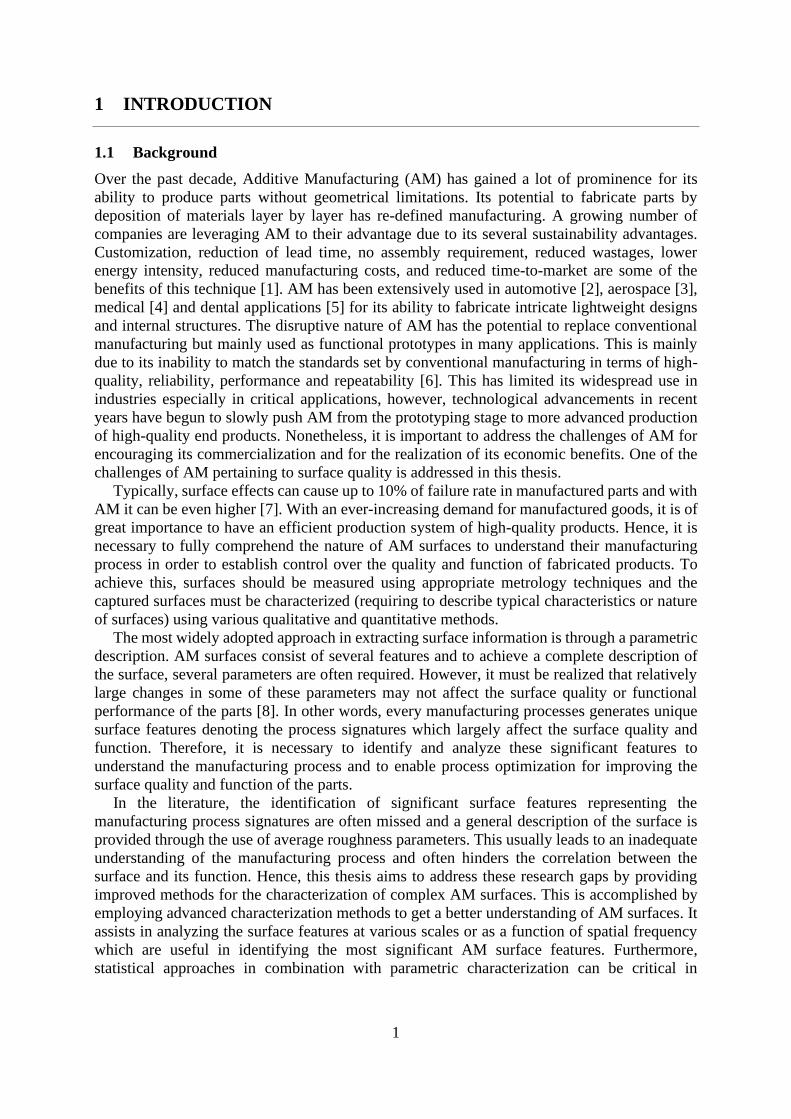
1.4 Approach
The research approach adopted in this thesis is based on the control loop system first presented
by Stout and Davis [8]. It comprises of three important facets namely manufacturing,
characterization and function linked together in a loop as shown in figure 1. In this thesis, the
primary focus is on the characterization, however, it can only be meaningful if it is associated
with the manufacturing process and component function. Every manufacturing process can be
interpreted by using topography characterization which in turn can be utilized to predict the
functional behavior of the component and by knowing the function it is possible to refine and
improve the efficiency of the manufacturing process.
Figure 1. Control loop depicting the interdependence of manufacturing, characterization and
function.
3
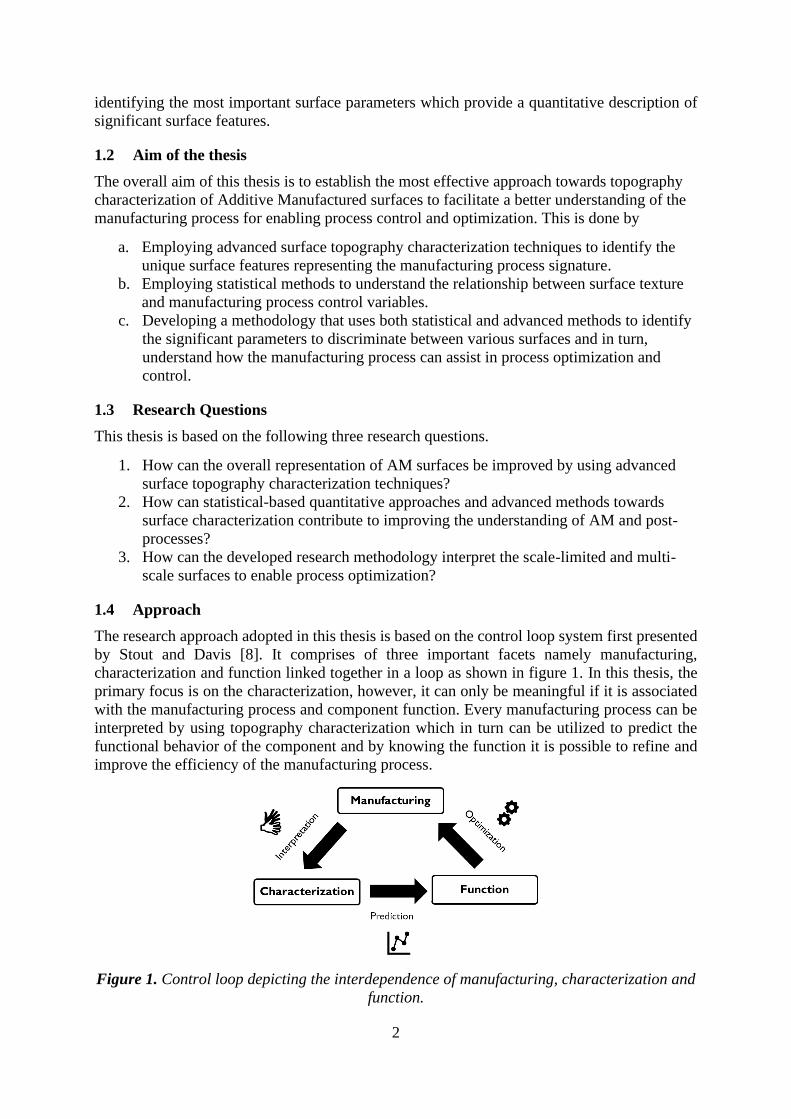
A detailed overview of the research approach based on the surface control loop is presented in
figure 2. In this research, the surfaces of Fused Deposition Modeling (FDM) and Laser-Based
Powder Bed Fusion of Metals (PBF-LB/M) produced by various AM process settings are
subjected to various post-processing methods with variable settings to enhance the surface
quality. Both the as-built and post-processed surfaces were captured using Stylus Profilometer,
Structured light projection and Confocal Fusion optical microscopy. These captured surfaces
were interpreted using advanced characterization techniques such as PSD, Scale-sensitive
fractal analysis (Area-scale analysis), Feature-based characterization and statistical methods. In
addition, a methodology was developed to identify the most critical parameters for
characterizing the scale-limited and multi-scale surfaces to exploit the most essential factors
affecting the functional behavior of the component. This established knowledge can be utilized
in process optimization and control by adjusting the AM and post-process variables to match
the functional and quality needs.
Figure 2. Research approach as per the control loop for the development of functional
surfaces of the AM process.
1.5 Delimitations
• This research is confined to only FDM and PBF-LB/M techniques for surface analysis.
Surface features differ significantly with change in AM technology and hence it will be
necessary to study other techniques to generalize the findings obtained from this study.
4
• Surface metrology is confined to tactile and optical measurements which fail to capture
the re-entrant features [9] of PBF based AM surfaces, because of this there may be some
loss of surface information. It is necessary to explore the extent of the impact this lost
surface information can cause.
• The research methodology is restricted to a linear statistical approach to study the
influence of AM process variables on surface texture and to predict its functional
behavior. The polynomial approach must be explored to determine if it can improve the
prediction of surface quality and function.
1.6 Thesis structure
Chapter 1 provides a brief introduction highlighting the background, aim, research approach
and limitations.
Chapter 2 presents an overview of Additive Manufacturing processes and post-processing
methods and including associated surface conditions.
Chapter 3 describes the state of the art in surface metrology for AM processes.
Chapter 4 includes topography characterization techniques used for AM surfaces.
Chapter 5 outlines the research methodology.
Chapter 6 illustrates the results of the appended papers.
Chapter 7 reports conclusions and future work.
5
2 ADDITIVE MANUFACTURING SYSTEMS
2.1 Introduction
Additive Manufacturing (AM) popularly known as 3D printing is a fabrication technique
involving the progressive deposition of material, layer by layer, leading to the creation of highly
complex parts [1]. As per ISO/ASTM 52900:2015 standard terminology, Additive
Manufacturing is described as the “process of joining materials to make parts from 3D model
data, usually layer upon layer, as opposed to subtractive manufacturing and formative
manufacturing methodologies” [10]. The unique technique of building parts layer by layer has
provided industries with numerous advantages, which is why AM is considered as the emerging
next-generation technology in part manufacture. Not until recently, did the patents on the
original pre-existing printers expire which led to the rapid growth in the AM industry [1].
Today, there are several types of AM technologies which are broadly classified into seven
categories.
• Powder bed fusion processes consist of a powder reservoir, platform, a thermal source and
a powder recoating system. The re-coater spreads a layer of the material powder on the
platform and the heat from the thermal source is utilized to melt and fuse the powders and
then the platform is lowered to distribute a new layer of powder and the process repeats
until the part is finished [11]. There are typically four types of powder fusion mechanisms,
solid-state sintering, chemically induced sintering, Liquid-phase sintering (LPS) and full
melting. The solid-state sintering involves fusion of the particles at elevated temperatures
without melting. The chemically induced sintering process initiates the bonding process due
to the thermally activated chemical reactions which create a by-product that fuses the
powders together. LPS is a partial melting process where only some portion of the powders
melt while others remain solid and the molten portions bind the other solid powders
together. The full melting process completely melts the powder particles into a liquid which
then undergoes a solidification process to build a part [1]. Furthermore, there are two types
of thermal source, Laser-based methods use a laser beam in an inert atmosphere for
producing metal, polymer, ceramics and composite materials. Electron beam uses electrons
in a vacuum environment, as a thermal source to produce parts. Hence, it cannot be used to
produce parts made of non-metallic materials such as polymers or ceramics. According to
the ISO/ASTM 52911:2019 standard, the laser-based methods are termed as Laser-based
Powder Bed Fusion of Polymers or Metals (PBF-LB/P or PBF-LB/M) and for an electron
beam, it is called as Electron beam Powder Bed Fusion of Metals (PBF-EB/M). However,
these technologies are known popularly by different names as given by AM technological
providers. Selective Laser Sintering (SLS) process builds parts usually made of non-
metallic materials [12]. Direct Metal Laser Sintering (DMLS) method works best with metal
alloys and Selective Laser Melting (SLM) is used to produce parts made of metals [1][13].
Electron Beam Melting (EBM) or Electron Beam Additive Manufacturing (EBAM) works
with metal and metal alloys and has higher productivity but limited materials compared to
the laser-based methods [14].
• Material extrusion is by far the most popular AM technology on the market. According to
the ISO/ASTM standards, extrusion refers to the process where the material is selectively
discharged through a nozzle by application of pressure [10]. There are two types of
extrusion-based AM processes, the most common one is the Fused Deposition Modeling
(FDM) or Fused Filament Fabrication (FFF) method which uses temperature as the
controlling mechanism for material flow [1][15][16][17]. The solid material is heated to its
melting temperature, and the molten material is extruded layer by layer to build the part.
6
The other approach is quite the opposite, which uses a chemical reaction to cause the
solidification process to build a component. For instance, Contour Crafting can be one such
method where the “wet” quick setting concrete-like material is extruded layer by layer and
it solidifies to build an object [18][19][20]. Another example is the 3D bio-printers which
extrudes layer by layer of biomaterials to build 3D functional living tissues and organs
[21][22][23].
• Vat photopolymerization is a process where liquid polymer or radiation-curable resin
undergoes a chemical change to solidify upon the incidence of Ultra-violet rays or visible
light portion of the electromagnetic spectrum [24]. The most common methods in this
category as named by different AM technological providers are Stereolithography (SLA)
[25] and Digital Light Processing (DLP) [26], it typically consists of a resin tank, build
platform and light source. The main difference between these methods is the source of
curing, the former uses Laser beam and the latter uses visible light from a projector.
Continuous Light Interface Production (CLIP) [27] and Solid Ground Curing (SGC) [28]
are recent advances in vat photopolymerization processes with the sole purpose to increase
the fabrication rate.
• Material jetting process operates similarly to the 2D inkjet printers. In this technique, a
printhead selectively sprays the photo-sensitive liquid material and UV light curing is
performed after each layer of dispensed material droplets, the process repeats layer by layer
thereby building an object [29].
• Binder Jetting comprises of several steps to build the part. Firstly, a recoating blade spreads
a thin layer of material in powder form on the build platform. Then the print head deposits
the binders (glue) selectively that bonds the powder particles together. After each layer, the
build platform is lowered, and a new layer of powder is distributed, and the process repeats
until the part is built. In the case of colored binder jetting, an additional step of coating the
powder with colored ink is included, similar to the desktop 2D printers, to get vibrant
colored end-products. Once the printing is complete, the part built is termed as a green part
since it will usually be very brittle and porous and hence, it requires an additional curing
step. Depending on the material, the curing step varies, typically for polymer products, the
build part is left in the chamber after printing for binders to fully combine the powders. For
metallic materials, the build part requires a sintering process or infiltration with low melting
point metals to strengthen the part [1][30].
• Sheet Lamination is the process of combining sheets/layers of solid material together and
using subtractive methods to shape it as per the required design. Laminated Object
Manufacturing (LOM) and Ultraviolet Additive Manufacturing (UAM) are two types of
process under this category. LAM is the process of laminating sheets of paper or plastic
layer by layer and each layer of material is cut as per the shape of the cross-sectional layer
of the designed CAD model and the cut layers are combined using adhesives to build an
object [31]. UAM is a hybrid manufacturing process which uses both additive and
subtractive methods to create a part. It combines sheets of metal foil using sonotrode and
CNC milling is performed to shape it as per the designed object. Sonotrode is a tool that
generates ultrasonic vibrations which are locally applied under pressure to metal foils to
weld them together [32].
• Directed Energy Deposition (DED) is the process of building parts by melting material as
it is being deposited [33]. The melting mechanism is similar to the conventional welding
techniques, a thermal source focuses its energy into a narrow region where the material is
supplied, simultaneously melting and depositing the material on a platform. There are wire-
based and powder-based DED systems and the two popular methods are Laser Engineered

7
Net Shaping (LENS) and Electron Beam Welding (EBW) as the name suggests, a high
powered laser beam or an the electron beam is used as a heating source to melt the material.
With the advent of Industry 4.0 and the Industrial Internet of Things (IIOT), the need for digital
production is unprecedented. Although the technology push for AM has been exponential with
the continuous development of new materials and processes, the procedure of part preparation
for fabrication has been constant with all the AM technologies. An object to be printed is
designed in the CAD modeling software and the 3D model is converted into STL (Standard
Triangle Language) file format. The STL file is then sent to the 3D printing software where a
slicing operation is performed, which converts the continuous geometry of the CAD model into
a series of discrete layers. The printer then uses this information to fabricate the model layer by
layer.
2.1.1 Additive Manufacturing as Sustainable Manufacturing
An increasing number of companies are embracing sustainable manufacturing due to its
substantial environmental and financial benefits. With an ever-increasing demand for
manufactured goods, the conservation of resources is very crucial in establishing long term
benefits. Sustainable manufacturing is defined as the creation of goods through optimized
processes that minimize the negative environmental impacts by conserving energy and natural
resources [34]. Although sustainable manufacturing is a complex problem, the advent of
Additive Manufacturing has made it easier for the industries to adopt sustainable business
approaches. AM has several sustainability advantages such as limited usage of materials with
minimum wastage during manufacturing; capable of producing intricate geometries and
lightweight components and require comparatively less energy during manufacturing; and
efficient inventory management since it is capable of producing parts on demand. This
technological advantage aligns well with the goals of the United Nations sustainable
development of responsible consumption and production [35], see figure 3. The overall
articulation of “AM as sustainable manufacturing of the future” [36] is very promising,
however, certain downsides of AM are limiting its widespread use in industries. The current
scope of this thesis is to tackle one of the many challenges of AM by addressing the gaps
concerning the surface quality. This thesis focuses on improving the understanding of the
manufacturing process and enabling process optimization to enhance the surface quality and
part function, thereby, helping the industries to implement AM into their supply chain.
Figure 3. Sustainable development goals by the United Nations [35].

8
In the following section, a detailed overview of AM technology utilized in this research is
presented along with a brief explanation of the generated surfaces with their respective
technology. The details of surface roughness mechanisms are provided to help readers visualize
the common surface quality-related issues with AM.
2.2 Laser-based Powder Bed Fusion of Metals (PBF-LB/M)
This technique is also termed as Powder Bed Fusion – Laser Beam Melting. It consists of a
laser source, laser beam focusing system, powder feed system and a control unit. The process
takes place inside a closed chamber with an inert atmosphere mainly to avoid oxidation during
the fabrication process. The metal powder is distributed over the build platform with the help
of a powder re-coater. The laser beam from the sources is directed on to the powder bed in X
and Y direction with the help of the high-frequency scanning mirror. The laser melts the powder
layer as predefined by the sliced CAD file. The build plate is then lowered after the fabrication
of one complete layer and then the powder is spread over this layer with the surrounding powder
particles serving as support for subsequent layers. This continues until the part is completely
built. Figure 4 displays the main components of PBF-LB/M system.
Figure 4. Illustration of Laser-based powder bed fusion of Metals (PBF-LB/M) process.
The input parameters influencing the part quality are powder particle size, material composition
and properties, laser beam spot size, energy deposition, scan speed, atmosphere, material
homogeneity, linear track separation, vertical step height, powder reuse, part geometry,
scanning strategy and errors caused due to motion & energy deposition [37]. As mentioned by
J S Taylor [38], characterizing the surface morphology helps to enhance manufacturing process
control and attain stability in the essential physical processes. The input parameters induce the
following physical processes such as conduction heat transfer, phase changes, radiation heat
transfer, denuding effect, balling effect, spatter, melt pool size, pore formation, Rayleigh
instability, Marangoni circulation, the evolution of grain structure, thermal expansion &
shrinkage, spatial variation in temperature (heat sinks), ‘stair-step effect’, raster pattern and
residual stress [37][38]. The surface morphology of PBF-LB/M is a result of the above-
mentioned input parameters and corresponding physical processes.
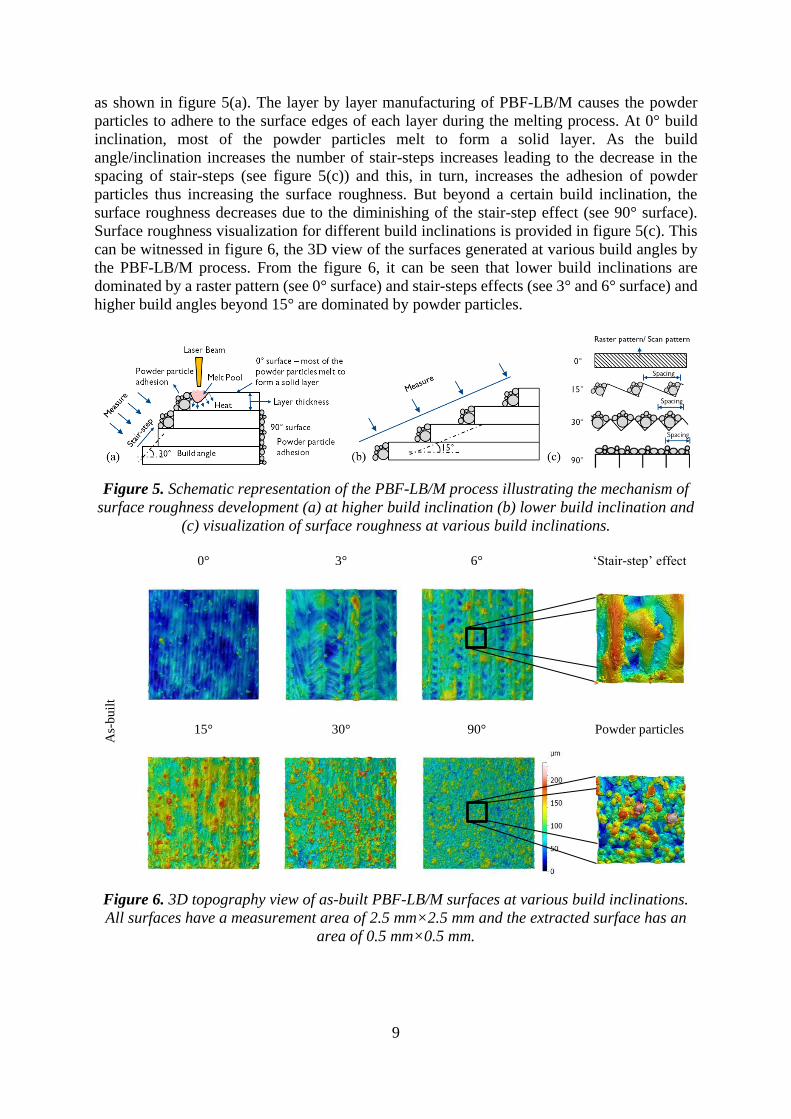
Figure 5 shows the working principle of the PBF-LB/M technique with illustrations
depicting the main contributing factor towards the development of surface roughness. In AM,
the object is built in layers causing the slopes of the object to have a “stair-step” like structures
9
as shown in figure 5(a). The layer by layer manufacturing of PBF-LB/M causes the powder
particles to adhere to the surface edges of each layer during the melting process. At 0° build
inclination, most of the powder particles melt to form a solid layer. As the build
angle/inclination increases the number of stair-steps increases leading to the decrease in the
spacing of stair-steps (see figure 5(c)) and this, in turn, increases the adhesion of powder
particles thus increasing the surface roughness. But beyond a certain build inclination, the
surface roughness decreases due to the diminishing of the stair-step effect (see 90° surface).
Surface roughness visualization for different build inclinations is provided in figure 5(c). This
can be witnessed in figure 6, the 3D view of the surfaces generated at various build angles by
the PBF-LB/M process. From the figure 6, it can be seen that lower build inclinations are
dominated by a raster pattern (see 0° surface) and stair-steps effects (see 3° and 6° surface) and
higher build angles beyond 15° are dominated by powder particles.
Figure 5. Schematic representation of the PBF-LB/M process illustrating the mechanism of
surface roughness development (a) at higher build inclination (b) lower build inclination and
(c) visualization of surface roughness at various build inclinations.
As-
bu
ilt
0°
3°
6°
ʻStair-step’ effect
15°
30°
90°
Powder particles
Figure 6. 3D topography view of as-built PBF-LB/M surfaces at various build inclinations.
All surfaces have a measurement area of 2.5 mm×2.5 mm and the extracted surface has an
area of 0.5 mm×0.5 mm.
µm
0
50
100
150
200
µm
0
50
100
150
200

10
2.3 Fused Deposition Modeling
Fused Deposition Modeling (FDM) is a widely used extrusion-based AM process. Figure 7
shows an illustration of the FDM process. The material in the form of a wire from the filament
spool is fed into the extruder by a step motor. The motor is fitted with a gear which pulls or
pushes the material with the help of support bearing into the hotend. The material melts in the
hotend and the molten material is extruded from the nozzle which is then deposited layer by
layer on the platform to build an object. The whole extruder head is mounted on a fixture which
provides the movement during printing [1].
In FDM, the part quality can be affected by various factors such as layer thickness, print
temperature, print speed, infill settings, number of top layers and material properties. Apart
from these, the geometry of the build part that is its build inclination (slopes) can have a large
effect on surface quality. Much research has shown that the most dominating factor influencing
the surface roughness is layer thickness and build inclination [39][40]. The development of
surface roughness is similar to PBF-LB/M surfaces, FDM also has stair-step and raster pattern
on its surface but is devoid of powder particles [41], see figure 8.
Figure 7. Illustration of the FDM process
Figure 8. The 3D view of surface topography of the as-built FDM sample with varying build
inclinations to show the stair-step effect. All surfaces have a measurement area of 2.5
mm×2.5 mm.

11
2.4 Post-processing
The principle of building components layer by layer makes it inevitable to eliminate features
such as stair-step and raster patterns in AM surfaces. Although the effects of these features on
surface roughness can be reduced by adjusting various print settings, the finish still cannot
match the industrial standards in some cases. It is, therefore, necessary to use a subsequent post-
processing step to finish the products. Although post-processing methods imparts high surface
quality to the products, it increases the lead time and cost involved in manufacturing the end-
product. However, this can be compensated by implementing Topology Optimization, i.e.
performing design changes to reduce the material consumption and printing time without
hindering the functionality of the component [42]. In this work, three post-processing methods
are reviewed to find the best finishing process that can represent AM surfaces close to the
conventional methods.
2.4.1 Shot-blasting
Shot blasting is a process of modifying the surface features by propelling a jet of abrasive
particles at high pressure with the help of compressed air. The size and shape of the abrasive
media, and the duration of blasting highly influence the surface roughness. Previous research
has shown the effects of abrasive flow machining [43], abrasive jet deburring [44], and abrasive
finishing of internal channels [45][46] on surface finish.
In this study, the surfaces generated by FDM and PBF-LB/M at various build inclinations
were blasted to smoothen the surface and possibly produce surfaces close to the conventional
manufacturing methods. Generally, sandblasting media is used for producing rough finish and
glass beads for producing finer finish on the surfaces. This is because sand grains contain
irregular shape and sharp features which when impacted on the surface creates an abrasive
action damaging the surface, whereas, the glass beads appear comparatively smoother and
rounder in shape which smoothens the sharp peaks and seals the pores on the surface upon
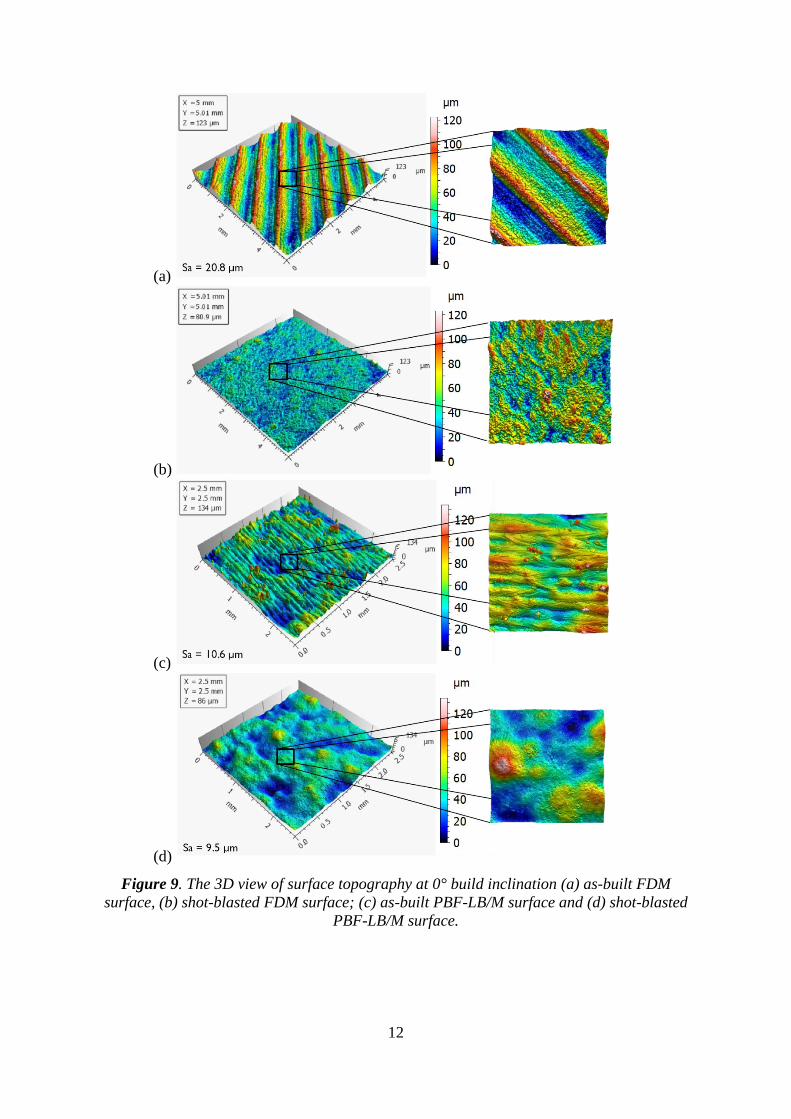
impact [47]. Figure 9 represents the surfaces produced by shot blasting of FDM and PBF-LB/M
surfaces, also, as-built surfaces produced by the respective AM techniques are provided for
comparison. It is evident from figure 9 that the raster pattern as seen on the topography of the
as-built surfaces in both FDM and PBF-LB/M techniques are removed due to the abrasive
action of the shot-blasting process.
12
(a)
(b)
(c)
(d)
Figure 9. The 3D view of surface topography at 0° build inclination (a) as-built FDM
surface, (b) shot-blasted FDM surface; (c) as-built PBF-LB/M surface and (d) shot-blasted
PBF-LB/M surface.
13
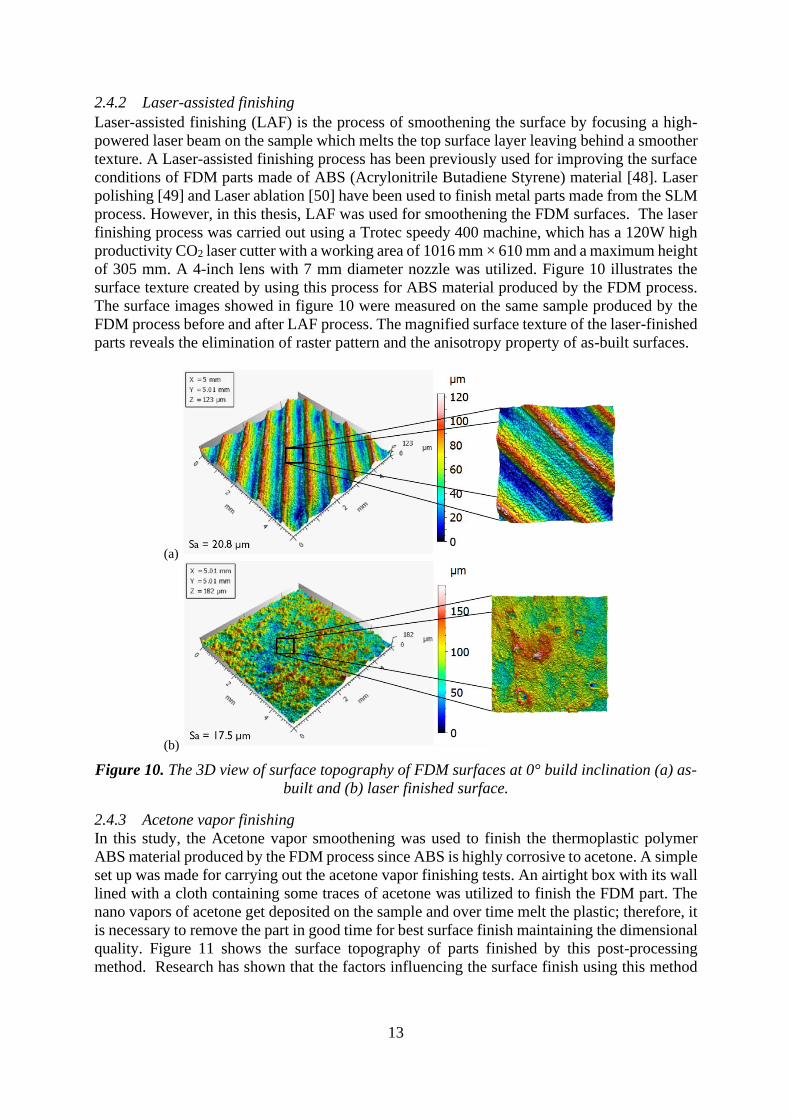
2.4.2 Laser-assisted finishing
Laser-assisted finishing (LAF) is the process of smoothening the surface by focusing a high-
powered laser beam on the sample which melts the top surface layer leaving behind a smoother
texture. A Laser-assisted finishing process has been previously used for improving the surface
conditions of FDM parts made of ABS (Acrylonitrile Butadiene Styrene) material [48]. Laser
polishing [49] and Laser ablation [50] have been used to finish metal parts made from the SLM
process. However, in this thesis, LAF was used for smoothening the FDM surfaces. The laser
finishing process was carried out using a Trotec speedy 400 machine, which has a 120W high
productivity CO2 laser cutter with a working area of 1016 mm × 610 mm and a maximum height
of 305 mm. A 4-inch lens with 7 mm diameter nozzle was utilized. Figure 10 illustrates the
surface texture created by using this process for ABS material produced by the FDM process.
The surface images showed in figure 10 were measured on the same sample produced by the
FDM process before and after LAF process. The magnified surface texture of the laser-finished
parts reveals the elimination of raster pattern and the anisotropy property of as-built surfaces.
(a)
(b)
Figure 10. The 3D view of surface topography of FDM surfaces at 0° build inclination (a) as-
built and (b) laser finished surface.
2.4.3 Acetone vapor finishing
In this study, the Acetone vapor smoothening was used to finish the thermoplastic polymer
ABS material produced by the FDM process since ABS is highly corrosive to acetone. A simple
set up was made for carrying out the acetone vapor finishing tests. An airtight box with its wall
lined with a cloth containing some traces of acetone was utilized to finish the FDM part. The
nano vapors of acetone get deposited on the sample and over time melt the plastic; therefore, it
is necessary to remove the part in good time for best surface finish maintaining the dimensional
quality. Figure 11 shows the surface topography of parts finished by this post-processing
method. Research has shown that the factors influencing the surface finish using this method

14
are the acetone exposure time and the number of smoothening cycles. The former has a more
significant effect than the latter on surface roughness [51].
The reaction of acetone with ABS material does not result in a chemical change in ABS
thermoplastic, however, it can significantly change the geometrical shape of the ABS material.
The layer by layer deposition of material during the FDM process creates the gap between the
layers which is termed as ridges, as shown in figure 11a. Acetone reacts with ABS to form a
molten thermoplastic slurry on the top layer. The semi-molten plastic then flows into the ridges
creating a smooth and glossy finish (see figure 11b) [51]. Depending on the geometry of the
part that has to be finished, the exposure time can vary.
(a)
(b)
Figure 11. The 3D view of surface topography of FDM surfaces at 0° build inclination (a) as-
built and (b) Acetone-vapour finished surface.
15
3 SURFACE METROLOGY
There is an increasing interest from manufacturing industries to gain control over the surface
characteristics of their produced products since most of the component failures are surface-
initiated [7]. Every manufacturing processes generates surfaces containing unique textures
which sometimes can affect the ability of the product to perform its intended function [52]. It
is therefore of high importance to study the surface texture for establishing control over the
function and quality of the product. The studying of surfaces establishes an understanding of
the effects of various manufacturing process variables on surface texture, which can then be
utilized to engineer the surface to maximize the function and reduce failures. For this purpose,
it is first necessary to capture the surface topography using an appropriate measurement
technique to retrieve complete surface information. The established surface information can
then be characterized both qualitatively and quantitatively to enable process optimization for
achieving the best results.
Surface metrology is defined as the measurement of the complete geometric information
about the surface shape and other irregularities caused by the manufacturing process [37]. In
other words, it is defined as the measurement of the deviations of a workpiece from its intended
shape and surface texture. The shape is referred to as form, which includes roundness, flatness,
cylindricity and straightness [53]. Surface texture refers to the geometrical irregularities left
behind by the manufacturing process [54]. With the advance of manufacturing technologies,
surface metrology is increasingly facing challenges to characterize the surface features and the
demand for new advanced analysis of surface features has increased to support innovation in
the manufacturing industry. As a response to these demands, the International Organization of
Standardization (ISO) published a standard, ISO 25178-6:2010 [55] which provides the
classification of methods for measuring surface texture. As per the standard, there are three
basic measurement techniques, line-profiling, Areal-topography and Areal integrating methods.
Line-profiling method is a technique of measuring the surface profile. It is achieved by
measuring the geometrical deviations along the line scanned across the surface and can be
mathematically represented as a height function with lateral displacement, z(x) [56]. Examples
of this techniques are contact stylus scanning [57], phase-shifting interferometry [58], circular
interferometric profiler [59] (Measurement performed on circular profiles, mathematically
represented as a height function with angular displacement, z(θ)) and optical differential
profiling [60].
Areal-topography method provides the surface information by generating the topographic
image, mathematically given by z(x,y) as a function of height with lateral displacements in x
and y direction [55][56]. It can also be termed as topographic data obtained by combining a
series of parallel profiles (z(x) as a function of y). Examples of this method include confocal
microscopy [61], coherence scanning interferometry [61], structured light projection, focus
variation microscopy [62], digital holography microscopy, angle-resolved SEM, SEM
stereoscopy [63], scanning tunneling microscopy, atomic force microscopy [64], optical
differential profiler, point autofocus profiling.
Areal integrating methods provide numerical results dependent on area-integrated properties
of surface topography [55]. Examples of this method are total integrated light scatter [65],
angle-resolved light scatter [66], parallel-plate capacitance [67] and pneumatic flow
measurement [68].
A brief explanation of some of the optical surface measurement instruments is provided
elsewhere [7]. In the following section, an overview of different surface measurement
techniques used in the study is presented.

16
3.1 Stylus Profilometer
The nominal characteristics of contact stylus instruments are defined in the ISO 25178-601
standard. It defines the stylus profilometer as a surface profile measurement system consisting
of a probe with a contacting stylus whose motion is transformed into a signal as a function of
position [69]. The stylus used in this instrument traverses a predefined distance over the surface
and the vertical displacements caused by the irregularities on the surface are detected by the
transducer which converts the signal into height data. The lateral movement of the worktable
allows it to capture areal surface topography information by measuring a series of parallel
profiles. The shape and radius of the curvature of the stylus tip along with sampling intervals
determine the resolution of the profile. Typically, stylus tips are made of diamond material and
have a radius of curvature ranging from 0.5 to 50 µm. Figure 12 shows a sketch of a stylus
profilometer. The contact type measurement often causes deformations on the surface due to
the contact of its hard stylus tip on the surface and repeated measurements over the same
location are not recommended. Depending on the nature of surfaces under investigation, the
deformation can be significant [70]. The measurement speed and load on the stylus tip may also
contribute towards surface deformations and measurement errors. In this study, the stylus
profilometer is utilized for measuring the surface profiles of Fused Deposition Modeling (FDM)
samples. The highly anisotropic nature of FDM surfaces allows the captured individual profiles
to be representative of the whole surface topography for analysis, as the profiles are measured
perpendicular to the lay.
Figure 12. Illustration of a Stylus Profilometer
3.2 Structured light projection
Structured light projection, also known as Fringe projection (FP) is a “surface topography
measurement technique whereby a light image with a known structure or pattern is projected
on a surface and the pattern of reflected light together with knowledge of the incident structured
light can determine the surface topography” [55]. This technique is termed as triangulation
when the structured light is a single focused spot or fine line. Figure 13 displays the principle
of this technique. It consists of a light source and camera to capture the images. A series of
known patterns or fringes of light is projected onto the surface and a camera views the object
under investigation from different perspectives. The surface features of the sample distort the
projected pattern. The information obtained from the distorted light pattern along with the
original incident light pattern can be used to reconstruct the surface topography data. Although
this technique can be used to measure surfaces of a variety of materials, it struggles to capture

17
the data on reflective or transparent surfaces. In such cases, surface coating or using a replica
can be recommended to capture the surface topography information.
Figure 13. Illustration of structured light projection technique
3.3 Confocal microscopy
Confocal microscopy is one of the widely used optical techniques for measurement of surface
topography. As the name suggests it has both the illumination and detector light paths on a
common focal point [71]. The ISO 25178-602 provides the nominal characteristics of non-
contact confocal chromatic probe instruments [72].
Figure 14. Working principle of confocal microscopy
The basic principle of confocal microscopy is presented in figure 14. It consists of two
identically structured patterns in the form of pinholes, where one is placed near the light source
and the other near the photo-detector. The light from the source passes through the pinhole
18
creating a structured illumination which is directed towards the dichromatic mirror onto the
objective and the sample. The dichromatic mirror acts as a filter to remove certain wavelengths
of light and allowing the remainder to pass through. Therefore, the reflected illumination from
the sample passes through the dichromatic mirror and reaches the detector pinhole (confocal
aperture) which permits only the focused light to fall onto the photo-detector and rejects the out
of focus light. This makes it possible to produce optically sectioned images of the sample under
investigation. A vertical scanning system is provided to move the objective to capture a series
of optically sectioned images for analyzing different height regions of the sample. The images
are captured by point by point illumination onto the surface. An optically sectioned image
displays bright grey pixel levels for surface features that are in focus and dark for the rest of the
regions that lie out of focus. This pixel intensity map from various optically sectioned images
can then be used to reconstruct the 3D surface topography of the sample under inspection [7].
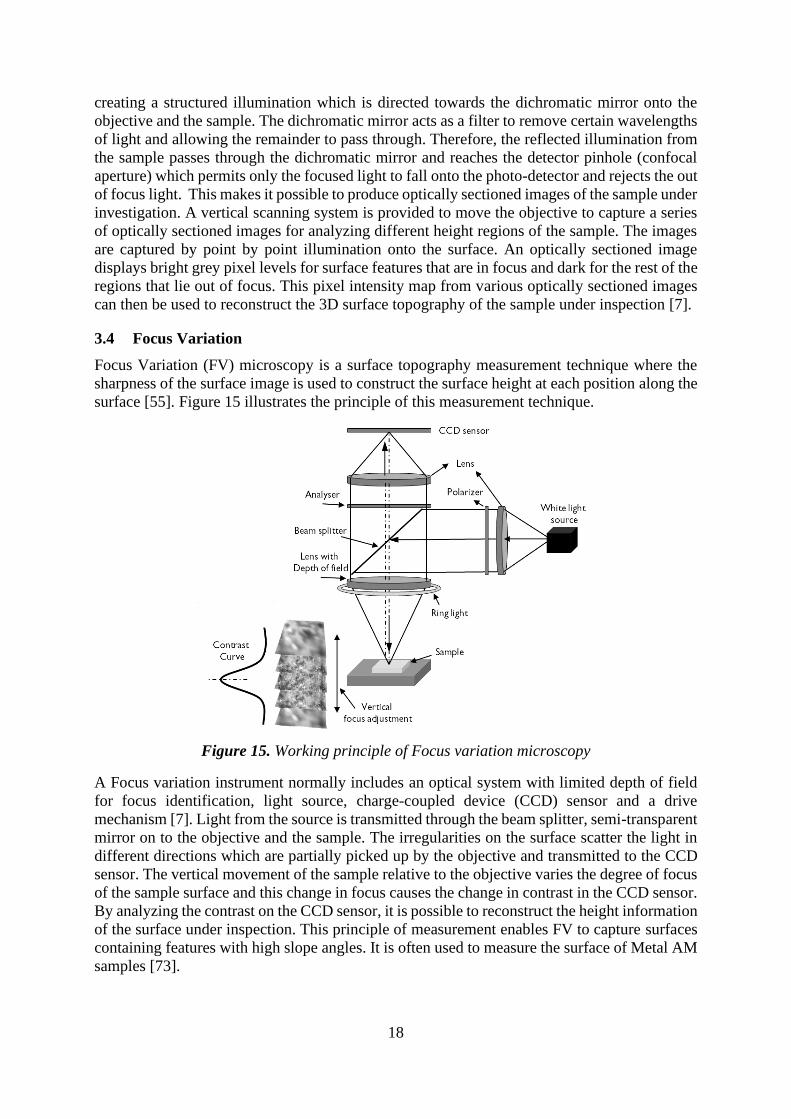
3.4 Focus Variation
Focus Variation (FV) microscopy is a surface topography measurement technique where the
sharpness of the surface image is used to construct the surface height at each position along the
surface [55]. Figure 15 illustrates the principle of this measurement technique.
Figure 15. Working principle of Focus variation microscopy
A Focus variation instrument normally includes an optical system with limited depth of field
for focus identification, light source, charge-coupled device (CCD) sensor and a drive
mechanism [7]. Light from the source is transmitted through the beam splitter, semi-transparent
mirror on to the objective and the sample. The irregularities on the surface scatter the light in
different directions which are partially picked up by the objective and transmitted to the CCD
sensor. The vertical movement of the sample relative to the objective varies the degree of focus
of the sample surface and this change in focus causes the change in contrast in the CCD sensor.
By analyzing the contrast on the CCD sensor, it is possible to reconstruct the height information
of the surface under inspection. This principle of measurement enables FV to capture surfaces
containing features with high slope angles. It is often used to measure the surface of Metal AM
samples [73].

19
3.5 Confocal fusion
The measurement mode Confocal Fusion [74] is a combination of Imaging Confocal
Microscopy and Focus Variation and is suitable to use with surfaces containing smooth parts
as well as rougher parts with steep angles [74][75][76]. The surface topography of PBF-LB/M
samples used in paper 2 was captured using this technology. The disadvantages of Focus
variation and Confocal microscopy are avoided by this combined technique. As with all the
individual "line of sight" instruments mentioned above (stylus profilometer, structured light
projection, focus variation and confocal microscopy), confocal fusion technique also cannot
capture the re-entrant features [9] present on the PBF-LB/M samples. Nonetheless, the captured
surface was deemed enough for characterization.

20
21
4 TOPOGRAPHY CHARACTERIZATION METHODS
Surface measurement instruments provide the topography information that can be directly used
for qualitative characterization and often a comprehensive quantitative method is required to
fully understand the surface behavior. Before the surface analysis, it is important to process and
refine the captured surface images so that they are suitable for characterization. Typically, the
measured surfaces consist of geometrical information about surface shape and surface texture
caused by its manufacturing process. Often, the surface shape is referred to as form and
waviness; and surface texture is understood as roughness features of the surface topography.
According to ISO 25178-2 [77], the primary surface is derived from the raw surface data after
applying an S-filter which removes all the small-scale lateral components. S-F surface refers to
the surface that is obtained from the primary surface after the application of F-operator to
remove the form. S-L surface refers to the surface that is derived from S-F surface by removing
the large-scale components using L-filter. The S-L surface is termed as roughness or surface
texture and the residual surface after the application of L-filter on S-F surface is termed as
waviness surface.
The difference between the form, waviness and roughness surface features is based on the
surface wavelength [52]. The long-wavelength or low-frequency component on the surface
topography is referred to as form. The occurrence of the form may be due to the geometrical
shape of the sample being measured, it can be planar form due to tilt errors or rotary form when
measured on cylindrical, cone or spherical samples. Waviness components on the surface
topography usually have wavelength comparatively shorter than that of form. Waviness may
occur due to disruptions such as vibrations, thermal effects during manufacturing or in some
cases it may be due to the nature of the manufacturing process itself. For instance, during AM,
the process of layer by layer manufacturing creates the effect of stair-steps on the surface which
is considered as waviness. Once the form and waviness are removed the remaining geometrical
irregularities on the surface topography are termed as roughness or surface texture. The
separation of roughness and waviness is arbitrary, based on the nature of manufacturing
processes or from the intended function of the sample, so an appropriate filter must be applied
[52].
All the image processing operations on the captured surface topography were performed
using MountainsMap, a 3D imaging and analysis software tool from Digital Surf [78]. The raw
surface measurement data was pre-processed to remove the aberrations or any abnormality
before the analysis. The form was removed by various algorithms such as levelling line by line,
by least-squares method, levelling by partition and using a polynomial approximation to remove
any shape from the surface topography. Based on the nature of the surface under inspection,
suitable form removal operation can be employed. Once the form is removed, the waviness and
measurement noise can be filtered from the roughness profile or surface by employing various
filters such as Gaussian filter, spline filter, morphological filter, motif method, wavelet
transform and spatial filters [79]. A brief explanation can be found in [80]. The quality of
separation of roughness and waviness features of the surface depends on the type of filter and
the nesting index value. The nesting index is the separation criteria based on wavelength
threshold of the surface [79]. In addition, the surface captured by the optical microscope may
not always have all the measured data points within its field of view due to the reflectivity or
transparency issues of the sample. This can be handled in the software, where the non-measured
points can be filled in by calculating the neighboring data points or filling it by a certain constant
value. Once the surfaces are processed as required, it can then be subjected to various
characterization techniques.
22
4.1 Parametric characterization
4.1.1 Profile roughness parameters
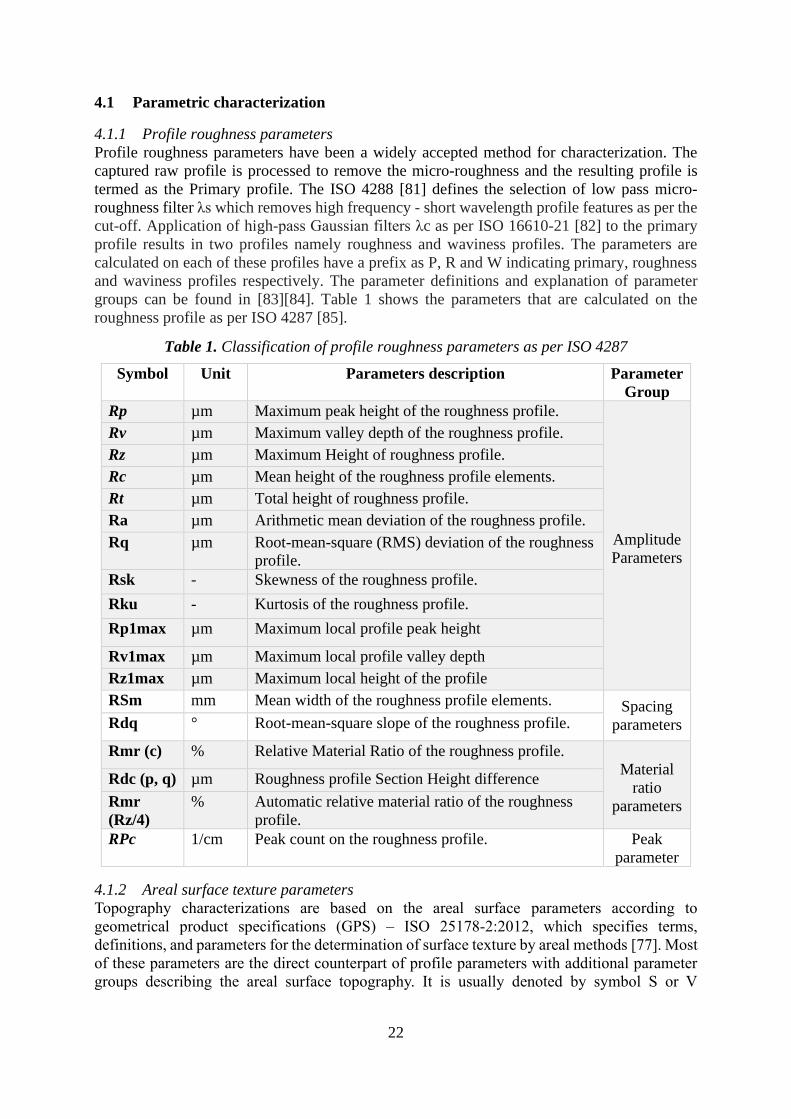
Profile roughness parameters have been a widely accepted method for characterization. The
captured raw profile is processed to remove the micro-roughness and the resulting profile is
termed as the Primary profile. The ISO 4288 [81] defines the selection of low pass micro-
roughness filter λs which removes high frequency - short wavelength profile features as per the
cut-off. Application of high-pass Gaussian filters λc as per ISO 16610-21 [82] to the primary
profile results in two profiles namely roughness and waviness profiles. The parameters are
calculated on each of these profiles have a prefix as P, R and W indicating primary, roughness
and waviness profiles respectively. The parameter definitions and explanation of parameter
groups can be found in [83][84]. Table 1 shows the parameters that are calculated on the
roughness profile as per ISO 4287 [85].
Table 1. Classification of profile roughness parameters as per ISO 4287
Symbol Unit Parameters description Parameter
Group
Rp µm Maximum peak height of the roughness profile.
Amplitude
Parameters
Rv µm Maximum valley depth of the roughness profile.
Rz µm Maximum Height of roughness profile.
Rc µm Mean height of the roughness profile elements.
Rt µm Total height of roughness profile.
Ra µm Arithmetic mean deviation of the roughness profile.
Rq µm Root-mean-square (RMS) deviation of the roughness
profile.
Rsk - Skewness of the roughness profile.
Rku - Kurtosis of the roughness profile.
Rp1max µm Maximum local profile peak height
Rv1max µm Maximum local profile valley depth
Rz1max µm Maximum local height of the profile
RSm mm Mean width of the roughness profile elements.
Spacing
parameters Rdq ° Root-mean-square slope of the roughness profile.
Rmr (c) % Relative Material Ratio of the roughness profile.
Material
ratio
parameters
Rdc (p, q) µm Roughness profile Section Height difference
Rmr
(Rz/4)
% Automatic relative material ratio of the roughness
profile.
RPc 1/cm Peak count on the roughness profile. Peak
parameter
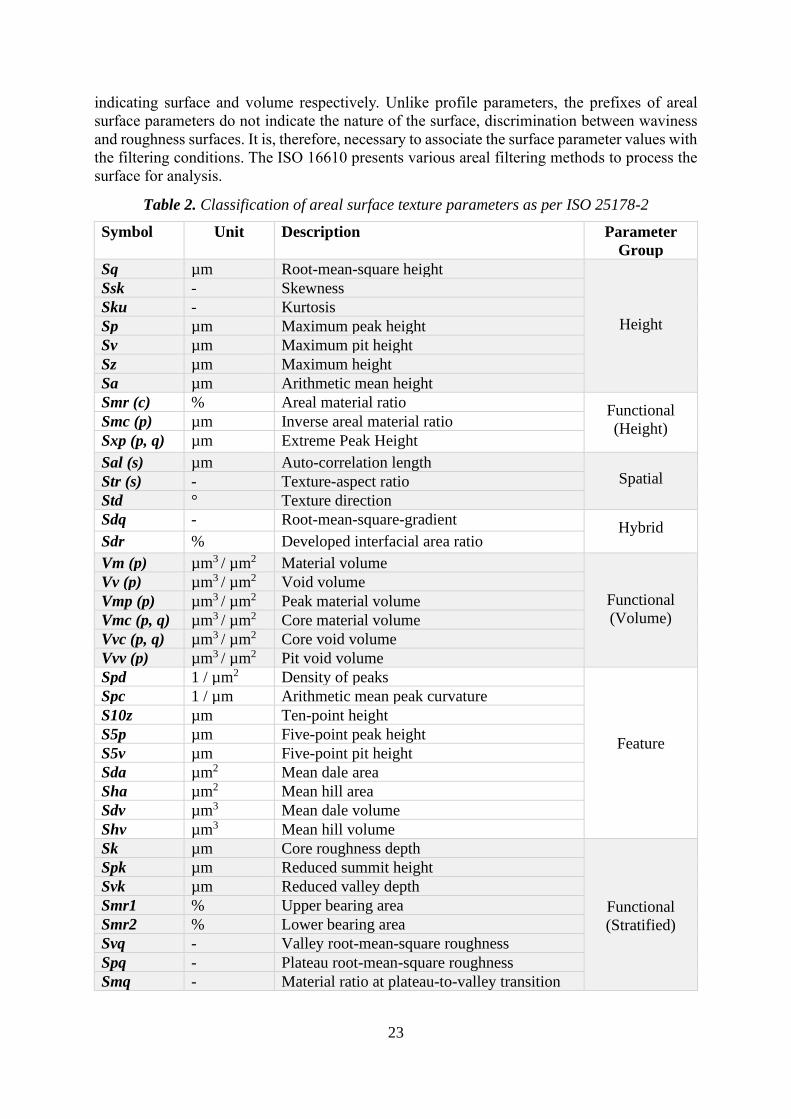
4.1.2 Areal surface texture parameters
Topography characterizations are based on the areal surface parameters according to
geometrical product specifications (GPS) – ISO 25178-2:2012, which specifies terms,
definitions, and parameters for the determination of surface texture by areal methods [77]. Most
of these parameters are the direct counterpart of profile parameters with additional parameter
groups describing the areal surface topography. It is usually denoted by symbol S or V
23
indicating surface and volume respectively. Unlike profile parameters, the prefixes of areal
surface parameters do not indicate the nature of the surface, discrimination between waviness
and roughness surfaces. It is, therefore, necessary to associate the surface parameter values with
the filtering conditions. The ISO 16610 presents various areal filtering methods to process the
surface for analysis.
Table 2. Classification of areal surface texture parameters as per ISO 25178-2
Symbol Unit Description Parameter
Group
Sq µm Root-mean-square height
Height
Ssk - Skewness
Sku - Kurtosis
Sp µm Maximum peak height
Sv µm Maximum pit height
Sz µm Maximum height
Sa µm Arithmetic mean height
Smr (c) % Areal material ratio Functional
(Height) Smc (p) µm Inverse areal material ratio
Sxp (p, q) µm Extreme Peak Height
Sal (s) µm Auto-correlation length Spatial Str (s) - Texture-aspect ratio
Std ° Texture direction
Sdq - Root-mean-square-gradient Hybrid
Sdr % Developed interfacial area ratio
Vm (p) µm3 / µm2 Material volume
Functional
(Volume)
Vv (p) µm3 / µm2 Void volume
Vmp (p) µm3 / µm2 Peak material volume
Vmc (p, q) µm3 / µm2 Core material volume
Vvc (p, q) µm3 / µm2 Core void volume
Vvv (p) µm3 / µm2 Pit void volume
Spd 1 / µm2 Density of peaks
Feature
Spc 1 / µm Arithmetic mean peak curvature
S10z µm Ten-point height
S5p µm Five-point peak height
S5v µm Five-point pit height
Sda µm2 Mean dale area
Sha µm2 Mean hill area
Sdv µm3 Mean dale volume
Shv µm3 Mean hill volume
Sk µm Core roughness depth
Functional
(Stratified)
Spk µm Reduced summit height
Svk µm Reduced valley depth
Smr1 % Upper bearing area
Smr2 % Lower bearing area
Svq - Valley root-mean-square roughness
Spq - Plateau root-mean-square roughness
Smq - Material ratio at plateau-to-valley transition
24
Table 2 shows the list of areal surface texture parameters which are broadly classified into 7
groups.
Height parameters are groups of parameters that describe the surface features in the z-direction
perpendicular to the surface. There are several parameters within this group each describing
different aspects of the surface height. Average roughness parameters provide the overall
measure of surface texture and can be used to differentiate various manufactured surfaces;
skewness and kurtosis provide the shape of the surface topography height distribution and
sharpness of the surface features respectively. Other parameters explain different amplitude
features such as peaks and valleys.[56]
Spatial parameters are used to provide the characteristics of surface texture using spectral
analysis. These parameters provide lateral information on the surface under inspection. Auto-
correlation length (Sal) provides the measure of length along the surface such that the new
location has a minimum correlation to the original location. Texture aspect ratio (Str) provides
the measure of isotropy or directionality of the surface and Standard texture direction (Std) can
be used to find the orientation of the dominant texture on the surface topography.[56]
Hybrid parameters are used to characterize the features that depend on both the amplitude
and the spacing. These parameters provide information on surface intricacy, which can be used
to discriminate between surfaces having similar average roughness.
Feature parameters are used to quantify the specific characteristics of the surface
topography. The significant features on the surface topography are segmented and identified by
a discrimination method known as pruning [56].
Functional parameters are a set of parameters used to characterize the functional aspects of
the surface topography such as lubrication, wear and grinding. There are two classes of
functional parameters, height and volume parameters usually provide the amount of material or
void between predefined thresholds. They are calculated from the Abbott-Firestone curve
(material ratio curve) which is the graphical representation of the cumulative distribution of
surface amplitudes as a percentage of material [84][86]. Stratified parameters are used to
describe the surfaces containing two or more types of textures imposed at different depths
usually formed due to processing with different manufacturing methods. The surface may have
several functional behaviors which can be quantified using parameters of this group [87].
4.2 Advanced characterization
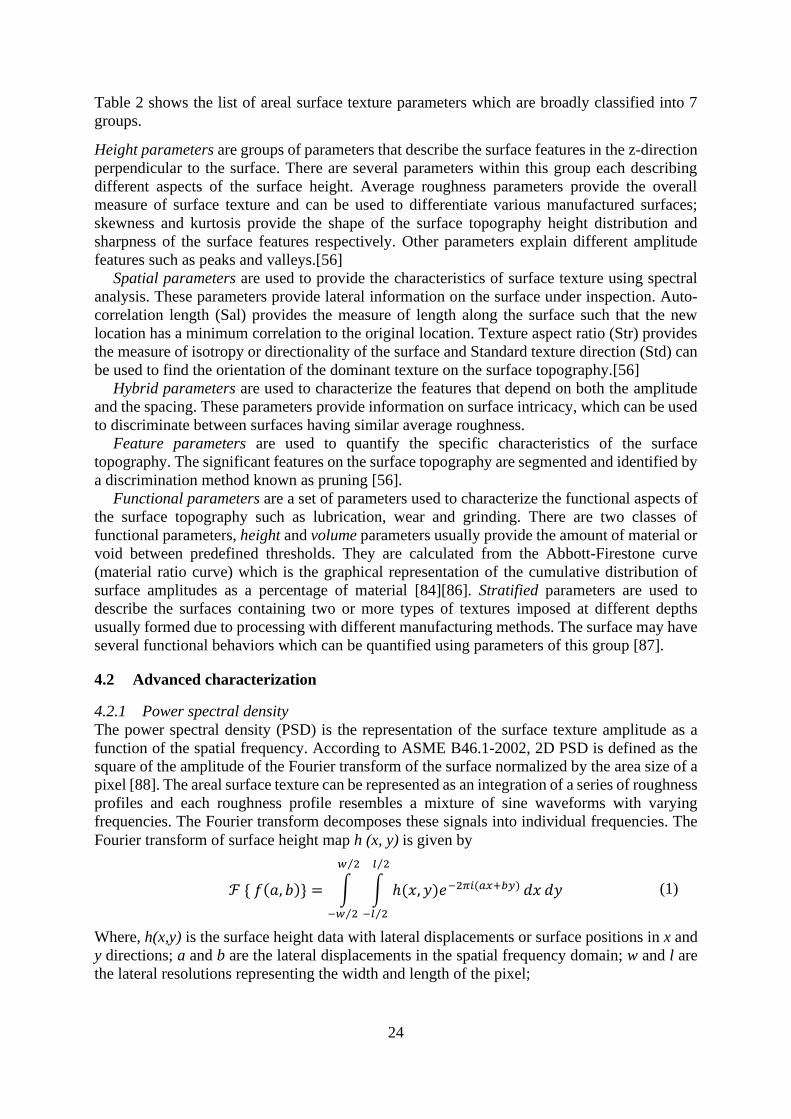
4.2.1 Power spectral density
The power spectral density (PSD) is the representation of the surface texture amplitude as a
function of the spatial frequency. According to ASME B46.1-2002, 2D PSD is defined as the
square of the amplitude of the Fourier transform of the surface normalized by the area size of a
pixel [88]. The areal surface texture can be represented as an integration of a series of roughness
profiles and each roughness profile resembles a mixture of sine waveforms with varying
frequencies. The Fourier transform decomposes these signals into individual frequencies. The
Fourier transform of surface height map h (x, y) is given by
ℱ { 𝑓(𝑎, 𝑏)} = ∫ ∫ ℎ(𝑥, 𝑦)𝑒−2𝜋𝑖(𝑎𝑥+𝑏𝑦)
𝑙 2⁄
−𝑙 2⁄
𝑤 2⁄
−𝑤 2⁄
𝑑𝑥 𝑑𝑦 (1)
Where, h(x,y) is the surface height data with lateral displacements or surface positions in x and
y directions; a and b are the lateral displacements in the spatial frequency domain; w and l are
the lateral resolutions representing the width and length of the pixel;
25
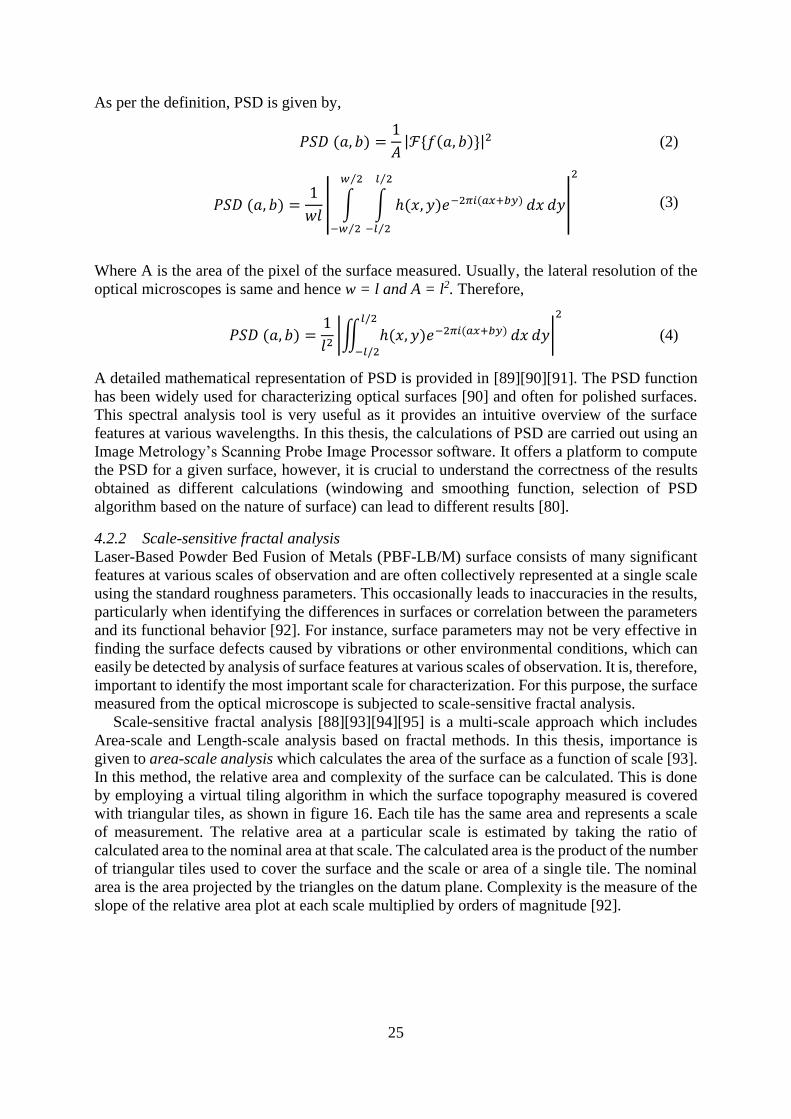
As per the definition, PSD is given by,
𝑃𝑆𝐷 (𝑎, 𝑏) =1
𝐴|ℱ{𝑓(𝑎, 𝑏)}|2 (2)
𝑃𝑆𝐷 (𝑎, 𝑏) =1
𝑤𝑙| ∫ ∫ ℎ(𝑥, 𝑦)𝑒−2𝜋𝑖(𝑎𝑥+𝑏𝑦)
𝑙 2⁄
−𝑙 2⁄
𝑤 2⁄
−𝑤 2⁄
𝑑𝑥 𝑑𝑦|
2
(3)
Where A is the area of the pixel of the surface measured. Usually, the lateral resolution of the
optical microscopes is same and hence w = l and A = l2. Therefore,
𝑃𝑆𝐷 (𝑎, 𝑏) =1
𝑙2|∬ ℎ(𝑥, 𝑦)𝑒−2𝜋𝑖(𝑎𝑥+𝑏𝑦)
𝑙/2
−𝑙/2
𝑑𝑥 𝑑𝑦|
2
(4)
A detailed mathematical representation of PSD is provided in [89][90][91]. The PSD function
has been widely used for characterizing optical surfaces [90] and often for polished surfaces.
This spectral analysis tool is very useful as it provides an intuitive overview of the surface
features at various wavelengths. In this thesis, the calculations of PSD are carried out using an
Image Metrology’s Scanning Probe Image Processor software. It offers a platform to compute
the PSD for a given surface, however, it is crucial to understand the correctness of the results
obtained as different calculations (windowing and smoothing function, selection of PSD
algorithm based on the nature of surface) can lead to different results [80].
4.2.2 Scale-sensitive fractal analysis
Laser-Based Powder Bed Fusion of Metals (PBF-LB/M) surface consists of many significant
features at various scales of observation and are often collectively represented at a single scale
using the standard roughness parameters. This occasionally leads to inaccuracies in the results,
particularly when identifying the differences in surfaces or correlation between the parameters
and its functional behavior [92]. For instance, surface parameters may not be very effective in
finding the surface defects caused by vibrations or other environmental conditions, which can
easily be detected by analysis of surface features at various scales of observation. It is, therefore,
important to identify the most important scale for characterization. For this purpose, the surface
measured from the optical microscope is subjected to scale-sensitive fractal analysis.
Scale-sensitive fractal analysis [88][93][94][95] is a multi-scale approach which includes
Area-scale and Length-scale analysis based on fractal methods. In this thesis, importance is
given to area-scale analysis which calculates the area of the surface as a function of scale [93].
In this method, the relative area and complexity of the surface can be calculated. This is done
by employing a virtual tiling algorithm in which the surface topography measured is covered
with triangular tiles, as shown in figure 16. Each tile has the same area and represents a scale
of measurement. The relative area at a particular scale is estimated by taking the ratio of
calculated area to the nominal area at that scale. The calculated area is the product of the number
of triangular tiles used to cover the surface and the scale or area of a single tile. The nominal
area is the area projected by the triangles on the datum plane. Complexity is the measure of the
slope of the relative area plot at each scale multiplied by orders of magnitude [92].

26
Figure 16. Area-scale plots showing an example of tiling algorithm performed on an as-built
PBF-LB/M surfaces at 0° build inclination. (a) Original surface (b) Relative area curve as a
function of scale; (c-e) Surface topography representation at three different scales.
4.2.3 Feature-based characterization
Several strategies have been discussed for the characterization of AM topographic features
[96][97] and in this study, a discussion on an alternative characterization strategy to define the
PBF-LB/M surface features is presented. Feature-based characterization refers to the process
of separating the significant surface features and individually characterizing such features to
fully understand the surface behavior concerning the factors affecting it. This is achieved in two
steps.
Firstly, a robust Gaussian filter (ISO 16610-71) is employed to separate the waviness and
roughness surfaces. The selection of the nesting index for filtering depends on the nature of the
surface under investigation. The separated waviness surface would include the staircase effect
[98] caused by the build orientation and also the form due to thermal conditions (shrinkages or swelling effects) during the build [98]. The roughness surface obtained includes powder particles and additional footprints of the process.
Secondly, a binary thresholding method is employed which helps in isolating the powder
particles from the roughness surface by moving a plane from the highest point on the surface
to the value of material ratio corresponding to the parameter Spk (Reduced summit height) of

27
the surface, provided the surface waviness is removed by the Robust Gaussian filtering. Powder
particles thus obtained could contain unmelted or partially melted particles, balling effect and
agglomeration of powder particles [37]. For ease of analysis, the characterization of powder
particles is based on the collective volume of all the particles above the threshold. Once the
powder particles are removed from the roughness surface, the residual surface contains the
additional footprints of the PBF-LB/M process. Both the waviness and the residual surface can
be subjected to characterization by areal surface texture parameters (ISO 25178-2). An example
of the methodology in use is provided in figure 22 in the section 6.1.

28
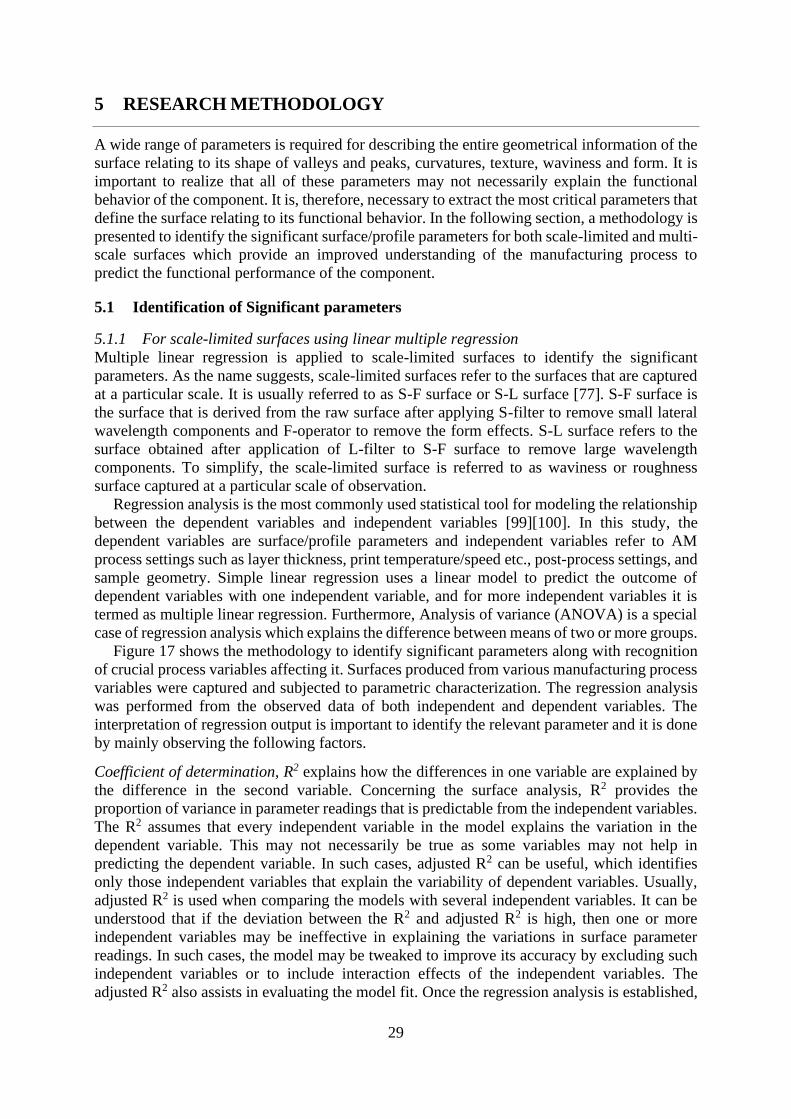
29
5 RESEARCH METHODOLOGY
A wide range of parameters is required for describing the entire geometrical information of the
surface relating to its shape of valleys and peaks, curvatures, texture, waviness and form. It is
important to realize that all of these parameters may not necessarily explain the functional
behavior of the component. It is, therefore, necessary to extract the most critical parameters that
define the surface relating to its functional behavior. In the following section, a methodology is
presented to identify the significant surface/profile parameters for both scale-limited and multi-
scale surfaces which provide an improved understanding of the manufacturing process to
predict the functional performance of the component.
5.1 Identification of Significant parameters
5.1.1 For scale-limited surfaces using linear multiple regression
Multiple linear regression is applied to scale-limited surfaces to identify the significant
parameters. As the name suggests, scale-limited surfaces refer to the surfaces that are captured
at a particular scale. It is usually referred to as S-F surface or S-L surface [77]. S-F surface is
the surface that is derived from the raw surface after applying S-filter to remove small lateral
wavelength components and F-operator to remove the form effects. S-L surface refers to the
surface obtained after application of L-filter to S-F surface to remove large wavelength
components. To simplify, the scale-limited surface is referred to as waviness or roughness
surface captured at a particular scale of observation.
Regression analysis is the most commonly used statistical tool for modeling the relationship
between the dependent variables and independent variables [99][100]. In this study, the
dependent variables are surface/profile parameters and independent variables refer to AM
process settings such as layer thickness, print temperature/speed etc., post-process settings, and
sample geometry. Simple linear regression uses a linear model to predict the outcome of
dependent variables with one independent variable, and for more independent variables it is
termed as multiple linear regression. Furthermore, Analysis of variance (ANOVA) is a special
case of regression analysis which explains the difference between means of two or more groups.
Figure 17 shows the methodology to identify significant parameters along with recognition
of crucial process variables affecting it. Surfaces produced from various manufacturing process
variables were captured and subjected to parametric characterization. The regression analysis
was performed from the observed data of both independent and dependent variables. The
interpretation of regression output is important to identify the relevant parameter and it is done
by mainly observing the following factors.
Coefficient of determination, R2 explains how the differences in one variable are explained by
the difference in the second variable. Concerning the surface analysis, R2 provides the
proportion of variance in parameter readings that is predictable from the independent variables.
The R2 assumes that every independent variable in the model explains the variation in the
dependent variable. This may not necessarily be true as some variables may not help in
predicting the dependent variable. In such cases, adjusted R2 can be useful, which identifies
only those independent variables that explain the variability of dependent variables. Usually,
adjusted R2 is used when comparing the models with several independent variables. It can be
understood that if the deviation between the R2 and adjusted R2 is high, then one or more
independent variables may be ineffective in explaining the variations in surface parameter
readings. In such cases, the model may be tweaked to improve its accuracy by excluding such
independent variables or to include interaction effects of the independent variables. The
adjusted R2 also assists in evaluating the model fit. Once the regression analysis is established,

30
a threshold is set at a certain value of the R2 or adjusted R2 to filter out the parameters with the
highest correlation.
Significance F provides an understanding of the reliability of the regression data. The
probability of the measurements with respect to the process variables is reliable if the p-value
associated with F-test is less than 0.05. It can also be understood as to what extent are
independent variables reliable in predicting the variations in the surface parameter readings.
The parameters that pass through the above-mentioned conditions are termed as significant.
Once all the significant parameters are established, the next step is to identify which
independent variable has a significant effect on surface parameters.
P-value- helps in determining the influence of process variables on surface or profile
parameters. It is usually used to test the null hypothesis to quantify the statistical significance
of measured data in the chosen t-statistic. The null hypothesis is a general statement claiming
that the relationship between two measured variables (in this case, the two variables are surface
parameters and process variables) is non-existent. If the p-value is less than 0.05 then it rejects
the null hypothesis by stating that there is a valid relationship between the measured surface
parameters and process variables.
Furthermore, regression coefficients obtained from the analysis describes the relationship
between the dependent and independent variables. It is possible to model and predict the values
of surface parameters for various values of chosen dependent variables. The positive value of
regression coefficients indicates that the increase in independent variable results in the increase
of the dependent variable. The negative value indicates that the decrease in the value of
independent variables leads to a decrease in the value of dependent variables.
Figure 17. Selection of significant parameter and influence of process variables using
regression analysis.
5.1.2 For Multi-scale surfaces using area-scale analysis
The multi-scale analysis presents the captured surface topography information from various
scales of observations. Multiple surfaces can be obtained by filtering the surface at various
nesting index wavelengths. This provides an opportunity to identify the most critical surface
regions affecting the function and the developed methodology (see figure 18) helps in
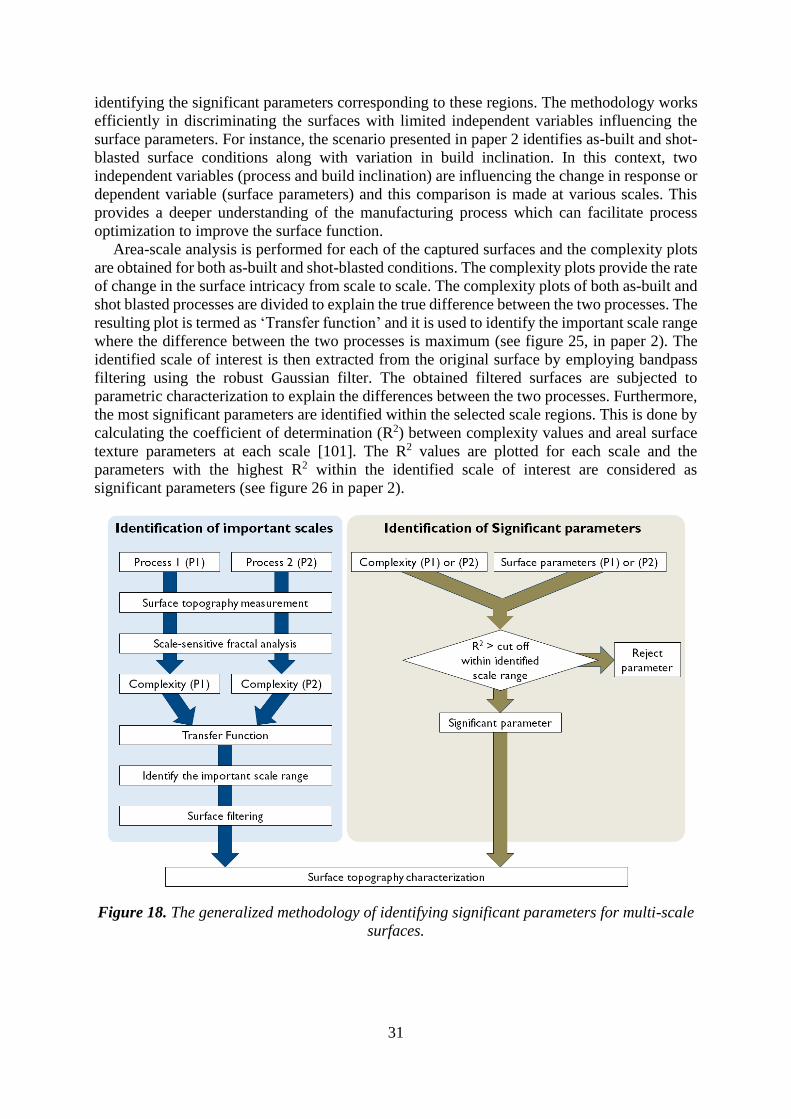
31
identifying the significant parameters corresponding to these regions. The methodology works
efficiently in discriminating the surfaces with limited independent variables influencing the
surface parameters. For instance, the scenario presented in paper 2 identifies as-built and shot-
blasted surface conditions along with variation in build inclination. In this context, two
independent variables (process and build inclination) are influencing the change in response or
dependent variable (surface parameters) and this comparison is made at various scales. This
provides a deeper understanding of the manufacturing process which can facilitate process
optimization to improve the surface function.
Area-scale analysis is performed for each of the captured surfaces and the complexity plots
are obtained for both as-built and shot-blasted conditions. The complexity plots provide the rate
of change in the surface intricacy from scale to scale. The complexity plots of both as-built and
shot blasted processes are divided to explain the true difference between the two processes. The
resulting plot is termed as ‘Transfer function’ and it is used to identify the important scale range
where the difference between the two processes is maximum (see figure 25, in paper 2). The
identified scale of interest is then extracted from the original surface by employing bandpass
filtering using the robust Gaussian filter. The obtained filtered surfaces are subjected to
parametric characterization to explain the differences between the two processes. Furthermore,
the most significant parameters are identified within the selected scale regions. This is done by
calculating the coefficient of determination (R2) between complexity values and areal surface
texture parameters at each scale [101]. The R2 values are plotted for each scale and the
parameters with the highest R2 within the identified scale of interest are considered as
significant parameters (see figure 26 in paper 2).
Figure 18. The generalized methodology of identifying significant parameters for multi-scale
surfaces.

32
Although the statistical approach is embedded in this method, the final selection of significant
parameters is based on “Transfer function” – complexity plot and due to this reason, it is
considered as an approach to identify the significant parameters using advanced
characterization technique. In scenarios where two processes are to be compared, then this
method works effectively and in cases where there are several independent variables are
involved then the aforementioned method works best.
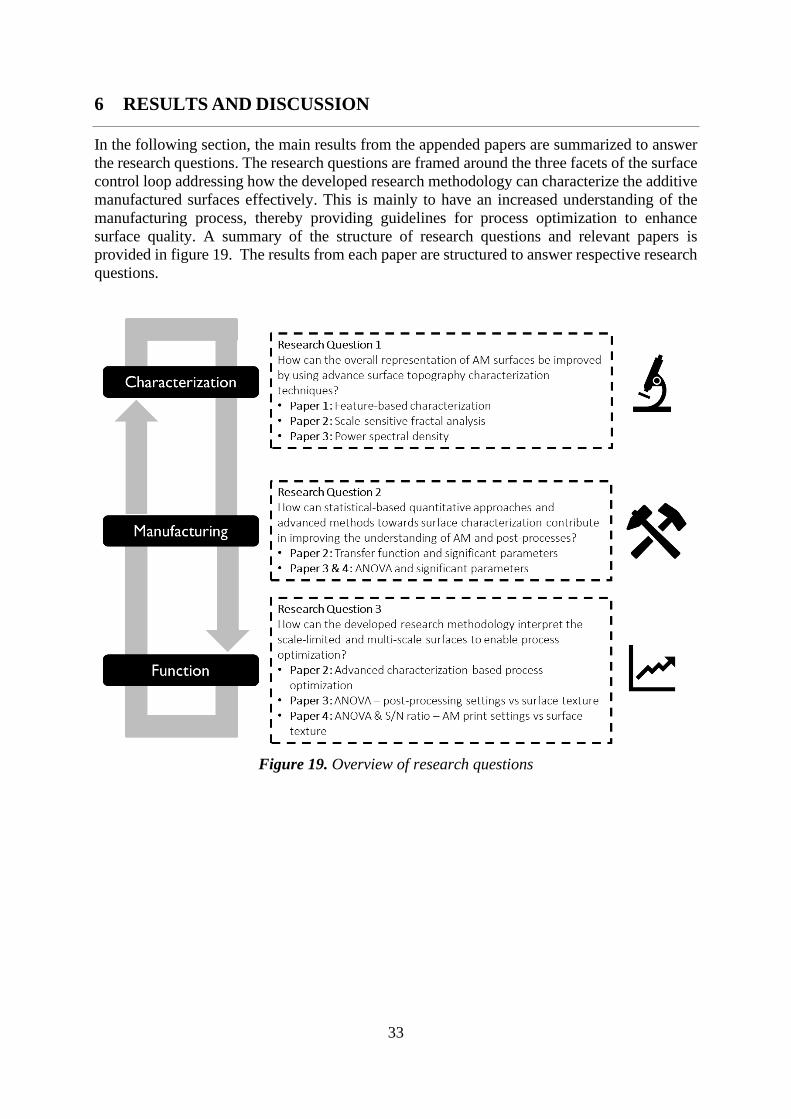
33
6 RESULTS AND DISCUSSION
In the following section, the main results from the appended papers are summarized to answer
the research questions. The research questions are framed around the three facets of the surface
control loop addressing how the developed research methodology can characterize the additive
manufactured surfaces effectively. This is mainly to have an increased understanding of the
manufacturing process, thereby providing guidelines for process optimization to enhance
surface quality. A summary of the structure of research questions and relevant papers is
provided in figure 19. The results from each paper are structured to answer respective research
questions.
Figure 19. Overview of research questions
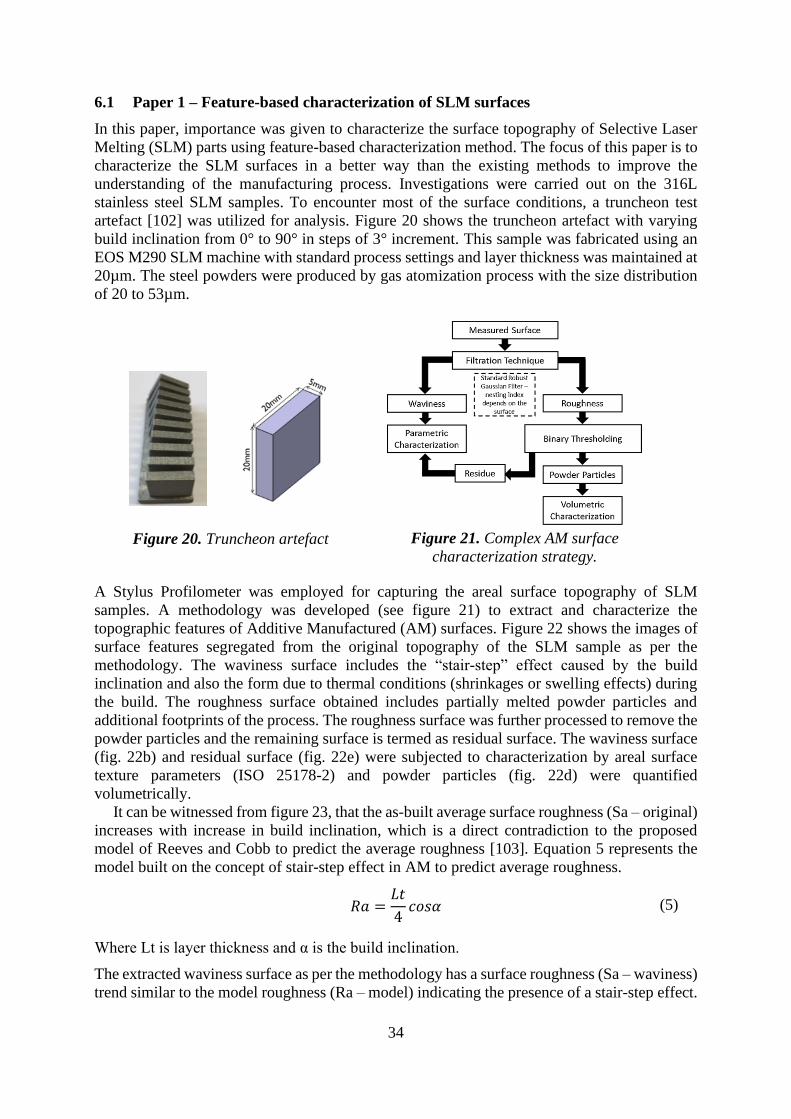
34
6.1 Paper 1 – Feature-based characterization of SLM surfaces
In this paper, importance was given to characterize the surface topography of Selective Laser
Melting (SLM) parts using feature-based characterization method. The focus of this paper is to
characterize the SLM surfaces in a better way than the existing methods to improve the
understanding of the manufacturing process. Investigations were carried out on the 316L
stainless steel SLM samples. To encounter most of the surface conditions, a truncheon test
artefact [102] was utilized for analysis. Figure 20 shows the truncheon artefact with varying
build inclination from 0° to 90° in steps of 3° increment. This sample was fabricated using an
EOS M290 SLM machine with standard process settings and layer thickness was maintained at
20µm. The steel powders were produced by gas atomization process with the size distribution
of 20 to 53µm.
Figure 20. Truncheon artefact
Figure 21. Complex AM surface
characterization strategy.
A Stylus Profilometer was employed for capturing the areal surface topography of SLM
samples. A methodology was developed (see figure 21) to extract and characterize the
topographic features of Additive Manufactured (AM) surfaces. Figure 22 shows the images of
surface features segregated from the original topography of the SLM sample as per the
methodology. The waviness surface includes the “stair-step” effect caused by the build
inclination and also the form due to thermal conditions (shrinkages or swelling effects) during
the build. The roughness surface obtained includes partially melted powder particles and
additional footprints of the process. The roughness surface was further processed to remove the
powder particles and the remaining surface is termed as residual surface. The waviness surface
(fig. 22b) and residual surface (fig. 22e) were subjected to characterization by areal surface
texture parameters (ISO 25178-2) and powder particles (fig. 22d) were quantified
volumetrically.
It can be witnessed from figure 23, that the as-built average surface roughness (Sa – original)
increases with increase in build inclination, which is a direct contradiction to the proposed
model of Reeves and Cobb to predict the average roughness [103]. Equation 5 represents the
model built on the concept of stair-step effect in AM to predict average roughness.
𝑅𝑎 =𝐿𝑡
4𝑐𝑜𝑠𝛼 (5)
Where Lt is layer thickness and α is the build inclination.
The extracted waviness surface as per the methodology has a surface roughness (Sa – waviness)
trend similar to the model roughness (Ra – model) indicating the presence of a stair-step effect.

35
This waviness surface represents an ideal situation where all the powder particles have
completely melted to build the part during the fabrication process of SLM. However, in reality,
some powder particles partially melt, and the surrounding loose powders in the powder bed
adhere to the surface during the SLM process, thereby, increasing the surface roughness.
(a) (b) (c)
(d) (e)
Figure 22. Isolation of powder particles and staircase effect by applying the Robust Gaussian
filter. (a) Original surface (b) Waviness surface (c) Roughness surface (d) Powder particles
(e) Residual surface. Measurement area of the captured surface is 2.5mm × 2.5mm.
The adherence of powder particles to the surface increases with an increase in build inclination
since the higher the slopes, the higher will be the contact with powder particles. It can be
witnessed in the volume curve of the powder particles in figure 24. After separation of powder
particles from the residual surface, as a rule of thumb, the higher the volume of the powder
particles, the lower the roughness of the residual surfaces and vice versa. It can be seen from
figure 24 that the transition takes place between 6-9˚ build angles, beyond which the powder
particles start to dominate the surface. This also implies that at lower build inclination (less than
6°), the stair-step effect is dominant on surface topography, between 9° to 15° there is an
increased dominance of powder particles along with the slight effect of stair-stepping, but
beyond 15° the methodology used in this study fails to identify the residual surface since it is
completely dominated by powder particles.
Figure 23. Average roughness curve
Figure 24. Volume curve of the powder
particles and Sa of residue plotted against the
build orientation.
µm
0
20
40
60
80
100
120
140
µm
0
20
40
60
80
100
µm
0
20
40
60
80
100
µm
0
10
20
30
40
50
60
70
µm
0
10
20
30
40
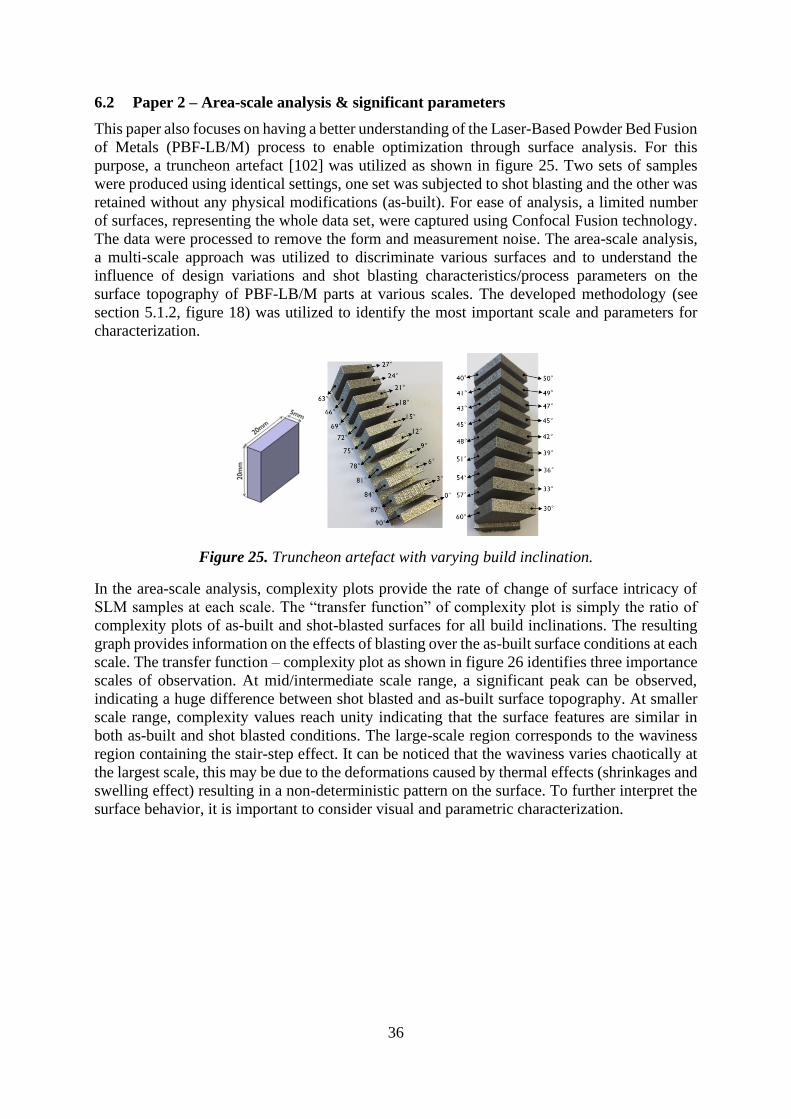
36
6.2 Paper 2 – Area-scale analysis & significant parameters
This paper also focuses on having a better understanding of the Laser-Based Powder Bed Fusion
of Metals (PBF-LB/M) process to enable optimization through surface analysis. For this
purpose, a truncheon artefact [102] was utilized as shown in figure 25. Two sets of samples
were produced using identical settings, one set was subjected to shot blasting and the other was
retained without any physical modifications (as-built). For ease of analysis, a limited number
of surfaces, representing the whole data set, were captured using Confocal Fusion technology.
The data were processed to remove the form and measurement noise. The area-scale analysis,
a multi-scale approach was utilized to discriminate various surfaces and to understand the
influence of design variations and shot blasting characteristics/process parameters on the
surface topography of PBF-LB/M parts at various scales. The developed methodology (see
section 5.1.2, figure 18) was utilized to identify the most important scale and parameters for
characterization.
Figure 25. Truncheon artefact with varying build inclination.
In the area-scale analysis, complexity plots provide the rate of change of surface intricacy of
SLM samples at each scale. The “transfer function” of complexity plot is simply the ratio of
complexity plots of as-built and shot-blasted surfaces for all build inclinations. The resulting
graph provides information on the effects of blasting over the as-built surface conditions at each
scale. The transfer function – complexity plot as shown in figure 26 identifies three importance
scales of observation. At mid/intermediate scale range, a significant peak can be observed,
indicating a huge difference between shot blasted and as-built surface topography. At smaller
scale range, complexity values reach unity indicating that the surface features are similar in
both as-built and shot blasted conditions. The large-scale region corresponds to the waviness
region containing the stair-step effect. It can be noticed that the waviness varies chaotically at
the largest scale, this may be due to the deformations caused by thermal effects (shrinkages and
swelling effect) resulting in a non-deterministic pattern on the surface. To further interpret the
surface behavior, it is important to consider visual and parametric characterization.

37
Figure 26. Transfer function – complexity plot of the PBF-LB/M surfaces at various build
inclinations
The methodology developed allowed to identify the most significant parameters within three
important scales of observation. Figure 27 shows areal surface texture parameters such as Sa,
Sq, Smc, Vmc, Vvc and Vv have high correlation within the large-scale ranges indicating that
the values of these parameters are determined by the waviness of the surface topography.
Parameters such as Sdr, Sdq, Sal and Str have a high correlation in the small and intermediate
scales. It is important to filter the surfaces with respect to the three identified regions and use
corresponding significant parameters to fully understand the effects of post-processing.
Figure 27. Coefficient of determination (R2) of significant parameters obtained by taking
correlations between the complexity values and areal surface texture parameters at every
scale.
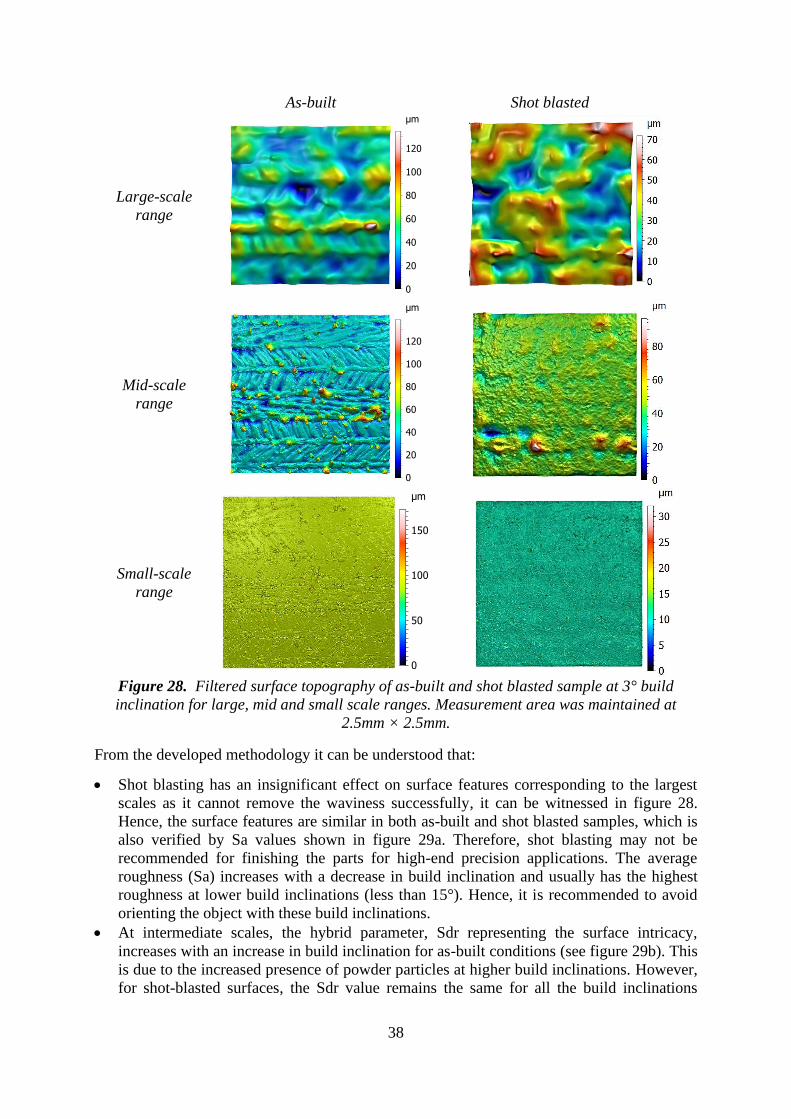
38
As-built Shot blasted
Large-scale
range
Mid-scale
range
Small-scale
range
Figure 28. Filtered surface topography of as-built and shot blasted sample at 3° build
inclination for large, mid and small scale ranges. Measurement area was maintained at
2.5mm × 2.5mm.
From the developed methodology it can be understood that:
• Shot blasting has an insignificant effect on surface features corresponding to the largest
scales as it cannot remove the waviness successfully, it can be witnessed in figure 28.
Hence, the surface features are similar in both as-built and shot blasted samples, which is
also verified by Sa values shown in figure 29a. Therefore, shot blasting may not be
recommended for finishing the parts for high-end precision applications. The average
roughness (Sa) increases with a decrease in build inclination and usually has the highest
roughness at lower build inclinations (less than 15°). Hence, it is recommended to avoid
orienting the object with these build inclinations.
• At intermediate scales, the hybrid parameter, Sdr representing the surface intricacy,
increases with an increase in build inclination for as-built conditions (see figure 29b). This
is due to the increased presence of powder particles at higher build inclinations. However,
for shot-blasted surfaces, the Sdr value remains the same for all the build inclinations
µm
0
20
40
60
80
100
120
µm
0
20
40
60
80
100
120
µm
0
50
100
150
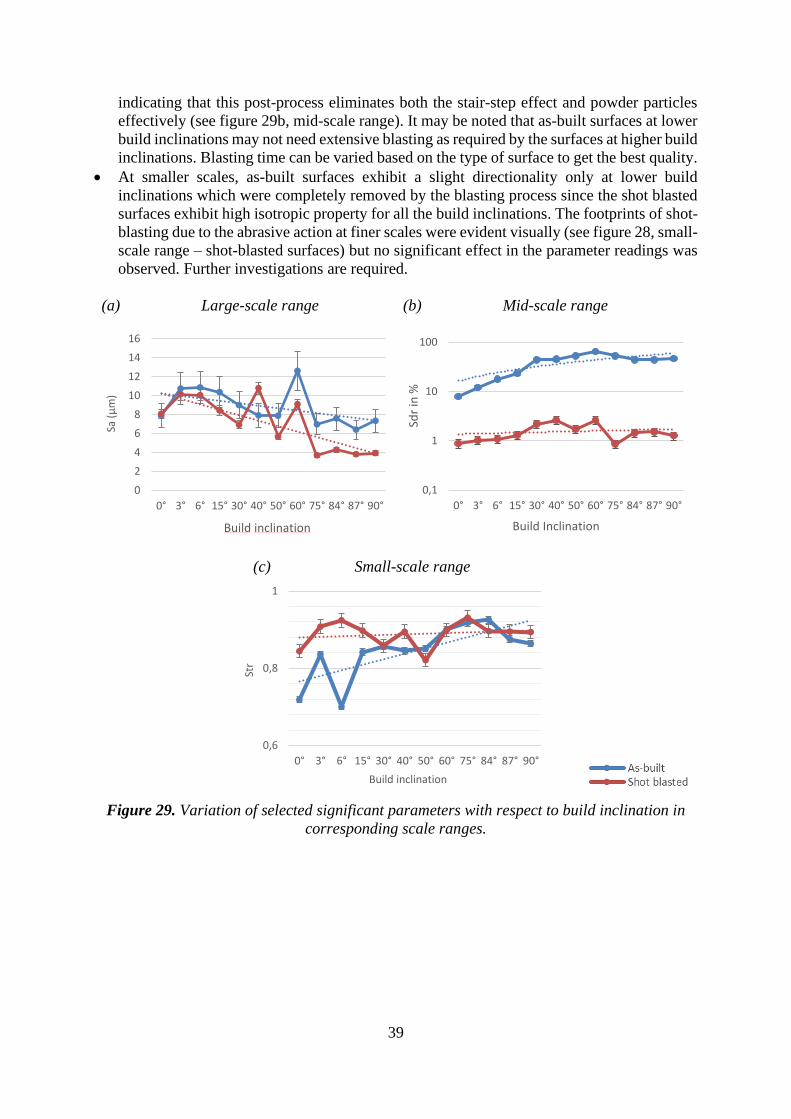
39
indicating that this post-process eliminates both the stair-step effect and powder particles
effectively (see figure 29b, mid-scale range). It may be noted that as-built surfaces at lower
build inclinations may not need extensive blasting as required by the surfaces at higher build
inclinations. Blasting time can be varied based on the type of surface to get the best quality.
• At smaller scales, as-built surfaces exhibit a slight directionality only at lower build
inclinations which were completely removed by the blasting process since the shot blasted
surfaces exhibit high isotropic property for all the build inclinations. The footprints of shot-
blasting due to the abrasive action at finer scales were evident visually (see figure 28, small-
scale range – shot-blasted surfaces) but no significant effect in the parameter readings was
observed. Further investigations are required.
(a) Large-scale range (b) Mid-scale range
(c) Small-scale range
Figure 29. Variation of selected significant parameters with respect to build inclination in
corresponding scale ranges.
0
2
4
6
8
10
12
14
16
0° 3° 6° 15° 30° 40° 50° 60° 75° 84° 87° 90°
Sa (
µm
)
Build inclination
0,1
1
10
100
0° 3° 6° 15° 30° 40° 50° 60° 75° 84° 87° 90°
Sdr
in %
Build Inclination
0,6
0,8
1
0° 3° 6° 15° 30° 40° 50° 60° 75° 84° 87° 90°
Str
Build inclination
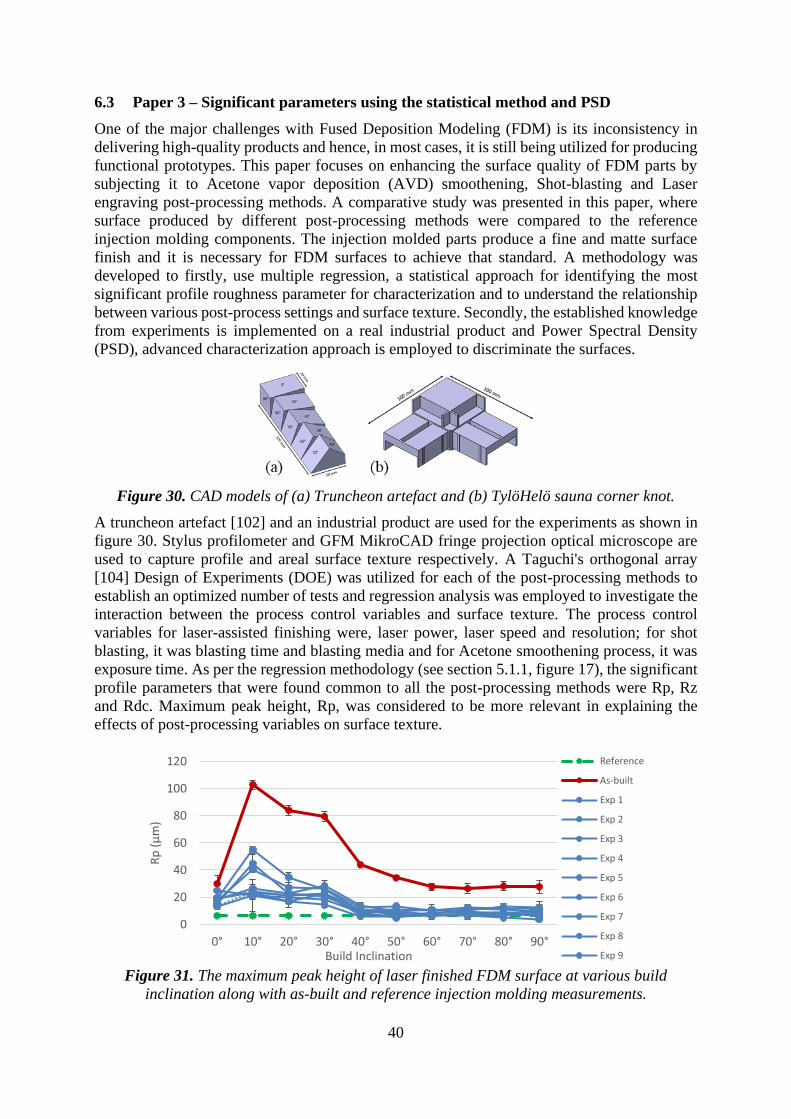
40
6.3 Paper 3 – Significant parameters using the statistical method and PSD
One of the major challenges with Fused Deposition Modeling (FDM) is its inconsistency in
delivering high-quality products and hence, in most cases, it is still being utilized for producing
functional prototypes. This paper focuses on enhancing the surface quality of FDM parts by
subjecting it to Acetone vapor deposition (AVD) smoothening, Shot-blasting and Laser
engraving post-processing methods. A comparative study was presented in this paper, where
surface produced by different post-processing methods were compared to the reference
injection molding components. The injection molded parts produce a fine and matte surface
finish and it is necessary for FDM surfaces to achieve that standard. A methodology was
developed to firstly, use multiple regression, a statistical approach for identifying the most
significant profile roughness parameter for characterization and to understand the relationship
between various post-process settings and surface texture. Secondly, the established knowledge
from experiments is implemented on a real industrial product and Power Spectral Density
(PSD), advanced characterization approach is employed to discriminate the surfaces.
Figure 30. CAD models of (a) Truncheon artefact and (b) TylöHelö sauna corner knot.
A truncheon artefact [102] and an industrial product are used for the experiments as shown in
figure 30. Stylus profilometer and GFM MikroCAD fringe projection optical microscope are
used to capture profile and areal surface texture respectively. A Taguchi's orthogonal array
[104] Design of Experiments (DOE) was utilized for each of the post-processing methods to
establish an optimized number of tests and regression analysis was employed to investigate the
interaction between the process control variables and surface texture. The process control
variables for laser-assisted finishing were, laser power, laser speed and resolution; for shot
blasting, it was blasting time and blasting media and for Acetone smoothening process, it was
exposure time. As per the regression methodology (see section 5.1.1, figure 17), the significant
profile parameters that were found common to all the post-processing methods were Rp, Rz
and Rdc. Maximum peak height, Rp, was considered to be more relevant in explaining the
effects of post-processing variables on surface texture.
Figure 31. The maximum peak height of laser finished FDM surface at various build
inclination along with as-built and reference injection molding measurements.
0
20
40
60
80
100
120
0° 10° 20° 30° 40° 50° 60° 70° 80° 90°
Rp
(µ
m)
Build Inclination
Reference
As-built
Exp 1
Exp 2
Exp 3
Exp 4
Exp 5
Exp 6
Exp 7
Exp 8
Exp 9
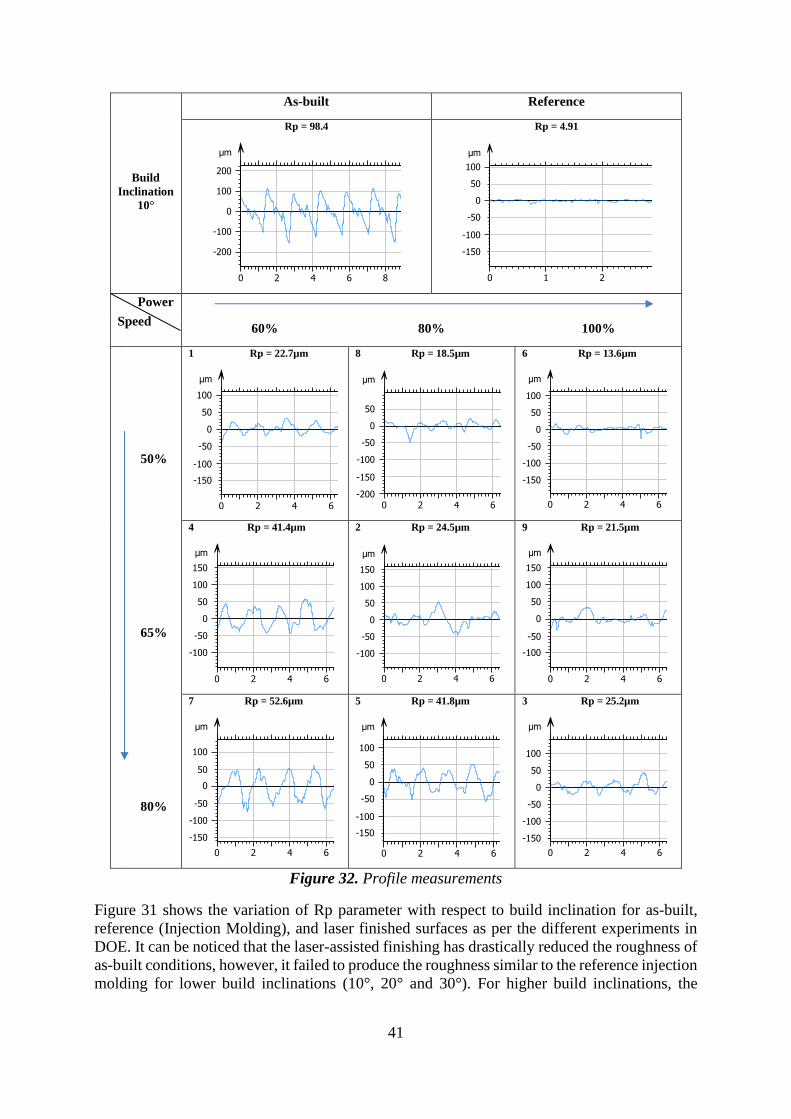
41
Build
Inclination
10°
As-built Reference
Rp = 98.4
Rp = 4.91
Power
Speed
60% 80% 100%
50%
1 Rp = 22.7µm
8 Rp = 18.5µm
6 Rp = 13.6µm
65%
4 Rp = 41.4µm
2 Rp = 24.5µm
9 Rp = 21.5µm
80%
7 Rp = 52.6µm
5 Rp = 41.8µm
3 Rp = 25.2µm
Figure 32. Profile measurements
Figure 31 shows the variation of Rp parameter with respect to build inclination for as-built,
reference (Injection Molding), and laser finished surfaces as per the different experiments in
DOE. It can be noticed that the laser-assisted finishing has drastically reduced the roughness of
as-built conditions, however, it failed to produce the roughness similar to the reference injection
molding for lower build inclinations (10°, 20° and 30°). For higher build inclinations, the
0 2 4 6 8 10 12 mm
µm
-200
-100
0
100
200
Parameters Value Unit
Length 12.5 mm
0 1 2 3 4 mm
µm
-150
-100
-50
0
50
100
Parameters Value Unit
Length 4.00 mm
0 2 4 6 8 10 12 mm
µm
-150
-100
-50
0
50
100
Parameters Value Unit
Length 12.5 mm
0 2 4 6 8 10 12 mm
µm
-200
-150
-100
-50
0
50
Parameters Value Unit
Length 12.5 mm
0 2 4 6 8 10 12 mm
µm
-150
-100
-50
0
50
100
Parameters Value Unit
Length 12.5 mm
0 2 4 6 8 10 12 mm
µm
-100
-50
0
50
100
150
Parameters Value Unit
Length 12.5 mm
0 2 4 6 8 10 12 mm
µm
-100
-50
0
50
100
150
Parameters Value Unit
Length 12.5 mm
0 2 4 6 8 10 12 mm
µm
-100
-50
0
50
100
150
Parameters Value Unit
Length 12.5 mm
0 2 4 6 8 10 12 mm
µm
-150
-100
-50
0
50
100
Parameters Value Unit
Length 12.5 mm
0 2 4 6 8 10 12 mm
µm
-150
-100
-50
0
50
100
Parameters Value Unit
Length 12.5 mm
0 2 4 6 8 10 12 mm
µm
-150
-100
-50
0
50
100
Parameters Value Unit
Length 12.5 mm
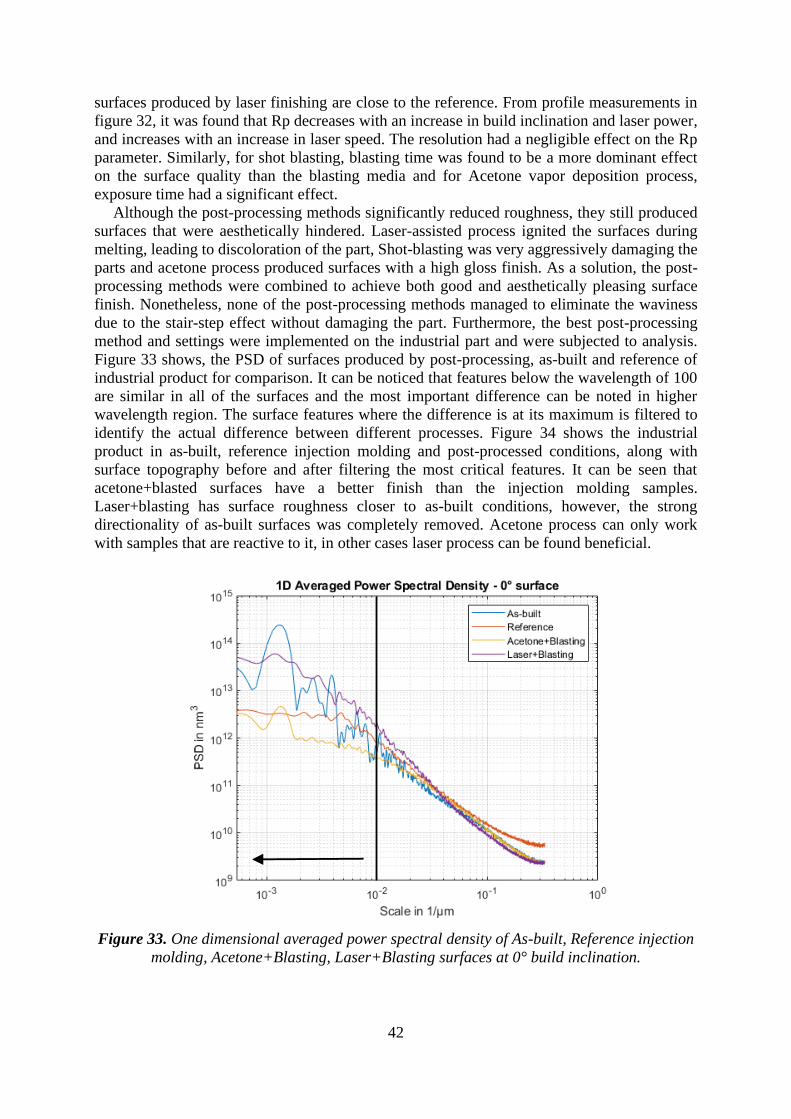
42
surfaces produced by laser finishing are close to the reference. From profile measurements in
figure 32, it was found that Rp decreases with an increase in build inclination and laser power,
and increases with an increase in laser speed. The resolution had a negligible effect on the Rp
parameter. Similarly, for shot blasting, blasting time was found to be a more dominant effect
on the surface quality than the blasting media and for Acetone vapor deposition process,
exposure time had a significant effect.
Although the post-processing methods significantly reduced roughness, they still produced
surfaces that were aesthetically hindered. Laser-assisted process ignited the surfaces during
melting, leading to discoloration of the part, Shot-blasting was very aggressively damaging the
parts and acetone process produced surfaces with a high gloss finish. As a solution, the post-
processing methods were combined to achieve both good and aesthetically pleasing surface
finish. Nonetheless, none of the post-processing methods managed to eliminate the waviness
due to the stair-step effect without damaging the part. Furthermore, the best post-processing
method and settings were implemented on the industrial part and were subjected to analysis.
Figure 33 shows, the PSD of surfaces produced by post-processing, as-built and reference of
industrial product for comparison. It can be noticed that features below the wavelength of 100
are similar in all of the surfaces and the most important difference can be noted in higher
wavelength region. The surface features where the difference is at its maximum is filtered to
identify the actual difference between different processes. Figure 34 shows the industrial
product in as-built, reference injection molding and post-processed conditions, along with
surface topography before and after filtering the most critical features. It can be seen that
acetone+blasted surfaces have a better finish than the injection molding samples.
Laser+blasting has surface roughness closer to as-built conditions, however, the strong
directionality of as-built surfaces was completely removed. Acetone process can only work
with samples that are reactive to it, in other cases laser process can be found beneficial.
Figure 33. One dimensional averaged power spectral density of As-built, Reference injection
molding, Acetone+Blasting, Laser+Blasting surfaces at 0° build inclination.
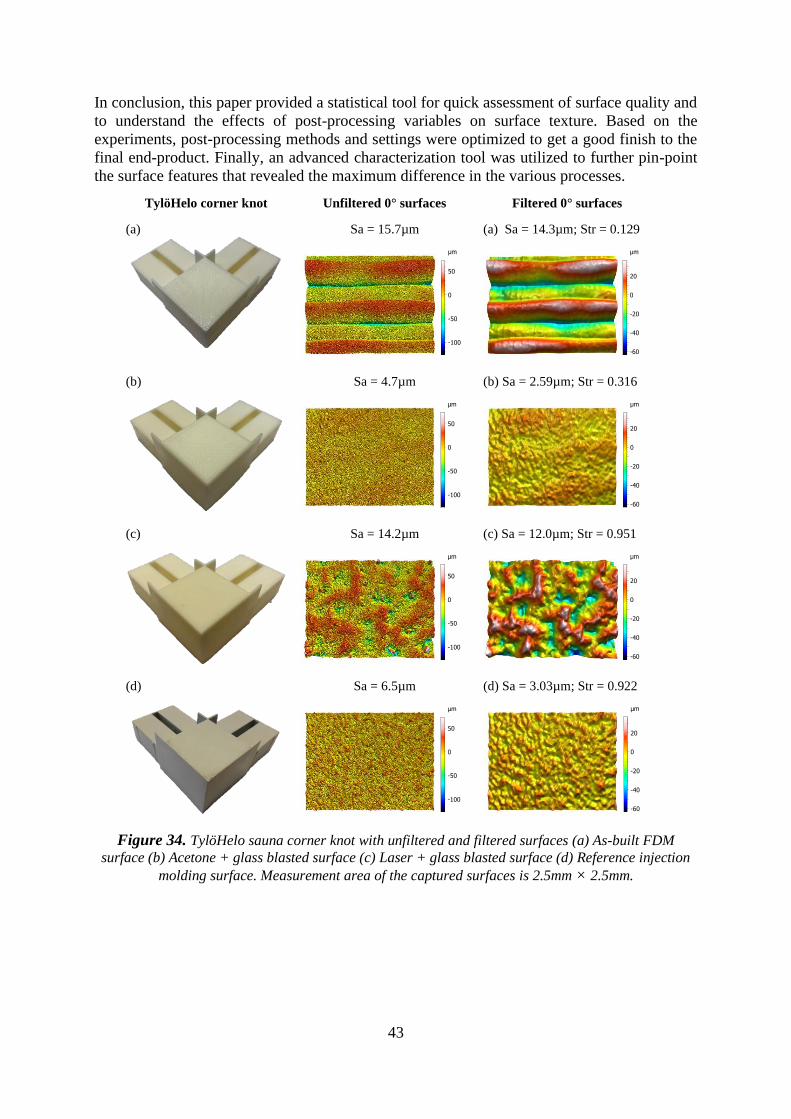
43
In conclusion, this paper provided a statistical tool for quick assessment of surface quality and
to understand the effects of post-processing variables on surface texture. Based on the
experiments, post-processing methods and settings were optimized to get a good finish to the
final end-product. Finally, an advanced characterization tool was utilized to further pin-point
the surface features that revealed the maximum difference in the various processes.
TylöHelo corner knot Unfiltered 0° surfaces Filtered 0° surfaces
(a) (a)
Sa = 15.7µm
(a) Sa = 14.3µm; Str = 0.129
(b)
Sa = 4.7µm
(b) Sa = 2.59µm; Str = 0.316
(c)
Sa = 14.2µm
(c) Sa = 12.0µm; Str = 0.951
(d)
Sa = 6.5µm
(d) Sa = 3.03µm; Str = 0.922
Figure 34. TylöHelo sauna corner knot with unfiltered and filtered surfaces (a) As-built FDM
surface (b) Acetone + glass blasted surface (c) Laser + glass blasted surface (d) Reference injection
molding surface. Measurement area of the captured surfaces is 2.5mm × 2.5mm.
µm
-100
-50
0
50
µm
-60
-40
-20
0
20
µm
-100
-50
0
50
µm
-60
-40
-20
0
20
µm
-100
-50
0
50
µm
-60
-40
-20
0
20
µm
-100
-50
0
50
µm
-60
-40
-20
0
20

44
6.4 Paper 4 – Significant parameters using statistical methods and S/N ratio
In the previous section, the focus was on using a linear statistical approach to characterize the
FDM surfaces and to understand the influence of post-processing settings on surface texture. In
this paper, the focus is on interpreting the effects of FDM print settings on surface texture.
Investigations were conducted on a truncheon artefact with varying build inclinations from 10°
to 90°. Taguchi’s orthogonal array design of experiments [104] was utilized to produce an
optimized number of experiments required for the study. Truncheon artefact [102] was
fabricated as per the DOE containing varying layer thickness, print quality (print speed) and
material infill. Quantitative surface texture measurements by Stylus profilometer were made
to obtain 2D profile roughness parameters to characterize the FDM surfaces. The profile
roughness parameters were linearly regressed with process control variables to study its effects
on surface quality and also to find the most significant profile parameters for characterization.
In addition, the signal to noise ratio (S/N) was used to quantify the influence of FDM process
variables on significant parameters.
Figure 35. Roughness profile measurements
The results suggest that profile roughness parameters such as Rp, Rv, Rz, Ra, RSm, Rdc and
Rpc were found to be significant for the study. All of these significant parameters value except
Rpc decreases with an increase in build inclination and increases with an increase in layer
thickness. The opposite behavior can be observed with Rpc parameter. This result suggests that
when the build inclination increases, amplitude and spacing of the roughness profile decrease,
thereby, increasing the number of stair-steps. When layer thickness increases, amplitude and
spacing increase, reducing the number of stair-steps. This can be observed from the profile
measurements shown in figure 35 and parameter readings in figure 36. Material infill and print
quality were found to have an insignificant effect on surface texture.
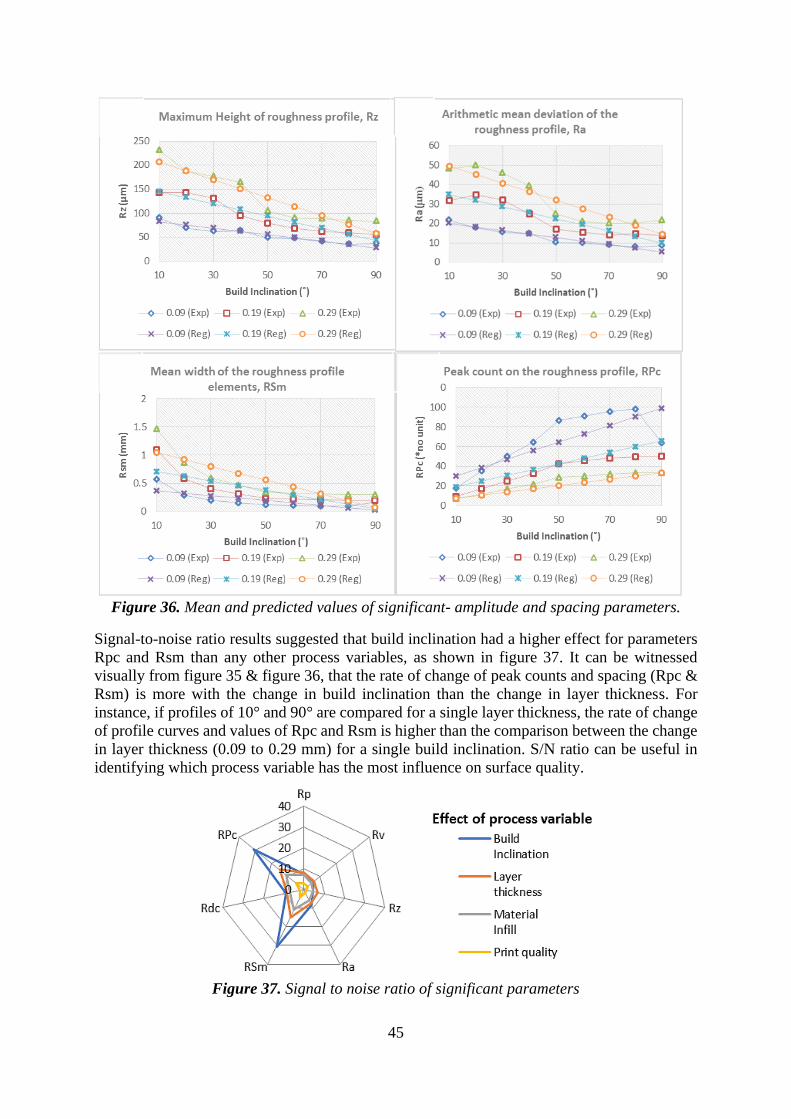
45
Figure 36. Mean and predicted values of significant- amplitude and spacing parameters.
Signal-to-noise ratio results suggested that build inclination had a higher effect for parameters
Rpc and Rsm than any other process variables, as shown in figure 37. It can be witnessed
visually from figure 35 & figure 36, that the rate of change of peak counts and spacing (Rpc &
Rsm) is more with the change in build inclination than the change in layer thickness. For
instance, if profiles of 10° and 90° are compared for a single layer thickness, the rate of change
of profile curves and values of Rpc and Rsm is higher than the comparison between the change
in layer thickness (0.09 to 0.29 mm) for a single build inclination. S/N ratio can be useful in
identifying which process variable has the most influence on surface quality.
Figure 37. Signal to noise ratio of significant parameters

46
47
7 CONCLUSIONS AND FUTURE WORK
7.1 Conclusions
Additive Manufacturing has proven to have the potential to be the next generation of technology
in part manufacture. Therefore, the focus has been shifted towards making AM process more
robust and reliable for its widespread adoption in industries. One such attempt is made in this
thesis by providing guidelines to AM users for process optimization through surface analysis.
This thesis provides several potential approaches to characterize the complex AM surfaces with
a primary purpose to improve the surface quality and its functional behavior. Diversity in this
research concerning AM technologies, surface metrology and characterization techniques along
with statistical approaches provides a strong foundation for researchers and manufacturers
aiming to improve the surface quality. The study can be summed up by answering the following
research questions.
RQ1: How can the overall representation of AM surfaces be improved by using advanced
surface topography characterization techniques?
The study on the surface topography of AM samples has predominantly been based on profile
measurements, which often do not fully reflect the functional behavior. Characterization by
areal surface texture parameters (ISO 25178-2) is effective, however, most of these parameters
are a direct counterpart of profile parameters (ISO 4287) and average parameters are mostly
used for surface description. This emphasizes the need for advanced characterization methods.
It can help in mapping the measured surface topography at various scales of observation and as
a function of spatial frequency which can be useful to extract the most crucial surface features.
Characterizing these features not only strengthens the correlation between the surface and
functional performance of the part but also improves the overall representation of AM surfaces.
The papers 1, 2 and 3 portray the use of advanced methods such as Feature-based
characterization, Scale-sensitive fractal analysis using area-scale relations and Power Spectral
Density. The contrast between direct quantification of surfaces via texture parameters and using
advanced methods in combination with texture parameters has been displayed in these papers.
RQ2: How can statistical-based quantitative approaches and advanced methods towards
surface characterization contribute to improving the understanding of AM and post-
processes?
In most of the published research, the quantification of as-built and post-processed AM surfaces
are based on Ra or Sa, average roughness parameters, which provides a limited understanding
of the manufacturing process since it does not provide a complete description of the surface
under inspection. The effective representation of surface topography is crucial in understanding
the manufacturing process. This thesis provides a technique to identify the most significant
surface/profile roughness parameters representing the “footprints” on the surface, unique to
each manufacturing process. Analyzing these unique features on the surface topography can
lead to an enhanced understanding of the manufacturing process.
Multiple regression statistical approach was used to analyze the measured surface with
respect to two or more independent variables at a particular scale and the most significant
parameters were the ones that had the highest adjusted coefficient of determination (adj. R2)
value. Similarly, advanced approach by area-scale analysis examined the measured surface at
various scales of observation and the most significant parameters were the parameters with high
R2 value within the identified scale of interest as per the “Transfer function” plot.
48
RQ3: How does the developed research methodology interpret the scale-limited and multi-
scale surfaces to enable process optimization?
Surface interpretation is crucial in having enhanced manufacturing process control and to attain
stability in the essential physical processes to achieve the desired surface quality and functional
performance of the part. The developed research methodology in this thesis can not only be
used for the identification of significant parameters but also to identify the influence of various
process variables (independent variables- AM or post-process settings) on the surface texture.
This enables process optimization where the process settings can be adjusted as per the
requirements to get the desired outcome.
For scale-limited surfaces, multiple regression statistical method was employed to identify
the influence of AM print settings (layer thickness, print temperature, infill settings and so on)
and post-process settings (shot-blasting, laser-finishing and acetone process settings) on surface
topography. Besides, the signal-to-noise ratio was utilized for determining which process
variable had a dominant effect on surface texture. By understanding this relationship, it is
possible to vary or adjust the settings of a particular manufacturing process to achieve the
desired results. Similarly, for multi-scale surfaces, advanced characterization technique by area-
scale analysis was utilized to identify the critical surface features and for interpreting the
influence of process variables on surface texture at different scales. This method works best
while comparing two processes (as-built and shot-blasted surfaces) with limited process
variables.
Multiple regression was mainly focused on scale-limited surfaces to bring out the overall
differences in manufacturing processes and to have a general understanding of how various
factors affect the surface texture. The area-scale analysis was employed for bringing out more
focused differences in processes by analyzing surfaces at different scales and to identify which
surface features gets affected the most by process variables.
7.2 Future work
The current scope of this thesis is to have an effective characterization of surface topography
of Additive Manufactured surfaces thereby increasing the understanding of its process and
providing inputs for process optimization to produce parts with enhanced surface quality and
function. Future work involves reducing the gaps identified in this thesis and also to verify the
accuracy of the established methods and results.
It is important to explore other surface measurements techniques and characterization
methods to quantify the surfaces in general and also to describe the re-entrant surface features
in AM. The statistical methodology employed in this thesis uses a linear approach to establish
the relationship between the dependent and independent variables, however, it is necessary to
explore the polynomial model to verify the usefulness of this approach. Furthermore, the
correlations between surface texture and functional behavior have to be explored. Although the
developed methodology predicts the functional behavior of the surface under inspection, it is
required to verify to fully establish the correlation between them. It could be of great importance
to compare the developed research approach with the existing methods for characterizing AM
surfaces. In doing so, it is possible to estimate the amount of impact that the developed approach
has in predicting the functional performance of the part. Furthermore, this can provide a
valuable addition to the surface quality guideline for AM manufacturers who are looking to
maximize the surface quality and function of the parts produced.

49
REFERENCES
[1] I. Gibson, D. Rosen, and B. Stucker, Additive Manufacturing Technologies. New York,
NY: Springer New York, 2015.
[2] M. Wiese, S. Thiede, and C. Herrmann, “Rapid manufacturing of automotive polymer
series parts: A systematic review of processes, materials and challenges,” Addit.
Manuf., vol. 36, p. 101582, Dec. 2020, doi: 10.1016/j.addma.2020.101582.
[3] A. Gisario, M. Kazarian, F. Martina, and M. Mehrpouya, “Metal additive
manufacturing in the commercial aviation industry: A review,” Journal of
Manufacturing Systems, vol. 53. Elsevier B.V., pp. 124–149, Oct. 01, 2019, doi:
10.1016/j.jmsy.2019.08.005.
[4] M. A. Ali, M. Rajabi, and S. Sudhir Sali, “Additive manufacturing potential for
medical devices and technology,” Current Opinion in Chemical Engineering, vol. 28.
Elsevier Ltd, pp. 127–133, Jun. 01, 2020, doi: 10.1016/j.coche.2020.05.001.
[5] R. Galante, C. G. Figueiredo-Pina, and A. P. Serro, “Additive manufacturing of
ceramics for dental applications: A review,” Dental Materials, vol. 35, no. 6. Elsevier
Inc., pp. 825–846, Jun. 01, 2019, doi: 10.1016/j.dental.2019.02.026.
[6] C. J. Bae, A. B. Diggs, and A. Ramachandran, “Quantification and certification of
additive manufacturing materials and processes,” in Additive Manufacturing:
Materials, Processes, Quantifications and Applications, Elsevier, 2018, pp. 181–213.
[7] R. Leach, Ed., Optical Measurement of Surface Topography. Springer Berlin
Heidelberg, 2011.
[8] K. J. Stout and E. J. Davis, “Surface topography of cylinder bores - the relationship
between manufacture, characterization and function,” Wear, vol. 95, no. 2, pp. 111–
125, 1984, doi: 10.1016/0043-1648(84)90111-X.
[9] F. Zanini, L. Pagani, P. J. Scott, E. Savio, and S. Carmignato, “Measurement of
additively manufactured surfaces with re-entrant features by x-ray computed
tomography,” Proc. - 2018 ASPE euspen Summer Top. Meet. Adv. Precis. Addit.
Manuf., no. July, pp. 222–225, 2018.
[10] “ISO/ASTM 52900:2015(en), Additive manufacturing — General principles —
Terminology,” Geneva, 2015.
[11] W. E. Frazier, “Metal additive manufacturing: A review,” Journal of Materials
Engineering and Performance, vol. 23, no. 6. Springer New York LLC, pp. 1917–
1928, Apr. 08, 2014, doi: 10.1007/s11665-014-0958-z.
[12] S. Yuan, F. Shen, C. K. Chua, and K. Zhou, “Polymeric composites for powder-based
additive manufacturing: Materials and applications,” Progress in Polymer Science, vol.
91. Elsevier Ltd, pp. 141–168, Apr. 01, 2019, doi:
10.1016/j.progpolymsci.2018.11.001.
[13] L. E. Murr et al., “Fabrication of metal and alloy components by additive
manufacturing: Examples of 3D materials science,” Journal of Materials Research and
Technology, vol. 1, no. 1. Elsevier Editora Ltda, pp. 42–54, Apr. 01, 2012, doi:
10.1016/S2238-7854(12)70009-1.
[14] S. Cooke, K. Ahmadi, S. Willerth, and R. Herring, “Metal additive manufacturing:
Technology, metallurgy and modelling,” Journal of Manufacturing Processes, vol. 57.
Elsevier Ltd, pp. 978–1003, Sep. 01, 2020, doi: 10.1016/j.jmapro.2020.07.025.
[15] S. C. Daminabo, S. Goel, S. A. Grammatikos, H. Y. Nezhad, and V. K. Thakur, “Fused
deposition modeling-based additive manufacturing (3D printing): techniques for
polymer material systems,” Materials Today Chemistry, vol. 16. Elsevier Ltd, p.
100248, Jun. 01, 2020, doi: 10.1016/j.mtchem.2020.100248.
50
[16] S. C. Ligon, R. Liska, J. Stampfl, M. Gurr, and R. Mülhaupt, “Polymers for 3D
Printing and Customized Additive Manufacturing,” Chemical Reviews, vol. 117, no.
15. American Chemical Society, pp. 10212–10290, Aug. 09, 2017, doi:
10.1021/acs.chemrev.7b00074.
[17] B. N. Turner and S. A. Gold, “A review of melt extrusion additive manufacturing
processes: II. Materials, dimensional accuracy, and surface roughness,” Rapid
Prototyping Journal, vol. 21, no. 3. Emerald Group Publishing Ltd., pp. 250–261, Apr.
20, 2015, doi: 10.1108/RPJ-02-2013-0017.
[18] B. Khoshnevis, “Automated construction by contour crafting - Related robotics and
information technologies,” in Automation in Construction, Jan. 2004, vol. 13, no. 1, pp.
5–19, doi: 10.1016/j.autcon.2003.08.012.
[19] F. Hamidi and F. Aslani, “Additive manufacturing of cementitious composites:
Materials, methods, potentials, and challenges,” Construction and Building Materials,
vol. 218. Elsevier Ltd, pp. 582–609, Sep. 10, 2019, doi:
10.1016/j.conbuildmat.2019.05.140.
[20] A. Paolini, S. Kollmannsberger, and E. Rank, “Additive manufacturing in construction:
A review on processes, applications, and digital planning methods,” Additive
Manufacturing, vol. 30. Elsevier B.V., p. 100894, Dec. 01, 2019, doi:
10.1016/j.addma.2019.100894.
[21] A. Habib and B. Khoda, “Development of clay based novel hybrid bio-ink for 3D bio-
printing process,” J. Manuf. Process., vol. 38, pp. 76–87, Feb. 2019, doi:
10.1016/j.jmapro.2018.12.034.
[22] S. V. Murphy and A. Atala, “3D bioprinting of tissues and organs,” Nature
Biotechnology, vol. 32, no. 8. Nature Publishing Group, pp. 773–785, 2014, doi:
10.1038/nbt.2958.
[23] J. Malda et al., “25th anniversary article: Engineering hydrogels for biofabrication,”
Advanced Materials, vol. 25, no. 36. John Wiley & Sons, Ltd, pp. 5011–5028, Sep. 01,
2013, doi: 10.1002/adma.201302042.
[24] C. J. Thrasher, “Advanced Methods and Materials for Vat Photopolymerization
Additive Manufacturing,” 2017.
[25] H. Wu et al., “Recent developments in polymers/polymer nanocomposites for additive
manufacturing,” Progress in Materials Science, vol. 111. Elsevier Ltd, p. 100638, Jun.
01, 2020, doi: 10.1016/j.pmatsci.2020.100638.
[26] F. Li et al., “Digital light processing 3D printing of ceramic shell for precision
casting,” Mater. Lett., vol. 276, p. 128037, Oct. 2020, doi:
10.1016/j.matlet.2020.128037.
[27] A. R. Johnson et al., “Single-step fabrication of computationally designed
microneedles by continuous liquid interface production,” PLoS One, vol. 11, no. 9,
Sep. 2016, doi: 10.1371/journal.pone.0162518.
[28] P. Gu, X. Zhang, Y. Zeng, and B. Ferguson, “Quality analysis and optimization of solid
ground curing process,” J. Manuf. Syst., vol. 20, no. 4, pp. 250–263, Jan. 2001, doi:
10.1016/S0278-6125(01)80045-5.
[29] J. Y. Lee, J. An, and C. K. Chua, “Fundamentals and applications of 3D printing for
novel materials,” Applied Materials Today, vol. 7. Elsevier Ltd, pp. 120–133, Jun. 01,
2017, doi: 10.1016/j.apmt.2017.02.004.
[30] M. Ziaee and N. B. Crane, “Binder jetting: A review of process, materials, and
methods,” Additive Manufacturing, vol. 28. Elsevier B.V., pp. 781–801, Aug. 01, 2019,
doi: 10.1016/j.addma.2019.05.031.
[31] S. Yi, F. Liu, J. Zhang, and S. Xiong, “Study of the key technologies of LOM for
51
functional metal parts,” in Journal of Materials Processing Technology, Jul. 2004, vol.
150, no. 1–2, pp. 175–181, doi: 10.1016/j.jmatprotec.2004.01.035.
[32] A. Bournias-Varotsis, X. Han, R. A. Harris, and D. S. Engstrøm, “Ultrasonic additive
manufacturing using feedstock with build-in circuitry for 3D metal embedded
electronics,” Addit. Manuf., vol. 29, p. 100799, Oct. 2019, doi:
10.1016/j.addma.2019.100799.
[33] S. M. Thompson, L. Bian, N. Shamsaei, and A. Yadollahi, “An overview of Direct
Laser Deposition for additive manufacturing; Part I: Transport phenomena, modeling
and diagnostics,” Additive Manufacturing, vol. 8. Elsevier B.V., pp. 36–62, Oct. 01,
2015, doi: 10.1016/j.addma.2015.07.001.
[34] O. US EPA, “Sustainable Manufacturing,” Accessed: Aug. 21, 2020. [Online].
Available: https://www.epa.gov/sustainability/sustainable-manufacturing.
[35] T. Sustainable and D. Goals, “The sustainable development goals report 2016,”
Sustain. Dev. goals Rep. 2016, 2016, doi:
10.29171/azu_acku_pamphlet_k3240_s878_2016.
[36] S. H. Huang, P. Liu, A. Mokasdar, and L. Hou, “Additive manufacturing and its
societal impact: A literature review,” International Journal of Advanced
Manufacturing Technology, vol. 67, no. 5–8. Springer, pp. 1191–1203, Jul. 16, 2013,
doi: 10.1007/s00170-012-4558-5.
[37] A. Townsend, N. Senin, L. Blunt, R. K. Leach, and J. S. Taylor, “Surface texture
metrology for metal additive manufacturing: a review,” Precision Engineering, vol. 46.
Elsevier Inc., pp. 34–47, Oct. 01, 2016, doi: 10.1016/j.precisioneng.2016.06.001.
[38] J. S. Taylor, “Physical processes linking input parameters and surfacemorphology in
additivemanufacturing,” ASPE Spring Top. Precis. Toler. Addit., pp. 70–1, 2015.
[39] V. Reddy, O. Flys, A. Chaparala, C. E. Berrimi, V. Amogh, and B. G. Rosen, “Study
on surface texture of Fused Deposition Modeling,” in Procedia Manufacturing, 2018,
vol. 25, pp. 389–396, doi: 10.1016/j.promfg.2018.06.108.
[40] Stephen Oluwashola Akande, “Dimensional Accuracy and Surface Finish Optimization
of Fused Deposition Modelling Parts using Desirability Function Analysis,” Int. J. Eng.
Res., vol. V4, no. 04, pp. 196–202, 2015, doi: 10.17577/ijertv4is040393.
[41] D. Ahn, H. Kim, and S. Lee, “Surface roughness prediction using measured data and
interpolation in layered manufacturing,” J. Mater. Process. Technol., vol. 209, no. 2,
pp. 664–671, Jan. 2009, doi: 10.1016/j.jmatprotec.2008.02.050.
[42] H. I. Medellin-Castillo and J. Zaragoza-Siqueiros, “Design and Manufacturing
Strategies for Fused Deposition Modelling in Additive Manufacturing: A Review,”
Chinese J. Mech. Eng. (English Ed., vol. 32, no. 1, 2019, doi: 10.1186/s10033-019-
0368-0.
[43] R. E. Williams and V. L. Melton, “Abrasive flow finishing of stereolithography
prototypes,” Rapid Prototyp. J., vol. 4, no. 2, pp. 56–67, 1998, doi:
10.1108/13552549810207279.
[44] K. F. Leong, C. K. Chua, G. S. Chua, and C. H. Tan, “Abrasive jet deburring of
jewellery models built by stereolithography apparatus (SLA),” J. Mater. Process.
Technol., vol. 83, no. 1–3, pp. 36–47, Nov. 1998, doi: 10.1016/S0924-0136(98)00041-
7.
[45] A. P. Nagalingam, H. K. Yuvaraj, and S. H. Yeo, “Synergistic effects in hydrodynamic
cavitation abrasive finishing for internal surface-finish enhancement of additive-
manufactured components,” Addit. Manuf., vol. 33, p. 101110, May 2020, doi:
10.1016/j.addma.2020.101110.
[46] O. FLYS et al., “Heat transfer and flow performance in additively manufactured
52
cooling channels with varying surface topography,” J. Japan Soc. Precis. Eng., vol. 86,
no. 1, pp. 71–79, Jan. 2020, doi: 10.2493/jjspe.86.71.
[47] R. C. Mulhall and N. D. Nedas, “Impact blasting with glass beads,” Met. Finish., vol.
105, no. 10, pp. 65–71, Jan. 2007, doi: 10.1016/S0026-0576(07)80319-9.
[48] M. Taufik and P. K. Jain, “Laser assisted finishing process for improved surface finish
of fused deposition modelled parts,” J. Manuf. Process., vol. 30, pp. 161–177, Dec.
2017, doi: 10.1016/j.jmapro.2017.09.020.
[49] E. Yasa, J. Deckers, and J. P. Kruth, “The investigation of the influence of laser re-
melting on density, surface quality and microstructure of selective laser melting parts,”
Rapid Prototyp. J., vol. 17, no. 5, pp. 312–327, Aug. 2011, doi:
10.1108/13552541111156450.
[50] S. Hallmann, T. Wolny, and C. Emmelmann, “Post-processing of additively
manufactured cutting edges by laser ablation,” in Procedia CIRP, Jan. 2018, vol. 74,
pp. 276–279, doi: 10.1016/j.procir.2018.08.110.
[51] A. Lalehpour, C. Janeteas, and A. Barari, “Surface roughness of FDM parts after post-
processing with acetone vapor bath smoothing process,” Int. J. Adv. Manuf. Technol.,
vol. 95, no. 1–4, pp. 1505–1520, Mar. 2018, doi: 10.1007/s00170-017-1165-5.
[52] L. Blunt and X. Jiang, Advanced Techniques for Assessment Surface Topography:
Development of a Basis for 3D Surface Texture Standards “Surfstand.” Elsevier Inc.,
2003.
[53] D. J. Whitehouse, “Surface metrology,” Meas. Sci. Technol., vol. 8, no. 9, pp. 955–972,
1997, doi: 10.1088/0957-0233/8/9/002.
[54] R. Leach, “Surface Texture,” in CIRP Encyclopedia of Production Engineering, L.
Laperrière and G. Reinhart, Eds. Springer Berlin Heidelberg, 2014, pp. 1–4.
[55] “ISO 25178-6:2010(en), Geometrical product specifications (GPS) — Surface texture:
Areal — Part 6: Classification of methods for measuring surface texture.”
https://www.iso.org/obp/ui#iso:std:iso:25178:-6:ed-1:v1:en:biblref:13 (accessed Aug.
05, 2020).
[56] R. Leach, “Characterisation of areal surface texture,” Characterisation Areal Surf.
Texture, vol. 9783642364, pp. 1–353, 2013, doi: 10.1007/978-3-642-36458-7.
[57] “ISO 3274:1997, Geometrical Product Specifications (GPS) — Surface texture: Profile
method — Nominal characteristics of contact (stylus) instruments.”
https://www.iso.org/obp/ui/#iso:std:iso:3274:ed-2:v1:en (accessed Aug. 07, 2020).
[58] K. Creath, “V Phase-Measurement Interferometry Techniques,” Prog. Opt., vol. 26, no.
C, pp. 349–393, Jan. 1988, doi: 10.1016/S0079-6638(08)70178-1.
[59] G. E. Sommargren, “Optical heterodyne profilometry,” Appl. Opt., vol. 20, no. 4, p.
610, Feb. 1981, doi: 10.1364/ao.20.000610.
[60] J. M. Eastman and J. M. Zavislan, “A New Optical Surface Microprofiling
Instrument,” in Precision Surface Metrology, 1983, vol. 0429, pp. 56–64, doi:
10.1117/12.936340.
[61] T. Grimm, G. Wiora, and G. Witt, “Characterization of typical surface effects in
additive manufacturing with confocal microscopy,” Surf. Topogr. Metrol. Prop., vol. 3,
no. 1, p. 014001, Jan. 2015, doi: 10.1088/2051-672X/3/1/014001.
[62] L. Newton et al., “Areal topography measurement of metal additive surfaces using
focus variation microscopy,” Addit. Manuf., vol. 25, pp. 365–389, Jan. 2019, doi:
10.1016/j.addma.2018.11.013.
[63] A. V. Krishna, O. Flys, V. V Reddy, and B. G. Rosén, “Surface topography
characterization using 3D stereoscopic reconstruction of SEM images,” Surf. Topogr.
Metrol. Prop., vol. 6, no. 2, p. 024006, May 2018, doi: 10.1088/2051-672X/AABDE1.

53
[64] G. Ercolano et al., “Additive manufacturing of sub-micron to sub-mm Metal structures
with hollow AFM cantilevers,” Micromachines, vol. 11, no. 1, Jan. 2020, doi:
10.3390/mi11010006.
[65] “ASTM F1048 - 87(1999) Standard Test Method for Measuring the Effective Surface
Roughness of Optical Components by Total Integrated Scattering (Withdrawn 2003).”
www.astm.org (accessed Aug. 28, 2020).
[66] J. M. Bennett and L. Mattsson, Introduction to Surface Roughness and Scattering.
Optical Society of America, 1989.
[67] B. J. N, F. R. E, and S. L. Y, “A capacitance-based surface texture measuring system.,”
CIRP Ann, vol. 26, no. 1, pp. 375–377, 1977, Accessed: Aug. 28, 2020. [Online].
Available: https://jglobal.jst.go.jp/en/detail?JGLOBAL_ID=201002027345082954.
[68] A. M. Hamouda, “A precise pneumatic co-axial jet gauging system for surface
roughness measurements,” Precis. Eng., vol. 1, no. 2, pp. 95–100, Apr. 1979, doi:
10.1016/0141-6359(79)90140-5.
[69] V. Radhakrishnan, “Effect of stylus radius on the roughness values measured with
tracing stylus instruments,” Wear, vol. 16, no. 5, pp. 325–335, Nov. 1970, doi:
10.1016/0043-1648(70)90099-2.
[70] M. Piska and J. Metelkova, “On the comparison of contact and non-contact evaluations
of a machined surface,” MM Sci. J., no. June 2014, pp. 476–479, 2014, doi:
10.17973/mmsj.2014_06_201408.
[71] S. H. R. Ali, “Advanced Nanomeasuring Techniques for Surface Characterization,”
ISRN Opt., vol. 2012, pp. 1–23, 2012, doi: 10.5402/2012/859353.
[72] “ISO - ISO 25178-602:2010 - Geometrical product specifications (GPS) — Surface
texture: Areal — Part 602: Nominal characteristics of non-contact (confocal chromatic
probe) instruments.” https://www.iso.org/standard/43920.html (accessed Aug. 05,
2020).
[73] F. Cabanettes et al., “Topography of as built surfaces generated in metal additive
manufacturing: A multi scale analysis from form to roughness,” Precis. Eng., vol. 52,
pp. 249–265, Apr. 2018, doi: 10.1016/j.precisioneng.2018.01.002.
[74] C. Bermudez, A. Matilla, and A. Aguerri, “Confocal fusion: towards the universal
optical 3D metrology technology,” in EUSPEN - LAMDAMAP, 2017.
[75] A. Matilla, J. Mariné, J. Pérez, C. Cadevall, and R. Artigas, “Three-dimensional
measurements with a novel technique combination of confocal and focus variation with
a simultaneous scan,” in Proceedings of the 16th International Conference of the
European Society for Precision Engineering and Nanotechnology, EUSPEN 2016, Apr.
2016, vol. 9890, p. 98900B, doi: 10.1117/12.2227054.
[76] O. Flys, J. Berglund, and B. G. Rosen, “Using confocal fusion for measurement of
metal AM surface texture,” Surf. Topogr. Metrol. Prop., vol. 8, no. 2, 2020, doi:
10.1088/2051-672X/ab84c3.
[77] “ISO 25178-2:2012(en), Geometrical product specifications (GPS) — Surface texture:
Areal — Part 2: Terms, definitions and surface texture parameters.”
https://www.iso.org/obp/ui/#iso:std:iso:25178:-2:ed-1:v1:en (accessed Aug. 09, 2020).
[78] F. Blateyron and A. Caulcutt, “3D Imaging and Analysis,” Imaging Microsc., vol. 8,
no. 3, pp. 42–43, 2006, doi: 10.1002/imic.200790094.
[79] “ISO 16610-1:2015(en), Geometrical product specifications (GPS) — Filtration — Part
1: Overview and basic concepts.” https://www.iso.org/obp/ui/#iso:std:iso:16610:-1:ed-
1:v1:en (accessed Aug. 07, 2020).
[80] O. Flys, “On surface structure characterization and application on additive
manufacturing,” 2020, Accessed: Aug. 07, 2020. [Online]. Available:
54
https://research.chalmers.se/en/publication/516839.
[81] “ISO 4288:1996(en), Geometrical Product Specifications (GPS) — Surface texture:
Profile method — Rules and procedures for the assessment of surface texture.”
https://www.iso.org/obp/ui/#iso:std:iso:4288:ed-2:v1:en:sec:B (accessed Aug. 09,
2020).
[82] “ISO 16610-21:2011(en), Geometrical product specifications (GPS) — Filtration —
Part 21: Linear profile filters: Gaussian filters.”
https://www.iso.org/obp/ui/#iso:std:iso:16610:-21:ed-1:v1:en (accessed Aug. 09,
2020).
[83] “Profile parameters from ISO 4287 - Surface Metrology Guide - Digital Surf.”
https://guide.digitalsurf.com/en/guide-iso-4287-parameters.html (accessed Aug. 09,
2020).
[84] T. R. Thomas, Rough Surfaces. PUBLISHED BY IMPERIAL COLLEGE PRESS
AND DISTRIBUTED BY WORLD SCIENTIFIC PUBLISHING CO., 1998.
[85] “ISO 4287:1997(en,fr), Geometrical Product Specifications (GPS) — Surface texture:
Profile method — Terms, definitions and surface texture parameters / Spécification
géométrique des produits (GPS) — État de surface: Méthode du profil — Termes,
définitions et paramètres d’état de surface.”
https://www.iso.org/obp/ui#iso:std:iso:4287:ed-1:v1:en,fr (accessed Aug. 05, 2020).
[86] M. C. Salcedo, I. B. Coral, and G. V. Ochoa, “Characterization of Surface Topography
with Abbott Firestone Curve,” Contemp. Eng. Sci., vol. 11, no. 68, pp. 3397–3407,
2018, doi: 10.12988/ces.2018.87319.
[87] F. Blateyron, “Stratified Surface,” in CIRP Encyclopedia of Production Engineering,
Springer Berlin Heidelberg, 2018, pp. 1–7.
[88] ASME, B46.1:2002 Surface Texture (Surface Roughness, Waviness, and Lay) - ASME.
2002.
[89] R. N. Youngworth, B. B. Gallagher, and B. L. Stamper, “An overview of power
spectral density (PSD) calculations,” Opt. Manuf. Test. VI, vol. 5869, no. August 2005,
p. 58690U, 2005, doi: 10.1117/12.618478.
[90] E. Sidick, “Power spectral density specification and analysis of large optical surfaces,”
Model. Asp. Opt. Metrol. II, vol. 7390, no. June 2009, p. 73900L, 2009, doi:
10.1117/12.823844.
[91] T. D. B. Jacobs, T. Junge, and L. Pastewka, “Quantitative characterization of surface
topography using spectral analysis,” Surf. Topogr. Metrol. Prop., vol. 5, no. 1, 2017,
doi: 10.1088/2051-672X/aa51f8.
[92] C. A. Brown, “Areal fractal methods,” in Characterisation of Areal Surface Texture,
vol. 9783642364587, Springer-Verlag Berlin Heidelberg, 2013, pp. 129–153.
[93] C. A. Brown, W. A. Johnsen, R. M. Butland, and J. Bryan, “Scale-Sensitive Fractal
Analysis of Turned Surfaces,” CIRP Ann. - Manuf. Technol., vol. 45, no. 1, pp. 515–
518, Jan. 1996, doi: 10.1016/S0007-8506(07)63114-X.
[94] J. Berglund, Characterisation of Functional Pressing Die Surfaces. Chalmers
University of Technology, 2011.
[95] C. A. Brown et al., “Multiscale analyses and characterizations of surface
topographies,” CIRP Ann., vol. 67, no. 2, pp. 839–862, Jan. 2018, doi:
10.1016/j.cirp.2018.06.001.
[96] N. Senin, A. Thompson, and R. Leach, “Feature-based characterisation of signature
topography in laser powder bed fusion of metals,” Meas. Sci. Technol., vol. 29, no. 4,
p. 045009, Mar. 2018, doi: 10.1088/1361-6501/aa9e19.
[97] S. Lou, W. Zeng, L. Pagani, H. Abdul-Rahman, X. Jiang, and P. J. Scott,
55
“Development of Surface Characterisation Toolbox for Additive Manufactured
Components: from Planar Layer Surfaces to Complex Functional Surfaces.” Accessed:
Aug. 17, 2020. [Online]. Available: www.euspen.eu.
[98] A. Boschetto, L. Bottini, and F. Veniali, “Roughness modeling of AlSi10Mg parts
fabricated by selective laser melting,” J. Mater. Process. Technol., vol. 241, pp. 154–
163, Mar. 2017, doi: 10.1016/j.jmatprotec.2016.11.013.
[99] B. G. Rosen, A. Fall, S. Rosen, A. Farbrot, and P. Bergström, “Topographic modelling
of haptic properties of tissue products,” in Journal of Physics: Conference Series,
2014, vol. 483, no. 1, doi: 10.1088/1742-6596/483/1/012010.
[100] S. Chatterjee and J. S. Simonoff, Handbook of Regression Analysis. Somerset,
UNITED STATES: John Wiley & Sons, Incorporated, 2012.
[101] J. Berglund and B. G. Rosén, “A method development for correlation of surface finish
appearance of die surfaces and roughness measurement data,” Tribol. Lett., vol. 36, no.
2, pp. 157–164, Nov. 2009, doi: 10.1007/s11249-009-9470-2.
[102] “ISO/ASTM 52902:2019(en), Additive manufacturing — Test artifacts — Geometric
capability assessment of additive manufacturing systems.”
https://www.iso.org/obp/ui/#iso:std:iso-astm:52902:ed-1:v1:en (accessed Aug. 09,
2020).
[103] P. Reeves and R. Cobb, “Surface deviation modeling of LMT Processes–a comparative
analysis,” Proc. Fifth Eur. Conf. Rapid Prototyp. Manuf., Jun. 1995.
[104] A. K. Sood, R. K. Ohdar, and S. S. Mahapatra, “Improving dimensional accuracy of
Fused Deposition Modelling processed part using grey Taguchi method,” Mater. Des.,
vol. 30, no. 10, pp. 4243–4252, Dec. 2009, doi: 10.1016/j.matdes.2009.04.030.


![topography LC session15A [Mode de compatibilité]Garbacz A., Courard L., Kostana K. (2006) Materials Characterization, 56: 281-289 Scarification Water jetting Topography evaluation](https://img.pdfslide.net/doc/110x75/6063696843cbe33f8f5718c7/topography-lc-session15a-mode-de-compatibilit-garbacz-a-courard-l-kostana.jpg)


![X-ray topography characterization of gallium nitride ... · yieldanddegradeddeviceperformance. ToovercomethelimitationsofusingforeignsubstratesforHVPE growth,patternedgrowthmethods[9]havebeendevelopedtolower](https://img.pdfslide.net/doc/110x75/605f2370cc73e40b430eaa3f/x-ray-topography-characterization-of-gallium-nitride-yieldanddegradeddeviceperformance.jpg)