Embed Size (px)
Citation preview

Towards universal access: scaling up priority HIV/AIDS interventions in the
health sector
Progress report 2009
Slide set – six summary data slides and all 40 figures from the report

Towards universal access: progress report 2009 | 18 April 20232 |
Increase in antiretroviral therapy in low- and middle-income countries, adults and children [combined], December 2007–December 2008
Increase in antiretroviral therapy in low- and middle-income countries, adults and children [combined], December 2007–December 2008
Geographical region Number of people receiving ARV
therapy
December 2008
Number of people receiving
ARV therapy
December 2007
Increasein one
year
Sub-Saharan Africa 2 925 000 2 100 000 39%
Latin America and the Caribbean 445 000 390 000 14%
East, South and South-East Asia 565 000 420 000 35%
Europe and Central Asia 85 000 54 000 39%
North Africa and the Middle East 10 000 7 000 43%
Total 4 030 000 [3.7–4.4 million]
2 970 000[2.7–3.3 million]
36%

Towards universal access: progress report 2009 | 18 April 20233 |
Antiretroviral therapy coverage in low- and middle-income countries, adults and children [combined], December 2008
Antiretroviral therapy coverage in low- and middle-income countries, adults and children [combined], December 2008
Geographical region Estimated number of people receiving
ARV therapy
Estimated number of people
needing ARV therapy
Antiretroviral therapy
coverage
Sub-Saharan Africa 2 925 000 6 700 000 44%
Latin America and the Caribbean 445 000 820 000 54%
East, South and South-East Asia 565 000 1 500 000 37%
Europe and Central Asia 85 000 370 000 23%
North Africa and the Middle East 10 000 68 000 14%
Total 4 030 000 [3.7–4.4 million]
9 500 000[8.6–10 million]
42%[40–47%]

Towards universal access: progress report 2009 | 18 April 20234 |
Antiretroviral therapy coverage in low- and middle-income countries, adults (≥15 years), December 2008
Antiretroviral therapy coverage in low- and middle-income countries, adults (≥15 years), December 2008
Geographical region Reported number of adults (≥15
years) receiving ARV therapy
Estimated number of adults
needing ARV therapy
Antiretroviral therapy
coverage
Sub-Saharan Africa 2 700 000 6 100 000 44%
Latin America and the Caribbean 429 000 800 000 54%
East, South and South-East Asia 537 000 1 500 000 36%
Europe and Central Asia 80 000 370 000 22%
North Africa and the Middle East 9 400 62 000 15%
Total 3 755 000 8 800 000[8.1–9.5 million]
43%[39–46%]

Towards universal access: progress report 2009 | 18 April 20235 |
Antiretroviral therapy coverage in low- and middle-income countries, children (0–14 years), December 2008
Antiretroviral therapy coverage in low- and middle-income countries, children (0–14 years), December 2008
Geographical region Reported number of children (0–14 years) receiving
ARV therapy
Estimated number of
children needing ARV therapy
Antiretroviral therapy
coverage
Sub-Saharan Africa 224 900 640 000 35%
Latin America and the Caribbean 16 100 21 000 76%
East, South and South-East Asia 30 000 58 000 52%
Europe and Central Asia 4 200 4 900 85%
North Africa and the Middle East 400 6 700 6%
Total 275 700 730 000[580 000–880 000]
38%[31–47%]

Towards universal access: progress report 2009 | 18 April 20236 |
Prevention of mother-to-child transmission coverage in low- and middle-income countries, December 2008
Prevention of mother-to-child transmission coverage in low- and middle-income countries, December 2008
Geographical region Reported number of pregnant
women living with HIV receiving
ARVs for PMTCT
Estimated number of
pregnant women living with HIV
needing ARVs for PMTCT
Prevention of mother-to-
child transmission
coverage
Sub-Saharan Africa 576 800 1 280 000 45%
Latin America and the Caribbean 17 100 32 000 54%
East, South and South-East Asia 21 700 85 000 25%
Europe and Central Asia 12 600 13 400 94%
North Africa and the Middle East <200 13 400 1%
Total 628 400 1 400 000[1.1–1.7 million]
45%[37–57%]

Towards universal access: progress report 2009 | 18 April 20237 |
Number of people receiving antiretroviral therapy in low- and middle-income countries, by region, 2002–2008
Number of people receiving antiretroviral therapy in low- and middle-income countries, by region, 2002–2008
0.0
0.5
1.0
1.5
2.0
2.5
3.0
3.5
4.0
4.5
End 2002 End 2003 End 2004 End 2005 End 2006 End 2007 End 2008
Mill
ion
s
North Africa and the Middle East
Europe and Central Asia
East, South and South-East Asia
Latin America and the Caribbean
Sub-Saharan Africa

Towards universal access: progress report 2009 | 18 April 20238 |
Fig. 2.1. Transaction volumes of rapid HIV tests, 2004–2008Fig. 2.1. Transaction volumes of rapid HIV tests, 2004–2008

Towards universal access: progress report 2009 | 18 April 20239 |
Fig. 2.2. Reported number of health facilities providing HIV testing and counselling services in low- and middle-income countries with comparable data, by region, 2007 and 2008
Fig. 2.2. Reported number of health facilities providing HIV testing and counselling services in low- and middle-income countries with comparable data, by region, 2007 and 2008

Towards universal access: progress report 2009 | 18 April 202310 |
Fig. 2.3. Percentage of women with HIV testing and counselling and percentage of women with secondary or
higher education, district comprehensive assessment districts in Burkina Faso, Haiti and Zambia, 2008
Fig. 2.3. Percentage of women with HIV testing and counselling and percentage of women with secondary or
higher education, district comprehensive assessment districts in Burkina Faso, Haiti and Zambia, 2008

Towards universal access: progress report 2009 | 18 April 202311 |
Fig. 2.4. Percentage of women and men receiving an HIV test and test results in the 12 months preceding the survey in
countries with repeat population surveys, 2003–2008
Fig. 2.4. Percentage of women and men receiving an HIV test and test results in the 12 months preceding the survey in
countries with repeat population surveys, 2003–2008

Towards universal access: progress report 2009 | 18 April 202312 |
Fig. 2.5. Percentage of women and men (≥15 years) who had ever received an HIV test and test results, South Africa, 2002,
2005 and 2008
Fig. 2.5. Percentage of women and men (≥15 years) who had ever received an HIV test and test results, South Africa, 2002,
2005 and 2008

Towards universal access: progress report 2009 | 18 April 202313 |
Fig. 3.1. Situation analysis of harm reduction interventions in the Middle East and North Africa at baseline, 2008
Fig. 3.1. Situation analysis of harm reduction interventions in the Middle East and North Africa at baseline, 2008

Towards universal access: progress report 2009 | 18 April 202314 |
Fig. 3.2. Blood donation per 1000 population, 2007Fig. 3.2. Blood donation per 1000 population, 2007

Towards universal access: progress report 2009 | 18 April 202315 |
Fig. 4.1. Number of people receiving antiretroviral therapy in low- and middle-income countries, by region, 2002–2008
Fig. 4.1. Number of people receiving antiretroviral therapy in low- and middle-income countries, by region, 2002–2008

Towards universal access: progress report 2009 | 18 April 202316 |
Fig. 4.2. Measuring attrition from antiretroviral therapy programmes
Fig. 4.2. Measuring attrition from antiretroviral therapy programmes

Towards universal access: progress report 2009 | 18 April 202317 |
Fig. 4.3. Retention on antiretroviral therapy at 12 months after initiation of treatment in 61 low- and middle-income countries
by region, 2008
Fig. 4.3. Retention on antiretroviral therapy at 12 months after initiation of treatment in 61 low- and middle-income countries
by region, 2008

Towards universal access: progress report 2009 | 18 April 202318 |
Fig. 4.4. 12-month retention of people receiving antiretroviral therapy in selected treatment sites, Papua New Guinea, 2008Fig. 4.4. 12-month retention of people receiving antiretroviral therapy in selected treatment sites, Papua New Guinea, 2008

Towards universal access: progress report 2009 | 18 April 202319 |
Fig. 4.5. Trends in retention on antiretroviral therapy in low- and middle-income countries by region, 2008
Fig. 4.5. Trends in retention on antiretroviral therapy in low- and middle-income countries by region, 2008

Towards universal access: progress report 2009 | 18 April 202320 |
Fig. 4.6. Trends over time in the median CD4 count at baseline count of 36 715 adults starting antiretroviral therapy between
2001 and 2006
Fig. 4.6. Trends over time in the median CD4 count at baseline count of 36 715 adults starting antiretroviral therapy between
2001 and 2006

Towards universal access: progress report 2009 | 18 April 202321 |
Fig. 4.7. Antiretroviral therapy coverage and all-cause mortality in South Africa, 2003–2006
Fig. 4.7. Antiretroviral therapy coverage and all-cause mortality in South Africa, 2003–2006

Towards universal access: progress report 2009 | 18 April 202322 |
Fig. 4.8. Countries implementing at least one element of the WHO Global Strategy for the Prevention and Assessment of HIV Drug Resistance and locations of HIV drug resistance
testing laboratories, February 2009
Fig. 4.8. Countries implementing at least one element of the WHO Global Strategy for the Prevention and Assessment of HIV Drug Resistance and locations of HIV drug resistance
testing laboratories, February 2009
Towards universal access: progress report 2009 | 18 April 202323 |
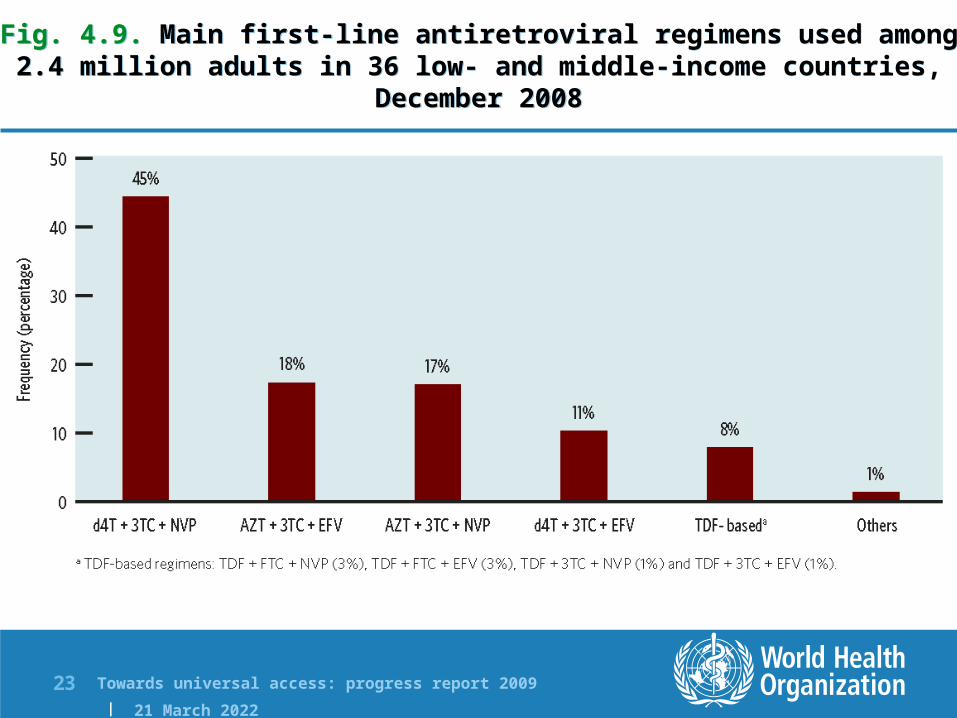
Fig. 4.9. Main first-line antiretroviral regimens used among 2.4 million adults in 36 low- and middle-income countries,
December 2008
Fig. 4.9. Main first-line antiretroviral regimens used among 2.4 million adults in 36 low- and middle-income countries,
December 2008

Towards universal access: progress report 2009 | 18 April 202324 |
Fig. 4.10. Main second-line antiretroviral regimens used among adults (n=51 135) in 36 low- and middle-income countries,
December 2008
Fig. 4.10. Main second-line antiretroviral regimens used among adults (n=51 135) in 36 low- and middle-income countries,
December 2008

Towards universal access: progress report 2009 | 18 April 202325 |
Fig. 4.11. First-line regimens used among children (n=177 064) in 36 low- and middle-income countries, December 2008
Fig. 4.11. First-line regimens used among children (n=177 064) in 36 low- and middle-income countries, December 2008

Towards universal access: progress report 2009 | 18 April 202326 |
Fig. 4.12. Second-line regimens used among children (n=5997) in 35 low- and middle-income countries, December 2008
Fig. 4.12. Second-line regimens used among children (n=5997) in 35 low- and middle-income countries, December 2008

Towards universal access: progress report 2009 | 18 April 202327 |
Fig. 4.13. Median annual cost (in US dollars) of first-line antiretroviral drug regimens in low-income countries by year,
2004–2008
Fig. 4.13. Median annual cost (in US dollars) of first-line antiretroviral drug regimens in low-income countries by year,
2004–2008

Towards universal access: progress report 2009 | 18 April 202328 |
Fig. 4.14. Median annual cost (in US dollars) of first-line antiretroviral drug regimens in lower-middle-income countries
by year, 2004–2008
Fig. 4.14. Median annual cost (in US dollars) of first-line antiretroviral drug regimens in lower-middle-income countries
by year, 2004–2008

Towards universal access: progress report 2009 | 18 April 202329 |
Fig. 4.15. Median price (in US dollars) of first-line antiretroviral drug regimens in upper-middle-income countries by year,
2004–2008
Fig. 4.15. Median price (in US dollars) of first-line antiretroviral drug regimens in upper-middle-income countries by year,
2004–2008

Towards universal access: progress report 2009 | 18 April 202330 |
Fig. 4.16. Estimated HIV prevalence (%) among people newly infected with TB, 2007
Fig. 4.16. Estimated HIV prevalence (%) among people newly infected with TB, 2007

Towards universal access: progress report 2009 | 18 April 202331 |
Fig. 4.17. Rates of HIV testing among people with TB in countries in sub-Saharan Africa, 2004–2007
Fig. 4.17. Rates of HIV testing among people with TB in countries in sub-Saharan Africa, 2004–2007

Towards universal access: progress report 2009 | 18 April 202332 |
Fig. 5.1. Number of low- and middle-income countries with national scale-up plans including population-based targets for preventing mother-to-child transmission and for HIV care and
treatment for children, by region, 2008
Fig. 5.1. Number of low- and middle-income countries with national scale-up plans including population-based targets for preventing mother-to-child transmission and for HIV care and
treatment for children, by region, 2008

Towards universal access: progress report 2009 | 18 April 202333 |
Fig. 5.2. Percentage of women and men aged 15–49 years with comprehensive knowledgea of HIV in countries with recent
population-based surveys (2007–2008)
Fig. 5.2. Percentage of women and men aged 15–49 years with comprehensive knowledgea of HIV in countries with recent
population-based surveys (2007–2008)
Towards universal access: progress report 2009 | 18 April 202334 |
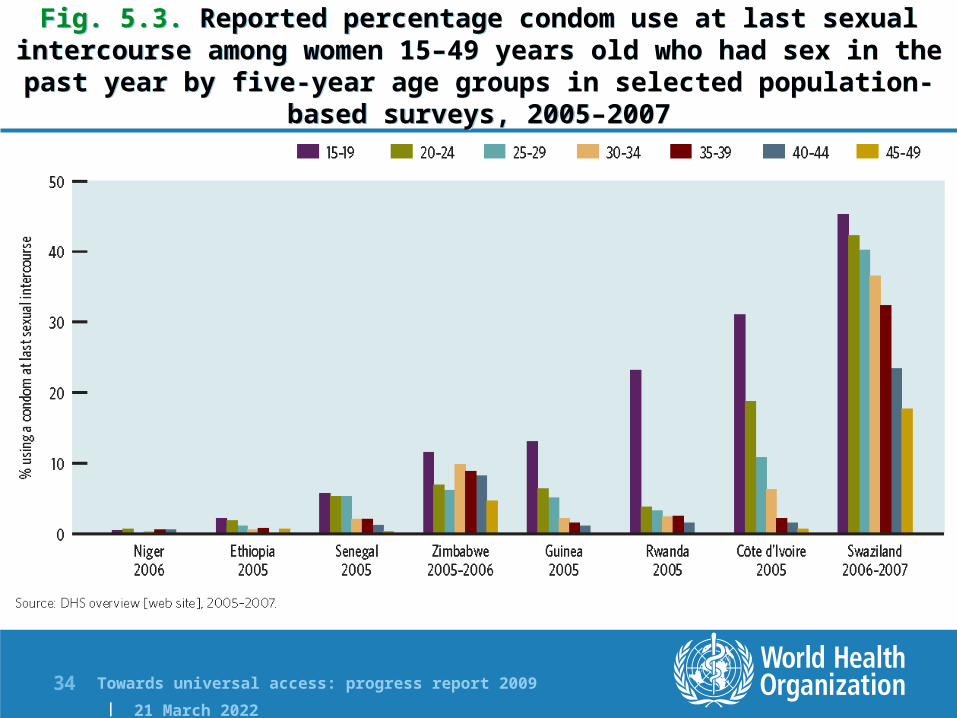
Fig. 5.3. Reported percentage condom use at last sexual intercourse among women 15–49 years old who had sex in the past year by five-year age groups in selected population-based
surveys, 2005–2007
Fig. 5.3. Reported percentage condom use at last sexual intercourse among women 15–49 years old who had sex in the past year by five-year age groups in selected population-based
surveys, 2005–2007

Towards universal access: progress report 2009 | 18 April 202335 |
Fig. 5.4. Unmet need for family planning among married women 15–49 years old (%) in countries with a generalized
epidemic, 2006–2008
Fig. 5.4. Unmet need for family planning among married women 15–49 years old (%) in countries with a generalized
epidemic, 2006–2008

Towards universal access: progress report 2009 | 18 April 202336 |
Fig. 5.5. Percentage of pregnant women who received an HIV test in low- and middle-income countries by region, 2004–
2008a
Fig. 5.5. Percentage of pregnant women who received an HIV test in low- and middle-income countries by region, 2004–
2008a

Towards universal access: progress report 2009 | 18 April 202337 |
Fig. 5.6. Percentage of pregnant women who received an HIV test in Malawi, 2004–2008
Fig. 5.6. Percentage of pregnant women who received an HIV test in Malawi, 2004–2008

Towards universal access: progress report 2009 | 18 April 202338 |
Fig. 5.7. Percentage of pregnant women with HIV receiving antiretrovirals for preventing mother-to-child transmission of HIV in low- and middle-income countries by region, 2004–2008
Fig. 5.7. Percentage of pregnant women with HIV receiving antiretrovirals for preventing mother-to-child transmission of HIV in low- and middle-income countries by region, 2004–2008

Towards universal access: progress report 2009 | 18 April 202339 |
Fig. 5.8. Percentage of pregnant women living with HIV who received antiretrovirals to prevent mother-to-child
transmission of HIV in Côte d’Ivoire, 2005–2008
Fig. 5.8. Percentage of pregnant women living with HIV who received antiretrovirals to prevent mother-to-child
transmission of HIV in Côte d’Ivoire, 2005–2008

Towards universal access: progress report 2009 | 18 April 202340 |
Fig. 5.9. Percentage of pregnant women living with HIV receiving antiretrovirals to prevent the mother-to-child transmission of HIV in 20 countries with the highest HIV
disease burden among pregnant women (in descending order), 2008
Fig. 5.9. Percentage of pregnant women living with HIV receiving antiretrovirals to prevent the mother-to-child transmission of HIV in 20 countries with the highest HIV
disease burden among pregnant women (in descending order), 2008

Towards universal access: progress report 2009 | 18 April 202341 |
Fig. 5.10. Coverage of antiretrovirals to prevent the mother-to-child transmission of HIV, 2008
Fig. 5.10. Coverage of antiretrovirals to prevent the mother-to-child transmission of HIV, 2008

Towards universal access: progress report 2009 | 18 April 202342 |
Fig. 5.11. Percentage distribution of various antiretroviral regimens provided to pregnant women in low- and medium-
income countries in 2007 and 2008, based on available data
Fig. 5.11. Percentage distribution of various antiretroviral regimens provided to pregnant women in low- and medium-
income countries in 2007 and 2008, based on available data

Towards universal access: progress report 2009 | 18 April 202343 |
Fig. 5.12. Contribution of the 20 countries with the largest numbers of women needing antiretrovirals for preventing the mother-to-child transmission of HIV to the global gap to reach
80% of those in need, 2008
Fig. 5.12. Contribution of the 20 countries with the largest numbers of women needing antiretrovirals for preventing the mother-to-child transmission of HIV to the global gap to reach
80% of those in need, 2008

Towards universal access: progress report 2009 | 18 April 202344 |
Fig. 5.13. Coverage of antiretroviral prophylaxis among infants born to mothers living with HIV in low- and middle-income
countries by region, 2008
Fig. 5.13. Coverage of antiretroviral prophylaxis among infants born to mothers living with HIV in low- and middle-income
countries by region, 2008

Towards universal access: progress report 2009 | 18 April 202345 |
Fig. 5.14. Percentage of pregnant women living with HIV and infants born to them who received antiretrovirals for preventing mother-to-child transmission, 2004–2008
Fig. 5.14. Percentage of pregnant women living with HIV and infants born to them who received antiretrovirals for preventing mother-to-child transmission, 2004–2008

Towards universal access: progress report 2009 | 18 April 202346 |
Fig. 5.15. Average age of infants at their first HIV DNA test in Namibia in weeks, 2006–2008
Fig. 5.15. Average age of infants at their first HIV DNA test in Namibia in weeks, 2006–2008

Towards universal access: progress report 2009 | 18 April 202347 |
Fig. 5.16. Percentage of children receiving antiretroviral therapy in low- and middle-income countries, 2005–2008Fig. 5.16. Percentage of children receiving antiretroviral therapy in low- and middle-income countries, 2005–2008