Embed Size (px)
Citation preview
Environmental Research Section A 82, 113}133 (2000)doi:10.1006/enrs.1999.4023, available online at http://www.idealibrary.com on
Toxic Chemicals: Can What We Don’t Know Harm Us?1,2
Peter L. deFur and Lisa Foersom
Center for Environmental Studies, Virginia Commonwealth University, Richmond, Virginia 23284
Received February 2, 1999
The Chesapeake Bay Program began more than 20years ago with assessments of a number of keyareas, relying on measurements of habitats, plantand animal populations, and physical and chemicalconditions. This approach used wildlife as indi-cators of Bay ‘‘health’’ and of potential threats tohuman health. The extent of toxic chemical con-tamination was one of the assessment endpoints inthe original survey. When the initial assessmentwas completed in 1983, the results of Bay-wide sur-veys indicated that several speciAc waterways werecontaminated. These waters, the Elizabeth River,Virginia, the James River, Virginia, and BaltimoreHarbor, Maryland, were targeted for speciAc ac-tions to address the problems of historical and on-going pollution. Over the past 10 years or more, dataon some toxic chemical releases into and levels inthe environment have been collected, but these dataare limited in scope. Furthermore, these data arenot used to assess threats to human health or moregenerally to nonhuman endpoints. New and exist-ing data on environmental levels of chemicals andeffects at low concentrations provide evidence thattoxic chemicals may threaten both human and non-human health in the wider Bay system. ( 2000
Academic Press
Key Words: toxic chemicals; Chesapeake Bay;health; sentinels; endocrine disruptors.
INTRODUCTION
The symposium of which this paper is a part exam-ines the relation between health of the ChesapeakeBay and that of its citizens; this paper focuses ontoxic chemicals. Two compelling reasons prompt an
1 From the symposium ‘‘Health of the Bay;Health of People’’ atthe Center for a Livable Future, The Johns Hopkins University onNovember 13, 1998.
2 This work was supported in part by grants from theChesapeake Bay Foundation (to P.L.d.F.) and the W. Alton JonesFoundation (to V.C.U.). The work reported here did not involveexperimental procedures on humans or laboratory animals.
113
investigation into the relationship between the eco-system health and that of its human inhabitants.The same two reasons explain the widespread publicsupport for Bay programs. First, the citizens of theBay region have long been concerned with the healthof ‘‘their’’ Bay as a resource, and rightly so. Forcenturies, the lives and livelihoods of the populationhave been intertwined with the Bay, dating backbefore colonization and continuing through the pres-ent. The Bay is a source of food, an avenue fortransportation, an object of aesthetic appreciation,a part of the spiritual culture, and a site for recre-ation. The Bay is also a rich laboratory for scienti7cinvestigation. The Bay has been considered the mostvaluable resource of the region and an indicator ofthe health and condition of the environment in gen-eral. In this latter sense, the Bay is both the object ofprotection and an indicator of the condition of thegreater environment.
The other reason that citizens are concerned overthe Bay health is that they consider the Bay anindicator of their own health or an early warningsystem for more direct health threats to themselves.In this sense, the Bay may be thought of as anenvironmental ‘‘canary.’’ Citizens and regulatoryagencies ask if ecosystems or components are show-ing signs of the effects of toxic chemicals for goodreasons. The Bay is home to some substantial indus-trial complexes in the Baltimore, Maryland, Rich-mond, Virginia, and Norfolk, Virginia areas.Additionally, extensive farming and livestock opera-tions in the Bay states, especially Pennsylvania andVirginia, use a wide range of pesticides. According tothe Bay program (Toxics Fact Sheet October, 1997),approximately 7.2 million acres in the Bay states areunder cultivation. Furthermore, population centersmust treat both drinking water and wastewater;both types of facilities release toxic chemicalsinto the air and water and onto the land. The totaluse and release of toxic chemicals among all theselarge facilities is great enough that citizens and
0013-9351/00 $35.00Copyright ( 2000 by Academic Press
All rights of reproduction in any form reserved.

114 DEFUR AND FOERSOM
government agencies need to know the location, dis-position, and effects of these chemicals.
This paper examines the relationship betweentoxic chemicals in the Bay and effects on humanhealth. We explore the perspective of the Bay assentinel and as the resource being protected. Thispaper reviews the concept of indicators and senti-nels, some of the historical information about toxicchemicals in the Bay area, and what is known abouttoxic chemicals in the Bay area now. Finally, thepaper addresses the dif7cult question of whether thepresent information is suf7cient to determine if toxicchemicals threaten human health and Bay health.
THE PROBLEM
The Chesapeake Bay and the Bay watershed eco-systems are too large and complex to address allaspects of toxic chemicals in either. Rather, thispaper addresses the issue at the programmatic level,particularly the Chesapeake Bay Program, variousmonitoring programs, and recent initiatives andBay-wide activities. From the data generated at theBay level, we consider the extent to which the Bayand/or its constituent resources are indicators orsentinels for assessing human health. To be moreef7cient, the review necessarily focuses on keychemicals, de7ned elements in the ecosystem, andspeci7c regions of the Bay.
Traditionally, the toxic chemicals of greatest con-cern in the Bay area (EPA, 1983) include speci7cmetals, organometals, and several types of organiccompounds. The metals lead, mercury, cadmium,and chromium all derive from some of the industrialactivities in the Bay area. Tributyltin (TBT) andtetraethyllead are two of the organometals that haveposed contaminant problems in the Bay. The organiccompounds include pesticides, especially chlorinatedpesticides, and polynuclear aromatic hydrocarbons(PAHs) from combustion processes. Though notidenti7ed in 1983, dioxins presented contaminationproblems during the past decade (see for examplesdeFur, 1991). Several pesticides that are no longer inuse, such as DDT and dieldrin, continue to contami-nate surface and groundwater in many areas of theUnited States (Spruill et al., 1998; Kolpin et al.,1998), and DDT is one of the most commonly foundcontaminants in 7sh tissues (Hanson, 1997).
The Bay ecosystem system is composed of fresh-water, estuarine, and marine habitats, plus the asso-ciated wetlands and riparian lands (see Schubel andPritchard, 1987). The watershed includes the uplandareas that drain into the Bay. The term ecosystem isoften used synonymously with all living things that
are not humans. Such is not, however, an accurateuse of the term. The Bay ecosystem really consists ofthe living resources, the nonliving elements of theenvironment, and the interactions among all theseparts. The key elements for the present discussionare the natural resources that may indicate some-thing about toxic chemicals, those areas where toxicchemicals are most common (the ‘‘hot spots’’), andsome parts of the general Bay waters not in the ‘‘hotspots.’’
There are two obvious approaches to assessingtoxic chemicals;the use of Bay health measures asindicators of human health in the Bay and the as-sessment of Bay health conditions in parallel withthose for human health. In the 7rst approach, Baywildlife and ecosystem health is assumed to be re-lated to human health in a fairly traditional sentinelfashion, much as the canary in the mineshaft wasused. Society, largely the management and regula-tory agencies, uses wildlife health because there isdirect or indirect evidence that humans respond sim-ilarly to other animals. What happens to animalswill happen to people. For the closest applicability,the animals need to be in the same place at the sametime as people and subjected to the same conditions(exposures) as humans.
In the second approach, measuring Bay healthconditions along with human health conditions, thewildlife health is used not as a direct sentinel but asan indicator of the larger system, of which humansare a part. In this approach, protecting humanhealth and protecting health of the Bay, in whateverform that takes, are both valued and important end-points, one does not have to be functionally related tothe other. In this case, Bay species are protectedbecause of their intrinsic importance and value. Theintersection is important, but human health will notbe ignored because an animal sentinel does not re-spond to the conditions that harm humans. By thesame token, society would protect Bay species (e.g.,bald eagles) even if human health were not directlyand immediately at risk from the same conditions.
A third option, advocated by Suter (1997), a lead-ing expert on ecological risk assessment, is to har-monize assessment of human health and ecologicalsystems. Many EPA management and regulatoryactivities are carried out under risk assessmentframeworks. Suter observed that the two 7eldswould each improve by more closely collaboratingand that human health risk assessors have much tolearn from ecological risk assessment. He suggestedmerging the two approaches into a single effort,rather than treating humans and ecological end-points as entirely separate. This same message was

TOXIC CHEMICALS IN THE BAY 115
heard from ecological risk management experts ina recent workshop held in Williamsburg (Bachmanet al., 1998). The EcoRisk Management workshopconcluded that the arti7cial separation of humanhealth and ecological risk assessment may promoteinef7ciencies in managing real situations.
TOXIC CHEMICALS AND HUMAN HEALTHIN THE BAY SYSTEM
The current approach to most environmentalissues, especially concerning chemical contamina-tion, is conceptually grounded in toxicology, the con-ceptual basis for risk assessment (NRC, 1983, 1996).Such an analysis consists of identifying the sourcesof chemicals, the exposures and exposure pathways,the hazardous effects of chemical exposures, and therelationships between dose and response (see NRC,1983, 1993; Landis and Yu, 1998, for discussions).The toxicological approach provides a linear andsequential treatment of the situation, based on causeand effect relationships between chemical exposuresand health outcomes (or ecological effects). The tox-icological view can be greatly limited by the extent ofcurrent knowledge, leaving the outcome blind tonovel or totally unforeseen situations (either effectsor exposures). deFur (1999) argues that the currentproblems caused by endocrine-disrupting chemicals(see Colborn and Clement, 1992; Kavlock, 1996) arethe consequence of such a limitation. The reproduc-tive and developmental effects of chronic exposureswere not in the usual range of effects (hazards)under review in traditional risk assessments. Hence,these effects were frequently overlooked. Alterna-tives to the toxicological approach include botha public health approach and an ecological approach;some aspects are discussed below.
While the term toxic chemicals refers to a greatmany substances (over 77,000 registered for com-merce in the United States, according to EDSTAC,1998), not all are considered here. The following areomitted from present consideration:
f Toxic effects of excess nutrients in the waterf Drugsf Bacteria, viruses, and other microbes (especially
diseases and their toxins)f Nutritional statusf Ambient conditions that may be lethal, such as
high temperatures and low oxygenThe focus here is on toxic chemical concentrationsand releases in the Bay system and those caseswhere toxic chemicals are known to affect Bay spe-cies. This review and analysis cannot be compre-hensive, but will take into account major sources of
information on chemical releases and concentrationsand on effects on wildlife and Bay species. T. Burkeevaluates issues related to public health in the Bayarea in another paper in this symposium.
ECOLOGICAL SYSTEMS AND COMPONENTSAS INDICATORS OR SENTINELS OF
HUMAN HEALTH CONDITIONS
Indicators and sentinels are not identical termsand are not used interchangeably here. Indicator isthe more general term for an animal or plant (orgroup or combination of plants and animals) whosepresence or absence results from a change from theideal or status quo. Indicator species have been usedfor many years in terrestrial and aquatic ecology toidentify deteriorating conditions. Species that aretolerant of disturbance or poor conditions are indi-cators. Animals and plants that require high-qualityconditions for their survival are also considered indi-cators because their absence indicates deterioratingconditions. Fish and crustaceans that require highlyoxygenated waters are indicators of healthy habitatswith high oxygen content and their absence is takenas an indication of poor conditions, i.e., low oxygen.In an earlier survey of Baltimore Harbor, P7tzen-meyer (1971) found that the benthic fauna of theinner harbor was limited to pollution-tolerant spe-cies and the more sensitive forms, such as am-phipods and isopods, were reduced or absent. Jensenet al. (1974) attributed the depauperate benthicfauna in Baltimore Harbor to acids and metals in thesediments in the vicinity of a steel mill.
The term indicators has an ecological meaning,but is also used outside the strict ecological setting,as in the present case. EPA (1992) applied currentinformation to populations of wildlife in an attemptto determine characteristics of indicators and foundthat population-level changes were most effective indetecting changes caused by habitat alterations,trophic disturbances, and harvesting pressures thatdeplete populations. The least effective applicationof populations as indicators was for factors withunknown or uncertain causal factors, meaning thatthe population changes could not be attributed tointrinsic or extrinsic factors. Of eight cases exam-ined, only elevated mortality of marine mammalswas associated with possible toxic chemical contami-nation.
Allaby (1991) de7nes indicator species as thosewith narrow ecological amplitude regarding one ormore environmental factors and thus, when present,indicate particular environmental conditions. Long-lived species, as with species presence over time,

116 DEFUR AND FOERSOM
represent integration of the temporal interaction be-tween the species and the environment. This indi-cator may give a better biological assessment ofhabitat conditions than can a more precise physicalmeasurement taken on any given day.
According to Pearson (1995), the characteristics ofindicator species are:
1. Taxonomically well known and stable (e.g.,birds).
2. Biology and general life history well under-stood.
3. Populations readily surveyed and manipu-lated;easy to identify, observe, and capture.
4. Higher taxa occupying a breadth of habitatsand a broad geographical range.
5. Specialization of each population within a nar-row habitat, e.g., tiger beetles (1% occupying morethan one obvious habitat type.
6. Patterns observed in the indicator taxon re8ec-ted in other related and unrelated taxa;showingpatterns of response to factors, e.g., pollution andhabitat degradation, that ‘‘presage’’ those of othermembers of the community or habitat.
7. Potential economic importance.Indicators do not necessarily re8ect the cause and
effect relationships, as do sentinels. The examplesmentioned thus far are more indicators than senti-nels in demonstrating some change that might bebut is not necessarily adverse. The changes expectedfrom individuals or a population of indicator speciesmight be:
f Spatial distribution of individuals or the popula-tion
f Abundance of the populationf Diversity of a community of organismsf Presence or absence of a speciesf Health or condition of the individuals in the
population, including but not limited to size, age,development, growth rate, disease, behavior, repro-duction
f Sex ratio of the populationf Population numbers over time‘‘Sentinels’’ are those species that have quite clear
and quanti7able response(s) to a speci7c stimu-lus;in the present case, chemical exposure. In thisregard, sentinels are more speci7c in their responseto some environmental state. The canary in the minewas an effective sentinel animal because it wasknown to respond rapidly to carbon monoxide pois-oning with respirator distress and failure. In pres-ent-day use, sentinels may also refer to populationsof animals (or plants); egg shell thinning in birds isnow considered a sentinel species response to or-ganochlorine chemical exposure (NRC, 1991). This
de7nition of sentinel is consistent with the NRCreport in 1991 on the subject. The NRC gave fourcritical attributes of animal sentinel species:
1. Having a measurable response to the agent oragents in question.
2. Having a territory or home range that overlapsthe area under investigation; the animal and theagents must occur in the same place and time.
3. Having individuals that are easily capturedand enumerated.
4. Having suf7cient population size and density topermit enumeration.
Ever since miners took canaries down into mineshafts (see NRC, 1991) as sensors of poisonous gas(especially carbon monoxide), humans have usedand in some cases relied on other animals to protecttheir own health. Some animals have been recog-nized as more sensitive than humans to some ratherpoisonous chemicals. An even more fundamentaland factual basis than casual observation of greatersensitivity for indicator or sentinel species lies in thecommonality of underlying biological processes andmechanisms. In a recent essay, Mangum andHochachka (1998) note that biological science hasaccepted the notion that all living things have a basi-cally similar biochemical/cellular construct on whichall life is based. This common biochemistry providesgreat opportunity for using animals as early warn-ing systems, sentinels, or surrogates. Mangum andHochachka (1998) also note the equally confoundingnotion that the millions of living species displaya diversity that belies such a common cellular struc-ture and function. But for the present essay, thecommon mechanism provides the basis for explain-ing both sentinels and indicators. The apparentparadox of incredible diversity is explained by theadaptive capacity of life in re7ning common mecha-nisms to 7t speci7c conditions, such as low salinityestuaries that vary in physical and chemical condi-tions.
BAY-SPECIFIC EXPERIENCES ASSESSING TOXICCHEMICALS
The initial investigation of Bay conditions in-cluded a survey of the distribution and concentrationof toxic chemicals in the Bay (EPA, 1983). This sur-vey covered the entire Bay, although at a rathercoarse level, and included measuring water andsediment concentrations of a number of metals andorganic compounds. Subsequently, Helz and Hug-gett (1987) reviewed the extent of toxic chemicalcontamination in the Bay generally and in the ‘‘hotspots.’’ Both EPA (1983) and Helz and Huggett

TOXIC CHEMICALS IN THE BAY 117
(1987) concluded that although toxic chemicals werefound throughout the Bay, contamination wasa threat to resources in speci7c areas of the Bay,rather than a widespread problem in most waters.The three contaminated areas identi7ed in the 1980sand remaining so today are the ports of Norfolk,speci7cally the Elizabeth River, Virginia, and Balti-
FIG. 1. The Chesapeake Bay, showing the location of Baltimoreactivity and populations centers.
more, speci7cally the Patapsco River, Maryland, andthe James River, Virginia (Fig. 1). The AnacostiaRiver, in Washington, DC, is another site of dis-charges typical of industrial facilities, particularlyfrom some industry and the Navy yard on the river.
Baltimore, Maryland, has served as an industrialport for many years and was the site of oil re7ning,
, Washington, Richmond, and Norfolk, major centers of industrial

FIG. 2. Distribution of toxic metal contamination in sedi-ments of the mainstem of the Bay and major tributaries (fromEPA, 1983), based on a comparative scale that references mea-sured concentrations of Cd, Cu, Cr, Ni, Pb, and Zn to predictedlevels, based on sediment cores and rock weathering in the water-shed. The highest concentrations are in the regions of the largestcities and at the mouths of the Rappahannock and SusquehannaRivers.
118 DEFUR AND FOERSOM
steel mills, metal processing, and food processing.These varied and diverse industrial activities pro-duced both metal (Fig. 2) and organic (Fig. 3) con-taminants. Various surveys addressed the natureand extent of toxic chemical contamination (seeEPA, 1983; Helz and Huggett, 1987). Metals andorganic compounds were reported in the harbor sedi-ments, some from known sources (e.g., steel millsand sewage treatment plants) and other chemicalspresumably from nonpoint sources or atmosphericdeposition. PAHs are found in high concentrations inharbor sediments as a result of the burning of woodand coal in industrial processes. Polychlorinated bi-phenyls (PCBs) are also found in high levels in Balti-more Harbor; concentrations and number of PCBs
decline with distance from the inner harbor. Clearly,these past practices have left a toxic legacy.
The Elizabeth River, Virginia, 8owing through theport of Norfolk, was the site of industrial activity formany years and now faces the challenge of cleaningup afterward. Much of the accumulated toxic mater-ial is a result of the past practices of burning, creo-sote processing, and related activities. These haveleft a legacy of sediments contaminated with indus-trial by-products, especially PAHs (see Helz andHuggett, 1987). PAHs make up the greater part ofcreosote, which was used to treat wood to protectagainst rotting and boring insects. Shipyards stilluse a variety of toxic chemicals in treating ships andin cleaning and maintaining vessels. Among thetoxic materials discharged from shipyards area number of metals, including TBT, used as an anti-fouling treatment on ship hulls. TBT was bannedfrom use on small vessels, but is still used on largeships and remains in sediments. TBT is also one ofthe compounds known to alter normal reproductivefunction and development in various marine ani-mals, particularly snails (see Colborn et al., 1993).
The other well-documented and characterized siteis the contamination of the James River with thepesticide Kepone in the 1970s (Bender and Huggett,1987). The organochlorine pesticide chlordecone(trade name Kepone), was spilled into the JamesRiver at Hopewell, Virginia, and the contaminationextended for about 30 miles to Newport News. Theriver was closed to all 7shing from Hopewell to New-port News for many years, on the basis of con-taminated 7sh, crabs, and oysters. The state and theEPA anticipated damage to health and the environ-ment, principally from consumption of contaminatedseafood, and direct toxicity, respectively. In recentyears, the bans have been lifted, though the Keponeremains buried in about 30 miles of the river. Thecase supports the use of Bay species as sentinels ormonitors of contamination. Crabs are quite sensitiveto low levels of Kepone (Schimmel et al., 1979), andcrabs, oysters, and 7sh all accumulate this com-pound. Fish continue to pick up Kepone in theirtissues when they move into the river to spawn inthe spring, albeit at low levels. Reevaluation of thiscontamination is now underway at Virginia Com-monwealth University and is presented below.
Audet (1988) summarized U.S. Fish and WildlifeService (USFWS) monitoring efforts of sediments inthe Bay. The USFWS was interested in the distribu-tion and concentration of toxic chemicals as poten-tial threats to the natural resources of the Bay, aswas the national NOAA survey of coastal waters.Given the experience with DDT, Kepone, and PCBs

FIG. 3. Distribution of toxic organic chemicals in sediments of the mainstem of the Bay. Concentrations are for total organiccompounds, after normalizing for sediment silt and clay content (taken from EPA, 1983). Numbers refer to sampling station locations.
TABLE 1Toxics of Concern and Toxics of Potential Concern
in the Chesapeake Bay Program
TOC list TOPC list
Atrazine AlachlorBenz[a]anthracene AldrinBenzo[a]pyrene ArsenicCadmium Other PAHsChlordane DieldrinChromium FenvalerateChrysene MetolachlorCopper PermethrinFluoranthene ToxapheneLead ZincMercuryNaphthalenePCBsTributyltin
Note. The list is current as of the 1990 approval process but hasnot been 7nalized in recent years, hence the overdue nature of theapproval.
TOXIC CHEMICALS IN THE BAY 119
poisoning some Bay wildlife and habitats, it is logicalthat the USFWS would monitor sediment contami-nation. Audet (1988) noted that the levels of con-taminants had declined generally and that the ‘‘hotspots’’ in the Bay were characterized and monitoredby other programs. The report noted that the con-taminants had the potential to impact wildlife in theBay. Subsequent investigations on the relation be-tween these contaminants and their effects on hu-man health revealed that both people and wildlifeare susceptible to the toxic effects of sediment con-taminants (Ingersoll et al., 1998).
CHEMICALS IN THE BAY
Sources of Chemicals
The types of toxic chemicals of concern are pestici-des, industrial chemicals, waste materials and prod-ucts, and products of mining and associatedmaterials processing. The Chesapeake Bay ProgramOf7ce developed a list of toxic chemicals of concern(TOC) and another list of toxics of potential concern(TOPC) for the Bay area; these lists are supposed tobe updated regularly (Table 1). The combined list isnot meant to identify all of the toxic chemicals in theBay system, but only those considered of concern dueto concentration and location in an exposure path.Indeed, the current list contains only 14 chemicalson the TOC list and an additional 10 on the TOPClist. The list has been under revision for several
years now; hence, the most recent approved list isnearly a decade old.
Known sources of toxic chemical inputs to the Baysystem are too numerous to identify all here. Thefollowing categories of toxic chemical sources covermajor source categories as listed by the EPA:
f Industrial manufacturing and processing
120 DEFUR AND FOERSOM
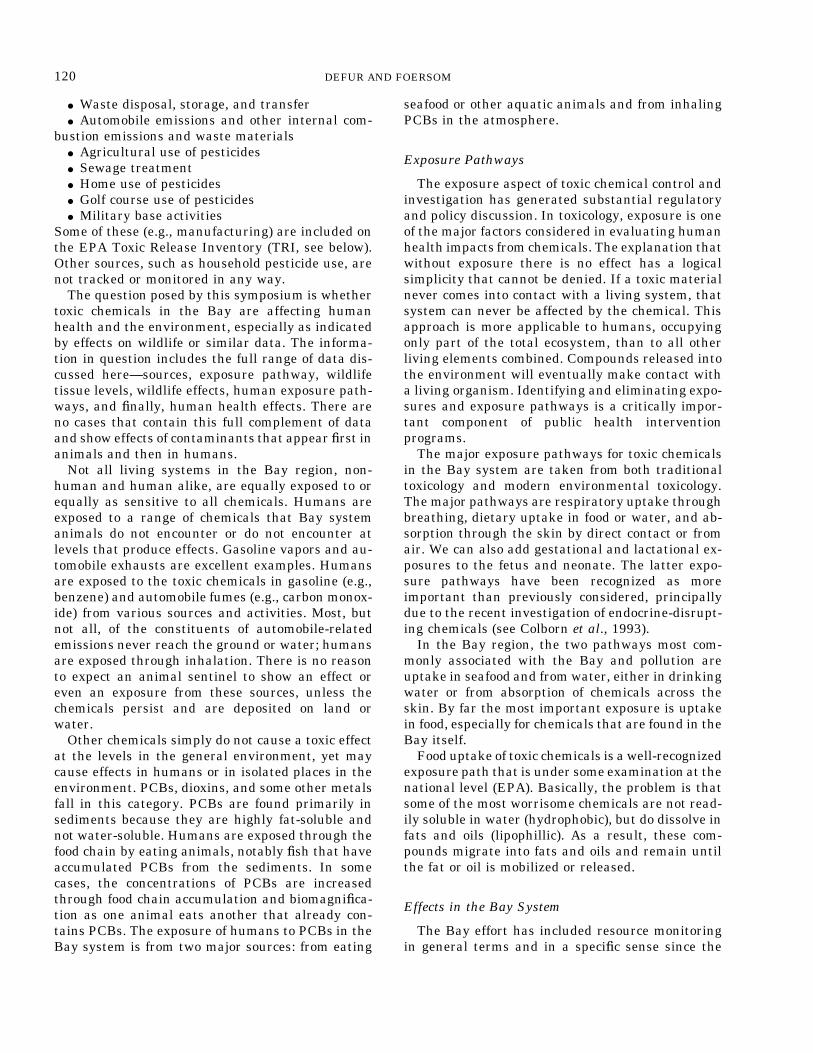
f Waste disposal, storage, and transferf Automobile emissions and other internal com-
bustion emissions and waste materialsf Agricultural use of pesticidesf Sewage treatmentf Home use of pesticidesf Golf course use of pesticidesf Military base activities
Some of these (e.g., manufacturing) are included onthe EPA Toxic Release Inventory (TRI, see below).Other sources, such as household pesticide use, arenot tracked or monitored in any way.
The question posed by this symposium is whethertoxic chemicals in the Bay are affecting humanhealth and the environment, especially as indicatedby effects on wildlife or similar data. The informa-tion in question includes the full range of data dis-cussed here;sources, exposure pathway, wildlifetissue levels, wildlife effects, human exposure path-ways, and 7nally, human health effects. There areno cases that contain this full complement of dataand show effects of contaminants that appear 7rst inanimals and then in humans.
Not all living systems in the Bay region, non-human and human alike, are equally exposed to orequally as sensitive to all chemicals. Humans areexposed to a range of chemicals that Bay systemanimals do not encounter or do not encounter atlevels that produce effects. Gasoline vapors and au-tomobile exhausts are excellent examples. Humansare exposed to the toxic chemicals in gasoline (e.g.,benzene) and automobile fumes (e.g., carbon monox-ide) from various sources and activities. Most, butnot all, of the constituents of automobile-relatedemissions never reach the ground or water; humansare exposed through inhalation. There is no reasonto expect an animal sentinel to show an effect oreven an exposure from these sources, unless thechemicals persist and are deposited on land orwater.
Other chemicals simply do not cause a toxic effectat the levels in the general environment, yet maycause effects in humans or in isolated places in theenvironment. PCBs, dioxins, and some other metalsfall in this category. PCBs are found primarily insediments because they are highly fat-soluble andnot water-soluble. Humans are exposed through thefood chain by eating animals, notably 7sh that haveaccumulated PCBs from the sediments. In somecases, the concentrations of PCBs are increasedthrough food chain accumulation and biomagni7ca-tion as one animal eats another that already con-tains PCBs. The exposure of humans to PCBs in theBay system is from two major sources: from eating
seafood or other aquatic animals and from inhalingPCBs in the atmosphere.
Exposure Pathways
The exposure aspect of toxic chemical control andinvestigation has generated substantial regulatoryand policy discussion. In toxicology, exposure is oneof the major factors considered in evaluating humanhealth impacts from chemicals. The explanation thatwithout exposure there is no effect has a logicalsimplicity that cannot be denied. If a toxic materialnever comes into contact with a living system, thatsystem can never be affected by the chemical. Thisapproach is more applicable to humans, occupyingonly part of the total ecosystem, than to all otherliving elements combined. Compounds released intothe environment will eventually make contact witha living organism. Identifying and eliminating expo-sures and exposure pathways is a critically impor-tant component of public health interventionprograms.
The major exposure pathways for toxic chemicalsin the Bay system are taken from both traditionaltoxicology and modern environmental toxicology.The major pathways are respiratory uptake throughbreathing, dietary uptake in food or water, and ab-sorption through the skin by direct contact or fromair. We can also add gestational and lactational ex-posures to the fetus and neonate. The latter expo-sure pathways have been recognized as moreimportant than previously considered, principallydue to the recent investigation of endocrine-disrupt-ing chemicals (see Colborn et al., 1993).
In the Bay region, the two pathways most com-monly associated with the Bay and pollution areuptake in seafood and from water, either in drinkingwater or from absorption of chemicals across theskin. By far the most important exposure is uptakein food, especially for chemicals that are found in theBay itself.
Food uptake of toxic chemicals is a well-recognizedexposure path that is under some examination at thenational level (EPA). Basically, the problem is thatsome of the most worrisome chemicals are not read-ily soluble in water (hydrophobic), but do dissolve infats and oils (lipophillic). As a result, these com-pounds migrate into fats and oils and remain untilthe fat or oil is mobilized or released.
Effects in the Bay System
The Bay effort has included resource monitoringin general terms and in a speci7c sense since the

TOXIC CHEMICALS IN THE BAY 121
onset of the program. The resources most studied arethose of substantial economic signi7cance (e.g.,crabs, oysters, striped bass) as well as ecologicalsigni7cance (e.g., sea grasses or submerged aquaticvegetation [SAV], wetlands, benthic communities,oyster bars). Catch records for the commercialspecies provide valuable sources of information onpopulation 8uctuations and other Bay-wide or river-speci7c trends in these important species. Only inrecent years have more intense efforts turned tomonitoring noncommercial living resources (e.g.,SAV).
Oyster catches have been declining for more thana few decades, according to both historical and re-cent data. One of the 7rst surveys of oyster popula-tions was conducted by Baylor over concern thatcatches were falling, especially catch per unit effort(Haven, 1987). Indeed, more than a century agoBrooks (1891) reported on the declining oyster har-vest and attributed the decline to overharvestingand mismanagement. Recently, when the state ofMaryland sought a consensus strategy to recoveroyster populations and harvest, overharvesting andmanagement problems were recognized as but twocauses for oyster declines. Oyster parasitic infec-tions (Dermo and MSX) take a heavy toll, and thecontributions from deteriorating water quality andtoxic chemical poisoning are now acknowledged, butlargely unexamined (Maryland Oyster RoundtableReport, 1995).
Sea grasses in the 1980s were the object of invest-igation because of the realization that some seagrassareas were now sparse or had been depleted of grass-es entirely. Indeed, in the Bay assessment (EPA,1987) the EPA recorded dramatic declines in seagrasses, and the term submerged aquatic vegetationcame into popular use in the Bay program. SAVsurveys continued for many years, and even today,as a way of charting progress toward recovery. Thecause of the SAV decline was not apparent at 7rst.Following some investigation, it was concluded thatoverenrichment of the aquatic system and excessturbidity from sediment both contributed to obscur-ing sunlight and limiting the photosynthetic capabil-ity of SAV. This was coupled with increaseddeposition of sediment on the plant surface, causinggrowth of a variety of microorganisms, some ofwhich challenged the plants systems and increasedthe disease incidents. But it was fairly clear that nodirect or even indirect effects of chemicals were re-sponsible for the decline in SAV.
During the early years of the Bay cleanup, andeven in the preceding years, bald eagle, osprey, andperegrine falcon populations declined throughout
much of the East Coast and the Great Lakes (seeCade, 1990 for review). The cause turned out to bethe pesticide DDT impairing eggshell formation inthese birds. Eagle eggs especially were too thin tosupport the weight of the adult birds incubating theeggs and thus were crushed. DDT was found tocause eggshell thinning in some bird species andhigh DDT residues in several species of piscivorousbirds con7rmed the nature of the problem. HighDDT residues were also found in osprey and peregri-ne falcons, contributing to the decline of these popu-lations as well. Falcons were eventually extirpatedfrom the East Coast and only through federal agencyefforts were reintroduced from animals in otherparts of the country.
Two critically important conclusions came fromthe work on bald eagles and other raptors on theEast Coast. One conclusion was that wildlife speciescan serve as effective sentinel species, as noted bythe NRC (1991). This conclusion supported the cre-ation of programs to monitor wildlife populations forthe presence or effects of contaminants in the envi-ronment. The other important point from the workon bald eagles and other species affected by DDT isthat acute poisoning is not the only factor contribu-ting to population declines, especially in regionaldeclines of substantial magnitude. Eggshell thinn-ing was a serious affect not observed as acute mor-tality of the exposed animals. The offspring sufferedin much the same way that scientists recognize thatendocrine-disrupting chemicals affect reproductiveand developmental processes. Nor was chemicalpoisoning the sole impact on eagle populations. Hu-man activities encroaching on eagle nesting sitesresulted in nest abandonment and limitations onreproduction at the population level. Through thisresearch, scientists and resource managers came torealize the potential adverse effects of habitat degra-dation and reduction or loss.
Another case in which the effects of toxic chemicalcontamination have been shown to affect popula-tions of Bay species is in the Elizabeth River, Vir-ginia. This river system is heavily impacted fromlong use for various industrial activities. One majorchemical problem is high levels of PAHs in the sedi-ment, primarily from past industrial combustion us-ing coal, from coal processing, and from old creosoteplants on the river (Helz and Huggett, 1987). Al-though the sources are long closed, the creosote resi-dues remain in the sediment, along with a number ofother contaminants, such as metals and PCBs.While the metals and the PCBs in the river sedi-ments are known to affect human health and bothare taken up and passed along to humans via
122 DEFUR AND FOERSOM
seafood, PAHs are not treated the same way by mostmarine animals. Most PAHs are not passed alongand are not toxic in their immediate form, but themetabolic breakdown products are quite toxic. In-itial surveys of 7sh in the vicinity revealed a highincidence of tumors (Klauda and Bender, 1987). Re-searchers have continued to monitor and investigatethis heavily contaminated site. The latest 7ndings(Van Veld et al., 1997) indicate that the 7sh Fun-dulus still is able to reproduce in the ElizabethRiver, despite lethal incidences of liver tumors in thepopulation, because reproduction occurs prior todeath. Furthermore, enzyme levels in this popula-tion are altered to accommodate the high concentra-tions of toxic PAHs in the sediment.
The Kepone contamination of the James River wasdiscovered when three seemingly unrelated eventstook place in Hopewell, Virginia; monitoring for ef-fects was not involved at all. The three events were:(1) the failure of sewage treatment processes due todeath of the microbial 8ora that process industrialwastes at the waste treatment facility in Hopewell,Verginia; (2) the illegal midnight dumping of barrelsof industrial waste in the wetlands; and (3) the ad-mittance of workers with acute neurotoxicity symp-toms to medical facilities (Taylor et al., 1978).
A reexamination of this contamination problem in1997}1998 by Virginia scientists led to further un-derstanding of contamination in the James River(Garman et al., 1998). This work originally focusedon Kepone levels in larger, older cat7sh of severalspecies. The complete study included measurementsof 26 toxic chemicals (metals, pesticides, PCBs, etc.)in 7sh tissues, the standard EPA protocol formeasuring 7sh tissue contamination. Kepone wasnot found above the analytical detection limit incat7sh from the James River, but other toxic com-pounds were found in suf7ciently high concentra-tions to warrant concern. PCBs, organotincompounds, mercury, and DDT and metaboliteswere found in cat7sh tissues and many of the cat7sh,especially males, appeared to exhibit arrested orindeterminate sexual development. Problems withsexual development associated with or causedby contamination from several of these compoundshave been reported in snails, male 7sh, andalligators (see Colborn and Clement, 1992; Colbornet al., 1993; Kavlock et al., 1996). As of this writing,the EPA and the Virginia Department of Environ-mental Quality are examining the threat to humanhealth and the need for cleaning up the con-taminated sediment. Clearly, a biomonitoring effortusing 7sh as indicators has promise for this riversystem.
These cat7sh are 7shed recreationally and by sub-sistence 7shers on the James River. In this case, thesources are industrial and municipal discharges,likely organotin leaching off the hulls of large shipson the James River and nonpoint source runoff fromthe land. Runoff includes atmospheric deposition ofchemicals such as PCBs that can be transported longdistances in air. Runoff is also the most likely ex-planation for the presence of some of the bannedpesticides, such as DDT and chlordane.
MONITORING PROGRAMS IN THE BAY
United States Geological Survey
The USGS has for some years monitored ground-water and surface water quality through the Nation-al Ambient Water Quality Assessment Program(NAWQA; U.S. Geological Survey, 1996; Lindsey etal., 1998; Spruill et al., 1998). This program providessome of the best and most well-documented data onthe occurrence and distribution of pesticides, metals,and industrial compounds in both types of water.USGS data are available in hard copy and from Theinternet Web site as well (see Lindsey et al., 1998).The program assesses water quality on a watershedor basin level, based on the USGS determinations of50 major watersheds and basins throughout the na-tion. These study areas are called Study Units andcover about half of the U.S. land mass and about70% of the water supply for the United States. Notall of the Study Units are under the same level ofinvestigation simultaneously; comprehensive in-vestigations are underway in about one-third. Re-cent data are presented here for the Potomac andSusquehanna Study Units in the Chesapeake Bayarea (Fig. 4).
A range of organic chemicals and metals are foundin streambed sediments in the lower SusquehannaRiver basin (Figs. 5 and 6). The highest concentra-tions occurr in areas with mixed agricultural andindustrial uses, compared to concentrations in areasof forest and forest mixed with agriculture (Fig. 5).The PAHs, phthalates, and phenols detected instreambed sediments are products associated withindustrial practices; some are widespread in otherwaterways as well (Hale et al., 1999) and may befound throughout the United States. PAHs in ur-ban/industrial areas were high enough to raise someconcerns for human health and aquatic life. Both7sh tissues and sediments also accumulate chlorin-ated organic compounds, including pesticides andPCBs (Fig. 6). As with the chlorinated organic com-pounds, all three groups of compounds were highestin industrial-use areas. Chlordanes, PCBs, and DDT

FIG. 4. Potomac River (right) and Susquehanna (left) watersheds studied in the USGS National Water Quality Assessment program.
TOXIC CHEMICALS IN THE BAY 123
were all high enough in 7sh tissues to raise concernsfor human health, although, according to Lindsey etal. (1998), the appropriate Pennsylvania agenciesdid not 7nd a need to issue health warnings for thespecies sampled (white sucker and small mouthbass).
A number of pesticides occurred in both well waterand streams (Fig. 7), and the same six most fre-quently detected pesticides were the same in bothwells and streams. More than one pesticide wasdetected in almost all cases, and the most commonlydetected pesticides were herbicides used on corn (at-razine, metolachlor, simazine, prometon, alachlor,and cyanozine). Atrazine, one of the most commonlyused and detected herbicides across the nation, wasfound in 98% of the stream samples and 74% of thewell samples in the Lower Susquehanna River basin(Lindsey et al., 1998). The presence of chemicals ineither water source is related to use patterns (e.g.,Figs. 5 and 6), as well as to the regional geologicalcharacteristics and chemical properties of the com-pounds. Some soils are more prone to leaching (Fig.8), particularly limestone, and some compounds,such as atrazine, are more mobile and have a higherleaching potential.
Compounds such as chlordane and some of theother chlorinated organic compounds break downslowly under natural conditions and therefore re-main in stream sediments for many years, even afteruse and input to the system has long since stopped.DDT, another lipophillic and persistent compound,was present at 23 of 26 sites. Concentrations ofchlordane in 7sh tissues and sediments are directly
related (e.g., chlordane, Fig. 9), due to the propertiesof the chemicals in question. These lipophillic chem-icals adsorb to organic particles and dissolve readilyin fats, not in water, and the major route of uptake isvia food ingestion, either in the food or as sediment istaken in incidental to feeding.
The levels of many of these compounds are belowthe point at which traditional testing reveals eitheracute or chronic effects. For some of the compounds,including mercury, lead, chlordane, PCBs, and DDT,aquatic life is at risk from the adverse effects at thelevels found in streams in the Potomac River basin(Figs. 10 and 11). According to the USGS, sedimentat 14 of 23 sites had concentrations high enough topose a risk to aquatic life (Lindsey et al., 1998) and at6 sites, there was a high likelihood of harm to aqua-tic life. The screening levels are based on laboratorytoxicity tests and adjustments made to account forvariation among species; hence, the screening levelis not able to conclusive identify what species mightbe affected. Clearly, these data point to the need tocomplete more thorough 7eld and laboratory exam-inations and to explore the possibilities of remedialactions to protect both human health and the envi-ronment.
It is clear from the USGS data that pesticides andindustrial chemicals are widely distributed in theBay region and are found in inland as well as tidalwaters. The most commonly occurring pesticides areDDT and other chlorinated organic compounds,primarily because they were widely used andare highly persistent. Additionally, PCBs are foundin many sites and are highly persistent and

FIG. 5. Concentrations (in parts per billion) of PAHs,phthalates, and phenols in stream sediments in the Lower Sus-quehanna River basin, according to land use of the surroundingland. Four sites on large rivers were excluded from this compari-son because the sites had characteristics dissimilar to those of theother sites. The numbers of sites are given below the land-usetype.
FIG. 6. Selected organochlorine pesticides (chlordane andDDT) and PCBs in sediment and 7sh (white sucker) tissues in theLower Susquehanna River basin, according to land use of thesurrounding land.
124 DEFUR AND FOERSOM
transportable in air and in water, though much moreso in the former. Lead and mercury, for much thesame reasons, persist in waters, sediments, and 7shtissues. One of the greatest unknowns is whetherthe combination of these and other toxic chemicalshas effects on human health or the environment.
Toxic Release Inventory
The Toxic Release Inventory (TRI) is a database ofquantities of chemicals released into the environ-ment from or stored on-site at certain facilities and ismandated by federal law. Reports are 7led annuallywith the EPA and reported publicly in several forms.One readily accessible location is the WWW site of
the EPA for the TRI data (www.epa.gov). These re-porting requirements cover speci7c types of facilitiesand chemical compounds that are released in excessof a certain amount. The TRI reports for the Baystates of Virginia, Maryland, and Pennsylvania andfor Washington, DC are summarized from the inter-net data for all chemicals reported (Table 2).
A few trends are apparent in the data for allchemicals and all facilities by state. The District ofColumbia, with only three facilities, makes no sub-stantial contribution to the total and is not con-sidered further. Air emissions dominate the list oftotal releases, but the total amounts of on-site wastemanagement and energy recovery (using the wasteas fuel for another process) greatly exceed theamounts released from all categories. The distribu-tion of emissions and releases is not even among theBay states, especially when considered on the basis

FIG. 7. Presence of pesticides in wells and streams in the Lower Susquehanna River basin. Values are percentages of samples in whichthe pesticide was detected.
TOXIC CHEMICALS IN THE BAY 125
of pounds released per facility. On this basis, poundsreleased per facility, Virginia has proportionatelymore air emissions (114,116 lbs/facility) and Pen-nsylvania has proportionately more water dis-charges (18,997 lbs/facility). Virginia facilities haveabout twice the total on-site releases in lbs/facility asthe other two states. The most dramatic difference isthe pounds released per member of the population(lbs/person): Virginia"8.6; Maryland"2.6; Pen-nsylvania"5.6 (Table 2).
Individual state summaries give data on the top10 chemicals across all release categories for each ofthe states (Tables 3}5). A few toxic compounds dom-inate the total emissions reported under TRI;meth-
FIG. 8. Presence of selected pesticides in groundwater be-neath three different bedrock types, according to leaching poten-tial of the pesticide. Data are for selected sites in the LowerSusquehanna River basin.
anol, ammonia, and toluene. Methanol and ammo-nia occur in nature yet are the by-products of a largenumber of industrial and municipal processes, in-cluding organic waste treatment, such as sewagetreatment (ammonia). Toluene is a solvent used invarious extraction and distillation processes. Vol-atile organic compounds (including methanol) makeup a substantial fraction of the releases into air andwater; these are solvents and industrial materialsthat may be used in various processes (e.g., produc-tion of styrene), and, of course, metals and metalcompounds are found in the releases into all media.
Some of the differences among the states simplyre8ect the different industrial bases and populationcenters. Virginia and Pennsylvania have pet-rochemical facilities and Maryland is home to steelproduction in Baltimore. Pulp and paper mills, ce-ment factories, waste incinerators, and chemicalmanufacturing all have different combinations andamounts of chemical use and release. These differ-ences in facility processes explain the variations inthe chemical constituents on the top 10 list for eachstate (Tables 3}5). It is more dif7cult to explain whythe pounds released per facility is so variable fromone state to the next. One explanation is that eachstate varies considerably in the administration ofthe permit programs for water, air, and solid wastereleases.
While all of these compounds are listed becausethey are toxic and released in excess of a certainamount, the matter of threats to human health andthe environment remains undetermined from thesedata. Looking at the effects question toxicologically,

FIG. 9. Chlordane in sediments and tissues of three 7sh species for selected sites in the Potomac River basin. ND, not detected.
126 DEFUR AND FOERSOM
releases are but one element; the delivered dose andpotential effects must also be taken into account. Ofthe amounts of TRI chemicals released, there are noestimates of their fate at a regional level. Someefforts estimate fate and transport of emissions ordischarges for regulatory purposes, but there is nooverall effort to determine what happens to the mil-lions of pounds released into the air, water, and landof the Bay states.
Interestingly enough, at least some of the metalsmust wind up in the Bay waters and sediments,because the surveys by the EPA (1983), the NOS(Hanson, 1997), and the USFWS (1988) report meta-ls in waters, sediments, and wildlife tissues. Fur-thermore, these same metals (e.g., lead, chromium,zinc, manganese, and nickel) are known threats tohuman health when the exposure (dose) is suf7cient(ATSDR, 1997).
State Agencies
State agencies conduct water quality monitoringthrough two programs: the discharge permits pro-gram and water quality monitoring. Any facility thatdischarges into waters of the state must 7rst securea National Pollution Discharge Elimination System(NPDES) permit. In the Bay, these permit programsare operated by the state agencies, under authorityfrom the EPA, as described in the Clean Water Act.
Discharge permit holders are required to 7lemonthly reports on the materials found in the dis-charge, for those chemicals listed in the permits.
State agencies must also report to the EPA on thestate of the water quality and whether rivers, lakes,and other bodies of water can be used for swimming,7shing, and other uses. To accurately report to theEPA, agencies need to conduct some sort of monitor-ing program to provide the necessary data. Thesemonitoring programs assess primarily temperature,pH, bacteria levels, oxygen levels, suspended sedi-ment, and odor.
National Oceanographic and AtmosphericAdministration (NOAA) National Ocean Survey(NOS)
Beginning in 1984, NOAA conducted a survey ofcoastal waters to determine the extent of contamina-tion from land-based sources. The survey consistedof measuring the concentrations of a series of metalsand organic chemicals in sediment samples, 7sh tis-sue, and mussel or oyster tissue. The survey sam-pled from all coasts, including several sites in theBay region, both industrialized (Elizabeth River)and rural (York River). This effort documented sometrends that were expected, to say the least. Majorharbors and rivers were the most contaminatedsites, and locations with no industrial or other

FIG. 10. Potomac River basin testing sites for concentrations of 7ve contaminants listed in Fig. 11.
TOXIC CHEMICALS IN THE BAY 127
human activities had no or little measurable con-taminants. Metals, industrial chemicals, and pestici-des were found commonly in coastal sediments. Oneof the few surprises was the presence of relativelyhigh concentrations of DDT and its by-products andPCBs, even though both were banned by the mid-1970s.
Hanson (1997) used the results of the ongoingBenthic Surveillance Project of the NOS to identifyrelationships between sediment and liver con-taminant concentrations in 7sh. Hanson useda large number of contaminants (organic and meta-ls) from more than two dozen sites to determinemajor trends that might be obscured in smaller datasets. Sediment and 7sh liver samples were collectedfrom Maine to Texas; Hanson compared the NorthAtlantic coast (north of Raritan Bay, NJ) with the
south Atlantic and Gulf coasts. The more con-taminated sites in the northeast region resulted inelevated liver contaminants compared with themid-Atlantic and Gulf regions. Hanson concludedthat when analyzed properly, the liver contaminantswere an effective indicator of sediment pollution.
One of the important conclusions from the NOAAsurvey efforts is the con7rmation that sedimentsand 7sh tissue do contain measurable levels of toxicmetals and organic compounds. Some of these chem-icals are present in fairly high levels, consistent withthe results of the USGS surveys.
CONCLUSIONS
The available data provide little complete informa-tion on the relationship between Bay and human

FIG. 11. Concentrations of 7ve contaminants (lead, mercury, DDT, PCBs, and chlordane) from sediments at selected sites in thePotomac River basin shown in Fig. 10.
128 DEFUR AND FOERSOM
health effects from toxic chemical exposures. Thedata do show the release of large quantities of toxicchemicals into the Bay ecosystem, including air,water, and land. Hot spots of contaminated sedi-ments around the areas of Baltimore, Washington,and Norfolk remain.
Biological systems are suf7ciently conservative instructure and function that Bay animals and sys-tems can and should be used as sentinels for healthof a wide array of animals, including humans. Ani-mals in the Bay system have great potential forserving as indictors and sentinels for monitoringboth human health and Bay health conditions.Examples include 7sh in the Elizabeth and JamesRivers and animals living in the bottom of BaltimoreHarbor. But the Bay program and state agenciesmake insuf7cient use of indicators and monitors.The overlap between human health and ecological
health has not been as fully examined and used inthe Bay as it might be.
While animal sentinels or indicators are viableand useful, with many known examples of the con-nection between the effects of contaminant expo-sures on the health of wildife and those on the healthof humans, the relationship is not suf7ciently tightto rely on its ability to satisfactorily protect humanhealth. One of the limitations is the diversity ofchemicals found in and released into the Bay; theother is the diversity of biological systems in theregion. Some wildlife species are more sensitive thanhumans and therefore are excellent candidates forindicator or sentinel species. In other cases, the useof animal sentinels has simply not been developedwith scienti7c data.
Some of the toxic chemicals in the Bay systemhave characteristics that do not permit quick and

TABLE 2Toxics Release Inventory (TRI) Summary Data for the Chesapeake Bay States, Based on Data Extracted June 10, 1998
Virginia Maryland Pennsylvania Washington, DC
Population 6,187,358 4,781,468 11,881,643 606,900Number of facilities 444 195 1,189 3On-site releases of air emissions 50,667,719 8,574,878 41,419,631 3,910Surface water discharges 1,190,262 1,845,508 22,588,120 300Underground injection 10 0 0 0Releases to land 1,068,761 1,920,064 2,563,778 5,000Total on-site releases 52,926,752 12,340,450 66,571,529 9,210On-site waste management recycling 178,353,208 18,543,556 387,088,578 0Energy recovery 29,707,489 13,397,901 50,287,872 0Treatment 317,701,825 34,012,979 149,234,860 1,695Total on-site waste management 317,701,825 65,954,436 586,611,310 1,695
Note. All chemical amounts are reported in pounds. For all releases estimated as a range, the midpoint of the range was used in thesecalculations.
TOXIC CHEMICALS IN THE BAY 129
reliable predictions of effects based on the initialestimates of exposures. These chemicals are persist-ent, bioaccumulative, frequently found in or asso-ciated with soils and sediments, and exert toxiceffects after some time period. Some of these chem-icals (e.g., PCBs, TBT, dioxins) exert effects at lowconcentrations, and perhaps in the next generationof animals.
Humans are exposed to conditions that Bay ani-mals and plants do not experience, and thereforehuman health protection needs to include monitor-ing and assessment activities not speci7cally in-cluded in the Bay programs. Air quality is the mostobvious area in which enhanced monitoring isneeded to protect human health, especially in popu-lation centers.
TABLEVirginia Toxics Release Inventory Summary
Chemical nameAir emis
dischar
Methanol 13,574,Toluene 7,196,8Ammonia 5,726,6Hydrochloric acid (1995 and after: ‘‘acid aerosols’’ only) 3,718,6Methyl ethyl ketone 2,823,2Xylene (mixed isomers) 2,489,3Dichloromethane 1,434,8Sulfuric acid (1994 and after: ‘‘acid aerosols’’ only) 1,422,1N-Hexane 964,473N-Butyl alcohol 879,184
Note. Results are based on data extracted on June 10, 1998. All chema range, the midpoint of the range was used in these calculations. Untherefore is not included in the table.
Few or no data exist on the multiple exposuresthat humans and the living resources in the Baysystem face. No one knows whether exposure to 500chemicals at low levels will have or is having someharmful effect on humans or on the Bay. It is notclear whether the multiple stresses faced by organ-isms living in estuarine conditions normally are pro-tective against the additional stresses caused byhuman activities or instead serve to make the re-sponses more severe and therefore more serious.
The delay or lag time present in many Bay pro-grams means that by the time some problems areidenti7ed, the conditions will have altered, some forthe worse. The most toxic chemicals are persistentand many are accumulative, as with DDT. Damagefrom activities that were halted years or decades ago
31996: Top 10 Chemicals for Total Releases
sionsges Surface water Releases to land Total releases
709 40,915 35,108 13,650,73250 566 154 7,197,57028 219,025 11,483 5,957,13621 0 0 3,718,62189 628 1,780 2,825,69718 0 355 2,489,67325 0 0 1,434,82553 0 19 1,422,172
0 0 964,4731,600 0 880,784
ical amounts are reported in pounds. For all releases estimated asderground injection was equal to zero for all top 10 chemicals and

TABLE 41996 Pennsylvania Toxics Release Inventory Summary 1996: Top 10 Chemicals for Total Releases
Chemical nameAir emissions
discharges Surface water Releases to land Total releases
Nitrate compounds 1 21,512,168 0 21,512,169Toluene 6,899,085 1,296 1,623 6,902,004Dichloromethane 4,364,672 76 0 4,364,748Methanol 4,088,085 18,619 3,710 4,110,414Hydrochloric acid (1995 and after: ‘‘acid aerosols’’ only) 3,136,780 500 0 3,137,280Methyl ethyl ketone 2,885,929 5,178 0 2,891,107Ammonia 2,412,609 193,565 1,414 2,607,588Xylene (mixed isomers) 2,578,002 630 14 2,578,646Trichloroethylene 1,759,544 363 0 1,759,907Styrene 1,562,802 102 12,965 1,575,869
Note. Results are based on data extracted on June 10, 1998. All chemical amounts are reported in pounds. For all releases estimated asa range, the midpoint of the range was used in these calculations.
130 DEFUR AND FOERSOM
persists for years and could have been prevented orat least lessened through expeditious monitoringand assessment programs.
Is There Harm?
The short answer is that no one knows for sure,but citizens want to know and state and federalagencies should be looking. The recent realizationthat compounds can act at low levels on reproductionand development in a variety of animals (Colbornand Clement, 1992; Kavlock et al., 1996) hasprompted a reexamination of the adequacy of toxic-ity testing and evaluation. Recently, Roe et al. (1997)found that the majority of chemicals in high produc-tion volume in the United States had only rudimen-tary toxicity data available on which to base
TABLEMaryland Toxics Release Inventory Summary
Chemical nameAir emis
dischar
Nitrate compounds 10Manganese compounds 34,093Carbonyl sul7de 1,357,Methanol 1,057,Toluene 780,43Xylene (mixed isomers) 636,31Styrene 601,00Sulfuric acid (1994 and after ‘‘acid aerosols’’ only) 469,23Ammonia 388,16Certain glycol ethers 427,58
Note. Results are based on data extracted on June 10, 1998. All chema range, the midpoint of the range was used in these calculations.
regulatory decisions. Roe et al. (1997) based theirwork on a random sample of 100 chemicals on thehigh production volume list, but the conclusions heldacross a larger group of the more than 75,000 chem-icals registered for use in commerce. EPA has nowinstituted a program, albeit a voluntary one, to cor-rect this de7ciency in chemical registration and test-ing programs.
State environmental and health departments arecharged with the responsibility of monitoring condi-tions related to human and environmental health,reporting results to the public, and taking appropri-ate actions. The discovery of toxic chemicals (PCBs,DDT, TBT, chlordane, and mercury) in sedimentsand 7sh tissues in the James River, Virginia, belowHopewell (Garman et al., 1998) points to the need forincreased diligence by state agencies in maintaining
51996: Top 10 Chemicals for Total Releases
sionsges Surface water Releases to land Total releases
1,516,774 80,267 1,597,05177,306 1,460,610 1,572,009
000 0 0 1,357,000563 0 0 1,057,5636 18 0 780,4542 9 0 636,3216 0 0 601,0060 0 0 469,2300 24,886 17,745 430,7919 0 5 427,594
ical amounts are reported in pounds. For all releases estimated as

TOXIC CHEMICALS IN THE BAY 131
monitoring efforts, even for banned or restrictedchemicals.
Next Steps: Monitoring for More Information
As extensive as local and even national efforts tomonitor and assess the condition of the Bay havebeen, these efforts have been limited and unevenlysuccessful. The original assessment of the Bay, com-pleted more than 15 years ago in 1983 and launchingthe cleanup effort (EPA, 1983), was a lengthy andfairly comprehensive assessment. This assessmentwas based on existing literature and 7eld surveyscompleted over a period of years. When the cleanupbegan in more earnest, workgroups were formed,including one on toxic chemicals. Much of themonitoring and cleanup effort was relegated to thestate level where agencies were charged with enforc-ing discharge limits and other control measures.Since 1983, the Bay Program has continued someattention on toxic chemicals, but toxic chemicalshave not been a priority or a focus of the Bay Pro-gram. The inability of the Bay Program toxic chem-icals workgroup to 7nalize the 1996 Toxics ofConcern list, as of the writing of this paper, is evid-ence for this conclusion.
The EPA undertook a more elaborate and far-reaching program to assess environmental condi-tions, presumably across the entire country, andbegan at the East Coast in the mid-Atlantic region.This program, the Environmental Monitoring andAssessment Program (EMAP), included measures ofthe relationships among ecological and humanhealth indicators. One goal was to understand someof the question posed in this symposium;the rela-tionships between environmental and humanhealth. Laudable as the goals were, EMAP met withmixed reviews at best. In a recent evaluation, theNational Research Council (NRC, 1995) concludedthat the undertaking was too grand and not suf7-ciently well focused to achieve meaningful results incomparison to the resources EPA devoted to EMAP.In the wake of EMAP, EPA and state agencies arenot monitoring water quality with respect to con-tamination from toxic chemicals through eitherwater, sediment, or 7sh tissue assessment pro-grams.
Policy Options: Risk Assessment andthe Precautionary Principle
The present regulatory approach in the UnitedStates has increasingly used risk-based programs(NRC, 1983, 1996). These programs have had mixed
success and the most dif7culty in dealing with toxicchemicals at low levels that exert effects that areless visually obvious. The risk-based approachmakes a number of assumptions, not the least ofwhich is that the problems are amenable to a toxico-logical analysis (e.g., exposure, effects, dose re-sponse, characterization). In addition, the toxico-logical approach is much more applicable to cases ofthe known than to cases of the unknown or thepredicted. Finally, the risk-based approach does notaccount for pollution prevention or for takinga whole-systems approach that includes widespreaduse of sentinel or indicator species.
Four Principles for Policy
An alternative to a risk-based approach could beincorporated into new policies to protect the environ-ment and human health from the effects of chem-icals released into the environment (deFur, 1999).
I. Every action needs to improve the environment.Keeping the status quo is not suf7cient. The as-sumption that many actions taken in modern societywere relatively environmentally neutral has simplynot proven true. Products, chemicals, and energyuse have changed the local, regional, and globalenvironment. Now, the next generation of decisionsmust promote and implement environmental recov-ery from many past actions.
II. Every act has an effect. The laws of thermo-dynamics apply here and for every action there willbe an equal and opposite reaction. Creating, using,and releasing chemicals will have some response inthe ‘‘environmental system.’’ The lesson from chem-icals that act on hormonal systems (e.g., see Colbornet al., 1993) is that even ‘‘neutral’’ chemicals haveunexpected effects;no one looked for these effectsat 7rst. New policies must anticipate the unexpectedby assuming that chemicals have toxic effects.
III. The timing makes the poison. Past toxicolo-gical practice has been that the dose makes thepoison. But now it is clear that some chemicals exertan effect only when administered at precise times,and perhaps without an effects threshold. It is notpossible to control the timing of an exposure to chem-icals present in the environment; therefore, guaran-tees of protection, safety, or even estimated risk aresimply not possible.
IV. Shift the burden of proof to the applicant andwhen in doubt, do not proceed. This policy assumesthat one more chemical, one more exposure, or evenmore of the same chemical will cause harm. The

132 DEFUR AND FOERSOM
burden of proof must shift to the applicant, the pro-poser, the activity, or the facility to demonstrate noharm. The automatic default must not allow furtherreleases, emissions, or uses when we cannot predictthe consequences. Society can no longer allow activ-ities to go forward, as a matter of default actionbecause of insuf7cient data to ‘‘prove’’ that it willcause harm. A corollary to this point is that lesscontamination is better: The fewer toxic chemicalsput into the environment, the better. With time andnormal ecological processes, some past errors will becovered and no longer accessible; others will be biolo-gically processed, but slowly. Lead will not degrade,and dioxin only degrades slowly.
REFERENCES
Allaby, M. Ed. (1991). ‘‘The Concise Oxford Dictionary of Zoology,’’Oxford Univ. Press, New York.
ATSDR. (1997). ‘‘Toxicological Pro7les,’’ ATSDR, Atlanta, GA.Audet, D. (1988). Summary of Chesapeake Bay Environmental
Contaminant Studies 1984}1988,’’ U.S. Fish and Wildlife Ser-vice, Annapolis, MD.
Bachman, R. et al. (1998). A Multi-Stakeholder Framework forEcological Risk Management: Proceedings of a SETAC Tech-nical Workshop.’’ SETAC, Pensacola, FL.
Bender, M. E., and Huggett, R. J. (1987). Contaminant Effects onChesapeake Bay Shell7sh. In ‘‘Contaminant Problems andManagement of Living Chesapeake Bay Resources,’’ (S. K.Majumdar, L. W. Hall, and H. M. Austin, Eds.) pp. 373}393.Pennsylvania Academy of Sciences, Philadelphia, PA.
Brooks, W. K. (1891). ‘‘The Oyster,’’ Johns Hopkins Press. Balti-more.
Cade, T. (1990). Peregrine falcon recovery. Endangered SpeciesUpdate 8, 40}45.
Colborn, T., and Clement, C., Eds. (1992). ‘‘Chemically}InducedAlterations in Sexual and Functional Development: The Wil-dlife Human/Connection,’’ Princeton Sci. Pub., Princeton, NJ.
Colborn, T., vom Saal, F., and Soto, A. (1993). Developmentaleffects of endocrine disrupting chemicals in wildlife and hu-mans. Environ. Health Perspect. 101, 378}384.
deFur, P. L. (1991). Water quality standards for dioxin threatenaquatic life and human health. In ‘‘New Perspectives in theChesapeake System,’’ Conference proceedings. CRC Publ. No.137, CRC Press, Annapolis, MD.
deFur, P. L. (1999). Public policy recommendations to address endo-crine disrupting chemicals. Biotechnology International 3, 1}6.
EDSTAC. (1998). ‘‘Endocrine Disruptor Screening and TestingAdvisory Committee Final Report to EPA,’’ US EPA, Washing-ton, DC.
EPA. (1983). ‘‘Chesapeake Bay: A Framework for Action,’’ USEPA, Chesapeake Bay Program Of7ce, Annapolis, MD.
EPA. (1992). ‘‘Biological Populations as Indicators of Environ-mental Change,’’ US EPA, Washington, DC.
Garman, G., Hale, R., Unger, M., and Rice, G. (1998). ‘‘Fish TissueAnalysis for Chlordecone (Kepone) and other Contaminants inthe James River, Virginia,’’ Virginia Commonwealth Univ.,Richmond, VA.
Hale, R. C., Smith, C. L., and de Fur, P. O. (2000). Nonylphenolsin ef8uents associated with diverse wastewater outfalls.Environ. Toxicol. Chem., in press.
Hanson, P. J. (1997). Response of hepatic trace element concen-trations in 7sh exposed to elemental and organic contaminants.Estuaries 20, 659}676.
Haven, D. (1987). The American oyster, Crassostrea virginica, inthe Chesapeake Bay. In ‘‘Contaminant Problems and Manage-ment of Living Chesapeake Bay Resources,’’ (S. K. Majumdar,L. W. Hall, and H. M. Austin, Eds.) pp. 165}176. PennsylvaniaAcademy of Sciences, Philadelphia, PA.
Helz, G., and Hugget, R. J., (1987). Contaminants in ChesapeakeBay: The regional perspective. In ‘‘Contaminant Problems andManagement of Living Chesapeake Bay Resources,’’ (S. K.Majumdar, L. W. Hall, and H. M. Austin, Eds.) pp. 270}297.Pennsylvania Academy of Sciences, Philadelphia, PA.
Ingersoll, C. D., Dillon, T., Biddinger, G. R. (1998). ‘‘EcologicalRisk Assessment of Contaminated Sediments,’’ SETAC Press,Pensacola, FL.
Jensen, L. D. et al. (1974). ‘‘Ecological Survey of the PatapscoRiver and Baltimore Harbor, MD,’’ Power Plant Site EvaluationProgram, Maryland Dept. of the Environ., Annapolis, MD.
Kavlock, R. et al. (1996). ‘‘Research needs for the risk assessmentof health and environmental effects of endocrine disruptors:A report of the US EPA-sponsored workshop.’’ Environ. HealthPerspect. 104(Suppl. 4), 715}740.
Klauda, R. J., and Bender, M. E. (1987). Contaminant effects onChesapeake Bay 7n7shes. In ‘‘Contaminant Problems andManagement of Living Chesapeake Bay Resources,’’ (S. K.Majumdar, L. W. Hall, and H. M. Austin, Eds.) pp. 321}372.Pennsylvania Academy of Sciences, Philadelphia, PA.
Kolpin, D. W., Barbash, J. E., and Gilliom, R. J. (1998). Occur-rence of pesticides in shallow groundwater of the United States:Initial results from the National Water Quality AssessmentProgram. Environ. Sci. Technol. 32, 558}566.
Landis, W. G., and Yu, M-L. (1998). ‘‘Introduction to Environ-mental Toxicology,’’ Lewis, Boca Raton, FL.
Lindsey, B. D., Breen, K. J., Bilger, M. D., and Brightbill, R. A.(1998). ‘‘Water Quality in the Lower Susquehanna River Basin,Pennsylvania, and Maryland, 1992}95,’’ U.S. Geol. Surv. Circ.1168. [On line at (URL:http://water.usgs.gov/pubs/circ1168[, updated April 2, 1998.]
Mangum, C. P., and Hochachka, P. W. (1998). New directions incomparative physiology and biochemistry: Mechanisms, ad-aptations and evolution. Physiol. Zool. 71, 417}484.
Maryland Oyster Roundtable. (1995). ‘‘Report to Departmentof Natural Resources, Maryland, from the Roundtable,December 1995,’’ Maryland Dept. of Natural Resources, An-napolis, MD.
NRC. (1983). ‘‘Risk Assessment in the Federal Government:Managing the Process,’’ National Academy Press, Washington,DC.
NRC. (1991). ‘‘Animals as Sentinels of Environmental HealthHazards,’’ National Academy Press, Washington, DC.
NRC. (1993). ‘‘Science and Judgement in Risk,’’ National Acad-emy Press, Washington, DC.
NRC. (1995). ‘‘Review of EPA’s Environmental Monitoring andAssessment Program,’’ National Academy Press, Washington,DC.
NRC. (1996). ‘‘Understanding Risk,’’ National Academy Press,Washington, DC.

TOXIC CHEMICALS IN THE BAY 133
Pearson, D. L. (1995). Selecting indicator taxa for the quantitat-ive assessment of biodiversity. In ‘‘Biodiversity: Measurementand Estimation’’ (D. L. Hawksworth, Ed.) Chapman & Hall,NY.
P7tzenmeyer, H. T. (1971). Benthic Fauna of Baltimore Harbor,MD.
Roe, D., Pease, W., Florini, K., and Silbergeld, E. K. (1997). ‘‘ToxicIgnorance,’’ Environmental Defense Fund, Washington, DC.
Schimmel, S. C., Patrick, J. M., Faas, L. F., Ogelsby, J. L., andWilson, A. J., Jr. (1979). Kepone toxicity and bioaccumulationin blue crabs. Estuaries 2, 915.
Schubel, J. R., and Pritchard, D. W. (1987). A brief physicaldescription of the Chesapeake Bay. In ‘‘Contaminant Problemsand Management of Chesapeake Bay Living Resources,’’ (S. K.Majumdar, L. W. Hall, and H. M. Austin, Eds.) pp. 1}32, Pen-nsylvania Academy of Sciences, Philadelphia, PA.
Spruill, T. B., Harned, D. H., Ruhl, P. M., Eimers, J. L.,McMahon, G., Smith, K. E., Galeone, D. R., and Woodside,M. D. (1998). ‘‘Water Quality in the Arbmarle}Pamlico Drain-age Basin, North Carolina and Virginia, 1992}1995,’’ U.S. Geol.Surv. Circ. 1157.
Suter, G. W., II. (1997). Integration of human health and ecologi-cal risk assessment. Environ. Health Perspect. 105, 1282}1283.
Taylor, J. R., Selhorst, J. B., Houff, S. A., Martinez, A. J. (1978).Chlordecone intoxication in man. I. Clinical observations. Neur-ology 28, 626}630.
U.S. Geological Survey. (1996). ‘‘Pesticides in Groundwater,’’USGS Fact Sheet. FS 244-95. USGS, Sacramento, CA.
Van Veld, P., Vogelbein, W. K., Cochran, M. K., Goksoyr, A., andStegeman, J. J. (1997). Route-speci7c cellular expression ofcytochrome P450A (CYP1A) in 7sh (Fundulus heteroclitus) fol-lowing exposure to aqueous and dietary benzo[a]pyrene. Toxi-col. Appl. Pharmacol. 142, 348}359.