Embed Size (px)
Citation preview
RTI International
RTI International is a trade name of Research Triangle Institute. www.rti.org
TPH Methods and Measurements and Petroleum Vapor Intrusion (PVI) Risks
Robert Truesdale, RTI InternationalHeidi Hayes, Eurofins Air Toxics
Ian Hers, Golder Associates
1
RTI International
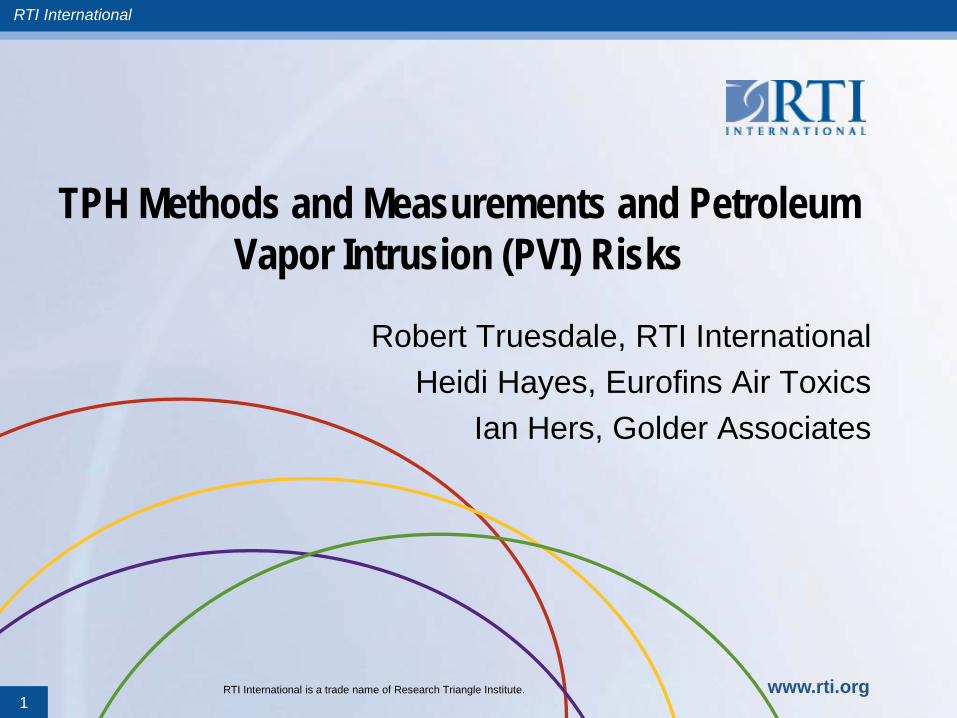
Actual PVI is very rare Why? PHCs biodegrade
readily; CHCs do not = a thickness of “clean” (aerobic) soil is all that’s needed to prevent PVI (NAPL or dissolved)
CHCs can be treated as single chemicals; PHCs are a complex mixture.
How do petroleum & chlorinated hydrocarbons differ in vapor intrusion?
http://www.epa.gov/oust/cat/pvi/pvicvi.pdf2
RTI International
Reason for Presentation (Why?)
Total petroleum hydrocarbon (TPH) definitions and methods vary, from state to state, from site to site, from publication to publication, & within EPA’s PVI database.
This variation = uncertainties: (e.g., what chemicals does a particular TPH measurement represent?)
This uncertainty led to limited use of TPH in EPA’s analysis of the PVI database
Although benzene is usually assumed to drive vapor risk at petroleum sites Brewer et al. (2012) and this presentation suggest that TPH often drives vapor risk, especially with the new EPA inhalation RSLs for TPH fractions.
3
RTI International
Objectives - Organization1. Review TPH vapor methods and demonstrate how they
differ in terms of what is measured
2. Examine relative levels and risks of TPH and benzene in soil gas samples from U.S. EPA’s petroleum vapor intrusion (PVI) database
3. Conclusions and recommendations for selecting and using vapor-phase TPH methods at petroleum hydrocarbon sites
4
RTI International
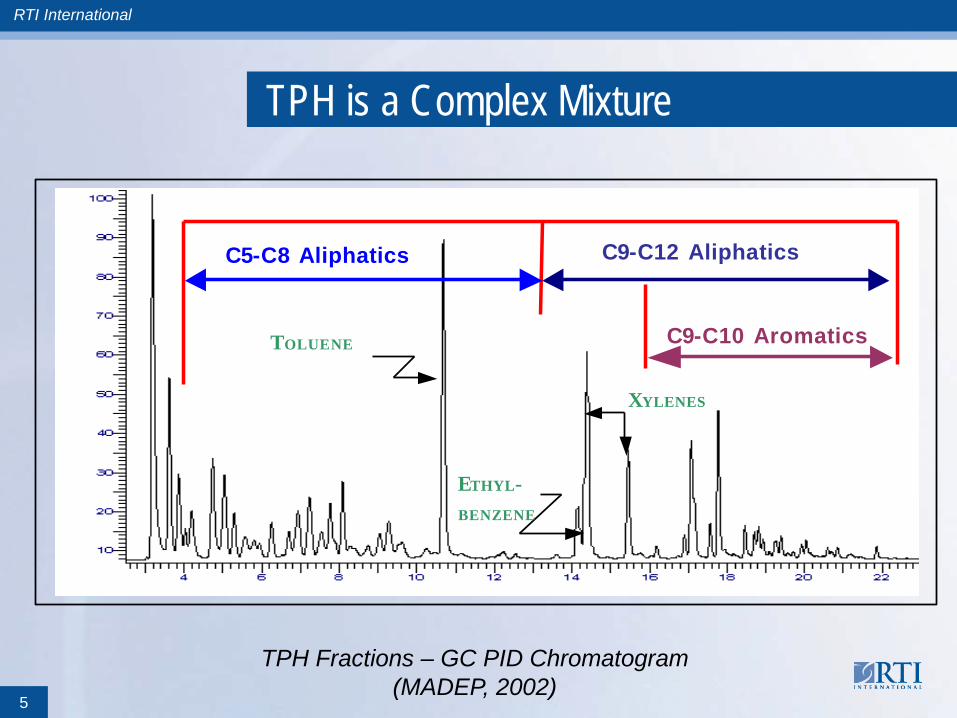
TPH is a Complex Mixture
C5-C8 Aliphatics C9-C12 Aliphatics
TOLUENE C9-C10 Aromatics
XYLENES
ETHYL- BENZENE
TPH Fractions – GC PID Chromatogram (MADEP, 2002)
5
RTI International
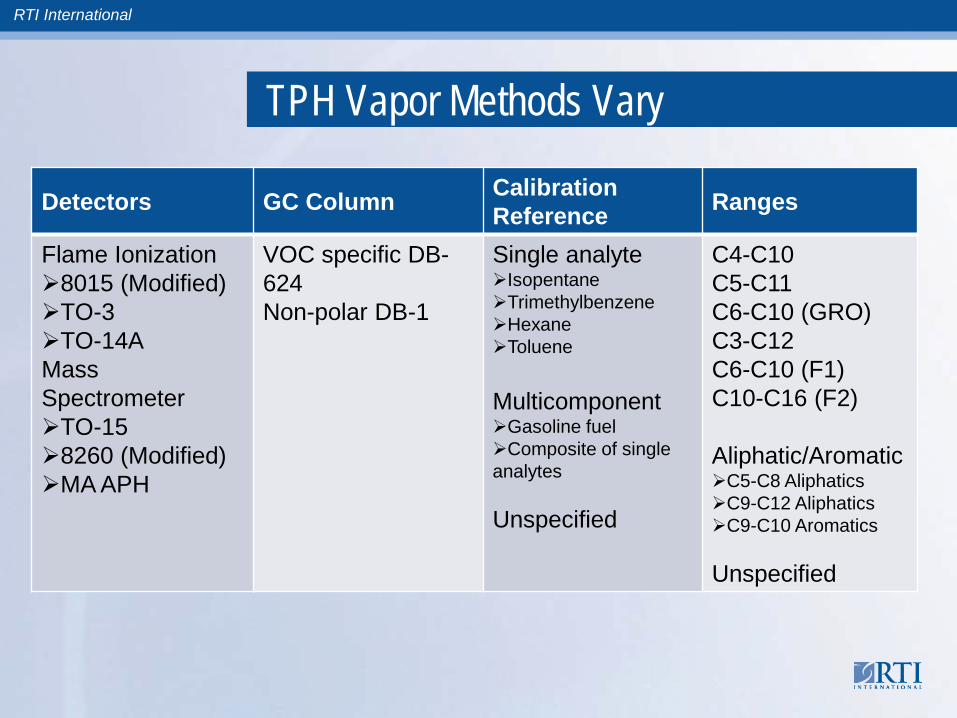
TPH Vapor Methods Vary
Detectors GC Column Calibration Reference Ranges
Flame Ionization8015 (Modified)TO-3TO-14AMass SpectrometerTO-158260 (Modified)MA APH
VOC specific DB-624Non-polar DB-1
Single analyteIsopentaneTrimethylbenzeneHexaneToluene
MulticomponentGasoline fuelComposite of single analytes
Unspecified
C4-C10C5-C11C6-C10 (GRO)C3-C12C6-C10 (F1)C10-C16 (F2)
Aliphatic/AromaticC5-C8 AliphaticsC9-C12 AliphaticsC9-C10 Aromatics
Unspecified
RTI International
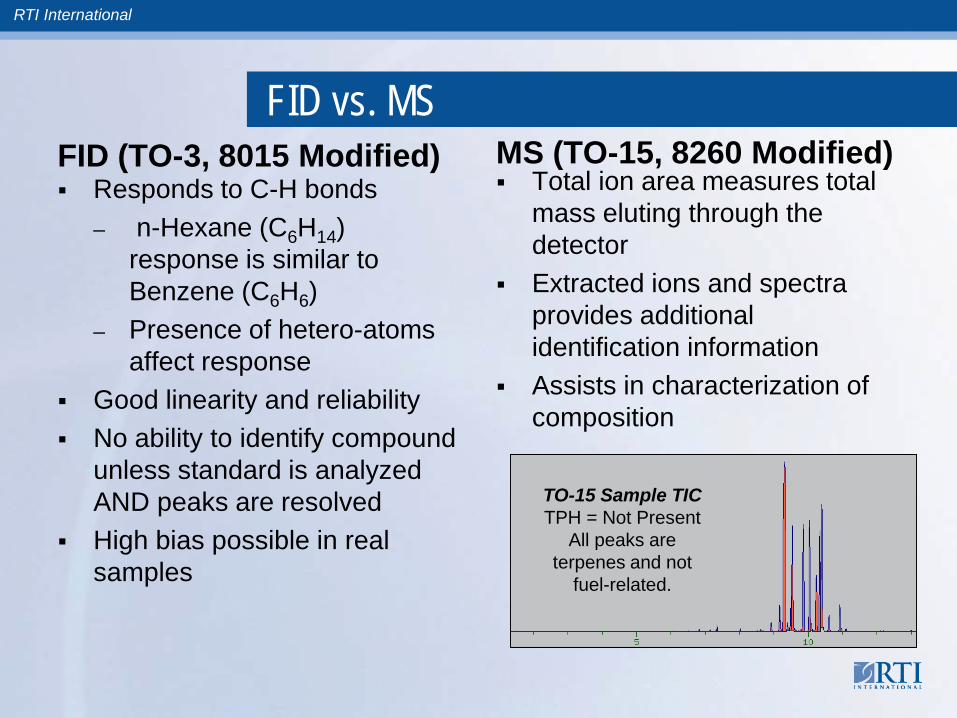
FID vs. MSFID (TO-3, 8015 Modified) Responds to C-H bonds
– n-Hexane (C6H14) response is similar to Benzene (C6H6)
– Presence of hetero-atoms affect response
Good linearity and reliability No ability to identify compound
unless standard is analyzed AND peaks are resolved
High bias possible in real samples
MS (TO-15, 8260 Modified) Total ion area measures total
mass eluting through the detector
Extracted ions and spectra provides additional identification information
Assists in characterization of composition
TO-15 Sample TICTPH = Not Present
All peaks are terpenes and not
fuel-related.
RTI International
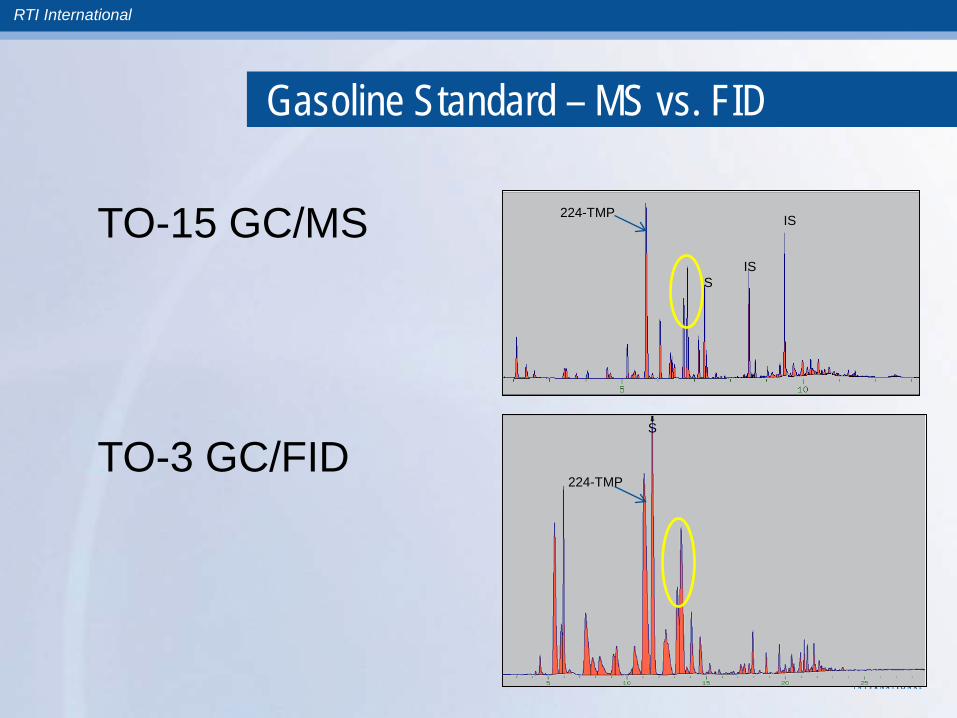
Gasoline Standard – MS vs. FID
IS
ISS
S
224-TMP
224-TMP
TO-15 GC/MS
TO-3 GC/FID
RTI International
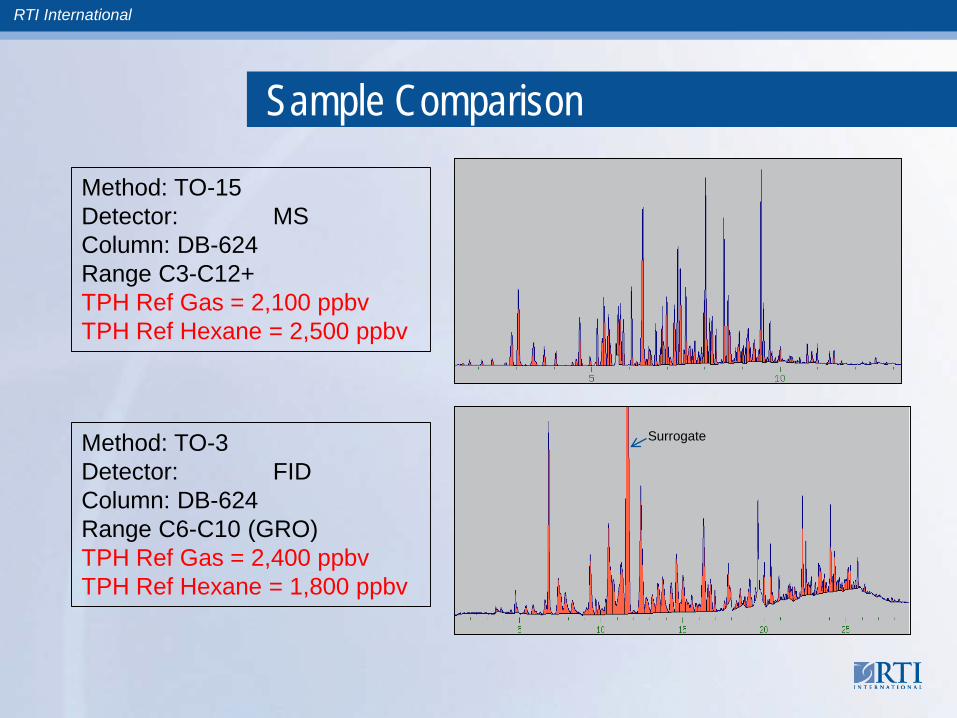
Sample Comparison
Surrogate
Method: TO-15Detector: MSColumn: DB-624Range C3-C12+ TPH Ref Gas = 2,100 ppbvTPH Ref Hexane = 2,500 ppbv
Method: TO-3Detector: FIDColumn: DB-624Range C6-C10 (GRO)TPH Ref Gas = 2,400 ppbvTPH Ref Hexane = 1,800 ppbv
RTI International
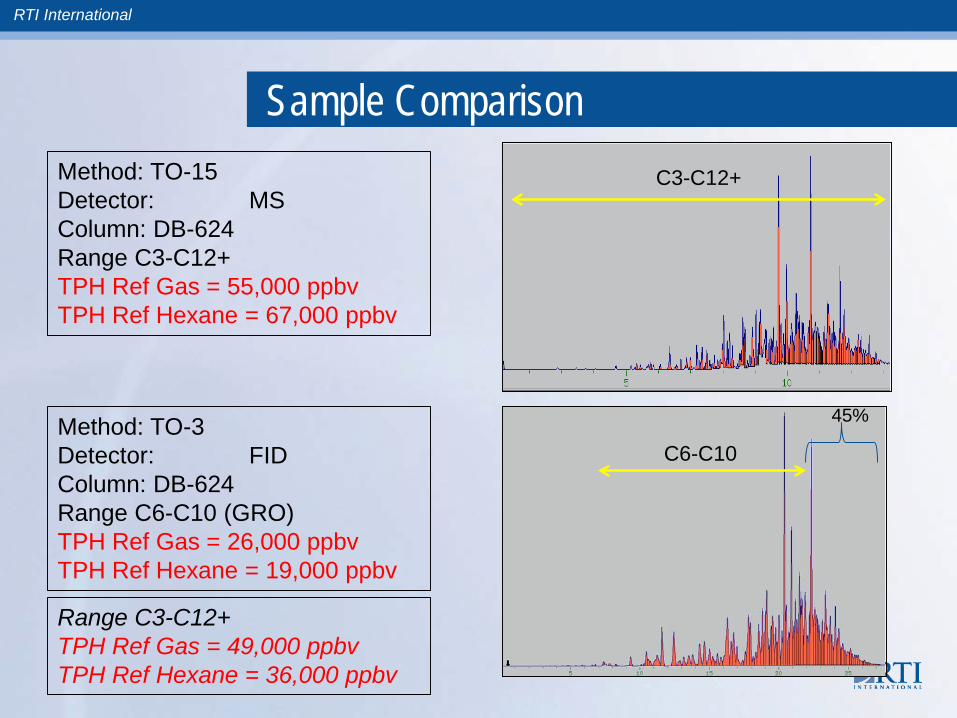
Sample ComparisonMethod: TO-15Detector: MSColumn: DB-624Range C3-C12+ TPH Ref Gas = 55,000 ppbvTPH Ref Hexane = 67,000 ppbv
Method: TO-3Detector: FIDColumn: DB-624Range C6-C10 (GRO)TPH Ref Gas = 26,000 ppbvTPH Ref Hexane = 19,000 ppbv
C3-C12+
C6-C10
45%
Range C3-C12+TPH Ref Gas = 49,000 ppbvTPH Ref Hexane = 36,000 ppbv
RTI International
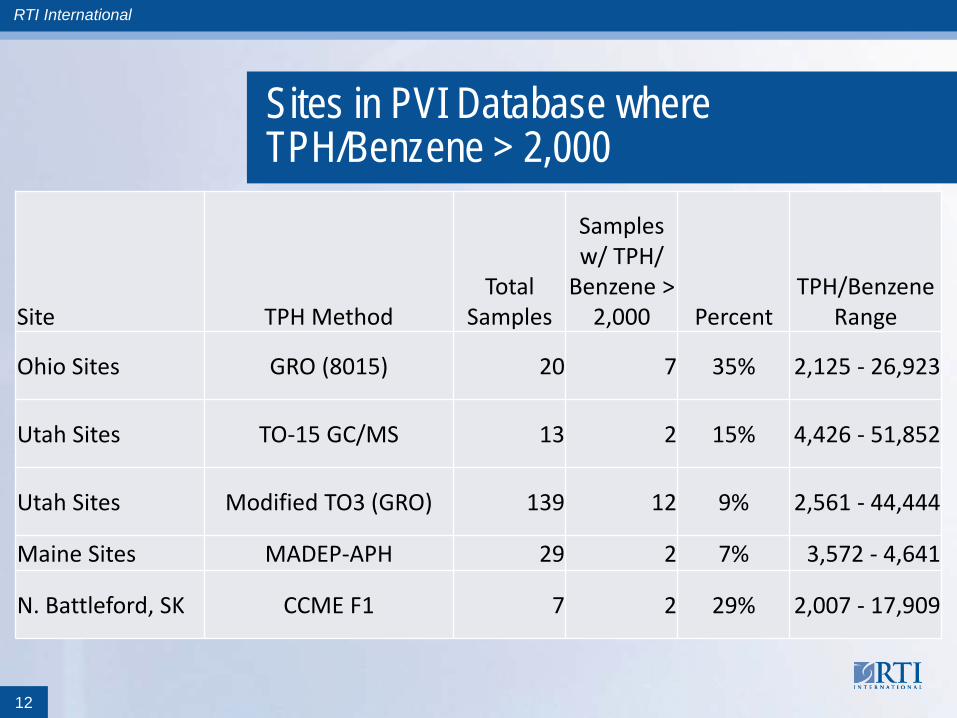
Characterization of TPH vs. Benzene Risk in PVI Database – Problem Identification
Calculated TPH/benzene ratios for PVI database samples with detectable benzene and TPH to identify samples where TPH risk may be higher than benzene.
Simplistic analysis used a TPH/benzene ratio of 2,000(from Roger Brewer’s work) to roughly approximate point at which TPH risk may be comparable or greater than benzene risk
Tabulated results by TPH method in PVI database
11
RTI International
Sites in PVI Database where TPH/Benzene > 2,000
Site TPH MethodTotal
Samples
Samples w/ TPH/
Benzene > 2,000 Percent
TPH/Benzene Range
Ohio Sites GRO (8015) 20 7 35% 2,125 - 26,923
Utah Sites TO-15 GC/MS 13 2 15% 4,426 - 51,852
Utah Sites Modified TO3 (GRO) 139 12 9% 2,561 - 44,444
Maine Sites MADEP-APH 29 2 7% 3,572 - 4,641
N. Battleford, SK CCME F1 7 2 29% 2,007 - 17,909
12
RTI International
EPA Inhalation Regional Screening Levels (RSLs) for TPH Fractions
Released summer 2013 10-6 target cancer risk; 0.1 and 1 hazard quotient Based on EPA Provisional Peer Reviewed
Toxicity Values (PPRTVs) Set cancer-based values for C5-C8 and C9-C18
aliphatics and C6-C8 aromatics C6-C8 aromatic inhalation RSL = benzene RSL Will 2,000 x rule hold?
13
RTI International
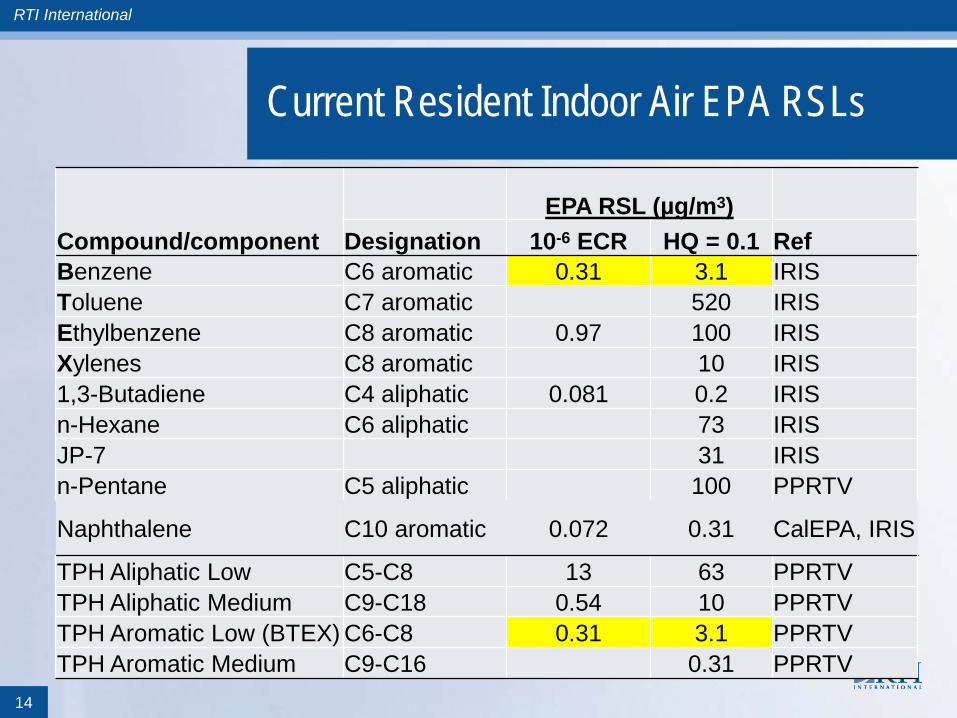
Current Resident Indoor Air EPA RSLs
Compound/componentEPA RSL (µg/m3)
Designation 10-6 ECR HQ = 0.1 RefBenzene C6 aromatic 0.31 3.1 IRISToluene C7 aromatic 520 IRISEthylbenzene C8 aromatic 0.97 100 IRISXylenes C8 aromatic 10 IRIS1,3-Butadiene C4 aliphatic 0.081 0.2 IRISn-Hexane C6 aliphatic 73 IRISJP-7 31 IRISn-Pentane C5 aliphatic 100 PPRTV
Naphthalene C10 aromatic 0.072 0.31 CalEPA, IRIS
TPH Aliphatic Low C5-C8 13 63 PPRTVTPH Aliphatic Medium C9-C18 0.54 10 PPRTVTPH Aromatic Low (BTEX) C6-C8 0.31 3.1 PPRTVTPH Aromatic Medium C9-C16 0.31 PPRTV
14
RTI International
Application of RSLs to Maine UST Site Data
3 gas station sites from EPA PVI database Very coarse (S&G), coarse (S), and fine (silt) soils 2 soil gas samples per site Sample depths from 2 – 11 feet BGS Probes leak-checked CH4 BDL; O2 = 14 – 17% (aerobic) Detectable BTEX, 1,3-butadiene; naphthalene;
MassDEP air phase petroleum hydrocarbon (APH) fractions
TPH/benzene ratio range: 42 - 359
15
RTI International
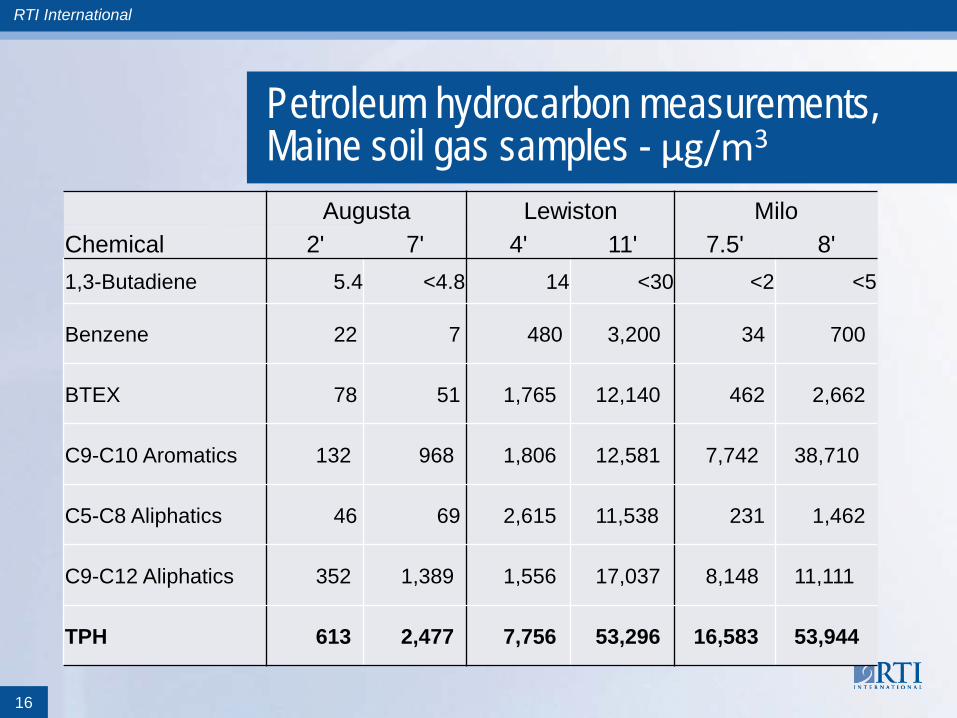
Petroleum hydrocarbon measurements, Maine soil gas samples - µg/m3
Augusta Lewiston MiloChemical 2' 7' 4' 11' 7.5' 8'1,3-Butadiene 5.4 <4.8 14 <30 <2 <5
Benzene 22 7 480 3,200 34 700
BTEX 78 51 1,765 12,140 462 2,662
C9-C10 Aromatics 132 968 1,806 12,581 7,742 38,710
C5-C8 Aliphatics 46 69 2,615 11,538 231 1,462
C9-C12 Aliphatics 352 1,389 1,556 17,037 8,148 11,111
TPH 613 2,477 7,756 53,296 16,583 53,944
16
RTI International
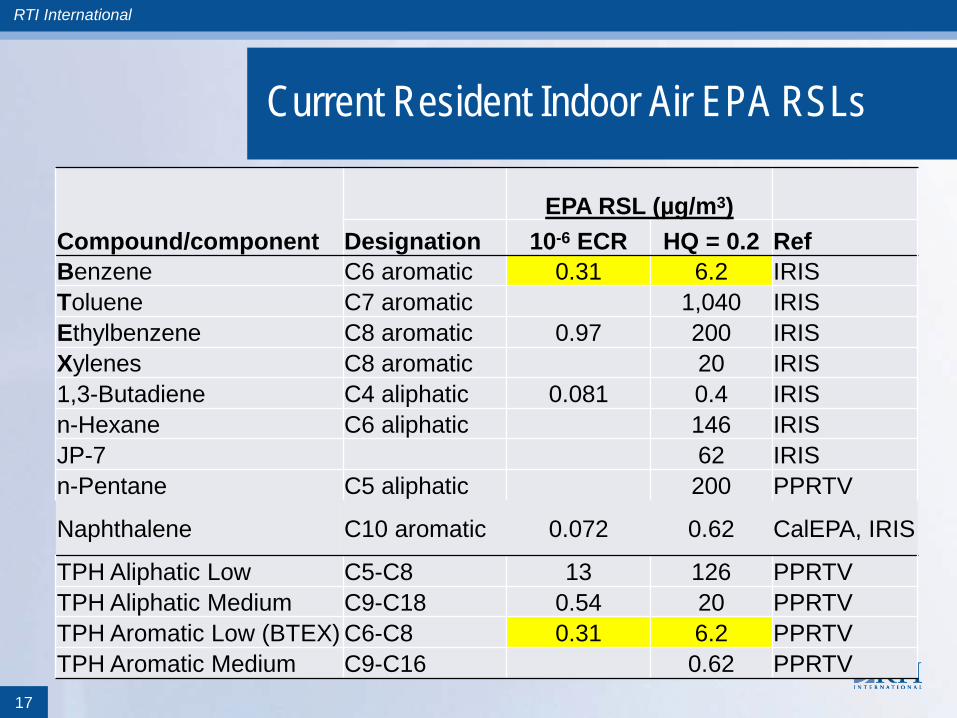
Current Resident Indoor Air EPA RSLs
Compound/componentEPA RSL (µg/m3)
Designation 10-6 ECR HQ = 0.2 RefBenzene C6 aromatic 0.31 6.2 IRISToluene C7 aromatic 1,040 IRISEthylbenzene C8 aromatic 0.97 200 IRISXylenes C8 aromatic 20 IRIS1,3-Butadiene C4 aliphatic 0.081 0.4 IRISn-Hexane C6 aliphatic 146 IRISJP-7 62 IRISn-Pentane C5 aliphatic 200 PPRTV
Naphthalene C10 aromatic 0.072 0.62 CalEPA, IRIS
TPH Aliphatic Low C5-C8 13 126 PPRTVTPH Aliphatic Medium C9-C18 0.54 20 PPRTVTPH Aromatic Low (BTEX) C6-C8 0.31 6.2 PPRTVTPH Aromatic Medium C9-C16 0.62 PPRTV
17
RTI International
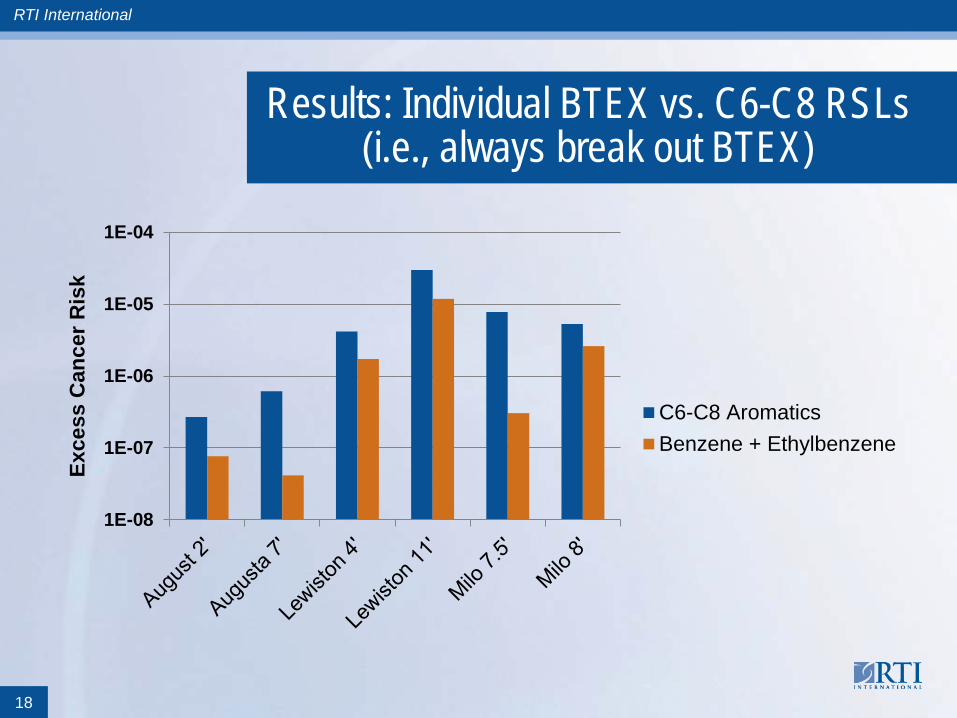
Results: Individual BTEX vs. C6-C8 RSLs (i.e., always break out BTEX)
1E-08
1E-07
1E-06
1E-05
1E-04
Exce
ss C
ance
r Ris
k
C6-C8 AromaticsBenzene + Ethylbenzene
18
RTI International
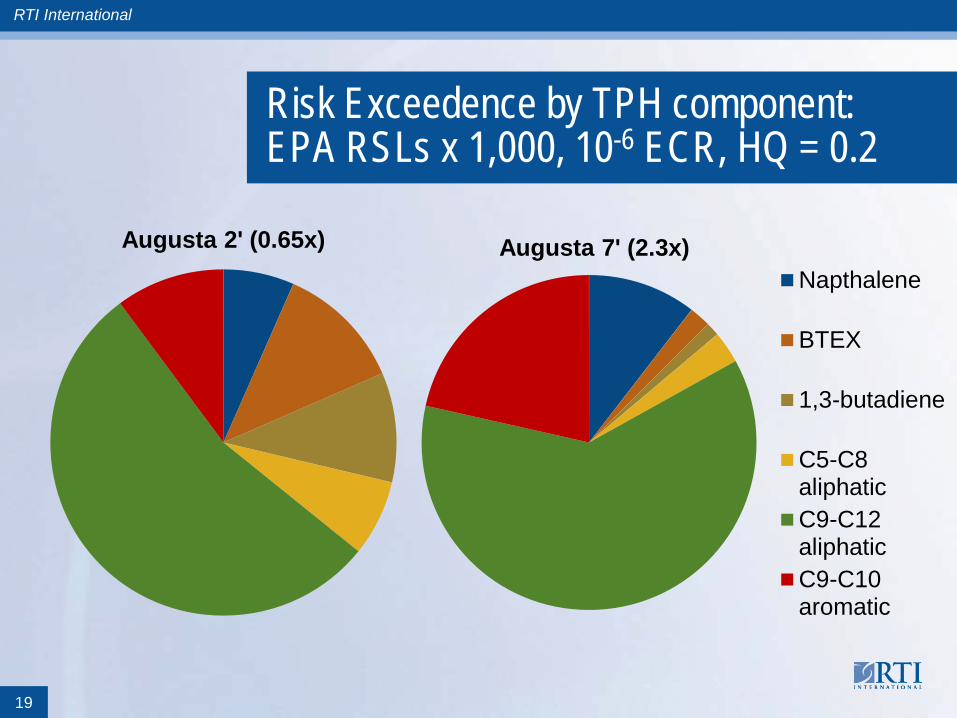
Risk Exceedence by TPH component: EPA RSLs x 1,000, 10-6 ECR, HQ = 0.2
Augusta 7' (2.3x)Napthalene
BTEX
1,3-butadiene
C5-C8aliphaticC9-C12aliphaticC9-C10aromatic
Augusta 2' (0.65x)
19
RTI International
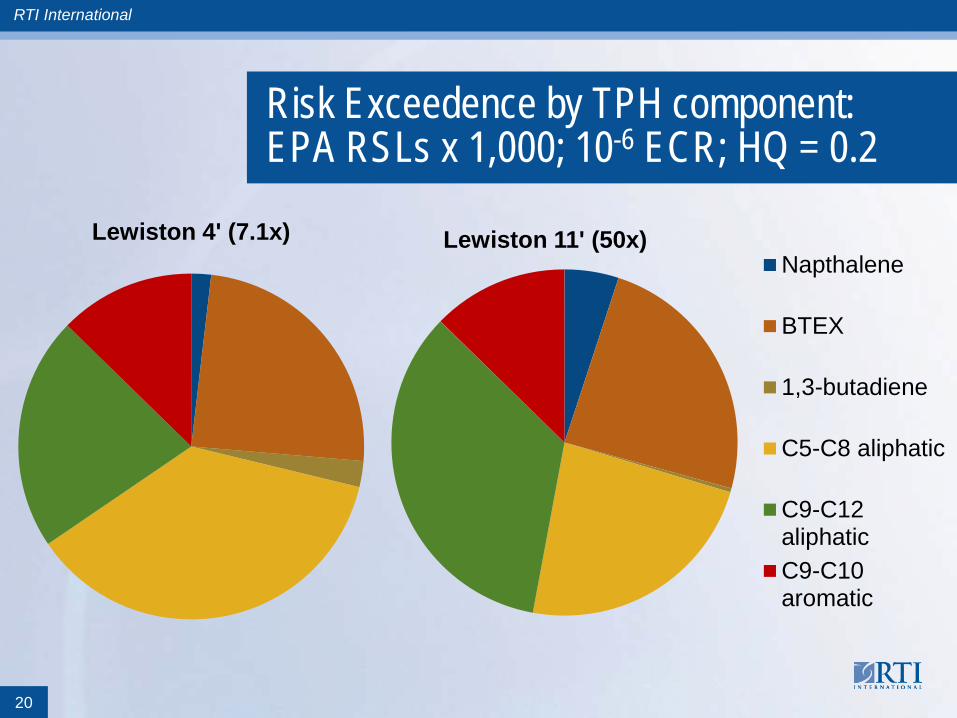
Risk Exceedence by TPH component: EPA RSLs x 1,000; 10-6 ECR; HQ = 0.2
Lewiston 11' (50x)Napthalene
BTEX
1,3-butadiene
C5-C8 aliphatic
C9-C12aliphaticC9-C10aromatic
Lewiston 4' (7.1x)
20
RTI International
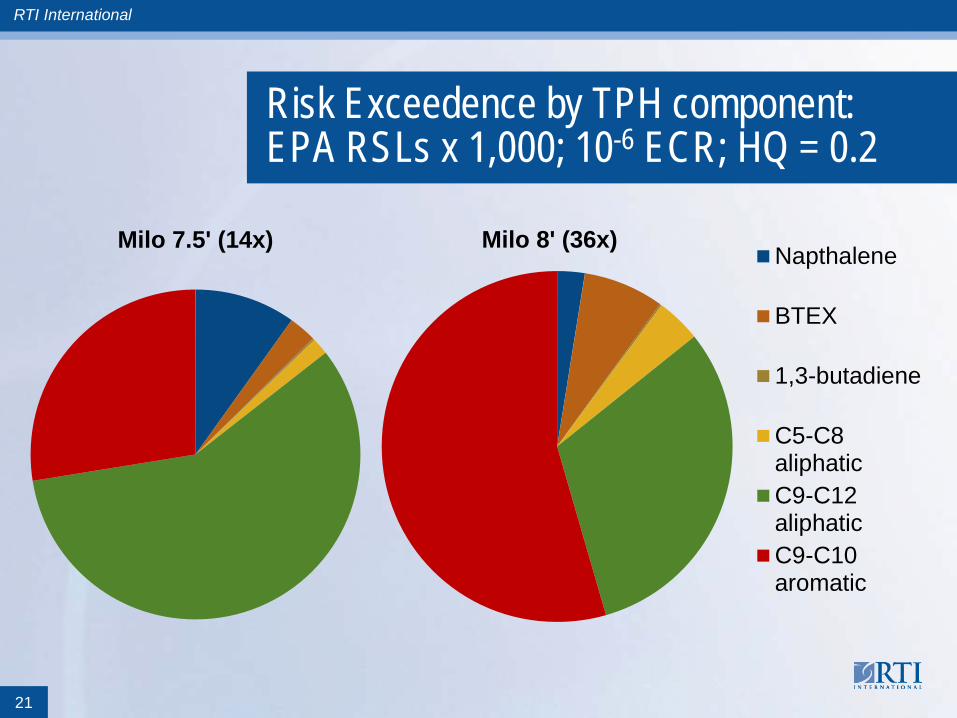
Risk Exceedence by TPH component: EPA RSLs x 1,000; 10-6 ECR; HQ = 0.2
Milo 8' (36x)Napthalene
BTEX
1,3-butadiene
C5-C8aliphaticC9-C12aliphaticC9-C10aromatic
Milo 7.5' (14x)
21
RTI International
Conclusions1. Although previous studies by Hawaii DOH suggested that benzene
concentrations usually drive inhalation risks at PVI sites, the recent EPA TPH-fractions RSLs increase risk levels for non-benzene components so that they are similar or greater than benzene.
2. TPH is an important/driving volatile chemical component at gasoline sites, especially where benzene may be depleted.
3. Because the number of TPH compounds are vast and vary with fuel composition and age in an environmental sample, there really is no single “right answer” – for a TPH measurement in gas or other media. Ask the right questions of your analyst and regulator to get the analyses you need for petroleum hydrocarbon decisions.
4. Remember: PHCs readily biodegrade; actual PVI is rare
22
RTI International
Recommendations1. TPH methods do make a difference – be consistent with and
knowledgeable of methods and screening levels that you use at your investigative sites .
– Better yet, the industry needs a standard, practical TPH measurement definition that air labs can easily accommodate on a production basis.
2. Make sure the method(s) cover the full carbon range expected for the fuel type being investigated
– Use your lab as a resource. Reviewing the sample pattern as compared to the reference fuels and carbon ranges can be a valuable investigative tool.
3. FID and MS TPH methods can give equivalent results, but only if applied to the same carbon range AND sample is largely comprised of fuel-related VOCs.
– Using MS as a detector (TO-15), allows the lab to remove non-TPH peaks that may result in anomalous TPH measurements, and MS allows for positive identification and characterization. One could use both with MS to confirm that non-PHC compounds are not present.
23
RTI International
Summary: There is a need for a standard definition of TPH that is useful, practical, and cost-effective, to enable consistent comparison and evaluation of TPH values among sites and between labs and to allow characterization of vapor phase TPH risk at petroleum hydrocarbon sites.
24
RTI International
More Information
Robert TruesdaleRTI [email protected]
Heidi HayesEurofins Air [email protected]
Ian HersGolder [email protected]
25