Embed Size (px)
Citation preview
TPM11 - Session 4
PRA1. Freshwater Pollution- Progress in TPM Fresh Water
Chinese Research Academy of Environmental Sciences
November, 2014
Contents Part I: Organization of the Workshop Part II: Presentation No. 1
Part III: Presentation No. 2 Part Ⅳ: Onsite Visit of Menlou Reservoir Basin Part Ⅴ: Prospects

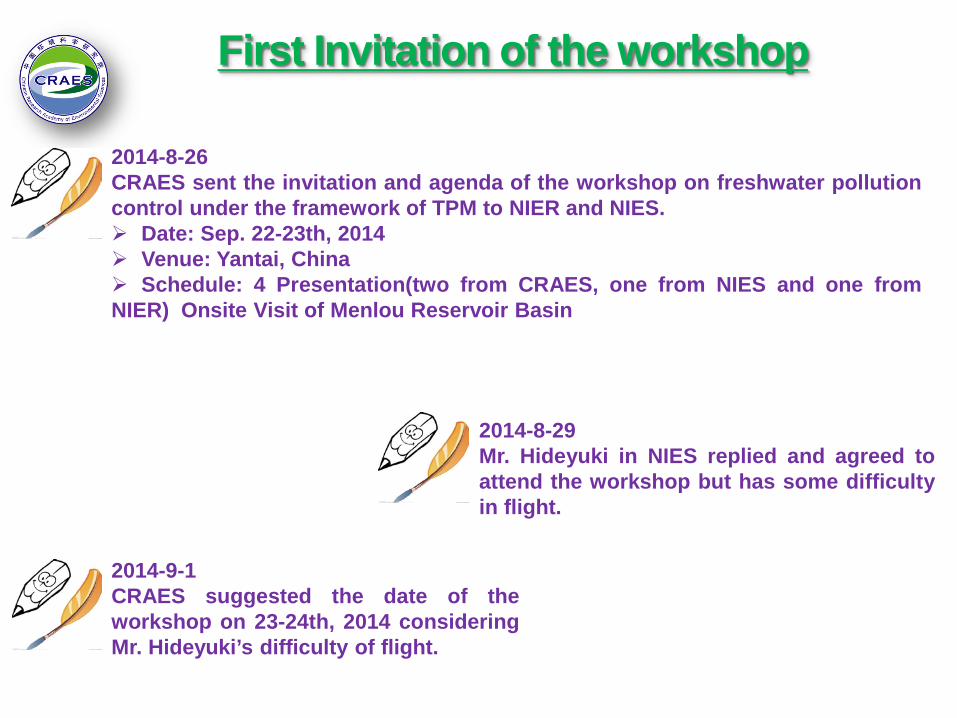
First Invitation of the workshop
2014-8-26 CRAES sent the invitation and agenda of the workshop on freshwater pollution control under the framework of TPM to NIER and NIES. Date: Sep. 22-23th, 2014 Venue: Yantai, China Schedule: 4 Presentation(two from CRAES, one from NIES and one from NIER) Onsite Visit of Menlou Reservoir Basin
2014-8-29 Mr. Hideyuki in NIES replied and agreed to attend the workshop but has some difficulty in flight.
2014-9-1 CRAES suggested the date of the workshop on 23-24th, 2014 considering Mr. Hideyuki’s difficulty of flight.
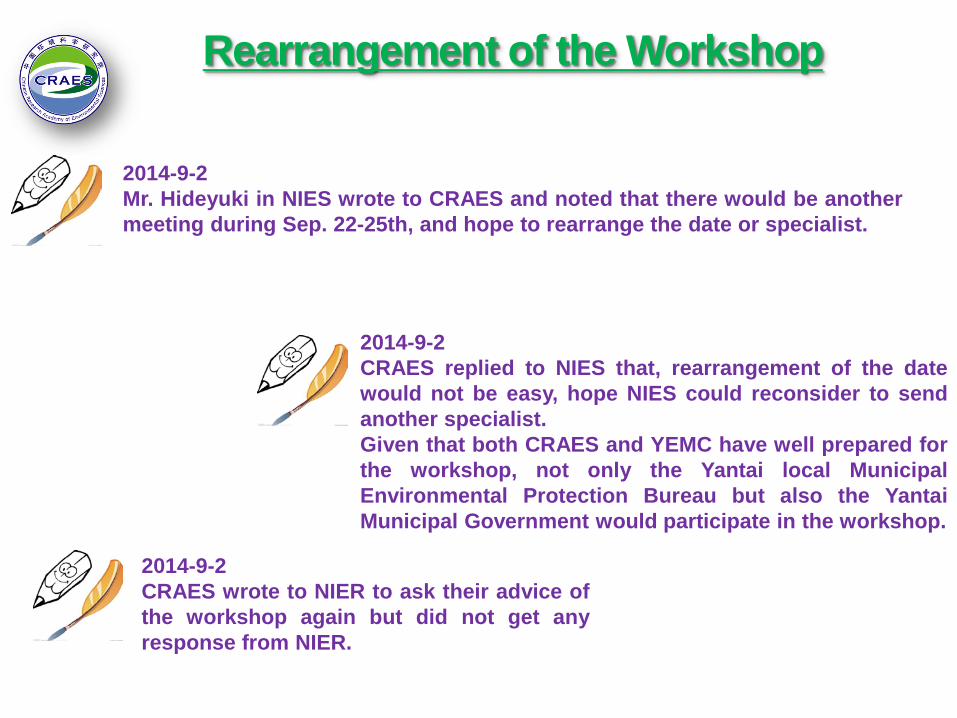
Rearrangement of the Workshop
2014-9-2 Mr. Hideyuki in NIES wrote to CRAES and noted that there would be another meeting during Sep. 22-25th, and hope to rearrange the date or specialist.
2014-9-2 CRAES replied to NIES that, rearrangement of the date would not be easy, hope NIES could reconsider to send another specialist. Given that both CRAES and YEMC have well prepared for the workshop, not only the Yantai local Municipal Environmental Protection Bureau but also the Yantai Municipal Government would participate in the workshop.
2014-9-2 CRAES wrote to NIER to ask their advice of the workshop again but did not get any response from NIER.
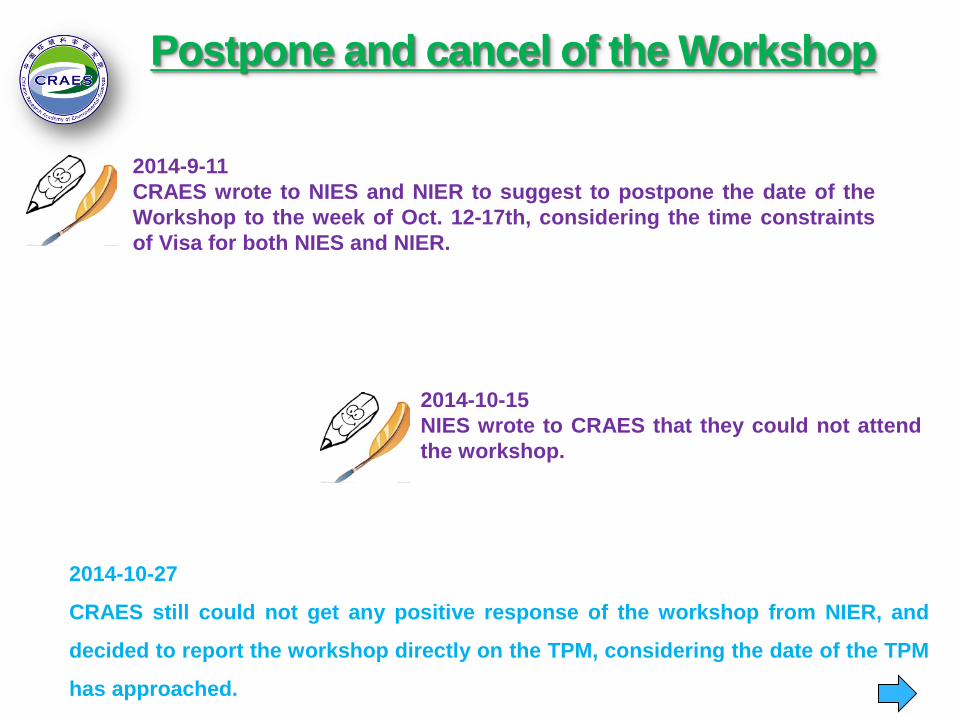
2014-10-27
CRAES still could not get any positive response of the workshop from NIER, and
decided to report the workshop directly on the TPM, considering the date of the TPM
has approached.
Postpone and cancel of the Workshop
2014-10-15 NIES wrote to CRAES that they could not attend the workshop.
2014-9-11 CRAES wrote to NIES and NIER to suggest to postpone the date of the Workshop to the week of Oct. 12-17th, considering the time constraints of Visa for both NIES and NIER.
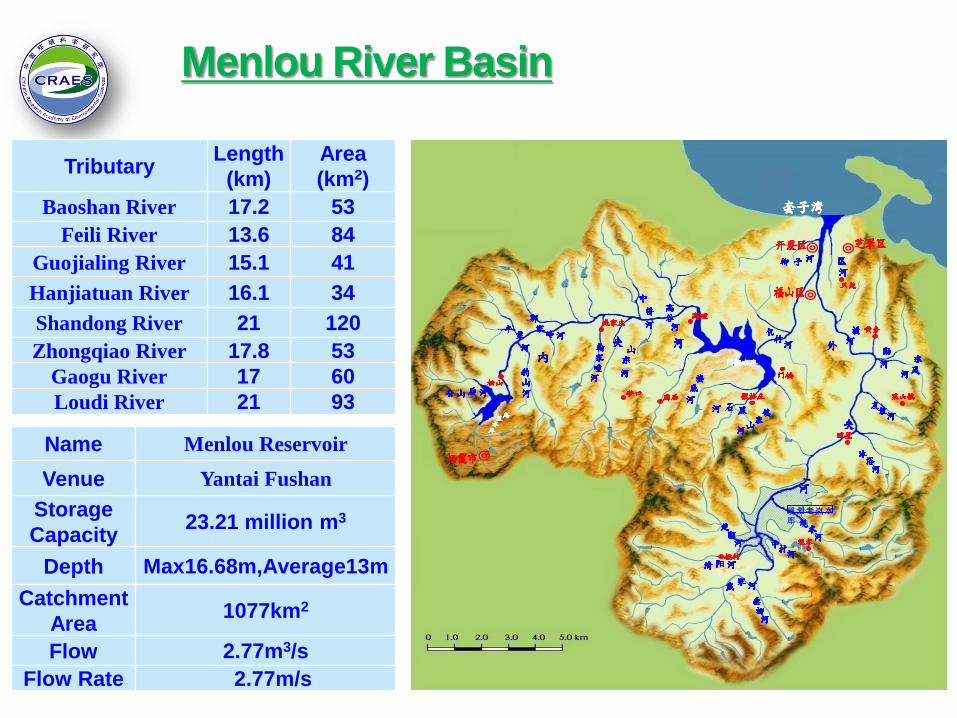
Tributary Length (km)
Area (km2)
Baoshan River 17.2 53 Feili River 13.6 84
Guojialing River 15.1 41 Hanjiatuan River 16.1 34 Shandong River 21 120 Zhongqiao River 17.8 53
Gaogu River 17 60 Loudi River 21 93
Name Menlou Reservoir Venue Yantai Fushan
Storage Capacity 23.21 million m3
Depth Max16.68m,Average13m Catchment
Area 1077km2
Flow 2.77m3/s Flow Rate 2.77m/s
Menlou River Basin
规划老岚水库
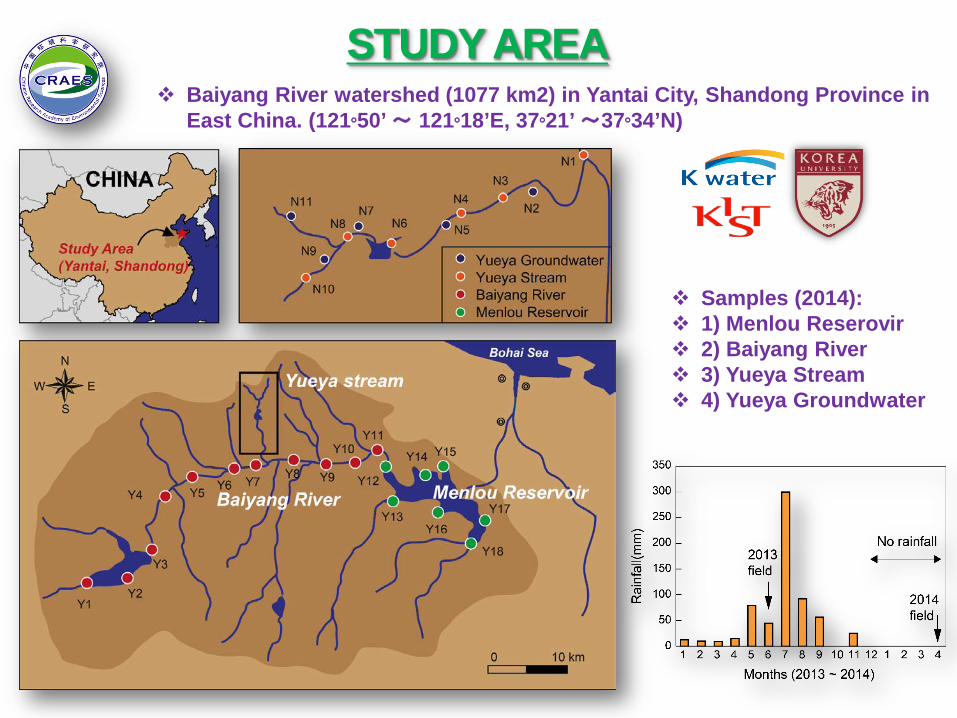
STUDY AREA Baiyang River watershed (1077 km2) in Yantai City, Shandong Province in
East China. (121◦50’ ~ 121◦18’E, 37◦21’ ~37◦34’N)
Samples (2014): 1) Menlou Reserovir 2) Baiyang River 3) Yueya Stream 4) Yueya Groundwater

Project for the Comprehensive Watershed
Management Study in Qingdao and Yantai to
Reduce Pollutants in the Yellow Sea
KOICA KIST KU
2012.2-2014.8
NO3-N and COD during two years (2011 ~ 2012) The average NO3-N of this study area were 12.7 and 21.5 mg/L The objectives are to assess the water quality status and to identify the major pollution sources. For this, we sampled different water bodies and analyzed: • Inorganic chemical compositions (pH, Cations, and Anoins) • Dual isotopic values of nitrate (δ 15 N and δ 18 O)
Water pollution & Purposes of This Study
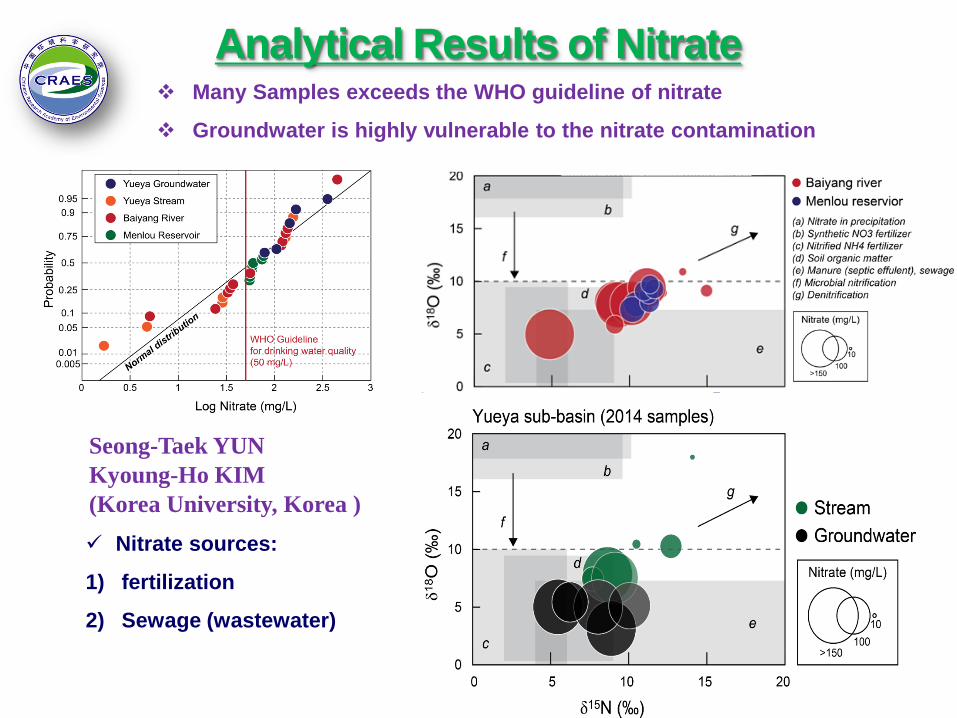
Analytical Results of Nitrate Many Samples exceeds the WHO guideline of nitrate
Groundwater is highly vulnerable to the nitrate contamination
Nitrate sources:
1) fertilization
2) Sewage (wastewater)
Seong-Taek YUN Kyoung-Ho KIM (Korea University, Korea )
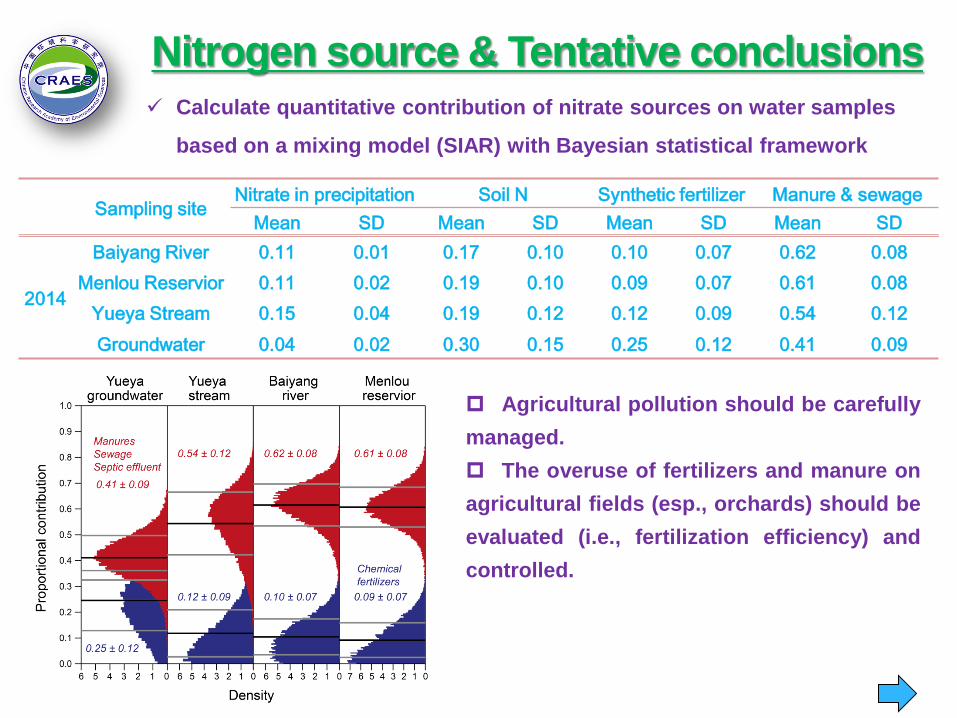
Nitrogen source & Tentative conclusions Calculate quantitative contribution of nitrate sources on water samples
based on a mixing model (SIAR) with Bayesian statistical framework
Sampling site Nitrate in precipitation Soil N Synthetic fertilizer Manure & sewage
Mean SD Mean SD Mean SD Mean SD
2014
Baiyang River 0.11 0.01 0.17 0.10 0.10 0.07 0.62 0.08 Menlou Reservior 0.11 0.02 0.19 0.10 0.09 0.07 0.61 0.08
Yueya Stream 0.15 0.04 0.19 0.12 0.12 0.09 0.54 0.12 Groundwater 0.04 0.02 0.30 0.15 0.25 0.12 0.41 0.09
Agricultural pollution should be carefully managed. The overuse of fertilizers and manure on agricultural fields (esp., orchards) should be evaluated (i.e., fertilization efficiency) and controlled.
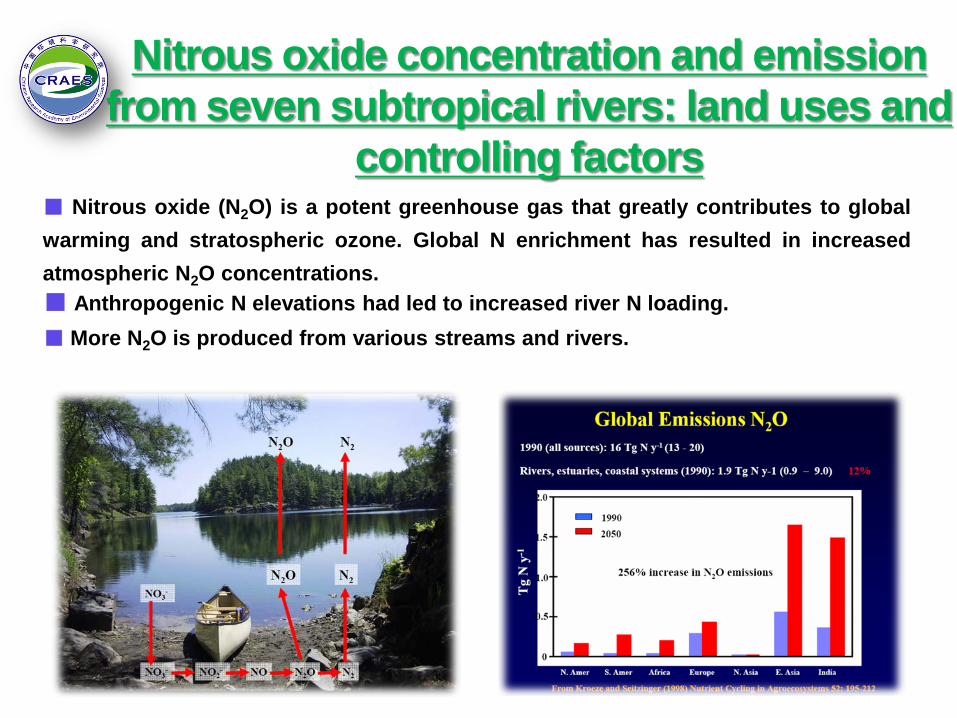
■ Nitrous oxide (N2O) is a potent greenhouse gas that greatly contributes to global warming and stratospheric ozone. Global N enrichment has resulted in increased atmospheric N2O concentrations. ■ Anthropogenic N elevations had led to increased river N loading. ■ More N2O is produced from various streams and rivers.
Nitrous oxide concentration and emission from seven subtropical rivers: land uses and
controlling factors
Sampling
site
Dominat
ed
land use
River
length
(km)
Dept
h
(m)
Flow
velocity
(m s-1)
DO
(mg L-1)
NO3--N
(mg L-1)
NH4+-N
(mg L-1) pH
SO42-
(mg L-1)
Cl-
(mg L-1)
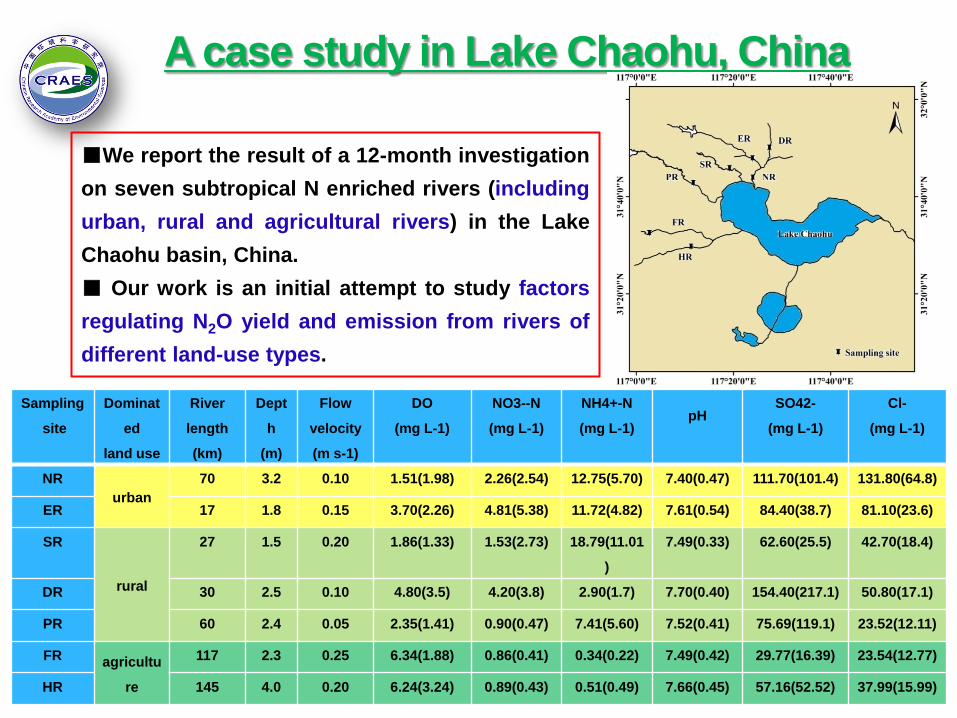
NR urban
70 3.2 0.10 1.51(1.98) 2.26(2.54) 12.75(5.70) 7.40(0.47) 111.70(101.4) 131.80(64.8)
ER 17 1.8 0.15 3.70(2.26) 4.81(5.38) 11.72(4.82) 7.61(0.54) 84.40(38.7) 81.10(23.6)
SR
rural
27 1.5 0.20 1.86(1.33) 1.53(2.73) 18.79(11.01
)
7.49(0.33) 62.60(25.5) 42.70(18.4)
DR 30 2.5 0.10 4.80(3.5) 4.20(3.8) 2.90(1.7) 7.70(0.40) 154.40(217.1) 50.80(17.1)
PR 60 2.4 0.05 2.35(1.41) 0.90(0.47) 7.41(5.60) 7.52(0.41) 75.69(119.1) 23.52(12.11)
FR agricultu
re
117 2.3 0.25 6.34(1.88) 0.86(0.41) 0.34(0.22) 7.49(0.42) 29.77(16.39) 23.54(12.77)
HR 145 4.0 0.20 6.24(3.24) 0.89(0.43) 0.51(0.49) 7.66(0.45) 57.16(52.52) 37.99(15.99)
A case study in Lake Chaohu, China
■We report the result of a 12-month investigation on seven subtropical N enriched rivers (including urban, rural and agricultural rivers) in the Lake Chaohu basin, China. ■ Our work is an initial attempt to study factors regulating N2O yield and emission from rivers of different land-use types.
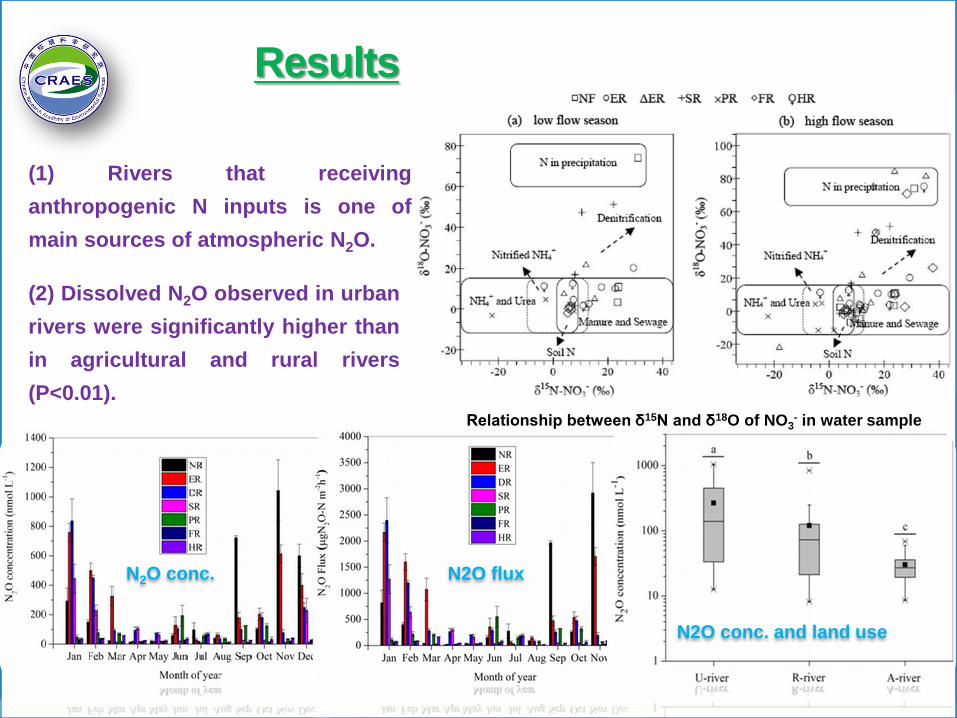
Relationship between δ15N and δ18O of NO3- in water sample
(1) Rivers that receiving anthropogenic N inputs is one of main sources of atmospheric N2O.
(2) Dissolved N2O observed in urban rivers were significantly higher than in agricultural and rural rivers (P<0.01).
Results
N2O conc. N2O flux
N2O conc. and land use
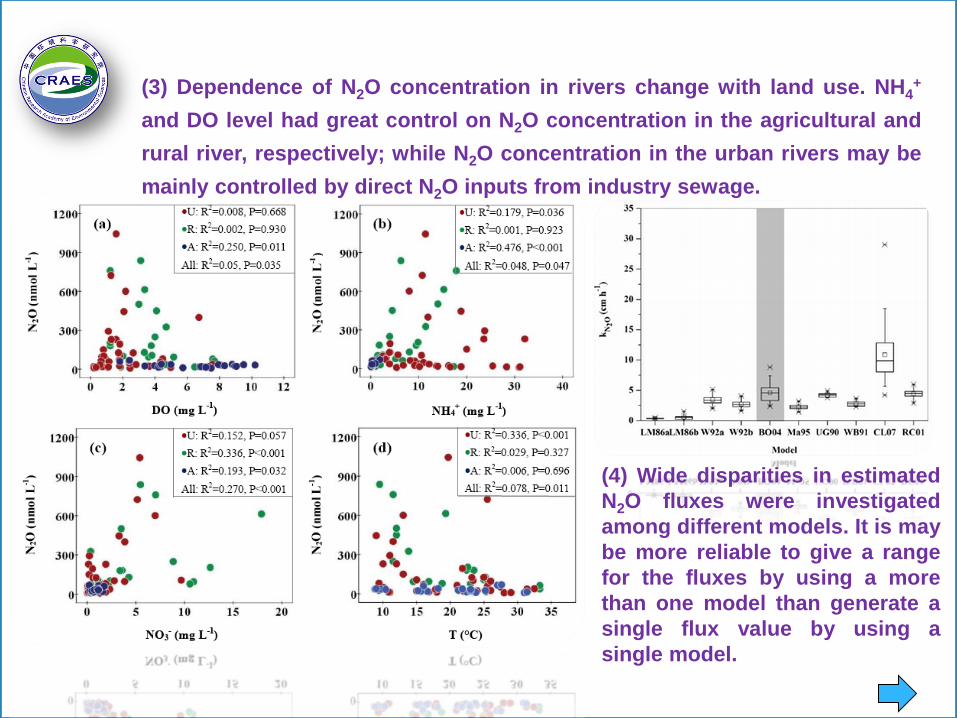
(3) Dependence of N2O concentration in rivers change with land use. NH4+
and DO level had great control on N2O concentration in the agricultural and rural river, respectively; while N2O concentration in the urban rivers may be mainly controlled by direct N2O inputs from industry sewage.
(4) Wide disparities in estimated N2O fluxes were investigated among different models. It is may be more reliable to give a range for the fluxes by using a more than one model than generate a single flux value by using a single model.

Conclusions
Feel Sorry For the Workshop this year
For Water Pollution control, long-term efforts still needed
More cooperation & extensive academic communication
among NIES, NIER and CRAES are expected

Thanks you for your attention