Embed Size (px)
Citation preview

44Lauterbach GmbHAltlaufstraße 40 • 85635 Höhenkirchen • Tel: +49 8102 9876 0 • [email protected] our official Youtube channel and discover our new tutorials: http://www.youtube.com/user/lauterbachgmbh
For more information visit: www.lauterbach.com/5500
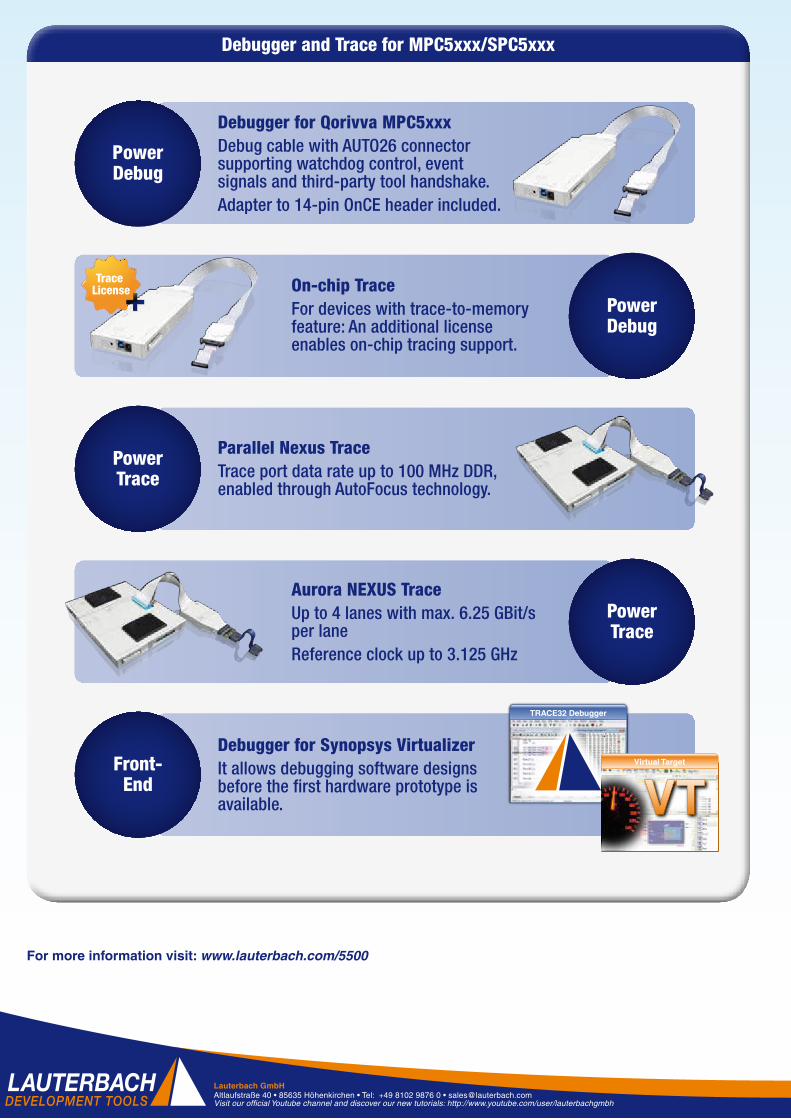
Debugger and Trace for MPC5xxx/SPC5xxx TRACE32®
Debug & Trace
NXP Qorivva MPC5xxxNXP S32Rxxx
STMicroelectronics SPC5xxx
PowerDebug
Debugger for Qorivva MPC5xxxDebug cable with AUTO26 connector supporting watchdog control, event signals and third-party tool handshake.Adapter to 14-pin OnCE header included.
On-chip TraceFor devices with trace-to-memory feature: An additional license enables on-chip tracing support.
PowerDebug
Parallel Nexus TraceTrace port data rate up to 100 MHz DDR, enabled through AutoFocus technology.
PowerTrace
Aurora NEXUS TraceUp to 4 lanes with max. 6.25 GBit/s per laneReference clock up to 3.125 GHz
PowerTrace
Debugger for Synopsys VirtualizerIt allows debugging software designs before the first hardware prototype is available.
Front-End
TRACE32 Debugger
Virtual Target
Trace License
2 3 www.lauterbach.com/5500
Support for Auxiliary Cores
Nexus Trace Solutions for MPC5xxx/SPC5xxx
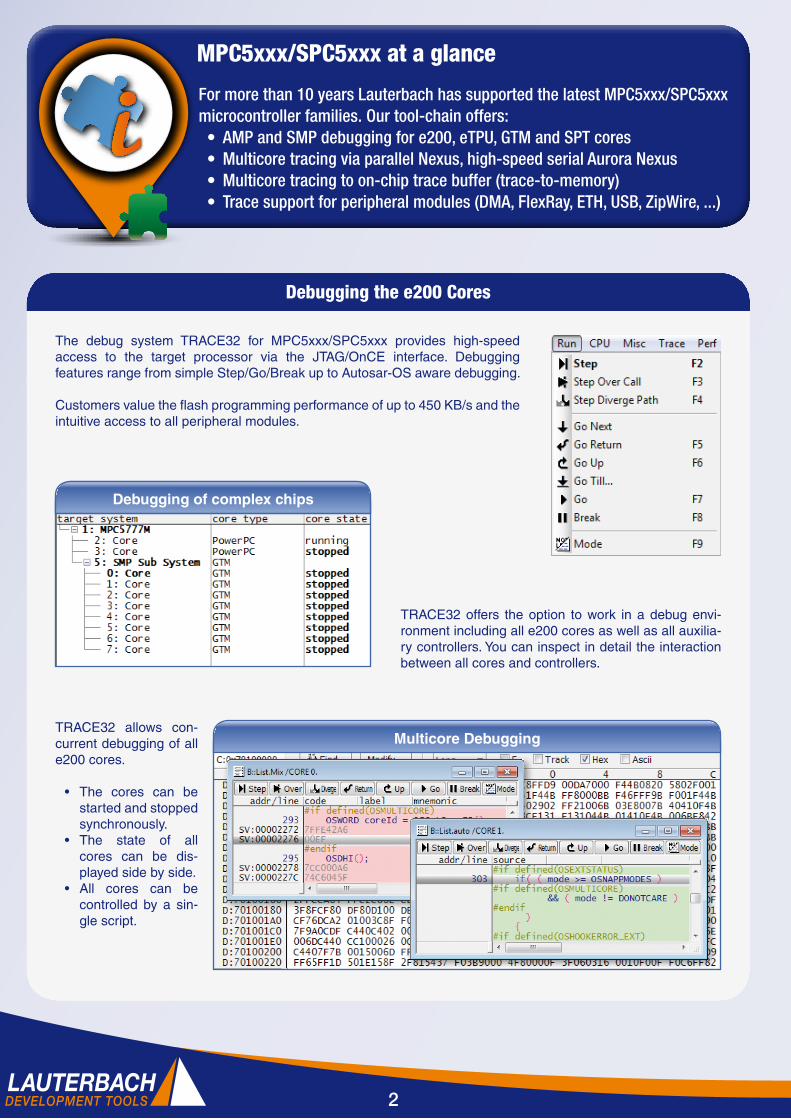
The debug system TRACE32 for MPC5xxx/SPC5xxx provides high-speed access to the target processor via the JTAG/OnCE interface. Debugging features range from simple Step/Go/Break up to Autosar-OS aware debugging.
Customers value the flash programming performance of up to 450 KB/s and the intuitive access to all peripheral modules.
Debugging the e200 Cores
MPC5xxx/SPC5xxx at a glance
For more than 10 years Lauterbach has supported the latest MPC5xxx/SPC5xxx microcontroller families. Our tool-chain offers:• AMP and SMP debugging for e200, eTPU, GTM and SPT cores• Multicore tracing via parallel Nexus, high-speed serial Aurora Nexus• Multicore tracing to on-chip trace buffer (trace-to-memory) • Trace support for peripheral modules (DMA, FlexRay, ETH, USB, ZipWire, ...)
Multicore DebuggingTRACE32 allows con-current debugging of all e200 cores.
• The cores can be started and stopped synchronously.
• The state of all cores can be dis-played side by side.
• All cores can be controlled by a sin-gle script.
Debugging of complex chips
TRACE32 offers the option to work in a debug envi-ronment including all e200 cores as well as all auxilia-ry controllers. You can inspect in detail the interaction between all cores and controllers.
Debugging and tracing of auxiliary cores is included free of charge:
eTPU Debugging GTM Tracing
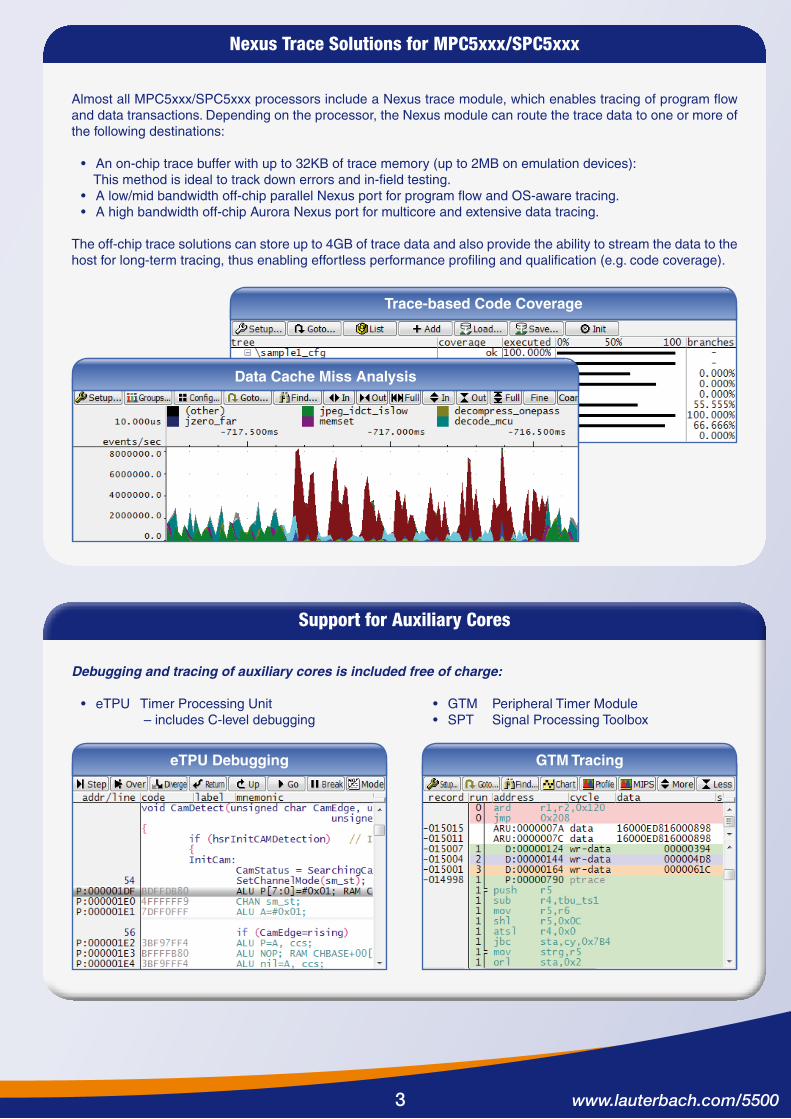
Trace-based Code Coverage
Almost all MPC5xxx/SPC5xxx processors include a Nexus trace module, which enables tracing of program flow and data transactions. Depending on the processor, the Nexus module can route the trace data to one or more of the following destinations:
• An on-chip trace buffer with up to 32KB of trace memory (up to 2MB on emulation devices): This method is ideal to track down errors and in-field testing.
• A low/mid bandwidth off-chip parallel Nexus port for program flow and OS-aware tracing.• A high bandwidth off-chip Aurora Nexus port for multicore and extensive data tracing.
The off-chip trace solutions can store up to 4GB of trace data and also provide the ability to stream the data to the host for long-term tracing, thus enabling effortless performance profiling and qualification (e.g. code coverage).
Data Cache Miss Analysis
• eTPU Timer Processing Unit – includes C-level debugging
• GTM Peripheral Timer Module• SPT Signal Processing Toolbox
2 3 www.lauterbach.com/5500
Support for Auxiliary Cores
Nexus Trace Solutions for MPC5xxx/SPC5xxx
The debug system TRACE32 for MPC5xxx/SPC5xxx provides high-speed access to the target processor via the JTAG/OnCE interface. Debugging features range from simple Step/Go/Break up to Autosar-OS aware debugging.
Customers value the flash programming performance of up to 450 KB/s and the intuitive access to all peripheral modules.
Debugging the e200 Cores
MPC5xxx/SPC5xxx at a glance
For more than 10 years Lauterbach has supported the latest MPC5xxx/SPC5xxx microcontroller families. Our tool-chain offers:• AMP and SMP debugging for e200, eTPU, GTM and SPT cores• Multicore tracing via parallel Nexus, high-speed serial Aurora Nexus• Multicore tracing to on-chip trace buffer (trace-to-memory) • Trace support for peripheral modules (DMA, FlexRay, ETH, USB, ZipWire, ...)
Multicore DebuggingTRACE32 allows con-current debugging of all e200 cores.
• The cores can be started and stopped synchronously.
• The state of all cores can be dis-played side by side.
• All cores can be controlled by a sin-gle script.
Debugging of complex chips
TRACE32 offers the option to work in a debug envi-ronment including all e200 cores as well as all auxilia-ry controllers. You can inspect in detail the interaction between all cores and controllers.
Debugging and tracing of auxiliary cores is included free of charge:
eTPU Debugging GTM Tracing
Trace-based Code Coverage
Almost all MPC5xxx/SPC5xxx processors include a Nexus trace module, which enables tracing of program flow and data transactions. Depending on the processor, the Nexus module can route the trace data to one or more of the following destinations:
• An on-chip trace buffer with up to 32KB of trace memory (up to 2MB on emulation devices): This method is ideal to track down errors and in-field testing.
• A low/mid bandwidth off-chip parallel Nexus port for program flow and OS-aware tracing.• A high bandwidth off-chip Aurora Nexus port for multicore and extensive data tracing.
The off-chip trace solutions can store up to 4GB of trace data and also provide the ability to stream the data to the host for long-term tracing, thus enabling effortless performance profiling and qualification (e.g. code coverage).
Data Cache Miss Analysis
• eTPU Timer Processing Unit – includes C-level debugging
• GTM Peripheral Timer Module• SPT Signal Processing Toolbox
44Lauterbach GmbHAltlaufstraße 40 • 85635 Höhenkirchen • Tel: +49 8102 9876 0 • [email protected] our official Youtube channel and discover our new tutorials: http://www.youtube.com/user/lauterbachgmbh
For more information visit: www.lauterbach.com/5500
Debugger and Trace for MPC5xxx/SPC5xxx TRACE32®
Debug & Trace
NXP Qorivva MPC5xxxNXP S32Rxxx
STMicroelectronics SPC5xxx
PowerDebug
Debugger for Qorivva MPC5xxxDebug cable with AUTO26 connector supporting watchdog control, event signals and third-party tool handshake.Adapter to 14-pin OnCE header included.
On-chip TraceFor devices with trace-to-memory feature: An additional license enables on-chip tracing support.
PowerDebug
Parallel Nexus TraceTrace port data rate up to 100 MHz DDR, enabled through AutoFocus technology.
PowerTrace
Aurora NEXUS TraceUp to 4 lanes with max. 6.25 GBit/s per laneReference clock up to 3.125 GHz
PowerTrace
Debugger for Synopsys VirtualizerIt allows debugging software designs before the first hardware prototype is available.
Front-End
TRACE32 Debugger
Virtual Target
Trace License