Embed Size (px)
Citation preview

-Ai85 411 YOUTH ATTITUDE TRACKCING STUDY- HISTORICAL EVOLUTION AND 1/iAi CHARACTERISTI CSCU) DEFENSE MANPOWER DATA CENTER'
ARLINGTON VA MARKET RESEARCH BRANCH
7UNCLASSIFIED M T LARENCE ET AL JAN 85 DMDC/MRB/TR-12 F/G 5/9 N
EMoEnossoni
EhhhE~hhmh
~~I~2.5
1.6
1111112 1 1 _KL __
MICROCOPY RESOLUTION TEST CHARTNATIONAL BUREAU OF STANDARDS-1963-A
V%
PHOTOGRAPH THIS SHEET
iJLEVEL INVENTORY
00 A.0
B ~DOCUME~iNT IDENTIFICAAfON
.~pubkm r.Iecu m4dm =wo
DISTRIBUTION STATEMENT
ACCESSION FORNTIS GRAM
DTIC TAB c
DISTRIBUTION /NSPECTF EAVAILABILITY CODES 7DIST AVAIL AND/OR SPECIAL ______________
DATE ACCESSIONED
DISTRIBUTION STAMP
DATE RETURNED
DATE RECEIVED IN DTIC REGISTERED OR CERTIFIED NO.
PHOTOGRAPH THIS SHEET AND RETURN TO DTIC-FDAC
DTIC FORM 70A DOCUMENT PROCESSING SHEET PREVIOUS EDITION MAY BE USED UNTILMAR 86mSTOCK IS EXHAUSTED.
KA186
.I.
,-- -DEFENSE
00
-MMANPOWER DATA CENTER
TECHNICAL NOTE
YOUTH ATTITUDE TRACKINGSTUDY:
HISTORICAL EVOLUTION ANDCHARACTERISTICS
JANUARY 1985
1600 WILSON BOULEVARD ARLINGTON, VIRGINIA 22209
, '

SECURITY CLASSIFICATION OF THIS PAGE
REPORT DOCUMENTATION PAGE1a. RE(O T ECURITY CLASSIFICATION lb. RESTRICTIVE MARKINGS
2a. SECURITY CLSIIAIN AUTHORITY 3 DISTRIBUTION/ AVAILABILITY OF REPORT
2b. DECLASSIFICATION / DOWNGRADING SCHEDULE Apevdr-v J te, ure ease~e
4. PERFORMING ORGANIZATION REPORT NUMBER(S) 5. MONITORING ORGANIZATION REPORT NUMBER(S)
_________ ___Dry__ c'vocJ rywa /v-Q-- 12-
6a. NAME OF PERFORMING ORGANIZATION I6b OFFICE SYMBOL 7a. NAME OF MONITORING ORGANIZATION
Ckf ii ct"r' Powe-r W&,'- (if applicable) JCA±Ad
6c. ADDRESS (City, State, and ZIP Code) 7b. ADDRESS (City, State, and ZIP Code)
)(DcXo W, Isor-, 1"J6'~ S~uft-s- 4wc
Sa. NAME OF FUNDING /SPONSORING 8b. OFFICE SYMBOL PRCR NTRU T IDE ICA NUI
Oeff-eAc-s QA&D Q(A- to)'a c. ADDRESS (City, State, and ZIP Code) U11.-o UC% UBR
11 TITLE (Include Security Classification)
1'A- -eN& /oN\-n4tit c rozcsva S1-e.y t- t cod Evotu-hornar'\6 ChaoMC~rexis-CC"
12. PERSONAL AUTHOR(S)
Lo~ixeoc. rY) k ceA T- ny 6, BYdce S U...,-12.13a. TYPE OF REPORf ;1b. TIME COVERED Iii DATE OF REPORT (Year, onrth, Day) jiS. PAGE COUNT
tCdc.. M~- FROM TO I bjAJs\4 I 2-716. SUPPLEMENTARY NOTATION1
17. COSATI CODES 18. SUBJECT TERMS (Continue on reverse if necessary .Inq identify by block number)FIELD GROUP SU-GOU rAqaw / j-
19. ABSTRACT (Continue on reverse if necessary and identify by block number)
This technical note summarizes for the first time the details of the
%, evolution of the Youth Attitude-Tracking Study (YATS) into its present
* form. it also discusses and presents comparative propensity data for all
the administrations of YATS.
YATS has become the recognized principal source of data regarding the
propensity of the military-age population for joining the military.
Changes made in the Fall 1983 survey merited the redesignation of thesurey s YTSII. Distinguishing YATS II from its predecessor are
expanded market coverage and increased methodological and statisticalrigor.
20 PRIUUTION /AVAILABILITY OF ABSTRACT 21. A STRACT SECURITY CLASSIFATIONIWUNCLASSIFIED/UNLIMITED 03 SAME AS RPT [3DTIC USERS A~ I
2a NAME OF RESPONSIBLE INDIVIDUAL 22b TELEPHONE (include Area Code) 22c. OFFICE SYMBOL
DD FORM 1473.84 MAR 83 APR edition mnay be used until exhausted SECURITY CLASSIFICATION OF THIS PAGEAll other editions are obsolete E fect.
A '
SECURITy CLASSIFICATION OF THIS PAGE
The Defense Manpower Data Center (DMDC) has retraced the history, bynecessity, as part of an effort to ensure the comparability of data inadjacent data collections. The purpose of this paper is to summarize inone place the details of the evolution of YATS into its present form.
The last section of this paper discusses and presents comparativepropensity data for all the administrations of YATS in a manner thatadjusts and compensates for the conversion of YATS into YATS II, as wellas previous changes.
The changes have been made due to changing data requirements of boththe policy and operational recruiting communities in the Office of theSecretary of Defense and the Services. Other changes are a result ofbudgetary constraints.
'4J
SECURITY CLASSIFICATION OF THIS PAGE

TECHNICAL NOTE
YOUTH ATTITUDE TRACKING STUDY:
Historical Evolution and Characteristics
Michael T. Laurence and Sue T. Bridges
Market Research Branch
Survey and Market Analysis Division
Defense Manpower Data Center1600 Wilson Boulevard, Arlington, VA 22209
January 1985
m Omni
This report was prepared for the Directorate cf Accession Policy in theOffice of the Deputy Assistant Secretary of Defense (Military Personnel andForce Management) (ODASD(MP&FM)(AP)). Any interpretations or viewpointscontained in this report should not be construed as an official Departmentof Defense position.
4
Preface
This Technical Note summarizes for the first time the details of the
evolution of the Youth Attitude Tracking Study (YATS) into its present
form. It also discusses and presents comparative propensity data for all
the administrations of YATS.
As is always the case when working with an effort as large and complex
as YATS, the preparation of this Technical Note would not have been
possible without the assistance of many others. Within the Directorate of
Accession Policy, Office of the Secretary of Defense, Dr. W. S. Sellman,
Director, and Captain Louise C. Wilmot, USN, Deputy Director, have provided
policy guidance for YATS and encouraged efforts to improve it.
In the Survey and Market Analysis Division, Defense Manpower Data
Center, Zahava 0. Doering and J. J. Miller provided overall direction and
review. Vonda Kiplinger provided guidance and review in the analysis of
weighting issues. Barbara A. Saunders, Elaine Sellman, and Mark Howell
contributed by conducting historical research and verifying the weights
used in past YATS.
At the Research Triangle Institute, James R. Chromy and Fredrick W.
Immerman conducted the analysis reported in Appendix D of the Final Report:
1983 YATS and summarized here. At the Rand Corporation, Bruce Orvis and
Martin Gahart conducted the weighting analysis of the YATS male propensity
data for the pre-1982 surveys as well as that for females in those years in
which they were interviewed. Without their insight, technical expertise,
and attention to detail, the work summarized here would not have been
possible.

Table of Contents
Page
Preface ....... ......................... i
Introduction ...... ...................... 1
Summary of Details of Survey Operations ............ 3
Summary of Survey Methodology ..... .............. 7
Restatement of Waves 2 through 13 Propensity Data. . . . 15
lSummary ...... ... ......................... 27
Tables
1. Summary of Details of Survey Operations ......... 4
2. Summary of Survey Methodology .... ........... 8
3. Comparison of Wave 13 (Fall 1982) Young MalePositive Propensity as Originally Reportedand as Reweighted ..... ................. 17
4. Comparison of Young Male Positive Propensityas Originally Reported and as Reweighted ....... 20
5. Comparison of Female Positive Propensity asOriginally Reported and as Reweighted .......... 22
6. Summary of Geographic Weight and Data FileLocation for Proper Weighting of YATS Data . . . . 23
7. Tracking Area Weights for Waves 2-5(Spring 1976 - Fall 1977) ................ .. 24
8. Adjustment Factors Used in ReweightingFemale Propensity Data for Waves 11-13(Fall 1980- Fall 1982) ................. ... 25
Ze
-. 4
--.. *-5
YOUTH ATTITUDE TRACKING STUDY:
Historical Evolution and Characteristics
Introduction
The Youth Attitude Tracking Study (YATS) will, in a few months, mark
its tenth anniversary. What began as a relatively simple survey of
military-age young males in Fall 1915 has evolved into a complex and
sophisticated survey of young men, young women, and older men that is
recognized as the principal source of data regarding the propensity of the
military-age population for joining the military. While the YATS has
evolved over the years, with changes made between adjacent data collec-
tions, changes made in the Fall 1983 survey merited the redesignation of
the survey as YATS II. Distinguishing YATS II from its predecessor are
expanded market coverage and increased methodological and statistical
rigor.
Few individuals who currently use the YATS data, or participate in the
annual execution of the survey, were present at its creation in 1975.
Thus, there is little institutional memory of how the YATS developed into
. its present form and no context in which to relate the most recent findings
to those obtained in earlier years. The institutional memory that exists
regarding YATS resides in the many published reports that have been pro-
duced by contractors over the last ten years and in internal memoranda in
the Office of the Secretary of Defense (OSD) and in the Services. Most
current users of YATS are either not in possession of all these reports and
memoranda, nor do they have the time or inclination to trace fully the
history of the survey. The Defense Manpower Data Center (DMDC) retraced
the history, by necessity, as part of an effort to ensure the comparability
of data in adjacent data collections. Thus, the purpose of this paper: to
summarize in one place the details of the evolution of YATS into its pre-
sent form. The last section of this paper, which is less historical in
nature, discusses and presents comparative propensity data for all the
administrations of YATS in a manner that adjusts and compensates for the
conversion f YATS into YATS II, as well as previous changes. This paper
does not provide justification for changes which have been made, as the
documentation frequently omits it. In general, these changes have been
made to meet the changing data requirements of both the policy and opera-
tional recruiting communities in OSD and the Services, by incorporating new
statistical and data collection methodologies. In addition, some changes
have resulted from budgetary constraints.
2
Summary of Details of Survey Operations
The details of the Youth Attitude Tracking Study (YATS) survey opera-
tions including the wave number, data of survey, contractor, target markets
sampled, sample sizes, and the data collection periods are summarized in
Table 1. Each of these details will be discussed in turn.
Wave number. This is a sequential number assigned to each YATS data
collection effort.
Date of survey. The season (Spring/Fall) year of the data
collection effort.
Contractors. Since it began, only two contractors have conducted
YATS. Waves 1 through 13 (Fall 1975 through Fall 1982) were perf'.m'ed by
Market Facts, Inc. As a result of the competition for the YATS contract,
Waves 14 and 15 (Fall 1983 and Fall 1984) were conducted by the Research
Triangle Institute (RTI). In addition to certain methodological differen-
ces which are discussed below, the most significant change in the conduct
of this survey resulting from the change in contractors was the implemen-
tation of Computer Assisted Telephone Interviewing (CATI) in Wave 14 (Fall
1983) by RTI. Prior to this wave, most telephone interviews were conducted
using traditional paper and pencil recording methods.
Within the Department of Defense (DoD), the Directorate of Accession
Policy (AP) in the Office of the Deputy Assistant Secretary of Defense
(Military Personnel and Force Management) (ODASD(MP&FM)) was directly
responsible for monitoring the technical performance of contractors in Waves
I through 12 (Fall 1975 through Fall 1981). With Wave 13 (Fall 1982) these
responsibilities were transferred to the Market Research Branch, Survey and
-,3
16 W 0 -a 0- a .Ca % Nf 0% 0m w %n 0 0Ca m t% ar - 0 # - 7 e n %D 4w 0 %D
to 0% Ch F.0
C % '. 0 . s 0 0 '. i4. N, C, -, C0 N n 0 F-%- - - -%N
- n .- %n n M n - n - an - 4 - - 0
43 F.l Nq in -e 0 C a . F~ - ~ -. C ~ - 1. - 0o 4 3 w 40 w. m ~ 0 0 C" 0m
.40 0 0 0 0 03 0 m 0 0 N2 m~ - CIOaan EftPlC 41.Ia an - - In
0 4.
u- 00 Cm en an cc
40 - -
r.1- CD siO
w w v w u w u u u u u u 1 -03.0 % a
S. 0 0
4-, 1
5~ 0%c% 4
an C I. 41
an (Ft 'a mA an n cc an an an wn an a -
4 " 4p 4m 4 4 4 4 4 M! 4 L
a 10 AL U. U. A a. 16 AL. 10 U. 0. U . U4 U U w
4. 4 44 44 4 4' 44 4 44 44 4 44 44 4 1. 1Li44 ~ f -W kA %a 0% 41 m1 -r 41 4 1 4 1 41 4 4a .
these responsibilities were transferred to the Market Research Branch,
Survey and Market Analysis Division, Defense Manpower Data Center (DMDC).
Policy guidance for YATS has always resided in ODASD(MP&FM)(AP), or its
predecessors, with assistance and advice from the Joint Market Analysis and
Research Committee (JMARC).
Samples. Waves 1 through 10 (Fall 1975 through Spring 1980) were
semi-annual surveys, conducted in the Spring and Fall, of approximately
5,200 (Wave 3 and beyond) young males, aged 16-21. Beginning with Wave 11
(Fall 1980) YATS became an annual survey and females, in approximate equal
proportion to the males, were included in the survey. The size of the
female sample was reduced to approximately 1,300 in Wave 13 (Fall 1982) and
succeeding waves. In Wave 14 (Fall 1983) a nationally representative
sample of older men, aged 22-29, was introduced.
In all waves of the YATS, the basic eligibility criteria have remained
unchanged with the exception of the participation of respondents in ROTC
programs. The basic eligibility criteria for inclusion in the sample
require that respondents have 1) no prior or current military service; 2)
not be beyond the second year of college; and 3) fall within the age limits
of 16-21 years for young males and females and 22-29 years for the older
males. In Waves 1 through 12 (Fall 1975 through Fall 1981), participation
in any form of ROTC was not considered to be military service. In Wave 13
(Fall 1982) participation in any form of ROTC was considered to be military
service and participants were excluded from the survey. In Wave 14 and 15
(Fall 1983 and Fall 1984), college ROTC was considered to be military ser-
vice while high scho,l ROTC was not. Accordingly, those individuals who
participated in high school ROTC were eligible for inclusion in the survey.
5- . . . . . . . . .
Data Collection Period. For all the waves appearing in Table I the
median duration of the data collection period was 48 days. The shortest
data collection period was 26 days for Wave 2 (Spring 1976) in which 3,008
interviews were conducted and the longest was 166 days in Wave 6 (Spring 1978)
in which 4,006 interviews were conducted. Even though data collection in
Wave 6 spanned a five and one-half month period, the report indicates that
statistical tests revealed no month-to-month differences and the data were
collapsed and treated similarly to the other waves.
Data collection for the Spring waves normally began in mid-April
except for Wave 6 (Spring 1978) which began at the beginning of January.
Data collection for the Fall waves normally began in the mid-September to
mid-October period. Wave 15 (Fall 1984) began on August 1 so that inter-
viewing would be entirely completed prior to the end of the FY 1984
Advertising Mix Test, which ended on September 30, 1984. (YATS Waves 14
and 15 were among the principal measuring instruments for this test).
6
KAsk:",
i ,n
Summary of Survey Methodology
Table 2 summarizes the sampling methods, sampling strata, and
weighting schemes employed over the 15 waves of YATS. The sampling method
will be discussed first, followed by the sample strata and weighting scheme
together since the latter is dependent on the former.
Sampling method. Since its beginning YATS has employed random digit
dialing techniques to locate eligible respondents. The published reports
for Waves 1 through 4 (Fall 1975 through Spring 1977) are uninformative as
to whethe, a true random digit dialing procedure was employed or whether
some procedures to enhance efficiency were utilized. Beginning with Wave 5
(Fall 1977) and continuing through Wave 12 (Fall 1981), the dialing proce-
dures were modified to introduce the use of "seed" numbers to enhance effi-
ciency. By identifying residential telephone exchanges in advance of the
actual survey screening process, fewer calls were needed since businesses
and non-working numbers were eliminated ahead of time. These seed numbers
were obtained from a 1977 national sample of 40,000 households selected
from a panel of 100,000 in the contiguous United States. Each of these
40,000 households was asked to select "n" telephone numbers from their
local telephone directories. These numbers served as the basis for
telephone dialing in Waves 5 through 12 (Fall 1977 through Fall 1981).
Beginning with Wave 13 (Fall 1982), the random digit dialing proce-
dures were further modified to employ the techniques developed by Waksburg.
Instead of the seed number approach, the Waksburg method is a two-stage pro-
cess in which calls are made to randomly selected telephone exchanges to
Qt,4. L7
c c 0) 0 C
VS 0- C- o- C tCl 3 -00 t w -0 0 C
0'Jd~4 c *3- CL .C Q
(v c) 4) Ot a)Xx( 0 l)S. ) -0 0, toV) Q))- -;
0- u 'at EU~ ~ . c:) a
Q) o a~ .0U4( U 4 co 0) 0m
0 2 c))- EO4c:cum3 ) 4- CU
o'al-4)Q) wL a) w-L~ 0 mu .00C 3 'Ur) a, ~ 0.o~o
w3 *-o C'- . >' u
*~~ ~ C Ca. c )0 -) i 4.'U . E
4.. O )'U- o 4)0n. 'U 'U 0) 1. m' 4-0 00u4 aw 4)0-t0 a a ) U () ) 0- M 4L- W CU M~ 3, l a
m -UC ' m) a)Ct4 cx m mM M . r mc4)4 lo V'U' :m :3 D-' 4S) z a: 0 X,:z~~c L- Mo *U 4
CL) .~ 4 'o m4- M0m4_10 M R a m ) C C
> U ' 4va 'a Eo )m
mI i CL W 0- MV W~ (v c .04)4) : u 5 511"m a
Qo - CL) .< ) m i En en E' %' )- : 0 - E 4L. 3.tC') - 0S)4- w ) 4IV 0.>00 S 0 0- C 0 a S
3V L 4 'U ) 0 ) k4) 4) ) 4I V) V) Oe-')U LI M) .4
4)- ) 3 ) In
4-~o P D -0 P4 P P P 0.e 0D~ .- 4
VL-C w eo 4.0. 0o i o t o t o 0C 4 o 4'U-CV - t
1-0 - .) 4)a)' E O
.7).4 M a) LI LL4) LO 4 a) a 0 ).0.. o9a
on 0 U- " C tm10 M M a 10 c 0 o 'a 3)C 0 z : :c : 3 3 i rA
CL o4 a, 00 m'U 0 EscuL 4)c U 4) c ) Q) c )c E 4 ) 4):3a
C) eU E -'U 'U E'
OLl oI V)4 ) 4) 4j 4) 4) 4) 4) 4) 4) L/) 4) M 00 . a V)
* ~~ ~0 D ~ ~ P VLP P P P P P P PP L--
44l E LCn4 un 'n LI'U*)0
a 0 040Q4,. 'U a)O 'U 'U ' ) U 'U 'U U EU (M cu w
0'% 0 - I I
CL &
'U cm . )0 n n v
C- C, (1
CI LI
00 CO M o3B

identify those which contain primarily residential households as opposed to
businesses, institutions, or non-working numbers. Those exchanges which
are identified as residential are designated as "clusters" which, in the
second stage of the process, are used to generate telephone numbers to be
called to find additional households and respondents.
Sampling Strata and Weighting Schemes. In the first two Waves (Fall
1975 and Spring 1976) approximately 200 respondents in each of 13 special
geographic areas defined for YATS, called "Tracking Areas," were inter-
viewed. These Tracking Areas cumulatively accounted for 65% of the U.S.
"Estimated Military Available" (EMA) population.* The Tracking Areas were-a
selected by using criteria that included 1) maximizing the percentage of
the potential applicant pool covered; 2) providing sufficient geographical
dispersion; and 3) limiting the number of military recruiting units in each
Tracking Area to three or less per Service. Also interviewed were 400
respondents from the balance of the country not included in the 13 Tracking
Areas.
Weighting of respondents was accomplished by first assigning each
respondent to a cell of a 13 x 6 x 2 matrix. This matrix consisted of 13
*The Estimated Military Available (EMA) population was based on estimates
generated by the method developed by Huck, D. F., Crews, A., and Siea, G. P.
(Sept. 1978) The Qualified Military Available Projection System, General
Research Corpordtion, McLean, VA, Report CR-224.
9tI%
Tracking Areas, 6 age categories (single years of age, 16-21), and 2 racial
categories (white and non-white). The weight for each individual within
each cell was calculated by dividing the percentage of total EMA in that
cell by the percentage of total respondents falling in that cell. (The
report does not discuss how weights were calculated for the 400 respondents
from the balance of the country.)
Beginning with Wave 3 (Fall 1976) and continuing through Wave 12
(Fall 1981) the sampling strata were revised so that 200 respondents from
each of 26 Tracking Areas were interviewed. These 26 Tracking Areas
encompassed the entire contiguous United States, and therefore, 100% of the
EMA population. Each Tracking Area roughly coincided with the major
*recruiting areas used by the Services at that time.
The weighting method employed in Waves 1 and 2 (Fall 1975 and Spring
1976) produced considerable variation among the weights calculated for each
of the 156 cells and, thus, reduced statistical precision. Accordingly, it
was revised in Wave 3 (Fall 1976) both to increase statistical precision
and to account for the change in sampling strata. The revised scheme,
employed in Waves 3 through 11 (Fall 1976 through Spring 1980), was one in
which fewer weights were calculated and in which the individual weight was
the product of a Tracking Area weight and an age/race weight.
The Tracking Area weight was calculated by dividing the percentage of
total EMA population in each Tracking Area by the percentage of total
respondents in each Tracking Area. The age/race weight was calculated by
10
w ' , - ..... * ... -, - , . .
dividing the percentage of total national EMA population for each of twelve
age/race cells (6 age cells x 2 race cells) by the percentage of total
respondents in each age/race cell.
With Wave 11 (Fall 1980) the weighting scheme was again revised.
Household population estimates of military available youths, projected from
the 1970 Census were substituted for the EMA estimates in the two
weighting components introduced in Wave 3 (Fall 1976).
In Wave 13 (Fall 1982) the 66 Military Entrance Processing Stations
(MEPS) covering the contiguous United Stateswere used as the sampling
strata for the males, instead of the 26 Tracking Areas first used in Wave 3
(Fall 1976). The overall sample size was increased by approximately 800
males with 90 from each of the 66 MEPS being interviewed. The size of the
female sample was reduced from approximately 5,200 to 1,250, and the sample
was selected on a state-by-state basis with the number of respondents in
each state drawn in proportion to each state's population.
For the males, the weighting formulae used in Waves 11 and 12 (Fall
1980 and Fall 1981) were used in Wave 13 (Fall 1982) with modifications for
the MEPS-based sampling and the availability of 1980 Census data.
Accordingly, the Wave 13 individual weight was the product of the MEPS
weight (percentage of total male population, aged 16-21, in the MEPS
divided by the percentage of total respondents in that MEPS) and the
age/race weight (percentage of total male population in each of 12 age/race
11
cells divided by the percentage of total respondents in each age/race
cell). Population estimates for these calculations were based on the 1980
Census rather than projections from the 1970 Census as were used in Waves
11 and 12 (Fall 1980 and Fall 1981). The weights for females were calcu-
lated in a similar manner, but used state population estimates instead of
MEPS population estimates.
At the time the Wave 13 (Fall 1982) data were being analyzed and the
report prepared, it was recognized that these changes, particularly the
change from 1970 to 1980 Census estimates, might result in differences
between the Wave 13 (Fall 1982) and Wave 12 (Fall 1981) data that were more
an artifact of weighting than actual differences between the two samples.
Accordingly, a thorough examination of demographic comparisons was per-
formed as well as a restatement of the Wave 12 (Fall 1981) data using Wave
13 (Fall 1982) weights. This examination did not yield any significant
findings indicating that the data for the two waves were not comparable.
Thus, reweighting and restatement of the Wave 12 (Fall 1981) data were not
necessary.
With the change in the contractor executing the YATS survey, Wave 14
(Fall 1983) saw changes in both the sampling strata and weighting scheme.
The sampling strata for all target groups, the young males, young females,
and older males, were households within each MEPS. Individual weights were
based on these sampling strata, using the number of households per county
having eligible respondents, and included consideration of the probabilities
of selection of eligible respondents.
=%%
. . 12
Since the Wave 14 (Fall 1983) sampling strata and weighting scheme
were different than those used in the prior years, comparability with prior
waves again became an issue. Thus, this historical reconstruction and
related analyses were undertaken. The next sect 4on of this paper discusses
the comparability of the YATS data over successive waves and the method-
ology employed in the restatement of the data for Waves 2 through 13.
13
i Restatement of Waves 2 through 13 Propensity Data
The Issue. As has been described earlier in this paper, the Wave 13
(Fall 1982) data were weighted using population estimates projected from
the 1980 Census. The estimates were for all males and females, aged 16-21,
regardless of whether or not they met the other eligibility criteria for
. participation in the survey (i.e., not beyond the second year of college
and no prior or current military service). In contrast, the weighting
scheme employed by RTI for Wave 14 (Fall 1983) YATS used MEPS household
counts (by county) and the probabilities of selection of eligible respon-
dents generated from the screening interviews. These estimates were not
for all males and females, aged 16-21, but only for those also meeting the
other eligibility criteria.
As a result of these differences, the two sets of data are not
strictly comparable. The Market Facts Inc. approach gives higher weights
to older respondents than does the military-eligible weighting scheme used
by RTI, thereby producing lower estimates of positive propensity. When all
eligibility criteria are applied, the rate of study eligibility decreases
with age, beginning at age 18. Thus weighting in such a way that gives
older individuals equal weight to that of the younger individuals biases
the final positive propensity rate downward.
DMDC is fully satisfied that the procedures employed by RTI in
weighting the Wave 14 (Fall 1983) YATS data are both methodologically sound
and provide the most accurate measure of propensity for the target popula-
tion. Accordingly, it was necessary to evaluate the propensity uata pre-
15
sented in previous YATS reports and develop procedures that would enable
restatement of all waves of the previously reported data to be directly
comparable to those reported by RTI.
Both RTI and the Rand Corporation have closely studied the propensity
series comparability issue and proposed similar solutions. RTI's efforts
were concentrated on comparing the Wave 13 (Fall 1982) and Wave 14 (Fall
1983) data for young (16-21 year old) males. This work is reported in
detail in Appendix D of the Fall 1983 YATS Final Report, and will be sum-
marized here. Rand corroborated RTI's findings for Wave 13 (Fall 1982),
and extended the analysis to Waves 2 through 12 (Spring 1976 through Fall
1981) for the males and Waves 11 through 13 (Fall 1980 through Fall 1982)
for the females. Their analysis is also summarized below.
The RTI analysis. RTI first performed a series of analyses in which
0. the 1982 propensity data were initially weighted by the MEPS x age/race
weight calculated by Market Facts. These weighted data were further
adjusted for the age, race and MEPS distributions for the 1983 sample. The
1983 adjustment factors were applied both individually and in combination
with each other to identify the importance of each factor. This analysis
confirmed that age was the key variable for establishing comparable esti-
mates of propensity for Wave 13 (Fall 1982) and Wave 14 (Fall 1983).
Further evaluation of the weights calculated by Market Facts revealed
that the MEPS national weights, when applied to the 1982 propensity data
without any age/race adjustment, produced a reasonable approximation of the
1983 age distribution. The effect of this approach is shown in Table 3.
16
V% '- * ** * * ..%j
V.~* 4~ .* *
Table 3
YOUTH ATTITUDE TRACKING STUDY
Comparison of Wave 13 (Fall 1982) Young Male Positive Propensitya
As Originally Reported and as Reweighted
Wave 13 (Fall 1982)
OriginallyService Reported Reweighted
* Army 14.5 16.0
Navy 13.0 14.4
Marine Corps 10.5 11.7
Air Force 17.4 18.7
Any Active Duty Service 32.7 35.8
apositive propensity respondents are those who stated they either"definitely" or "probably" will be serving in one or more of the four
* Active Duty Services in the next few years.
17
, j
As can be seen, the level of positive propensity for each Service and for
any Active Duty Service is higher than that previously reported. These
results are not unexpected, given the age bias in the originally reported
figures.
The Rand Corporation analysis. The Rand Corporation studied the pro-
pensity series comparability issue somewhat differently than RTI, and
extended the restatement of propensity to Waves 2 through 12 (Spring 1976
through Fall 1981) for the males and Waves 11 through 13 (Fall 1980 through
Fall 1982) for the females.
Rand worked with three weighting schemes in studying the issue. Like
RTI, it began with an analysis of Wave 13 (Fall 1982) and Wave 14 (Fall
1983) propensity data. The first approach divided the 1982 and 1983 young
male (16-21) samples into 60 cells based on age (4 categories), race (white
and non-white), and geographical region (9 for whites, 6 for non-whites).
The 1982 propensity results were then weighted by the MEPS national
weighting factor provided by Market Facts and means calculated for each
cell. Next, each cell was weighted in proportion to the 1983 sample of
16-21 year old males that fell in that cell and the weighted cell means
sumed. The second approach was similar but used only 16 cells based on 4
geographical regions for all respondents, 2 age groups and 2 race groups.
The third approach, following RTI's lead, weighted the 1982 data by the
MEPS national weight alone.
All three procedures yielded similar results, with the more complex
procedures providing marginally more precise results. The "MEPS national
weights only" procedure produced the same results as obtained by RTI. The
18
propensity data for Waves 2 through 12 (Spring 1976 through Fall 1981) were
evaluated in a similar manner as above, but the analyses were based on
Tracking Area weights rather than MEPS national weights. As was the case
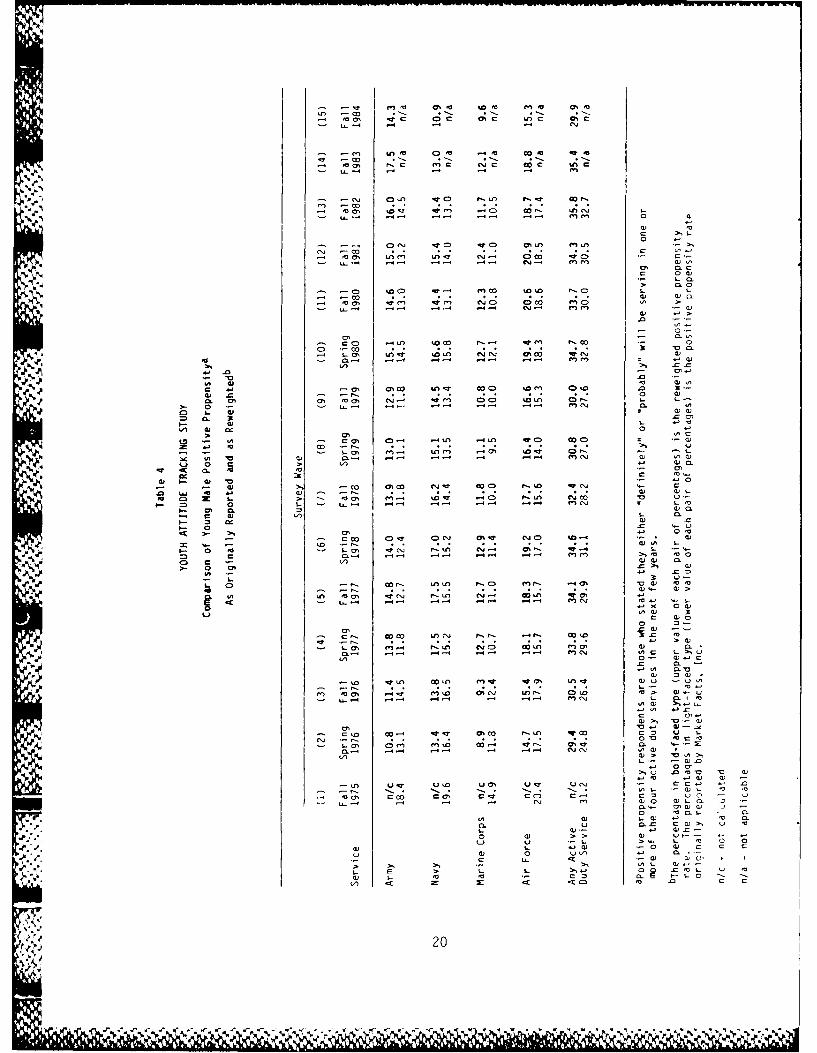
before, all three methods yielded similar results. Table 4 summarizes the
results of the Rand reweighting using the Tracking Area or MEPS national
weights as adjustment factors, as discussed above.
The data for females for Waves 11 through 13 (Fall 1980 through Fall
1982) were also evaluated by Rand using the same 16-cell and geographic
weight only procedure (Tracking Area weights for Waves 11 and 12 and state
weights for Wave 13 as provided by Market Facts) as were employed in the
analysis of the data for males. Due to the relatively small size of the
female samples, the 60-cell approach was not tested. Unlike the results
obtained for the males, these two weighting procedures produced results
that were systematically different from Pch other. Accordingly, Rand
showed that it would be desirable to use adj'istment factors, in addition to
the geographical weights, in order to make Waves 11 through 13 data com-
parable to the Wave 14 (Fall 1983) data.
Two additional procedures were evaluated. The first was a modified
16-cell region/age/race adjustment that used the 1980-1982 average sample
proportions in each of the 16-cells so that one set of weights would be
used for all three waves. The second approach initally weighted the
results using the Market Facts, Inc. geographical region by age/race for-
mula and then adjusted the result to reflect the Wave 14 (Fall 1983) age
distri-bution. Compared to the original 16-cell weighting procedure the
modified 16-cell weighting procedure produced similar and satisfactory
19N N %°
17 V 4w.Q r
-9o
F: - - - ,
-co. - 400~4 40~ 00- r-. ~ tcij
0 0.
-- ~~~~~c 0~40 ~ %.% (~40 co Ci C9V'.- t:
m a,0 'n~ -cAm 0 C. 000 c" CD-L4 - - - CJ- m (n a,
C 00ca
00
L.c C) If! - -- C9J 4 1%C 3 10C00~~0 .4-4>ko Ci %0 11c
.A0
-m 1- -
o) 0%-~c 1 00 r.- *' uc
o -c . . . . .W44 - -0% 44440 04(4 '.44' 04C 4CJ0
*~~~ ~~ -.- a % - -C- ~ -~4 -
0) 10 0*0 CIO
a) L- 40094C It~- 404 .40 It. C'.CU )ca X. L. > a, fn %ar C r i0
cm aau 3
o% c0 4-cco o~ C'. 0.1ll (.0 404.-
s0 cn 4-04 4C.) ru C'.- 0a%- ~ -'.
-T0 C\ .40 --c Y
cml4% 4i - -4
0 0)
.o a -
A, U .0a
ON en10 O W) C ) 4) um) '-04
m 40% .40 4)40 044% 414-- '.O40>. W~~ cu
U.'4 *>4- 4-o a).4 4
54 C9- 't. 09C 0-U MC ~U 4
Z a-. C)~ m 'n 0 CO- T0' a,~ -T CL -0=- -l - C- ~ ~.' 4
>0 .0 0
-M u- u .4 , m 0) - 0 -0 4a,0.- . -
0)40) 0 - 40
4- 0). C7, cu w0 0) >>0 v4. a -
CL u.0 0 m )
*44~~~~~~' >:c' - ) 00
4- 0 > 4 4- 44.40 .004- - 4
S) - m0 a 0 ~ C. 44 0 4-
-/ C E ' C 0 .
20
results, while the age adjustment procedure produced positive propensity
estimates that were systematically lower than the original 16-cell and the
modified 16-cell weighting procedures. Based on these findings Rand
concluded that the modified 16-cell weighting procedure produced the opti-
mum solution for restating Waves 11 through 13 propensity data for females.
Table 5 presents the reweighted data.
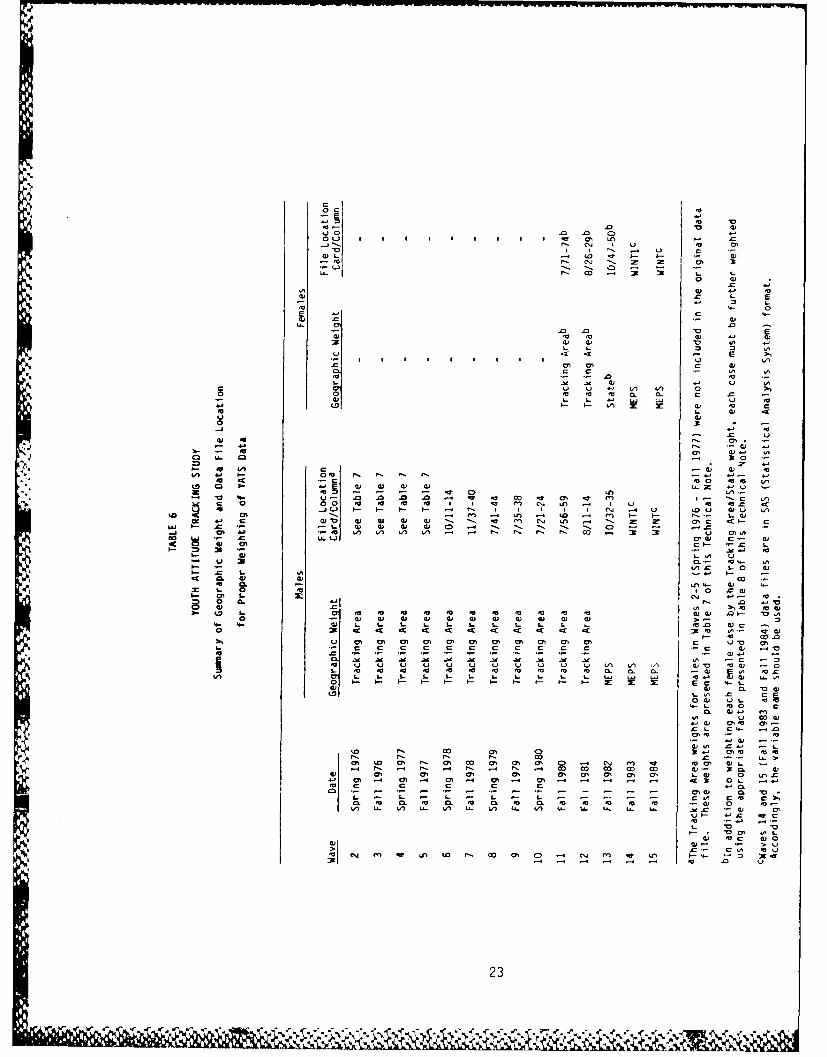
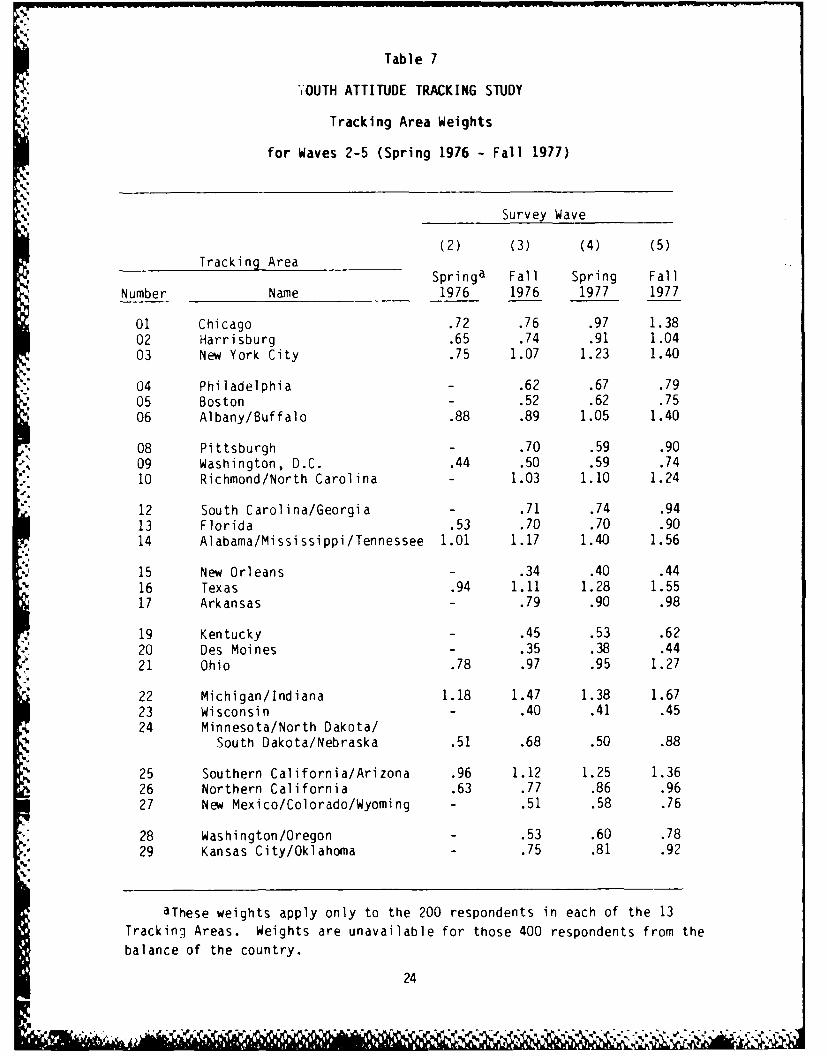
Tables 6, 7, and 8 provide the technical information that will permit
YATS data file users to apply the weighting schemes developed by RTI and
Rand in their own analyses. Presented in Table 6 is a summary of the
geographical weight (Tracking Area, MEPS, or state weight) to be used, and
-. its location (card/column numbers or variable name) in the data file. The
Tracking Area weights for the males in Waves 2 through 5 (Spring 1976
through Fall 1977) were not included in the original data files.
MAccordingly, Table 7 lists these weights as a supplement to Table 6. The
weighting factors developed by Rand and used in their modified 16-cell
weighting procedure for females in Waves 11 through 13 (Fall 1980 through
• Fall 1982) are presented in Table 8.
1"S J.
21
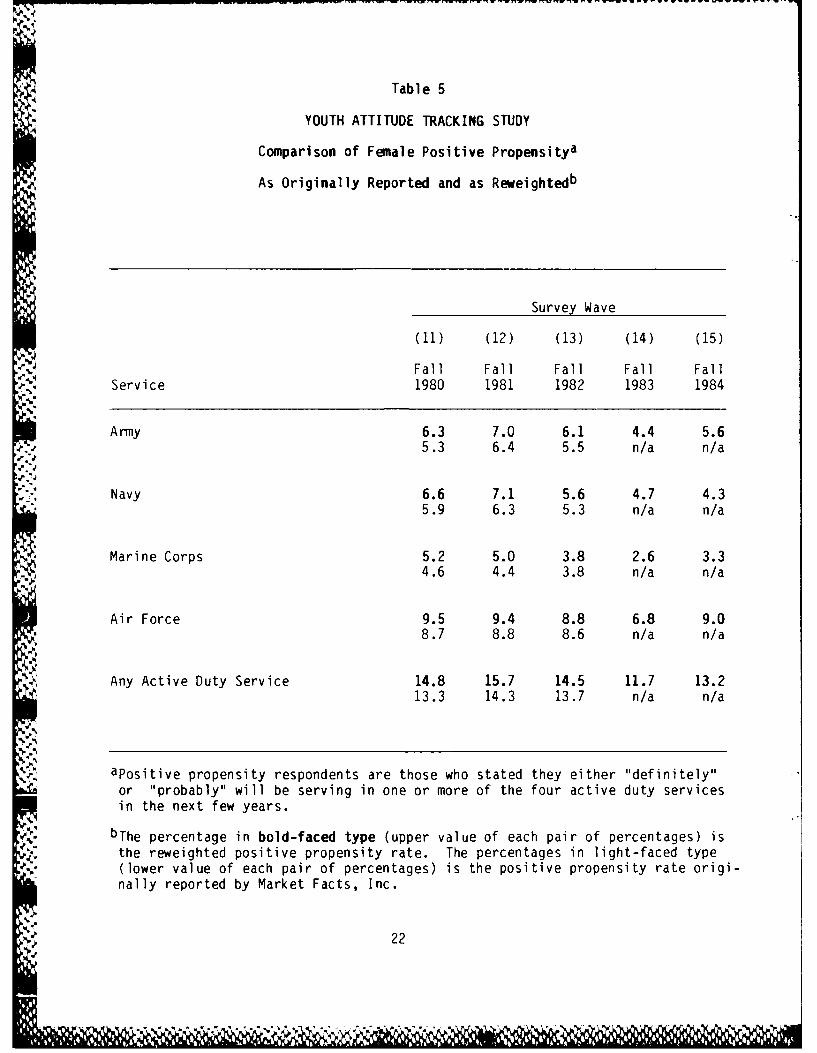
Table 5
YOUTH ATTITUDE TRACKING STUDY
Comparison of Female Positive Propensitya
As Originally Reported and as Reweightedb
Survey Wave
(11) (12) (13) (14) (15)
Fall Fall Fall Fall FallService 1980 1981 1982 1983 1984
Army 6.3 7.0 6.1 4.4 5.6.1 5.3 6.4 5.5 n/a n/a
Navy 6.6 7.1 5.6 4.7 4.35.9 6.3 5.3 n/a n/a
Marine Corps 5.2 5.0 3.8 2.6 3.34.6 4.4 3.8 n/a n/a
Air Force 9.5 9.4 8.8 6.8 9.08.7 8.8 8.6 n/a n/a
Any Active Duty Service 14.8 15.7 14.5 11.7 13.213.3 14.3 13.7 n/a n/a
.,
apositive propensity respondents are those who stated they either "definitely"or "probably" will be serving in one or more of the four active duty servicesin the next few years.
bThe percentage in bold-faced type (upper value of each pair of percentages) isthe reweighted positive propensity rate. The percentages in light-faced type(lower value of each pair of percentages) is the positive propensity rate origi-nally reported by Market Facts, Inc.
* 22
CC
M 0 Q aj .. r*- (NJ U 'V~~L L- - -
a, a,
a, .C C--
to 4- 0,U aII 0 ft m m m I Iac n,"V 4) a, -W ( r , '
aty acu1 4
c~~~ CL w4)cn- 4) >
00 CL .. ' 431 C.DI .0 'V M n m a1
(D a, w- U 0) a , (D w 4di~~~ U- S' %- IA &-0 . & - S
u c cn t~l 0) ol h CI a c a, cu
u 0 u u u ) ' w 'V10~~ ~ ~ ~ mr m - 0 u o u
-A 6' L.~ -6, s-I
0~ 0. U - ~ 3
0V to CY % c a, 'VmC) Cj -'V m mC cVO 3, ' It I c
V) L2 V)I- I- V) L- Ln-r- I V) I LI (NJ a) U a,
U.L)~G 01) . a
ar d- r-
- L% 3I 1?. If.-
IA.C LO a
.'
Table 7
Y"OUTH ATTITUDE TRACKING STUDY
Tracking Area Weights
for Waves 2-5 (Spring 1976 - Fall 1977)
Survey Wave
(2) (3) (4) (5)Tracking Area
Springa Fall Spring FallNumber Name 1976 1976 1977 1977
01 Chicago .72 .76 .97 1.3802 Harrisburg .65 .74 .91 1.0403 New York City .75 1.07 1.23 1.40
04 Philadelphia - .62 .67 .7905 Boston - .52 .62 .7506 Albany/Buffalo .88 .89 1.05 1.40
08 Pittsburgh - .70 .59 .9009 Washington, D.C. .44 .50 .59 .741" 10 Richmond/North Carolina - 1.03 1.10 1.24
12 South Carolina/Georgia - .71 .74 .9413 Florida .53 .70 .70 .9014 Alabama/Mississippi/Tennessee 1.01 1.17 1.40 1.56
15 New Orleans - .34 .40 .4416 Texas .94 1.11 1.28 1.5517 Arkansas - .79 .90 .98
19 Kentucky - .45 .53 .6220 Des Moines - .35 .38 .44
* 21 Ohio .78 .97 .95 1.27
22 Michigan/Indiana 1.18 1.47 1.38 1.6723 Wisconsin - .40 .41 .4524 Minnesota/North Dakota/
South Dakota/Nebraska .51 .68 .50 .88
25 Southern California/Arizona .96 1.12 1.25 1.3626 Northern California .63 .77 .86 .9627 New Mexico/Colorado/Wyoming - .51 .58 .76
28 Washington/Oregon - .53 .60 .7829 Kansas City/Oklahoma - .75 .81 .92
aThese weights apply only to the 200 respondents in each of the 13
Tracking Areas. Weights are unavailable for those 400 respondents from the
balance of the country.
24
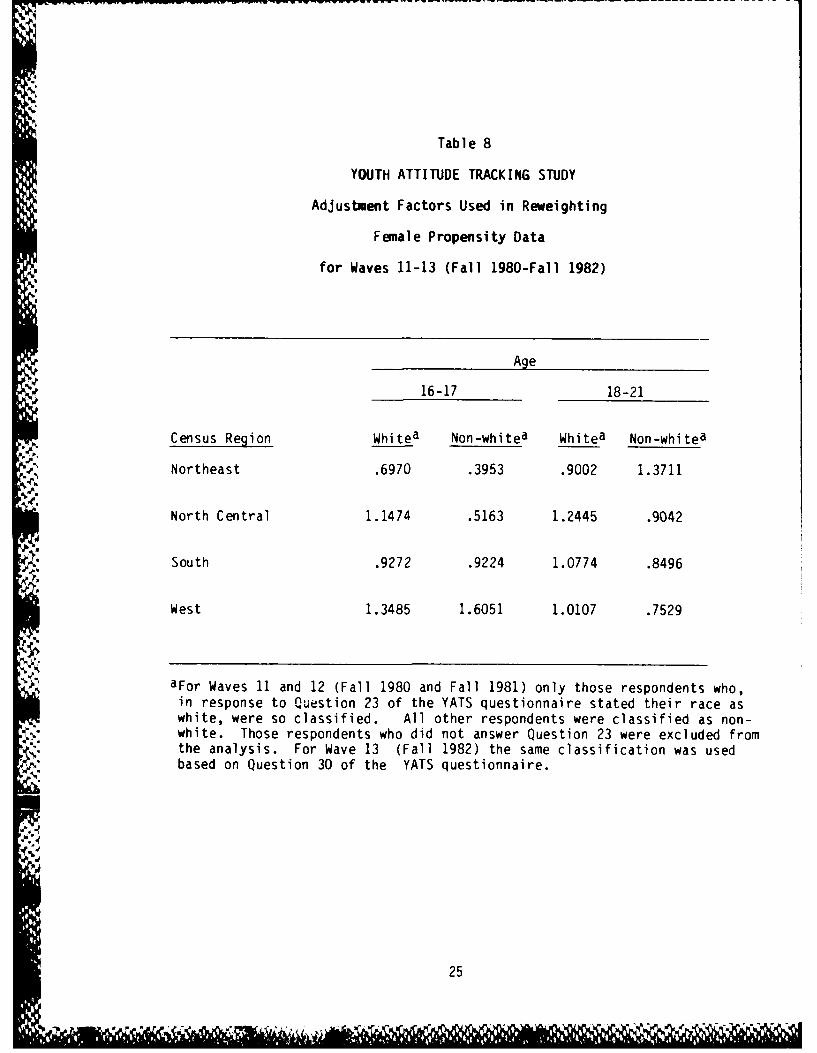
Table 8
YOUTH ATTITUDE TRACKING STUDY
Adjustment Factors Used in Reweighting
Female Propensity Data
for Waves 11-13 (Fall 1980-Fall 1982)
Age
16-17 18-21
Census Region Whitea Non-whitea Whitea Non-whitea
Northeast .6970 .3953 .9002 1.3711
North Central 1.1474 .5163 1.2445 .9042
South .9272 .9224 1.0774 .8496
West 1.3485 1.6051 1.0107 .7529
aFor Waves 11 and 12 (Fall 1980 and Fall 1981) only those respondents who,in response to Question 23 of the YATS questionnaire stated their race aswhite, were so classified. All other respondents were classified as non-white. Those respondents who did not answer Question 23 were excluded fromthe analysis. For Wave 13 (Fall 1982) the same classification was usedbased on Question 30 of the YATS questionnaire.
25
Summary
The increased utilization of YATS as a data source for policy and
.- ". program deliberations has led to an increased focus on its methodology in
the past two to three years. Consequently, a common misconception has been
that the changes that have occurred in the study have resulted principally
from a change in contractors. This technical note suggests the contrary.
More often that not, each successive wave of YATS has seen methodological
changes in order to enchance its reliability or to meet the changing needs
of its users.
This technical note summarizes these changes, describes the weighting
schemes employed in the various waves of YATS, and presents a methodology
that allows all data across all waves of the YATS to be compared.
V.2
-27
-44
.1~
S. p 4 * .~ -, .. I -. *, - -- ~