Embed Size (px)
Citation preview

Figure 1 Figure 3 Figure 5 Figure 7 Figure 8 Figure 9 Figure 10 Figure 11Figure 2 Figure 4 Figure 6
Pupil A: Zara BakerAt the end of KS1, Zara was a little below expectations in English and maths. When Mrs Evans inputs Zara’s scores for the two autumn reading tests into the Progress Tracker her scores are shaded red, indicating that Zara is still not making the progress expected for her age group. She attained scores of 9 (see Fig 1) and 10 (Fig 2 ) so she is only a little below where she should be.
Mrs Evans looks at Zara’s marks in detail and notices that Zara seems particularly weak on questions targeting Assessment Focus 3 (inference and deduction). Looking at the average mark per question information at the bottom of the test data she notices that AF3 is an area of weakness for many children in
the class (see Fig 2). She decides that she needs to do some additional work on this in class.In the spring term, Zara’s progress has accelerated and her scores are slightly higher. Her scores are shaded green indicating that she is now making the progress expected of a child in Y3. The additional work on AF3 seems to have helped as she is now getting some of these questions correct (see Fig 3 and Fig 4).
Zara’s scores remain similar in the summer term (see Fig 5 and Fig 6). This shows that her rate of progress is consistent as the tests become increasingly more difficult during the course of the year (see Fig 7).
Pupil B: Anil Gupta
Anil met the end of Y2 expectations for all subjects. His scores in the Rising Stars reading tests in the autumn term show that he continues to make expected progress because the marks fall in the green zone when his marks are put into the Progress Tracker. In the spring and summer terms his scores increase. (see Fig 8)Anil has benefited from the additional teaching around Assessment Focus 3 that Mrs Evans carried out at the end of the autumn term and is now more confident in that area and is answering questions assessing that area correctly. By the end of the year, Anil’s scores are towards the upper end of the range for expected progress indicating that his progress is secure.
Pupil C: Samantha Farrell
Samantha is on the Gifted and Talented Register and showed above expected attainment and progress at the end of Y2. Her scores for the reading tests show that she is consistently working above the expectations for Y3. (see Fig 9). Mrs Evans selects some more difficult texts for Samantha to read so that she is sufficiently challenged and also gives her the opportunity to answer more probing questions.
Pupil D: Mohammed Zaman
Mohammed has just come to the UK and is not yet fluent in English which is his second language. His results in the autumn reading tests show he is not making expected progress, however Mrs Evans judges that this is because he is still learning English as his results in the Rising Stars maths tests are all in the green progress zone. Mohammed receives additional language support in learning English and by the spring term his scores in the reading tests are increasing. He makes rapid progress and by the end of the summer term is making the progress expected of a Y3 pupil (see Fig 10).
At any time Mrs Evans can run reports on individual children (see Fig 10) or for the whole class (see Fig 11).
Tracking reading progress at Key Stage 2
A CASE STUDYSally Evans, a primary teacher, plans to use the Rising Stars Reading Progress Tests with her Year 3 class. The information she has about these children from assessments at the end of KS1 shows that most of the class are in line with national expectations for attainment and progress. However, there are a few children who did not meet expectations at the end of Y2 and also some children who performed well above national expectations.
Case study

Figure 3 Figure 5 Figure 7 Figure 8 Figure 9 Figure 10 Figure 11Figure 2 Figure 4 Figure 6Figure 1Case study
Return to Case study

Figure 1Case study Figure 3 Figure 5 Figure 7 Figure 8 Figure 9 Figure 10 Figure 11Figure 4 Figure 6Figure 2
Return to Case study

Figure 1Case study Figure 5 Figure 7 Figure 8 Figure 9 Figure 10 Figure 11Figure 2 Figure 4 Figure 6Figure 3
Return to Case study

Figure 1Case study Figure 3 Figure 5 Figure 7 Figure 8 Figure 9 Figure 10 Figure 11Figure 2 Figure 6Figure 4
Return to Case study

Figure 1Case study Figure 3 Figure 7 Figure 8 Figure 9 Figure 10 Figure 11Figure 2 Figure 4 Figure 6Figure 5
Return to Case study

Figure 1Case study Figure 3 Figure 5 Figure 7 Figure 8 Figure 9 Figure 10 Figure 11Figure 2 Figure 4 Figure 6
Return to Case study
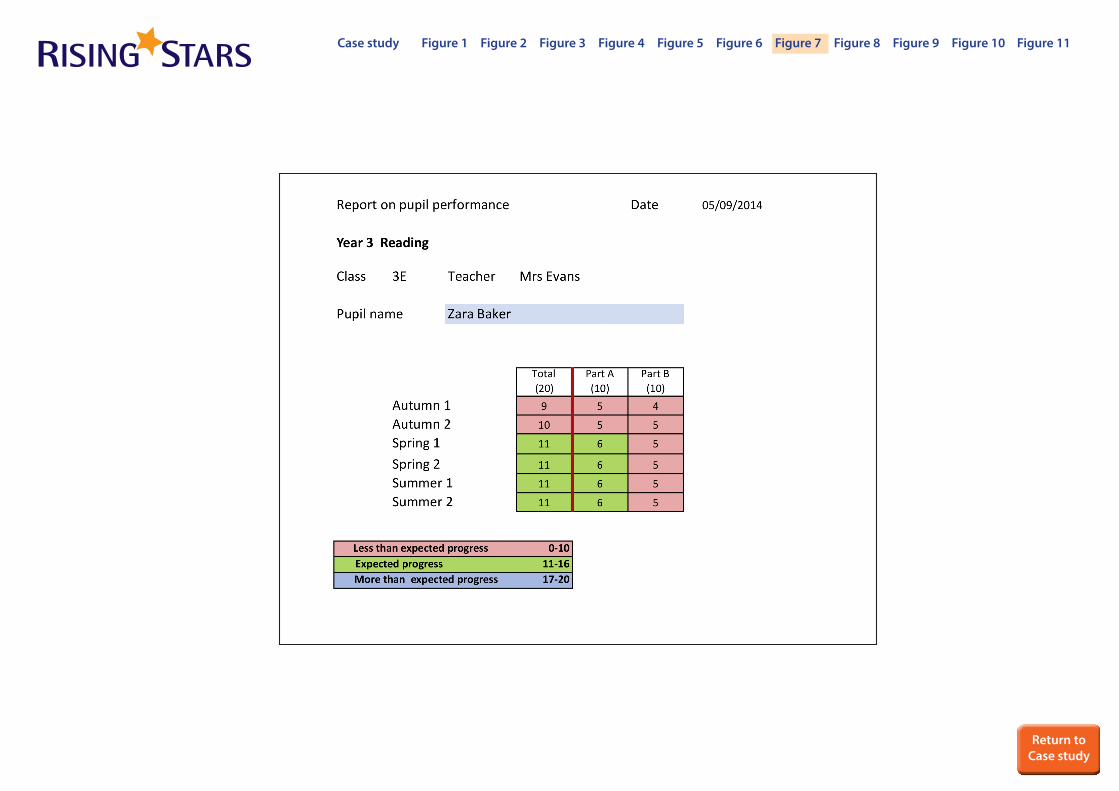
Figure 1Case study Figure 3 Figure 5 Figure 8 Figure 9 Figure 10 Figure 11Figure 2 Figure 4 Figure 6 Figure 7
Return to Case study

Figure 1Case study Figure 3 Figure 5 Figure 7 Figure 9 Figure 10 Figure 11Figure 2 Figure 4 Figure 6 Figure 8
Return to Case study

Figure 1Case study Figure 3 Figure 5 Figure 7 Figure 8 Figure 10 Figure 11Figure 2 Figure 4 Figure 6 Figure 9
Return to Case study

Figure 1Case study Figure 3 Figure 5 Figure 7 Figure 8 Figure 9 Figure 11Figure 2 Figure 4 Figure 6 Figure 10
Return to Case study

Figure 1Case study Figure 3 Figure 5 Figure 7 Figure 8 Figure 9 Figure 10Figure 2 Figure 4 Figure 6 Figure 11
Return to Case study

