Embed Size (px)
Citation preview

Supported by;
The project is funded by the EU under the EU4Business initiative and implemented by the EBRD
TRADE
OPPORTUNITIES
in
ISRAEL
FOR UKRAINIAN COMPANIES
IN THE AGRO SECTOR
2
The project is funded by the EU under the EU4Business initiative and implemented by the EBRD
Supported by;
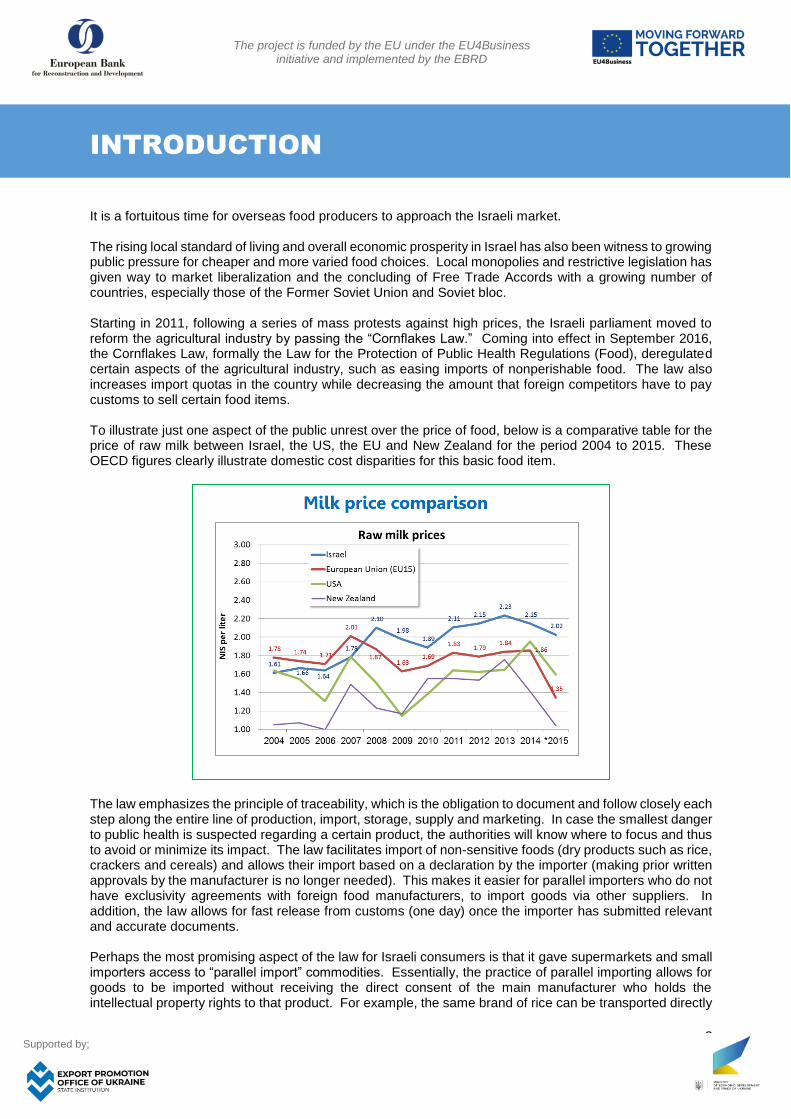
INTRODUCTION It is a fortuitous time for overseas food producers to approach the Israeli market. The rising local standard of living and overall economic prosperity in Israel has also been witness to growing public pressure for cheaper and more varied food choices. Local monopolies and restrictive legislation has given way to market liberalization and the concluding of Free Trade Accords with a growing number of countries, especially those of the Former Soviet Union and Soviet bloc. Starting in 2011, following a series of mass protests against high prices, the Israeli parliament moved to reform the agricultural industry by passing the “Cornflakes Law.” Coming into effect in September 2016, the Cornflakes Law, formally the Law for the Protection of Public Health Regulations (Food), deregulated certain aspects of the agricultural industry, such as easing imports of nonperishable food. The law also increases import quotas in the country while decreasing the amount that foreign competitors have to pay customs to sell certain food items. To illustrate just one aspect of the public unrest over the price of food, below is a comparative table for the price of raw milk between Israel, the US, the EU and New Zealand for the period 2004 to 2015. These OECD figures clearly illustrate domestic cost disparities for this basic food item.
The law emphasizes the principle of traceability, which is the obligation to document and follow closely each step along the entire line of production, import, storage, supply and marketing. In case the smallest danger to public health is suspected regarding a certain product, the authorities will know where to focus and thus to avoid or minimize its impact. The law facilitates import of non-sensitive foods (dry products such as rice, crackers and cereals) and allows their import based on a declaration by the importer (making prior written approvals by the manufacturer is no longer needed). This makes it easier for parallel importers who do not have exclusivity agreements with foreign food manufacturers, to import goods via other suppliers. In addition, the law allows for fast release from customs (one day) once the importer has submitted relevant and accurate documents. Perhaps the most promising aspect of the law for Israeli consumers is that it gave supermarkets and small importers access to “parallel import” commodities. Essentially, the practice of parallel importing allows for goods to be imported without receiving the direct consent of the main manufacturer who holds the intellectual property rights to that product. For example, the same brand of rice can be transported directly

3
The project is funded by the EU under the EU4Business initiative and implemented by the EBRD
Supported by;
from Spain or the original producer in Greece instead of going through the primary importer. This has driven down the prices of goods for consumers. In effect, easing import restrictions on dry food products has increased competition between domestic and foreign companies. Large supermarkets are decreasing costs through directly importing from foreign food exporters while giving Israeli consumers access to a wider array of products. Perishable food items are not accounted for under the Cornflakes Law. This was ironic due to the fact that price hikes in dairy products were one of the many factors (along with high costs of other food items, housing, transportation, and gas as well as perceived economic injustice) that prompted the demonstrations by Israelis. At that time of unrest and consumer dissatisfaction, Israelis launched a boycott of cottage cheese and other dairy products to pressure legislators to adopt reforms in the food industry. Gradually, deregulatory measures to lower the price of dairy products have been slowly implemented.
PART I: OVERVIEW OF THE ISRAELI ECONOMY - 2018 The Israeli economy continues to perform well, beating many of its peer countries and remaining the envy of most, if not all, of the developed world’s economies. The continuing electoral victories by Prime Minister Netanyahu reiterates the continued good guidance of the economy, something tempered, as always, by security concerns. Indeed, in February 2019, S&P Global Ratings affirmed Israel's 'AA-/A-1+' long- and short-term foreign and local currency sovereign credit ratings with a stable outlook. This move was echoed in March 2019, when Fitch Ratings also affirmed Israel's Long-Term Foreign- and Local-Currency Issuer Default Ratings (IDRs) at 'A+' with a Stable Outlook.
Map of Israel
The International Monetary Fund holds a favorable forecast for Israel's economic growth for 2019, forecasting 3.5%, amid otherwise conservative projections for the rest of the global economy. The IMF observed in May 2018 (latest Article IV review) that Israel is enjoying solid economic growth and low unemployment, making this an especially favorable time to undertake reforms to help sustain strong and inclusive growth. Israel's monetary policy should continue to support the return of inflation to the target band. Major progress has been achieved in reducing public debt, a trend that should be maintained while raising potential growth through sound investments in education, health and infrastructure. Israel's GDP growth rate has averaged some 1% from 1980 until 2013. From 2013 to 2018, growth averaged 3.6%.

4
The project is funded by the EU under the EU4Business initiative and implemented by the EBRD
Supported by;
Indeed, the leading international credit ratings agencies agree that Israel's economy could grow by an average 3.1% annually between 2017 and 2020. The standard of living in Israel is steadily increasing, as reflected in the growth of per capita GDP. However, per capita GDP in Israel (in PPP terms) remained low compared to other advanced economies, and the gap has not narrowed in recent years. Israel’s disadvantage in per capita GDP largely reflects the relatively low level of labor productivity in Israel. Demographic factors, which were reflected in a decline in the working-age population as a share of the total population in Israel (an increase in the dependency ratio), widened the gap in per capita GDP between Israel and the other advanced economies in recent years. In contrast, the relatively rapid growth of the employment rate in Israel served to narrow it.
Bank of Israel, 2019
The economic outlook is favorable in the near term but challenges will increase over time. Growth is expected to remain strong at about 3.5% in the next few years benefitting from the completion of major projects. With trend productivity gains relatively modest at 1% annually, growth is projected to average about 3% in subsequent years.

5
The project is funded by the EU under the EU4Business initiative and implemented by the EBRD
Supported by;
Israel Comparative OECD Annual GDP Growth: 2007 – 2016
Israel does face, according to the IMF, two major challenges to sustaining solid growth in the longer run. Subgroups with lower average labor market skills and labor force participation, especially ultra-Orthodox and to a lesser extent Arab Israelis, will rise as a share of the working age population from one quarter in 2015, to one third by 2025, and two fifths by 2045. Moreover, Israel faces sizable infrastructure needs, most evident in traffic congestion already the worst in the OECD, which will increasingly drag on productivity as the population and per capita incomes rise.
The inflation rate, once the bugaboo of the economy, has been historically low. In recent years, inflation in Israel has actually been lower than inflation in other OECD countries. This is even though the output gap (actual GDP relative to potential GDP) in Israel was relatively high, private consumption increased more rapidly, and wages - hence the unit labor cost - increased by higher rates. These findings are consistent with the Bank of Israel's assessment that the relatively low inflation in Israel reflected the effects of supply factors - including government measures to support the lowering of the cost of living in Israel, particularly in the years following the social protest of 2011/12. Beyond the impact of specific measures, especially those if the Netanyahu government, it seems that consumer awareness and sensitivity to price rises increased during those years, which might have made it difficult for firms to raise prices. Overall, Israel has averaged 1.7% inflation annually since 2011. After the March 2015 elections and the formation of a coalition government the following May, Prime Minister Netanyahu has implemented a spate of economic reforms. Much of this process has been complicated as his narrow government has a number of recalcitrant partners.

6
The project is funded by the EU under the EU4Business initiative and implemented by the EBRD
Supported by;
Israel passed the budget for 2019 in mid-March 2018, earlier than normal due to political considerations. The budget revised the deficit ceiling for 2019 to 2.9% of GDP from 2.5% of GDP in the previous multiyear budget plan. The budget assumes a 5% increase in revenue over the updated 2018 budget, slightly stronger than our forecast for overall nominal GDP growth in 2019. Spending is planned to grow by 5.6%. This includes sizeable increases for education and other social spending, as well as for defense and for infrastructure. Natural gas fields discovered off Israel's coast since 2009 have brightened Israel's energy security outlook. The Tamar and Leviathan fields were some of the world's largest offshore natural gas finds of this past decade. The massive Leviathan field is not due to come online until 2018, but production from Tamar provided a significant boost to Israel's GDP. For example, Israel's gas royalties increased by 8.5% during the course of 2016. The effect is also being felt regionally. Natural gas from Israel's offshore Tamar reservoir began flowing to Jordan in early 2017. Despite the initial small amount of gas, it is being delivered via a special pipeline built in the Dead Sea. In December 2016, government ministers from Israel, Greece, and Cyprus agreed to continue their promotion of a natural gas pipeline from Israel to Europe. This is not only an economic boon to Israel, but a strategic breakthrough for Western Europe, freeing it from dependence on Russian gas. Between 2004 and 2011, Israel's economic growth averaged nearly 5% per year, led by exports. The global financial crisis of 2008 - 09 spurred a brief recession in Israel, but the country entered the crisis with solid fundamentals, following years of prudent fiscal policy and a resilient banking sector. Israel's economy has also weathered the so-called Arab Spring because strong trade ties outside the Middle East have insulated the economy from spillover effects. The economy has recovered better than most advanced, comparably sized economies, but slowing demand domestically and internationally, and a strong shekel, has reduced growth forecasts for the next decade to the 3% level.
Israel's Overall Imports of Consumer Goods
Israel, known worldwide as the “Start-Up Nation,” excels in all hi-tech sectors. This prowess is bolstered by the defense sector and there is an intimate relationship between these two spheres. The percentage of Israelis engaged in scientific and technological inquiry and the amount spent on R&D in relation to the GDP is amongst the highest in the world. Israel ranks fourth in the world in scientific activity, as measured by the number of scientific publications per million citizens. Israel's percentage of the total number of scientific articles published worldwide is almost 10 times higher than its percentage of the world's population. Despite its small population relative to other industrialized nations around the world, Israel has the highest number of scientists, technicians, and engineers per capita in the world with 140 scientists, technicians, and engineers per 10,000 employees. In comparison, the equivalent number is 85 per 10,000 in the United States and 83 per 10,000 in Japan.

7
The project is funded by the EU under the EU4Business initiative and implemented by the EBRD
Supported by;
The economy is also supported by strengths in electronic and biomedical equipment, agricultural products, processed foods, chemicals, pharmaceuticals, and transport equipment. Recent discoveries of large off-shore natural gas reserves have the potential to make Israel a net energy exporter in the near future. Israel has been a member of the OECD since 2010. In 1985, the United States and Israel concluded a Free Trade Accord, the first official such agreement by Washington with a foreign country. Israel currently also has free trade agreements with the European Union, the European Free Trade Association, Turkey, Mexico, Canada, Jordan, Egypt, Ukraine and the Mercosur trade bloc.
Basic Economic & Trade Statistics – 2018
Population: 8.995 million (2.1% annual growth) Inflation: 0.1% (February 2019) (0.8% for 2018) GDP: $350.81 billion (PPP), +3.3% growth for 2018 GDP per capita: $39,600 (PPP), +1.3% growth in 2018 Business Product: +6% (+3.9% growth) FDI Inflow: $56.7 billion Exports of Goods & Services*: $103.8 billion (+4.8%) Import of Goods & Services*: $102.2 billion (+14.4%) *excluding diamonds Israel recorded an overall trade deficit (in goods only) of $21.39 billion in 2018 due to the fact that the Israeli exports have been hurt by a strong shekel. This was a 43% jump from 2017's total trade deficit of $14.9 billion. Total Israeli imports of goods in 2018 were worth $75.6 billion, an 11.2% rise over 2017's $68 billion.
ISRAEL – UKRAINE TRADE According to the State Statistics Service of Ukraine, in 2017 the total trade turnover (goods and services) between Israel and Ukraine amounted to $973.4 million, marking an increase of 13% compared to 2016, which was $861.3 million. Ukrainian exports totaled $781.4 million, an 18.6% increase, while imports from Israel were worth $192 million, registering a 6.1% drop in annual terms. For 2017, Ukraine enjoyed a trade surplus of $589.4 million with Israel. For 2017, the trade in goods alone amounted to made $772.5 million, a 14.7% increase (worth $99.2 million) over the previous year. Ukrainian exports were worth $604.6 million, marking a 23.8% annual increase, while imports from Israel were $167.9 million, a 9.2% decrease, resulting in a Ukrainian trade surplus of $436.7 million. Israeli imports from Ukraine of cereals were worth $407 million during 2017, according to the United Nations COMTRADE database on international trade. Cereal imports made up 50% of all Israeli imports from Ukraine in that year. Other leading exports from Ukraine to Israel were: ferrous metals (25.9%), oil seeds and oleaginous plants (7.9%), food industry byproducts (4.8%), wood (1.7%), oil (1.6%) and milling industry products (1.2%). Main imports from Israel to Ukraine were: various chemical products (39.8 %), refined mineral fuel, oil and related products (9.2 %), plastics & polymers (8.6 %), nuclear reactors, boilers and related machinery (5.5 %), electric machines (5 %) pharmaceutical products (4.4 %) and goods procured in ports (6.2 %). In 2017, bi-lateral trade in services amounted to $200.9 million and increased by 6.9% or $12.9 million compared to the previous year. Export amounted to $176.8 million and increased by 5%, while imports were $24.1 million and increased by 23.1%.

8
The project is funded by the EU under the EU4Business initiative and implemented by the EBRD
Supported by;
Key Ukrainian Exports to Israel by Value - 2017 Value Year
Cereals $406.99 million 2017
Iron and steel $177.44 million 2017
Oil seed, oleagic fruits, grain, seed, fruits $69.77 million 2017
Residues, wastes of food industry, animal fodder $41.32 million 2017
Wood and articles of wood, wood charcoal $15.74 million 2017
Animal, vegetable fats and oils, cleavage products $8.86 million 2017
Electrical, electronic equipment $8.86 million 2017
Machinery, nuclear reactors, boilers $7.03 million 2017
Dairy products, eggs, honey, edible products $6.94 million 2017
Fertilizers $6.91 million 2017
Cereal, flour, starch, milk preparations and products $6.22 million 2017
Sugars and sugar confectionery $5.05 million 2017
Milling products, malt, starches, wheat gluten $5.02 million 2017
Miscellaneous edible preparations $4.97 million 2017
Beverages, spirits and vinegar $3.81 million 2017
Cocoa and cocoa preparations $3.06 million 2017
Vegetable, fruit, nut food preparations $2.23 million 2017
Fish, crustaceans, mollusks, aquatics invertebrates $2.21 million 2017
Edible vegetables and certain roots and tubers $744,000 2017
Meat, fish and seafood preparations $513,000 2017
Coffee, tea, mate and spices $217,000 2017
Products of animal origin $165,000 2017
Edible fruits, nuts, peel of citrus fruit, melons $132,000 2017

9
The project is funded by the EU under the EU4Business initiative and implemented by the EBRD
Supported by;
PART 2: ISRAEL'S AGRICULTURAL COMMODITY & FOOD MARKET
Israel's Import Regime As stated above, the process of liberalization of Israel's food import regime has presented many opportunities for foreign food producers. It is still important to remember that the market remains tightly regulated, regardless of free trade accords, given the strict oversight exercised by the Israeli Ministry of Health and other food regulatory authorities. As well, local conventions remain tightly in place, either as protective measures for sensitive local industries (such as poultry, dairy or apiary products), or in support of kosher food restrictions that impact a majority of the Jewish and Moslem consumers.
Central Bureau of Statistics, 2017/8 Figures
Raw food materials are imported either directly by food manufacturers, through importers, or agents. Importers and agents sell directly to food manufacturers or via distributors. Local producers of raw food materials generally sell directly to food manufacturers, but will use distributors to supply to smaller food manufacturers. The large food processing companies, as well as some large distributors, increasingly prefer to source their food ingredients directly from overseas suppliers. By removing local agents from the distribution chain, they can save costs and are able to buy bulk and repack as needed. The majority of the large food processing companies in Israel have their own import departments that work directly with suppliers. Smaller Israeli food processors tend to prefer to purchase from agents because they can obtain better service from these parties. The local agents normally buy large quantities from overseas and distribute those to smaller buyers. Small food processers can also use local suppliers to protect themselves from some risk and better manage contract terms, quality issues, etc.

10
The project is funded by the EU under the EU4Business initiative and implemented by the EBRD
Supported by;
Israel Food Importation: Some Rules & Regulations Overall, the Ministry of Health divides all food products into the general categories of sensitive and non-sensitive products. Importation of food is regulated under the Public Health Protection (Food) Law 2015, under which is mandated more stringent certificate requirements for those goods listed as sensitive. While non-sensitive products may require only a sanitary or health certificate, sensitive products could require additional certification such as a manufacturing license (ISO 9001 or 22000), GMP certificate, or a certificate of thermal treatment for low acid canned goods. Due to the complicated nature of many of these stipulations, working with an Israeli agents is perhaps the best way to meet the certificate requirements for sensitive products. As per the latest update of October 2016, the Israeli Ministry of Health defines the following items as Sensitive Food Products:
▪ Milk products and milk product substitutes, including canned products ▪ Meat & poultry products and their substitutes, including canned products ▪ Fish products & their substitutes and shellfish, including canned products ▪ Food supplements, including vitamins, minerals and herbs ▪ Baby food, including; infant formula, follow-up formula, baby porridge, puree baby food, biscuits
baby food and fruit juice baby food ▪ Food products for people with metabolic disorders (e.g. people with PKU, Gluten or lactose free
products, low calorie products; sugar free items) ▪ Canned food (pH >= 4.5) ▪ Eggs products, including confectionery products that contain eggs ▪ Gelatin products, including products that contain gelatin. ▪ Collagen products, including products that contain collagen. ▪ Honey products according to the Israeli Honey Standards (SI 373) ▪ Other food products that have to be stored at low temperature s (chilled) ▪ Mineral water and other bottled water ▪ Beverages that are based on mineral water ▪ Mushroom products ▪ Food products for athletes ▪ Color additives for the retail market ▪ Mayonnaise and spreads that contain eggs ▪ Food products containing caffeine above 150 ppm (excluding coffee and tea) ▪ Fresh fruit and vegetables ▪ Vitamins, minerals and amino acids
In addition to the list above, the Ministry of Health's food and nutrition service has been known to add other kinds of foods that it deems it is a “sensitive” food product item without much warning.

11
The project is funded by the EU under the EU4Business initiative and implemented by the EBRD
Supported by;
Required Export Certificates: (This table is only illustrative and subject to change or revision)
Product (s) Title of
Certification
Attestation
Required Purpose
Requesting
Ministry
All Products
Export Certificate (e.g. FDA Certificate of Free Sale or Sanitary/Health Certificate)
Heath/Free Sale Certificate
MOAG, MoH
Invoice Declaration Origin of Product MOAG, MoH
Grains and Oilseeds (Human
Consumption)
Phytosanitary Certificate
Health Certificate MOAG, MoH
Grain Inspection Certificate
Weight, Grade MOAG, MoH
Stowage Examination Certificate
Free of pests and contaminates
MOAG, MoH
Fumigation Certificate (if applicable)
Health Certificate MOAG, MoH
Weight Certificate MOAG, MoH
Meat, Poultry and Products
Kosher Slaughter Certificate
Religious Certification
Chief Rabbinate of Israel
Meat and Poultry Export Certificate of Wholesomeness
NOTE: Specific attestations are required.
Health Certificate MOAG, MoH
Fish and Fish Products
Export Health Certificate and Certificate of Origin
Health Certificate MoH
Dairy Products
Sanitary Certificate (e.g. AMS)
Health Certificate MoH
Certificate of Analysis
MoH
Fruits and Vegetables
Phytosanitary Certificate
Phytosanitary Certificate
MOAG, MoH
Live Animals Veterinary Health Certificate
NOTE: Specific attestations are required.
Health Certificate MOAG
MOAG – Ministry of Agriculture and Rural Development MoH – Ministry of Health

12
The project is funded by the EU under the EU4Business initiative and implemented by the EBRD
Supported by;
PRODUCTS & REQUIREMENTS
Animal Products The importation of products of animal origin is regulated under the Animal Disease Regulations (Import and Export of Animal Products) 1988. According to these regulations, animal products are considered to be the carcass of any animal, inclusive of any part of an animal including blood and its components, skin, hide, bones, internal organs, hooves, horns, wool, hair, bristles, feathers, dung, and including meal, processed fat and other products derived from animal products, or material containing any such part used for the feeding of animals or the preparation of animal feed. It is important to always remember that non-kosher meats are not allowed for importation into Israel. There are also prohibitions on the import of crustaceans and other seafood. They are also not kosher and most supermarkets and retailers do not offer them. The general principles of certification for a consignment of animals or products of animal origin are detailed below:
General Principles of Certification: The representative of the competent authority of dispatch issuing a certificate to accompany a consignment of animals or animal origin must sign the certificate and ensure that it bears an official stamp. This requirement applies to each sheet of the certificate should it consists of more than one page. Certificates must be drawn up in English. However, it is possible to certify a bilingual document if it is the official language of the exporting country and English. The original version of the certificate must accompany consignments upon entry into Israel. Certificates must include:
• A single sheet of paper; or
• Two or more pages that are part of a single and indivisible sheet of paper; or
• A sequence of papers numbered so as to indicate that it is a particular page in a finite sequence (for example, ‘page 2 of 4’).
• Certificates must bear a unique identifying number. Where the certificate consists of a sequence of pages, each page must indicate this number.
• The original veterinary health certificate must bear the word “ORIGINAL”. Copies of the veterinary health certificate must bear the word “COPY”.
• The certificate must be issued before the consignment to which it relates leaves the control of the competent authority of the country of dispatch.
• The color of the stamp and signature must be different then to that of the other particulars in the certificate.
• Near each addition or correction, a signature and an official stamp must be added. Any deletion in the certificate should be in a manner that the deleted should be readable.

13
The project is funded by the EU under the EU4Business initiative and implemented by the EBRD
Supported by;
KOSHER CERTIFICATION Kosher is an important consideration in the export of food to Israel. With over 65% of the country's Jewish population maintaining some degree of kosher observance, and a Muslim population of one million purchasing kosher food that meets the halal dietary requirement, Israel is the largest market in the world for kosher food. Although the import of non-kosher food is not forbidden (with the exception of meat and poultry), its marketing would be limited to a small segment of the market. The large food chains, processing plants and institutional market import only kosher food. Non-kosher foods account for less than 5% of the total food market. The chief rabbinate's office provides what is known as rabbinate supervision for food products produced in Israel. It also relies on kosher certification granted overseas, usually dependent on which supervision that is (but not always). However, since the chief rabbinate's office is at times viewed as too lenient, there are alternatives. Badatz, or Mehadrin is a general term referring to enhanced or stricter kosher supervision. People use it to describe a particular standard, or they might mean a general term for one or several kosher supervisions available (e.g. Bedatz Eida Chareidis, Rav Landau, Rav Rubin, Sheeris Yisrael, Rav Machpud, etc.). The term can also be used by a local rabbinate certification to denote a higher level than their usual standard. In other words, it can mean anything or nothing. There is no universal standard. A person needs to ask the specific organization what is meant by mehadrin - this can include not relying on a full time overseer, more careful checking of bugs in vegetables and grains, using "bug free" leafy vegetables, using milk only from Sabbath observant farms, etc. There are some 28 different organizations that call themselves Badatz, each having their own standards. Some of their certification symbols are as follows:
A stricter kosher supervision is held by many products. One reason, among many, is that health food/natural food is increasingly popular with the ultra-Orthodox population in Israel.

14
The project is funded by the EU under the EU4Business initiative and implemented by the EBRD
Supported by;
Israel's Food Imports: Sectoral Overview Israel's annual average household food expenditure (including fresh fruits and vegetables) in 2016 reached $8,429. The monthly average household expenditures in 2016 totaled about NIS 15,805 (approximately $4,160), up 2.6% from 2015. Of total expenditures in 2016, 16.7% were allocated to food and agricultural products, making a total of $8,336 annually spent on food and agricultural products per household. Indeed, 16.2% of all credit card purchases in Israel in 2016 were for food and beverage items. Processed food (that is, excluding fresh fruit and vegetables) accounted for 13.4% of purchases. Fruits and vegetables accounted for the remaining 3.3%. The largest single expenditure in 2015 on food was meals away from home, at 2.8%, followed by meats and poultry, at 2.6%. However, consumer purchases do not reflect the complete picture when it comes to assessing the Israeli market. In terms of what Israelis are importing, based on the UN’s classification of imports according to their intended final uses (i.e. capital goods, intermediates goods and consumer goods), in 2017 Israel imported food products intended for private consumption worth $3.4 billion, while importing raw materials for the food industry worth an estimated $1.4 billion. For food products of all types, Israel's leading imports in 2017 included wheat (25%), cows and sheep (18%), soy beans (13%), barley (5%), sesame seeds (5%), sugar cane (4%) and coffee (4%). As a result, these items most heavily influence the prices of final food products in the country. The table below illustrates the division of food imports according to their primary use in Israel, either as raw or intermediate materials for the local industry or for private consumption.
Israel's Import of Food Products by Primary Usage for 2017 Product Category Primarily for Industry Primarily for Private Consumption
Animals 19.2% - Meat - 15.7% Fish & seafood - 13.4% Fruits & Nuts 0.3% 8.2% Grains 31.2% 2.4% Oilseed 21.2% - Oils & Fats 4.2% 3.3% Sugar & Other Sweeteners 6.7% 4.5% Cocoa & related products 4.7% 4.1% Products made from grains or flour 1.7% 7.5% Products made from fruits, vegetables or nuts
- 8.0%
Products made from other items 1.1% 10.3% Alcoholic beverages & vinegar - 9.4% Other 9.7% 13.2%

15
The project is funded by the EU under the EU4Business initiative and implemented by the EBRD
Supported by;
Israel's Dairy Sector The entire dairy sector is one of the most contentious sub-sectors of the Israel economy. It is highly protected domestically for a myriad of economic and political reasons. Nevertheless, import access is gradually increasing due to equally strong social pressure. The Israeli Government maintains a significant role in the dairy sector. The overall policy objective is to protect the domestic industry and encourage self-sufficiency, including in dairy products. Under the Dairy Sector Planning Law of 2011, the dairy industry is closely regulated and production is controlled through production quotas, farm-gate target prices for milk and regulated retail prices for a variety of dairy products. The government uses high tariffs to protect the industry. Tariff protection on dairy products is particularly high, with an average of 65.6% of the Most Favored Nation (MFN) rate. However, in an effort to lower the cost of living, the Israeli Government is slowly liberalizing dairy trade. On 28 October 2018, the Israeli ministries of Finance and Agriculture, together with the Israeli Farmers Association, the Association of Israeli Cattle Breeders and the Israeli Dairy Association signed an agreement of principles for dairy reform. The reform includes the gradual reduction of a number of tariffs and increases in a number of quotas. The changes in the tariffs and quotas are contingent on their effects on the Israeli dairy farmers. If the milk production in Israel is negatively affected, the process will likely be halted. Certain industry actors are currently opposing the reforms and it is unclear when the provisions will be implemented. While the agreement demands a reduction in import duties, raw milk prices are also expected to fall, but farmers will be compensated for the reduction by means of grants and investments from the Ministry of Finance. The agreement preserves planning in the dairy industry and the target price mechanism. It both includes grants and investment for dairy growers and opens the market to imports, with a gradual reduction in customs duties. The regulated target price of milk will be gradually reduced each year until 2025. Customs duties will be cut to NIS 4.90 per kilogram in 2019 and NIS 3.20 per kilogram in the final year of the agreement. If the target price is lower, customs duties will be lowered to NIS 3 per kilogram. As a result of the agreement, on 1 January 2019, the Israeli government opened the country to dairy imports. Concurrently, the government of Israel is working to promote Israeli dairy exports. In 2017 the Ministry of Agriculture and Rural Development signed an agreement with Chinese authorities, the Ministry of Economy and Industry and the Ministry of Agriculture and Rural Development, resulting in the announcement that China will soon officially allow the export of Israeli dairy products to China. Both Tnuva Dairy and Tara Dairy, major Israeli firms, submitted requests for approval for exports of their dairy product to China. Tnuva itself was actually acquired by the Chinese firm Bright Foods in 2015. While Tnuva has been working hard in the local market at a time when its market share there is shrinking, what was of interest to Bright Food was producing dairy products in China using Tnuva's technology. These plans, however, ran into the ground when the Chinese authorities refused to grant Tnuva the necessary regulatory approval for commencing manufacturing. It now appears that it will now be granted approval at least for exporting products made in Israel to China - obviously those with a longer shelf life, such as hard cheese. The question of manufacturing dairy products in China itself, which Tnuva originally hoped to do, meanwhile remains unresolved as 2019 began. Annual per capita milk consumption in China is only 12 liters, compared with 180 liters in Israel, 210 liters in the US, and 300 liters in Europe, but it has tripled in the past decade, and is projected to continue growing. Indeed, on 2 April 2019, Israel's biggest dairies Tnuva, Strauss and Tara were expected to bid in the Ministry of Economy and Industry's excise exempt tender to begin importing butter. Tnuva and Tara are the country's biggest producers of butter but there has been a major shortage in recent months with almost no butter to be found on the shelves of Israel's stores. Tnuva and Strauss have stopped making butter because
16
The project is funded by the EU under the EU4Business initiative and implemented by the EBRD
Supported by;
they claim the price fixed by the government does not make production worthwhile. Strauss does not produce butter but in recent months has been importing butter of Danish brand Lurpak. Because of the severe shortage of butter so far in 2019, the Ministry of Economy and Industry has approved excise free importing of 1,437,500 kilograms of table butter and 1,650 tons of butter for industry.
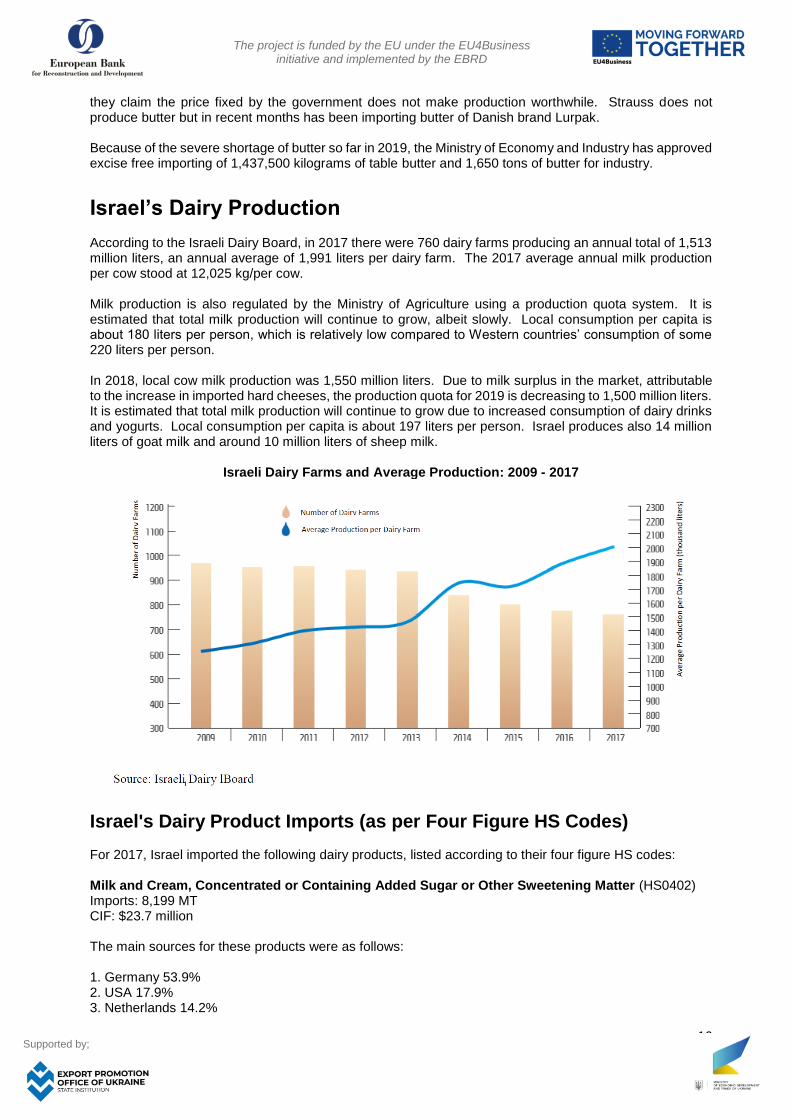
Israel’s Dairy Production According to the Israeli Dairy Board, in 2017 there were 760 dairy farms producing an annual total of 1,513 million liters, an annual average of 1,991 liters per dairy farm. The 2017 average annual milk production per cow stood at 12,025 kg/per cow. Milk production is also regulated by the Ministry of Agriculture using a production quota system. It is estimated that total milk production will continue to grow, albeit slowly. Local consumption per capita is about 180 liters per person, which is relatively low compared to Western countries’ consumption of some 220 liters per person. In 2018, local cow milk production was 1,550 million liters. Due to milk surplus in the market, attributable to the increase in imported hard cheeses, the production quota for 2019 is decreasing to 1,500 million liters. It is estimated that total milk production will continue to grow due to increased consumption of dairy drinks and yogurts. Local consumption per capita is about 197 liters per person. Israel produces also 14 million liters of goat milk and around 10 million liters of sheep milk.
Israeli Dairy Farms and Average Production: 2009 - 2017
Israel's Dairy Product Imports (as per Four Figure HS Codes) For 2017, Israel imported the following dairy products, listed according to their four figure HS codes: Milk and Cream, Concentrated or Containing Added Sugar or Other Sweetening Matter (HS0402) Imports: 8,199 MT CIF: $23.7 million The main sources for these products were as follows: 1. Germany 53.9% 2. USA 17.9% 3. Netherlands 14.2%
17
The project is funded by the EU under the EU4Business initiative and implemented by the EBRD
Supported by;
Cheese and Curd (HS 0406) Imports 8,494 MT CIF $46.4 million The main sources for these products were as follows: 1. Poland 26.1% 2. France 17.1% 3. Netherlands 15.9%
Dairy Product Imports (as per Six Figure HS Codes) Cheese and Curd- Other Cheese (HS 040690): Imports grew from 2.259 million kg. (worth $15.96 million) in 2012 to 2017, when imports of 8.146 million kg. were worth $47 million, mostly from Poland, Netherlands and Italy. In 2016, 7.312 million kg of these products were imported, worth $39.24 million. Milk and Cream (concentrated or containing added sugar or other sweetening matter - in powder, granules or other solid forms, of a fat content, by weight, exceeding 1.5%:-not containing added sugar or other sweetening matter - worth $13.9 million, amounting to 2.92 million kgHS 040221): Imports in 2012 were ,.growing to $16.9 million for 4.13 million kg. in 2017. Product came mostly from Germany, the Netherland and Poland.
Milk and Cream (concentrated or containing added sugar or other sweetening matter- in powder, granules or other solid forms, of a fat content, by weight, not included- whey and modified whey, whether or not concentrated or containing added sugar or other sweetening matter- HS 040210) imports in 2015 were worth $11 million, amounting to 3.6 million kg. By 2017, imports were worth $12.4 million and amounted to 2.857 million kg., mostly from Germany, the US and Ukraine. Butter and Other Fats and Oils Derived from Milk; Dairy Spreads- Butter (HS 040510) imports in 2013 amounted to 1.419 million kg., worth $7.4 million, growing to 2.329 million kg. worth $11.95 million in 2017, principally from Germany, Belgium and France. Cheese & Curd-Processed Cheese, Not Grated or Powdered (HS 040630) imports in 2012 amounted to 385.4 thousand kilos, worth $2.268 million. This grew to 607,119 kg. worth $384.4 million in 2017, imported from France, Egypt and Poland. Cheese and Curd-Fresh (Unripened or Uncured) Cheese, Including Whey Cheese and Curd (HS 040610) imports in 2012 were worth $885,000 for 160,111 kg., rising to $2.473 million for 372,989 kg. in 2017, from France, the US and Denmark.
Fish Despite its once being the home of a thriving fish industry, this sector in Israel has witnessed a marked downturn in recent years. Aquaculture in Israel has been and continues to be the realm of cooperative farms (i.e. the kibbutz). Over the years the smaller fish farms have ceased operation as a result of being unable to compete and to fill fish production quotas. Small farms similar to those found in other parts of the world do not exist mainly due to the limited availability of water resources. Today, it is estimated that Israel imports 90% of its edible fish. In recent years, the leading imported species included fresh and frozen Atlantic salmon from Norway and Canada, fresh and frozen Nile perch from Kenya and Uganda, tinned sardines from Portugal and Morocco, as well as frozen mackerel, hake, herring and tilapia. Fish markets are present in the three largest Israeli cities of Tel Aviv, Jerusalem and Haifa, which handle fresh, chilled and frozen fish produced from all over the country. Harvested fish are first shipped to the regional packing houses from the individual farms and, following inspection, are transported to the main fish markets. Examination of farmed fish is carried out by the Israel's Veterinary Service both at the farms and at the packing houses, thus preventing poor quality fish and fish

18
The project is funded by the EU under the EU4Business initiative and implemented by the EBRD
Supported by;
products from reaching the consumer and enabling prompt detection of diseases. Farms affected by specific diseases are placed in quarantine. For 2017, Israel imported some $403 million worth of fish, but there was negligible import of mollusks or other seafood products. The main sources of these products were: 1. Norway 38% 2. China 15.2% Norway is a large provider of salmon, as it is located close to Israel, making shipment of chilled fresh fish quite convenient. China is also a large provider of frozen fish, as China’s advantage is relatively low prices. During 2017 there was also an upward trend of massive imports of frozen Tilapia fillets from China, which then amounted to 17,000 tons, compared with 11,000 tons in previous years. This is due to the reduction of duties.
Israeli Fish Consumption In an average month, Israelis eat 1.5 kilos of fish, about a third of that fresh – a figure that jumps 75% during the month that the Passover holiday falls. While the most popular fish during the year is amnon (tilapia), during Pesach, carp – used to make fresh gefilte fish – is most consumed. In 2017, Israelis ate 60% more fish that year than in 2016, for a total of 156,000 tons. Prices of popular fish have also been falling, as supplies from fish farms and imports increase. Tilapia, for example, sells for an average NIS 26.6 a kilo today, compared to NIS 37 in 2015. With that, Israelis are slightly behind other Mediterranean countries in their fish consumption; they eat about 18 kg. a year, while the average for other Mediterranean countries is over 20 kg., according to OECD figures.
Poultry Israelis are the fourth largest consumers of chicken per capita and the biggest consumers of turkey per capita of any country, according to the U.N. Food and Agriculture Organization. In 2016, the poultry production (for broilers) quota system was eliminated. With no mandated quota, production surpluses, too high to be absorbed by the local market, were expected, though none have been seen thus far. Growers are attempting to put in place an internal quota control to avoid excess production. The quota system, which began in 1997, increased broiler production by 113% in 2014. Poultry production in 2018 now totals 615,000 MT, down 1% compared to 2017 due to low market prices. As for now, the Israeli market is self-sufficient in chicken, supplying all of its needs domestically. Turkey is very common in Israeli cuisine, but not usually whole birds. Most turkey produced is consumed by the local processing industry. The total production of turkey in 2017 was 85,000 MT, 5,000 MT less than in 2016. Total production for 2018 was about 94,000 MT, up some 9,000 MT compared to 2017. Pundits feel consumption is stabilizing at this amount for the near future. Israel does not import any turkey products. Schnitzel, both fresh and frozen, is usually made from turkey meat, as is the popular shawarma meat. It is important to also note that there is another aspect to consider. The industry is also served by many small slaughterhouses, employing many skilled kosher slaughters. The influx of imported chicken would put this industry at risk, engendering a major political and economic concern.

19
The project is funded by the EU under the EU4Business initiative and implemented by the EBRD
Supported by;
Eggs
The Ministry of Agriculture and Rural Development controls table egg production through a production quota system, where farmers can only produce a certain amount of eggs to avoid deflating prices. There is little incentive or interest in changing the existing system. During holiday periods (the Jewish New Year of Rosh Hashanah, Sukkot and Passover), when Israeli egg consumption has a spike, the Ministry of Agriculture sometimes allows the import of eggs to meet local demand, while keeping domestic egg production stable. For example, in July 2017 (before the Israeli Veterinary Services intervened following the EU SPS egg contamination issue) the Ministry announced it would allow the importation of 30 million eggs during the fall Jewish holiday season. They expected to import eggs from Italy, Spain, and Portugal. During the Passover holidays earlier that year, the Ministry allowed for the importation of 100 million eggs. The move angered Israel’s 3,000 poultry growers, who accused the Ministry of allowing too many eggs into the country and poaching their profits. In recent years. Israel's table egg production hovered around some two billion eggs.
Beef Local Israeli beef production in 2018 totaled 80,000 MT, up 10% compared to 2017, while beef imports from all sources in that same year amounted to 125,000 MT. Israel is increasingly dependent on imported feeder cattle, as well as on chilled or frozen beef as beef demand rises. With the resource constraints and high dependence on imported inputs, locally produced beef is now more expensive than imported product. It is felt that there will be an increase in both chilled and frozen beef imports, with a concomitant decrease in imported feeder cattle. The demand for beef in Israel is increasing. Today Israelis eat some 16 kilograms on average per person – with about 40% of that produced in Israel and the rest imported. Beef consumption jumps about 30% during the Passover holiday season. Among OECD countries, the average beef consumption each year is 15 kg.
A Note About Pork Due to religious restrictions on pork consumption by the Jewish and Muslim population, local pork production is relatively small. Production levels have remained unchanged since 1997, totaling about 14,000 metric tons. The Israeli Kosher Law prohibits imports of non-kosher meats, but does permit domestic pork production.
Honey Israel's honey market is even more complicated than the poultry market. Concerning the Israeli apiary industry, there are today some 100,000 hives are scattered throughout the country and about 500 beekeepers are engaged in the industry. About 60,000 beehives are placed in agricultural crops for the purpose of pollination. The honey bee in Israel is an Italian species (A.meliifera ligustica). They produce about 35 kg. of honey per hive per year, which is harvested mostly harvested between May to August. Israel consumes 3,600 tons of honey annually. However, with regular frequency, the local industry cannot meet the local demand that peaks before the Jewish New Year and High Holy Days. Honey marketed during this period is valued at about approximately
20
The project is funded by the EU under the EU4Business initiative and implemented by the EBRD
Supported by;
NIS 50 million and constitutes about 40% of Israeli annual consumption of the substance. During the Jewish month of Tishrei (which begins with the Jewish New Year), the average Israeli consumes about 200 grams of honey. Indeed, 40% of the honey consumed in Israel every year is consumed during the High Holidays, when it is customary to eat honey and give it as a gift. As a result, the government usually issues an allowance to import honey exempted from customs payments. For example, in September 2017, Finance Minister Kahlon signed an order to import 560 tons of honey from around the world, aimed at preventing a shortage of honey ahead of the Jewish New Year. It remained in force until the end of 2017. The legislation covered two separate imports of honey. The first one included 400 tons of honey in packages of up to 50 kilograms that are intended for various industries. Standard tax for large packages is NIS 10.60 per kilogram, up to a limit of 255% of the package's value. The second import included 160 tons of honey shipped in packages of up to 1.5 kilograms (3.3 pounds) each. Standard tax on such packages is NIS 16.33 per kilo, up to a limit of 55% of the package's worth. The order exempted both types of packages from the relevant taxes. Yad Mordechai controls more than 50% of the honey market. The company is owned by the Kibbutz Yad Mordechai and Strauss Group. Emek-Hefer Apiary, established in 1981 in northern Israel, is the second-largest honey company in Israel, marketing honey from a number of apiaries across the country. The third-largest is the Ein Harod Apiary, established 80 years ago on Kibbutz Ein Harod in northern Israel. In many cases, domestic apiaries have also imported honey to augment their production for export!
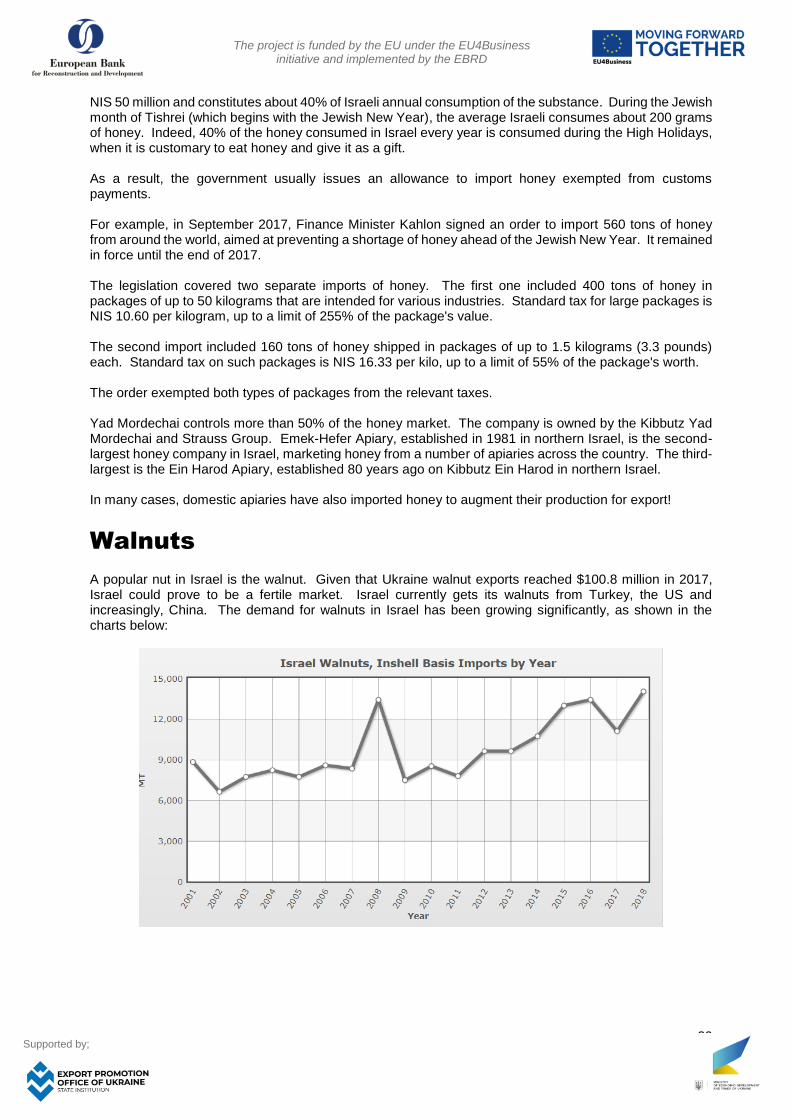
Walnuts A popular nut in Israel is the walnut. Given that Ukraine walnut exports reached $100.8 million in 2017, Israel could prove to be a fertile market. Israel currently gets its walnuts from Turkey, the US and increasingly, China. The demand for walnuts in Israel has been growing significantly, as shown in the charts below:

21
The project is funded by the EU under the EU4Business initiative and implemented by the EBRD
Supported by;
Annual Growth and value of Israeli Walnut Imports from All Sources
Market Year Imports
(Metric Tons) Growth Rate
2006 8,600 11.69 %
2010 8,500 13.33 %
2014 10,700 11.46 %
2015 13,000 21.50 %
2016 13,400 3.08 %
2017 11,100 -17.16 %
2018 14,000 26.13 %
Other popular nuts in Israel include Brazil nuts, cashews, pecans and pistachios. The most recent statistics for other nuts, fresh or dried, whether or not shelled or peeled (Excluding Coconuts, Brazil Nuts and Cashew Nuts - HS0802) amounting toimportsrecorded 17,314 MT, worth CIF $132 million. The products originated mostly from the USA (72.3%), followed by Turkey (11.3%).
Grains and Feeds While Israel is almost self-sufficient in milk, poultry, and certain fruits and vegetables, it remains highly dependent on imports of many grain and feed products. Israel imported 4.922 million metric tons (MMT) of grain and feed in 2017/18. Imports increased to 5.396 MMT in MY 2017/18.
Animal Feeds Israel groups animal feeds into ten categories, each of which maintains a distinct certificate requirement. Exporters of these products should be aware of the group that includes their specific product and the certificate requirements for that group of products. Eight feed millers control about 90% of Israel's feed milling industry. The largest feed miller controls 22% of the market, and plans to increase production by 12%. There some 150 feed centers in Israel. These are communal feed mills operated by local farming communities (i.e. kibbutzim), and sell their feed mix to the cattle industry. Fifteen of these are large feed centers servicing the largest cattle producers. Beef production in Israel is relatively expensive due to the climate, water scarcity, and limited land availability. It is estimated that the total market for the Israeli feed milling industry (feed millers and feed centers) is about 4 million MT (excluding hay and silage). Their typical formulation is composed of grains, oilseed meals (i.e., soy, sunflower, and canola), and other feed sources such as DDGS and corn gluten feed. Israeli feed mills export about 15% of their production to Jordan and the Palestinian Authority.
Wheat & Bakery Products Israel’s imports of wheat in the marketing year 2019/20 (July - June) are forecast to reach some 1.7 million metric tons (MMT), up 5.5% or increasing by 90,000 MT compared to the MY 2018/19 figure. Wheat Production Israel’s wheat production in marketing year (MY) 2019/20 (July-June) to reach 75,000 metric tons (MT), up 7% compared to 70,000 MT in marketing year 2018/19. Israeli wheat production is dependent on rainfall. The production drop in MY 2018/19 was to low precipitation during a shorter than normal winter combined with political protests. Palestinian terrorists burnt some 400 hectares of wheat fields along the Gaza Strip border. Roughly 70% of Israel’s wheat production occurs in the southern part of the country. The northern and central areas account for the balance of production. Rainfall in the southern areas of the country averages 450 millimeters (mm) per annum; the northern regions receive some 500-550 mm of rain yearly. The rainy

22
The project is funded by the EU under the EU4Business initiative and implemented by the EBRD
Supported by;
season runs from October to April. The average rainfall in MY 2018/19 was only 76% of its normal average in the southern growing areas and 80% in the northern growing areas. Precipitation and soil moisture distribution are currently 20% above the annual averages in the northern and central parts of the country, but 35% lower than the annual averages in the south. Lower rainfall in the south, combined with farmers’ intentions to harvest wheat green for silage along the Gaza Strip will affect total production in marketing year 2019/20. Farmers plant some 100,000 hectares with wheat usually, but only harvest 70% actually for milling; the remainder goes to fodder for livestock. In 2019, it is anticipated that there will be a harvest of only 60% of the wheat crop for milling, with 40% going to livestock feed. Wheat Consumption Pundits forecast Israel’s wheat consumption in MY 2019/20 to reach 1.75 million metric tons (MMT), up slightly over 2% or some 39,000 MT above earlier estimates. There is a growing consumer preference to switch away from white wheat flour to alternative substitutes; Israelis are shifting to rice, spelt, teff and rye flours. However, modest increases in wheat consumption are expected to continue in the future. The Israeli feed milling industry shifts easily from corn, barley and sorghum to feed wheat and back based on prevailing prices. Feed mills however do not entirely substitute one grain in their mix for another grain, regardless of the price relationship. Despite the increase in the price of feed wheat in 2018, feed mills continued utilizing significant quantities of it in their feed formulations despite the availability of lower cost corn and barley. Most mills use a computerized system to assist with substitution decisions in rations. The systems produce a best-value product considering the costs and benefits of available inputs (i.e. protein, carbohydrates, fat and price). Israeli feed mills produce hundreds of different feed formulas for different usages and for the different growth stages of the animals; each formula has a slightly different feed ratio. In 2018/19, Israel imported some 755,000 of feed wheat, mainly from the nearby Black Sea region (Russia and Ukraine). Israel has not imported any feed wheat from the U.S. since 2010 until today.
Israel’s Wheat Production (TMT) and Annual Percent Change Season Total
Production Annual Percent
Change 2007/08 145 10 2008/09 60 -59 2009/10 100 67 2010/11 100 0 2011/12 100 0 2012/13 165 65 2013/14 130 -21 2014/15 90 -31 2015/16 155 72 2016/17 142 -8 2017/18 50 -65 2018/19 110 (f) 120
Wheat Imports For 2018/19, it is forecast that Israel's total wheat imports will stand at 1.7 MMT an increase of 49,000 MT, or 3% from 2017/18. The increase is expected to be primarily in feed wheat, which might substitute for some corn imports due to price pressure. As forecasted in 2017, some feed wheat imports were displaced by corn imports due to corn’s competitive pricing. In spite of price pressures, the substitution is expected to be nominal due to the advanced feed ration systems discussed above. Most feed wheat is imported from Ukraine.

23
The project is funded by the EU under the EU4Business initiative and implemented by the EBRD
Supported by;
Milling Wheat - Flour Israel imports wheat for milling from Russia, the United States, Hungary, Germany, Canada and Romania. Most of these imports are hard red winter wheat. There are 19 flour mills in Israel, with a total milling capacity of 1.3 million tons. In addition to milling wheat, there are also imports of packaged flour, mainly from Ukraine and Russia. Annual non-feed wheat consumption in Israel is steady at about 1 million metric tons. Israel is also shipping some milled wheat to the Palestinian Authority (PA) due to the latter’s insufficient milling capacity and high demand. Israel’s imports of milling wheat in 2019/20 is forecast at 875,000 metric tons. Despite an annual population growth of 2%, consumption remains stable due to the consumer consumption trend towards reduced white flour usage. Israelis are increasing the consumption of white wheat flour alternatives, considered as being healthier than regular flour. Israelis are reportedly decreasing their consumption of white bread, replacing it with breads baked from rice, spelt, teff and rye flours. There is also a growing trend to consume increasing numbers of gluten-free products. The local production of milling wheat covers a maximum of 15% of annual consumption.
Barley It is forecast that Israel’s barley production in 2019/20 (October-September) at about 15,000 MT from a harvested area of around 5,000 hectares. Estimates say the area planted with barley is actually 6,700 hectares, but 1,700 hectares are going to silage. The other 5,000 hectares is for grain production. Most barley production is located in the south of Israel; the rest of the production is in the Beit-Sh’ean Valley in the east of the country. Production is about 3 MT/hectare for grains and around 8.5 MT/hectare when cultivated for silage. 2018/19 saw some 2,700 hectares harvested for silage due to field fires set by Palestinian terrorists near the Gaza Strip. Israel’s barley consumption in MY 2019/20 at 365,000 metric tons, up nearly 3% or some 10,000 MT higher compared to the MY 2018/19 estimates. Following feed wheat and corn, barley is the third most utilized feed grain in Israel. It is anticipated that annual consumption will range 250,000 to 500,000 MT over the course of the next few years. Barley’s main use in Israel is for sheep feed. Most feed mills will swap out feed wheat for barley depending of prices.
Barley Imports Israel’s imports of barley in 2019/20 are forecast at around 355,000 MT, up almost 5% or some 16,000 MT more compared to the MY 2018/19 estimate. Most of Israel’s barley imports originate in Ukraine, taking advantage of shipping proximity and lower prices. Barley and other grains are necessary in feed rations, due to the presence of xanthophyll 1, a pigment in corn that turns the broiler meat yellow. Poultry producers and feed millers use higher amounts of barley, sorghum or even feed wheat to mitigate for the strong yellow pigment in chicken meat. Israeli consumers tend to associate a yellow color in poultry to poor animal health and obesity. In recent years, annual barley imports have varied between 190,000 MT and 550,000 MT, and will stay at these levels in the coming years.
Juices Israel's consumption of juice is declining in volume terms, owing to consumers’ shift to water, in an attempt to avoid high-sugar beverages. However, value growth was positive in 2018, thanks to the strong premium trends in this category, driven by several factors. The premium trend has promoted growth in the 100% juice category, which grew last year and is expected to continue to do so. 100% juice is often preferred by consumers as it is less processed and fruitier, and they are willing to pay more for a fresher, more natural product.
24
The project is funded by the EU under the EU4Business initiative and implemented by the EBRD
Supported by;
One trend is the shift to higher priced brands at the expense of low-cost ones. For example, local firms Prigat, Primore, Priniv and Jumex have all either gained or maintained their share, thanks to their high fruit content, while the more sugary Spring, Tapuzina and Cristal brands have seen their sales decline. Fruit Water, when launched by Jafora-Tabori in 2015, was a great success. It was targeted mostly at young consumers, and the company continues advertising the beverage every year with notable promotional campaigns. Prigat has also run campaigns for Prigat Extra, launched in 2017. Although the juice is not 100%, it consists of over 90% fruit and is positioned as a premium beverage, challenging the brand Jumex, which also offers premium juices.
Israeli Juice Imports In 2018, fruit juice (including grape must) and vegetable juices, unfermented and not containing added spirit, whether or not containing added sugar or other sweetening matter - HS 2009 )i mports amounted to 34,542 MT, worth CIF $64.9 million. In terms of market share in this category, sources ranked: 1. Brazil 16.1% 2. South Africa 8% 3. USA 9.5% There is also a sizeable presence of various fruit juices of all types from the former Soviet Union and Eastern Europe, including from Russia and Ukraine.
Edible Oils The trend for healthier nutrition trend seen in the juice market is also being felt in the edible oil market. Israeli consumers have been hearing about the negative health effect of a high fat diet and this trend is impacting edible oils in two ways. First, there has been a continuous volume decline; with consumers refraining from frying and cooking dishes with large amounts of oil. Second, it has also lead to a switch in the kinds of oils people are buying. Products such as soy, palm and corn oil have a highly negative image, with sales declining in these areas for many years, with a commensurate rise in olive oil or other healthier substitutes. The Israeli company Shemen Industries is the leading local producer of edible oils. Its Trade Division is responsible for the import of oilseeds and for the selling of the factories’ product to the food and feed industries. This Division supplies the Israeli food industry with quality bulk oils, and the feed industry with meal and other animal feed ingredients. Shemen Industries' Trade Division imports oil-seeds, grains and animal feed products in bulk over 300,000 tons per year, and together with a strategic partner in the eastern Mediterranean, as much as 700,000 tons a year. They purchase oil-seeds, vegetable oils and animal feed products globally, from such sources as the US, Brazil, Argentina and Paraguay, Western Europe, Russia, Ukraine and other Black Sea countries. The goods are purchased under strict contract terms and under FOSFA and GAFTA rules and vessels are chartered under common charter-party rules. The Strauss Group ranks second in the Israeli edible oil field, followed by such companies as Halutza, Israbar and others.

25
The project is funded by the EU under the EU4Business initiative and implemented by the EBRD
Supported by;
Soybean Oil
The latest statistics available from the United Nations Statistical Office show that between 2015 and 2016, demand fell by 34.45%. This follows on the previous year's 49.5% decline in soybean oil demand. Indeed, Israel has seen a cumulative drop of 33.1% in soybean oil imports in the period 2000 to 2016.

26
The project is funded by the EU under the EU4Business initiative and implemented by the EBRD
Supported by;
TRADE EXHIBITIONS As Israel is known worldwide for its innovation and success in the fields of agriculture, irrigation, etc., its trade events are wisely attended by many international visitors from around the world. The events are prime venues to not only become familiar with the local industry and players, it is also an opportunity to interact with a myriad of international agriculturalists, relevant government officials and others active in the field. The major event in the sector is Agritech, which generally takes place every 3 years. The exhibition and conference focus on agricultural technologies, innovations and food processing. In recent years, although most of the exhibitors tend to be Israeli companies, more than foreign 100 delegations and tens of thousands of visitors have participated in the event. Though information about the next event has yet to be posted, additional information about past events is available at the following links: https://www.linkedin.com/showcase/agritech-israel/
https://www.facebook.com/AgritechInIsrael/ http://www.israelagri.com/?CategoryID=449&ArticleID=601
A smaller event held in Israel is AgroMashov, which concentrates on commercial agriculture, including fresh produce and agricultural equipment. Some of the international brands who have exhibited include: John Deere, Bayer, HCR Seeds, De Ruiter Seeds, Messy Ferguson Tractors, New Holland, Case, Pure Line Seeds, Kaneko Seeds, Takada Seeds, Monsanto, Zata Seeds, KEKKILA, Agresco, Carmel, Jaffo, Origin Seeds, and others. Information about the AgroMashov event is available at this link: http://agro.mashovgroup.net/en/
Recommendations and Conclusion Taking into consideration the Israeli penchant for new and different food types, tempered by health considerations and price, the Israeli market holds promise for Ukrainian agricultural and food manufacturers. Quality kosher certification is an imperative for all items, a standard important not only for the Jewish consumers.