Embed Size (px)
Citation preview

Traffic and Transport Expert Evidence
Roxburgh Park Development CG130171
Prepared for Prestige Properties Pty Ltd
4 April 2013
Traffic and Transport Expert Evidence
Roxburgh Park Development CG130171

Traffic and Transport Expert Evidence Roxburgh Park Development
4 April 2013 Cardno ii
Document Information
Prepared for Prestige Properties Pty Ltd
Project Name Roxburgh Park Development
File Reference CG130171REP001 F01.docx
Job Reference CG130171
Date 4 April 2013
Contact Information
Cardno Victoria Pty Ltd
Trading as Cardno
ABN 47 106 610 913
150 Oxford Street, Collingwood
Victoria 3066 Australia
Telephone: (03) 8415 7777
Facsimile: (03) 8415 7788
International: +61 3 8415 7777
www.cardno.com
Document Control
Version Date Author Author Initials
Reviewer Reviewer Initials
F01 4/04/13 Aaron Walley
Peter Malley
© Cardno. Copyright in the whole and every part of this document belongs to Cardno and may not be used, sold, transferred, copied or reproduced in whole or in part in any manner or form or in or on any media to any person other than by agreement with Cardno.
This document is produced by Cardno solely for the benefit and use by the client in accordance with the terms of the engagement. Cardno does not and shall not assume any responsibility or liability whatsoever to any third party arising out of any use or reliance by any third party on the content of this document.

Traffic and Transport Expert Evidence Roxburgh Park Development
4 April 2013 Cardno iii
Table of Contents
1 Expert Evidence Statement 1
2 Introduction 3
2.1 General 3
3 Background and History 4
3.1 General 4
3.2 A Plan for Melbourne’s Growth Areas 5
3.3 Delivering Melbourne's Newest Sustainable Communities 5
3.4 Aitken Boulevard (E14) 5
4 Background and Existing Conditions 7
4.1 Location and Land Use 7
4.2 Planning Zones 8
4.3 Road Network 9
4.3.1 Bridgewater Road 9
4.3.2 Donald Cameron Drive 10
4.3.3 James Mirams Drive 11
4.3.4 Kennedy Parade 12
4.3.5 Truscott Avenue 13
4.4 Traffic Volumes 14
4.5 Existing Intersection Analysis 17
4.6 Public Transport 19
4.6.2 Bicycle Network 20
5 Proposal 21
5.1 General 21
5.2 Access 22
6 Road Network Implications 23
6.1 RPLSP 1998 23
6.2 Daily Traffic Generation 23
6.3 Road Network Adequacy 23
7 Intersection Access Operations 24
7.1 Site Access 24
7.2 Traffic Generation 24
7.2.1 Residential Dwellings 24
7.2.2 Neighbourhood Centre 24
7.2.3 Mixed Use 25
7.3 Generated Traffic Volumes 26
7.4 Traffic Distribution 26
7.5 Intersection Analysis 31
7.6 Access Operation 33
8 Summary & Conclusions 35
Appendices
Appendix A Ashton Traffic Modelling of Aitken Boulevard

Traffic and Transport Expert Evidence Roxburgh Park Development
4 April 2013 Cardno iv
Tables
Table 4-1 Existing Daily Traffic Volumes 14
Table 4-2 Rating of Degrees of Saturation 17
Table 4-3 SIDRA Intersection Analysis Summary – Bridgewater Road/James Mirams Drive 17
Table 4-4 SIDRA Intersection Analysis Summary –James Mirams Drive/Truscott Avenue 17
Table 4-5 SIDRA Intersection Analysis Summary – Kennedy Parade/Donald Cameron Drive 18
Table 4-6 SIDRA Intersection Analysis Summary – Donald Cameron Drive/Bridgewater Road 18
Table 4-7 Public Transport Provision 19
Table 5-1 Proposed Access Summary 22
Table 6-1 Comparison of 1998 RPLSP Traffic Generation with 2013 Proposal 23
Table 7-1 Residential Peak Hour Traffic Generation 24
Table 7-2 Retail Peak Hour Traffic Generation 25
Table 7-3 Commercial/Office Peak Hour Traffic Generation 25
Table 7-4 Peak Hour Traffic Generation – Vehicle Trips Per Hour 26
Table 7-5 Post Development SIDRA Analysis Summary – Bridgewater Road/James Mirams Drive 31
Table 7-6 Post Development SIDRA Analysis Summary –James Mirams Drive/Truscott Avenue 31
Table 7-7 Post Development SIDRA Analysis Summary – Kennedy Parade/Donald Cameron Drive 31
Table 7-8 Post Development SIDRA Analysis Summary – Donald Cameron Drive/Bridgewater Road 32
Table 7-9 Bridgewater Road Access SIDRA Analysis Summary 34

Traffic and Transport Expert Evidence Roxburgh Park Development
4 April 2013 Cardno v
Figures
Figure 3-1 Roxburgh Park Local Structure Plan 4
Figure 3-2 Aitken Boulevard Alignment 6
Figure 4-1 Site Location 7
Figure 4-2 Planning Scheme Zones 8
Figure 4-3 Bridgewater Road, looking east towards the intersection with Donald Cameron Drive 9
Figure 4-4 Bridgewater Road, looking west from the intersection with Donald Cameron Drive 9
Figure 4-5 Donald Cameron Drive, looking north towards the intersection with Bridgewater Drive 10
Figure 4-6 Donald Cameron Drive, looking south to Kennedy Parade 10
Figure 4-7 James Mirams Drive, looking east towards the intersection with Bridgewater Drive 11
Figure 4-8 James Mirams Drive, looking west from the intersection with Bridgewater Drive 11
Figure 4-9 Kennedy Parade, looking west towards the intersection with Truscott Avenue 12
Figure 4-10 Kennedy Parade, looking east towards the intersection with Donald Cameron Drive 12
Figure 4-11 Truscott Avenue, looking north towards the intersection with James Mirams Drive 13
Figure 4-12 Truscott Avenue, looking south from the intersection with James Mirams Drive 13
Figure 4-13 AM Peak Hour Volumes Thursday 21 March 2013 15
Figure 4-14 PM peak Hour Volumes Thursday 21 March 2013 16
Figure 4-15 Existing Public Transport Services 19
Figure 4-16 Principal Bicycle Network 20
Figure 5-1 Amendment C156 Proposed Rezoning 21
Figure 5-2 Schedule 28 of the Development Plan Overlay Figure 1 22
Figure 7-1 Development Generated AM Peak Hour Volumes 27
Figure 7-2 Development Generated PM Peak Hour Volumes 28
Figure 7-3 Post Development AM Peak Hour Volumes 29
Figure 7-4 Post Development PM Peak Hour Volumes 30
Figure 7-5 Bridgewater Road Fully Directional Access Concept Configuration 33

Traffic and Transport Expert Evidence Roxburgh Park Development
4 April 2013 Cardno 1
1 Expert Evidence Statement
The date of the report 4 April 2013
The address of that property and the date(s) of any inspection
175 Donald Cameron Drive, Roxburgh Park
Site visit undertaken on Friday 22 & Sunday 24 March 2013
The party for whom the report has been prepared
This report has been prepared at the request of ARG Planning on behalf of Prestige Properties Pty Ltd
The person from whom the expert received his/her instructions
Mr Andrew Gray, ARG Planning
In accordance with the Guide to Expert Evidence, my qualifications and expertise to undertake this work are
summarised below:-
Name:
Aaron Jacob Walley
Address:
Cardno
150 Oxford Street
Collingwood Vic 3066
Professional Qualifications:
Bachelor of Engineering (Civil), 2001, RMIT University
Professional Experience:
Engineer - Grogan Richards Pty Ltd 2002 – 2005
Project Engineer - Cardno Victoria 2006 – 2008
Senior Engineer – Cardno Victoria 2008 – 2011
Associate – Cardno Victoria 2011 – Present
Areas of Expertise: > Car parking and traffic.
> Traffic advice and assessment of land uses and development proposals to planning authorities,
government agencies, corporations and developers (including residential, retail, commercial, industrial,
institutional and mixed use projects).
Expertise to Prepare this Report:
My training and experience including involvement with all forms of development over a number of years
qualifies me to comment on the traffic implications of the proposal.
Instructions which Defined the Scope of this Report:
I have been requested by Prestige Properties Pty Ltd to express my expert opinion as to the traffic
implications of the proposed development on the surrounding road network.

Traffic and Transport Expert Evidence Roxburgh Park Development
4 April 2013 Cardno 2
Facts, Matters and Assumptions Relied Upon: > Exhibited documentation of the C156 Amendment;
> Hume Planning Scheme;
> Third party submissions;
> Ashton Traffic Pty Ltd Traffic Modelling for Hume Corridor, September 2009; and
> NSW RTA Guide to Traffic Generating Developments - V2.2a.
Identity of Persons Undertaking the Work:
Aaron Walley of Cardno assisted by Peter Malley.
I have made all the inquiries that I believe are desirable and appropriate, and no matters of significance,
which I regard as relevant, have to my knowledge been withheld from the Tribunal.
Aaron Walley
Associate
for Cardno

Traffic and Transport Expert Evidence Roxburgh Park Development
4 April 2013 Cardno 3
2 Introduction
2.1 General
Cardno was retained by Prestige Properties Pty Ltd to prepare traffic and transport expert evidence of the
proposed Hume Planning Scheme Amendment C156 generally comprising a residential subdivision of land
bound by Bridgewater Road, James Mirams Drive, Donald Cameron Drive and Kennedy Parade, Roxburgh
Park.
The following report assesses the broad road network impacts of the proposed rezoning as well as the
operation of proposed access points to the external road network. It is envisaged that the internal road
network would be assessed as part of a detailed permit application.
In the course of preparing this assessment, the subject site and its environs have been inspected, plans of
the development examined and relevant traffic and parking data collected and analysed.

Traffic and Transport Expert Evidence Roxburgh Park Development
4 April 2013 Cardno 4
3 Background and History
3.1 General
The subject site, and Roxburgh Park in the wider sense, has been considered in various iterations of the
Roxburgh Park Local Structure Plan (RPLSP), the latest of which was dated October 1998.
These RPLSPs defined the subject site as the Roxburgh Park Town Centre with the surrounding area
generally being of a residential nature.
Within the 1998 RPLSP, it was envisaged that the Roxburgh Town Centre would comprise between
4,000sqm and 5,000sqm of retail floor space inclusive of a large format supermarket and supporting
specialty retail stores. A portion of the site, roughly one half, was also earmarked as mixed use allowing for
medium density housing or community related uses.
The proposed zoning of the subject site land uses was defined in the RPLSP as a mix of Town Centre (retail)
and Mixed Use (Medium Density Housing/Commercial/Community) as shown in Figure 3-1.
Figure 3-1 Roxburgh Park Local Structure Plan
The RPLSP also considered the development of a Sub-Regional shopping centre to the south of the site on
Somerton Road comprising of approximately 19,000sqm of retail uses which has subsequently been
developed as the Roxburgh Park shopping centre. Roxburgh Park shopping centre is currently undergoing
expansion/upgrade works and has approval to ultimately provide up to approximately 30,000sqm of retail
floor area.
The RPLSP 1998 discussed the surrounding road network inclusive of the proposed E14 (Aitken Boulevard)
link connecting from Somerton Road in the south to Craigieburn Road in the north. The intent of the E14 link
as stated in the RPLSP was the “Reduction of potential through traffic in Roxburgh Park…” and an alignment
that would encourage “…through traffic on the proposed E14 to continue on that route rather than using
arterials planned to serve Roxburgh Park traffic.”
SUBJECT SITE

Traffic and Transport Expert Evidence Roxburgh Park Development
4 April 2013 Cardno 5
3.2 A Plan for Melbourne’s Growth Areas
A Plan for Melbourne’s Growth Areas was released in 2005 and set out a strategic approach for
development in Melbourne's growth areas including the City of Hume. This plan included amending the
Urban Growth Boundary to provide sufficient land to accommodate a further 35,000 residents or up to
21,000 households.
The plan also considered access and movement networks in the municipality to provide an improved road
and public transport network. This plan identified the E14 road (Aitken Boulevard) as a key road to
improving vehicular movement and alleviating potential congestion in the surrounding area.
3.3 Delivering Melbourne's Newest Sustainable Communities
Delivering Melbourne's Newest Sustainable Communities was a policy direction created to deliver land use,
transport and environmental initiatives. The study considered an integrated approach between proposed
land uses and transport planning so that infrastructure was delivered as new communities in the growth
areas of Melbourne are developed.
As part of Delivering Melbourne’s newest sustainable communities a review of the Urban Growth Boundary
(UGB) was undertaken. In July 2010 the UGB was amended which accommodated growth to the east and
north of Roxburgh Park, areas not previously considered as part of the RPLSP process.
3.4 Aitken Boulevard (E14)
Aitken Boulevard or the E14 Transit Route is ultimately proposed to become a 6 lane arterial road extending
from Broadmeadows in the south to Craigieburn in the north. The Aitken Boulevard corridor is located
approximately 1km west of the subject site, and locally, will be accessed via James Mirams Drive as
illustrated in Figure 3-2.

Traffic and Transport Expert Evidence Roxburgh Park Development
4 April 2013 Cardno 6
Figure 3-2 Aitken Boulevard Alignment
Aitken Boulevard as a single carriageway is currently under construction with approximately 1km of roadway
constructed north of Somerton Road. The section between James Mirams Drive and Fairways Boulevard
has recently been completed with these two sections anticipated to connect in 2014.
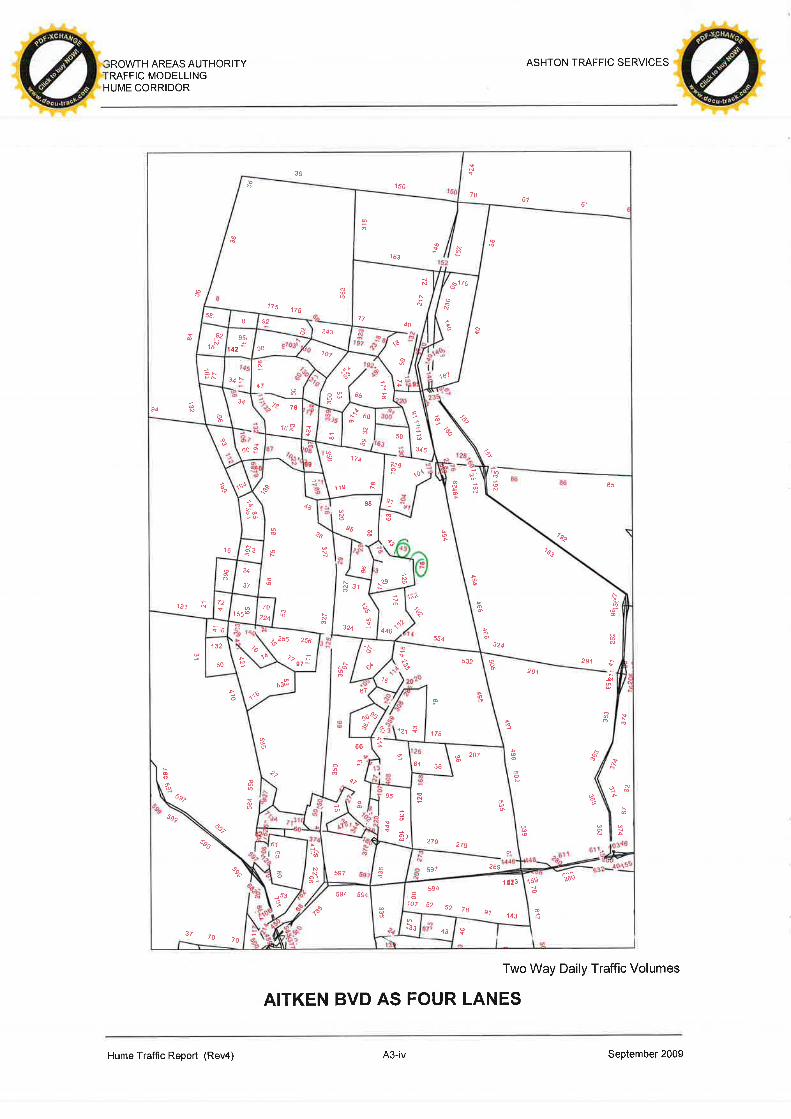
The Growth Areas Authority commissioned Ashton Traffic Pty Ltd to prepare a traffic model for the Hume
Corridor including the subject site and Aitken Boulevard in September 2009. The study considered a variety
of scenarios and alignments of Aitken Boulevard including a scenario contemplating a continuous link from
Tullamarine Airport and a scenario with Aitken Boulevard not extending south of Somerton Road.
Of the scenarios, the model with no extension of Aitken Boulevard south of Somerton Road had the highest
daily traffic volumes on the road network surrounding the subject site. This modelling indicates that under
this scenario Donald Cameron Drive and Bridgewater Road would be expected to carry 9,000 and 5,700
vehicles per day (vpd) respectively with the bulk of through traffic being carried by Aitken Boulevard.
All other models showed daily volumes of not more than 7,500vpd and 4,800vpd on Donald Cameron Drive
and Bridgewater Road respectively.
Extracts of the relevant models are provided in Appendix A.
Subject Site
Aitken
Boulevard
Traffic and Transport Expert Evidence Roxburgh Park Development
4 April 2013 Cardno 7
4 Background and Existing Conditions
4.1 Location and Land Use
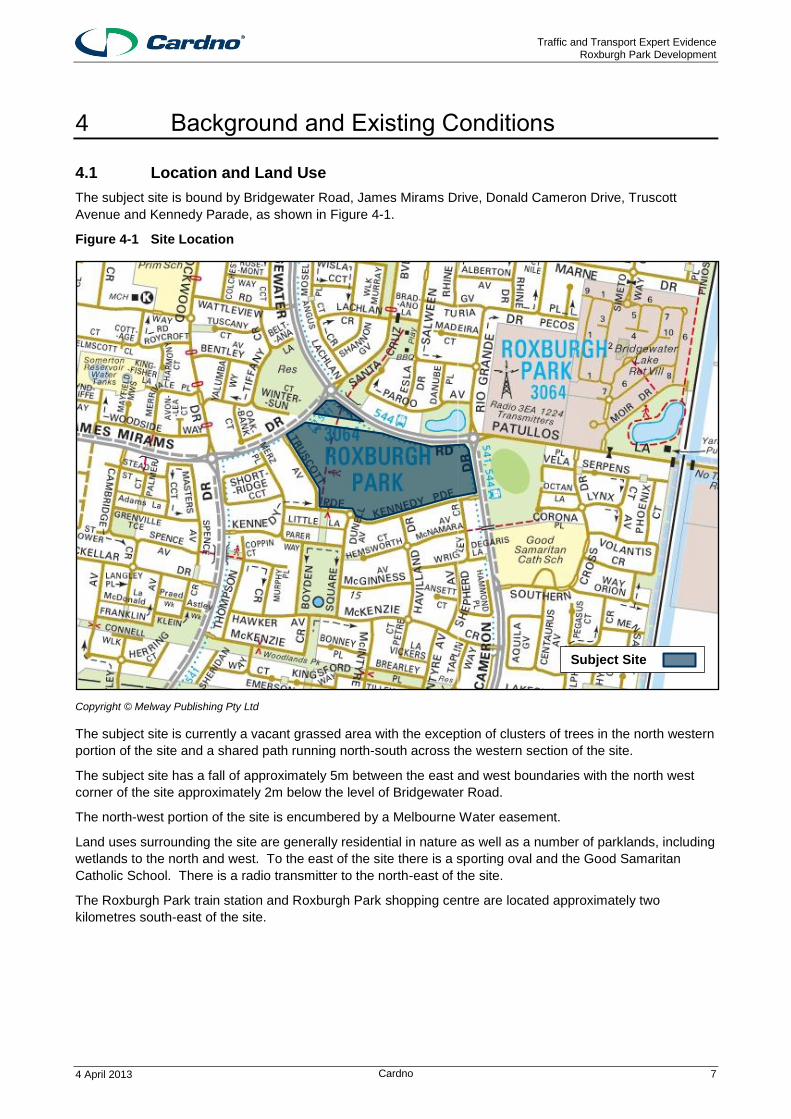
The subject site is bound by Bridgewater Road, James Mirams Drive, Donald Cameron Drive, Truscott
Avenue and Kennedy Parade, as shown in Figure 4-1.
Figure 4-1 Site Location
Copyright © Melway Publishing Pty Ltd
The subject site is currently a vacant grassed area with the exception of clusters of trees in the north western
portion of the site and a shared path running north-south across the western section of the site.
The subject site has a fall of approximately 5m between the east and west boundaries with the north west
corner of the site approximately 2m below the level of Bridgewater Road.
The north-west portion of the site is encumbered by a Melbourne Water easement.
Land uses surrounding the site are generally residential in nature as well as a number of parklands, including
wetlands to the north and west. To the east of the site there is a sporting oval and the Good Samaritan
Catholic School. There is a radio transmitter to the north-east of the site.
The Roxburgh Park train station and Roxburgh Park shopping centre are located approximately two
kilometres south-east of the site.
Subject Site
Traffic and Transport Expert Evidence Roxburgh Park Development
4 April 2013 Cardno 8
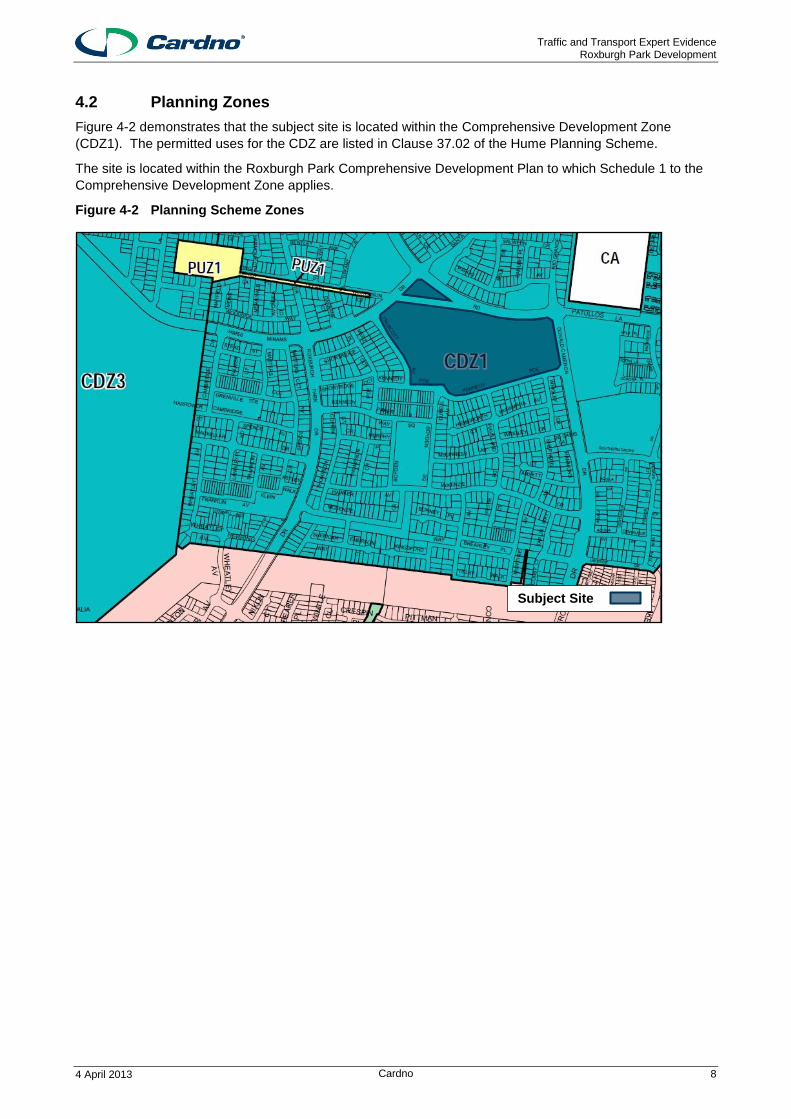
4.2 Planning Zones
Figure 4-2 demonstrates that the subject site is located within the Comprehensive Development Zone
(CDZ1). The permitted uses for the CDZ are listed in Clause 37.02 of the Hume Planning Scheme.
The site is located within the Roxburgh Park Comprehensive Development Plan to which Schedule 1 to the
Comprehensive Development Zone applies.
Figure 4-2 Planning Scheme Zones
Subject Site

Traffic and Transport Expert Evidence Roxburgh Park Development
4 April 2013 Cardno 9
4.3 Road Network
4.3.1 Bridgewater Road
Bridgewater Road extends south from Craigieburn Road to the subject site, after which it extends east until
Donald Cameron Drive where it becomes Patullos Lane.
In the vicinity of the subject site, Bridgewater Road comprises two carriageways separated by a central
median, with two trafficable lanes in either direction as illustrated in Figure 4-3 and Figure 4-4.
The intersections of Bridgewater Drive/James Mirams Drive/Santa Cruz Boulevard and Bridgewater
Drive/Donald Cameron Drive/Patullos Lane/Rio Grande Drive are both controlled by roundabouts.
At the frontage of the subject site, a speed limit of 60km/h applies.
Figure 4-3 Bridgewater Road, looking east towards the intersection with Donald Cameron Drive
Figure 4-4 Bridgewater Road, looking west from the intersection with Donald Cameron Drive

Traffic and Transport Expert Evidence Roxburgh Park Development
4 April 2013 Cardno 10
4.3.2 Donald Cameron Drive
Donald Cameron Drive is generally aligned north-south, extending from Bridgewater Drive in the north
through to Roxburgh Park Drive in the south. North of Bridgewater Drive, the road extends as Rio Grande
Drive while south of Roxburgh Park Drive, the road continues as Ravenhill Boulevard.
In the vicinity of the subject site, Donald Cameron Drive comprises two carriageways separated by a central
median, with two trafficable lanes in either direction as illustrated in Figure 4-5 and Figure 4-6.
At the frontage of the subject site, a speed limit of 60km/h applies.
Figure 4-5 Donald Cameron Drive, looking north towards the intersection with Bridgewater Drive
Figure 4-6 Donald Cameron Drive, looking south to Kennedy Parade

Traffic and Transport Expert Evidence Roxburgh Park Development
4 April 2013 Cardno 11
4.3.3 James Mirams Drive
James Mirams Drive is generally aligned east-west from Aitken Boulevard in the west through to Bridgewater
Drive in the east. Further west of Aitken Boulevard the road extends on as Lysterfield Drive while east of
Bridgewater Road the road continues as Santa Cruz Boulevard.
In the vicinity of the site, James Mirams Drive comprises a single carriageway with one lane of traffic in either
direction as illustrated in Figure 4-7 and Figure 4-8.
At the frontage of the subject site, a speed limit of 60km/h applies.
It is understood that James Mirams Drive will ultimately be duplicated forming a divided carriageway. Based
on discussions with Council officers it is understood that duplication is likely to occur within 5 to 10 years.
Figure 4-7 James Mirams Drive, looking east towards the intersection with Bridgewater Drive
Figure 4-8 James Mirams Drive, looking west from the intersection with Bridgewater Drive

Traffic and Transport Expert Evidence Roxburgh Park Development
4 April 2013 Cardno 12
4.3.4 Kennedy Parade
Kennedy Parade is a local street generally aligned east-west between Roxburgh Park Drive and Donald
Cameron Drive.
In the vicinity of the site, Kennedy Parade comprises a single carriageway which allows for two-way traffic
flow and unrestricted kerbside parking as illustrated in Figure 4-9 and Figure 4-10.
The default speed limit on Kennedy Parade is 50 km/h.
Figure 4-9 Kennedy Parade, looking west towards the intersection with Truscott Avenue
Figure 4-10 Kennedy Parade, looking east towards the intersection with Donald Cameron Drive

Traffic and Transport Expert Evidence Roxburgh Park Development
4 April 2013 Cardno 13
4.3.5 Truscott Avenue
Truscott Avenue is a local street generally aligned north-west to south-east, between James Mirams Drive
and Kennedy Parade.
In the vicinity of the site, Truscott Avenue comprises a single carriageway which allows for two-way traffic
flow as illustrated in Figure 4-11 and Figure 4-12.
The default speed limit on Truscott Avenue is 50 km/h.
Figure 4-11 Truscott Avenue, looking north towards the intersection with James Mirams Drive
Figure 4-12 Truscott Avenue, looking south from the intersection with James Mirams Drive

Traffic and Transport Expert Evidence Roxburgh Park Development
4 April 2013 Cardno 14
4.4 Traffic Volumes
Traffic volume counts were undertaken by Nationwide Traffic Surveys on behalf of Cardno Pty Ltd on
Thursday 21 March 2013 from 6.30am to 9.30am and 3pm to 7pm at the intersections of:
> Bridgewater Road/James Mirams Drive
> Bridgewater Road/Donald Cameron Drive
> Donald Cameron Drive/Kennedy Parade
> Kennedy Parade/Dunell Avenue
> Kennedy Parade/Truscott Avenue
> Truscott Avenue/James Mirams Drive
The peak hours were determined to occur between 8.15am and 9.15am in the morning and between 3pm
and 4pm in the afternoon. It is noted that the PM peak hour coincides with the typical school drop off and
pick up period. The peak hour turning movement results of the surveys are shown in Figure 4-13 and
Figure 4-14.
It is generally accepted that peak hour traffic volumes represent 10% of daily traffic volumes and therefore
based on the turning movement counts undertaken the estimated daily traffic volumes for the roadways
fronting the subject site are summarised in Table 4-1.
Table 4-1 Existing Daily Traffic Volumes
Road Peak Hour Two-way Volume1 Approximate Daily Two-way
Volume
Bridgewater Road 1,287 vehicles 12,870 vehicles per day
Donald Cameron Drive 1,434 vehicles 14,340 vehicles per day
James Mirams Drive 908 vehicles 9,080 vehicles per day
Kennedy Avenue 70 vehicles 700 vehicles per day
Truscott Avenue 88 vehicles 880 vehicles per day
1 - The highest peak two-way volume from the AM or PM periods to provide a conservative assessment
The estimated daily traffic volumes presented in Table 4-1 correlate to partial traffic volume data held by
Hume City Council which suggest that, along the subject site, Bridgewater Road carried 12,583vpd in 2011.

Traffic and Transport Expert Evidence Roxburgh Park Development
4 April 2013 Cardno 15
Figure 4-13 AM Peak Hour Volumes Thursday 21 March 2013
120 325
9 17 212
208
13 622
278
45 18
6
30 29 192
23
123
31
18 112
703
294 35
82
960 3
16 364
10
41
3
1 25
21
32
7 33 19
19 13
26 7
38
15
21 425
431 14
Donald Cameron
Drive
Patullos
Lane
Rio Grande
Drive
Bridgewater
Boulevard
Santa Cruz
Boulevard Bridgewater
Boulevard
James
Mirams Drive
Truscott
Avenue
Kennedy
Parade
Kennedy
Parade
Dunell
Avenue
North

Traffic and Transport Expert Evidence Roxburgh Park Development
4 April 2013 Cardno 16
Figure 4-14 PM peak Hour Volumes Thursday 21 March 2013
127 585
26 67
83
289
22 427
217
18 19
23
17 10 136
33
141
41
23 50
473
562 21
209
663 1
30 884
3
14
4
6 38
14
24
12 29 22
13 9
28 7
21
18
22 342
424 13
Donald Cameron
Drive
Patullos
Lane
Rio Grande
Drive
Bridgewater
Boulevard
Santa Cruz
Boulevard Bridgewater
Boulevard
James
Mirams Drive
Truscott
Avenue
Kennedy
Parade
Kennedy
Parade
Dunell
Avenue
North

Traffic and Transport Expert Evidence Roxburgh Park Development
4 April 2013 Cardno 17
4.5 Existing Intersection Analysis
The operation of the surrounding intersections was analysed using SIDRA Intersection. This computer
package, originally developed by the Australian Road Research Board, provides information about the
capacity of an intersection in terms of a range of parameters, as described below:
Degree of Saturation (D.O.S.) is the ratio of the volume of traffic observed making a particular movement
compared to the maximum capacity for that movement. Various values of degree of saturation and their
rating are shown in Table 4-2.
Table 4-2 Rating of Degrees of Saturation
D.O.S. Rating
Up to 0.6 Excellent
0.6 to 0.7 Very Good
0.7 to 0.8 Good
0.8 to 0.9 Fair
0.9 to 1.0 Poor
Above 1.0 Very Poor
The 95th Percentile (95%ile) Queue represents the maximum queue length, in metres, that can be
expected in 95% of observed queue lengths in the peak hour; and
Average Delay is the delay time, in seconds, which can be expected over all vehicles making a particular
movement in the peak hour.
The results of the SIDRA Intersection analysis for the AM and PM peak periods of the key road network
intersections are summarised in Table 4-3 to Table 4-6.
Table 4-3 SIDRA Intersection Analysis Summary – Bridgewater Road/James Mirams Drive
Time Approach Degree of Saturation
95th
%ile Queue Average Delay
AM
Pe
ak
Bridgewater Road (north) 0.37 19m 8 sec
Santa Cruz Boulevard (east) 0.12 4m 11 sec
Bridgewater Road (south) 0.20 9m 7 sec
James Mirams Drive (west) 0.23 7m 10 sec
PM
Pe
ak
Bridgewater Road (north) 0.26 12m 8 sec
Santa Cruz Boulevard (east) 0.08 2m 10 sec
Bridgewater Road (south) 0.30 14m 7 sec
James Mirams Drive (west) 0.31 10m 9 sec
Table 4-4 SIDRA Intersection Analysis Summary –James Mirams Drive/Truscott Avenue
Time Approach Degree of Saturation
95th
%ile Queue Average Delay
AM
Pe
ak James Mirams Drive (east) 0.25 0m 0 sec
Truscott Avenue (south) 0.15 4m 17 sec
James Mirams Drive (west) 0.25 18m 4 sec
PM
Pe
ak James Mirams Drive (east) 0.20 0m 0 sec
Truscott Avenue (south) 0.12 3m 18 sec
James Mirams Drive (west) 0.25 16m 3 sec

Traffic and Transport Expert Evidence Roxburgh Park Development
4 April 2013 Cardno 18
Table 4-5 SIDRA Intersection Analysis Summary – Kennedy Parade/Donald Cameron Drive
Approach Degree of Saturation
95th
%ile Queue Average Delay
AM
Pe
ak Donald Cameron Drive (north) 0.26 0m 0 sec
Donald Cameron Drive (south) 0.10 0m 0 sec
Kennedy Parade (west) 0.13 3m 26 sec
PM
Pe
ak Donald Cameron Drive (north) 0.18 0m 0m
Donald Cameron Drive (south) 0.25 0m 0 sec
Kennedy Parade (west) 0.05 1m 27 sec
Table 4-6 SIDRA Intersection Analysis Summary – Donald Cameron Drive/Bridgewater Road
Approach Degree of Saturation
95th
%ile Queue Average Delay
AM
Pe
ak
Rio Grande Drive (north) 0.39 15m 11 sec
Patullos Lane (east) 0.34 15m 14 sec
Donald Cameron Drive (south) 0.25 10m 8 sec
Bridgewater Road (west) 0.48 26m 11 sec
PM
Pe
ak
Rio Grande Drive (north) 0.21 7m 9 sec
Patullos Lane (east) 0.31 12m 11 sec
Donald Cameron Drive (south) 0.46 23m 8 sec
Bridgewater Road (west) 0.36 18m 12 sec
Review of Table 4-3 to Table 4-6 indicates that the surrounding road network generally operates under
‘excellent’ conditions.
I note that right turns out of Kennedy Parade to Donald Cameron Drive experience average delays of up to
27 seconds. These delays are associated with the staging of the right turn i.e. vehicles storing in the central
median to turn right and in my opinion are not excessive in an urban context for a local road intersecting with
a collector road.

Traffic and Transport Expert Evidence Roxburgh Park Development
4 April 2013 Cardno 19
4.6 Public Transport
The subject site is serviced by two public bus routes which operate along Bridgewater Drive at the frontage
to the site as well as a NightRider service which operates along James Mirams Drive. There are two train
stations located in proximity to the site, one to the north-east and one to the south-east.
The full public transport provision is indicated in Table 4-7.
Table 4-7 Public Transport Provision
Service Route No’s
Route Description Nearest Stop
Train Craigieburn Line Roxburgh Park Railway Station (2km)
Craigieburn Railway Station (2.7 km)
Bus 541 Roxburgh Park - Broadmeadows via Meadow Heights Frontage
544 Broadmeadows - Craigieburn via Roxburgh Park Frontage
954 NightRider Frontage
The routes of the services within Table 4-7 are shown in Figure 4-15 along with their connections to other
public transport services.
Figure 4-15 Existing Public Transport Services
Subject Site

Traffic and Transport Expert Evidence Roxburgh Park Development
4 April 2013 Cardno 20
4.6.2 Bicycle Network
Melbourne’s Principal Bicycle Network (PBN) was established in 1994 and provides maps of major bicycle
routes around Melbourne and surrounding suburbs. The PBN maps show a network of cycle routes that
provide access and connectivity between key destinations. The PBN has recently been updated in draft
form, as shown in Figure 4-16.
The draft PBN includes Bridgewater Drive north of the site and a shared path south of the site as part of the
PBN which provide excellent connection to the subject site and surrounding bicycle connections. The draft
PBN traverses the subject site connecting paths to the north and south.
Figure 4-16 Principal Bicycle Network
Subject Site

Traffic and Transport Expert Evidence Roxburgh Park Development
4 April 2013 Cardno 21
5 Proposal
5.1 General
Amendment C156 of the Hume Planning Scheme proposes to rezone the site generally as Residential 1 with
a Business 1 Zone to the north and a Mixed Use Zone to the north west as shown in Figure 5-1.
Figure 5-1 Amendment C156 Proposed Rezoning
I am advised by that this rezoning will allow for:
> Residential 1 Zone: Approximately 214 dwellings of various configurations, including terrace and
traditional housing;
> Business 1 Zone (Neighbourhood Centre): Approximately 3,000sqm of retail use (1,800sqm of
supermarket and 1,200sqm of specialty retail), 600sqm commercial/office and a community use; and
> Mixed Use Zone: Convenience petrol outlet including food and drink uses.

Traffic and Transport Expert Evidence Roxburgh Park Development
4 April 2013 Cardno 22
5.2 Access
Access to the subject site is considered in Schedule 28 of the Development Plan Overlay as summarised in
Table 5-1 and reproduced as Figure 5-2.
Table 5-1 Proposed Access Summary
Location Control
Bridgewater Road Give-way T-intersection – Left in/Left out
Kennedy Parade - west Roundabout – Fully directional
Kennedy Parade - east Give-way T-intersection – Fully directional
Truscott Avenue Give-way T-intersection – Fully directional
Figure 5-2 Schedule 28 of the Development Plan Overlay Figure 1
Further to Table 5-1 the proposed mixed use in the north west corner of the site will also have the option of
access via left in/left out to Bridgewater Road and James Mirams Drive.

Traffic and Transport Expert Evidence Roxburgh Park Development
4 April 2013 Cardno 23
6 Road Network Implications
6.1 RPLSP 1998
As previously discussed the Roxburgh Park road network was designed to accommodate the uses
contemplated within the RPLSP 1998. Under the RPLSP 1998 the subject site was proposed to comprise up
to 5,000sqm of retail use and medium density dwellings.
Under the RPLSP 1998 approximately half of the subject site was zoned for medium density dwelling.
Adopting a medium density yield of approximately 20 lots per hectare equates to a yield of approximately
110 dwellings within the RPLSP 1998 area zoned for medium density dwellings.
6.2 Daily Traffic Generation
The RTA Guide to Traffic Generating Developments provides typical daily traffic generation rates for various
land uses including retail uses. The RTA Guide to Traffic Generating Developments indicates that retail
centres of less than 10,000sqm generate traffic at a rate of 121 trips/100sqm per day.
It is generally accepted that single dwelling lots in outer urban areas generate traffic at a rate of up to
10 vehicles per day per lot.
Passing trips Case study data of a convenience petrol outlet indicates an average daily traffic volume of
1,200 vehicles per day. It is noted that the majority of traffic accessing a convenience petrol filling station is
passing trips and therefore this volume represents the number of vehicles accessing the site rather than new
vehicles on the road network.
The anticipated traffic generation associated with the RPLSP 1998 floor area is compared to the current
proposal’s traffic generation in Table 6-1.
Table 6-1 Comparison of 1998 RPLSP Traffic Generation with 2013 Proposal
Scheme Use Schedule Daily Traffic Generation Rate
Daily Generated Traffic
Total
1998 RPLSP Retail 5,000sqm 121 trips/ 100sqm
6,050vpd 7,150vpd
Residential 110 dwellings 10 trips/ dwelling 1,100vpd
2013 Rezoning Retail 3,000sqm 121 trips/ 100sqm
3,630vpd 6,970vpd
Residential 214 dwellings 10 trips/ dwelling 2,140vpd
Mixed Use - - 1,200vpd1
1 - Based on case study data of convenience petrol outlets
Review of Table 6-1 indicates that the 2013 proposal could be expected to generate daily traffic at a level
similar to that contemplated under the RPLSP 1998.
6.3 Road Network Adequacy
Given that the road network outlined in the LSP 1998 was designed to cater for the traffic generated by the
5,000sqm of retail and approximately 110 residential dwellings and that the 2013 proposal will generate
similar daily traffic volumes it is concluded that the external road network has already been designed
appropriately to accommodate development traffic and will have sufficient capacity to accommodate the
proposed uses.

Traffic and Transport Expert Evidence Roxburgh Park Development
4 April 2013 Cardno 24
7 Intersection Access Operations
7.1 Site Access
Schedule 28 of the Development Plan Overlay considers the access arrangements to the site including a left
in/left out access to Bridgewater Road.
An economic assessment of the proposed Neighbourhood Centre dated 21 June 2011 prepared by Hames
Sharley indicates that due to the railway to the east and the influence of Roxburgh Park shopping centre to
the south the anticipated retail catchment of the Neighbourhood Centre is predominantly to the north of the
site.
In my opinion the provision of a fully directional access via Bridgewater Road to the BZ1 area, to avoid
vehicles doubling back and generating unnecessary movements through the Bridgwater Road roundabouts
and to minimise external trips filtering through the proposed and existing residential areas to access the
Neighbourhood Centre, is appropriate.
Review of the Bridgewater Road cross section indicates that there is sufficient road space to accommodate
appropriately designed right turn lanes into and out of the site.
The following assessment therefore considers that the access to Bridgewater Road will be provided in the
form of an uncontrolled i.e. ‘Stop’ controlled, fully directional access.
7.2 Traffic Generation
7.2.1 Residential Dwellings
It is generally accepted that single dwelling lots in outer urban areas generate traffic at a rate of up to 10
vehicles per day per lot.
In areas of good public transport accessibility, and for multi-unit and higher density dwelling lots, lower traffic
generation rates are often observed.
For the purposes of this assessment it has conservatively been assumed that all residential lots will generate
traffic at a rate of 10 trips per dwelling per day and 1 trip per dwelling in each of the peak hours.
During the AM peak hour residential traffic distribution typically comprises 80% outbound traffic and 20%
inbound traffic whilst during the PM peak hour the distribution is typically 40% outbound and 60% inbound.
Application of these rates to the proposed 214 residential dwellings equates to the traffic generation
summarised in Table 7-1.
Table 7-1 Residential Peak Hour Traffic Generation
Peak Hour Schedule Peak Hour Generation Rate
Peak Hour Traffic Generation
Inbound Outbound Total
AM (8.15am-9.15am) 214 dwellings 1 trip/dwelling 214 trips
43 171 214
PM (3pm-4pm) 128 86 214
7.2.2 Neighbourhood Centre
Retail traffic generation is a function of the retail offering as well as the retail floor area proposed with traffic
generation rates decreasing per 100sqm as the floor area increases. Furthermore traffic generation of retail
uses is typically critical during the PM peak hour when retail traffic combines with commuter traffic. AM peak
hour traffic is typically limited to staff and minor customer activity.
Case study data of neighbourhood centres comprising a supermarket and specialty retail with a similar total
floor area has been sourced. Review of the PM peak hour traffic generation rates of Dingley Village,
Hampton Park, Meadow Heights and Wheelers Hill shopping centres equates to 14.07 trips/100sqm of floor
area. A PM peak hour traffic generation rate of 14 trips/100sqm of floor area has therefore been adopted.

Traffic and Transport Expert Evidence Roxburgh Park Development
4 April 2013 Cardno 25
During the AM peak hour retail traffic is generally limited to staff arrivals and minor customer traffic and as
such AM peak hour traffic is assumed to be generated at 2 trips/100sqm of floor area.
Peak hour traffic is generally evenly split between inbound and outbound movements, the resulting traffic
generation of the Neighbourhood Centre is summarised in Table 7-2.
Table 7-2 Retail Peak Hour Traffic Generation
Peak Hour Schedule Peak Hour Generation Rate
Peak Hour Traffic Generation
Inbound Outbound Total
AM (8.15am-9.15am) 3,000sqm
2 trips/100sqm 60 trips 30 30 60
PM (3pm-4pm) 14 trips/100sqm 420 trips 210 210 420
The Neighbourhood Centre is also proposed to contain a commercial/office component of approximately
600sqm. Traffic generation of such uses is typically a function of parking supply with 50% of the parking
supply turning over during the peak hours. Assuming that parking is provided at the statutory rates a peak
hour traffic generation rate of 1.8 trips/100sqm has been adopted. The resulting traffic generation of the
commercial/office component of the Neighbourhood Centre is summarised in Table 7-3.
Table 7-3 Commercial/Office Peak Hour Traffic Generation
Peak Hour Schedule Peak Hour Generation Rate
Peak Hour Traffic Generation
Inbound Outbound Total
AM (8.15am-9.15am) 600sqm
1.8 trips/ 100sqm
11 trips 9 2 11
PM (3pm-4pm) 2 9 11
7.2.3 Mixed Use
In assessing the likely operating conditions of the proposed convenience petrol outlet, surveys
undertaken at similar sites have been considered. Review of case study data for convenience petrol outlets
in Mount Waverley, South Morang, Bendigo and Oakleigh indicates peak hour traffic volumes vary between
103 and 192 movements. For the purposes of this assessment it has been considered that up to 200
movements will access the proposed convenience petrol outlet.
Case study data indicates that a small proportion of traffic accessing convenience petrol outlets is derived
from patrons who make a trip to the site specifically to purchase fuel with the majority of traffic typically
considered to be passing trade or local customers who purchase fuel when required. For the purposes of
this assessment it has been conservatively assumed that 65% of traffic is passing trade.
In real terms this equates to an additional 70 trips (35 inbound and 35 outbound) on the road network during
periods of peak activity with the remaining 130 trips to the site being diverted from existing passing traffic.

Traffic and Transport Expert Evidence Roxburgh Park Development
4 April 2013 Cardno 26
7.3 Generated Traffic Volumes
Considering the traffic generation rates and distributions detailed above, the expected traffic volumes
generated by the proposed development are indicated in Table 7-4.
Table 7-4 Peak Hour Traffic Generation – Vehicle Trips Per Hour
Peak Period Use Total Outbound Inbound
AM Peak Hour Residential 214 171 43
Neighbourhood Centre - Retail
60 12 48
Neighbourhood Centre – Commercial/Office
11 2 9
Mixed Use 70 35 35
Total 355 220 135
PM Peak Hour Residential 214 86 128
Neighbourhood Centre - Retail
420 210 210
Neighbourhood Centre – Commercial/Office
11 9 2
Mixed Use 70 35 35
Total 715 340 375
7.4 Traffic Distribution
The residential component of the traffic generated by the site has been distributed having regard to
prevailing traffic patterns and the surrounding land uses.
An economic assessment dated 21 June 2011 prepared by Hames Sharley indicates that due to the railway
to the east and the influence of Roxburgh Park shopping centre to the south the anticipated retail catchment
of the Neighbourhood Centre is to the north of the site. As such a higher proportion of retail traffic has been
distributed to the north via Bridgewater Road.
The proposed Mixed Use site is anticipated to draw the majority of traffic from vehicles already passing the
site and that access will be limited to left in and left out with no internal connection. As such the bulk of
traffic accessing the Mixed Use site has been distributed to Bridgewater Boulevard and to a lesser extent
James Mirams Drive.
The distribution of traffic generated by the proposal is summarised in Figure 7-1 and Figure 7-2 and
superimposed on existing volumes to create post development volumes as summarised in Figure 7-3 and
Figure 7-4.

Traffic and Transport Expert Evidence Roxburgh Park Development
4 April 2013 Cardno 27
Figure 7-1 Development Generated AM Peak Hour Volumes
Donald Cameron
Drive
Patullos
Lane
Rio Grande
Drive
Bridgewater
Boulevard
Santa Cruz
Boulevard Bridgewater
Boulevard
James
Mirams Drive
Truscott
Avenue
Kennedy
Parade
Kennedy
Parade Dunell
Avenue
North
17 82 11
0 16 0
0 39
17
0 0
5
5 0 2
2 13
0
8
7
5
13 5
5
5 2
13 13
8
41
12 0
0 0
4 0
25
0
0 34
16 8 18
13
18
92
0
60
7 6
0 22
27 0 12 0
0
13
4 4
0
0 0
0
0
0
6 4
6
1 12 22
18
92
18 17
17
17
Mixed Use Site

Traffic and Transport Expert Evidence Roxburgh Park Development
4 April 2013 Cardno 28
Figure 7-2 Development Generated PM Peak Hour Volumes
Donald Cameron
Drive
Patullos
Lane
Rio Grande
Drive
Bridgewater
Boulevard
Santa Cruz
Boulevard Bridgewater
Boulevard
James
Mirams Drive
Truscott
Avenue
Kennedy
Parade
Kennedy
Parade Dunell
Avenue
North
61 135
15 0 62
0
0 129
17
0 0
17
15 0 3
3
33
0
15 25
8
19 0
3
8 5
37 19
3
27
6 0
0 0
10 0
14
0
0 78
62 21 45
48
18
193
0
209
21 21
0 17
14 0 6 0
0
8
11 10
0
0 0
0
0 0
21 10
21
22 6 17
18
193
18 17
17
61
Mixed Use Site

Traffic and Transport Expert Evidence Roxburgh Park Development
4 April 2013 Cardno 29
Figure 7-3 Post Development AM Peak Hour Volumes
Donald Cameron
Drive
Patullos
Lane
Rio Grande
Drive
Bridgewater
Boulevard
Santa Cruz
Boulevard Bridgewater
Boulevard
James
Mirams Drive
Truscott
Avenue
Kennedy
Parade
Kennedy
Parade Dunell
Avenue
North
137 407
20 17 228
208
13 661
295
45 18
11
35 29 194136
25
136
31
26 119
708
307 40
87
965 5
29 377
18
82
45 19
19 13
30 7
63
15
21 459
447 22 18
13
483
9
840
60
7 25
0 65
27 0 64 0
0
13
11 45
3
1 25
21
32 7
6 4
6
1 12 22
18
546
18 17
17
442
Mixed Use Site

Traffic and Transport Expert Evidence Roxburgh Park Development
4 April 2013 Cardno 30
Figure 7-4 Post Development PM Peak Hour Volumes
Donald Cameron
Drive
Patullos
Lane
Rio Grande
Drive
Bridgewater
Boulevard
Santa Cruz
Boulevard Bridgewater
Boulevard
James
Mirams Drive
Truscott
Avenue
Kennedy
Parade
Kennedy
Parade Dunell
Avenue
North
188 702603
41 67 145
289
22 556
234
18 19
40
32 10 139
36
166
41
38 75
481
581 24
212
671 6
67 903
6
41
35 22
13 9
38 7
35
18
22 420
486 34 46
48
738
193
550
208
21 21
0 17
14 0 48 0
0
5
11 45
4
6 38
14
24 12
21 10
21
22 6 17
18
913
18 17
17
403
Mixed Use Site

Traffic and Transport Expert Evidence Roxburgh Park Development
4 April 2013 Cardno 31
7.5 Intersection Analysis
The key intersections of the surrounding road network have been assessed utilising the post development
volumes as summarised in Figure 7-3 and Figure 7-4.
The results of the SIDRA Intersection analysis for the AM and PM peak periods are summarised in Table 7-5
to Table 7-8.
Table 7-5 Post Development SIDRA Analysis Summary – Bridgewater Road/James Mirams Drive
Time Approach Degree of Saturation
95th
%ile Queue Average Delay
AM
Pe
ak
Bridgewater Road (north) 0.39 21m 9 sec
Santa Cruz Boulevard (east) 0.13 4m 11 sec
Bridgewater Road (south) 0.24 11m 8 sec
James Mirams Drive (west) 0.24 8m 10 sec
PM
Pe
ak
Bridgewater Road (north) 0.33 16m 8 sec
Santa Cruz Boulevard (east) 0.12 4m 10 sec
Bridgewater Road (south) 0.38 20m 7 sec
James Mirams Drive (west) 0.33 12m 10 sec
Table 7-6 Post Development SIDRA Analysis Summary –James Mirams Drive/Truscott Avenue
Time Approach Degree of Saturation
95th
%ile Queue Average Delay
AM
Pe
ak James Mirams Drive (east) 0.25 0m 0 sec
Truscott Avenue (south) 0.21 5m 16 sec
James Mirams Drive (west) 0.27 20m 4 sec
PM
Pe
ak James Mirams Drive (east) 0.24 0m 0 sec
Truscott Avenue (south) 0.18 4m 19 sec
James Mirams Drive (west) 0.31 23m 4 sec
Table 7-7 Post Development SIDRA Analysis Summary – Kennedy Parade/Donald Cameron Drive
Approach Degree of Saturation
95th
%ile Queue Average Delay
AM
Pe
ak Donald Cameron Drive (north) 0.27 0m 0 sec
Donald Cameron Drive (south) 0.11 0m 0 sec
Kennedy Parade (west) 0.28 7m 28 sec
PM
Pe
ak Donald Cameron Drive (north) 0.19 0m 0 sec
Donald Cameron Drive (south) 0.27 0m 0 sec
Kennedy Parade (west) 0.13 3m 28 sec

Traffic and Transport Expert Evidence Roxburgh Park Development
4 April 2013 Cardno 32
Table 7-8 Post Development SIDRA Analysis Summary – Donald Cameron Drive/Bridgewater Road
Approach Degree of Saturation
95th
%ile Queue Average Delay
AM
Pe
ak
Rio Grande Drive (north) 0.40 16m 12 sec
Patullos Lane (east) 0.37 17m 15 sec
Donald Cameron Drive (south) 0.25 10m 8 sec
Bridgewater Road (west) 0.48 27m 11 sec
PM
Pe
ak
Rio Grande Drive (north) 0.24 8m 9 sec
Patullos Lane (east) 0.35 15m 11 sec
Donald Cameron Drive (south) 0.49 25m 8 sec
Bridgewater Road (west) 0.37 18m 12 sec
Review of Table 7-5 to Table 7-8 indicates that the surrounding road network continues to operate under
‘excellent’ conditions.
Having regard to the operation of traffic exiting Kennedy Parade to Donald Cameron Drive it is noted that the
average delays predicted for right turn traffic increase by 1 second from existing conditions.
It is therefore my opinion that the existing road network and existing intersection configurations are adequate
to accommodate the traffic generated by the proposed rezoning.
It is further noted that, as discussed in Section 3.4, the connection of Aitken Boulevard to the west has been
modelled to show that Donald Cameron Drive and Bridgewater Road will experience a reduction in traffic
volumes as through north-south traffic is diverted.
The modelling suggests that traffic volumes will reduce to approximately 9,000vpd on Donald Cameron Drive
and 5,700vpd on Bridgewater Road being a reduction of at least 30% from existing volumes presented in
Section 4.4.
It is therefore my opinion that the above intersection analysis represents a “worst case” scenario with
intersection operations anticipated to improve with the reduction of traffic associated with the Aitken
Boulevard connection.

Traffic and Transport Expert Evidence Roxburgh Park Development
4 April 2013 Cardno 33
7.6 Access Operation
As noted in Section 7.1 my recommendation is to provide access from Bridgewater Road as a fully
directional access to the development.
Bridgewater Road comprises a divided carriageway with a central median of sufficient width to accommodate
an indented right turn lane into the site.
Having regard to right turn movements out of the site the southern leg of the intersection has been modelled
with a separate right turn lane with an effective storage length of 25m. This arrangement allows left turn
traffic to exit the site whilst right turning traffic queues.
The intersection configuration is conceptually shown in Figure 7-5.
Figure 7-5 Bridgewater Road Fully Directional Access Concept Configuration
The proposed access is in line with similar treatments in the vicinity of the subject site including the
intersections of Bridgewater Road and Wattleview Road, Donald Cameron Drive and Kennedy Parade and
the intersection of Donald Cameron Drive and Southern Cross Drive.
The proposed fully directional access from Bridgewater Road has been assessed using SIDRA Intersection
with a summary of the analysis presented in Table 7-9.

Traffic and Transport Expert Evidence Roxburgh Park Development
4 April 2013 Cardno 34
Table 7-9 Bridgewater Road Access SIDRA Analysis Summary
Approach Degree of Saturation
95th
%ile Queue Average Delay
AM
Pe
ak Bridgewater Road (east) 0.13 0m 0 sec
New Access (south) 0.14 4m 25 sec
Bridgewater Road (west) 0.23 2m 1 sec
PM
Pe
ak Bridgewater Road (east) 0.21 0m 0 sec
New Access (south) 0.44 15m 27 sec
Bridgewater Road (west) 0.38 13m 4 sec
Review of Table 7-9 indicates that the proposed access from Bridgewater Road would operate under
‘excellent’ conditions.
It is therefore my opinion that fully directional access via Bridgewater Road can be adequately provided.

Traffic and Transport Expert Evidence Roxburgh Park Development
4 April 2013 Cardno 35
8 Summary & Conclusions
Based on the foregoing it is my view that;
> It is proposed to rezone the Roxburgh Park town centre at 175 Donald Cameron Drive from a
Comprehensive Development Zone (CDZ) to Residential 1 (R1Z), Business 1 (B1Z) and Mixed Use
(MUZ) zones;
> It is understood that the site will likely contain 3,000sqm of retail, 600sqm of commercial/office, a
convenience petrol outlet and 214 dwellings;
> The site has previously been considered as part of the Roxburgh Park Local Structure Plan (RPLSP)
1998 to comprise 5,000sqm of retail uses with the remainder of the site being medium density residential
dwellings;
> The RPLSP 1998 defines the road network for Roxburgh Park as a whole including the subject site;
> The RPLSP 1998 includes to provision of a north-south arterial road known as Aitken Boulevard or the
E14 transit road. Aitken Boulevard will ultimately provide a divided carriageway comprising 3 through
lanes in each direction;
> Modelling prepared by Ashton Traffic Pty Ltd of Aitken Boulevard indicates that when connected through
traffic volumes will shift from Donald Cameron Drive and Bridgewater Road to Aitken Boulevard;
> A comparison of daily traffic generation of the Roxburgh Park Town Centre envisaged in the RPLSP 1998
and the current rezoning proposal indicates that the current proposal generates a similar level of daily
traffic to the RPLSP 1998 town centre;
> Given that the Roxburgh Park road network has been designed generally in accordance with the RPLSP
1998 which contemplates a Roxburgh Park town centre of a similar traffic generating nature to the current
proposal it is considered that the external road network has already been designed appropriately to
accommodate development traffic and will have sufficient capacity to accommodate the new proposed
uses.
> A detailed AM and PM peak hour assessment of the surrounding intersections indicates that sufficient
capacity exists within the existing intersection geometries to accommodate the peak hour traffic
requirements of the proposal;
> It is considered appropriate that fully directional access be gained from Bridgewater Boulevard and
assessment of this access during the AM and PM peak hours indicates that such a treatment would
operate satisfactorily;
> The intersection analysis are based on existing traffic volumes and do not consider the reduction in traffic
forecast by the Ashton Traffic model with the Aitken Boulevard connection resulting in daily traffic volume
reductions of approximately 30% from current conditions on Donald Cameron Drive and Bridgewater
Road. As such it is considered that intersection operations will improve from existing conditions when
Aitken Boulevard in constructed.

Traffic and Transport Expert Evidence Roxburgh Park Development
4 April 2013 Cardno 36
Roxburgh Park Development
APPENDIX
A ASHTON TRAFFIC MODELLING OF AITKEN BOULEVARD