Embed Size (px)
Citation preview
Department of Civil Engineering, IIT Bombay CE 740: Traffic Engineering
TRAFFIC ENGINEERING LAB
RECORD AUTUMN, 2015

Page | 1 CE 740 Lab Record: Autumn, 2015
CE 740: TRAFFIC ENGINEERING LAB
July – December, 2015
Name: _____________________________________ Roll No: ___________________
Other Group Members:
No Tests Page Date Marks Signature of
TA
1 Study of Driver Testing Unit 2
2 Study of Driver Vision Screen Tester 6
3 Spot Speed Study 10
4 Moving Observer Method 29
5 Measurement of Travel Time and
Delay for Congested Corridor 39
6 Parking Usage Study 43
7 Intersection Volume Study 49
8 Saturation Flow Measurement 67
9 Intersection Delay Measurement 85
10 License Plate Method of OD Survey 96
11 Gap Acceptance Study of Uncontrolled
Intersection 108
12 Pedestrian Behaviour Study 124
13 Traffic Noise Study 129
14 Road Safety Audit 132
End Semester Exam -
Marks for the lab by TAS (out of 50) : . . . . . . .
Marks for the lab viva/exam by Instructor (out of 50): . . . . . . .
Total marks (out of 100) : . . . . . . .
Signature of the Student Signature of the Instructor
Page | 2 CE 740 Lab Record: Autumn, 2015
1. DRIVER VISION TESTING
Aim:
Equipment:
Theory:
Page | 3 CE 740 Lab Record: Autumn, 2015
Procedure:
Page | 4 CE 740 Lab Record: Autumn, 2015
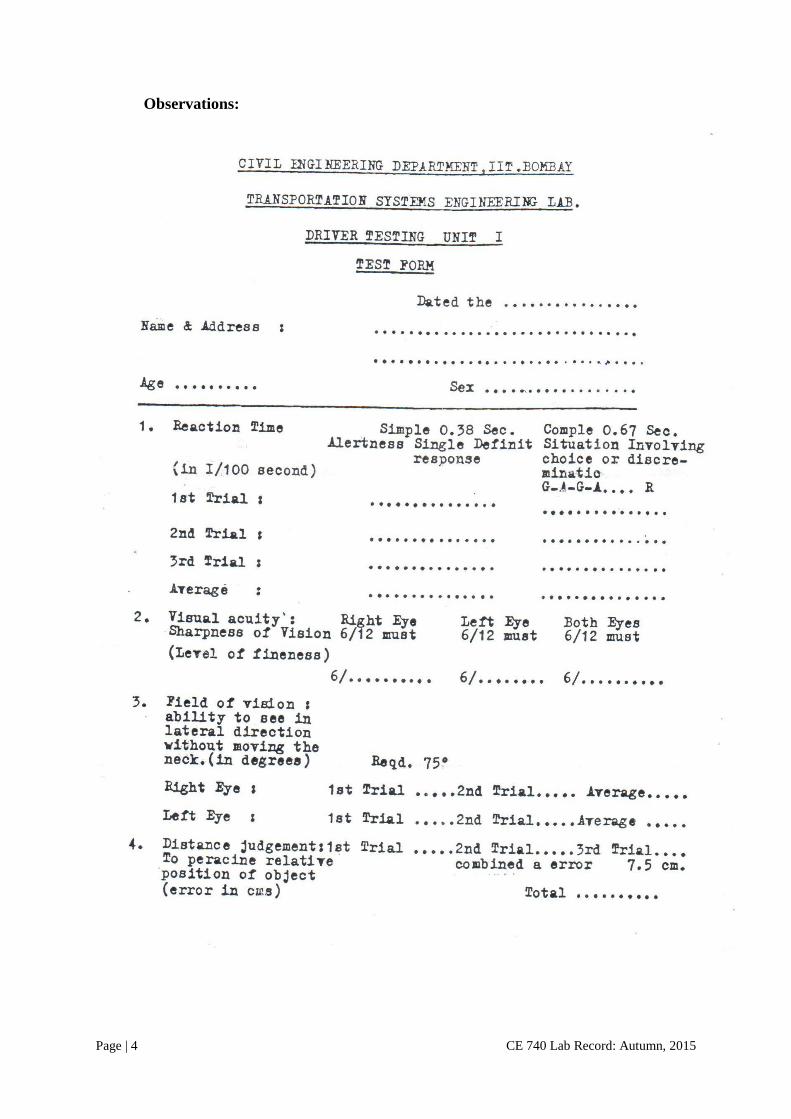
Observations:

Page | 5 CE 740 Lab Record: Autumn, 2015
Result:
Inference:
Date: Signature of TA

Page | 6 CE 740 Lab Record: Autumn, 2015
2. DRIVER VISION TESTING
Aim:
Equipment:
Theory:

Page | 7 CE 740 Lab Record: Autumn, 2015
Procedure:

Page | 8 CE 740 Lab Record: Autumn, 2015
Observations:

Page | 9 CE 740 Lab Record: Autumn, 2015
Result:
Inference:
Date: Signature of TA

Page | 10 CE 740 Lab Record: Autumn, 2015
3. SPOT SPEED STUDY
Aim:
Equipment:
Theory:

Page | 11 CE 740 Lab Record: Autumn, 2015
Procedure:
Page | 12 CE 740 Lab Record: Autumn, 2015
Observations:
Location: Date:
Name of Road: Trap Length:
Direction: Weather: (Sunny/Rainy/Windy)
Title:
Sl.
No.
Two Wheeler Three Wheeler Car LCV HCV
Time Speed Time Speed Time Speed Time Speed Time Speed

Page | 13 CE 740 Lab Record: Autumn, 2015
Location: Date:
Name of Road: Trap Length:
Direction: Weather: (Sunny/Rainy/Windy)
Title:
Sl.
No.
Two Wheeler Three Wheeler Car LCV HCV
Time Speed Time Speed Time Speed Time Speed Time Speed

Page | 14 CE 740 Lab Record: Autumn, 2015
Location: Date:
Name of Road: Name of Observer:
Direction: Weather: (Sunny/Rainy/Windy)
Title:
Sl.
No.
Two Wheeler Three Wheeler Car LCV HCV
Time Speed Time Speed Time Speed Time Speed Time Speed

Page | 15 CE 740 Lab Record : Autumn, 2015
Analysis:
Title:
Speed
Range
Mid-
Speed
Two Wheeler Three Wheeler Car LCV HCV
Fre
qu
ency
% F
req
uen
cy
Cu
mu
lati
ve
%
Fre
qu
ency
Fre
qu
ency
% F
req
uen
cy
Cu
mu
lati
ve
%
Fre
qu
ency
Fre
qu
ency
% F
req
uen
cy
Cu
mu
lati
ve
%
Fre
qu
ency
Fre
qu
ency
% F
req
uen
cy
Cu
mu
lati
ve
%
Fre
qu
ency
Fre
qu
ency
% F
req
uen
cy
Cu
mu
lati
ve
%
Fre
qu
ency

Page | 16 CE 740 Lab Record : Autumn, 2015
Graph Title:

Page | 17 CE 740 Lab Record : Autumn, 2015
Graph Title:

Page | 18 CE 740 Lab Record : Autumn, 2015
Graph Title:

Page | 19 CE 740 Lab Record : Autumn, 2015
Graph Title:
Page | 20 CE 740 Lab Record : Autumn, 2015
Graph Title:

Page | 21 CE 740 Lab Record : Autumn, 2015
Graph Title:

Page | 22 CE 740 Lab Record : Autumn, 2015
Graph Title:

Page | 23 CE 740 Lab Record : Autumn, 2015
Graph Title:

Page | 24 CE 740 Lab Record : Autumn, 2015
Graph Title:

Page | 25 CE 740 Lab Record : Autumn, 2015
Graph Title:

Page | 26 CE 740 Lab Record : Autumn, 2015
Graph Title:

Page | 27 CE 740 Lab Record : Autumn, 2015
Sample Calculations:
Vehicle Class: ___________
1. Mean =
2. Mode =
3. 15th
Percentile Speed =
4. 85th
Percentile Speed =
5. 95th
Percentile Speed =
6. Standard deviation =
7. Standard Error of Mean =
8. Required Sample Size (for 95% Confidence Level)=

Page | 28 CE 740 Lab Record : Autumn, 2015
Result:
Two
Wheeler
Three
Wheeler Car LCV HCV
Mean
(kmph)
Median
(kmph)
15th
Percentile
Speed
85th
Percentile
Speed
95th
Percentile
Speed
Standard
Error of
Mean
Sample Size
Required
(95%
confidence
level)
Inference:
Date: Signature of TA
Page | 29 CE 740 Lab Record : Autumn, 2015
4. MOVING OBSERVER METHOD
Aim:
Equipment:
Theory:

Page | 30 CE 740 Lab Record : Autumn, 2015
Procedure:

Page | 31 CE 740 Lab Record : Autumn, 2015
Observations:
Moving Observer Method Datasheet
Location: Date:
Name of Road: Name of Observer:
Direction: Weather: (Sunny/Rainy/Windy)
Sl.
No.
ma mo mp ta tw
2W 3W Car LCV HCV 2W 3W Car LCV HCV 2W 3W Car LCV HCV

Page | 32 CE 740 Lab Record : Autumn, 2015
Location: Date:
Name of Road: Name of Observer:
Direction: Weather: (Sunny/Rainy/Windy)
Sl.
No.
ma mo mp ta tw
2W 3W Car LCV HCV 2W 3W Car LCV HCV 2W 3W Car LCV HCV

Page | 33 CE 740 Lab Record : Autumn, 2015
Calculations:
Vehicle Class 2W 3W Car LCV HCV
PCU
Direction:
Sample
No. ma mo mp ma = (mo − mo) ta tw q v k
Direction:
Sample
No. ma mo mp ma = (mo − mo) ta tw q v k

Page | 34 CE 740 Lab Record : Autumn, 2015
Graph Title:

Page | 35 CE 740 Lab Record : Autumn, 2015
Graph Title:

Page | 36 CE 740 Lab Record : Autumn, 2015
Sample Calculation:
Calibration of Greenshield’s Model:
a) Direction:

Page | 37 CE 740 Lab Record : Autumn, 2015
b) Direction:

Page | 38 CE 740 Lab Record : Autumn, 2015
Results:
Direction Jam Density, kj Free Flow Speed, vf Maximum Flow, Qmax
Inference:

Page | 39 CE 740 Lab Record : Autumn, 2015
Date: Signature of TA
5. MEASUREMENT OF TRAVEL TIME AND
DELAY FOR CONGESTED CORRIDOR
Aim:
Equipment:
Theory:
Procedure:
Page | 40 CE 740 Lab Record : Autumn, 2015
Calculations:
Page | 41 CE 740 Lab Record : Autumn, 2015
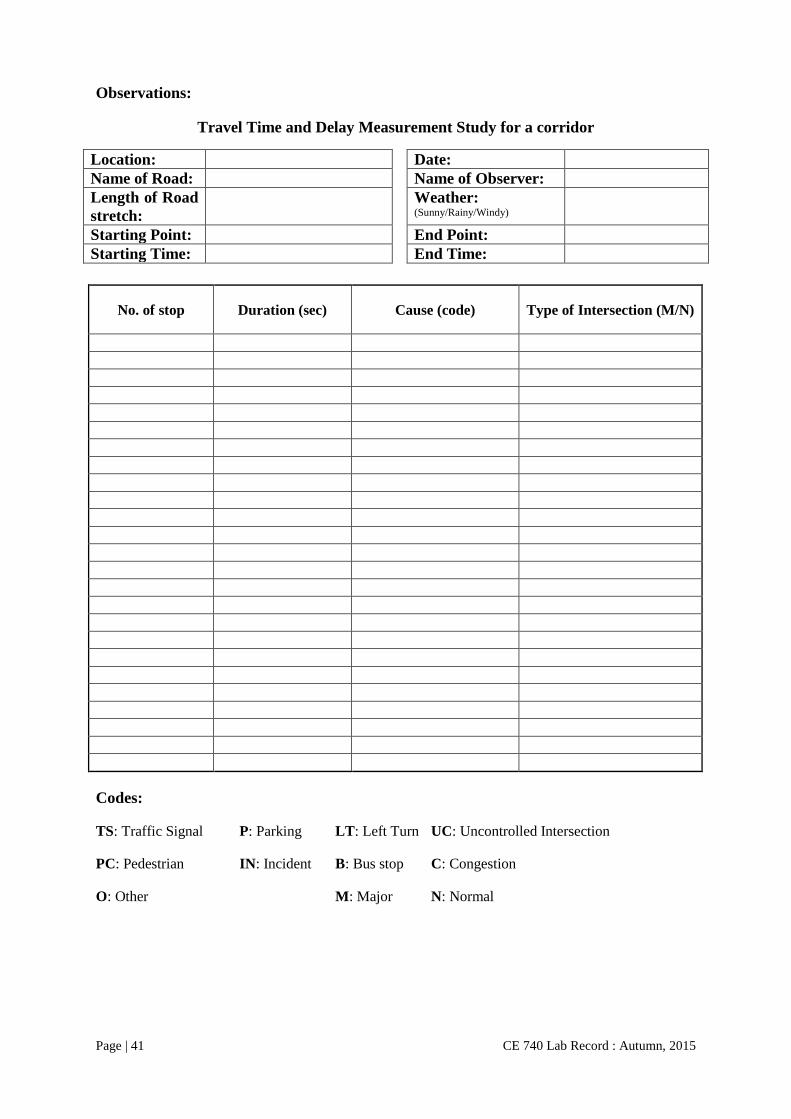
Observations:
Travel Time and Delay Measurement Study for a corridor
Location: Date:
Name of Road: Name of Observer:
Length of Road
stretch:
Weather: (Sunny/Rainy/Windy)
Starting Point: End Point:
Starting Time: End Time:
No. of stop Duration (sec) Cause (code) Type of Intersection (M/N)
Codes:
TS: Traffic Signal P: Parking LT: Left Turn UC: Uncontrolled Intersection
PC: Pedestrian IN: Incident B: Bus stop C: Congestion
O: Other M: Major N: Normal

Page | 42 CE 740 Lab Record : Autumn, 2015
Result:
Sl. No.
1. Total delay
2. Delay due to Traffic Signals
3. Congestion Delay
4. Travel Time
5. Average Speed
6. Running Speed
7. LOS (HCM 2000)
Inference:
Date: Signature of TA
Page | 43 CE 740 Lab Record : Autumn, 2015
6. PARKING USAGE STUDY
Aim:
Equipment:
Theory:

Page | 44 CE 740 Lab Record : Autumn, 2015
Procedure:
Sketch of Study Area:

Page | 45 CE 740 Lab Record : Autumn, 2015
Observations:
Data Sheet for Parking Usage Study
Location: Date:
Time: Name of Observer:
Type of Parking: Weather: (Sunny/Rainy/Windy)
Type of Vehicles
Parked:
Frequency of Patrol:
Bay
No.
Registration Number of Vehicles Parked at the Time of Patrol

Page | 46 CE 740 Lab Record : Autumn, 2015
Calculations:

Page | 47 CE 740 Lab Record : Autumn, 2015
Graph Title:

Page | 48 CE 740 Lab Record : Autumn, 2015
Result:
1. Parking Volume =
2. Parking Load =
3. Parking Index =
4. Parking Turnover =
5. Average Occupancy =
Inference:
Date: Signature of TA

Page | 49 CE 740 Lab Record : Autumn, 2015
7. INTERSECTION VOLUME STUDY
Aim:
Equipment:
Theory:
Procedure:
Page | 50 CE 740 Lab Record : Autumn, 2015
Sketch of Study Area:

Page | 51 CE 740 Lab Record : Autumn, 2015
Observations:
Name of Intersection: Date:
Name of Approach: Name of Observer:
Direction: Weather: (Sunny/Rainy/Windy)
Time Two Wheeler Three Wheeler Car LCV HCV
From To

Page | 52 CE 740 Lab Record : Autumn, 2015
Time Two Wheeler Three Wheeler Car LCV HCV
From To

Page | 53 CE 740 Lab Record : Autumn, 2015
Time Two Wheeler Three Wheeler Car LCV HCV
From To

Page | 54 CE 740 Lab Record : Autumn, 2015
Name of Intersection: Date:
Name of Approach: Name of Observer:
Direction: Weather: (Sunny/Rainy/Windy)
Time Two Wheeler Three Wheeler Car LCV HCV
From To
Page | 55 CE 740 Lab Record : Autumn, 2015
Time Two Wheeler Three Wheeler Car LCV HCV
From To

Page | 56 CE 740 Lab Record : Autumn, 2015
Time Two Wheeler Three Wheeler Car LCV HCV
From To

Page | 57 CE 740 Lab Record : Autumn, 2015
Name of Intersection: Date:
Name of Approach: Name of Observer:
Direction: Weather: (Sunny/Rainy/Windy)
Time Two Wheeler Three Wheeler Car LCV HCV
From To

Page | 58 CE 740 Lab Record : Autumn, 2015
Time Two Wheeler Three Wheeler Car LCV HCV
From To

Page | 59 CE 740 Lab Record : Autumn, 2015
Time Two Wheeler Three Wheeler Car LCV HCV
From To

Page | 60 CE 740 Lab Record : Autumn, 2015
Observation Table for PCU Estimation:
Title: Clearance Time in seconds for Various Vehicles Types
Sl. No. Two
Wheeler
Three
Wheeler Car LCV HCV
1
2
3
4
5
Average Clearance
Time
Average Area 1.2 4.48 5.39 12.81 17.62
PCU
Calculations:
a) Sample Calculations for PCU Estimation:
b) PHF Estimation:
Time Interval Volume Hourly Volume PHF Calculations
From To
Peak Volume for ____ min
Interval, Vn =
Peak Volume in 1 Hour, V60 =
Number of intervals in I hour,
n =
PHF =

Page | 61 CE 740 Lab Record : Autumn, 2015
Traffic Volume for the Selected Approach:
Location: Date:
Name of Intersection: Name of Observer:
Name of Approach: Weather: (Sunny/Rainy/Windy)
Direction:
Time Two Wheeler Three Wheeler Car LCV HCV Total PCU
From To

Page | 62 CE 740 Lab Record : Autumn, 2015
Direction:
Time Two Wheeler Three Wheeler Car LCV HCV Total PCU
From To

Page | 63 CE 740 Lab Record : Autumn, 2015
Direction:
Time Two Wheeler Three Wheeler Car LCV HCV Total PCU
From To

Page | 64 CE 740 Lab Record : Autumn, 2015
Traffic Volume on the Observed Intersection in PCU:
Volume in Each Direction Total
Intersection
Volume Time
From To Left Straight Right Left Straight Right Left Straight Right Left Straight Right

Page | 65 CE 740 Lab Record : Autumn, 2015
Graph Title:

Page | 66 CE 740 Lab Record : Autumn, 2015
Result:
Inference:
Date: Signature of TA
Page | 67 CE 740 Lab Record : Autumn, 2015
8. SATURATION FLOW MEASUREMENT
Aim:
Equipment:
Theory:

Page | 68 CE 740 Lab Record : Autumn, 2015
Procedure:

Page | 69 CE 740 Lab Record : Autumn, 2015
Observations:
1. Saturation Flow by HCM Method:
Name of Intersection: Date:
Name of Approach: Name of Observer:
Direction: Weather: (Sunny/Rainy/Windy)
Cycle
Time
Two
Wheeler
Three
Wheeler Car HCV LCV
Time
when
4th
vehicle
crosses
Time
when
8th
vehicle
crosses
Time
when
last
vehicle
crosses
1
2
3
4

Page | 70 CE 740 Lab Record : Autumn, 2015
5
6
7
8
9
10

Page | 71 CE 740 Lab Record : Autumn, 2015
2. Saturation Flow by TRL Method:
Name of Intersection: Date:
Name of Approach: Name of Observer:
Direction: Weather: (Sunny/Rainy/Windy)
Cycle
No.
Time (sec) 2W 3W Car LCV HCV
From To

Page | 72 CE 740 Lab Record : Autumn, 2015
Cycle
No.
Time (sec) 2W 3W Car LCV HCV
From To

Page | 73 CE 740 Lab Record : Autumn, 2015
Cycle
No.
Time (sec) 2W 3W Car LCV HCV
From To
Page | 74 CE 740 Lab Record : Autumn, 2015
Cycle
No.
Time (sec) 2W 3W Car LCV HCV
From To

Page | 75 CE 740 Lab Record : Autumn, 2015
Cycle
No.
Time (sec) 2W 3W Car LCV HCV
From To

Page | 76 CE 740 Lab Record : Autumn, 2015
Cycle
No.
Time (sec) 2W 3W Car LCV HCV
From To

Page | 77 CE 740 Lab Record : Autumn, 2015
Cycle
No.
Time (sec) 2W 3W Car LCV HCV
From To

Page | 78 CE 740 Lab Record : Autumn, 2015
Cycle
No.
Time (sec) 2W 3W Car LCV HCV
From To

Page | 79 CE 740 Lab Record : Autumn, 2015
Cycle
No.
Time (sec) 2W 3W Car LCV HCV
From To

Page | 80 CE 740 Lab Record : Autumn, 2015
Cycle
No.
Time (sec) 2W 3W Car LCV HCV
From To

Page | 81 CE 740 Lab Record : Autumn, 2015
Sample Calculations:
1. HCM 2010 Method:
2. TRL Method:

Page | 82 CE 740 Lab Record : Autumn, 2015
Analysis:
Title: Average Flow Values (TRL Method)
Time (sec) 2W 3W Car LCV HCV PCU
From To

Page | 83 CE 740 Lab Record : Autumn, 2015
Graph Title:

Page | 84 CE 740 Lab Record : Autumn, 2015
Results:
1. HCM 2010 Method:
2. TRL Method:
Inference:
Date: Signature of TA

Page | 85 CE 740 Lab Record : Autumn, 2015
9. INTERSECTION DELAY MEASUREMENT
Aim:
Equipment:
Theory:
Procedure:
Page | 86 CE 740 Lab Record : Autumn, 2015
Observations:
Site Information General Information
Name of Intersection: Date:
Name of Approach: Name of Observer:
Initial Input parameters
Number of Lanes Cycle length
Free-Flow Speed(km/h) Survey Count Interval(s)
Title:
Time Cycle
No.
Number of vehicles stopped in the approach Number of
stopped
vehicles
Number
of non-
stopped
vehicles
Count Interval
1 2 3 4 5 6 7 8 9 10

Page | 87 CE 740 Lab Record : Autumn, 2015
Title:
Time Cycle
No.
Number of vehicles stopped in the approach Number of
stopped
vehicles
Number
of non-
stopped
vehicles
Count Interval
1 2 3 4 5 6 7 8 9 10
Computation
Total vehicle in queue: Fraction of vehicle stopping:
Time in queue: Acc./Dece. Correction delay:
No. of vehicle stopping per lane per cycle: Control delay/ vehicle for
approach
Acc./Dece. Correction Factor:

Page | 88 CE 740 Lab Record : Autumn, 2015
Observations:
Site Information General Information
Name of Intersection: Date:
Name of Approach: Name of Observer:
Initial Input parameters
Number of Lanes Cycle length
Free-Flow Speed(km/h) Survey Count Interval(s)
Title:
Time Cycle
No.
Number of vehicles stopped in the approach Number of
stopped
vehicles
Number
of non-
stopped
vehicles
Count Interval
1 2 3 4 5 6 7 8 9 10

Page | 89 CE 740 Lab Record : Autumn, 2015
Title:
Time Cycle
No.
Number of vehicles stopped in the approach Number of
stopped
vehicles
Number
of non-
stopped
vehicles
Count Interval
1 2 3 4 5 6 7 8 9 10
Computation
Total vehicle in queue: Fraction of vehicle stopping:
Time in queue: Acc./Dece. Correction delay:
No. of vehicle stopping per lane per cycle: Control delay/ vehicle for
approach
Acc./Dece. Correction Factor:

Page | 90 CE 740 Lab Record : Autumn, 2015
Observations:
Site Information General Information
Name of Intersection: Date:
Name of Approach: Name of Observer:
Initial Input parameters
Number of Lanes Cycle length
Free-Flow Speed(km/h) Survey Count Interval(s)
Title:
Time Cycle
No.
Number of vehicles stopped in the approach Number of
stopped
vehicles
Number
of non-
stopped
vehicles
Count Interval
1 2 3 4 5 6 7 8 9 10

Page | 91 CE 740 Lab Record : Autumn, 2015
Title:
Time Cycle
No.
Number of vehicles stopped in the approach Number of
stopped
vehicles
Number
of non-
stopped
vehicles
Count Interval
1 2 3 4 5 6 7 8 9 10
Computation
Total vehicle in queue: Fraction of vehicle stopping:
Time in queue: Acc./Dece. Correction delay:
No. of vehicle stopping per lane per cycle: Control delay/ vehicle for
approach
Acc./Dece. Correction Factor:

Page | 92 CE 740 Lab Record : Autumn, 2015
Observations:
Site Information General Information
Name of Intersection: Date:
Name of Approach: Name of Observer:
Initial Input parameters
Number of Lanes Cycle length
Free-Flow Speed(km/h) Survey Count Interval(s)
Title:
Time Cycle
No.
Number of vehicles stopped in the approach Number of
stopped
vehicles
Number
of non-
stopped
vehicles
Count Interval
1 2 3 4 5 6 7 8 9 10

Page | 93 CE 740 Lab Record : Autumn, 2015
Title:
Time Cycle
No.
Number of vehicles stopped in the approach Number of
stopped
vehicles
Number
of non-
stopped
vehicles
Count Interval
1 2 3 4 5 6 7 8 9 10
Computation
Total vehicle in queue: Fraction of vehicle stopping:
Time in queue: Acc./Dece. Correction delay:
No. of vehicle stopping per lane per cycle: Control delay/ vehicle for
approach
Acc./Dece. Correction Factor:

Page | 94 CE 740 Lab Record : Autumn, 2015
Calculations:
Control Delay as per HCM 2010 for each approach:
Total intersection delay:

Page | 95 CE 740 Lab Record : Autumn, 2015
Result:
Inference:
Date: Signature of TA

Page | 96 CE 740 Lab Record : Autumn, 2015
10. LICENSE PLATE METHOD OF OD SURVEY
Aim:
Equipment:
Theory:

Page | 97 CE 740 Lab Record : Autumn, 2015
Procedure:
Page | 98 CE 740 Lab Record : Autumn, 2015
Sketch of Study Area:
Zone
No. Name
Observations:
Name of Loaction: Date:
Name of Observer: Weather: (Sunny/Rainy/Windy)
Sketch of location:

Page | 99 CE 740 Lab Record : Autumn, 2015
Zone Number: Zone Name:
Direction: Direction:
Time License Plate Number Time License Plate Number

Page | 100 CE 740 Lab Record : Autumn, 2015
Zone Number: Zone Name:
Direction: Direction:
Time License Plate Number Time License Plate Number
Page | 101 CE 740 Lab Record : Autumn, 2015
Zone Number: Zone Name:
Direction: Direction:
Time License Plate Number Time License Plate Number

Page | 102 CE 740 Lab Record : Autumn, 2015
Zone Number: Zone Name:
Direction: Direction:
Time License Plate Number Time License Plate Number

Page | 103 CE 740 Lab Record : Autumn, 2015
Zone Number: Zone Name:
Direction: Direction:
Time License Plate Number Time License Plate Number

Page | 104 CE 740 Lab Record : Autumn, 2015
Zone Number: Zone Name:
Direction: Direction:
Time License Plate Number Time License Plate Number

Page | 105 CE 740 Lab Record : Autumn, 2015
Zone Number: Zone Name:
Direction: Direction:
Time License Plate Number Time License Plate Number

Page | 106 CE 740 Lab Record : Autumn, 2015
Zone Number: Zone Name:
Direction: Direction:
Time License Plate Number Time License Plate Number

Page | 107 CE 740 Lab Record : Autumn, 2015
Result:
OD Matrix of Study Area:
Inference:
Date: Signature of TA

Page | 108 CE 740 Lab Record : Autumn, 2015
11. GAP ACCEPTANCE STUDY AT
UNCONTROLLED INTERSECTION
Aim:
Equipment:
Theory:

Page | 109 CE 740 Lab Record : Autumn, 2015
Procedure:
Page | 110 CE 740 Lab Record : Autumn, 2015
Observations:
Name of Intersection: Date:
Name of Approach: Name of Observer:
Direction: Weather: (Sunny/Rainy/Windy)
Title: Observed Accepted (A) and Rejected (R) gaps in seconds
2W 3W Car LCV HCV
A R A R A R A R A R

Page | 111 CE 740 Lab Record : Autumn, 2015
Calculations:
Vehicle Type:
Range Gap
Number of
Gaps
Accepted
Cumulative
Gaps (<t)
Number of
Gaps
Rejected
Cumulative
Gaps (>t) From To
Critical Gap by Raff’s Method:

Page | 112 CE 740 Lab Record : Autumn, 2015
Vehicle Type:
Range Gap
Number of
Gaps
Accepted
Cumulative
Gaps (<t)
Number of
Gaps
Rejected
Cumulative
Gaps (>t) From To
Critical Gap by Raff’s Method:

Page | 113 CE 740 Lab Record : Autumn, 2015
Vehicle Type:
Range Gap
Number of
Gaps
Accepted
Cumulative
Gaps (<t)
Number of
Gaps
Rejected
Cumulative
Gaps (>t) From To
Critical Gap by Raff’s Method:
Page | 114 CE 740 Lab Record : Autumn, 2015
Vehicle Type:
Range Gap
Number of
Gaps
Accepted
Cumulative
Gaps (<t)
Number of
Gaps
Rejected
Cumulative
Gaps (>t) From To
Critical Gap by Raff’s Method:

Page | 115 CE 740 Lab Record : Autumn, 2015
Vehicle Type:
Range Gap
Number of
Gaps
Accepted
Cumulative
Gaps (<t)
Number of
Gaps
Rejected
Cumulative
Gaps (>t) From To
Critical Gap by Raff’s Method:

Page | 116 CE 740 Lab Record : Autumn, 2015
Vehicle Type: Total Vehicles
Range Gap
Number of
Gaps
Accepted
Cumulative
Gaps (<t)
Number of
Gaps
Rejected
Cumulative
Gaps (>t) From To
Critical Gap by Raff’s Method:

Page | 117 CE 740 Lab Record : Autumn, 2015
Graph Title:

Page | 118 CE 740 Lab Record : Autumn, 2015
Graph Title:

Page | 119 CE 740 Lab Record : Autumn, 2015
Graph Title:

Page | 120 CE 740 Lab Record : Autumn, 2015
Graph Title:

Page | 121 CE 740 Lab Record : Autumn, 2015
Graph Title:

Page | 122 CE 740 Lab Record : Autumn, 2015
Graph Title:

Page | 123 CE 740 Lab Record : Autumn, 2015
Result:
Vehicle Type Critical Gap
Raff’s Method From Graph
Two Wheeler
Three Wheeler
Car
LCV
HCV
Total Vehicles
Inference:
Date: Signature of TA

Page | 124 CE 740 Lab Record : Autumn, 2015
12. PEDESTRIAN BEHAVIOUR STUDY
Aim:
Equipment:
Theory:

Page | 125 CE 740 Lab Record : Autumn, 2015
Procedure:
Page | 126 CE 740 Lab Record : Autumn, 2015
Observations:
Name of Intersection: Date:
Name of Observer: Weather: (Sunny/Rainy/Windy)
Title: Walking Time of Pedestrians (Distance______________)
Group Crossing time in seconds for______________direction
1 2 3 4 5 6
1 person
Group of 3
Group of 5
Above 5
Group Crossing Time in seconds for _____________direction
1 2 3 4 5 6
1 person
Group of 3
Group of 5
Above 5
Title: Pedestrian volume
Time (in
minutes)
Pedestrian Volume
Up Down
10
20
30
40
50
60

Page | 127 CE 740 Lab Record : Autumn, 2015
Graph Title:

Page | 128 CE 740 Lab Record : Autumn, 2015
Sample Calculation:
Result:
Inference:

Page | 129 CE 740 Lab Record : Autumn, 2015
13. TRAFFIC NOISE STUDY

Page | 130 CE 740 Lab Record : Autumn, 2015

Page | 131 CE 740 Lab Record : Autumn, 2015
Date: Signature of TA

Page | 132 CE 740 Lab Record : Autumn, 2015
14. ROAD SAFETY AUDIT
Page | 133 CE 740 Lab Record : Autumn, 2015
Page | 134 CE 740 Lab Record : Autumn, 2015
Date: Signature of TA

Page | 135 CE 740 Lab Record : Autumn, 2015
References