Embed Size (px)
Citation preview

CORTLAND COUNTY
TRAFFIC SAFETY DATA
Prepared by
Institute for Traffic Safety Management and Research80 Wolf Road, Suite 607, Albany, NY 12205-2604
Phone 518-453-0291 . FAX 518-453-0298
February 2015

COUNTY TRAFFIC SAFETY DATA
This document provides various crash and ticket data for the county. Ticket data are presented for the years
2011-2013. Four summary reports provide detailed crash data for the three years 2011-2013. The four crash
reports provide data for 1) all crashes, 2) alcohol-related crashes, 3) speed-related crashes, and 4) motorcycle
crashes. Caution is advised in interpreting the data in cases where the numbers are very small.
For assistance in using the data in this document or to request additional information about New York’s highway
safety issues or highway safety grant opportunities for state and local governments or non-profit agencies, please
contact
Institute for Traffic Safety
Management and Research
80 Wolf Road, Suite 607
Albany, New York 12205
Telephone: 518-453-0291
Contact Person: Sandra Fuller
E-Mail: [email protected]
OR
Governor’s Traffic Safety Committee
NYS Department of Motor Vehicles
6 Empire State Plaza Room 414
Albany, New York 12228
Telephone: 518-474-5111
E-Mail: [email protected]

TABLE OF CONTENTS
COUNTY DATA
Section
Crash Data: 2011 - 2013
General Crash Summary Report .............................................................................................. 1
Alcohol-Related Crash Summary Report ................................................................................ 2
Speed-Related Crash Summary Report .................................................................................... 3
Motorcycle Crash Summary Report ......................................................................................... 4
Ticket Data: 2011 - 2013
Tickets Issued and Conviction Rates for Selected Violations ................................................. 5
DWI/AI Probation Data ........................................................................................................... 5
Tickets Issued by TSLED Agencies by Agency Type ............................................................. 5
TSLED Tickets Issued for Selected Violations by Enforcement Agency ................................ 5

SECTION 1
General Crash Summary Report

TABLE 1 Crash Summary Totals
Category TotalsCounty
Total
NYS
Total
% of
NYS
County
Total
NYS
Total
% of
NYS
County
Total
NYS
Total
% of
NYS
Total Crashes 1,138 307,550 0.4 1,144 294,757 0.4 1,353 304,804 0.4
Fatal Crashes 1 1,077 0.1 5 1,082 0.5 3 1,109 0.3
Non-Fatal Personal Injury Crashes 280 128,036 0.2 289 123,296 0.2 299 124,505 0.2
Reportable Property Damage Crashes 857 178,437 0.5 850 170,379 0.5 1,051 179,190 0.6
Manner of Collision
Single Vehicle Crashes 558 98,836 0.6 589 97,456 0.6 703 101,607 0.7
Multiple Vehicle Crashes 580 208,714 0.3 555 197,301 0.3 650 203,197 0.3
Special Crash Series
Pedestrian/Motor Vehicle Crashes 16 15,928 0.1 22 15,832 0.1 12 16,432 0.1
Bicycle/Motor Vehicle Crashes 14 6,076 0.2 11 6,137 0.2 11 6,328 0.2
Motorcycle Crashes 16 5,336 0.3 18 5,916 0.3 21 5,190 0.4
Fatalities
Persons Killed (1) 1 1,153 0.1 5 1,163 0.4 9 1,188 0.8
Drivers Killed 1 597 0.2 3 612 0.5 2 625 0.3
Passengers Killed 0 203 0.0 0 194 0.0 7 178 3.9
Pedestrians Killed 0 296 0.0 2 312 0.6 0 344 0.0
Bicyclists Killed 0 57 0.0 0 45 0.0 0 40 0.0
Other 0 0 0.0 0 0 0.0 0 1 0.0
Non-Fatal Injuries
Persons Injured (1) 372 177,445 0.2 368 169,206 0.2 382 169,177 0.2
Drivers Injured 230 106,335 0.2 251 101,605 0.2 250 101,317 0.2
Passengers Injured 110 48,677 0.2 86 45,532 0.2 109 45,003 0.2
Pedestrians Injured 17 15,689 0.1 19 15,607 0.1 12 16,278 0.1
Bicyclists Injured 14 5,883 0.2 12 5,929 0.2 11 6,140 0.2
Other 1 861 0.1 0 533 0.0 0 439 0.0
General Notes
* Some of the tables are based upon information received from police and motorist
reports of motor vehicle crashes. Others are based only on the police
reports; these are indicated by a (P).
* The Property Damage Crash reporting level is $1,000 or more.
* The term "vehicle" always excludes bicycles.
* The term "driver" always excludes bicyclists.
* Percentages may not total 100.0 due to rounding.
2013
(1) Includes pedestrians, bicyclists and all other non-vehicle involved persons as well as vehicle occupants regardless of seating position.
New York State Department of Motor Vehicles
Motor Vehicle Crashes
Cortland County
20122011
Compiled by ITSMR, December 2014All Crashes
Page 1 of 6

2011 2012 2013
Crash Rates
Crash Rate per 10,000 Population 230.54 231.23 276.26
Crash Rate per 10,000 Licensed Drivers 358.38 362.38 426.09
Fatality & Injury Rates
Fatality & Injury Rate per 10,000 Population 75.56 75.39 78.84
Fatality & Injury Rate per 10,000 Licensed Drivers 117.47 118.15 123.13
Total
Crashes Mid-6am 6am-Noon Noon-6pm 6pm-Mid Unknown
Total 1,353 127 339 555 303 29
Sunday 163 25 36 59 35 8
Monday 206 15 50 89 48 4
Tuesday 219 21 55 103 38 2
Wednesday 179 19 49 67 41 3
Thursday 201 13 62 77 48 1
Friday 216 15 53 94 46 8
Saturday 169 19 34 66 47 3
TABLE 3(P) Police Investigating Agency
# % # % # %
Total 1,030 100.0 1,062 100.0 1,244 100.0
State Police 398 38.6 413 38.9 398 32.0
County Police 270 26.2 315 29.7 440 35.4
New York City (NYPD) 0 0.0 0 0.0 0 0.0
Municipal Police (non-NYC) 362 35.1 334 31.5 406 32.6
Unknown 0 0.0 0 0.0 0 0.0
New York State Department of Motor Vehicles
Cortland County
Motor Vehicle Crashes
Time of Day
2011 2012 2013
TABLE 2 Day of Week/Time of Day: 2013
TABLE 1.1 Crash and Fatality & Injury Rates
Compiled by ITSMR, December 2014All Crashes
Page 2 of 6

Total
State Routes
County Routes
Town Routes
Municipal Routes
Parkways
Thruway
Other Interstates
Unknown
# % # % # %
Total Drivers 1,650 100.0 1,651 100.0 1,935 100.0
Male 942 57.1 929 56.3 1,095 56.6
Female 658 39.9 678 41.1 786 40.6
Unknown 50 3.0 44 2.7 54 2.8
Under Age 16 0 0.0 0 0.0 0 0.0
Ages 16-20 225 13.6 199 12.1 241 12.5
Ages 21-29 363 22.0 363 22.0 465 24.0
Ages 30-39 231 14.0 256 15.5 291 15.0
Ages 40-49 280 17.0 267 16.2 301 15.6
Ages 50-59 269 16.3 260 15.7 264 13.6
Ages 60-69 135 8.2 154 9.3 184 9.5
Ages 70 and Over 97 5.9 107 6.5 133 6.9
Unknown Age 50 3.0 45 2.7 56 2.9
2011 2012 2013
No roadway data are
available.
New York State Department of Motor Vehicles
Motor Vehicle Crashes
Cortland County
TABLE 5 Driver Gender and Age
TABLE 4 Jurisdictional Road System
201320122011
Compiled by ITSMR, December 2014All Crashes
Page 3 of 6
# % # % # %
Total Crashes 1,030 1,062 1,244
Alcohol Involvement* 41 4.0 48 4.5 42 3.4
Backing Unsafely 83 8.1 88 8.3 118 9.5
Driver Inattention/Distraction 126 12.2 130 12.2 120 9.6
Driver Inexperience 13 1.3 17 1.6 20 1.6
Failure to Keep Right 29 2.8 37 3.5 38 3.1
Failure to Yield R.O.W. 156 15.1 153 14.4 164 13.2
Following Too Closely 137 13.3 167 15.7 185 14.9
Passing/Lane Violations 106 10.3 106 10.0 101 8.1
Traffic Control Disregarded 31 3.0 27 2.5 32 2.6
Turning Improperly 35 3.4 31 2.9 31 2.5
Unsafe Speed* 213 20.7 179 16.9 268 21.5
Note: Many crashes have multiple factors reported.
Age Group Total # % # of Ped/Bike Total # % # of Ped/Bike
Total 373 100.0 33 391 100.0 23
Under Age 4 8 2.1 1 2 0.5 0
Ages 4-6 5 1.3 1 12 3.1 1
Ages 7-15 14 3.8 3 18 4.6 1
Ages 16-17 13 3.5 1 14 3.6 0
Ages 18-20 43 11.5 3 49 12.5 3
Ages 21-29 65 17.4 6 81 20.7 5
Ages 30-39 47 12.6 4 59 15.1 4
Ages 40-49 52 13.9 3 58 14.8 1
Ages 50-59 60 16.1 6 56 14.3 4
Ages 60-69 30 8.0 2 26 6.6 2
Ages 70 and Over 35 9.4 2 13 3.3 2
Unknown Age 1 0.3 1 3 0.8 0
# Killed or
Injured %# Killed or
Injured %# Killed or
Injured %
Motor Vehicle Occupants 324 100.0 318 100.0 346 100.0
No Restraint Used 22 6.8 23 7.2 34 9.8
Restraint Used 298 92.0 293 92.1 304 87.9
Unknown 4 1.2 2 0.6 8 2.3
Motorcyclists 13 100.0 16 100.0 19 100.0
No Helmet Used 0 0.0 1 6.3 1 5.3
Helmet Used 13 100.0 15 93.8 18 94.7
Unknown 0 0.0 0 0.0 0 0.0
Bicyclists 13 100.0 12 100.0 11 100.0
No Helmet Used 8 61.5 8 66.7 9 81.8
Helmet Used 2 15.4 2 16.7 0 0.0
Unknown 3 23.1 2 16.7 2 18.2
201320122011
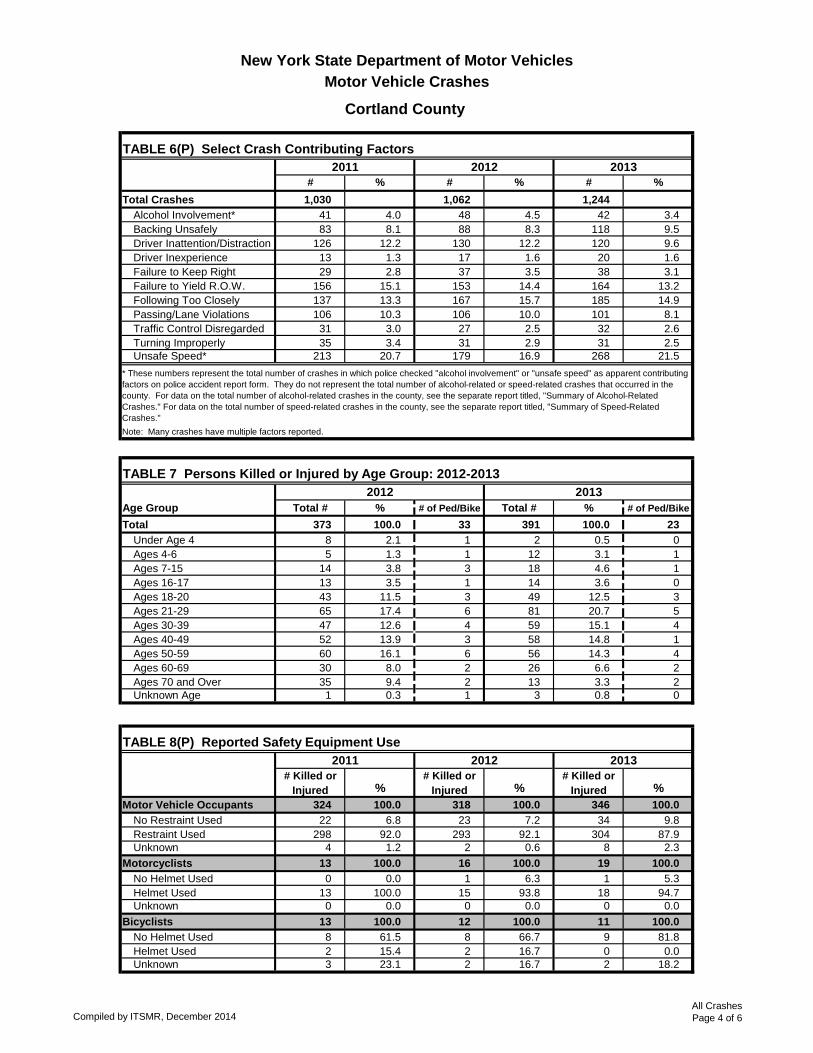
TABLE 8(P) Reported Safety Equipment Use
TABLE 7 Persons Killed or Injured by Age Group: 2012-2013
* These numbers represent the total number of crashes in which police checked "alcohol involvement" or "unsafe speed" as apparent contributing
factors on police accident report form. They do not represent the total number of alcohol-related or speed-related crashes that occurred in the
county. For data on the total number of alcohol-related crashes in the county, see the separate report titled, "Summary of Alcohol-Related
Crashes." For data on the total number of speed-related crashes in the county, see the separate report titled, "Summary of Speed-Related
Crashes."
2012 2013
201320122011
Cortland County
Motor Vehicle Crashes
New York State Department of Motor Vehicles
TABLE 6(P) Select Crash Contributing Factors
Compiled by ITSMR, December 2014All Crashes
Page 4 of 6

Note: In interpreting these data, any age group with a greater percentage of drivers involved in fatal and personal injury crashes
than licensed drivers indicates that the drivers in that age group are overrepresented in fatal and personal injury crashes. Seven
drivers in fatal and personal injury crashes were excluded due to unknown age.
1%
4%
6%
8%
14%17%
20%
29%
4%
11% 11% 12%
14%
19%
16%
13%
0%
5%
10%
15%
20%
25%
30%
35%
<18 18-20 21-24 25-29 30-39 40-49 50-59 60+
Age Group
FIGURE 1Cortland County 2013
Licensed Drivers and Drivers Involved in Fatal and Personal Injury Crashesby Age Group
Licensed Drivers (n=31,754)
Drivers in F&PI Crashes (n=458)
Compiled by ITSMR, December 2014All Crashes
Page 5 of 6

TABLE 9 Fatal & Personal Injury Crashes, Crash Rate per Roadway Mile, and Fatalities & Injuries by County Jurisdiction
Pop./ F&PI Crashes/ # Killed & F&PI Crashes/ # Killed & F&PI Crashes/ # Killed &
Pop. % Miles % Mile Crashes Mile Injured Crashes Mile Injured Crashes Mile Injured
Towns Cincinnatus 1,042 2.1 46.6 4.5 22.4 8 0.2 8 10 0.2 11 6 0.1 8
Cortlandville 6,984 14.3 128.3 12.5 54.4 75 0.6 104 87 0.7 120 86 0.7 119
Cuyler 1,048 2.1 63.0 6.1 16.6 2 <0.1 2 1 <0.1 2 3 <0.1 4
Freetown 820 1.7 49.4 4.8 16.6 2 <0.1 2 0 na na 3 0.1 4
Harford 921 1.9 42.8 4.2 21.5 4 0.1 4 9 0.2 14 5 0.1 6
Homer 3,095 6.3 110.6 10.8 28.0 23 0.2 30 20 0.2 26 31 0.3 39
Lapeer 691 1.4 40.7 4.0 17.0 4 0.1 8 3 0.1 4 6 0.1 8
Marathon 1,147 2.3 46.5 4.5 24.7 12 0.3 18 13 0.3 16 10 0.2 11
Preble 1,584 3.2 56.9 5.5 27.8 11 0.2 12 8 0.1 9 9 0.2 10
Scott 1,196 2.4 44.9 4.4 26.6 1 <0.1 1 7 0.2 7 6 0.1 7
Solon 1,124 2.3 47.3 4.6 23.8 7 0.1 12 8 0.2 9 11 0.2 13
Taylor 498 1.0 48.8 4.7 10.2 0 na na 2 <0.1 3 4 0.1 4
Truxton 1,257 2.6 65.9 6.4 19.1 6 0.1 9 8 0.1 8 6 0.1 13
Virgil 2,487 5.1 103.1 10.0 24.1 19 0.2 24 23 0.2 28 12 0.1 14
Willet 1,016 2.1 47.9 4.7 21.2 2 <0.1 2 2 <0.1 2 4 0.1 4
Villages Homer 3,346 6.8 19.6 1.9 170.7 13 0.7 14 14 0.7 19 15 0.8 22
McGraw 988 2.0 6.1 0.6 162.0 4 0.7 5 4 0.7 5 3 0.5 3
Marathon 1,049 2.1 9.5 0.9 110.4 0 na na 2 0.2 2 3 0.3 5
City Cortland 18,713 38.2 50.4 4.9 371.3 88 1.7 118 70 1.4 84 79 1.6 97
Other unknown na na na na na 0 na na 3 na 4 0 na na
Cortland
49,006 1028.1 47.7 281 0.3 373 294 0.3 373 302 0.3 391
New York State 19,227,088 113342.8 169.6 129,113 1.1 178,598 124,378 1.1 170,369 125,614 1.1 170,365
Source: US Census Bureau redistricting data, 2004 NYSDOT Highway Mileage report, and the NYSDMV AIS data base.
2013
Cortland County
Motor Vehicle Crashes
New York State Department of Motor Vehicles
20122011
County Total
Jurisdiction
Compiled by ITSMR, December 2014All Crashes
Page 6 of 6

SECTION 2
Alcohol-Related Crash Summary Report

TABLE 1(P) Alcohol-Related (A-R) Crashes
Category TotalsCounty
Total
NYS
Total
% of
NYS
County
Total
NYS
Total
% of
NYS
County
Total
NYS
Total
% of
NYS
Total Crashes 42 8,461 0.5 52 8,633 0.6 48 8,368 0.6
Fatal Crashes 1 330 0.3 3 325 0.9 1 358 0.3
Non-Fatal Personal Injury Crashes 16 4,298 0.4 27 4,471 0.6 25 4,248 0.6
Reportable Property Damage Crashes 25 3,833 0.7 22 3,837 0.6 22 3,762 0.6
Manner of Collision
Single Vehicle Crashes 27 4,646 0.6 34 4,725 0.7 30 4,690 0.6
Multiple Vehicle Crashes 15 3,815 0.4 18 3,908 0.5 18 3,678 0.5
Special A-R Crash Series
A-R Pedestrian/Motor Vehicle Crashes 2 460 0.4 4 495 0.8 0 495 0.0
A-R Bicycle/Motor Vehicle Crashes 0 105 0.0 1 118 0.8 2 127 1.6
A-R Motorcycle Crashes 1 204 0.5 3 215 1.4 2 182 1.1
Fatalities
Persons Killed (1) 1 362 0.3 3 358 0.8 1 387 0.3
Drivers Killed 1 185 0.5 2 188 1.1 0 214 0.0
Drinking Drivers 1 170 0.6 1 171 0.6 0 201 0.0
Non-Drinking Drivers 0 15 0.0 1 17 5.9 0 13 0.0
Passengers Killed 0 73 0.0 0 62 0.0 1 62 1.6
Pedestrians Killed 0 91 0.0 1 99 1.0 0 98 0.0
Bicyclists Killed 0 13 0.0 0 9 0.0 0 13 0.0
Other 0 0 0.0 0 0 0.0 0 0 0.0
Non-Fatal Injuries
Persons Injured (1) 21 6,121 0.3 34 6,303 0.5 31 6,019 0.5
Drivers Injured 15 3,874 0.4 24 4,011 0.6 22 3,754 0.6
Passengers Injured 4 1,726 0.2 7 1,741 0.4 7 1,729 0.4
Pedestrians Injured 2 382 0.5 2 404 0.5 0 400 0.0
Bicyclists Injured 0 91 0.0 1 105 1.0 2 110 1.8
Other 0 48 0.0 0 42 0.0 0 26 0.0
General Notes
* All tables are based on information received from police reports.
* The Property Damage Crash reporting level is $1,000 or more.
* The term "vehicle" always excludes bicycles.
* The term "driver" always excludes bicyclists.
* Percentages may not total 100.0 due to rounding.
2013
Cortland County
Alcohol-Related Motor Vehicle Crashes
New York State Department of Motor Vehicles
(1) Includes pedestrians, bicyclists and all other non-vehicle involved persons as well as vehicle occupants regardless of seating position.
20122011
Compiled by ITSMR, December 2014Alcohol-Related Crashes
Page 1 of 4

Total
Crashes Mid-6am 6am-Noon Noon-6pm 6pm-Mid Unknown
Total 48 13 5 7 23 0
Sunday 9 4 1 1 3 0
Monday 6 0 0 1 5 0
Tuesday 2 1 0 0 1 0
Wednesday 4 1 1 2 0 0
Thursday 8 1 0 1 6 0
Friday 8 2 1 0 5 0
Saturday 11 4 2 2 3 0
# % # % # %
Total Drivers 53 100.0 63 100.0 61 100.0
Male 40 75.5 46 73.0 50 82.0
Drinking Drivers 33 62.3 37 58.7 37 60.7
Non-Drinking Drivers 7 13.2 9 14.3 13 21.3
Female 12 22.6 17 27.0 10 16.4
Drinking Drivers 8 15.1 12 19.0 8 13.1
Non-Drinking Drivers 4 7.5 5 7.9 2 3.3
Unknown 1 1.9 0 0.0 1 1.6
Drinking Drivers 0 0.0 0 0.0 0 0.0
Non-Drinking Drivers 1 1.9 0 0.0 1 1.6
Drinking Drivers 41 100.0 49 100.0 45 100.0
Under Age 16 0 0.0 0 0.0 0 0.0
Ages 16-20 5 12.2 9 18.4 4 8.9
Ages 21-29 16 39.0 12 24.5 16 35.6
Ages 30-39 8 19.5 8 16.3 10 22.2
Ages 40-49 9 22.0 12 24.5 8 17.8
Ages 50-59 3 7.3 7 14.3 6 13.3
Age 60 and Over 0 0.0 1 2.0 1 2.2
Unknown Age 0 0.0 0 0.0 0 0.0
Non-Drinking Drivers 12 100.0 14 100.0 16 100.0
Under Age 16 0 0.0 0 0.0 0 0.0
Ages 16-20 1 8.3 1 7.1 1 6.3
Ages 21-29 2 16.7 2 14.3 6 37.5
Ages 30-39 1 8.3 0 0.0 3 18.8
Ages 40-49 2 16.7 3 21.4 3 18.8
Ages 50-59 4 33.3 4 28.6 1 6.3
Age 60 and Over 1 8.3 4 28.6 1 6.3
Unknown Age 1 8.3 0 0.0 1 6.3
Time of Day
New York State Department of Motor Vehicles
Alcohol-Related Motor Vehicle Crashes
Cortland County
2011 2012 2013
TABLE 2(P) Day of Week/Time of Day: 2013
TABLE 3(P) Driver Gender and Age
Compiled by ITSMR, December 2014Alcohol-Related Crashes
Page 2 of 4
# % # % # %
Total Crashes 42 52 48
Driver Inattention/Distraction 3 7.1 2 3.8 1 2.1
Failure to Keep Right 3 7.1 5 9.6 7 14.6
Failure to Yield R.O.W. 1 2.4 3 5.8 3 6.3
Fell Asleep 1 2.4 0 0.0 0 0.0
Following Too Closely 6 14.3 3 5.8 4 8.3
Passing/Lane Violations 5 11.9 9 17.3 3 6.3
Traffic Control Disregarded 1 2.4 3 5.8 3 6.3
Unsafe Speed 13 31.0 11 21.2 13 27.1
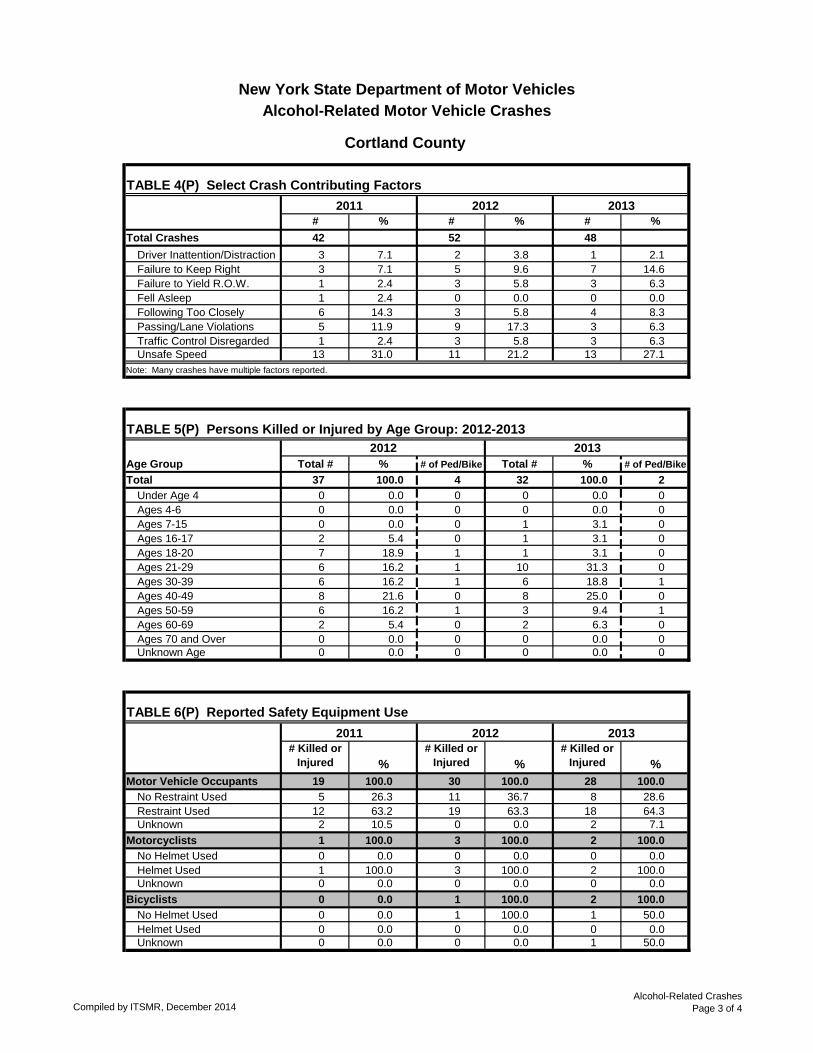
Note: Many crashes have multiple factors reported.
Age Group Total # % # of Ped/Bike Total # % # of Ped/Bike
Total 37 100.0 4 32 100.0 2
Under Age 4 0 0.0 0 0 0.0 0
Ages 4-6 0 0.0 0 0 0.0 0
Ages 7-15 0 0.0 0 1 3.1 0
Ages 16-17 2 5.4 0 1 3.1 0
Ages 18-20 7 18.9 1 1 3.1 0
Ages 21-29 6 16.2 1 10 31.3 0
Ages 30-39 6 16.2 1 6 18.8 1
Ages 40-49 8 21.6 0 8 25.0 0
Ages 50-59 6 16.2 1 3 9.4 1
Ages 60-69 2 5.4 0 2 6.3 0
Ages 70 and Over 0 0.0 0 0 0.0 0
Unknown Age 0 0.0 0 0 0.0 0
# Killed or
Injured %
# Killed or
Injured %
# Killed or
Injured %
Motor Vehicle Occupants 19 100.0 30 100.0 28 100.0
No Restraint Used 5 26.3 11 36.7 8 28.6
Restraint Used 12 63.2 19 63.3 18 64.3
Unknown 2 10.5 0 0.0 2 7.1
Motorcyclists 1 100.0 3 100.0 2 100.0
No Helmet Used 0 0.0 0 0.0 0 0.0
Helmet Used 1 100.0 3 100.0 2 100.0
Unknown 0 0.0 0 0.0 0 0.0
Bicyclists 0 0.0 1 100.0 2 100.0
No Helmet Used 0 0.0 1 100.0 1 50.0
Helmet Used 0 0.0 0 0.0 0 0.0
Unknown 0 0.0 0 0.0 1 50.0
TABLE 6(P) Reported Safety Equipment Use
TABLE 5(P) Persons Killed or Injured by Age Group: 2012-2013
2012 2013
2011 2012 2013
New York State Department of Motor Vehicles
201320122011
TABLE 4(P) Select Crash Contributing Factors
Cortland County
Alcohol-Related Motor Vehicle Crashes
Compiled by ITSMR, December 2014Alcohol-Related Crashes
Page 3 of 4

Note: In interpreting these data, any age group with a greater percentage of impaired drivers involved in A-R fatal and personal
injury crashes than licensed drivers indicates that the drivers in that age group are overrepresented in A-R fatal and personal injury
crashes. Similarly, any age group with a greater percentage of drivers arrested for impaired driving than licensed drivers indicates
that drivers in that age group are overrepresented in alcohol-related arrests.
5% 6%
8%
14%
17%
20%
29%
9% 9%
27%
14%
27%
14%
0%
10%
21% 21% 21%
15%
11%
2%
0%
5%
10%
15%
20%
25%
30%
35%
<21 21-24 25-29 30-39 40-49 50-59 60+
Age Group
FIGURE 1 Cortland County 2013
Licensed Drivers, Impaired Drivers Involved in Alcohol-Related Fatal and Personal Injury Crashes, and Drivers Arrested for Impaired Driving
by Age Group
Licensed Drivers (n=31,754)
Impaired Drivers in A-R F&PI Crashes (n=22)
Impaired Driving Arrests (n=318)
Compiled by ITSMR, December 2014Alcohol-Related Crashes
Page 4 of 4

SECTION 3
Speed-Related Crash Summary Report

TABLE 1(P) Speed-Related (S-R) Crashes
Category TotalsCounty
Total
NYS
Total
% of
NYS
County
Total
NYS
Total
% of
NYS
County
Total
NYS
Total
% of
NYS
Total Crashes 218 28,147 0.8 187 26,630 0.7 276 29,178 0.9
Fatal Crashes 0 284 0.0 0 310 0.0 1 318 0.3
Non-Fatal Personal Injury Crashes 72 12,838 0.6 71 12,216 0.6 76 12,977 0.6
Reportable Property Damage Crashes 146 15,025 1.0 116 14,104 0.8 199 15,883 1.3
Manner of Collision
Single Vehicle Crashes 174 16,379 1.1 143 15,812 0.9 230 17,164 1.3
Multiple Vehicle Crashes 44 11,768 0.4 44 10,818 0.4 46 12,014 0.4
Special S-R Crash Series
S-R Pedestrian/Motor Vehicle Crashes 1 488 0.2 1 465 0.2 0 453 0.0
S-R Bicycle/Motor Vehicle Crashes 0 133 0.0 0 113 0.0 0 161 0.0
S-R Motorcycle Crashes 1 808 0.1 3 876 0.3 4 791 0.5
Fatalities
Persons Killed (1) 0 319 0.0 0 348 0.0 1 352 0.3
Drivers Killed 0 211 0.0 0 242 0.0 1 250 0.4
Speeding Drivers 0 195 0.0 0 215 0.0 1 237 0.4
Non-Speeding Drivers 0 16 0.0 0 27 0.0 0 13 0.0
Passengers Killed 0 91 0.0 0 77 0.0 0 79 0.0
Pedestrians Killed 0 17 0.0 0 27 0.0 0 23 0.0
Bicyclists Killed 0 0 0.0 0 2 0.0 0 0 0.0
Other 0 0 0.0 0 0 0.0 0 0 0.0
Non-Fatal Injuries
Persons Injured (1) 96 18,843 0.5 97 17,999 0.5 94 18,944 0.5
Drivers Injured 65 12,382 0.5 68 11,899 0.6 57 12,623 0.5
Passengers Injured 29 5,730 0.5 28 5,480 0.5 37 5,656 0.7
Pedestrians Injured 1 514 0.2 1 462 0.2 0 463 0.0
Bicyclists Injured 0 130 0.0 0 114 0.0 0 160 0.0
Other 1 87 1.1 0 44 0.0 0 42 0.0
General Notes
* All tables are based on information received from police reports.
* The Property Damage Crash reporting level is $1,000 or more.
* The term "vehicle" always excludes bicycles.
* The term "driver" always excludes bicyclists.
* Percentages may not total 100.0 due to rounding.
Cortland County
Speed-Related Motor Vehicle Crashes
New York State Department of Motor Vehicles
(1) Includes pedestrians, bicyclists and all other non-vehicle involved persons as well as vehicle occupants regardless of seating position.
20122011 2013
Compiled by ITSMR, December 2014Speed-Related Crashes
Page 1 of 3

Total Time of Day
Crashes Mid-6am 6am-Noon Noon-6pm 6pm-Mid Unknown
Total 276 41 66 102 67 0
Sunday 41 8 8 19 6 0
Monday 55 3 14 19 19 0
Tuesday 60 7 15 27 11 0
Wednesday 27 7 8 7 5 0
Thursday 33 3 12 9 9 0
Friday 24 5 3 7 9 0
Saturday 36 8 6 14 8 0
# % # % # %
Total Drivers 255 100.0 226 100.0 311 100.0
Male 156 61.2 148 65.5 199 64.0
Speeding Drivers 133 52.2 123 54.4 173 55.6
Non-Speeding Drivers 23 9.0 25 11.1 26 8.4
Female 97 38.0 75 33.2 107 34.4
Speeding Drivers 83 32.5 62 27.4 97 31.2
Non-Speeding Drivers 14 5.5 13 5.8 10 3.2
Unknown 2 0.8 3 1.3 5 1.6
Speeding Drivers 0 0.0 2 0.9 4 1.3
Non-Speeding Drivers 2 0.8 1 0.4 1 0.3
Speeding Drivers 216 100.0 187 100.0 274 100.0
Under Age 16 0 0.0 0 0.0 0 0.0
Ages 16-20 45 20.8 40 21.4 57 20.8
Ages 21-29 78 36.1 51 27.3 101 36.9
Ages 30-39 20 9.3 31 16.6 37 13.5
Ages 40-49 35 16.2 24 12.8 33 12.0
Ages 50-59 24 11.1 20 10.7 29 10.6
Age 60 and Over 14 6.5 18 9.6 13 4.7
Unknown Age 0 0.0 3 1.6 4 1.5
Non-Speeding Drivers 39 100.0 39 100.0 37 100.0
Under Age 16 0 0.0 0 0.0 0 0.0
Ages 16-20 5 12.8 2 5.1 1 2.7
Ages 21-29 9 23.1 7 17.9 11 29.7
Ages 30-39 9 23.1 8 20.5 7 18.9
Ages 40-49 3 7.7 6 15.4 1 2.7
Ages 50-59 6 15.4 11 28.2 7 18.9
Age 60 and Over 5 12.8 4 10.3 9 24.3
Unknown Age 2 5.1 1 2.6 1 2.7
New York State Department of Motor Vehicles
Speed-Related Motor Vehicle Crashes
Cortland County
2011 2012 2013
TABLE 2(P) Day of Week/Time of Day: 2013
TABLE 3(P) Driver Gender and Age
Compiled by ITSMR, December 2014Speed-Related Crashes
Page 2 of 3

# % # % # %
Total Crashes 218 187 276
Alcohol Involvement 14 6.4 13 7.0 17 6.2
Driver Inattention/Distraction 11 5.0 1 0.5 5 1.8
Driver Inexperience 3 1.4 4 2.1 6 2.2
Failure to Keep Right 5 2.3 7 3.7 9 3.3
Failure to Yield R.O.W. 4 1.8 5 2.7 2 0.7
Following Too Closely 9 4.1 11 5.9 7 2.5
Passing/Lane Violations 8 3.7 15 8.0 12 4.3
Traffic Control Disregarded 3 1.4 4 2.1 5 1.8
Note: Many crashes have multiple factors reported.
Age Group Total # % # of Ped/Bike Total # % # of Ped/Bike
Total 97 100.0 1 95 100.0 0
Under Age 4 1 1.0 0 2 2.1 0
Ages 4-6 0 0.0 0 1 1.1 0
Ages 7-15 7 7.2 0 5 5.3 0
Ages 16-17 6 6.2 0 7 7.4 0
Ages 18-20 18 18.6 1 15 15.8 0
Ages 21-29 20 20.6 0 22 23.2 0
Ages 30-39 11 11.3 0 12 12.6 0
Ages 40-49 14 14.4 0 15 15.8 0
Ages 50-59 13 13.4 0 10 10.5 0
Ages 60-69 6 6.2 0 3 3.2 0
Ages 70 and Over 1 1.0 0 3 3.2 0
Unknown Age 0 0.0 0 0 0.0 0
# Killed or
Injured %# Killed or
Injured %# Killed or
Injured %
Motor Vehicle Occupants 93 100.0 92 100.0 91 100.0
No Restraint Used 10 10.8 12 13.0 14 15.4
Restraint Used 82 88.2 79 85.9 74 81.3
Unknown 1 1.1 1 1.1 3 3.3
Motorcyclists 1 100.0 4 100.0 4 100.0
No Helmet Used 0 0.0 0 0.0 0 0.0
Helmet Used 1 100.0 4 100.0 4 100.0
Unknown 0 0.0 0 0.0 0 0.0
Bicyclists 0 0.0 0 0.0 0 0.0
No Helmet Used 0 0.0 0 0.0 0 0.0
Helmet Used 0 0.0 0 0.0 0 0.0
Unknown 0 0.0 0 0.0 0 0.0
Cortland County
Speed-Related Motor Vehicle Crashes
New York State Department of Motor Vehicles
201320122011
TABLE 4(P) Select Crash Contributing Factors
201320122011
TABLE 6(P) Reported Safety Equipment Use
TABLE 5(P) Persons Killed or Injured by Age Group: 2012-2013
2012 2013
Compiled by ITSMR, December 2014Speed-Related Crashes
Page 3 of 3

SECTION 4
Motorcycle Crash Summary Report

TABLE 1 Crash Summary Totals
Category TotalsCounty
Total
NYS
Total
% of
NYS
County
Total
NYS
Total
% of
NYS
County
Total
NYS
Total
% of
NYS
Total Motorcycle Crashes 16 5,336 0.3 18 5,916 0.3 21 5,190 0.4
Fatal Crashes 1 168 0.6 1 164 0.6 0 164 0.0
Non-Fatal Personal Injury Crashes 13 4,550 0.3 13 5,052 0.3 18 4,387 0.4
Reportable Property Damage Crashes 2 618 0.3 4 700 0.6 3 639 0.5
Manner of Collision
Single Motorcycle Crashes 9 2,408 0.4 14 2,564 0.5 11 2,207 0.5
Multiple Vehicle Crashes 7 2,928 0.2 4 3,352 0.1 10 2,983 0.3
Special Motorcycle Crash Series
Motorcycle/Pedestrian Crashes 0 64 0.0 0 89 0.0 0 105 0.0
Motorcycle/Bicycle Crashes 0 27 0.0 0 38 0.0 1 36 2.8
Fatalities
Persons Killed (1) 1 171 0.6 1 173 0.6 0 171 0.0
Drivers Killed 1 162 0.6 1 155 0.6 0 157 0.0
Motorcycle Operators 1 162 0.6 1 154 0.6 0 157 0.0
Non-Motorcycle Drivers 0 0 0.0 0 1 0.0 0 0 0.0
Passengers Killed 0 6 0.0 0 11 0.0 0 9 0.0
Motorcycle Passengers 0 6 0.0 0 10 0.0 0 8 0.0
Passengers in Other Vehicles 0 0 0.0 0 1 0.0 0 0 0.0
Pedestrians Killed 0 3 0.0 0 6 0.0 0 5 0.0
Bicyclists Killed 0 0 0.0 0 1 0.0 0 0 0.0
Other 0 0 0.0 0 0 0.0 0 0 0.0
Non-Fatal Injuries
Persons Injured (1) 13 5,180 0.3 15 5,820 0.3 22 5,017 0.4
Drivers Injured 12 4,604 0.3 13 5,129 0.3 18 4,434 0.4
Passengers Injured 1 485 0.2 2 562 0.4 3 456 0.7
Pedestrians Injured 0 59 0.0 0 88 0.0 0 96 0.0
Bicyclists Injured 0 22 0.0 0 31 0.0 1 29 3.4
Other 0 10 0.0 0 10 0.0 0 2 0.0
General Notes
* Some of the tables are based upon information received from police and motorist
reports of motor vehicle crashes. Others are based only on the police
reports; these are indicated by a (P).
* The Property Damage Crash reporting level is $1,000 or more.
* The term "vehicle" always excludes bicycles.
* The term "driver" always excludes bicyclists.
* Percentages may not total 100.0 due to rounding.
2013
Cortland County
Motorcycle Crashes
New York State Department of Motor Vehicles
(1) Includes pedestrians, bicyclists and all other non-vehicle involved persons as well as vehicle occupants regardless of seating position.
20122011
Compiled by ITSMR, December 2014Motorcycle Crashes
Page 1 of 3

Total
Crashes Mid-6am 6am-Noon Noon-6pm 6pm-Mid Unknown
Total 21 1 3 10 7 0
Sunday 2 1 0 0 1 0
Monday 4 0 2 1 1 0
Tuesday 2 0 0 1 1 0
Wednesday 3 0 0 2 1 0
Thursday 2 0 1 1 0 0
Friday 2 0 0 1 1 0
Saturday 6 0 0 4 2 0
# % # % # %
Total MC Operators 15 100.0 18 100.0 22 100.0
Male 14 93.3 17 94.4 20 90.9
Female 1 6.7 1 5.6 2 9.1
Unknown 0 0.0 0 0.0 0 0.0
Under Age 16 0 0.0 0 0.0 0 0.0
Ages 16-20 5 33.3 2 11.1 4 18.2
Ages 21-29 1 6.7 3 16.7 1 4.5
Ages 30-39 1 6.7 3 16.7 4 18.2
Ages 40-49 4 26.7 3 16.7 2 9.1
Ages 50-59 2 13.3 7 38.9 10 45.5
Ages 60 and Over 2 13.3 0 0.0 1 4.5
Unknown Age 0 0.0 0 0.0 0 0.0
# % # % # %
Total MC Crashes 14 18 20
Alcohol Involvement 1 7.1 2 11.1 2 10.0
Driver Inattention/Distraction 0 0.0 1 5.6 1 5.0
Driver Inexperience 2 14.3 1 5.6 1 5.0
Failure to Keep Right 1 7.1 0 0.0 3 15.0
Failure to Yield R.O.W. 3 21.4 2 11.1 3 15.0
Following Too Closely 2 14.3 3 16.7 4 20.0
Passing/Lane Violations 2 14.3 1 5.6 3 15.0
Traffic Control Disregarded 1 7.1 0 0.0 0 0.0
Turning Improperly 1 7.1 1 5.6 0 0.0
Unsafe Speed 1 7.1 2 11.1 4 20.0
Note: Many crashes have multiple factors reported. Caution is advised due to the small numbers.
201320122011
201320122011
TABLE 4(P) Select Crash Contributing Factors
Time of Day
New York State Department of Motor Vehicles
Motorcycle Crashes
Cortland County
TABLE 2 Day of Week/Time of Day: 2013
TABLE 3 Motorcycle Operator Gender and Age
Compiled by ITSMR, December 2014Motorcycle Crashes
Page 2 of 3

# % # % # %
Age Group 13 100.0 16 100.0 19 100.0
Under Age 4 0 0.0 0 0.0 0 0.0
Ages 4-6 0 0.0 0 0.0 0 0.0
Ages 7-15 0 0.0 0 0.0 0 0.0
Ages 16-17 0 0.0 0 0.0 0 0.0
Ages 18-20 5 38.5 1 6.3 4 21.1
Ages 21-29 0 0.0 2 12.5 3 15.8
Ages 30-39 1 7.7 4 25.0 3 15.8
Ages 40-49 3 23.1 3 18.8 2 10.5
Ages 50-59 2 15.4 6 37.5 6 31.6
Ages 60-69 2 15.4 0 0.0 1 5.3
Ages 70 and Over 0 0.0 0 0.0 0 0.0
Unknown Age 0 0.0 0 0.0 0 0.0
# % # % # %
Motorcyclists 13 100.0 16 100.0 19 100.0
No Helmet Used 0 0.0 1 6.3 1 5.3
Helmet Used 13 100.0 15 93.8 18 94.7
Unknown 0 0.0 0 0.0 0 0.0
# % of NYS # % of NYS
2009 2,000 0.6 4,153 0.6
2010 2,028 0.6 4,174 0.6
2011 2,021 0.6 4,134 0.6
2012 1,995 0.6 4,119 0.6
2013 2,024 0.6 4,240 0.6
2011
Cortland County
Motorcycle Crashes
New York State Department of Motor Vehicles
TABLE 6(P) Reported Safety Equipment Use for Motorcyclists Killed or Injured
TABLE 5 Motorcyclists Killed or Injured by Age Group
20132012
MC Registrations MC Licenses
TABLE 7 Motorcycle Registrations / License Endorsements
201320122011
Compiled by ITSMR, December 2014Motorcycle Crashes
Page 3 of 3

SECTION 5
Ticket Data

2011 2012 2013
TOTAL TICKETS ISSUED 19,004 15,843 16,257
SPEED (V&T 1180) 6,622 5,239 5,827
% of total tickets 34.8% 33.1% 35.8%
% convicted on same charge (of adjudicated cases) 57.0% 57.8% 52.7%
SAFETY RESTRAINTS (V&T 1229c) 908 681 504
% of total tickets 4.8% 4.3% 3.1%
% convicted on same charge (of adjudicated cases) 82.7% 80.7% 80.4%
Tickets for Non-Restrained Children (Under Age 16) 68 114 63
IMPAIRED DRIVING (V&T 1192) 631 577 556
% of total tickets 3.3% 3.6% 3.4%
Persons Arrested for Impaired Driving (N=349) (N=325) (N=318)
Case adjudicated 94.0% 90.5% 91.2%
Case pending 6.0% 9.5% 8.8%
Adjudicated Cases* (N=328) (N=294) (N=290)
Convicted on original 1192 charge 29.0% 29.9% 27.9%
Convicted on other 1192 charge 64.0% 62.2% 65.2%
Convicted on non-1192 charge 0.6% 1.7% 2.1%
Dismissed/Acquitted/Convicted on charge
associated with different event 6.4% 6.1% 4.8%
* Since some drivers are charged with more than one alcohol offense during a single traffic stop, conviction
rates are based on drivers who have had at least one offense adjudicated.
Source: NYSDMV TSLED ticket system.
2011 2012 2013
Number of Persons Sentenced
to Probation 42 48 47
Number of Persons on Probation 125 131 146
Source: NYS Office of Probation and Correctional Alternatives.
Probation Data for V&T 1192 and 511 Convictions
CORTLAND COUNTY
Tickets Issued and Conviction Rates for Select Violations
CORTLAND COUNTY
Compiled by ITSMR, December 2014Enforcement/Adjudication
Page 1 of 3

Cortland County
Tickets Issued by TSLED Agencies
By Agency Type
63%
24%
13%
62%
26%
12%
61%
24%
15%
0%
20%
40%
60%
80%
State Police Local Sheriff/County
2011 2012 2013
All Tickets Seat Belt Tickets
Speed Tickets Persons Ticketed for
Impaired Driving
75%
21%
4%
83%
14%
4%
78%
10% 12%
0%
20%
40%
60%
80%
State Police Local Sheriff/County
2011 2012 2013
25%
50%
24% 20%
63%
17% 17%
67%
16%
0%
20%
40%
60%
80%
State Police Local Sheriff/County
2011 2012 2013
Enforcement/Adjudication
Page 2 of 3
88%
8% 3%
89%
8% 3%
88%
7% 5%
0%
20%
40%
60%
80%
100%
State Police Local Sheriff/County
2011 2012 2013

% of % of % of % of % of % of
Enforcement Agency # Shf/Local Co. Total # Shf/Local Co. Total # Shf/Local Co. Total
Cortland Sheriff alcohol 157 33.5 24.9 98 21.2 17.0 89 19.0 16.0NCIC 01100 speed 226 29.1 3.4 171 29.4 3.3 270 39.0 4.6
seatbelt 34 15.2 3.7 25 21.0 3.7 61 55.0 12.1
Cortland City P.D. alcohol 281 59.9 44.5 342 74.0 59.3 329 70.3 59.2NCIC 01101 speed 203 26.2 3.1 145 25.0 2.8 185 26.7 3.2
seatbelt 102 45.5 11.2 56 47.1 8.2 23 20.7 4.6
SUNY Cortland alcohol 13 2.8 2.1 21 4.5 3.6 31 6.6 5.6NCIC 01104 speed 55 7.1 0.8 47 8.1 0.9 29 4.2 0.5
seatbelt 65 29.0 7.2 16 13.4 2.3 16 14.4 3.2
Homer P.D. alcohol 18 3.8 2.9 1 0.2 0.2 19 4.1 3.4NCIC 01120 speed 292 37.6 4.4 218 37.5 4.2 208 30.1 3.6
seatbelt 23 10.3 2.5 22 18.5 3.2 11 9.9 2.2 Village of McGraw P.D. alcohol 0 0.0 0.0 0 0.0 0.0 0 0.0 0.0
NCIC 01121 speed 0 0.0 0.0 0 0.0 0.0 0 0.0 0.0seatbelt 0 0.0 0.0 0 0.0 0.0 0 0.0 0.0
Totals by Agency Type Sheriff and Local alcohol 469 74.3 462 80.1 468 84.2
speed 776 11.7 581 11.1 692 11.9seatbelt 224 24.7 119 17.5 111 22.0
State Police alcohol 162 25.7 115 19.9 88 15.8 speed 5,846 88.3 4,658 88.9 5,135 88.1
seatbelt 684 75.3 562 82.5 393 78.0
Other alcohol 0 0.0 0 0.0 0 0.0 incl. Park Police speed 0 0.0 0 0.0 0 0.0
seatbelt 0 0.0 0 0.0 0 0.0
County Totalsalcohol 631 577 556
speed 6,622 5,239 5,827
seatbelt 908 681 504
2013
CORTLAND COUNTY
TSLED Tickets Issued for Selected Violations by Enforcement Agency
20122011
Compiled by ITSMR, December 2014 Enforcement / Adjudication
Page 3 of 3

Institute for Traffic Safety Management and Research 80 Wolf Road, Suite 607
Albany NY 12205-2604
Phone: 518-453-0291 FAX: 518-453-0298 E-mail: [email protected]
www.itsmr.org