Embed Size (px)
Citation preview
Dongho Chang, City Traffic Engineer
2016 Louisiana Transportation Confernece
March 2, 2016
Traffic Safety in Seattle Every Day Counts-3 Innovation: Road Diets
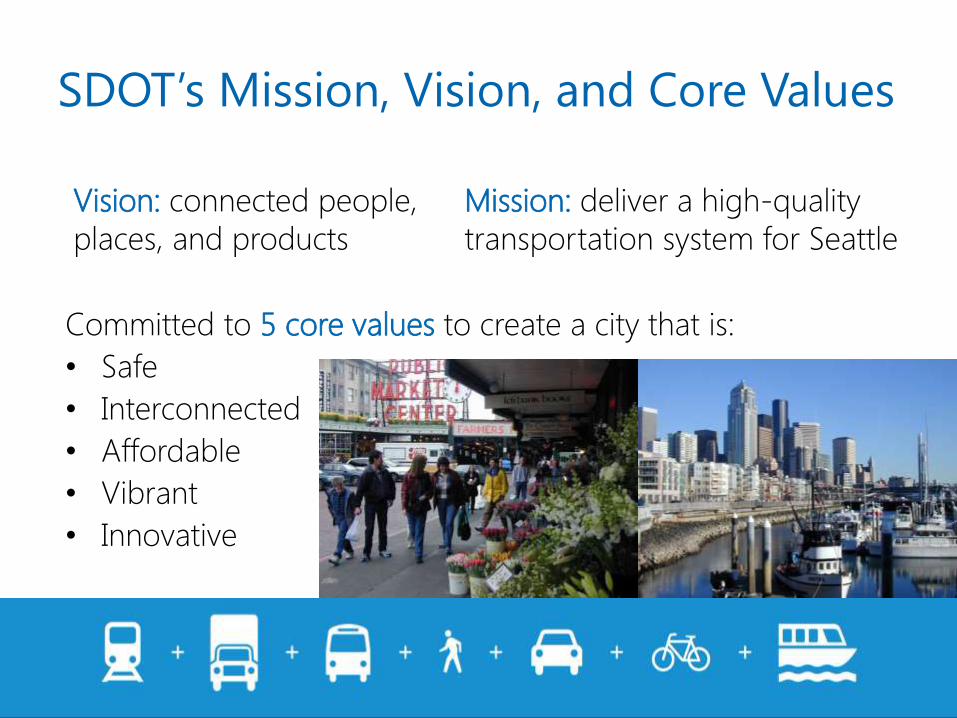
Vision: connected people,
places, and products
Mission: deliver a high-quality
transportation system for Seattle
SDOT’s Mission, Vision, and Core Values
Committed to 5 core values to create a city that is:
• Safe
• Interconnected
• Affordable
• Vibrant
• Innovative
Presentation overview
3
• Background on Seattle
• Vision Zero
• Safety Programs
• Questions/discussion
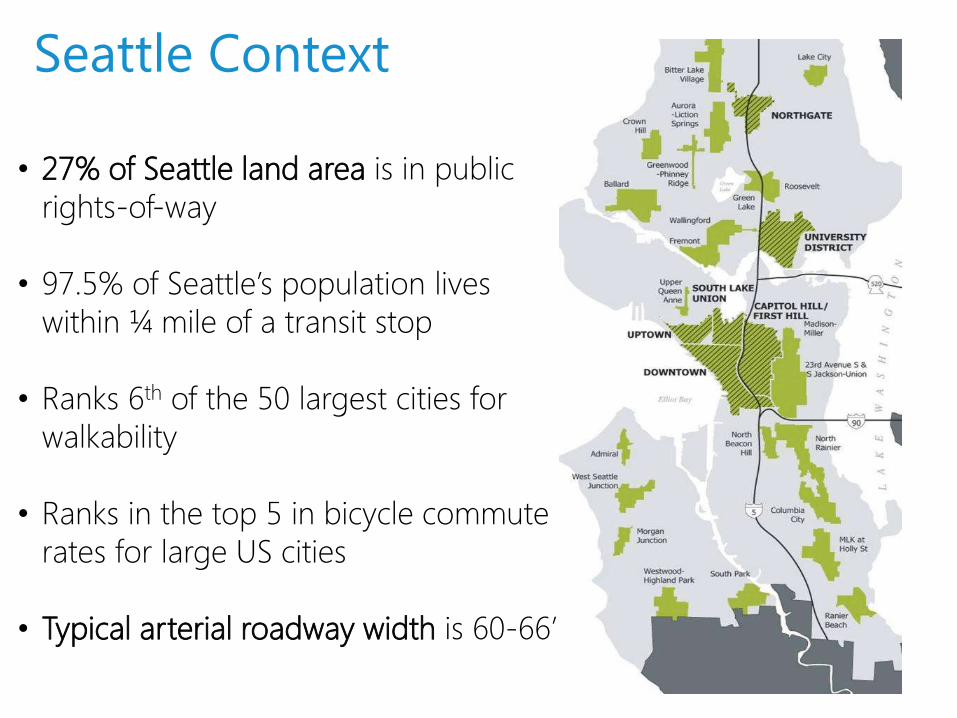
Seattle Context
• 27% of Seattle land area is in public
rights-of-way
• 97.5% of Seattle’s population lives
within ¼ mile of a transit stop
• Ranks 6th of the 50 largest cities for
walkability
• Ranks in the top 5 in bicycle commute
rates for large US cities
• Typical arterial roadway width is 60-66’
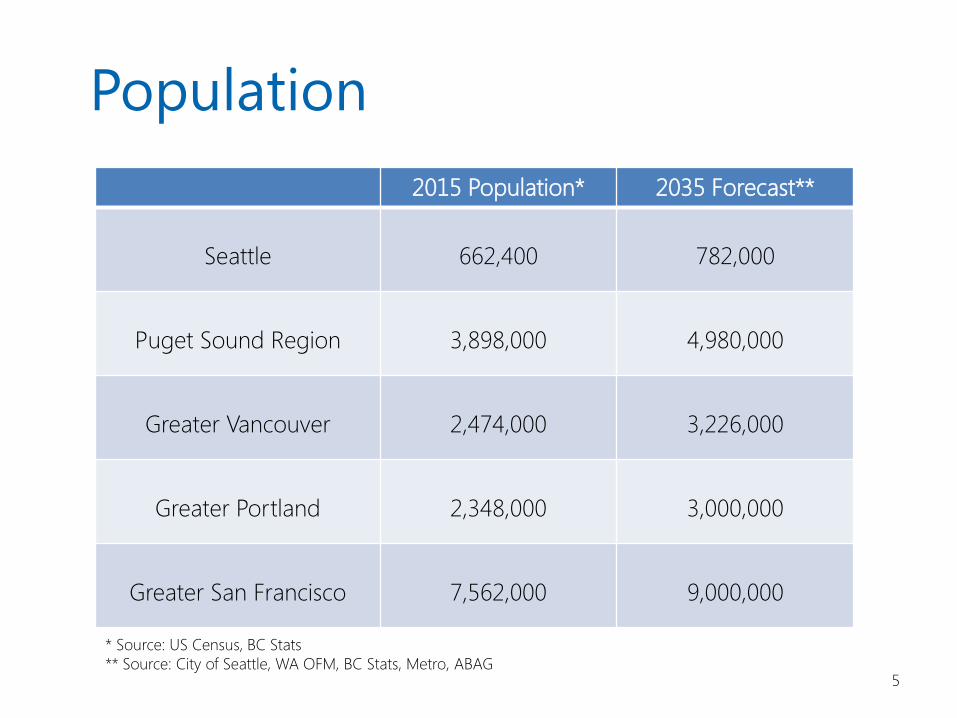
Population
5
2015 Population* 2035 Forecast**
Seattle
662,400
782,000
Puget Sound Region
3,898,000
4,980,000
Greater Vancouver
2,474,000
3,226,000
Greater Portland
2,348,000
3,000,000
Greater San Francisco
7,562,000
9,000,000
* Source: US Census, BC Stats
** Source: City of Seattle, WA OFM, BC Stats, Metro, ABAG
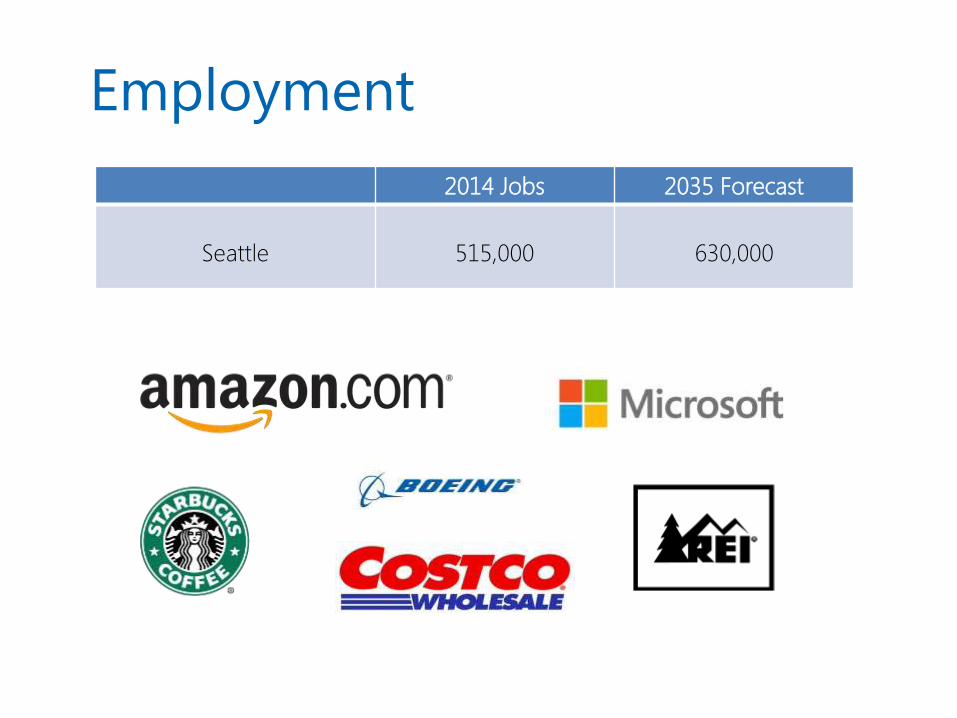
2014 Jobs 2035 Forecast
Seattle
515,000
630,000
Employment
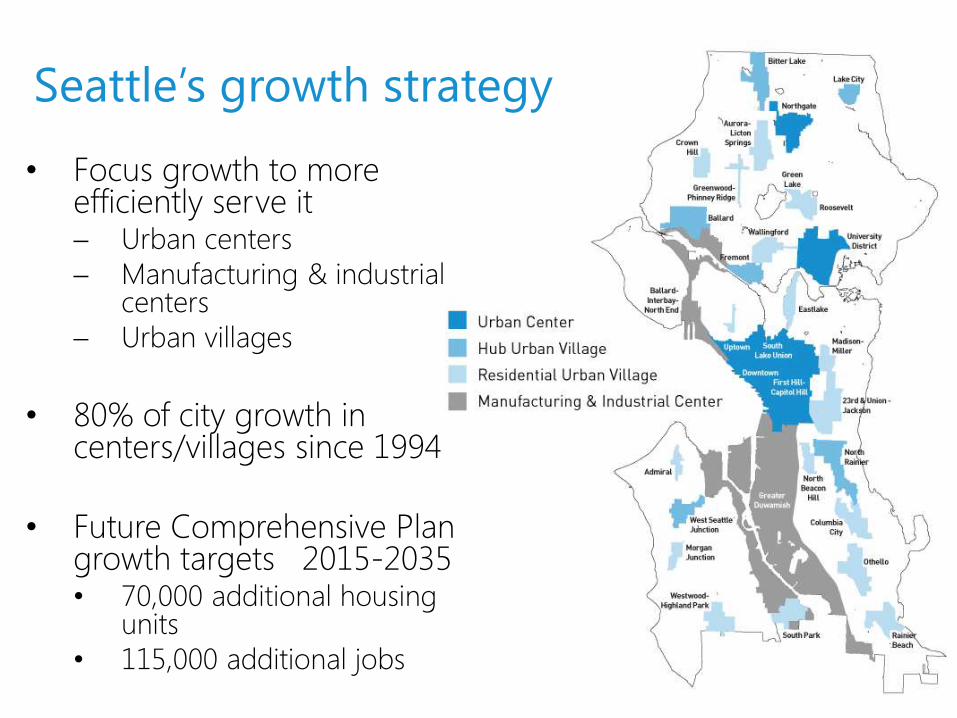
• Focus growth to more efficiently serve it Urban centers
Manufacturing & industrial centers
Urban villages
• 80% of city growth in centers/villages since 1994
• Future Comprehensive Plan growth targets 2015-2035 • 70,000 additional housing
units
• 115,000 additional jobs
Seattle’s growth strategy
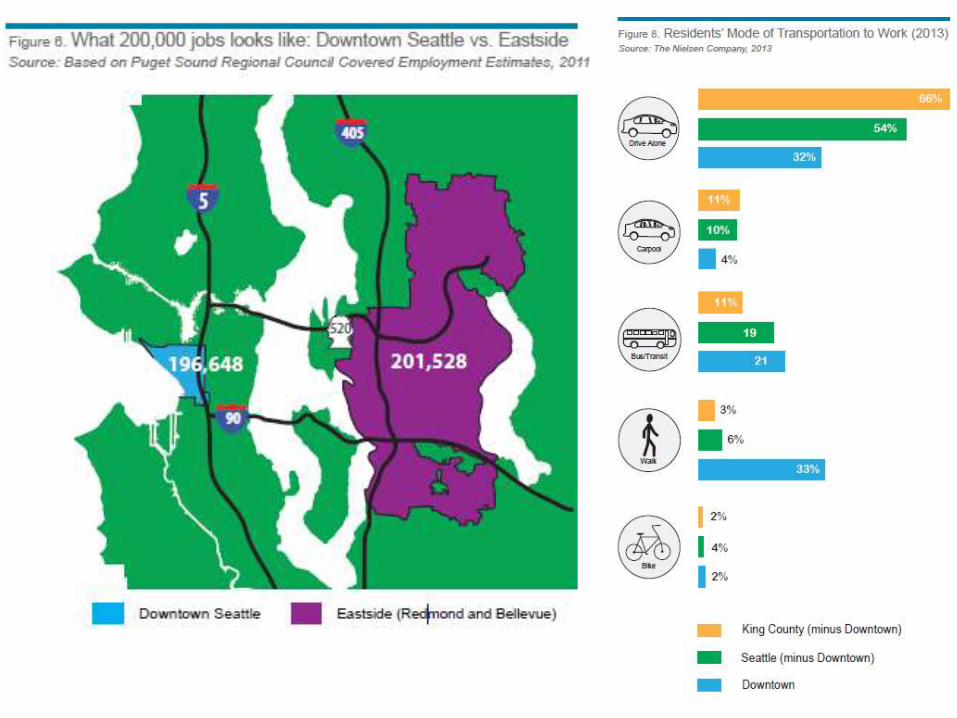
Why is Downtown Important
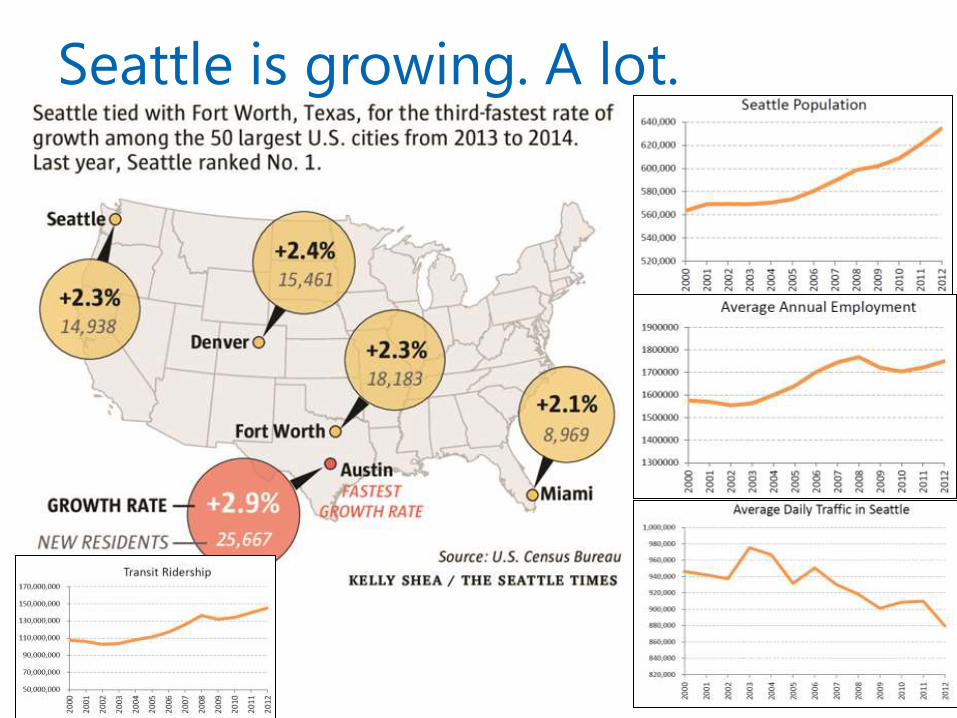
Seattle is growing. A lot.
9
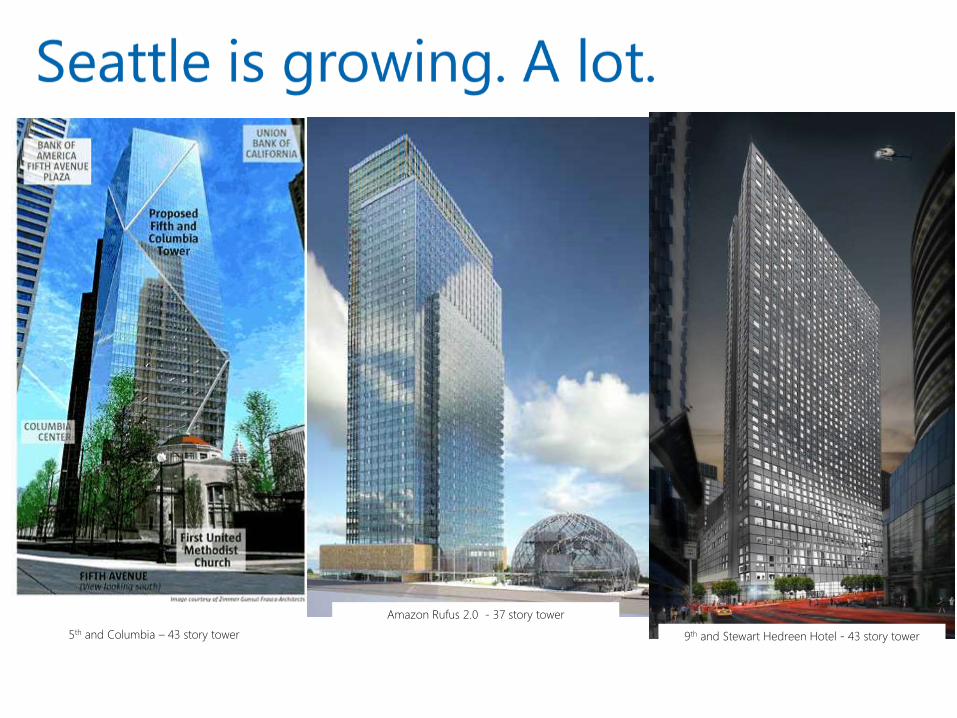
5th and Columbia – 43 story tower 9th and Stewart Hedreen Hotel - 43 story tower
Amazon Rufus 2.0 - 37 story tower
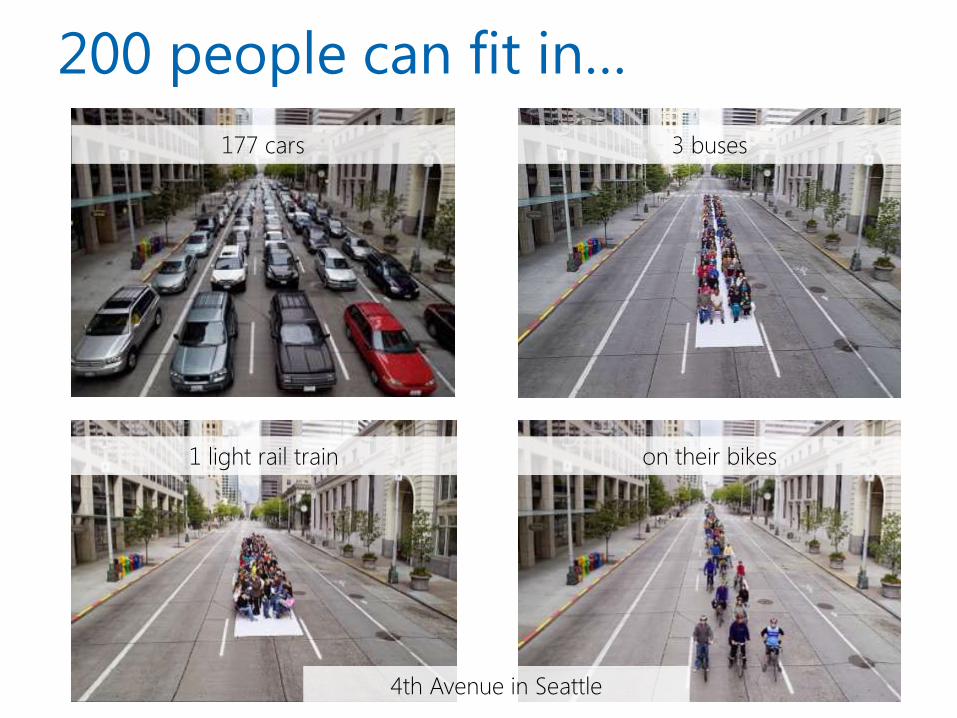
177 cars 3 buses
1 light rail train on their bikes
200 people can fit in…
4th Avenue in Seattle
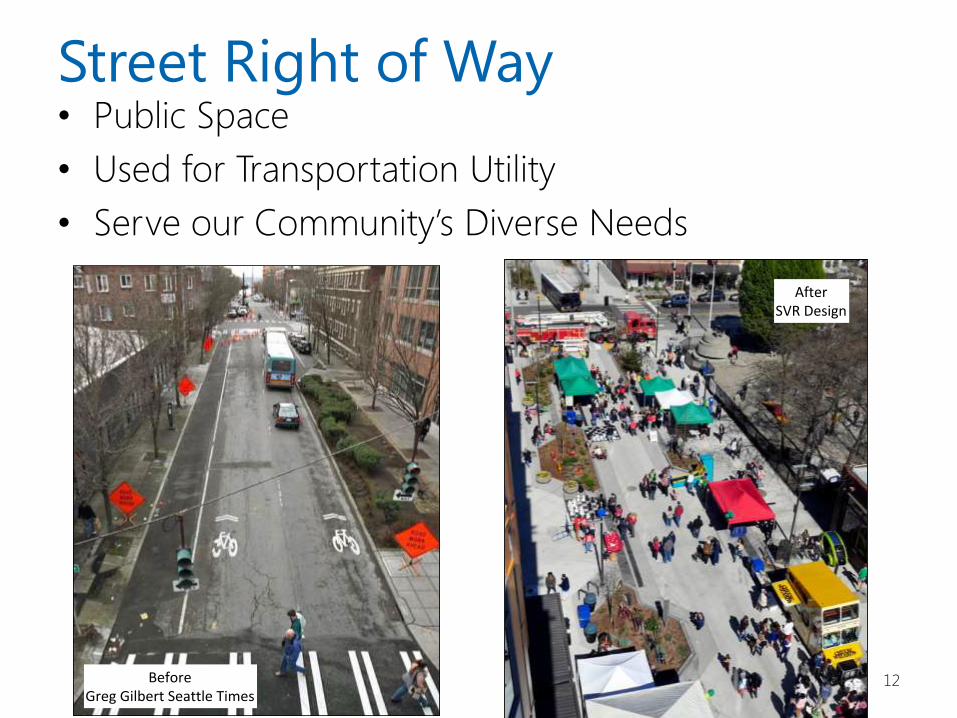
Street Right of Way • Public Space
• Used for Transportation Utility
• Serve our Community’s Diverse Needs
12 BeforeGreg Gilbert Seattle Times
AfterSVR Design
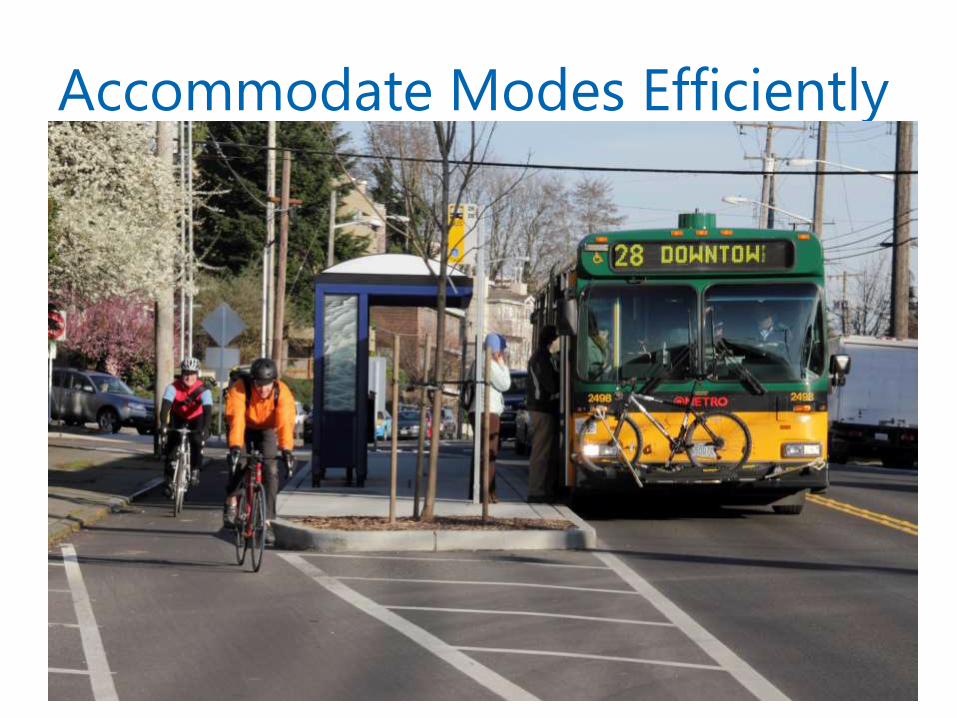
Accommodate Modes Efficiently
13
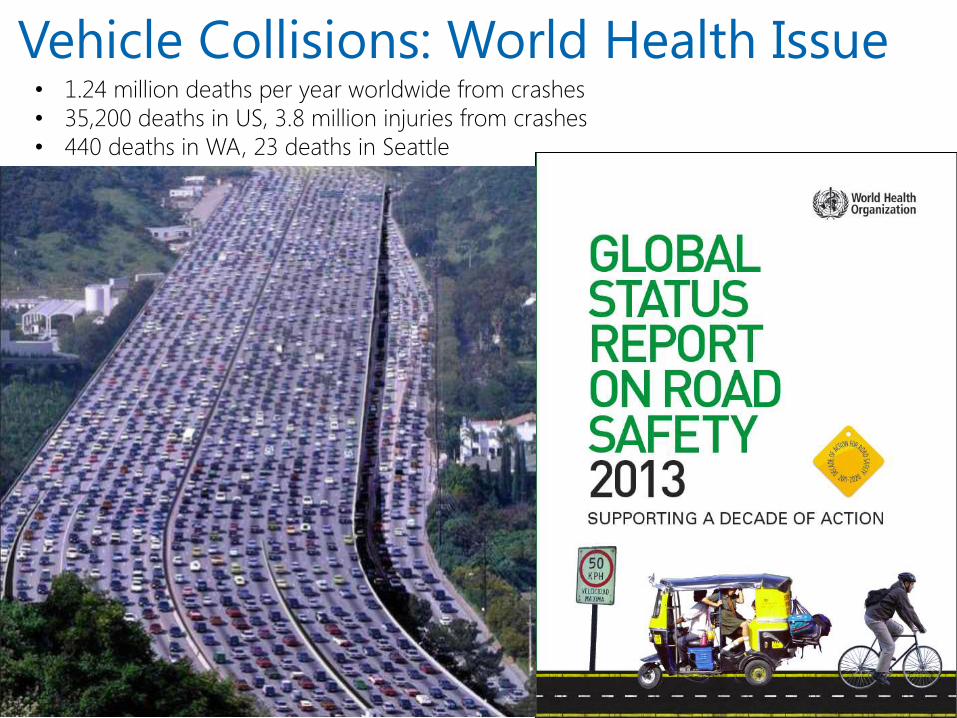
Vehicle Collisions: World Health Issue
14
• 1.24 million deaths per year worldwide from crashes
• 35,200 deaths in US, 3.8 million injuries from crashes
• 440 deaths in WA, 23 deaths in Seattle
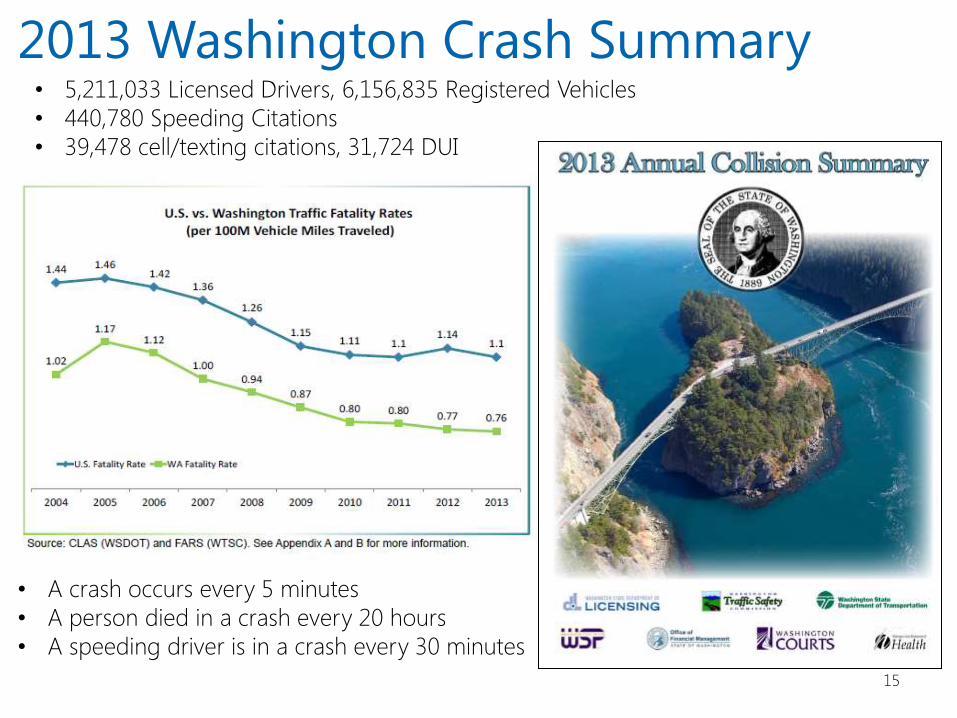
2013 Washington Crash Summary
15
• 5,211,033 Licensed Drivers, 6,156,835 Registered Vehicles
• 440,780 Speeding Citations
• 39,478 cell/texting citations, 31,724 DUI
• A crash occurs every 5 minutes
• A person died in a crash every 20 hours
• A speeding driver is in a crash every 30 minutes
16
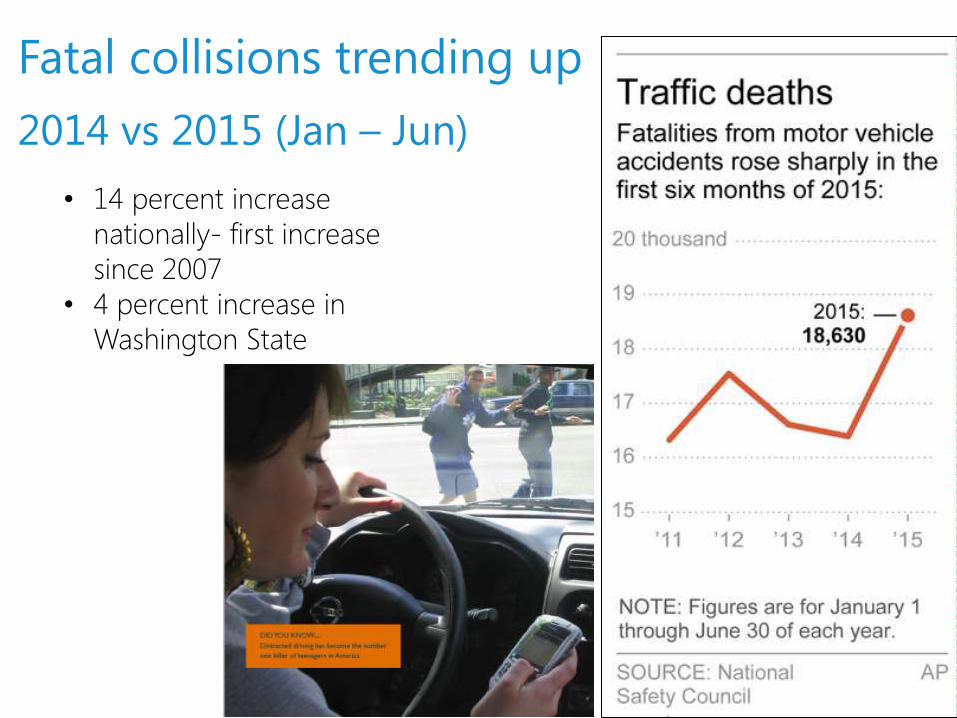
• 14 percent increase
nationally- first increase
since 2007
• 4 percent increase in
Washington State
2014 vs 2015 (Jan – Jun)
Fatal collisions trending up
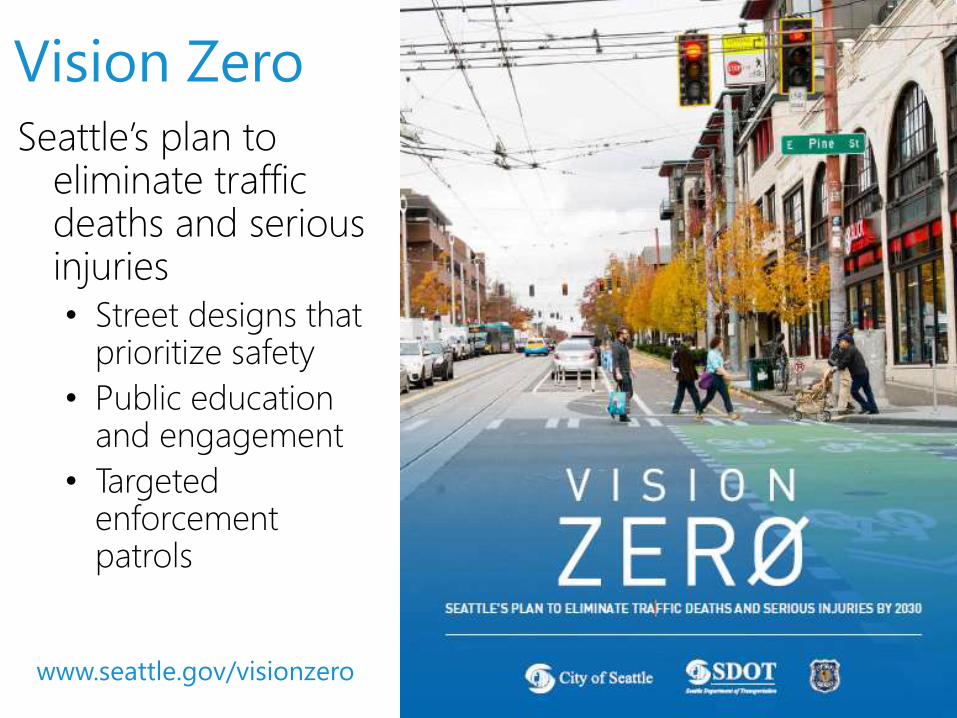
Vision Zero
Seattle’s plan to eliminate traffic deaths and serious injuries
• Street designs that prioritize safety
• Public education and engagement
• Targeted enforcement patrols
17
www.seattle.gov/visionzero
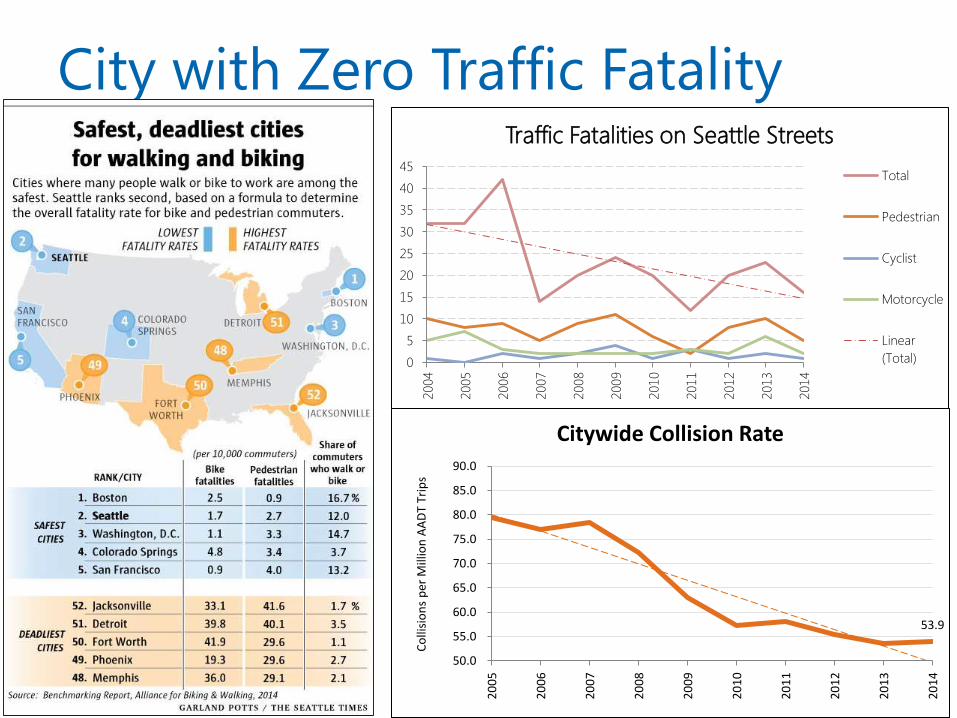
City with Zero Traffic Fatality
18
0
5
10
15
20
25
30
35
40
45
2004
2005
2006
2007
2008
2009
2010
2011
2012
2013
2014
Traffic Fatalities on Seattle Streets
Total
Pedestrian
Cyclist
Motorcycle
Linear
(Total)
53.9
50.0
55.0
60.0
65.0
70.0
75.0
80.0
85.0
90.0
20
05
20
06
20
07
20
08
20
09
20
10
20
11
20
12
20
13
20
14
Co
llisi
on
s p
er M
illio
n A
AD
T Tr
ips
Citywide Collision Rate
19
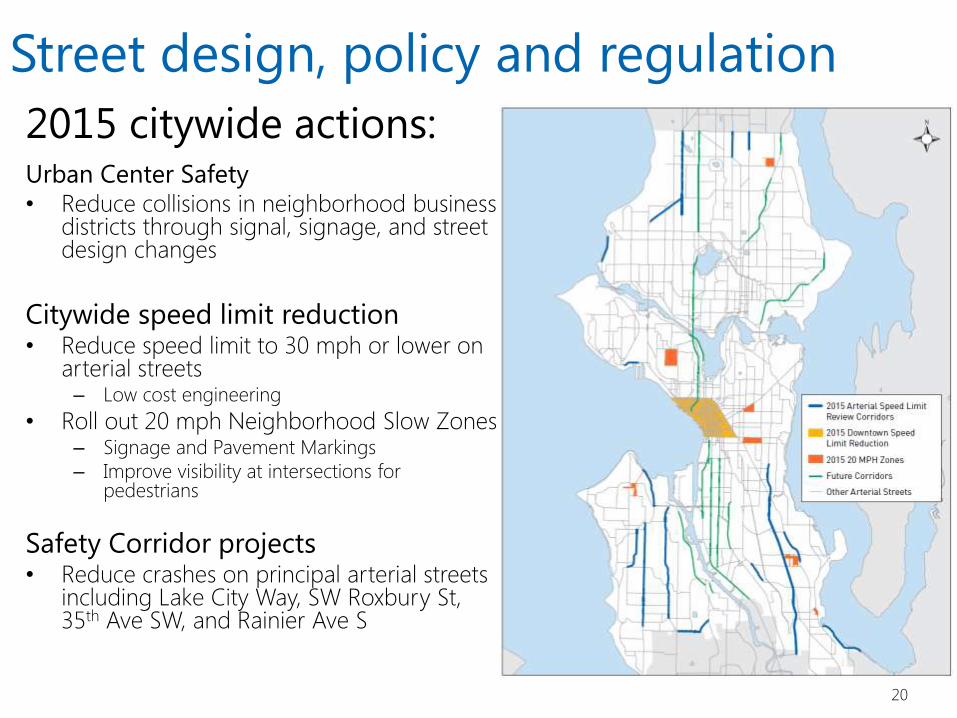
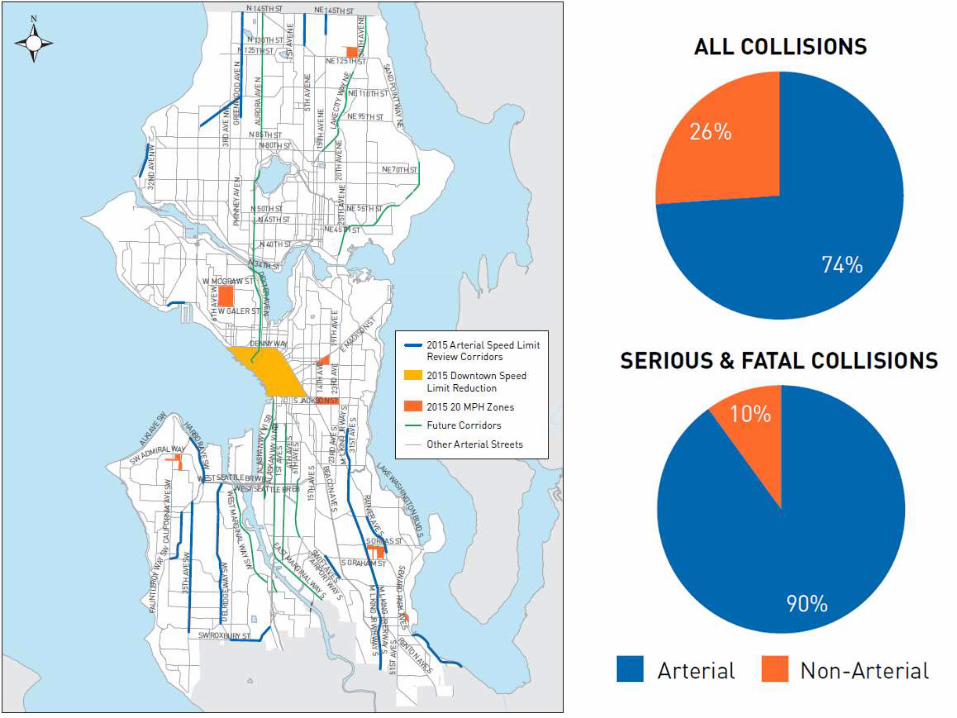
Street design, policy and regulation
Urban Center Safety • Reduce collisions in neighborhood business
districts through signal, signage, and street design changes
Citywide speed limit reduction • Reduce speed limit to 30 mph or lower on
arterial streets – Low cost engineering
• Roll out 20 mph Neighborhood Slow Zones – Signage and Pavement Markings
– Improve visibility at intersections for pedestrians
Safety Corridor projects • Reduce crashes on principal arterial streets
including Lake City Way, SW Roxbury St, 35th Ave SW, and Rainier Ave S
20
2015 citywide actions:
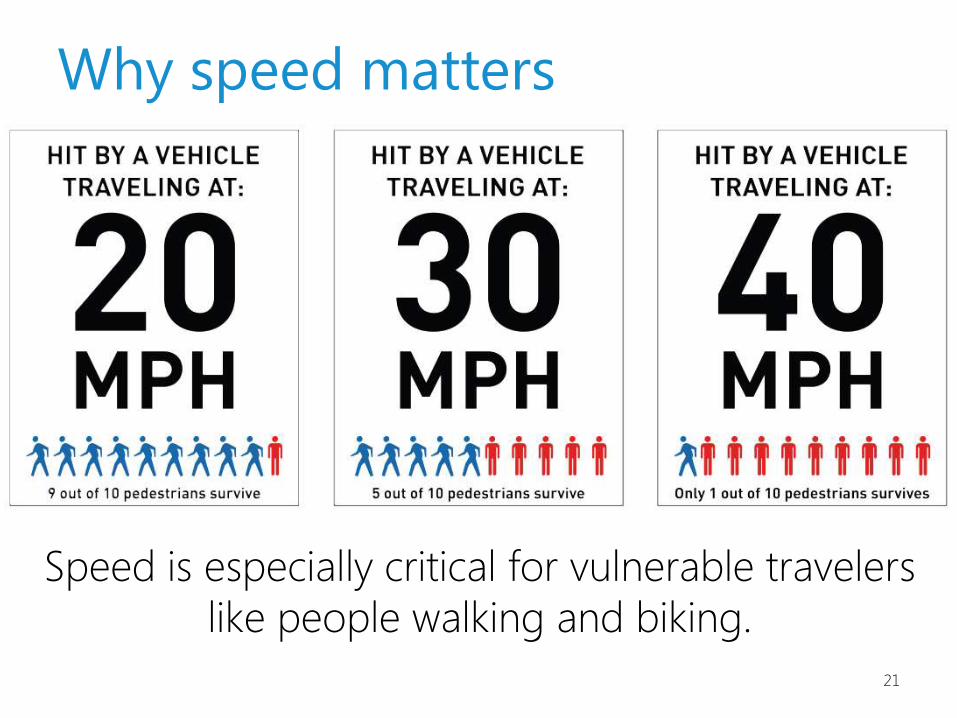
Why speed matters
Speed is especially critical for vulnerable travelers
like people walking and biking.
21
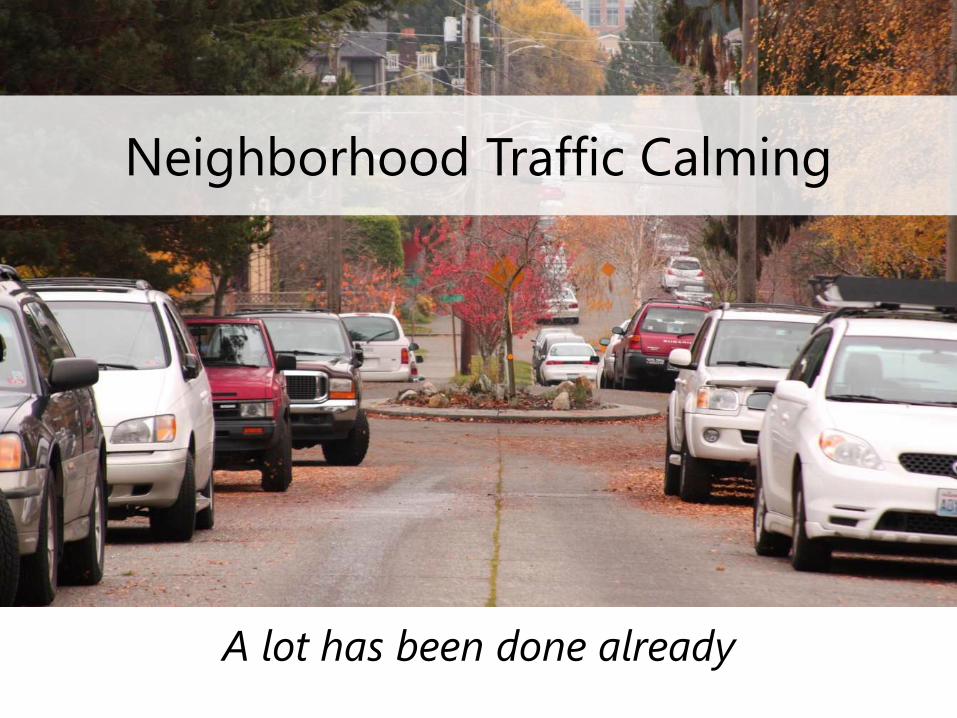
Neighborhood Traffic Calming
A lot has been done already
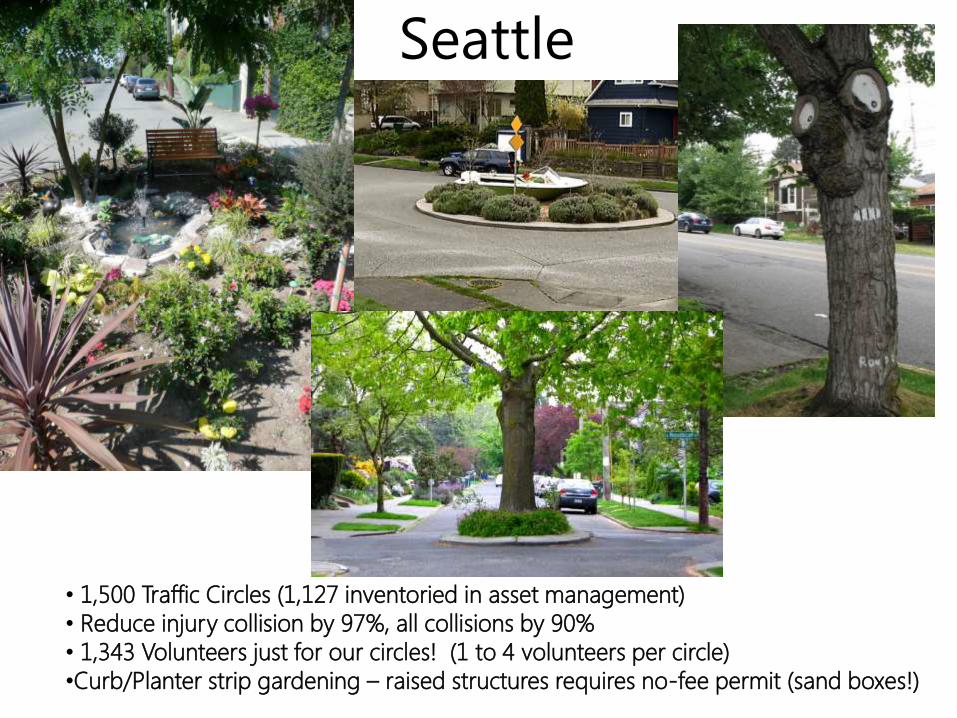
Seattle
• 1,500 Traffic Circles (1,127 inventoried in asset management)
• Reduce injury collision by 97%, all collisions by 90%
• 1,343 Volunteers just for our circles! (1 to 4 volunteers per circle)
•Curb/Planter strip gardening – raised structures requires no-fee permit (sand boxes!)
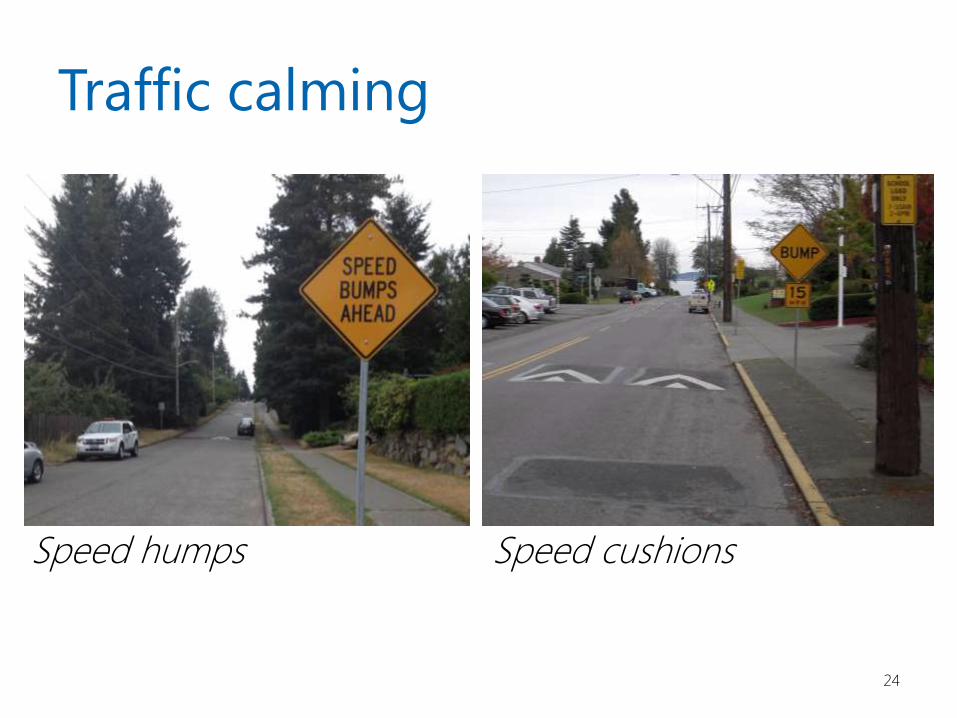
Traffic calming
24
Speed cushions Speed humps
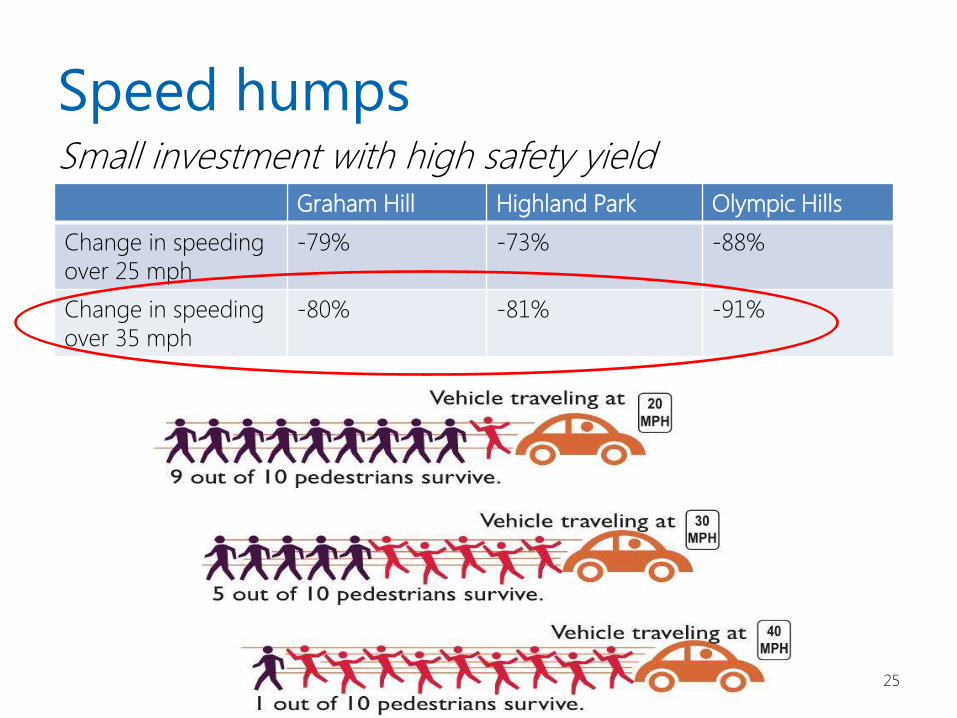
Speed humps
25
Small investment with high safety yield Graham Hill Highland Park Olympic Hills
Change in speeding
over 25 mph
-79% -73% -88%
Change in speeding
over 35 mph
-80% -81% -91%
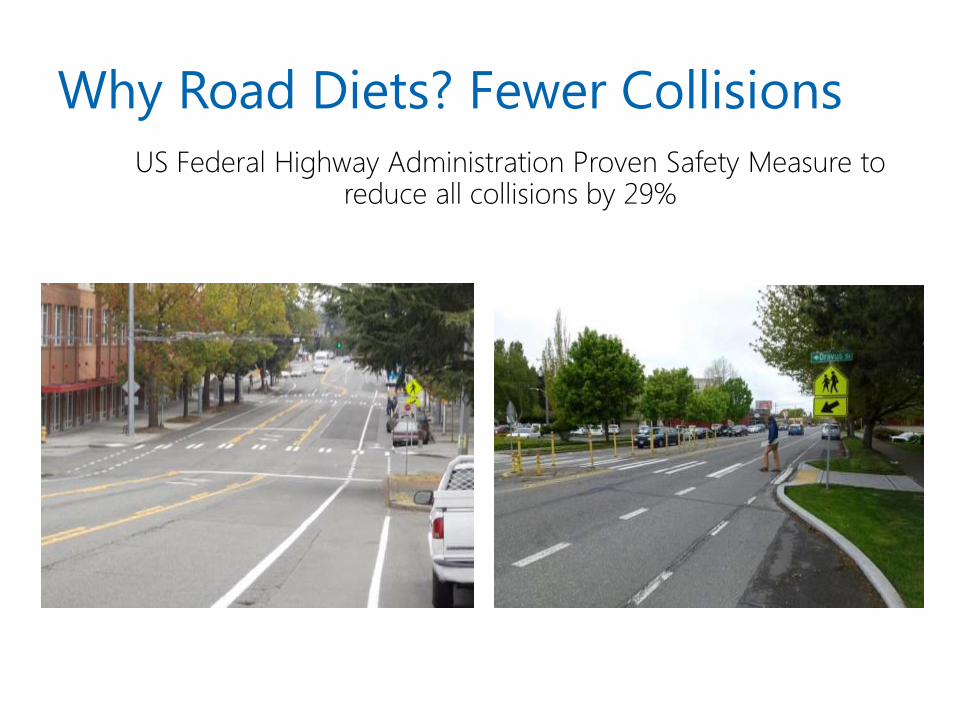
Why Road Diets? Fewer Collisions
US Federal Highway Administration Proven Safety Measure to reduce all collisions by 29%
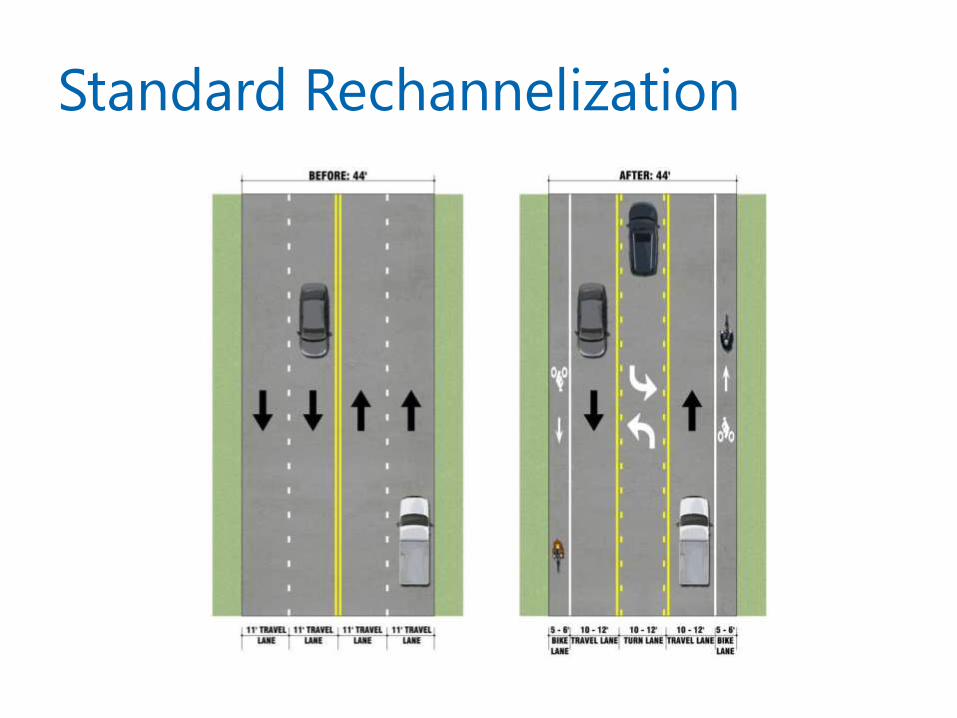
Standard Rechannelization
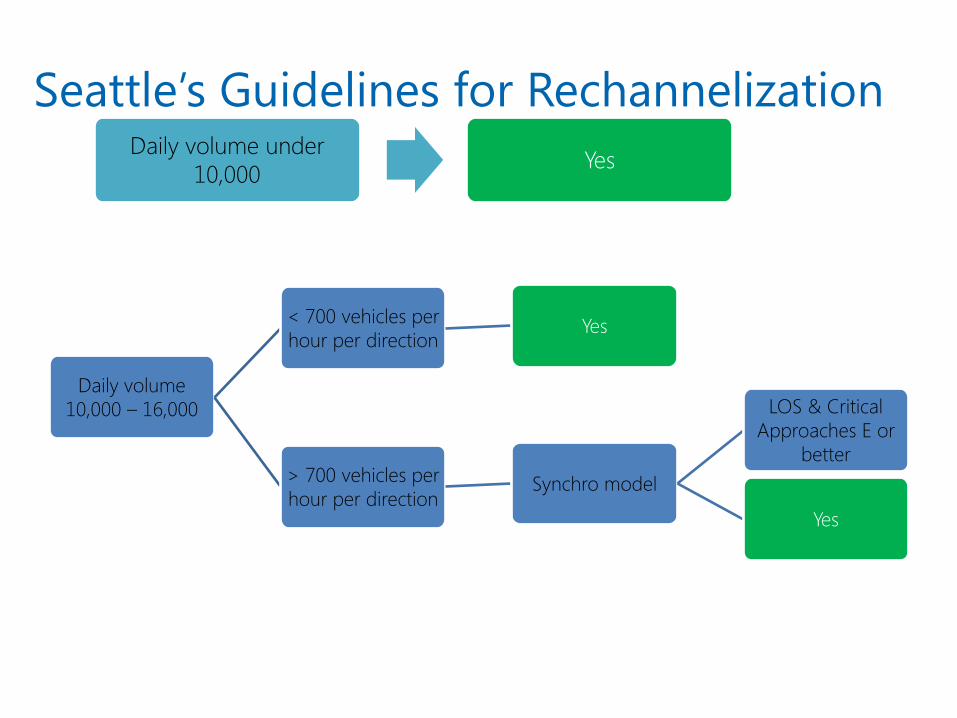
Seattle’s Guidelines for Rechannelization Daily volume under
10,000 Yes
Daily volume
10,000 – 16,000
< 700 vehicles per
hour per direction Yes
> 700 vehicles per
hour per direction Synchro model
LOS & Critical
Approaches E or
better
Yes
Applies to 4-lane or 5-lane to 3-lane conversion
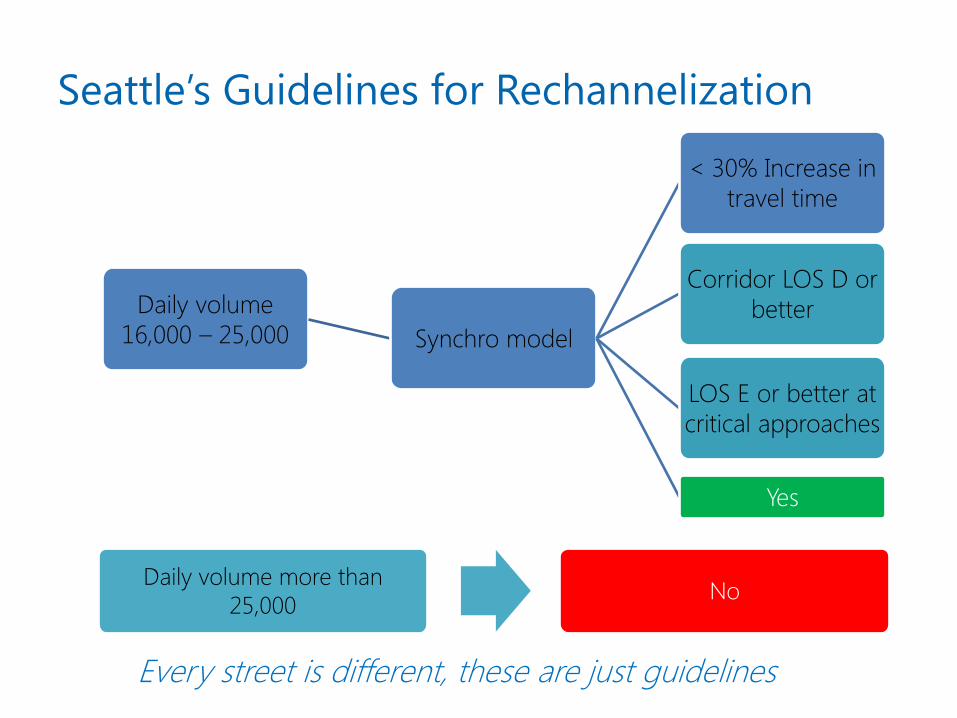
Seattle’s Guidelines for Rechannelization
Daily volume more than
25,000 No
Daily volume
16,000 – 25,000 Synchro model
< 30% Increase in
travel time
Corridor LOS D or
better
LOS E or better at
critical approaches
Yes
Every street is different, these are just guidelines
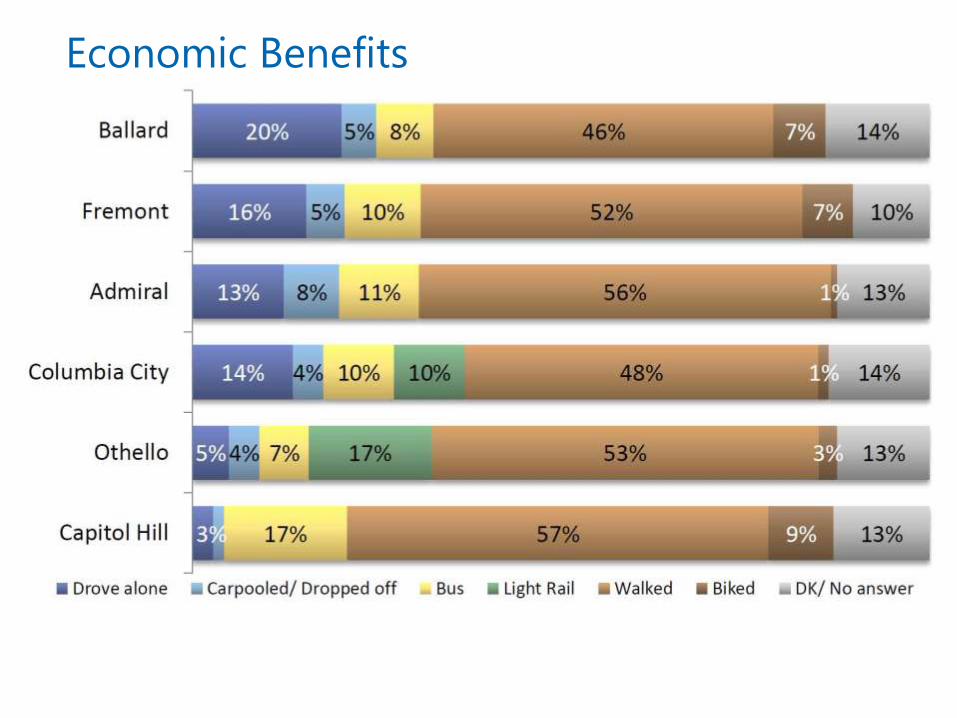
Economic Benefits
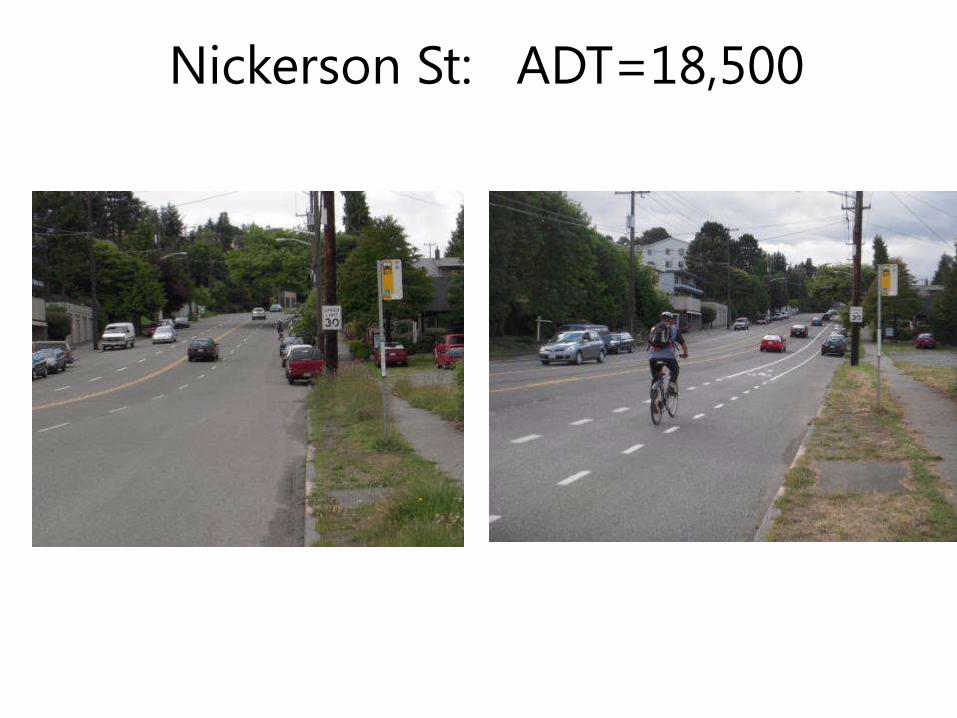
Nickerson St: ADT=18,500
Before
After
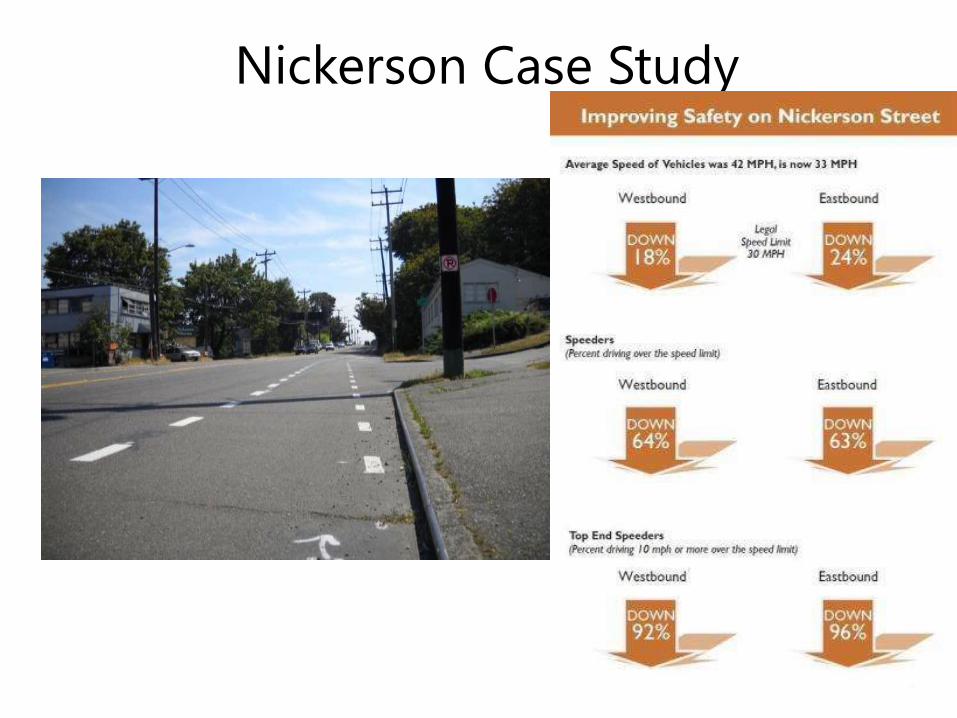
Nickerson Case Study
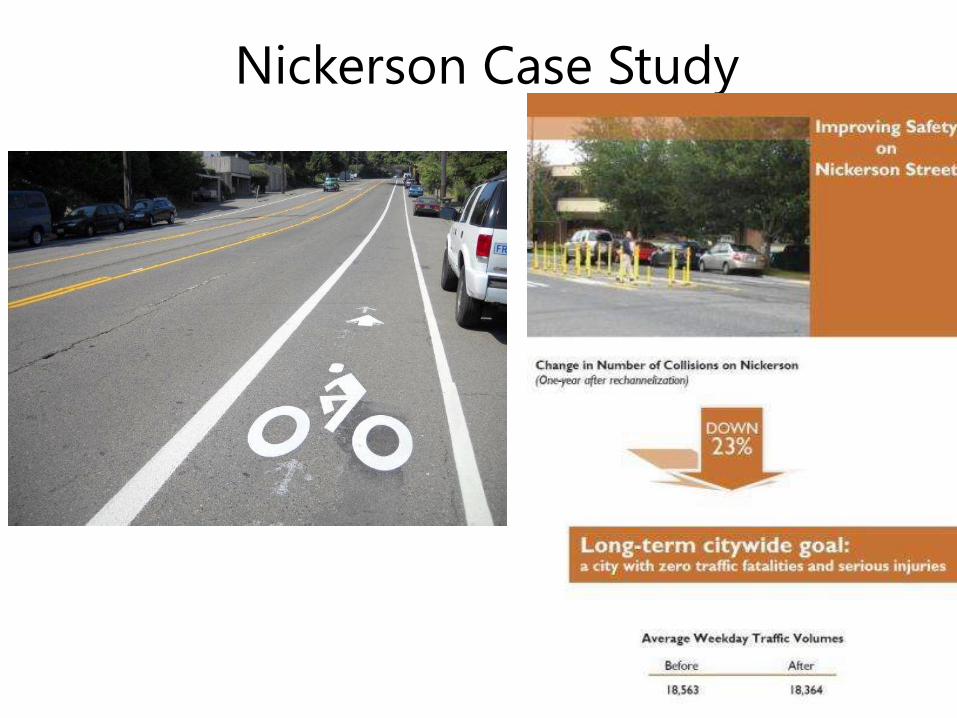
Nickerson Case Study
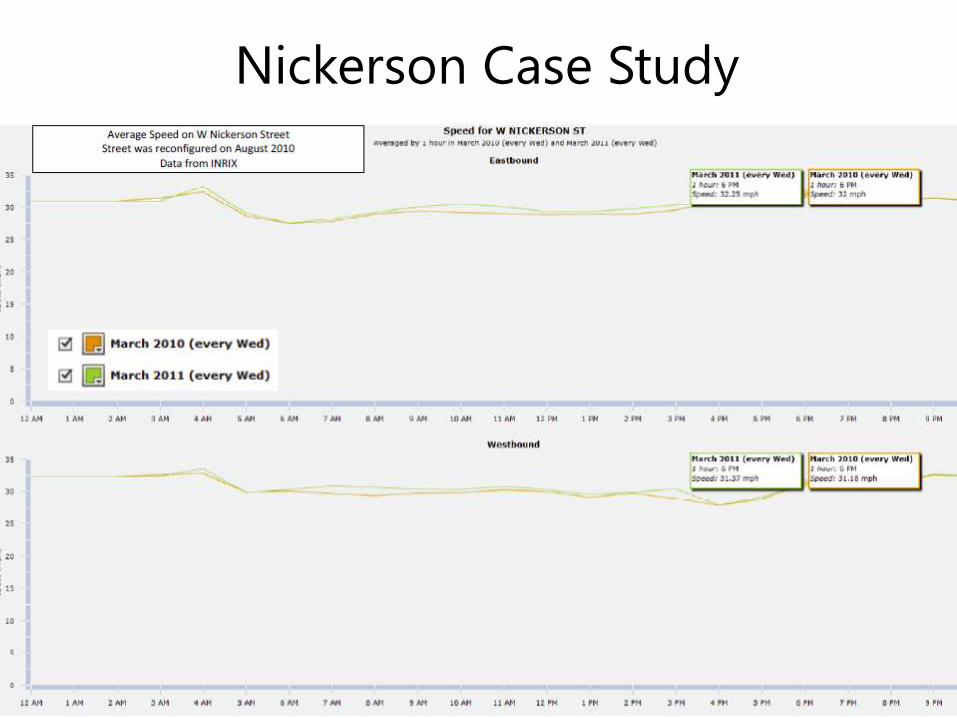
Nickerson Case Study
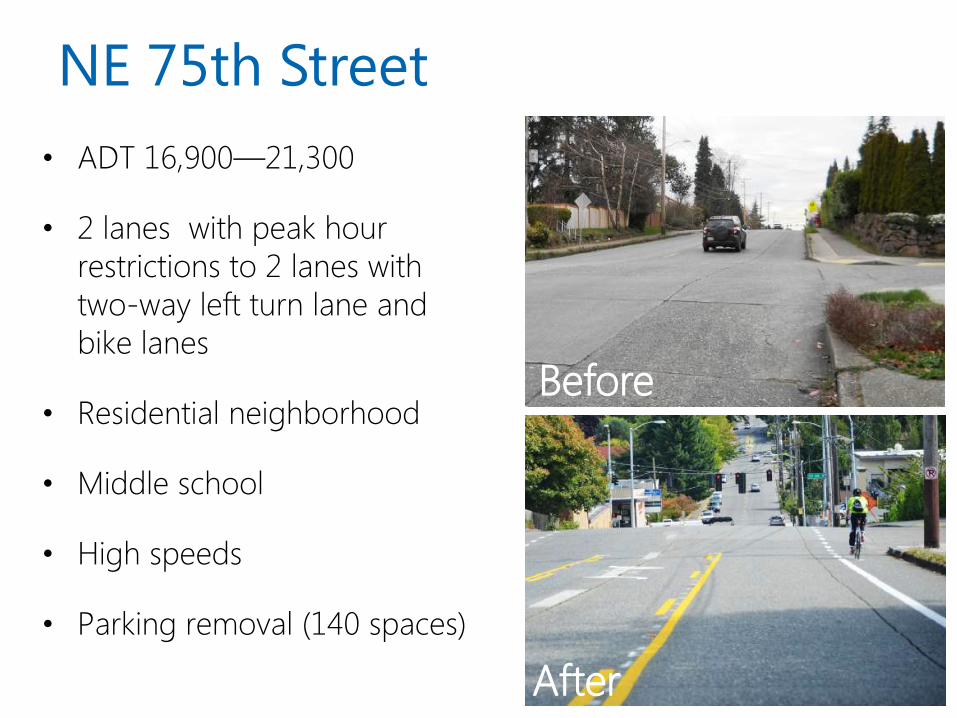
NE 75th Street
Before
After
• ADT 16,900—21,300
• 2 lanes with peak hour
restrictions to 2 lanes with
two-way left turn lane and
bike lanes
• Residential neighborhood
• Middle school
• High speeds
• Parking removal (140 spaces)
36
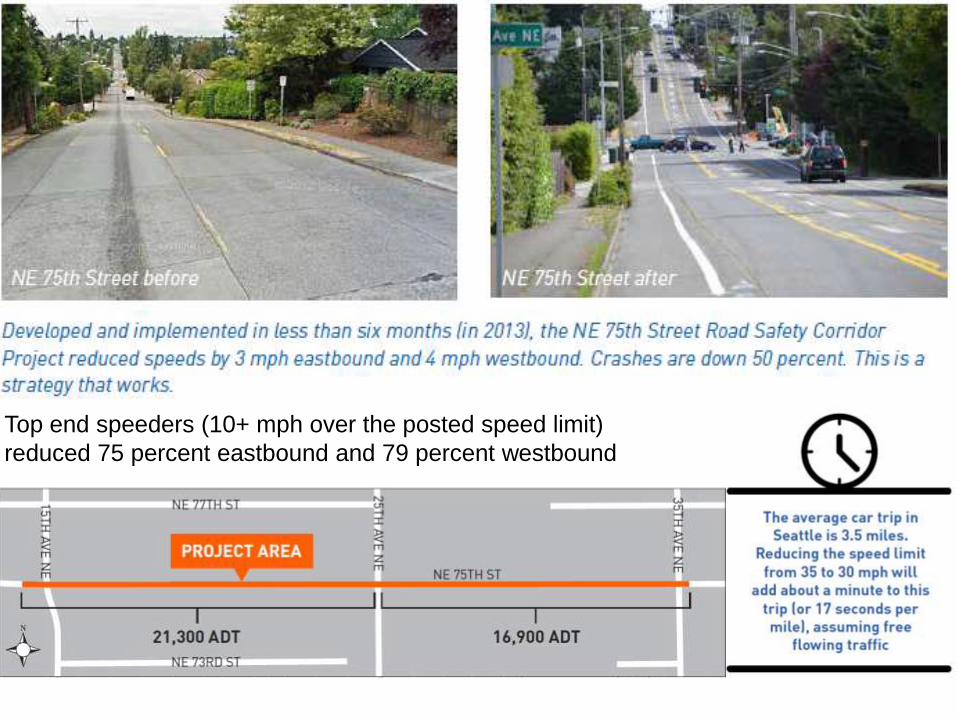
Top end speeders (10+ mph over the posted speed limit)
reduced 75 percent eastbound and 79 percent westbound
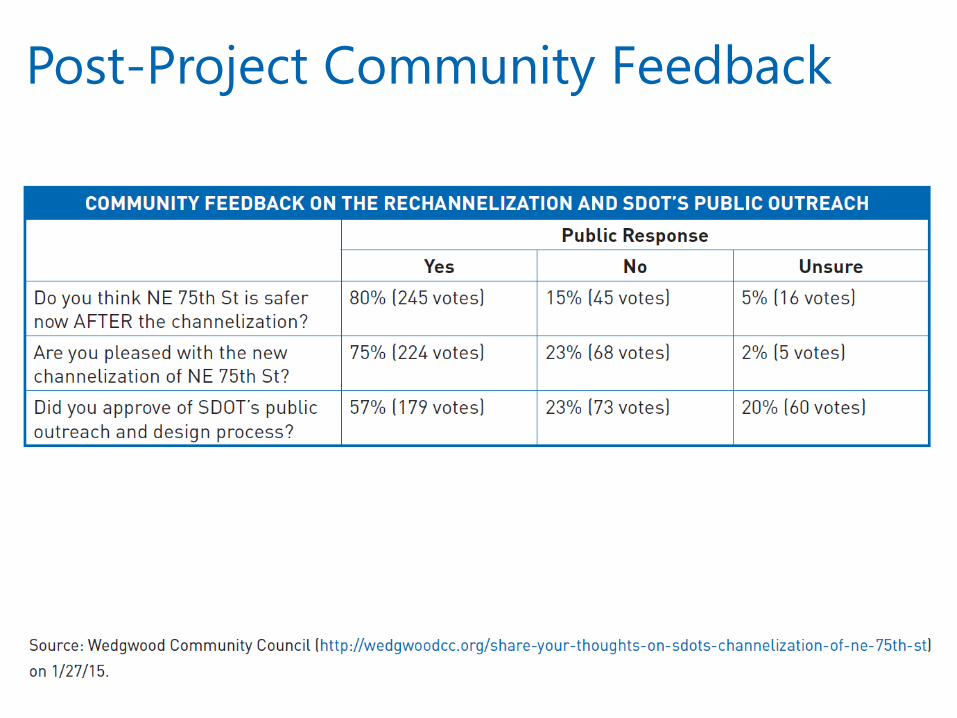
Post-Project Community Feedback
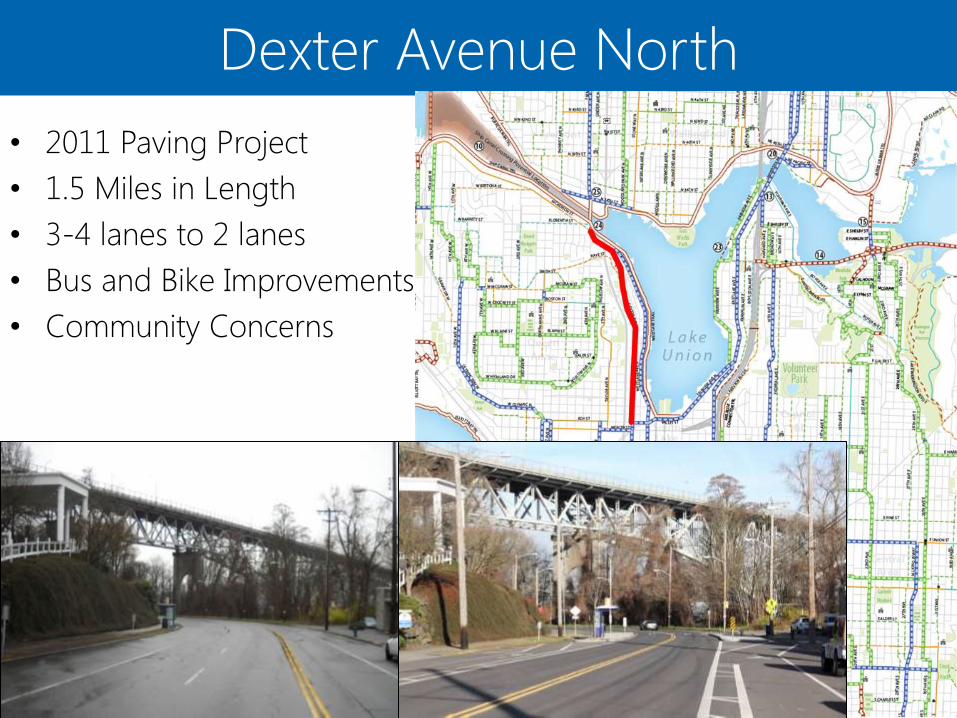
• 2011 Paving Project
• 1.5 Miles in Length
• 3-4 lanes to 2 lanes
• Bus and Bike Improvements
• Community Concerns
Dexter Avenue North
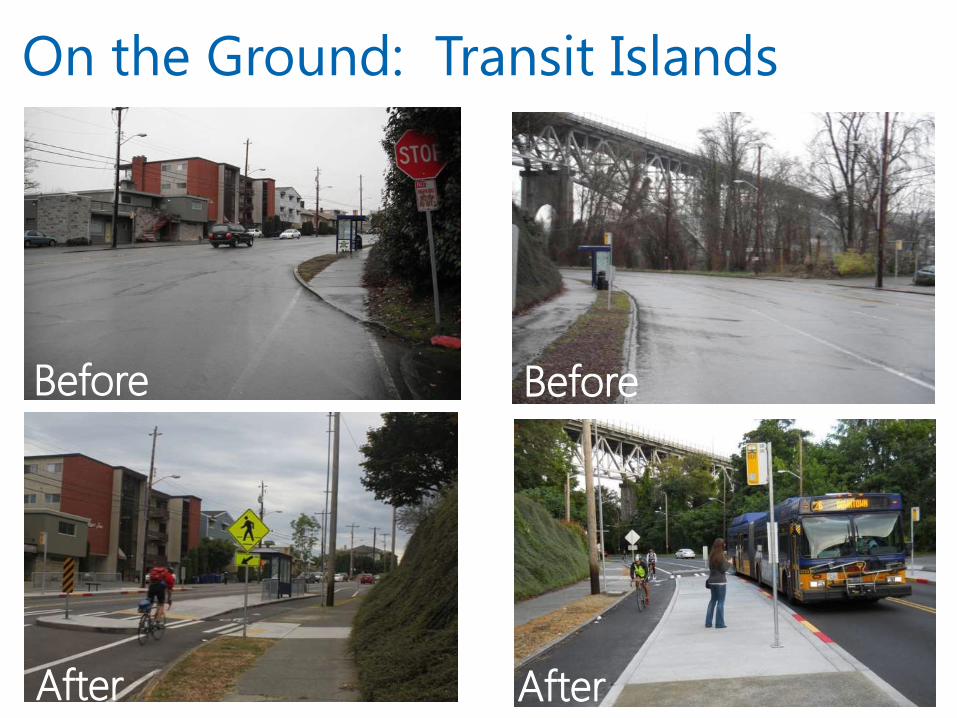
On the Ground: Transit Islands
Before
After
Before
After
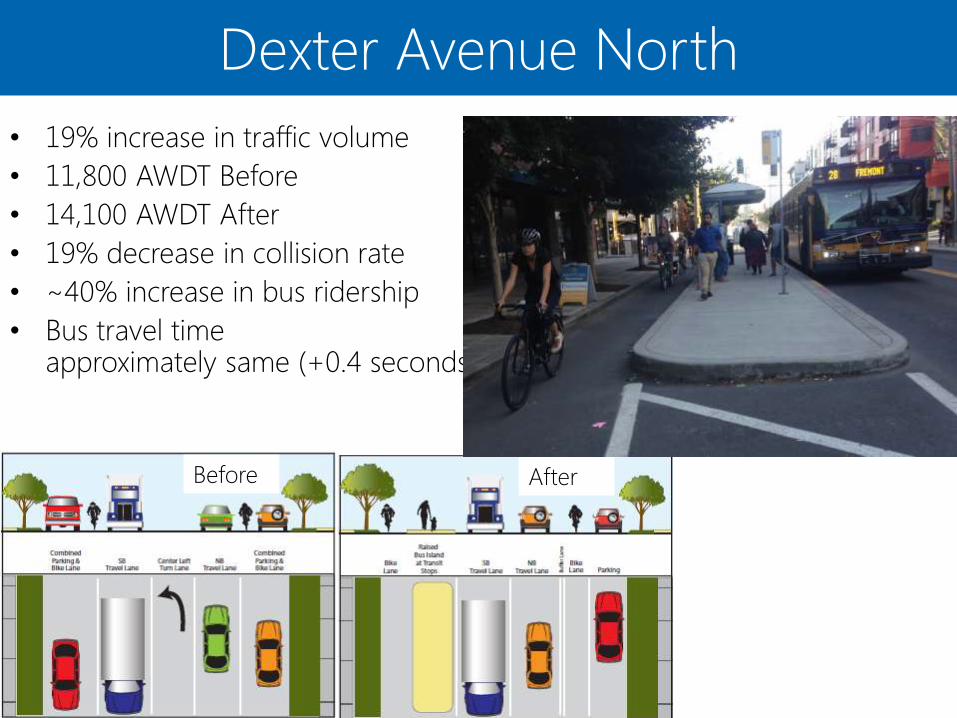
• 19% increase in traffic volume
• 11,800 AWDT Before
• 14,100 AWDT After
• 19% decrease in collision rate
• ~40% increase in bus ridership
• Bus travel time approximately same (+0.4 seconds)
Dexter Avenue North
Before After
Dexter Avenue North
0
50
100
150
200
250
300
350
400
Sale
s In
dex
Fiscal Quarter
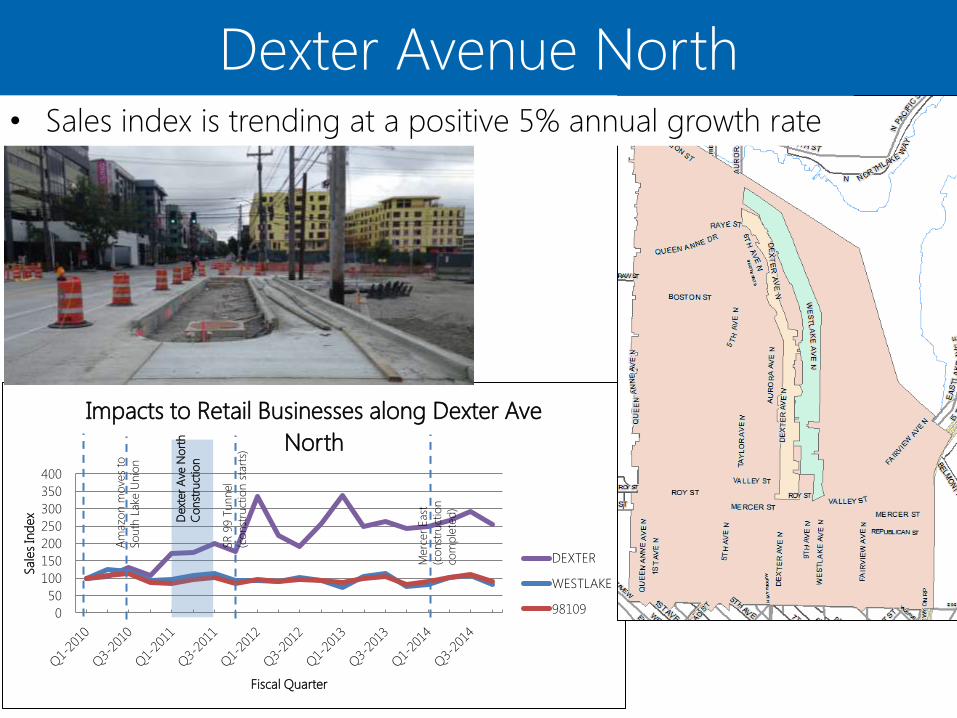
Impacts to Retail Businesses along Dexter Ave
North
DEXTER
WESTLAKE
98109
Dext
er
Ave
No
rth
Co
nst
ruct
ion
SR
99 T
unnel
(co
nst
ruct
ion s
tart
s)
Merc
er
East
(co
nst
ruct
ion
com
ple
ted
)
Am
azo
n m
ove
s to
So
uth
Lake
Unio
n
• Sales index is trending at a positive 5% annual growth rate
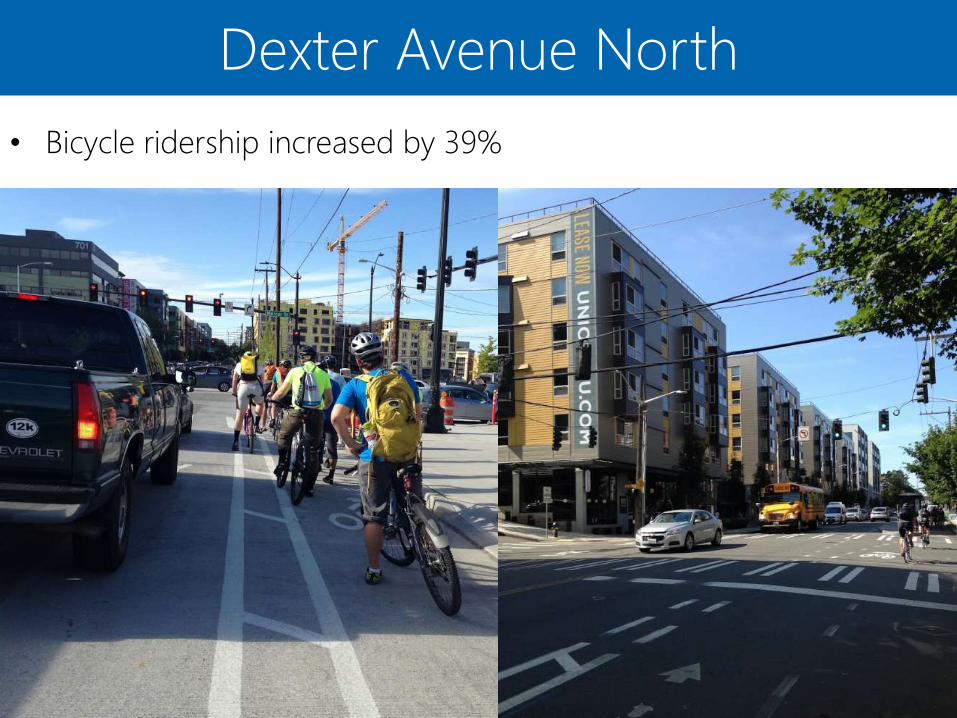
• Bicycle ridership increased by 39%
Dexter Avenue North
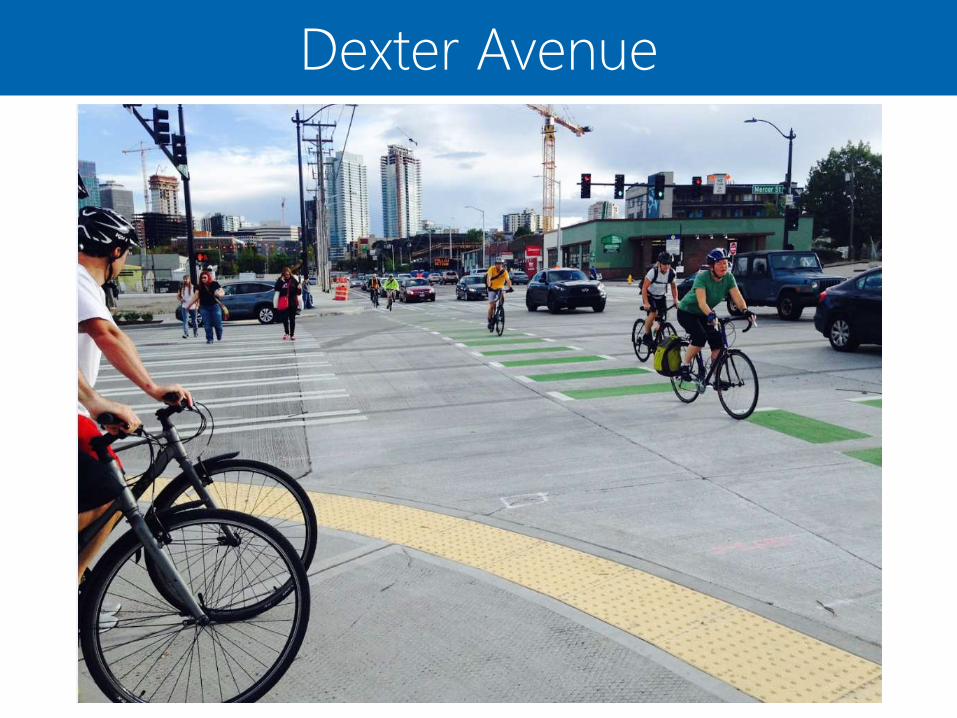
Dexter Avenue
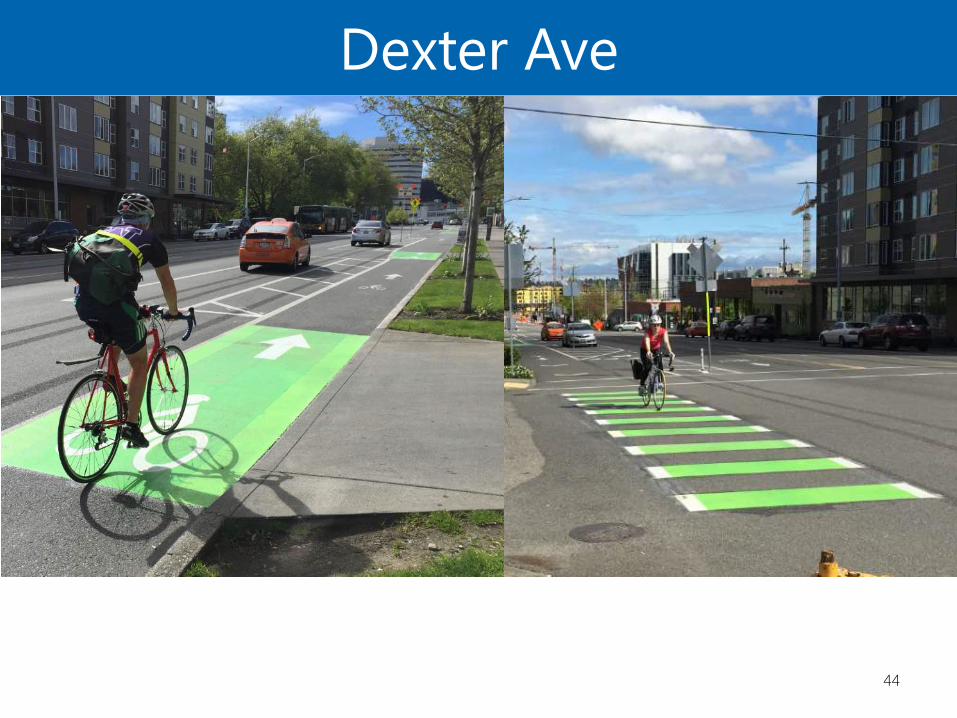
Dexter Ave
44
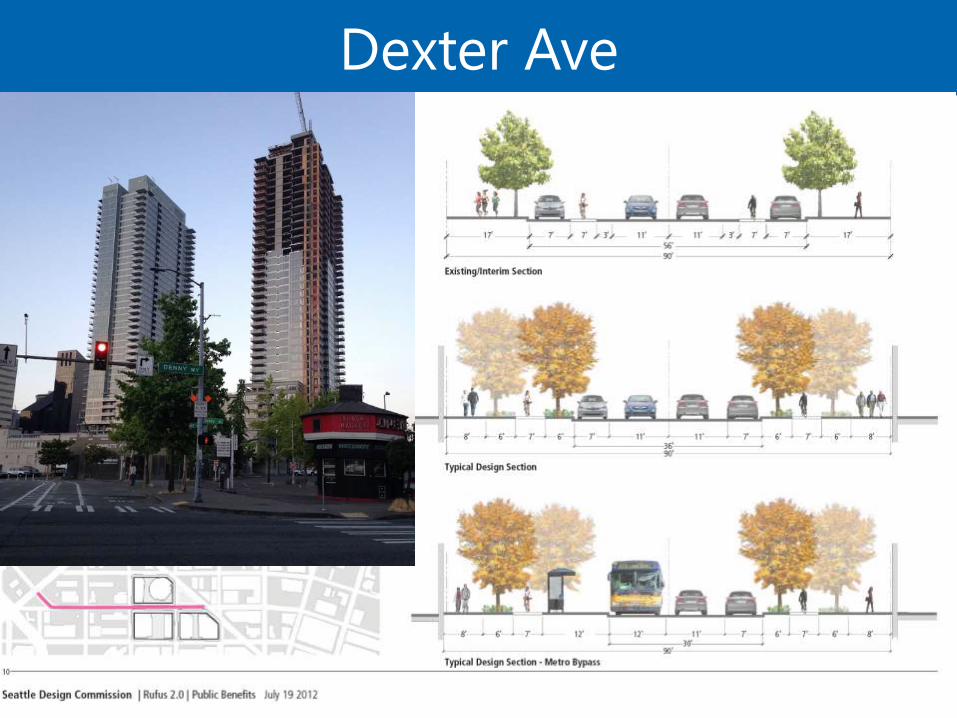
Dexter Ave
45
46
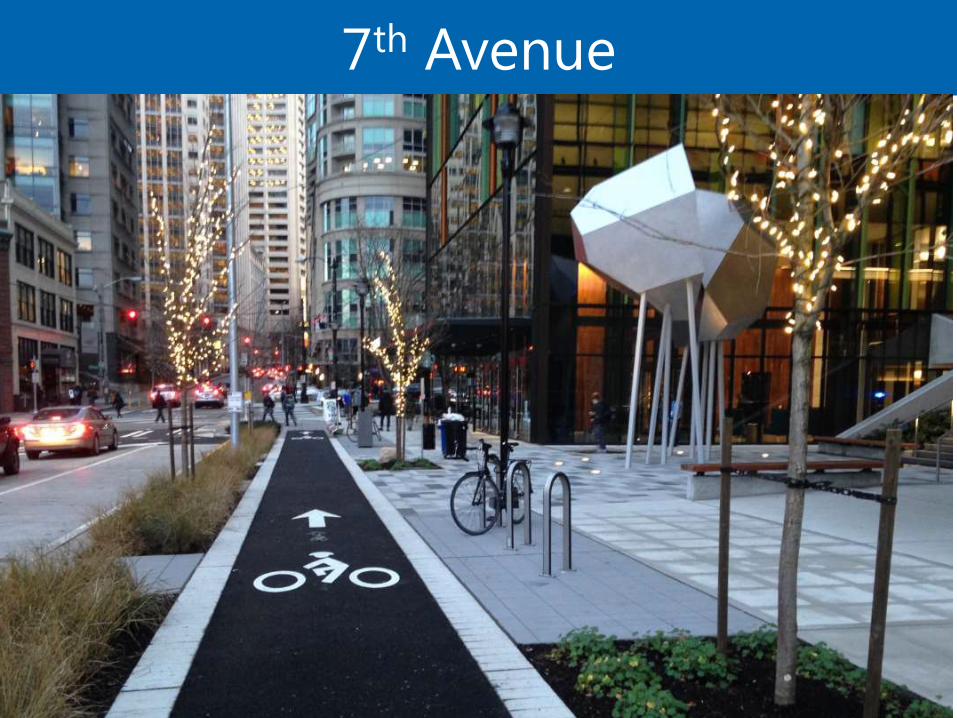
7th Avenue
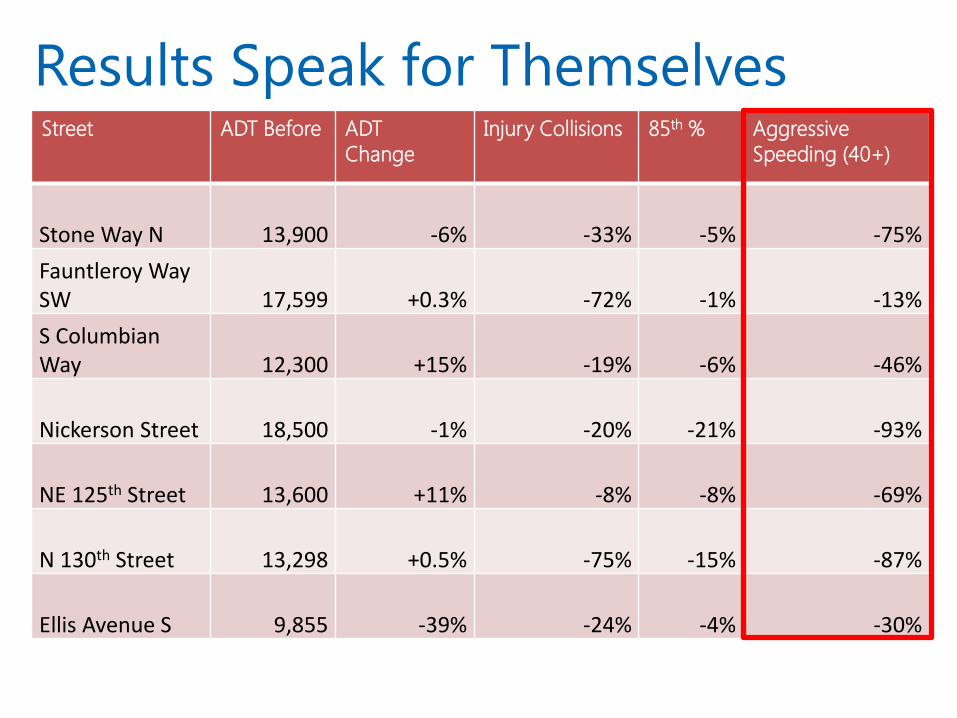
Results Speak for Themselves Street ADT Before ADT
Change
Injury Collisions 85th % Aggressive
Speeding (40+)
Stone Way N 13,900 -6% -33% -5% -75%
Fauntleroy Way SW 17,599 +0.3% -72% -1% -13%
S Columbian Way 12,300 +15% -19% -6% -46%
Nickerson Street 18,500 -1% -20% -21% -93%
NE 125th Street 13,600 +11% -8% -8% -69%
N 130th Street 13,298 +0.5% -75% -15% -87%
Ellis Avenue S 9,855 -39% -24% -4% -30%
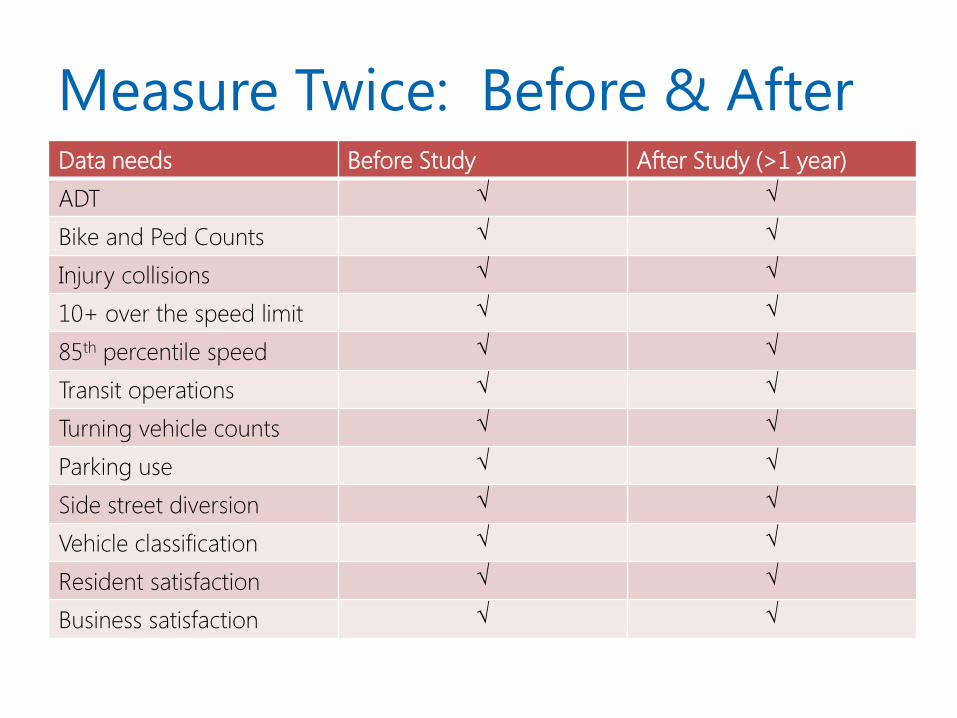
Measure Twice: Before & After Data needs Before Study After Study (>1 year)
ADT √ √
Bike and Ped Counts √ √
Injury collisions √ √
10+ over the speed limit √ √
85th percentile speed √ √
Transit operations √ √
Turning vehicle counts √ √
Parking use √ √
Side street diversion √ √
Vehicle classification √ √
Resident satisfaction √ √
Business satisfaction √ √
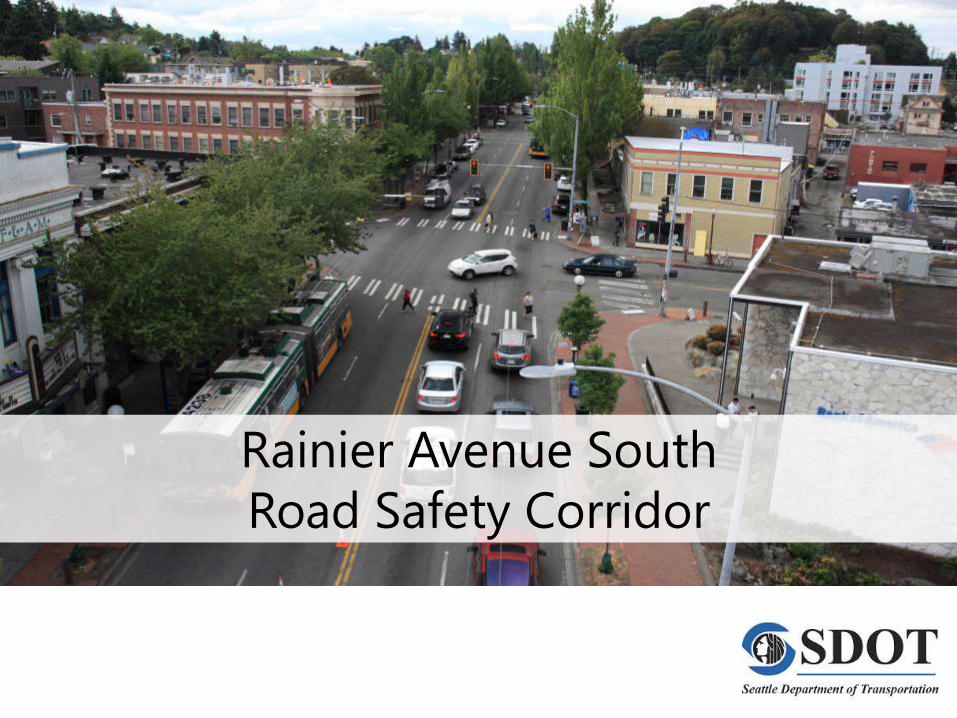
Rainier Avenue South
Road Safety Corridor
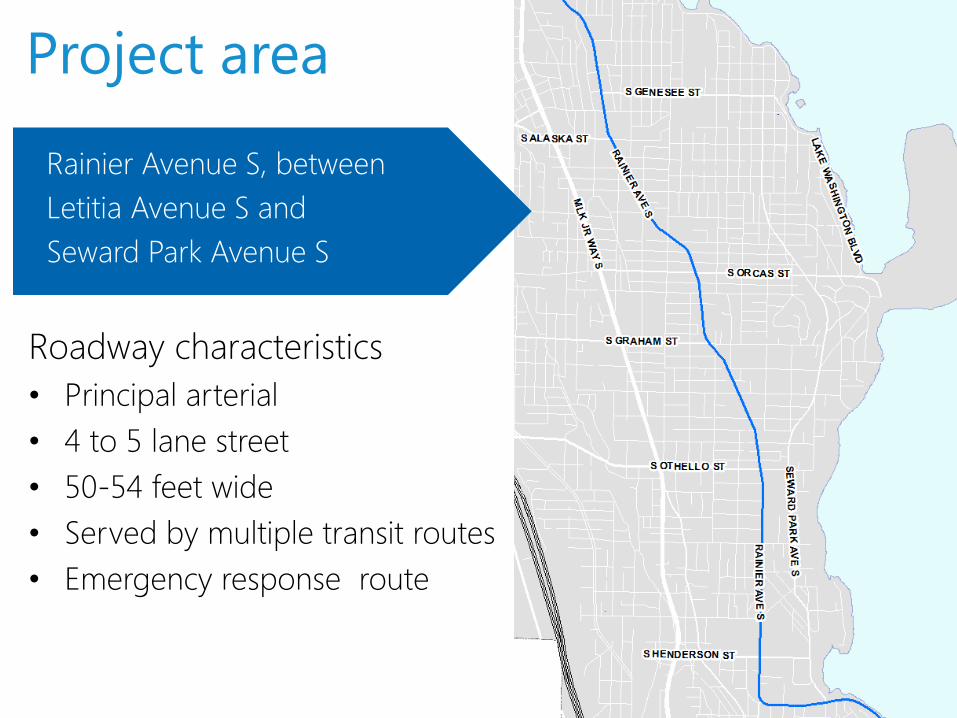
Project area
Roadway characteristics
• Principal arterial
• 4 to 5 lane street
• 50-54 feet wide
• Served by multiple transit routes
• Emergency response route
Rainier Avenue S, between
Letitia Avenue S and
Seward Park Avenue S
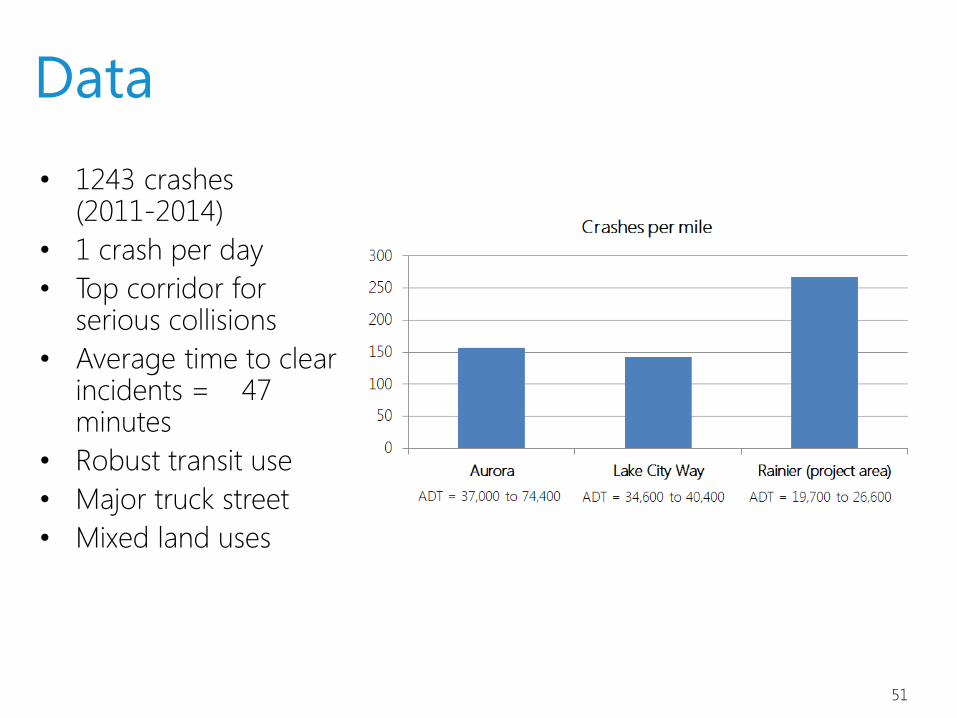
Data
51
• 1243 crashes (2011-2014)
• 1 crash per day
• Top corridor for serious collisions
• Average time to clear incidents = 47 minutes
• Robust transit use
• Major truck street
• Mixed land uses
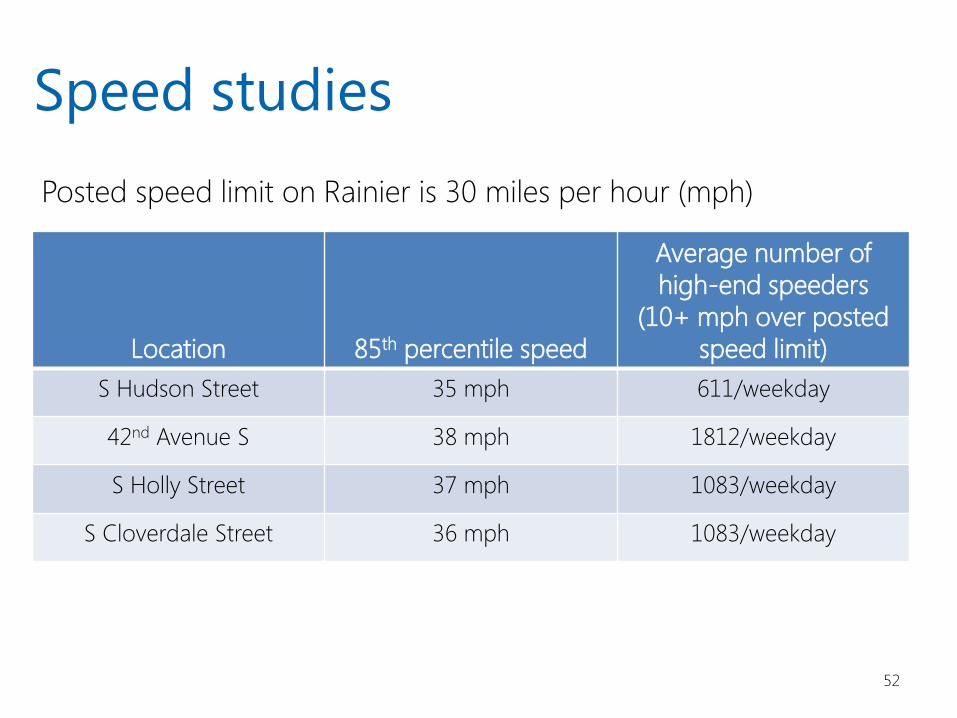
Speed studies
52
Posted speed limit on Rainier is 30 miles per hour (mph)
Location 85th percentile speed
Average number of
high-end speeders
(10+ mph over posted
speed limit)
S Hudson Street 35 mph 611/weekday
42nd Avenue S 38 mph 1812/weekday
S Holly Street 37 mph 1083/weekday
S Cloverdale Street 36 mph 1083/weekday
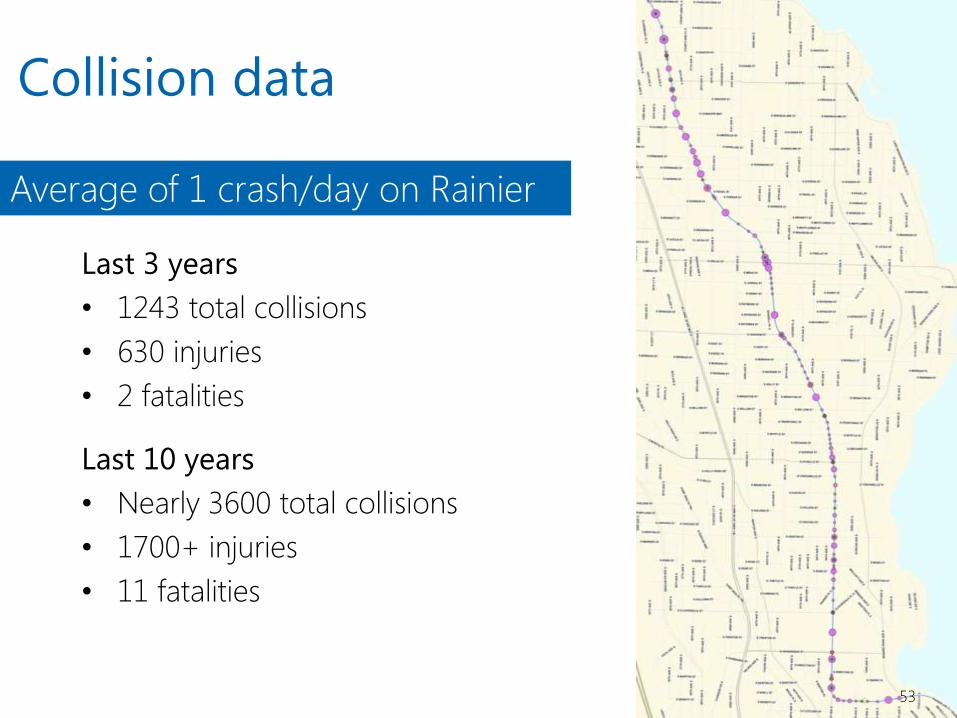
Collision data
Last 3 years
• 1243 total collisions
• 630 injuries
• 2 fatalities
Last 10 years
• Nearly 3600 total collisions
• 1700+ injuries
• 11 fatalities
53
Average of 1 crash/day on Rainier
53
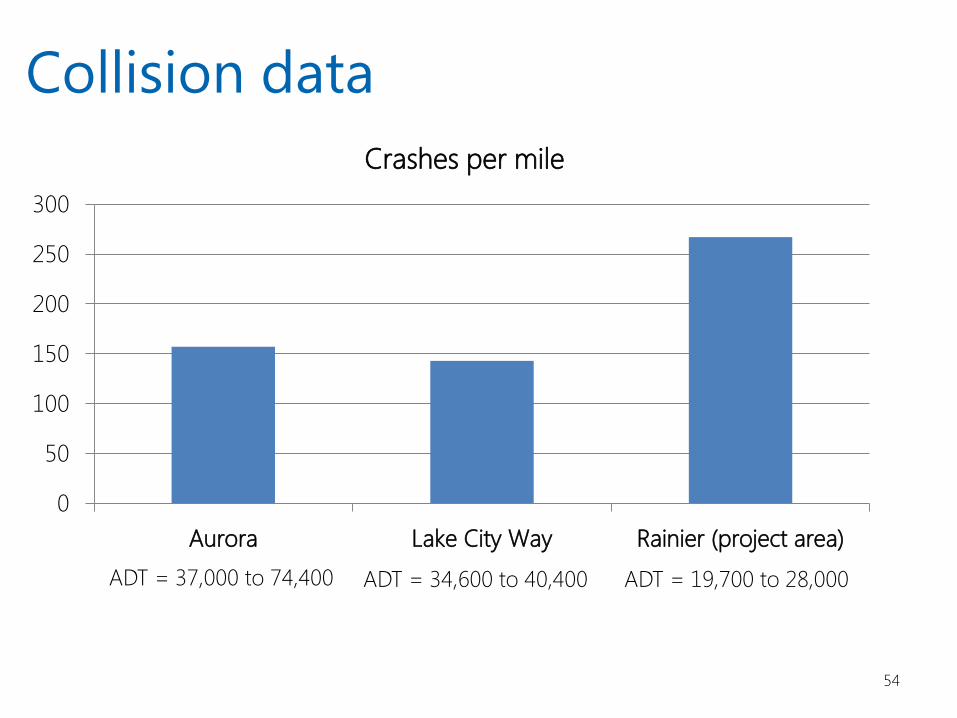
Collision data
54
0
50
100
150
200
250
300
Aurora Lake City Way Rainier (project area)
Crashes per mile
ADT = 37,000 to 74,400 ADT = 34,600 to 40,400 ADT = 19,700 to 28,000
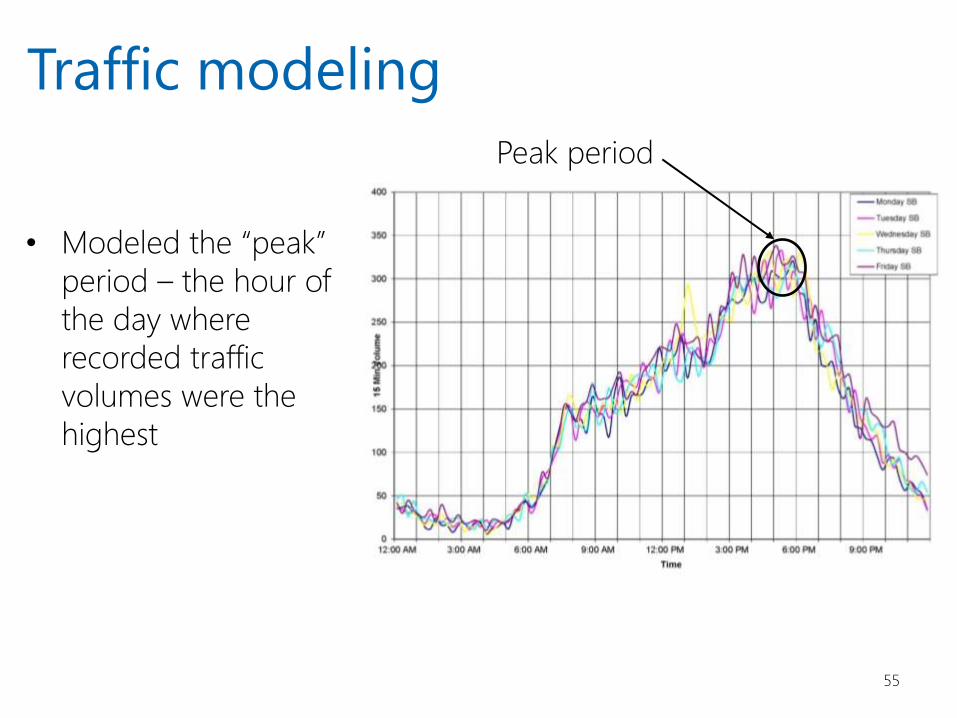
• Modeled the “peak”
period – the hour of
the day where
recorded traffic
volumes were the
highest
55
Traffic modeling
Peak period
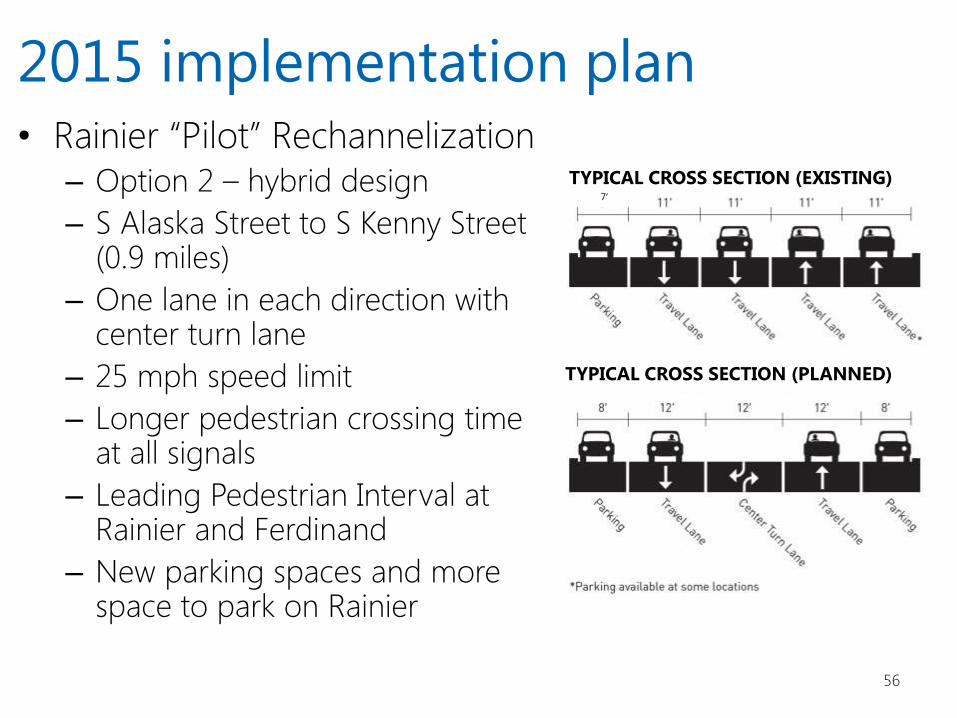
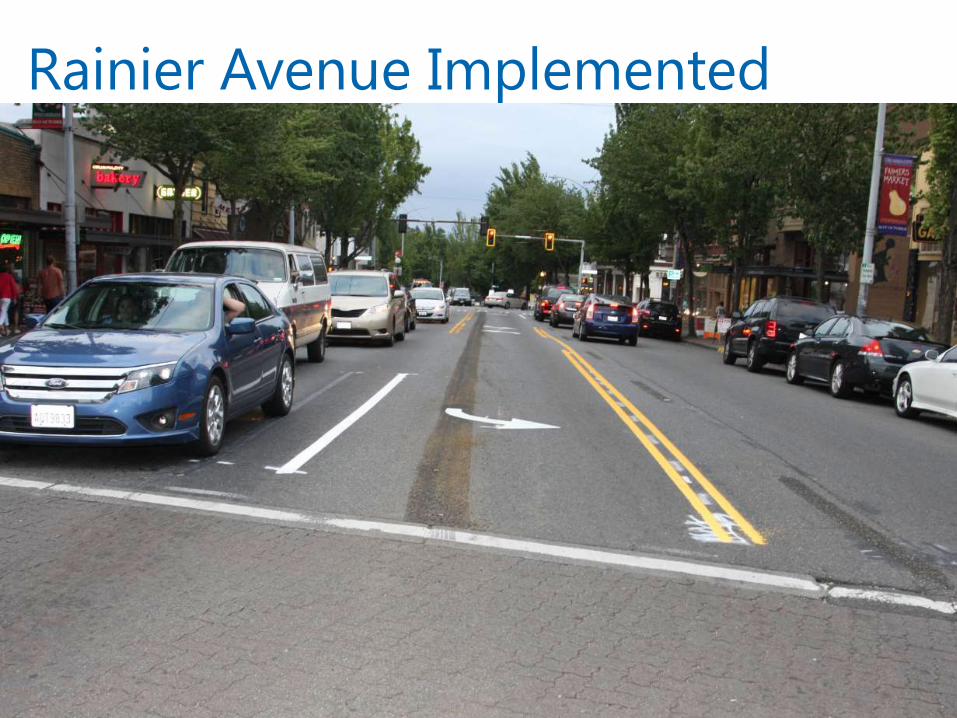
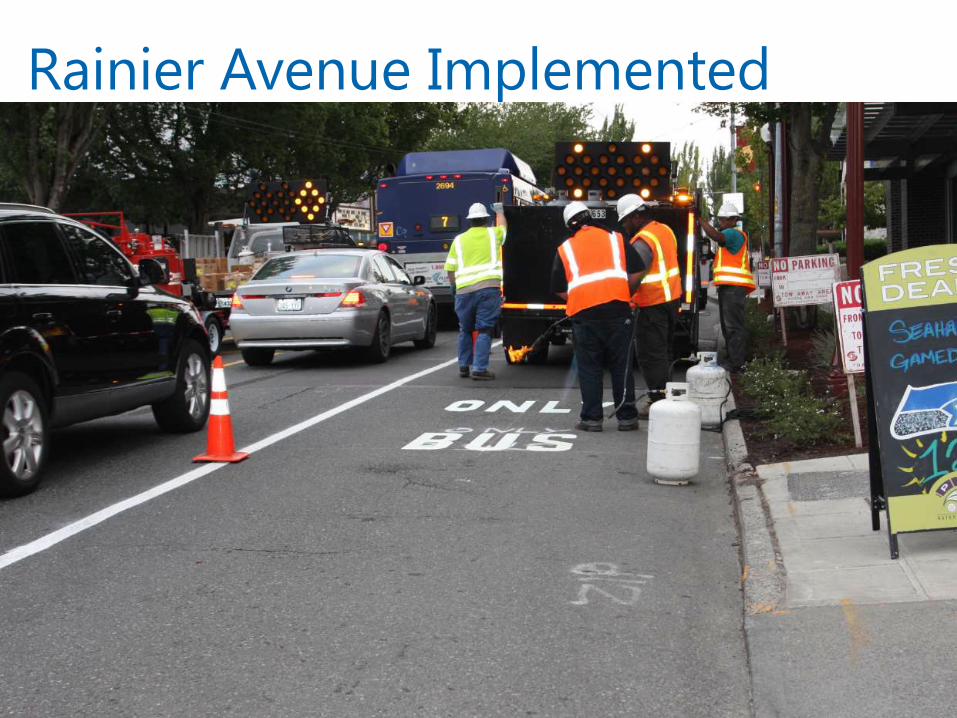
• Rainier “Pilot” Rechannelization – Option 2 – hybrid design
– S Alaska Street to S Kenny Street (0.9 miles)
– One lane in each direction with center turn lane
– 25 mph speed limit
– Longer pedestrian crossing time at all signals
– Leading Pedestrian Interval at Rainier and Ferdinand
– New parking spaces and more space to park on Rainier
56
2015 implementation plan
TYPICAL CROSS SECTION (PLANNED)
TYPICAL CROSS SECTION (EXISTING) 7’
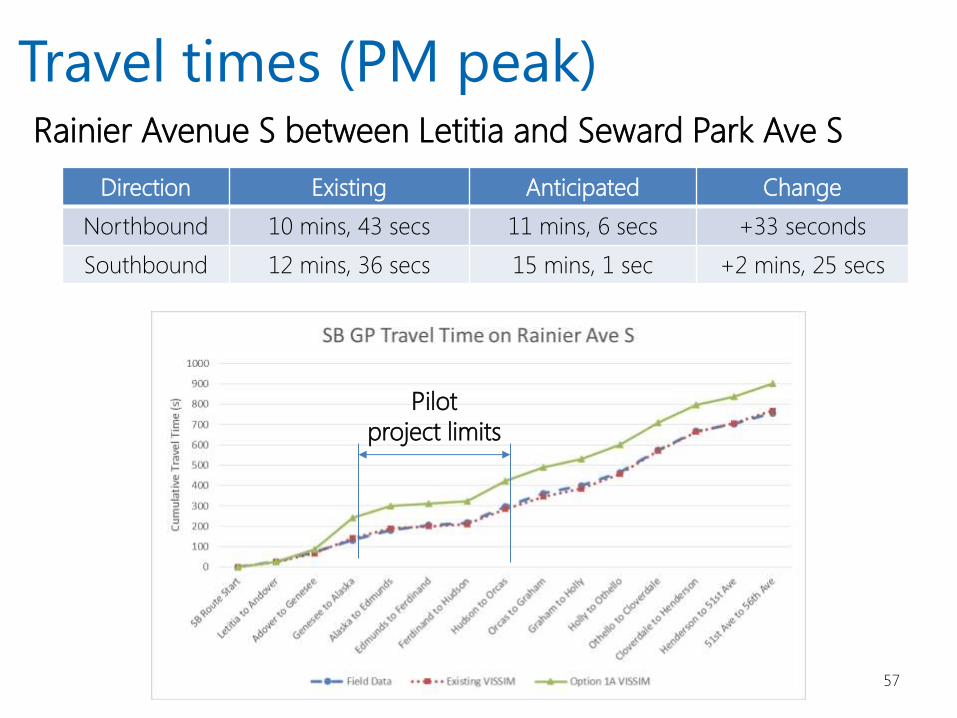
Rainier Avenue S between Letitia and Seward Park Ave S
57
Travel times (PM peak)
Pilot
project limits
Direction Existing Anticipated Change
Northbound 10 mins, 43 secs 11 mins, 6 secs +33 seconds
Southbound 12 mins, 36 secs 15 mins, 1 sec +2 mins, 25 secs
58
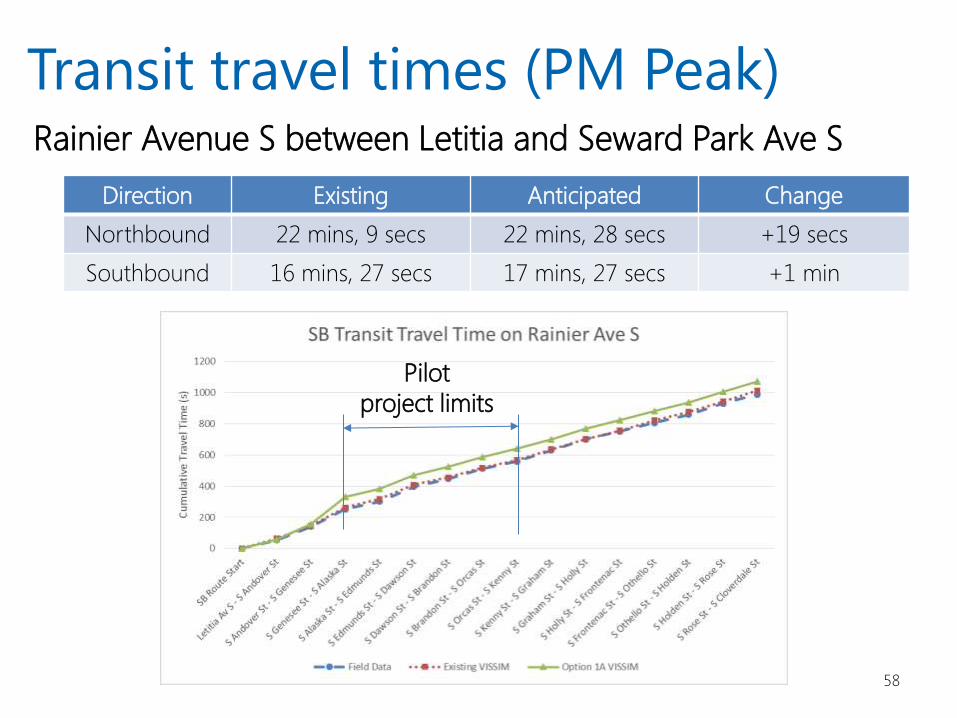
Transit travel times (PM Peak)
Pilot
project limits
Direction Existing Anticipated Change
Northbound 22 mins, 9 secs 22 mins, 28 secs +19 secs
Southbound 16 mins, 27 secs 17 mins, 27 secs +1 min
Rainier Avenue S between Letitia and Seward Park Ave S
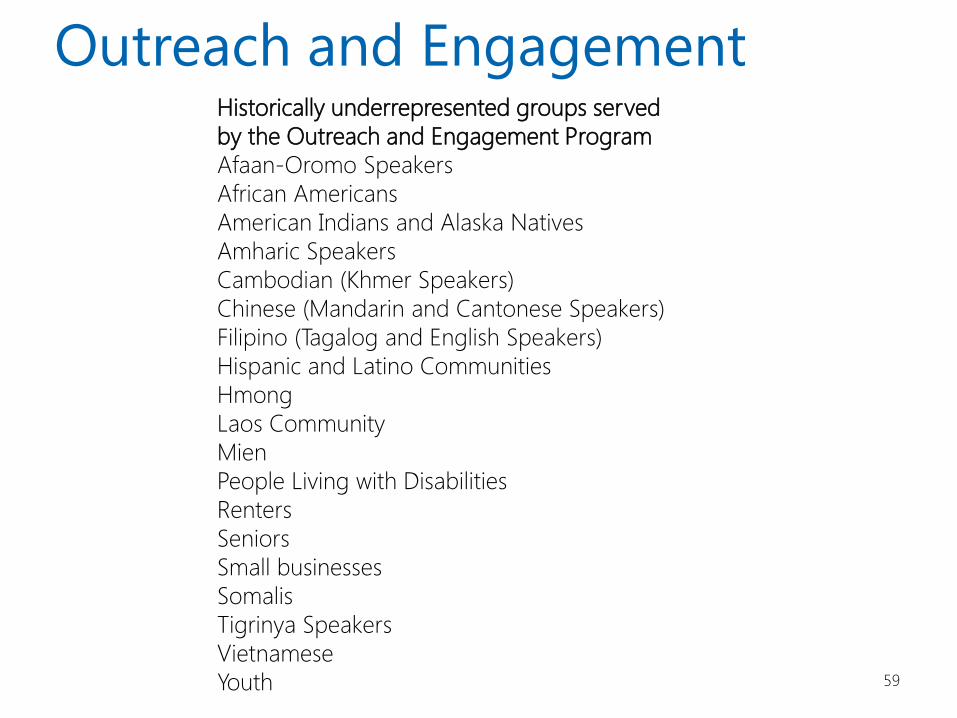
Outreach and Engagement
59
Historically underrepresented groups served
by the Outreach and Engagement Program
Afaan-Oromo Speakers
African Americans
American Indians and Alaska Natives
Amharic Speakers
Cambodian (Khmer Speakers)
Chinese (Mandarin and Cantonese Speakers)
Filipino (Tagalog and English Speakers)
Hispanic and Latino Communities
Hmong
Laos Community
Mien
People Living with Disabilities
Renters
Seniors
Small businesses
Somalis
Tigrinya Speakers
Vietnamese
Youth
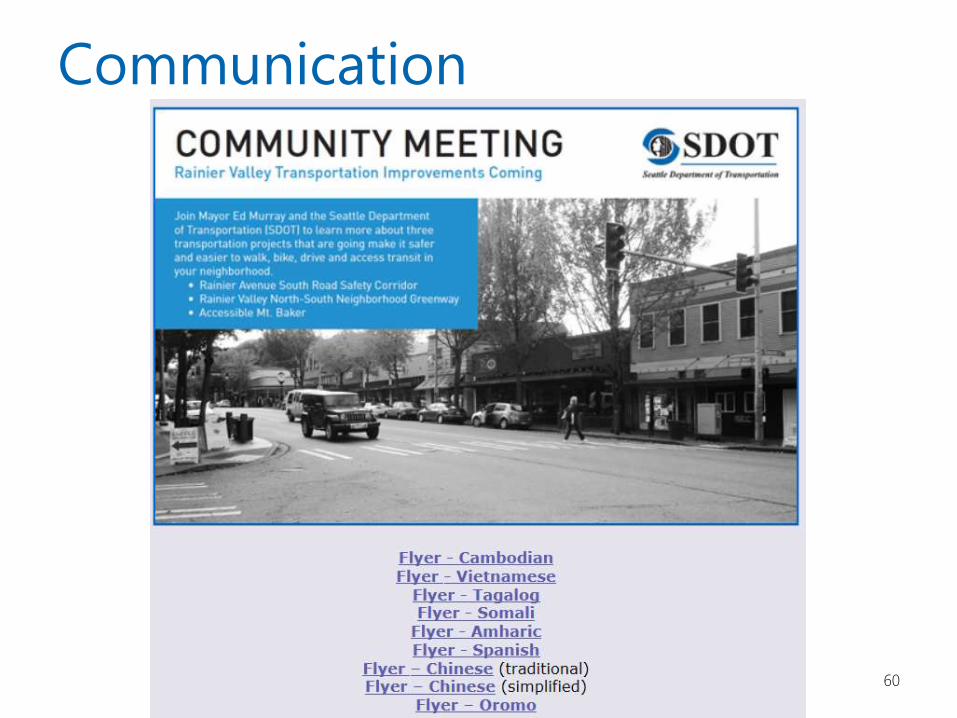
Communication
60
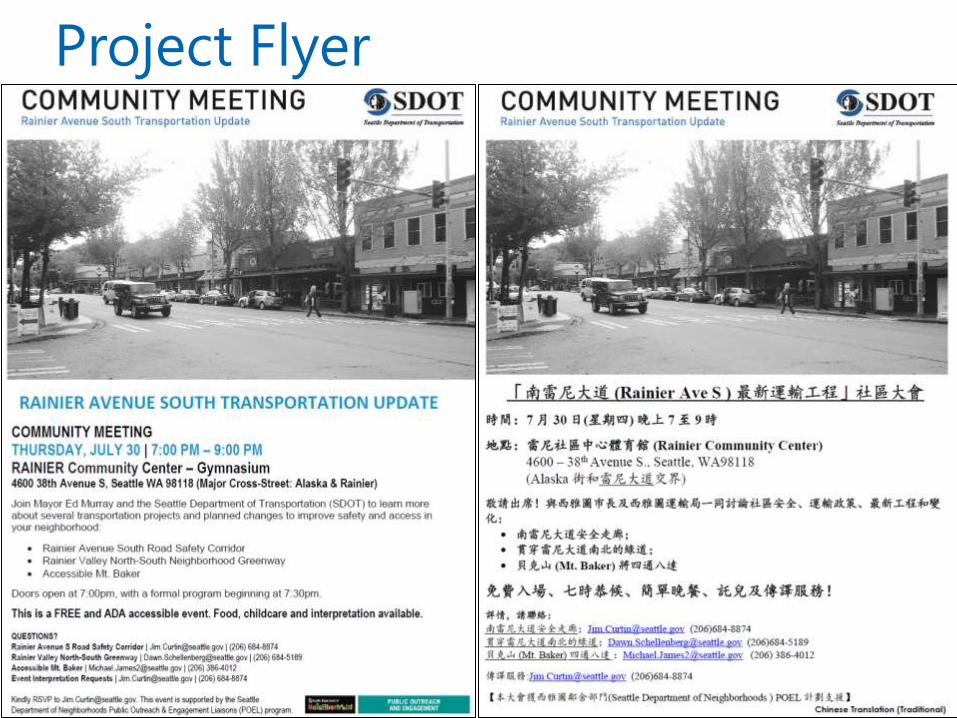
Project Flyer
61
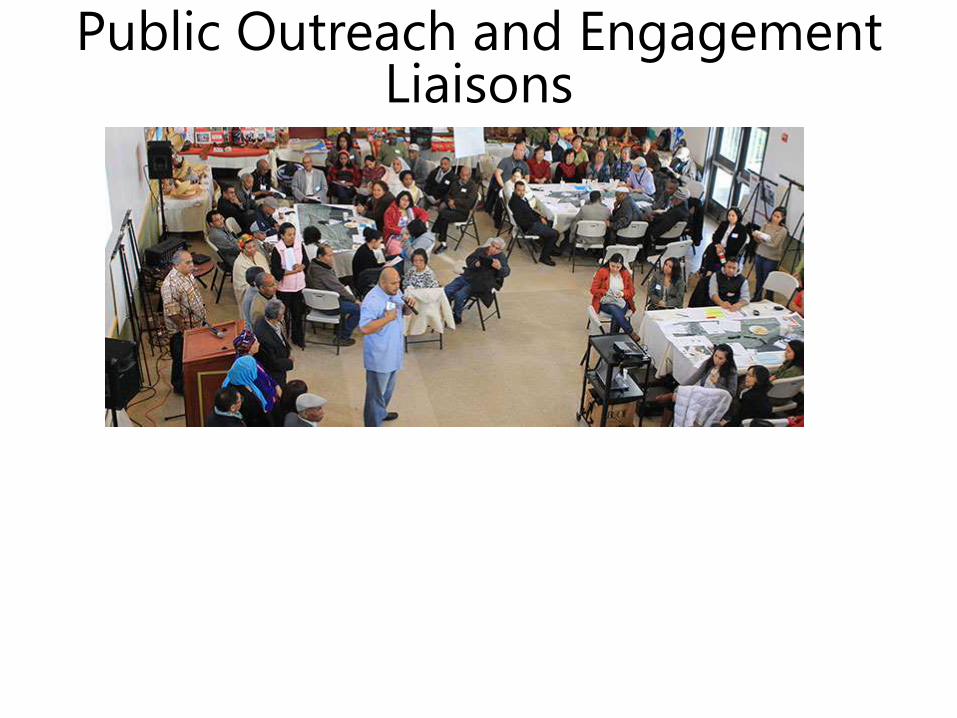
Public Outreach and Engagement Liaisons
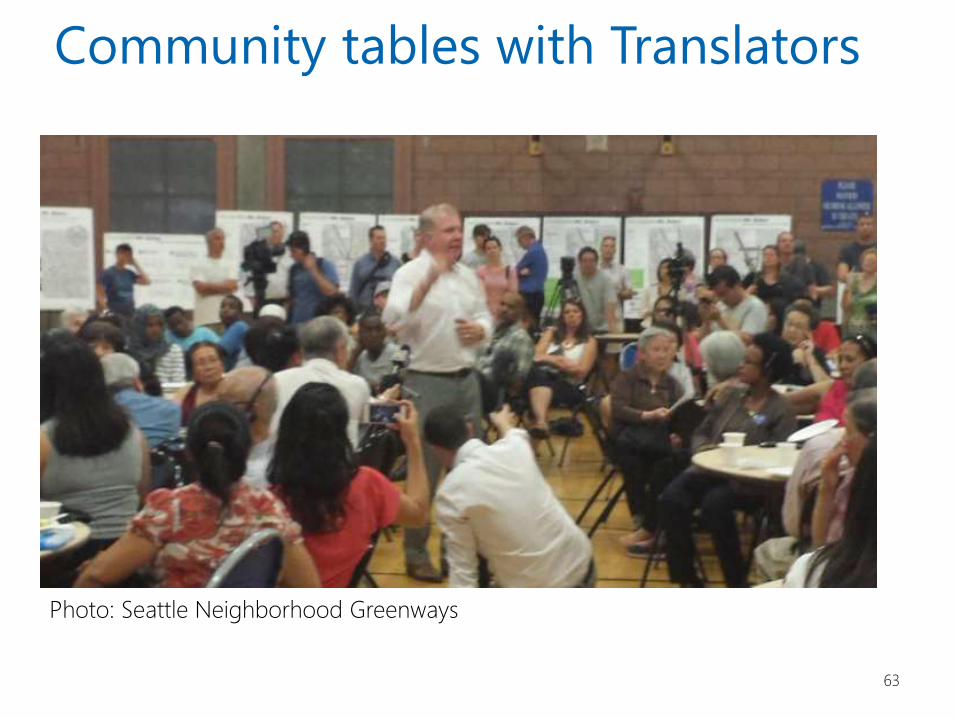
Community tables with Translators
63
Photo: Seattle Neighborhood Greenways
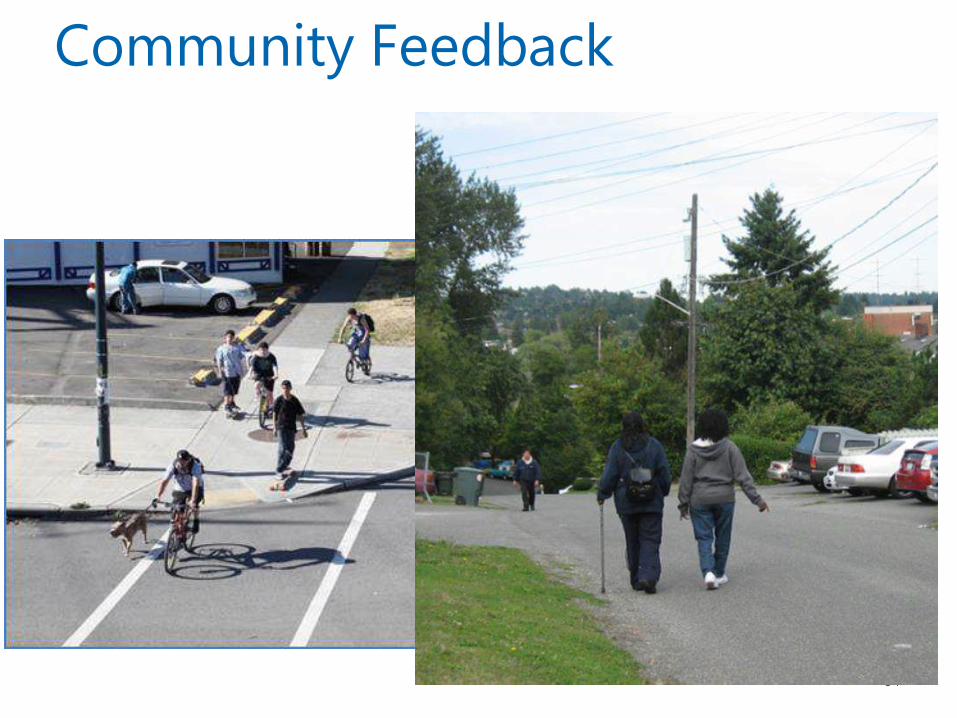
Community Feedback
64
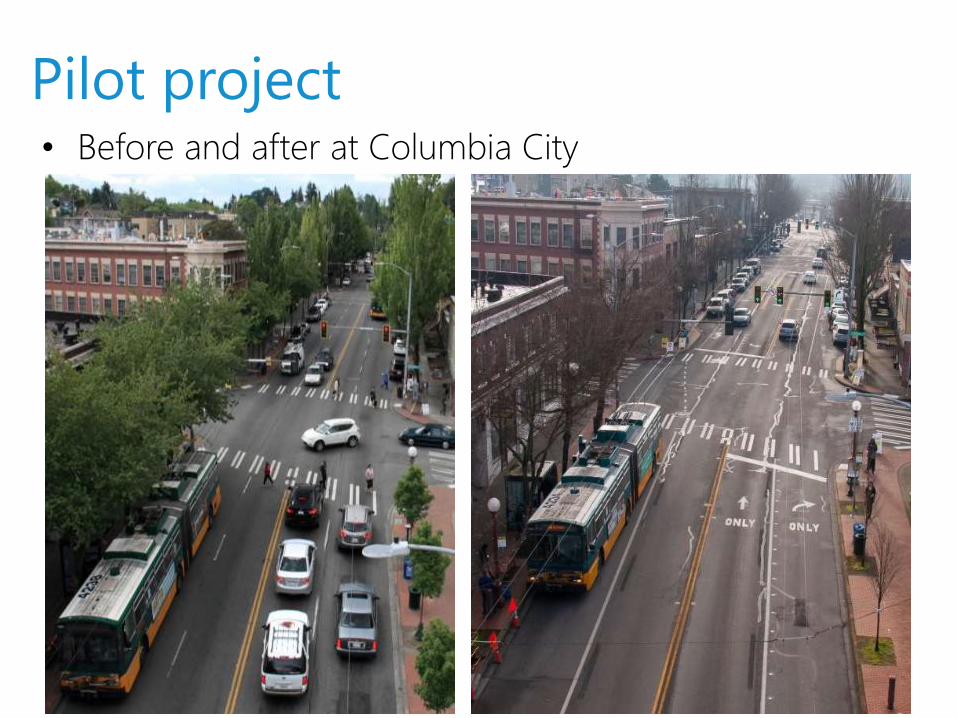
Pilot project
65
• Before and after at Columbia City
66
Rainier Avenue Implemented
67
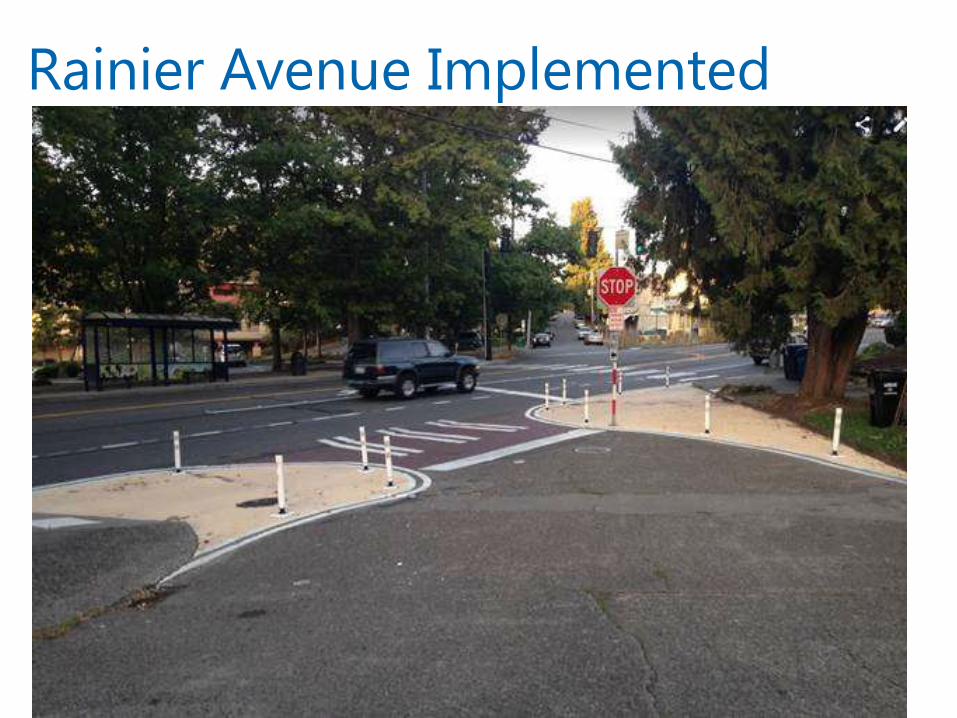
Rainier Avenue Implemented
68
Rainier Avenue Implemented
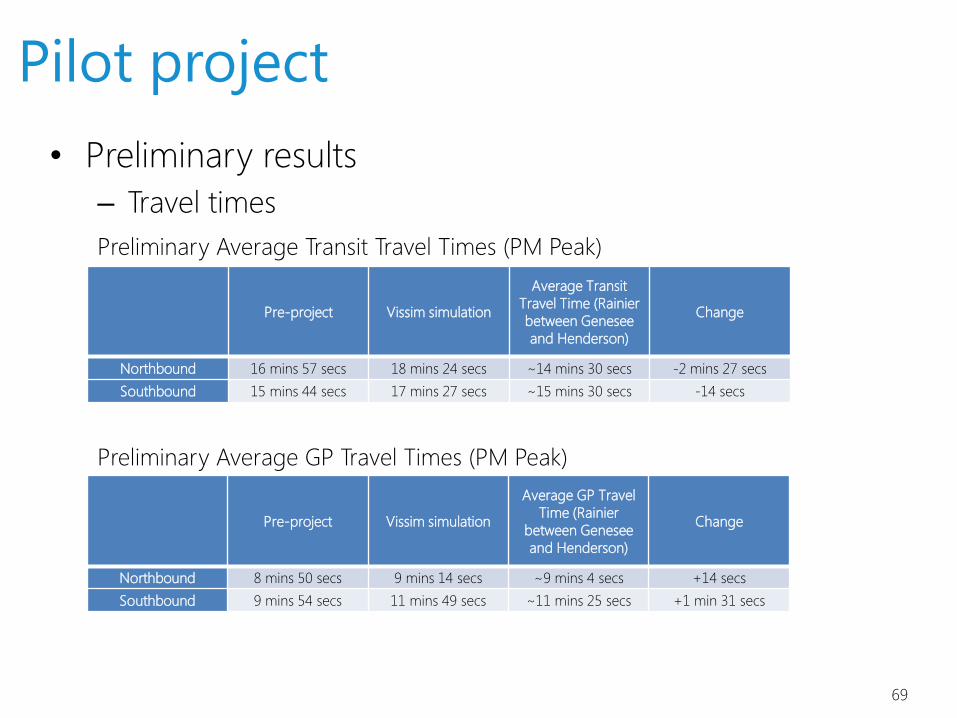
Pilot project
69
• Preliminary results
– Travel times
Pre-project Vissim simulation
Average Transit
Travel Time (Rainier
between Genesee
and Henderson)
Change
Northbound 16 mins 57 secs 18 mins 24 secs ~14 mins 30 secs -2 mins 27 secs
Southbound 15 mins 44 secs 17 mins 27 secs ~15 mins 30 secs -14 secs
Preliminary Average Transit Travel Times (PM Peak)
Preliminary Average GP Travel Times (PM Peak)
Pre-project Vissim simulation
Average GP Travel
Time (Rainier
between Genesee
and Henderson)
Change
Northbound 8 mins 50 secs 9 mins 14 secs ~9 mins 4 secs +14 secs
Southbound 9 mins 54 secs 11 mins 49 secs ~11 mins 25 secs +1 min 31 secs
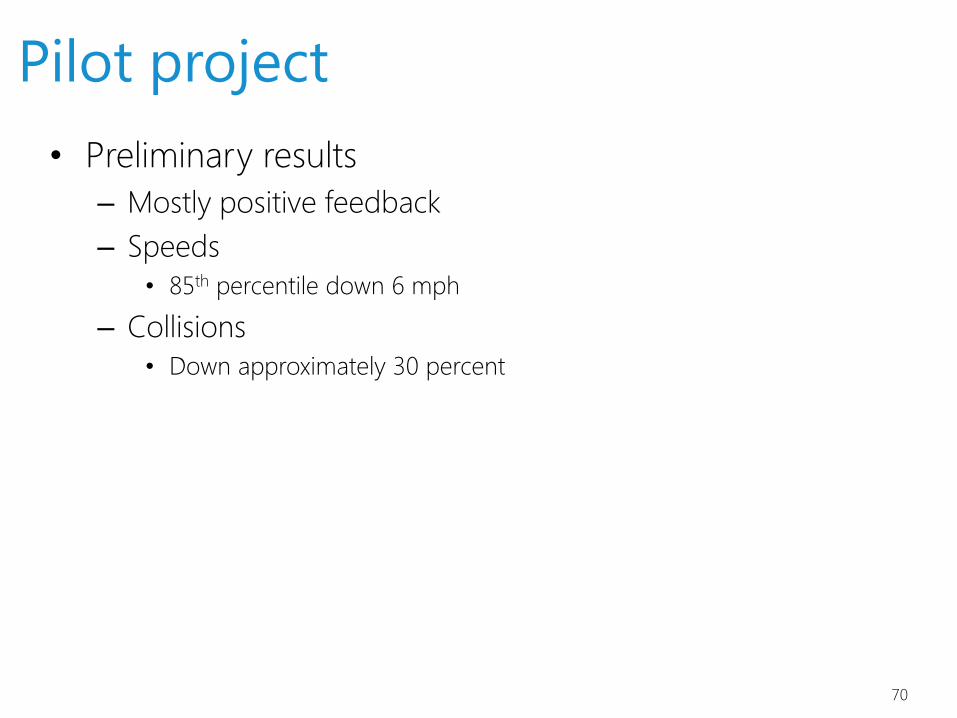
Pilot project
70
• Preliminary results
– Mostly positive feedback
– Speeds
• 85th percentile down 6 mph
– Collisions
• Down approximately 30 percent
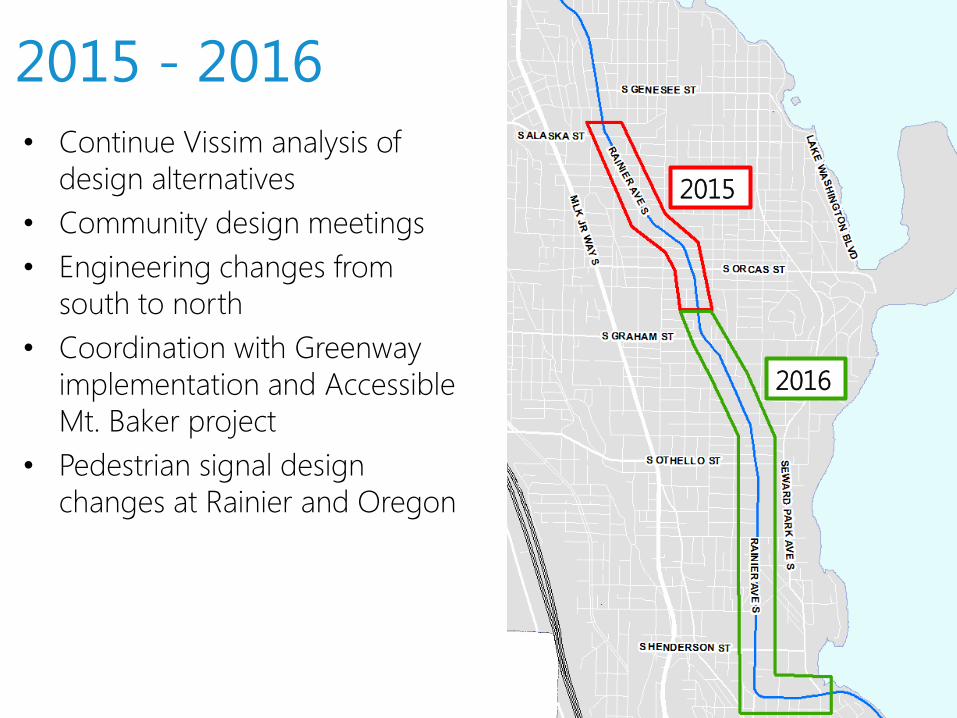
2015 - 2016
• Continue Vissim analysis of
design alternatives
• Community design meetings
• Engineering changes from
south to north
• Coordination with Greenway
implementation and Accessible
Mt. Baker project
• Pedestrian signal design
changes at Rainier and Oregon
2015
2016
Phase 2 coordination
72
• Public comments
– Strong desire for protected bike lanes on Rainier
– Extend channelization changes to the north and
south of pilot project
– Add more crosswalks
– Increase enforcement
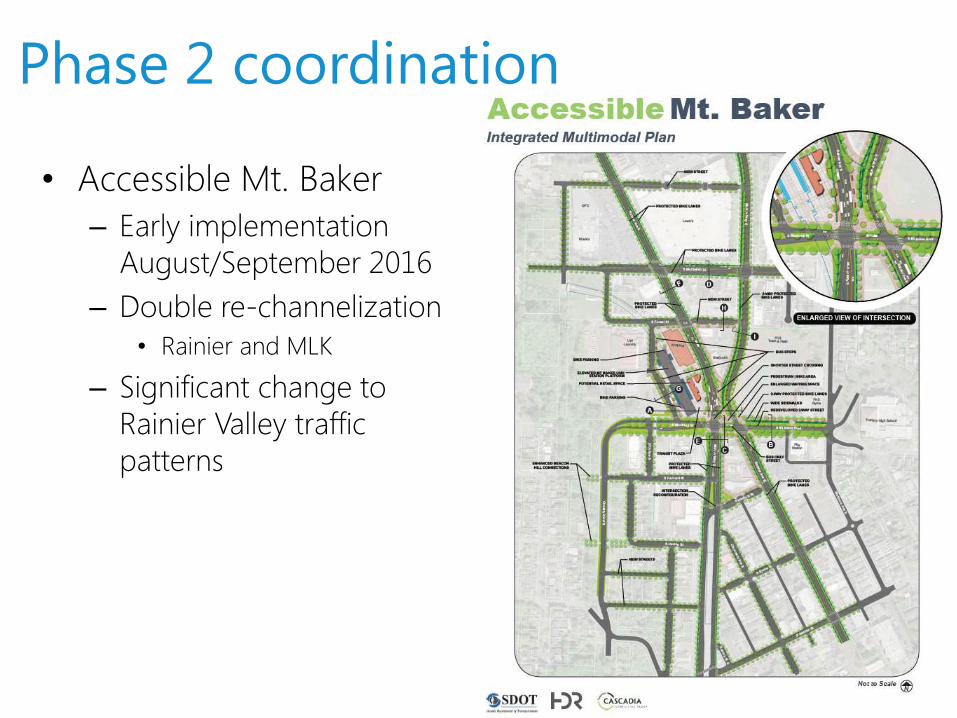
Phase 2 coordination
73
• Accessible Mt. Baker
– Early implementation
August/September 2016
– Double re-channelization
• Rainier and MLK
– Significant change to
Rainier Valley traffic
patterns
Lessons learned
• Complete corridors can be a preferred context sensitive
approach that may be able to meet multiple community
objectives
• Rightsizing works—over 40 completed examples in Seattle
• Speed reduction—especially for top-end speeders
• Pedestrian and bicycle safety and access encourages more
usage
• Low to no reductions in travel times along the corridors
• Difficult to get initial community support—once installed,
community support is typically very high
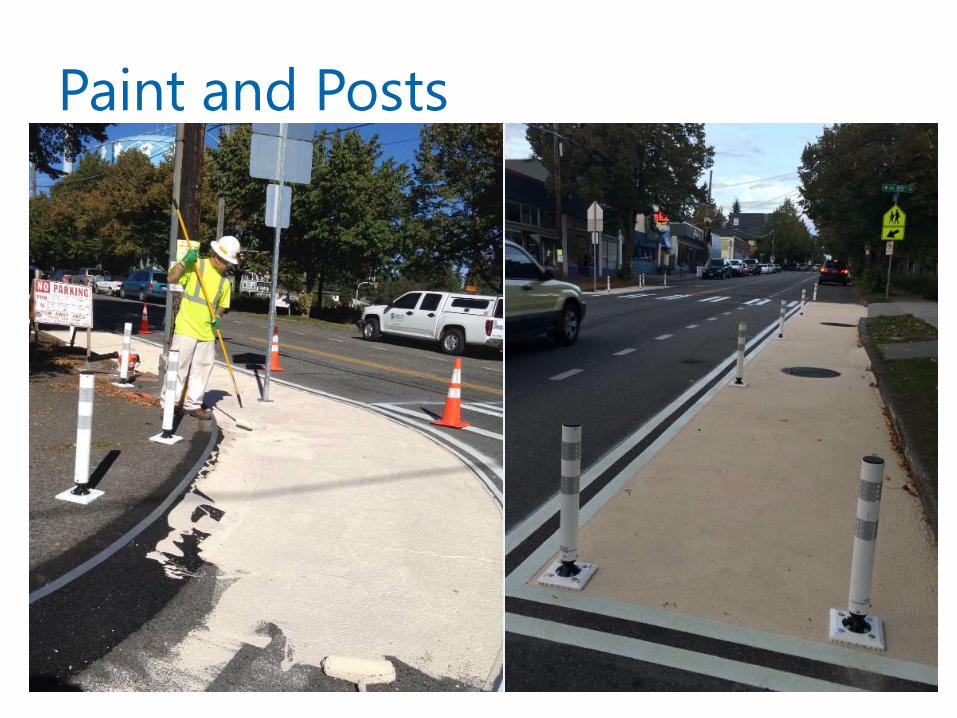
Paint and Posts
Our challenge
• Be creative and innovative
• Make safety the number one priority
• Emphasize moving people and goods (not
vehicles)
• Right-size streets to meet your community’s
needs
76
Questions?
http://www.seattle.gov/transportation