Embed Size (px)
Citation preview
Loughborough UniversityInstitutional Repository
Train planning in afragmented railway - aBritish perspective
This item was submitted to Loughborough University's Institutional Repositoryby the/an author.
Additional Information:
• A Doctoral Thesis submitted in partial fulfilment of the requirements ofLoughborough University for the Degree of Doctor of Philosophy.
Metadata Record: https://dspace.lboro.ac.uk/2134/4485
Publisher: c© Robert Watson
Please cite the published version.
This item was submitted to Loughborough’s Institutional Repository (https://dspace.lboro.ac.uk/) by the author and is made available under the
following Creative Commons Licence conditions.
For the full text of this licence, please go to: http://creativecommons.org/licenses/by-nc-nd/2.5/
TRAIN PLANNING IN A FRAGMENTED RAILWAY
- A British Perspective
by
ROBERT WATSON
A Doctoral Thesis submitted in partial fulfilment of the requirements of Loughborough University for the Degree of
Doctor of Philosophy
November 2008
© Robert Watson 2008
2
It might be hastily assumed that the construction of a time-table of trains was
likely to be as dull and dreary a task as the compilation of a calendar or the
making of a ready-reckoner. In fact, the making of railway time-tables is a
complicated and fascinating business, which forms a whole-time occupation for a
very large staff of experts specially trained for the work.
Let us realize that a railway time-table is a most complicated and delicate
structure pieced together with the greatest pains, and any – even the slightest –
disturbance of it may have far-reaching consequences difficult to foresee. … A
time-table is like a castle of cards, liable to be ruined by clumsy meddling with a
single card.
Williamson, 1938
3
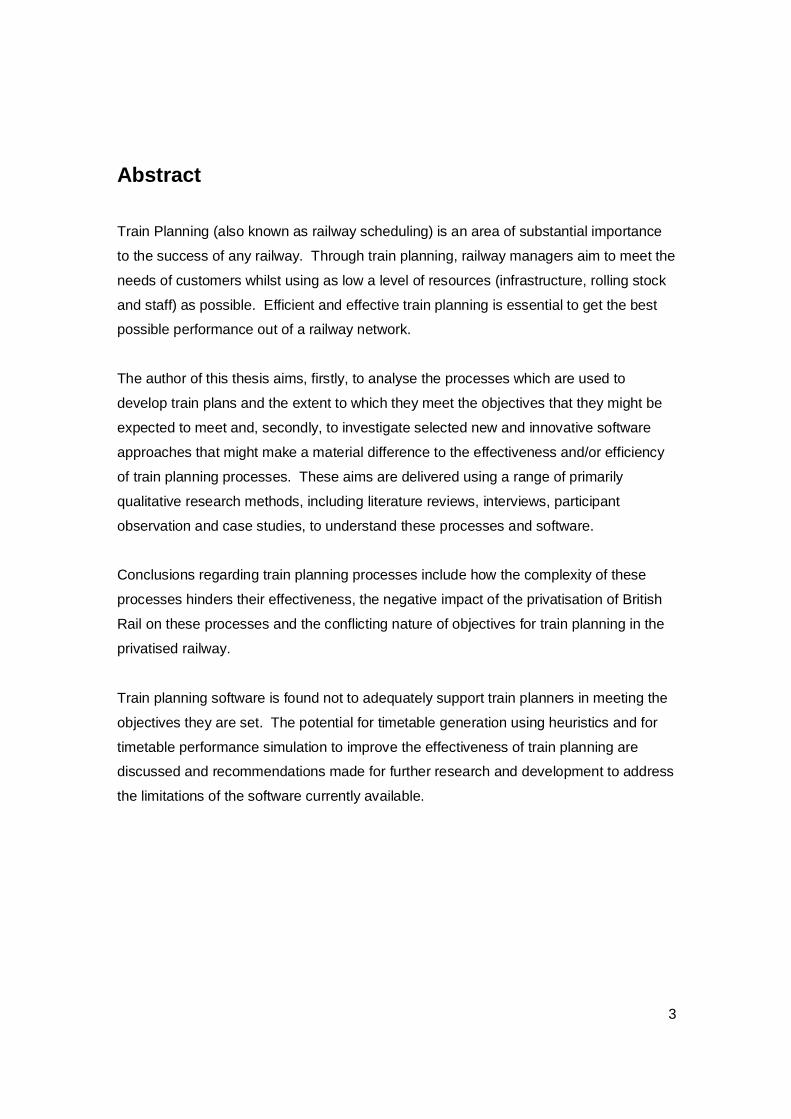
Abstract Train Planning (also known as railway scheduling) is an area of substantial importance
to the success of any railway. Through train planning, railway managers aim to meet the
needs of customers whilst using as low a level of resources (infrastructure, rolling stock
and staff) as possible. Efficient and effective train planning is essential to get the best
possible performance out of a railway network.
The author of this thesis aims, firstly, to analyse the processes which are used to
develop train plans and the extent to which they meet the objectives that they might be
expected to meet and, secondly, to investigate selected new and innovative software
approaches that might make a material difference to the effectiveness and/or efficiency
of train planning processes. These aims are delivered using a range of primarily
qualitative research methods, including literature reviews, interviews, participant
observation and case studies, to understand these processes and software.
Conclusions regarding train planning processes include how the complexity of these
processes hinders their effectiveness, the negative impact of the privatisation of British
Rail on these processes and the conflicting nature of objectives for train planning in the
privatised railway.
Train planning software is found not to adequately support train planners in meeting the
objectives they are set. The potential for timetable generation using heuristics and for
timetable performance simulation to improve the effectiveness of train planning are
discussed and recommendations made for further research and development to address
the limitations of the software currently available.

4
Acknowledgements My thanks go to everyone who has helped directly and indirectly with this research –
train planners across the railway industry for humouring my oblique and sometimes
opaque questioning (in particular Godfrey Willis and, sadly no longer with us, Tony
Hopper); senior management in Railtrack for funding some of the research into
processes and timetabling software; Anzir Boodoo and Ian Bradshaw for primary data
collection which enabled this research to cover a broader range of issues than would
otherwise have been possible.
My special thanks go to my supervisor, David Gillingwater, who’s gentle cajoling has in
the end yielded a result, and to my family, who have endured the whole process with an
appropriate level of stoicism.

5
TABLE OF CONTENTS
1 INTRODUCTION...................................................................................................12 1.1 Research Scope...........................................................................................12 1.2 Aims .............................................................................................................14 1.3 Objectives ....................................................................................................14 1.4 Publications and Use of Data Collected by Other Researchers ...............15 1.5 Structure of the Thesis................................................................................16
2 METHOD ..............................................................................................................18 2.1 Introduction..................................................................................................18 2.2 Philosophical Assumptions and Discussion of Possible Research Methods ...................................................................................................................18
2.2.1 Key Texts..............................................................................................18 2.2.2 Positivism vs. Relativism and Social Constructivism .......................19 2.2.3 Case Studies ........................................................................................21 2.2.4 Sequencing research...........................................................................21 2.2.5 Quantitative v Qualitative Research Methods....................................22 2.2.6 Positivism or Social Constructionism?..............................................23
2.3 Data Collection ............................................................................................25 2.3.1 Introduction ..........................................................................................25 2.3.2 Internal railway documents .................................................................25 2.3.3 Interviews .............................................................................................27 2.3.4 Participant Observation.......................................................................28 2.3.5 ‘Hands on’ Experience of Train Planning Systems ...........................29 2.3.6 Justification of methods used ............................................................29
2.4 Conclusions .................................................................................................30 3 TRAIN PLANNING PROCESSES.........................................................................31
3.1 Introduction..................................................................................................31 3.2 Method..........................................................................................................31 3.3 Literature......................................................................................................32 3.4 Key Terms in Train Service Planning.........................................................33 3.5 Time Horizons..............................................................................................34 3.6 Process Description ....................................................................................37
3.6.1 Overview...............................................................................................37 3.6.2 Base Data .............................................................................................37 3.6.3 Business Specifications ......................................................................38 3.6.4 Timetable Planning ..............................................................................40 3.6.5 Timetable Production ..........................................................................44
6
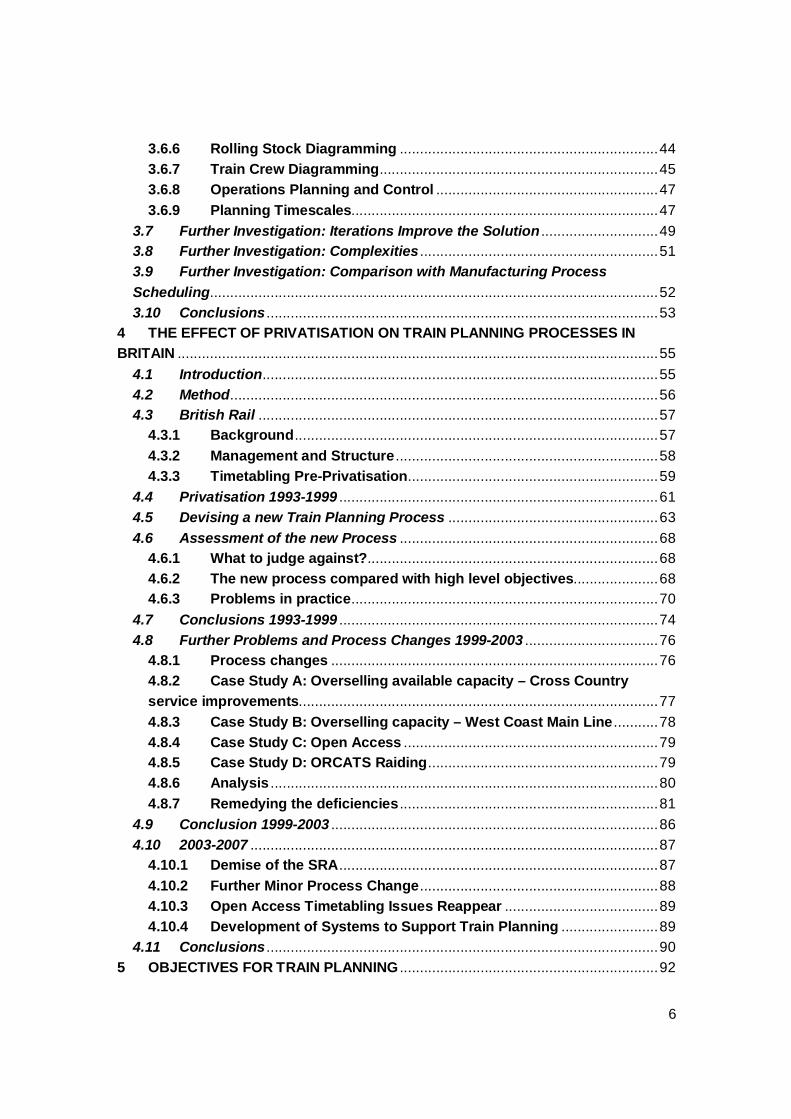
3.6.6 Rolling Stock Diagramming ................................................................44 3.6.7 Train Crew Diagramming.....................................................................45 3.6.8 Operations Planning and Control .......................................................47 3.6.9 Planning Timescales............................................................................47
3.7 Further Investigation: Iterations Improve the Solution .............................49 3.8 Further Investigation: Complexities ...........................................................51 3.9 Further Investigation: Comparison with Manufacturing Process Scheduling...............................................................................................................52 3.10 Conclusions .................................................................................................53
4 THE EFFECT OF PRIVATISATION ON TRAIN PLANNING PROCESSES IN BRITAIN .......................................................................................................................55
4.1 Introduction..................................................................................................55 4.2 Method..........................................................................................................56 4.3 British Rail ...................................................................................................57
4.3.1 Background..........................................................................................57 4.3.2 Management and Structure .................................................................58 4.3.3 Timetabling Pre-Privatisation..............................................................59
4.4 Privatisation 1993-1999 ...............................................................................61 4.5 Devising a new Train Planning Process ....................................................63 4.6 Assessment of the new Process ................................................................68
4.6.1 What to judge against?........................................................................68 4.6.2 The new process compared with high level objectives.....................68 4.6.3 Problems in practice............................................................................70
4.7 Conclusions 1993-1999 ...............................................................................74 4.8 Further Problems and Process Changes 1999-2003 .................................76
4.8.1 Process changes .................................................................................76 4.8.2 Case Study A: Overselling available capacity – Cross Country service improvements.........................................................................................77 4.8.3 Case Study B: Overselling capacity – West Coast Main Line ...........78 4.8.4 Case Study C: Open Access ...............................................................79 4.8.5 Case Study D: ORCATS Raiding.........................................................79 4.8.6 Analysis ................................................................................................80 4.8.7 Remedying the deficiencies ................................................................81
4.9 Conclusion 1999-2003 .................................................................................86 4.10 2003-2007 .....................................................................................................87
4.10.1 Demise of the SRA...............................................................................87 4.10.2 Further Minor Process Change...........................................................88 4.10.3 Open Access Timetabling Issues Reappear ......................................89 4.10.4 Development of Systems to Support Train Planning ........................89
4.11 Conclusions .................................................................................................90 5 OBJECTIVES FOR TRAIN PLANNING ................................................................92

7
5.1 Introduction..................................................................................................92 5.2 Methods........................................................................................................93 5.3 Literature on Objectives..............................................................................94 5.4 Business Objectives of Key Organisations ...............................................95
5.4.1 Introduction ..........................................................................................95 5.4.2 Government..........................................................................................95 5.4.3 The Strategic Rail Authority ................................................................97 5.4.4 The Office of the Rail Regulator (until 2004 – now the Office of Rail Regulation) ........................................................................................................100 5.4.5 Network Rail .......................................................................................104 5.4.6 Franchised Passenger Train Operators ...........................................106 5.4.7 ‘Open Access’ Passenger Operators ...............................................108 5.4.8 Freight Operators...............................................................................108
5.5 Train Planning Objectives for Railway Management and Train Planners.... 109
5.5.1 Priorities for Railway Management...................................................109 5.5.2 Priorities for Train Planners – and Differences from Management 111 5.5.3 Trade-offs between conflicting objectives .......................................114 5.5.4 Achievement of Objectives ...............................................................115
5.6 Analysis......................................................................................................117 5.6.1 Purpose of this analysis....................................................................117 5.6.2 Categorisation of objectives (1) – growth, cost or performance related ............................................................................................................117 5.6.3 Categorisation of objectives (2) – time horizon ...............................119 5.6.4 Categorisation of Objectives (3) – Business Objectives, Physical Constraints and Robustness............................................................................122
5.7 Delivering organisational objectives........................................................126 5.8 Conclusions ...............................................................................................128
6 THE ROLE OF SOFTWARE IN SUPPORTING TRAIN PLANNING ...................130 6.1 Introduction................................................................................................130 6.2 Method........................................................................................................130 6.3 Literature....................................................................................................131 6.4 A Brief Review of Current Train Planning Software ................................133
6.4.1 ‘Data management’ packages ...........................................................133 6.4.2 Timetable Simulation Packages........................................................135 6.4.3 Train Plan Generation and ‘Optimisation’ Tools..............................136 6.4.4 Strategic Tools ...................................................................................136
6.5 The Views of Train Planners on the Need for Improved Software..........137 6.5.1 Interview Results ...............................................................................137 6.5.2 Analysis ..............................................................................................139
6.6 Comparative Analysis – Mass Transit Use of Scheduling Software ......141
8
6.6.1 The Relevance of Mass Transit Experiences ...................................141 6.6.2 Mass Transit User Needs ..................................................................141 6.6.3 Mass Transit and ‘Main Line’ Train Planning Software Compared.142
6.7 Conclusions ...............................................................................................144 7 USE OF HEURISTICS IN TIMETABLE GENERATION AND OPTIMISATION ...145
7.1 Introduction................................................................................................145 7.2 Methodology ..............................................................................................146 7.3 Literature Review.......................................................................................146
7.3.1 Heuristics: Principles and Appropriateness for Train Planning Problems............................................................................................................146 7.3.2 Published Operations Research Work in the Area of Timetabling .148
7.4 An Example of Timetable Generation and Optimisation Software – the ‘Planning Timetable Generator’............................................................................150
7.4.1 Early Development.............................................................................150 7.4.2 Overview of PTG ................................................................................152 7.4.3 Detailed Description of PTG..............................................................154 7.4.4 Case Studies ......................................................................................160 7.4.5 Analysis ..............................................................................................162 7.4.6 Areas for Development......................................................................171
7.5 Connecting Timetable Optimisation Research and Development to Reality ....................................................................................................................174 7.6 Conclusions ...............................................................................................176
8 TIMETABLE SIMULATION SOFTWARE............................................................177 8.1 Introduction................................................................................................177 8.2 Method........................................................................................................177 8.3 Literature Review.......................................................................................178 8.4 Timetable Simulation in Britain ................................................................180
8.4.1 Background........................................................................................180 8.4.2 The British Rail Inheritance...............................................................182 8.4.3 Stochastic Simulation Software in Regular Use in Britain..............183
8.5 Issues with the Use of RailSys and other Simulation Tools...................191 8.5.1 Introduction ........................................................................................191 8.5.2 ‘Implementation’ Issues ....................................................................192 8.5.3 Technical Issues ................................................................................193 8.5.4 Where Next for Simulation? ..............................................................195
8.6 Conclusions ...............................................................................................197 9 CONCLUSIONS..................................................................................................198
9.1 Purpose of this chapter.............................................................................198 9.2 Have the Aims and Objectives been met? ...............................................198 9.3 Have the Methods adopted proved Appropriate? ...................................201 9.4 Train Planning Processes – Conclusions and Recommendations for
9
Further Work .........................................................................................................202 9.5 Train Planning Systems – Conclusions and Recommendations for Further Work .........................................................................................................203 9.6 The Value of the Research Undertaken....................................................205
10 Appendix 1 – Case Studies...........................................................................207 10.1 PTG Case Study - Brighton Main Line......................................................207
10.1.1 General description ...........................................................................207 10.1.2 Preparation.........................................................................................209 10.1.3 Running PTG......................................................................................209 10.1.4 Conclusions .......................................................................................212
10.2 RailSys Case Study - ERTMS....................................................................212 10.2.1 Introduction ........................................................................................212 10.2.2 Detailed Description of RailSys ........................................................213 10.2.3 Scope and Set Up of the Model.........................................................216 10.2.4 Modelling the Existing Infrastructure and Working Timetable .......220 10.2.5 Modelling ERTMS System D in RailSys............................................220 10.2.6 Options Run and Results ..................................................................222 10.2.7 Comparison with Previously Published Results on Benefits of ERTMS 227 10.2.8 Conclusions for ERTMS ....................................................................230 10.2.9 Suggestions for Further Analysis.....................................................232
11 References .....................................................................................................233
10
LIST OF FIGURES
Figure 1: Structure of the thesis ....................................................................................16 Figure 2: Planning Time Horizons (Source: Author) ......................................................36 Figure 3: Train Planning Process (Source: Author) .......................................................37 Figure 4: Timetable Development Process (Source: Author).........................................41 Figure 5: Simplified Timetable Graphs (Source: Author) ...............................................42 Figure 6: Timetable Graph (Source: Screen shot from DeltaRail commercial software) 42 Figure 7: Rolling Stock Diagrams (Source: IVE, Hannover commercial software DISPO).....................................................................................................................................45 Figure 8: Train Crew Diagrams in preparation (Source: SISCOG commercial software CREWS) .......................................................................................................................46 Figure 9: Amount of input and quality of output v. timeframe (Source: Author)..............49 Figure 10: Feedback Loops in Train Planning (Source: Author) ....................................50 Figure 11: Privatised Industry Structure (Source: Author)..............................................62 Figure 12: Train Planning Process Introduced at Privatisation (Source: Author)............66 Figure 13: Comparison of processes before privatisation with that initially proposed (Source: Author)............................................................................................................67 Figure 14: Objectives by Organisation (Source: Author)..............................................120 Figure 15: Objectives for Train Planning by Organisation and Time Horizon (Source: Author)........................................................................................................................121 Figure 16: NID Junction Conflicts (Source: Gilroy and Robertson, 2001) ....................157 Figure 17: PTG Case Study 1 Model Area (screenshot from the NID).........................208 Figure 18: Screenshot from the NID showing the level of detail held within the National Infrastructure Database...............................................................................................208 Figure 19: RailSys Case Study: ERTMS Model Area (Source: Author) .......................217 Figure 20: Relationship Between Secondary Delay and % Capacity Used (Source: Author)........................................................................................................................230
11
LIST OF TABLES
Table 1: Contrasting implications of positivism and social constructionism for research (Source: Easterby-Smith et al., 2002) ...........................................................................23 Table 2: Summary of Management Objectives for the Train Planning Process (Source: Author)........................................................................................................................111 Table 3: Factors hindering achievement of organisational objectives (Source: Author)127 Table 4 Conventional programs versus expert systems (from Daly, 1993) .................132 Table 5: Tools to semi-automate diagram production (Source: Author).......................136 Table 6: Train Planners’ Priorities for Software Support (Source: Author) ...................138 Table 7: Summarised Priorities for Train Planning Software Development (Source: Author)........................................................................................................................140 Table 8: PTG Cost Function Variables (Source: Gilroy and Robertson, 2001).............153 Table 9: PTG Phases (Source: Gilroy and Robertson, 2001) ......................................154 Table 10: PTG Inputs and Outputs (Source: Gilroy and Robertson, 2001) ..................155 Table 11: Reviews of Stochastic Simulation Tools (Source: Author) ...........................178 Table 12: Simulation models in use in Britain (Source: Author) ...................................184 Table 13. Scoring for simulation software packages for typical tasks (Source: Author)...................................................................................................................................190 Table 14: Summary of PTG Runs (Source: Author).....................................................210 Table 15: Results - ERTMS vs CURRENT (Source: Author) .......................................225 Table 16: Results - ERTMS with extra peak trains vs.CURRENT (Source: Author).....225 Table 17: Results - ‘Unconstrained’ platforming at Victoria (Source: Author)...............226
12
1 INTRODUCTION
1.1 Research Scope
Railways, especially in Britain, are experiencing substantial growth in traffic volumes for
the first time in many years. In Britain volumes have grown steadily, with passenger
traffic growth being particularly rapid in the late 1990s, with growth amounting to 40% in
passenger kilometres in the ten years up until 2005. Freight volumes in 2004 totalled 21
billion tonne kilometres against 14 billion a decade earlier. Though not as much is being
carried as then in absolute tonnage terms, what is being conveyed is travelling
considerably further (Association of Train Operating Companies, 2005).
Schmid and König (2008) describe railways as tightly coupled complex systems with a
number of technical, physical, operational and organisational characteristics that
interact. This complexity leads to the concern that future traffic growth is potentially
constrained by the ability of the industry to plan the use of the network effectively, with
examples of problems appearing frequently in the railway press, for instance with
shortage of capacity for additional trains on the Thameslink routes into London causing
heavy overcrowding (Modern Railways 1999, 2). The problems of success are not
unique to Britain; the European Union is concerned over potential constraints imposed
on growth and is undertaking work on path allocation where a key objective is to make
best use of available capacity. A key limitation is the ability of train planning processes
to support that objective (European Union, 1998).
It is therefore perhaps surprising that there is little published research on train planning
processes or systems, other than papers describing the development of theoretical
optimisation algorithms or packages.
Documenting investigations into train planning processes and systems undertaken by
the author over the last decade, this thesis to a limited extent fills this gap. It is in two
parts: in the first, the author looks at train planning processes (and the industry and
organisational objectives that must drive them); in the second he addresses the software
13
that is needed to support the processes. The motivation behind the train planning
process research has not been just to fill a knowledge gap, but also to attempt to record
and reflect (‘sense-make’) the problems faced by railway timetable practitioners,
including the author, from the 1990s through to 2007.
One of the conclusions reached by the author through his train planning process
research is that software is needed to improve delivery of results that meet the
objectives set for the train planning process. Hence the second part of this thesis is
used to investigate how promising software could deliver improvements. A literature
review of software development in the area led to the discovery of ground breaking work
using heuristics by a team of researchers in The Netherlands (Kroon, 1998) and by
Carey of the University of Ulster (Carey,1994 and 1995) that offered the potential to
make a ‘step change’. An up to date set of references is provided in Chapter 8. A
chance conversation (if such a thing exists) with Grahame Cooper of Railtrack led to an
invitation by Railtrack and AEA Technology Rail to review their ‘proof of concept’
simulated annealing approach to generating railway timetables. In parallel to this an
opportunity arose to work with Railtrack (and subsequently Network Rail) to find a way to
better assess the robustness of timetables and, hence, it has been possible to evaluate
two key areas where software can support train planning processes.
Some selectivity in the areas investigated is inevitable, to keep the thesis within
manageable bounds. It would have been interesting to look in more depth at diagram
optimisation systems and in fact TrainTRACS, the Leeds University train crew
diagramming tool, and DISPO, a rolling stock diagramming tool from Hanover University
have been evaluated less formally by the author for potential business use.
There has been a strong focus throughout the research on the situation in Britain, a
limitation that is justified again on the need to keep the research to a manageable size.
Britain’s railway industry has continued to change as the research has been under way.
This is most visible structurally, with the demise of Railtrack (replaced by Network Rail)
and of the Strategic Rail Authority (with its functions taken over by the Department for
Transport and Network Rail). In addition the train planning processes have been
evolving (as discussed in Chapter 4) and the systems that support train planning have
14
gradually improved. The author has sought to ensure that in all cases the various
strands of research present an up to date picture (i.e. up to 2007).
1.2 Aims
The author had three aims in undertaking this research:
Firstly, he aimed to codify and analyse the processes which are used to develop train
plans and the extent to which they meet the objectives that they might be expected to
meet.
Secondly, he aimed to understand the impact that privatisation of the railways in Britain
has had on train planning processes.
Thirdly, he aimed to investigate selected new and innovative software approaches that
might make a material difference to the effectiveness and/or efficiency of train planning
processes.
1.3 Objectives
Specific objectives have been:
1. To describe train planning processes at a high-level and to discuss generic
issues with these processes;
2. To describe the timetabling processes as they existed in Britain prior to
privatisation;
3. To describe how the processes changed at the point of privatisation and to
assess the issues that the new processes created;
4. To describe how the processes have subsequently evolved and to assess the
extent to which they are now ‘fit for purpose’;
5. To understand the objectives that train planners should be attempting to
meet;
6. To understand what railway practitioners (timetablers and managers) think
15
needs to be done to improve train planning processes;
7. To describe the current role of software in supporting timetabling processes;
8. To understand the key gaps in software support;
9. To investigate selected promising software avenues for making a material
improvement to the quality of the efficiency and effectiveness of train
planning.
1.4 Publications and Use of Data Collected by Other
Researchers
A number of the chapters of this thesis contain material from papers by the author
already published in academic journals or presented at academic conferences. Details
are provided in the introduction to each chapter and papers are referenced in the text
where appropriate.
The analysis of primary data collected by two other researchers, Anzir Boodoo and Ian
Bradshaw, has formed an important part of two chapters. Anzir interviewed a number of
industry personnel in an EPSRC funded research project supervised by the author, to
understand the objectives that timetable generation tools should be seeking to achieve
(see chapter 5) and Ian, in a Railtrack funded research project, trained as a PTG user
and ran PTG under supervision (see chapter 7). In both cases the analysis and
conclusions in this thesis are entirely those of the author.
16
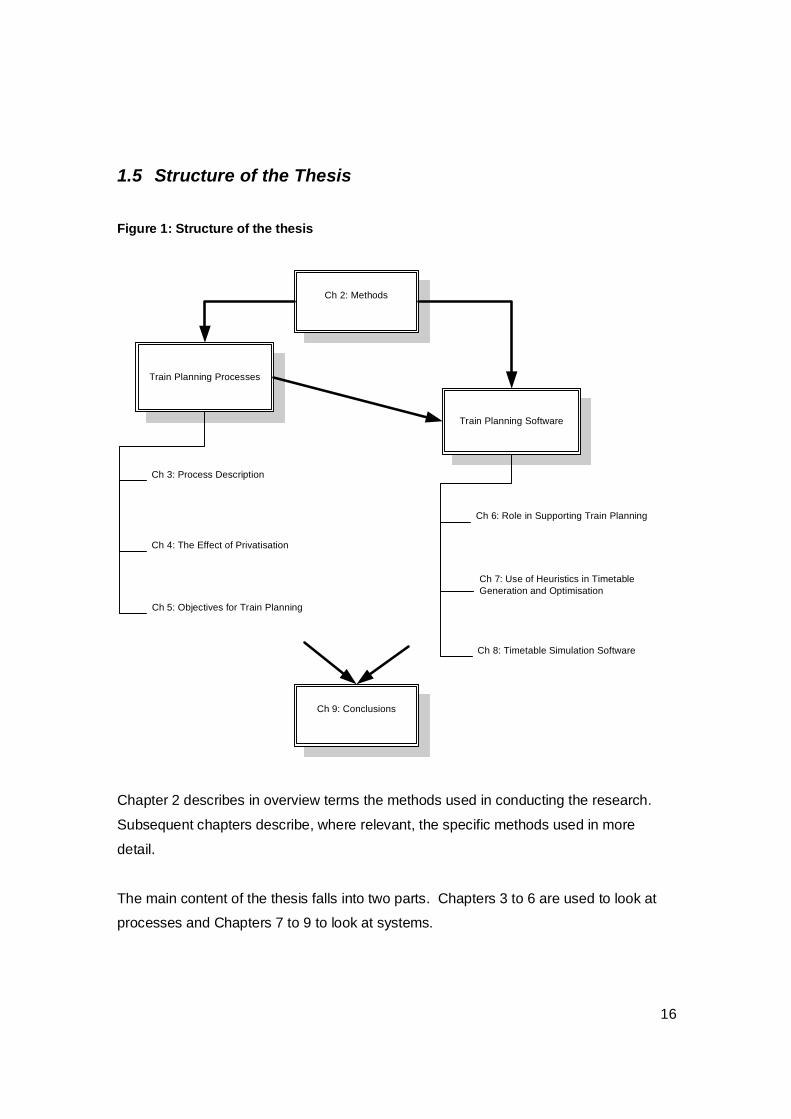
1.5 Structure of the Thesis Figure 1: Structure of the thesis
Train Planning Processes
Ch 3: Process Description
Ch 4: The Effect of Privatisation
Ch 5: Objectives for Train Planning
Train Planning Software
Ch 6: Role in Supporting Train Planning
Ch 7: Use of Heuristics in Timetable Generation and Optimisation
Ch 8: Timetable Simulation Software
Ch 2: Methods
Ch 9: Conclusions
Chapter 2 describes in overview terms the methods used in conducting the research.
Subsequent chapters describe, where relevant, the specific methods used in more
detail.
The main content of the thesis falls into two parts. Chapters 3 to 6 are used to look at
processes and Chapters 7 to 9 to look at systems.

17
Chapter 3 investigates train planning processes and then Chapter 4 looks at the effect of
UK rail privatisation on those processes.
Chapter 5 explores the high level objectives that the train planning processes should be
focused on achieving, together with more operational objectives from railway managers
and train planners. The extent to which these objectives are being met is considered.
Chapter 6 considers the role of software in supporting train planning before Chapters 7
and 8 explore two specific areas of software development, the former the use of
heuristics in timetable generation and optimisation and the latter timetable simulation
tools.
Chapter 9 draws conclusions and considers the overall value of the research
undertaken.
An Appendix and References follow.
The provision of a Glossary of key railway terms was considered, but a perfectly good
reference document is provided by Ford (2007), accessible via the World Wide Web.

18
2 METHOD
2.1 Introduction
The research undertaken by the author and reported in this thesis falls into the general
category of management research, focusing on a key business process, the objectives
that drive the process and the systems that support the process.
There is on going debate amongst academics as to the research methods most
appropriate to management research. This chapter is used to set out the philosophical
basis adopted by the author for the research and to explain the choices of method made,
justifying their appropriateness within the constraints of time and resource inevitably
imposed by the requirement to submit a thesis within a reasonable timescale.
2.2 Philosophical Assumptions and Discussion of Possible
Research Methods
2.2.1 Key Texts
Many PhD theses at this point set out in detail standard descriptions of different
philosophical positions. Rather than do this, readers are referred to a seminal text on
this subject - Sociological Paradigms and Organisational Analysis, by Burrell and
Morgan (1979), which the researcher was lucky enough to study at length under the
tutelage of Dan Gowler, the social anthropologist, and to more recent texts providing
overviews of the issues for researchers (Gill and Johnson, 2002; Easterby-Smith et al,
2002; Remenyi et al, 1998). In addition, the researcher’s Master of Philosophy thesis
Towers and Turnover: an action research study of induction and socialisation in a
voluntary organisation (Watson, 1982) briefly discusses ontological and epistemological
issues in designing research.
The following high level discussion is constructed around these texts.
19
2.2.2 Positivism vs. Relativism and Social Constructivism
Positivism adopts the premise that “the social world exists externally, and that its
properties should be measured through objective methods rather than being inferred
subjectively through sensation, reflection or intuition” (Easterby-Smith et al., 2002).
These authors have combined the work of a number of writers (e.g. Comte,
Wittgenstein, Pears) to provide the following list of factors that apply in positivist
research:
• Independence: the observer must be independent from what is being observed;
• Value free: how and what to study can be determined by objective criteria;
• Causality: the purpose of research is to identify causal explanations and
fundamental laws;
• Hypothesis and deduction (rather than using inductive reasoning);
• Operationalisation: concepts need to be operationalised in a way which enables
facts to be measured quantitatively;
• Reductionism: problems as a whole are better understood if they are reduced
into the simplest possible elements;
• Generalisation: it is necessary to select samples of sufficient size to enable
inferences to be drawn about the wider population;
• Cross sectional analysis: regularities can most easily be identified by making
comparisons of variations across samples.
House (1970) provides further clarity as to the requirements of positivist investigation:
• A priori hypotheses;
• A priori criteria to measure the acceptability of those hypotheses;
• Isolation and control of the variables under investigation;
• Pre-determined methods of measuring and verifying the variables in the
investigation.
Positivist research favours quantitative data collection and statistically valid data analysis
methods, with deductive reasoning to confirm hypotheses.

20
Relativism and Social Constructivism focus on the ways that people make sense of the
world. Research should focus on understanding why people have different experiences
and different views.
Typically research uses relativist, interpretive, qualitative methods and inductive
reasoning (the reverse of deduction), moving from observation to explanation and
theory, consistent with the view of Glaser and Strauss that explanation of social
phenomena are relatively worthless unless they are grounded in observation and
experience (Glaser and Strauss, 1967).
Examples of positivist research methods are experiments in the physical sciences and
large scale surveys in the social sciences, looking to produce statistically valid results.
Examples of relativist research methods are ethnography, which uses modes of inquiry
such as participant observation, very often used to explain social or behavioural issues
rather than to understand process and seen as an alternative to surveys and
experiments (see e.g. McGrath 1989) and action research, where the research no longer
tries to maintain a separation from the thing that is being researched but actually tries to
change outcomes as part of the research. Rappoport (1970) explains that action
research “aims to contribute both to the practical concerns of people in an immediate
problematic situation and to the goals of social science by joint collaboration within a
mutually accepted ethical framework”.
Methods such as these are good for looking at change over time and are often regarded
as a natural rather than artificial way of gathering data - but there are serious issues to
consider. Data collection can take a lot of time and resource and data collection and
analysis relies on interpretation by the researcher and therefore may be coloured by the
researcher’s views. Results are often ‘untidy’ because issues emerge during the
research process that it is not possible to go back and investigate thoroughly. Most
seriously, the results may not be convincing to all interested parties due to their
‘subjective nature’ and lack of statistical significance (making it difficult to generalise) –
especially to those most comfortable with the positivist paradigm.
21
2.2.3 Case Studies
Case studies are an important method of research, particularly for researchers
investigating phenomena using a relativist framework. Yin (1994) defines a case study
as “an empirical inquiry that investigates a contemporary phenomenon within its real-life
context; when the boundaries between phenomenon and context are not clearly evident;
and in which multiple sources of evidence are used. He further notes that in general,
case studies are the preferred strategy when ‘how’ or ‘why’ questions are being posed,
when the investigator has little control over events, and when the focus is on a
contemporary phenomenon within some real-life context”. Yin quotes Schramm (1971)
stating that “the essence of a case study…is that it tries to illuminate a decision or set of
decisions: why they were taken, how they were implemented, and with what result” and
highlights that case studies are effective in organisational and management studies,
amongst others. Yin further notes that case studies “cope with the situation in which
there will be many more variables of interest than data points and one result relies on
multiple sources of evidence, with data needing to converge in a triangulating fashion,
and as another result benefit from the prior development of theoretical propositions to
guide data collection and analysis”.
Case studies can be categorised as exploratory (pilot); descriptive (what) , explanatory
(why) (Yin 2003), with exploratory case studies being undertaken without clear expected
outputs, typically as a pilot prior to undertaking more in depth studies with clear
objectives, descriptive case studies seeking to explain what is happening and
explanatory case studies seeking to explain why something is happening.
2.2.4 Sequencing research
A further dimension to be considered is whether the research is to be fixed ‘at a point in
time’ or to be a longitudinal study – “a study that extends over a substantial period of
time and involves studying changes over time”, Remenyi et al. (1998).
Validity of results (‘warranty’ in the definition above) is a particularly important issue
whatever research methods are employed – it is necessary to ensure that results are
repeatable (or if this is not possible, then that there is reasonable evidence to suggest
22
that another researcher following the same research methods would produce similar
results), rigorous (for most research, unfounded speculation should not form a significant
part of the work) and without bias.
Bechhofer observed that “the research process is not a clear-cut sequence of
procedures following a neat pattern but a messy interaction between the conceptual and
empirical world, deduction and induction occurring at the same time” (Bechhofer, 1974).
Gill and Johnson further note that:
• there is no single method which generates scientific knowledge in all cases
• these methods may be inappropriate to the social world of management
• knowledge generation is affected by the goals of managers and their ways of
measuring success.
2.2.5 Quantitative v Qualitative Research Methods
Bryman (1988) suggests that quantitative and qualitative research are sometimes
viewed as competing views about the way in which social reality ought to be studied.
For other writers, they are simply different ways of conducting social investigation and
are appropriate to different kinds of research question. Bryman further notes that
qualitative research presents a “processual view of life” whereas quantitative research
provides a static account. These thoughts lead to the idea of triangulation, that is to use
a variety of data sources and methods to look at a problem from different directions, c.f.
Ragin (1987), Gable (1994), Deacon, Bryman and Fenton (1998).
Watson T (1997) notes that management research is widely regarded as
multidisciplinary in nature, with therefore the potential to draw on a range of research
traditions. To a researcher this can be both a strength and a challenge. It enables the
researcher to select the methods that he regards as most appropriate but yet he faces
the challenge (both self-imposed and by fellow researchers) that other methods might be
more appropriate (Knights and Willmott, 1997; Brown 1997).
A number of writers (e.g. Kuhn 1970, Giddens 1978) develop the above ideas to
conclude that the choice of research method is contingent on the issue being studied –
23
and this is the view that has been adopted in this research.
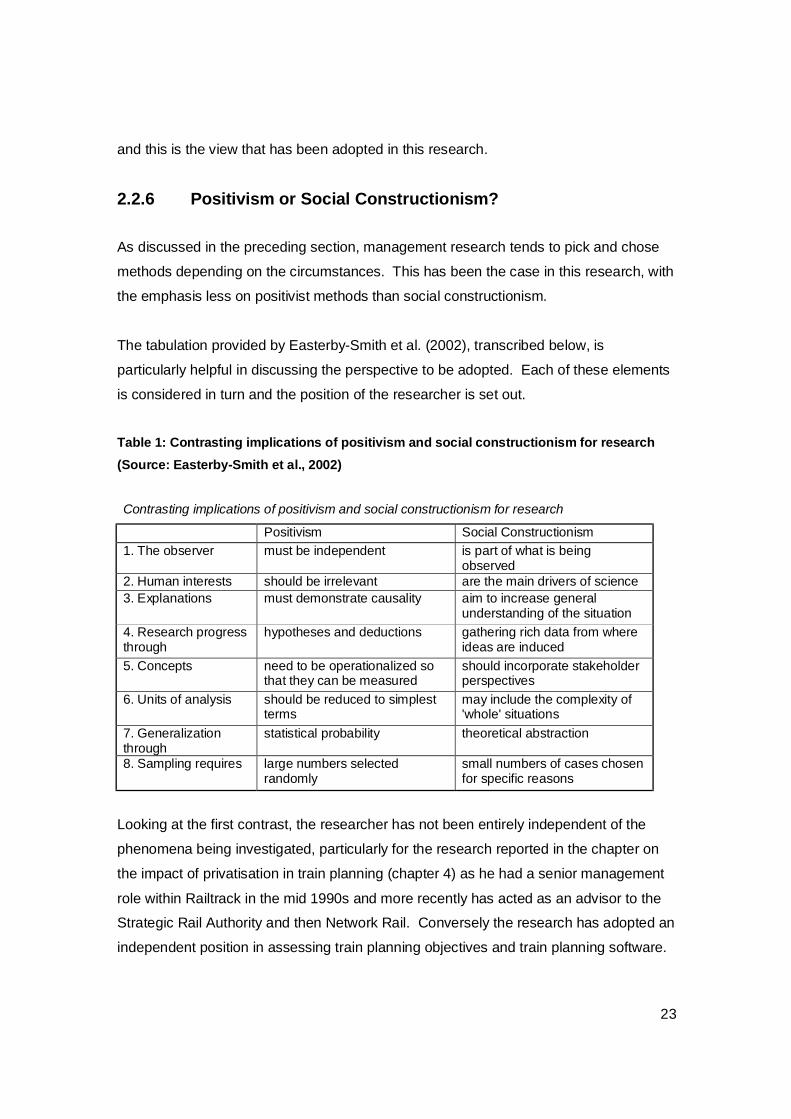
2.2.6 Positivism or Social Constructionism?
As discussed in the preceding section, management research tends to pick and chose
methods depending on the circumstances. This has been the case in this research, with
the emphasis less on positivist methods than social constructionism.
The tabulation provided by Easterby-Smith et al. (2002), transcribed below, is
particularly helpful in discussing the perspective to be adopted. Each of these elements
is considered in turn and the position of the researcher is set out.
Table 1: Contrasting implications of positivism and social constructionism for research (Source: Easterby-Smith et al., 2002) Contrasting implications of positivism and social constructionism for research
Positivism Social Constructionism 1. The observer must be independent is part of what is being
observed 2. Human interests should be irrelevant are the main drivers of science 3. Explanations must demonstrate causality aim to increase general
understanding of the situation 4. Research progress through
hypotheses and deductions gathering rich data from where ideas are induced
5. Concepts need to be operationalized so that they can be measured
should incorporate stakeholder perspectives
6. Units of analysis should be reduced to simplest terms
may include the complexity of 'whole' situations
7. Generalization through
statistical probability theoretical abstraction
8. Sampling requires large numbers selected randomly
small numbers of cases chosen for specific reasons
Looking at the first contrast, the researcher has not been entirely independent of the
phenomena being investigated, particularly for the research reported in the chapter on
the impact of privatisation in train planning (chapter 4) as he had a senior management
role within Railtrack in the mid 1990s and more recently has acted as an advisor to the
Strategic Rail Authority and then Network Rail. Conversely the research has adopted an
independent position in assessing train planning objectives and train planning software.

24
Human interests (point 2) are very much a feature of many elements of management
and these are important in a number of chapters of this thesis – the views and objectives
of managers and train planners during the privatisation process (chapter 4) and
subsequently (chapter 5) are personal things. On the other hand, description of train
planning processes and software are concrete, physical things.
The complexity of the issues discussed has meant that demonstration of causality has
been difficult and ‘cause and effect’ conclusions are only tentative. An increase in
general understanding has been achieved, as the social constructionist would require,
but it has also been the intention of this research to go further than this, making
recommendations for change, more the territory of the positivist. Increasing general
understanding is the purpose of the early sections of most of the chapters that follow;
recommendations for change are provided at the end of each chapter.
A mixture of hypotheses (positivism) and induction (social constructionism) has been
used, with, for instance, a hypothesis made at the start of chapter 4 (regarding the
impact of privatisation on train planning) whereas chapter 5 on the other hand uses
induction to develop a set of objectives for train planning.
Again we see in point 5 that the methodology adopted in this research crosses the divide
between positivism and social constructionism. Operationalisation of concepts is a key
aim of this thesis, consistent with positivist methodologies, whilst incorporation of a
variety of perspectives (e.g. managers, train planners) has been achieved too.
Regarding units of analysis, complexity is a key facet of train planning and it has
therefore proved difficult to reduce the analysis to simple terms.
Theoretical abstraction has been the only method of generalisation possible, as
statistically significant results either were not achievable due to the scope of the
research (focusing on a single process in a single situation, effectively a case study) or
not possible due to the resources that would have been required to achieve statistical
significance (for instance considering the effectiveness of stochastic simulation to model
reality).

25
The research has considered specific cases for specific reasons; sample sizes have not
been statistically significant – one process in one railway, one or two case studies,
interviews with the majority of people involved in a process but with this amounting to
only a dozen interviews.
It can be concluded from this analysis that this research does not naturally fit into either
the positivist or social constructionism traditions but rather elements of both are used as
the research considers appropriate.
2.3 Data Collection
2.3.1 Introduction
Specific research techniques used have included literature reviews (documented in each
chapter), interviews undertaken by the researcher, use of interview data sets where the
interviews have been undertaken by other researchers, informal interviews and
discussions with academics, managers and train planners, discussions with software
companies and formal ‘desk top’ comparisons of different software packages, process
analysis and data flow workshops, hands on use of software packages, familiarisation
visits to European railways and also Japan and Korea.
The following sections provide further detail on key data collection techniques:
• Reviews of internal railway documents;
• Interviews with railway personnel (managers and train planners);
• Participant observation by the author whilst working within train planning;
• ‘Hands on’ experience of train planning tools has providing a ‘user’ view of the
systems and enabling issues to be discovered by the author first hand.
2.3.2 Internal railway documents
Internal documents from Railtrack and Network Rail have been referred to extensively by
the author in developing a full understanding of train planning processes, objectives and
systems.
26
Some documents used by the author date back to before privatisation. Willis (1992)
reviews the train planning processes in place prior to privatisation and the Timetable
Planning Strategic Development Group (1993) sets out the results of analysis aimed at
designing new processes that were intended to function effectively in the privatised
railway.
A number of documents relating to train planning processes and systems during the
period of rapid change from 1994 to 1999 have provided source material, including
APlan 2 – User Requirements Specification, produced by Railtrack in 1994, which set
out the system changes that would be required to enable the new train planning
processes introduced at privatisation to work satisfactorily and The APlan Project –
Lessons Learned Report, written by Johnson (1996) which set out why the system
changes did not deliver as required. Papers to Class Representative Committee (1996),
and the Railtrack Timetable Project Control Group (1996) provide background to the
process changes that were required to deliver timetables more effectively whilst Loose
and Temple (1997) give insight into the internal problems that Railtrack’s train planning
organisation had during this period. Two documents from the Office of the Rail
Regulator (1997, 1998) provide the only published evidence regarding the problems
caused to train planning processes by privatisation, other than somewhat less
considered comments in the press, c.f. Daily Telegraph Editorial (1995) Timetable of
Errors and the chapter on timetabling in Wolmar’s book The Great British Railway
Disaster (1996).
More detailed documents on train planning processes called on in the writing of this
thesis include those developed by the author and endorsed by Sven Hjorth-Johansen, a
Norwegian train planning practitioner, whilst working on the Gardermoen Railway Project
(1998-9), the new railway from Oslo city centre to the airport at Gardermoen. Key
documents referred to relating directly to train planning in Britain are those produced by
O’Brien (2002 and 2004), Project Director for Operational Planning Business Change for
Railtrack from 2000 to 2002 and then Head of Access Planning at Network Rail from
2004 until 2007, during a major review of train planning processes and systems
undertaken by Railtrack and then Network Rail.

27
Training material used by Railtrack has also been referred to: Operational Planning
Training (Level 1) Student Notes and Operational Planning Training (Level 2) Student
Notes, Railtrack (Railtrack, 2000).
2.3.3 Interviews
Two sets of semi-structured interviews have been drawn on in this thesis.
The Author supervised an EPSRC-funded research during 2001 and 2002. The primary
purpose of this research was to document train planning processes and objectives that
train planning should seek to meet. The data collection exercise undertaken by Boodoo
consisted of a series of semi-structured interviews with stakeholders in the railway
timetabling process in the UK. The interviews included management from passenger
operators from the former Inter City, Network South East and Regional Railways groups
(GNER, West Anglia Great Northern and Arriva Northern respectively), Railtrack/
Network Rail, a Passenger Transport Executive (West Yorkshire), the Strategic Rail
Authority (SRA) and the Office of the Rail Regulator. The interviewees held various
positions, from timetablers working on the mechanics of the timetabling process to
management and strategic roles. Questions asked and areas explored were:
• Objectives for timetabling;
• Timetabling process (details of the process and fitness for purpose);
• Timetabling constraints;
• Defining a ‘good’ timetable;
• Conflict resolution;
• Success criteria for timetabling.
Boodoo produced a full transcript of the interviews undertaken.
In addition to providing insights into objectives, the transcripts revealed contentions and
conflicts within the current processes and also wider issues regarding the industry
structure in the UK. Practitioners revealed how they overcame the problems they faced
and highlighted the practical differences between the theory and practice of the
timetabling process. Outputs included process charts validated by interviewees (e.g.

28
Timetable Development Outline charts produced in August 2001) which provide more
detailed description than is incorporated in this thesis, and which support the analysis
contained in chapters 3, 4 and 5.
The author undertook a series of semi-structured interviews in April 2005 focused on
train planning processes. This gave the opportunity to cross check the findings of
Boodoo and ask some further questions. The interviewees were George Muir (Director
General, ATOC), Mark Phillips (Operations Director, ‘one’ Railway) , Nicola Shaw
(Director, Strategic Rail Authority), Julie Rickard (Demand Forecasting Manager,
Network Rail), Andrew Haines (Managing Director, South West Trains) and Mark
Leadbetter (Train Planning Manager, Freightliner). Subjects discussed were:
• The effectiveness of the annual timetable development process;
• The degree of discipline in the process;
• The need for the bid and offer process described in chapter 4;
• The split of work between NR and TOCs;
• The effectiveness of short term planning processes (and how they could be
improved);
• The effectiveness of strategic access planning.
2.3.4 Participant Observation
The author worked in the railway industry until 1997 (for British Rail and then Railtrack);
during this time he had the opportunity to learn about train planning processes and
systems as a manager of the train planning function.
Since 1997 he has worked for the railway industry (in the UK and Scandinavia) as a
management consultant, in parallel to undertaken research into train planning
processes, objectives and systems.
All of the positives and negatives of undertaking research whilst being directly involved
in the object of the research inevitably apply. In particular the author has throughout this
period been very aware of the risk of lack of objectivity due to commercial and financial
priorities. It is believed that this risk has been minimised through peer review of many
29
sections of this thesis prior to publication in journals or presentation at conferences and
by back-checking the conclusions with train planning practitioners (e.g. with Godfrey
Willis, who has reviewed and provided comments on the completed thesis).
2.3.5 ‘Hands on’ Experience of Train Planning Systems
The author has had ‘hands on’ experience of some of the systems assessed in chapters
7 and 8; in addition he was able to gain understanding and views from other users of the
systems from Railtrack and the software supplier in the preparation of the paper on
timetable generation presented in Berlin (Watson et al. 2000) and the papers on
simulation referenced in chapter 8.
Time did not permit ‘hands on’ experience of all the systems discussed and so this has
been supplemented by ‘desk top’ comparison.
2.3.6 Justification of methods used
The primary factors in the choice of methods were suitability for understanding the
subject matter and the availability of time and resource.
The complex and often undocumented nature of train planning has led to the author
using whatever data he could find, with internal documents being employed to a
considerable extent, with this data corroborated and embellished through semi-
structured interviews.
Given more time, more interviews would have been undertaken giving greater reliability
to the conclusions drawn, more ‘hands on’ investigation of software would have led to
less reliance on considering research already undertaken by others and some of the
recommendations for further work would have been undertaken by the author, rather
than being left for others to follow up at some point in the future.
30
2.4 Conclusions
Gill and Johnson (2002) state that “research methodology is always a compromise
between options in the light of tacit philosophical assumptions, and choices are
frequently influenced by the availability of resources”.
This chapter has sought to avoid the pitfall of keeping philosophical assumptions tacit,
whilst highlighting that management research often, as here, uses both positivist and
relativist/social constructionism methods, as appropriate.
Availability of resources has constrained the methods of research that could be adopted
and the preceding section has set out these limitations.
For the purposes of clarity, each chapter has it own ‘methods’ section describing the
specific research techniques employed.
31
3 TRAIN PLANNING PROCESSES
3.1 Introduction
In this chapter the author describes train planning processes. Key terms are defined,
time horizons for train planning discussed and a detailed description is provided.
Various issues and complexities are then discussed and a brief comparison provided
with manufacturing process scheduling.
The primary research significance of this chapter is that it sets out a detailed description
of train planning processes in a form that can be readily used by researchers and
educators. It provides an essential building block for the rest of this thesis.
Elements of the early sections of this chapter have been published in the Handbook of
Transport Systems and Traffic Control (Watson, 2001); in addition the section on
iteration was presented to the Second International Conference on Managing
Enterprises (Watson and Humphries, 1999).
3.2 Method
This chapter takes the limited literature on this subject and combines it with unpublished
work on the processes that existed within British Rail prior to privatisation, e.g. Willis
(1992), Timetable Planning Strategic Development Group (1993). To this is added
material from internal Railtrack documents produced during an attempt to fully map the
processes in 2000 and 2001, c.f. O’Brien R. (2002), and from the direct investigation of
the processes by the author.
Terms used by train planners have been defined and these definitions tested with them
to ensure they convey the intended meaning. Similarly the process steps have been
discussed with train planning practitioners to ensure that they are accurate.
32
3.3 Literature
A number of published papers that are predominantly about computer scheduling
provide an outline of train planning processes (cf. Caprara et al 1997). Outlines have
also been provided in the context of more general descriptions of railway processes
(Ford and Haydock 1992, Ferreira 1997). Each of these gives an explanation of the
stages of the train planning process and the methods (e.g. graphing) used by train
planning.
It is necessary to go back some considerable time to find detailed, published,
descriptions of train planning processes. Three books from the 1930s have been found,
each of which has a chapter on train planning. The process description and
accompanying commentary is still relevant, 70 years on.
Railways To-day (Williamson, 1938) in a book describing all key elements of the railway
system (route, gauges, track, locomotives etc.) has chapters on operating passenger
traffic, operating freight traffic and traffic control. Two quotations follow that relate to
train planning:
“It might be hastily assumed that the construction of a time-table of trains was likely to be
as dull and dreary a task as the compilation of a calendar or the making of a ready-
reckoner. In fact, the making of railway time-tables is a complicated and fascinating
business, which forms a whole-time occupation for a very large staff of experts specially
trained for the work.
Let us realize that a railway time-table is a most complicated and delicate structure
pieced together with the greatest pains, and any – even the slightest – disturbance of it
may have far-reaching consequences difficult to foresee. … A time-table is like a castle
of cards, liable to be ruined by clumsy meddling with a single card.”
Williamson then describes in detail how to develop a train graph and considers rolling
stock and planning the use of staff.
33
Practical Railway Operating (Hare 1930?), a supplement to British Railway Operations
(Hare 1930), provides an in-depth analysis of capacity utilisation, how to measure it and
how to make more capacity available and then goes on to discuss how to plan the
timetable and people as efficiently as possible (a topic that has very much re-emerged
today as the number of train services operated increases).
British Railways To-day (Fenelon, 1939) has a chapter entitled ‘Some Problems of
Railway Operating’ and within this a section on ‘The Working Time-table’. Fenelon starts
by saying: “in arranging the train services, many considerations have to be taken into
account, including the convenience of the public, the timing of the trains, provision of
rolling stock and locomotives, and the duty rosters of guards and drivers. All these
involve special consideration, and they have often to be balanced against each other
before the arrangements can be completed.”
Descriptions of working timetables and timetable graphs are followed by pertinent words
about the importance of developing a timetable that enables trains to run punctually. A
discussion of efficient planning of trains and people concludes the section on the
working timetable.
Whilst only of peripheral interest to the research topic of this thesis, Pachl (2002)
provides a good primer on railway operation and planning from a technical rather than
process perspective (e.g. looking at how to calculate running times and how to measure
capacity) and Pachl (Ed.) (2008) covers similar ground but with more depth and with
input from a number of leading academics in this area.
3.4 Key Terms in Train Service Planning
Wren (1996) provides definitions for a number of commonly used terms, in particular
scheduling, timetabling and rostering. The term train planning will be used here in a
manner that matches with Wren’s wider definition of scheduling; one that is also familiar
to train planning practitioners across Europe. Train Planning will be taken to cover:
• Timetable planning (accommodating train services on the railway network,
subject to the constraints imposed by the physical characteristics of the network

34
and the need to maintain and renew it);
• Locomotive/rolling stock planning (usually called ‘rolling stock diagramming’);
• Train crew planning (usually called ‘train crew diagramming’);
• Train crew rostering (a rotating linking of the train crew diagrams to spread the
work between members of staff to meet predefined rules).
These last three stages are often known collectively as resource planning.
Some definitions are now provided, constructed by the author from his researches:
Railway Scheduling or Train Planning is the process by which the ‘demand’ for rail
transport (passenger and freight) is brought together with ‘supply side’ constraints (such
as available infrastructure capacity, rolling stock and staff) to produce timetables and
resource plans that meet the demand at an appropriate level of cost.
Timetables show how trains travel over time and usually take the form of 'tables' or
'time-distance graphs'.
Resource plans map rolling stock and staff to the trains that are in the timetables,
taking into account all the operational, legal and trades union rules that need to be
applied.
Schedulers or planners are the railway personnel who put together timetables and
resource plans. For very small railways (for instance a city centre to airport rail-link)
there may be just one or two planners, responsible for the whole process; major
railroads and national railways will have up to several hundred train planners, with
different groups of staff responsible for timetabling and resource planning and individual
staff specialising in particular tasks within the process.
3.5 Time Horizons
Train Planning is undertaken at different times for different reasons.
Strategic Planning. This is where changes to the infrastructure are being considered
35
and ‘what if’ questions are being asked, typically looking 2 to 10 years ahead. This is
also known within the UK railway industry as Advanced Timetable Development and
Capacity Planning. ‘Back of an envelope’ assessments are undertaken, e.g. what train
service could be operated if some extra trains were leased or what train service could be
operated if extra tracks were provided? As these ideas become firmer, detailed
timetables are produced to assess the likely performance of revised infrastructure
layouts (perhaps with additional platforms or a new passing loop to let fast trains
overtake slow trains) and to confirm the additional rolling stock required to operate a
proposed future timetable.
Network Rail has now centralised this activity in a ‘Strategic Access Planning Unit’.
Tactical Planning. This is train planning over a time horizon where the infrastructure
tends to be fixed, but the mobile resources (rolling stock and staff) can be varied in
quantity, quality and intensity of operation. Tactical planning is often split into ‘long term
planning’ and ‘short term planning’. Long term planning produces the timetables and
resource plans that are to be in operation typically for up to a year in the future; short
term planning makes the changes to this plan that are always needed to a greater or
lesser extent to cope with supply or demand fluctuations, from a few weeks to a few
days ahead of operation. An example of a supply fluctuation is a shortage of train crew
due to sickness; examples of demand changes are Statutory Holidays and special
occasions, such as major sporting events. The long term plan is produced over a
number of months and, particularly for passenger railways, has to be completed some
weeks or months before the new timetable comes into operation, to allow for publication
of new timetables for passengers and transmission to reservation and customer
information systems.
Up until 2003, each region of Britain had its own ‘Train Planning Unit’ undertaking this
stage of the timetabling process. The 7 units that existed at that point have now been
reduced to 3 (plus the Strategic Access Planning unit), reducing overheads and
interfaces.
Operational Planning and Control. However good the tactical planning process, real
time perturbations are an inevitable feature of transport operations. Rescheduling

36
ultimately takes place ‘real time’ to accommodate last minute changes in demand
(usually from freight customers), train failures and delays, infrastructure reliability
problems and staff sickness. Train make up, freight wagon routing (decisions about
which wagons go on which trains) and yard operation decisions are made at this point.
On Britain’s main line railway, ‘short term planning’ (up until about 24 hours before the
trains run) is undertaken in the Train Planning Units; after that any ‘very short term
planning’, together with reacting to problems ‘on the day’, is undertaken by regional
Control Offices.
Figure 2: Planning Time Horizons (Source: Author)
Figure 2 shows the planning horizons described in the above paragraphs and also
highlights that as the time horizon reduces the degrees of freedom reduce. During
strategic planning, most elements of the railway system can be changed, e.g. the
number of tracks can be increased, signalling can be enhanced, the number of train sets
in use can be increased or new trains purchased with different characteristics, but these
gradually become fixed as planning horizons reduce, due to the long lead times that are
inherent in significant capital expenditure. The only exception to this logic is that
shortfalls in availability (e.g. due to a major infrastructure failure) might require major re-
Little flexibility Much flexibility – All variables can be changed
Real Time – 3 days
3 days – 18 months
2 -10 Years
TACTICAL PLANNING
OPERATIONAL PLANNING
STRATEGIC PLANNING
Degrees of freedom decrease as time horizon reduces
37
planning very close to the day of operation.
3.6 Process Description
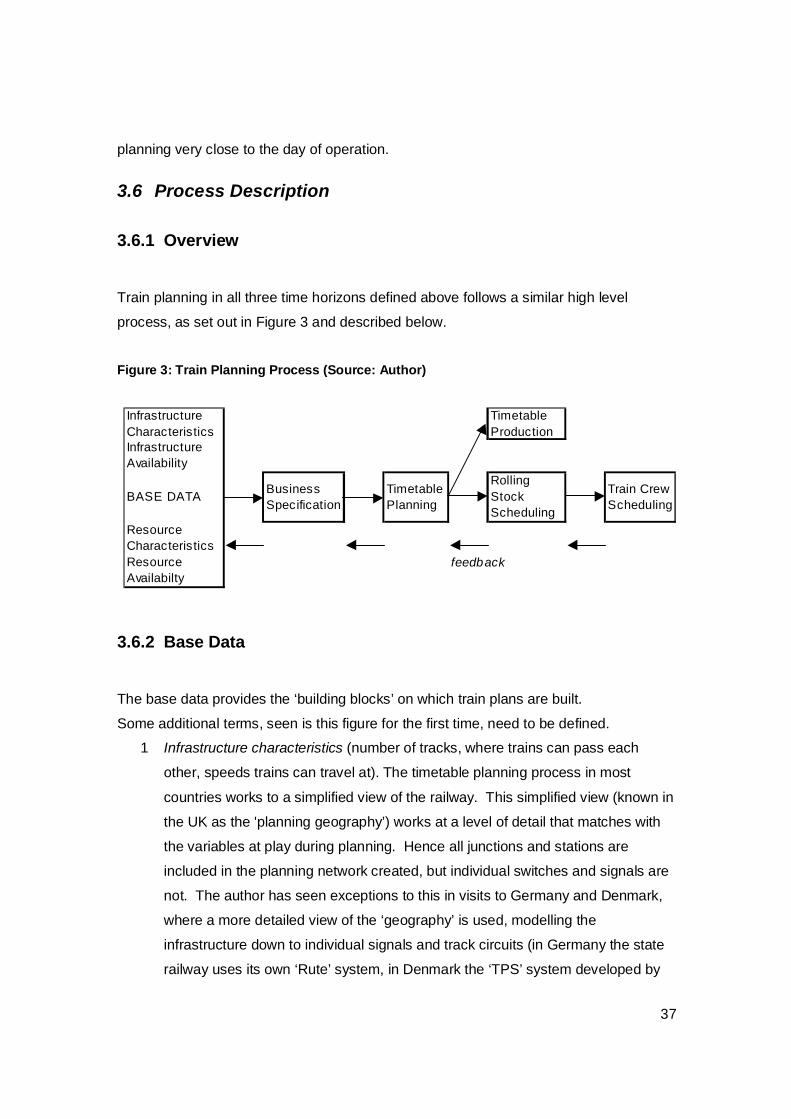
3.6.1 Overview
Train planning in all three time horizons defined above follows a similar high level
process, as set out in Figure 3 and described below.
Figure 3: Train Planning Process (Source: Author)
Infrastructure Characteristics
Timetable Production
Infrastructure Availability
BASE DATA Business Specification
Timetable Planning
Rolling Stock Scheduling
Train Crew Scheduling
Resource CharacteristicsResource Availabilty
feedback
3.6.2 Base Data
The base data provides the ‘building blocks’ on which train plans are built.
Some additional terms, seen is this figure for the first time, need to be defined.
1 Infrastructure characteristics (number of tracks, where trains can pass each
other, speeds trains can travel at). The timetable planning process in most
countries works to a simplified view of the railway. This simplified view (known in
the UK as the 'planning geography’) works at a level of detail that matches with
the variables at play during planning. Hence all junctions and stations are
included in the planning network created, but individual switches and signals are
not. The author has seen exceptions to this in visits to Germany and Denmark,
where a more detailed view of the ‘geography’ is used, modelling the
infrastructure down to individual signals and track circuits (in Germany the state
railway uses its own ‘Rute’ system, in Denmark the ‘TPS’ system developed by
38
HaCon of Germany is used). The TPS system is due to be implemented by
Network Rail during 2009 as its ‘Integrated Train Planning System, following
customisation to accommodate the larger network and greater number of train
operating companies in Britain;
2 Infrastructure availability (in practice often a statement of when the infrastructure
is ‘unavailable’). This indicates the constraints placed on when trains can run,
usually because the infrastructure is being maintained, renewed and enhanced.
These are sometimes known as engineering requirements. Typically, in Britain
this is achieved by allowing the engineer access to the track for a limited time
each night and for an extended period over a number of weekends. In mainland
Europe, greater flexibility in signalling systems and different working practices
allow much more work to be carried out ‘between trains’ during the week and the
weekend service is much less disrupted. These requirements will typically be
stated in the form of a maintenance ‘window’ – a period of hours on a daily,
weekly or occasional basis when trains are banned. In more limited
circumstances, it may also not be possible to run trains because signalling staff
or other key operating staff are not on duty;
3 Resource characteristics - whether particular rolling stock can run on particular
routes (limitations include gauge, curvature, weight or signalling interference) and
the performance characteristics of particular rolling stock on particular routes (in
particular the 'timings': the time it takes particular rolling stock to travel over every
leg of the planning ‘geography’);
4 Resource availability (rolling stock numbers, numbers of staff, locations).
3.6.3 Business Specifications
A key input to the train planning process is a business specification, setting out in
general terms the train service that is required. This comes at a high level from the
funders of the railway network (e.g. from the Department for Transport), who specify a
service level to be provided in the franchise agreements made with train operators. At a
more detailed and more frequent level, the marketing departments of the train operating
companies (or internal marketing department for an integrated railway) produce a train
service specification on the basis of past performance of services plus market research
to assess latent demand for rail services. This typically sets out the general service

39
pattern required (e.g. a stopping train every 15 minutes, a fast train every hour, stopping
only at specified stations).
It is normal for several, potentially conflicting, business specifications to be produced -
these specifications come from the differing requirements of customers of the railway.
Within unified state railways, specifications come from the different business units -
usually some combination of International, Inter City, Suburban, Regional and Freight;
for railways where there are a number of separate train operating companies competing
for access to the infrastructure, each will provide its own requirements. In either case
high level train service specifications (sometimes called ‘service plans’) will be produced,
indicating the general level of service required (e.g. number of trains per hour, the type
and stopping pattern of these trains). These specifications take into account the level of
resources (particularly rolling stock) available.
These specifications will have been put together to take account of overarching
objectives from stakeholders, in particular national and local government (in Britain
through the franchising process). The nature of these objectives is discussed in chapter
5.
Other factors taken into account are:
Market Research
For all railway services, it is essential to understand what your customers and potential
customers are prepared to pay for. Market research techniques vary substantially
depending upon the nature of the rail business, but they all feed into the service
specification stage.
Anticipated rolling stock availability
Rolling stock availability provides a finite cap on the service that can be offered. This
needs to take account not only of the number of physical units of rolling stock that will be
in the possession of the railway when the timetable comes into effect (this can be quite
difficult to predict with uncertainties about the delivery of new stock and possible
40
accident damage reducing the total fleet) but also the anticipated maintenance regime
and reliability.
Previous timetables and resource plans
Previous timetables are more often than not the basis of future timetables. This is partly
because demand does not usually change radically over the space of months or even a
few years and partly reflects the limitations on train planning resources that prevent
frequent ‘recasts’ of the timetable. Customer acceptance is also an issue - often
overlooked in Britain - where people become accustomed to particular service patterns
and are disorientated by change and react negatively, even where in principle the
changes are beneficial. Note the parallels here with the changes in 1998 to the BBC’s
Radio 4 schedules (BBC, 1998) and the discontinuation of Grandstand (The Times,
2006).
Rolling stock and train crew planning is also a complicated process and, where some
considerable time has been spent developing an efficient and reliable plan, rational
managers look to reuse it where possible.
3.6.4 Timetable Planning
Timetable Planning is sometimes known as Timetable Development or, in Britain,
Access Planning or, confusingly, as this term is also used to describe real time planning,
Operational Planning.
The train service specifications are passed to the timetable planners, whose task is to
produce timetables that are ‘conflict free’. This characteristic ensures that if the timetable
was worked to exactly in practice, no train would be delayed by any other.
Figure 4 provides an overview of the timetable development process; each stage is now
described.
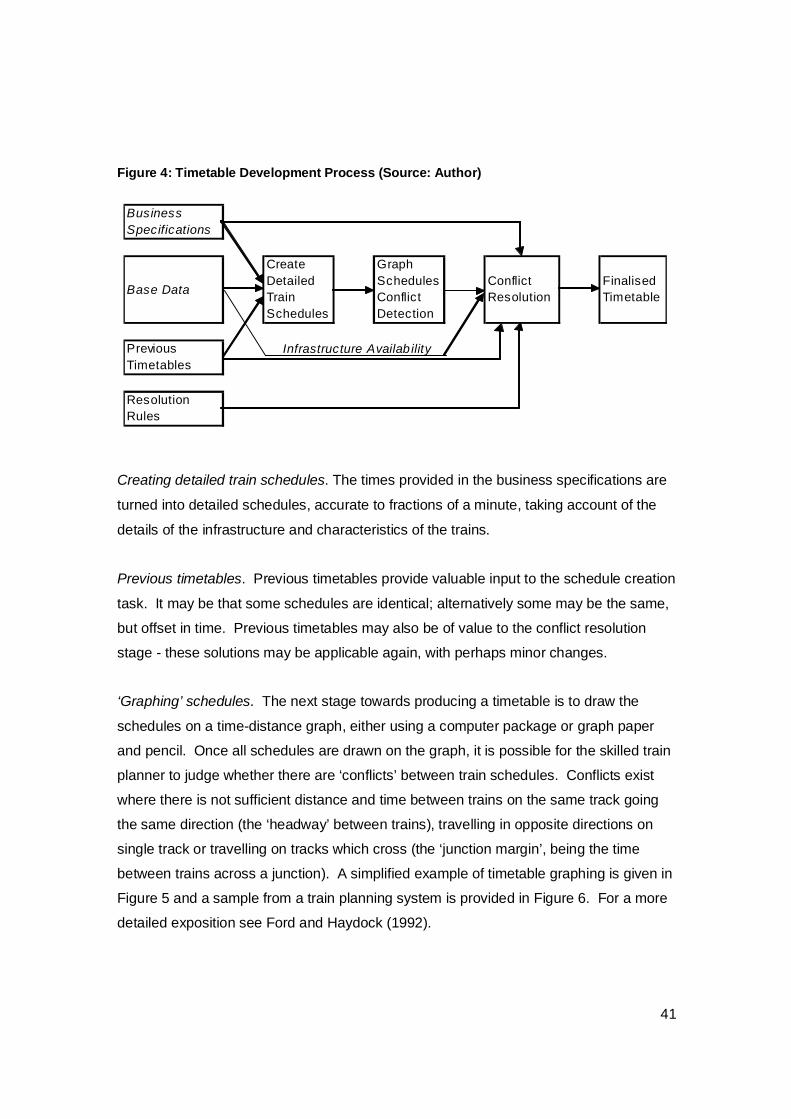
41
Figure 4: Timetable Development Process (Source: Author)
Business Specifications
Base Data
Create Detailed Train Schedules
Graph Schedules Conflict Detection
Conflict Resolution
Finalised Timetable
Previous Timetables
Infrastructure Availab ility
Resolution Rules
Creating detailed train schedules. The times provided in the business specifications are
turned into detailed schedules, accurate to fractions of a minute, taking account of the
details of the infrastructure and characteristics of the trains.
Previous timetables. Previous timetables provide valuable input to the schedule creation
task. It may be that some schedules are identical; alternatively some may be the same,
but offset in time. Previous timetables may also be of value to the conflict resolution
stage - these solutions may be applicable again, with perhaps minor changes.
‘Graphing’ schedules. The next stage towards producing a timetable is to draw the
schedules on a time-distance graph, either using a computer package or graph paper
and pencil. Once all schedules are drawn on the graph, it is possible for the skilled train
planner to judge whether there are ‘conflicts’ between train schedules. Conflicts exist
where there is not sufficient distance and time between trains on the same track going
the same direction (the ‘headway’ between trains), travelling in opposite directions on
single track or travelling on tracks which cross (the ‘junction margin’, being the time
between trains across a junction). A simplified example of timetable graphing is given in
Figure 5 and a sample from a train planning system is provided in Figure 6. For a more
detailed exposition see Ford and Haydock (1992).
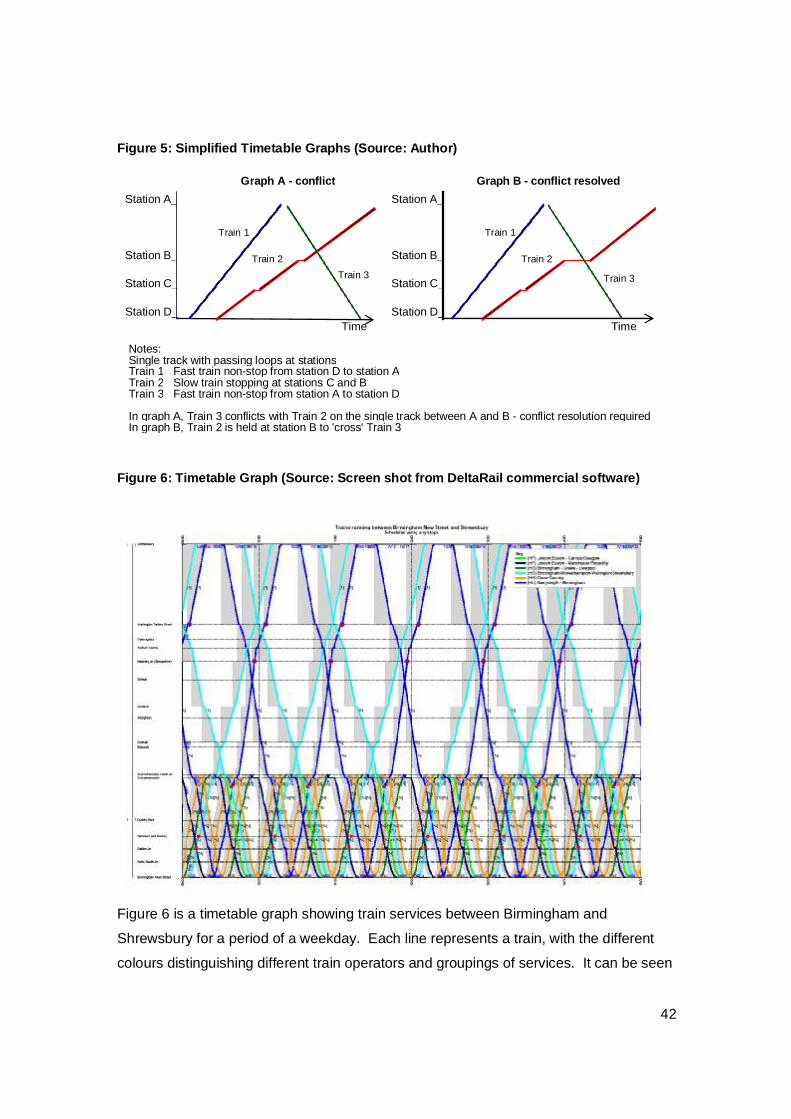
42
Figure 5: Simplified Timetable Graphs (Source: Author)
Figure 6: Timetable Graph (Source: Screen shot from DeltaRail commercial software)
Figure 6 is a timetable graph showing train services between Birmingham and
Shrewsbury for a period of a weekday. Each line represents a train, with the different
colours distinguishing different train operators and groupings of services. It can be seen
Graph A - conflict Graph B - conflict resolved
Station A_ Station A_
Station B_ Station B_
Station C_ Station C_
Station D_ Station D_Time Time
Notes: Single track with passing loops at stationsTrain 1 Fast train non-stop from station D to station ATrain 2 Slow train stopping at stations C and BTrain 3 Fast train non-stop from station A to station D
In graph A, Train 3 conflicts with Train 2 on the single track between A and B - conflict resolution required In graph B, Train 2 is held at station B to 'cross' Train 3
Train 1
Train 3 Train 2
Train 1
Train 3
Train 2

43
that the railway between Birmingham and Wolverhampton is very busy, with far fewer
trains between Wolverhampton and Shrewsbury. The shaded area behind each train
shows the time required before another train can travel on the section of line.
An alternative approach to producing graphs is to print out the schedules in tabular form
and to check for ‘headway’ or ‘junction margin’ deficiencies by comparing the times of
schedules at key locations.
Conflict resolution. Once conflicts have been detected, it is necessary to ‘resolve’ them.
In Britain the jargon ‘flexing’ has come to be used to describe the process whereby the
planner moves the schedules on the graph to achieve a conflict-free timetable, whilst, as
far as practicable, achieving the requirements in the business specification. Inevitably
on busy routes compromises are required; very skilful planners are required to achieve
satisfactory ‘paths’ (the term used to describe a train schedule once it has been put on
the graph) to meet all the business requirements. Sometimes this simply is not possible.
Resolution rules. There are rules about what represents a satisfactory solution - not only
must the basic infrastructure headway and junction margin rules be obeyed, but a set of
rules will apply regarding the extent to which it is acceptable to, say, increase the overall
journey time of an Inter City train to give a reasonably fast schedule for a freight train
Practice varies but typically in continental Europe, it is not acceptable to increase the
journey time of a passenger train at all to improve the journey time of a freight train
(unlike in North America where, outside the North East corridor from Washington to
Boston, freight trains for the most part get priority). In some circumstances, these rules
may be formalised in a document that has been agreed between the infrastructure
company and the train operators. In Britain these generally applicable rules are included
in a document that was called at the point of privatisation the Track Access Conditions
(Railtrack, 1995) and which is now called the Network Code.
Finalised Timetable. Once the resolution process has been completed, the timetable
can be fed into the rolling stock scheduling process and also into the timetable
publication process.
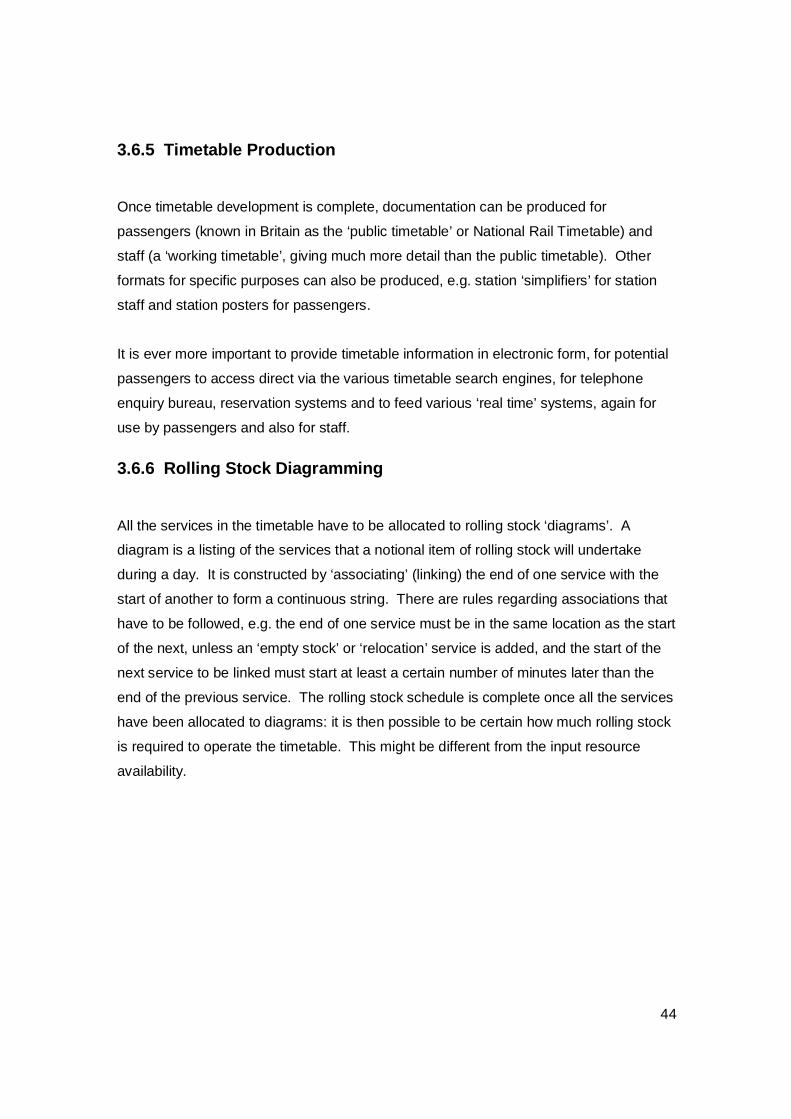
44
3.6.5 Timetable Production
Once timetable development is complete, documentation can be produced for
passengers (known in Britain as the ‘public timetable’ or National Rail Timetable) and
staff (a ‘working timetable’, giving much more detail than the public timetable). Other
formats for specific purposes can also be produced, e.g. station ‘simplifiers’ for station
staff and station posters for passengers.
It is ever more important to provide timetable information in electronic form, for potential
passengers to access direct via the various timetable search engines, for telephone
enquiry bureau, reservation systems and to feed various ‘real time’ systems, again for
use by passengers and also for staff.
3.6.6 Rolling Stock Diagramming
All the services in the timetable have to be allocated to rolling stock ‘diagrams’. A
diagram is a listing of the services that a notional item of rolling stock will undertake
during a day. It is constructed by ‘associating’ (linking) the end of one service with the
start of another to form a continuous string. There are rules regarding associations that
have to be followed, e.g. the end of one service must be in the same location as the start
of the next, unless an ‘empty stock’ or ‘relocation’ service is added, and the start of the
next service to be linked must start at least a certain number of minutes later than the
end of the previous service. The rolling stock schedule is complete once all the services
have been allocated to diagrams: it is then possible to be certain how much rolling stock
is required to operate the timetable. This might be different from the input resource
availability.
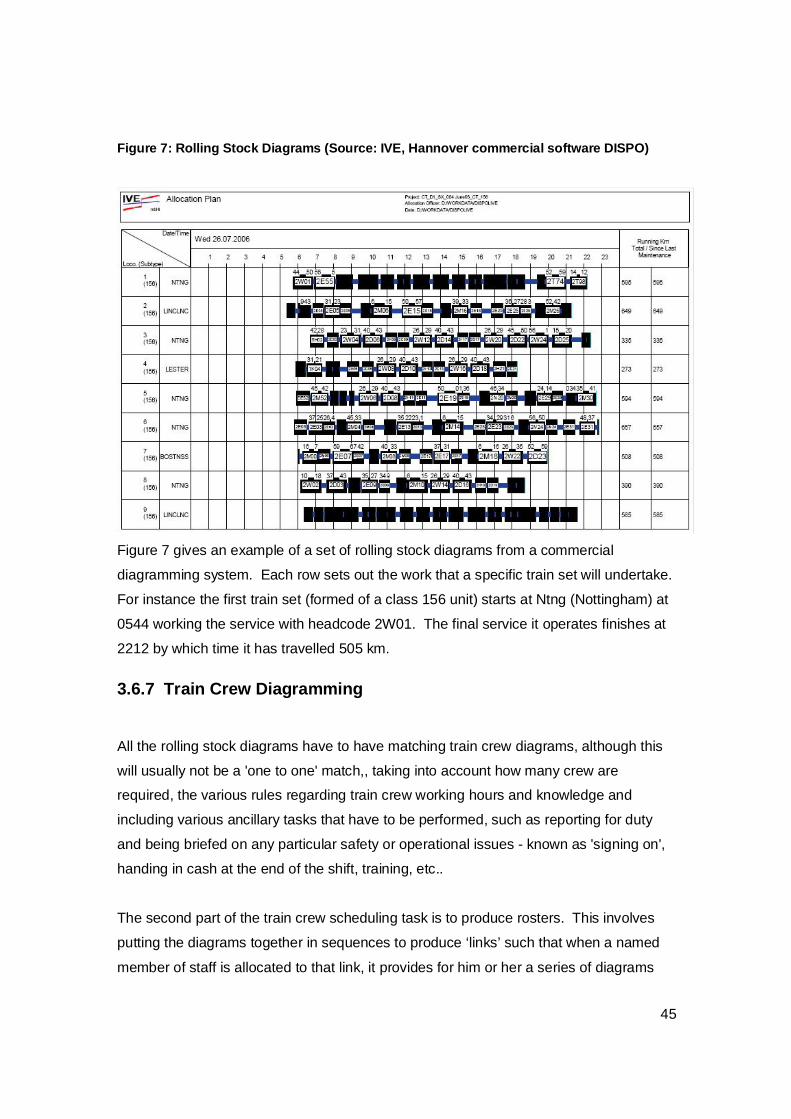
45
Figure 7: Rolling Stock Diagrams (Source: IVE, Hannover commercial software DISPO)
Figure 7 gives an example of a set of rolling stock diagrams from a commercial
diagramming system. Each row sets out the work that a specific train set will undertake.
For instance the first train set (formed of a class 156 unit) starts at Ntng (Nottingham) at
0544 working the service with headcode 2W01. The final service it operates finishes at
2212 by which time it has travelled 505 km.
3.6.7 Train Crew Diagramming
All the rolling stock diagrams have to have matching train crew diagrams, although this
will usually not be a 'one to one' match,, taking into account how many crew are
required, the various rules regarding train crew working hours and knowledge and
including various ancillary tasks that have to be performed, such as reporting for duty
and being briefed on any particular safety or operational issues - known as 'signing on',
handing in cash at the end of the shift, training, etc..
The second part of the train crew scheduling task is to produce rosters. This involves
putting the diagrams together in sequences to produce ‘links’ such that when a named
member of staff is allocated to that link, it provides for him or her a series of diagrams
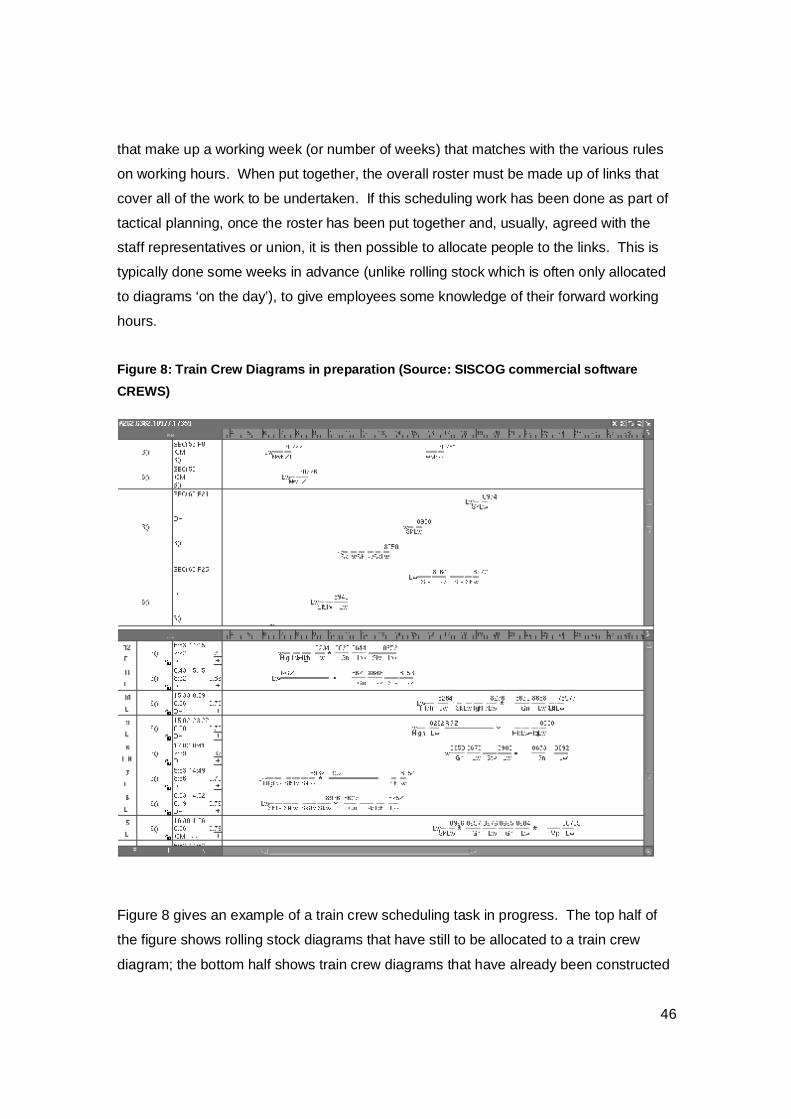
46
that make up a working week (or number of weeks) that matches with the various rules
on working hours. When put together, the overall roster must be made up of links that
cover all of the work to be undertaken. If this scheduling work has been done as part of
tactical planning, once the roster has been put together and, usually, agreed with the
staff representatives or union, it is then possible to allocate people to the links. This is
typically done some weeks in advance (unlike rolling stock which is often only allocated
to diagrams ‘on the day’), to give employees some knowledge of their forward working
hours.
Figure 8: Train Crew Diagrams in preparation (Source: SISCOG commercial software CREWS)
Figure 8 gives an example of a train crew scheduling task in progress. The top half of
the figure shows rolling stock diagrams that have still to be allocated to a train crew
diagram; the bottom half shows train crew diagrams that have already been constructed
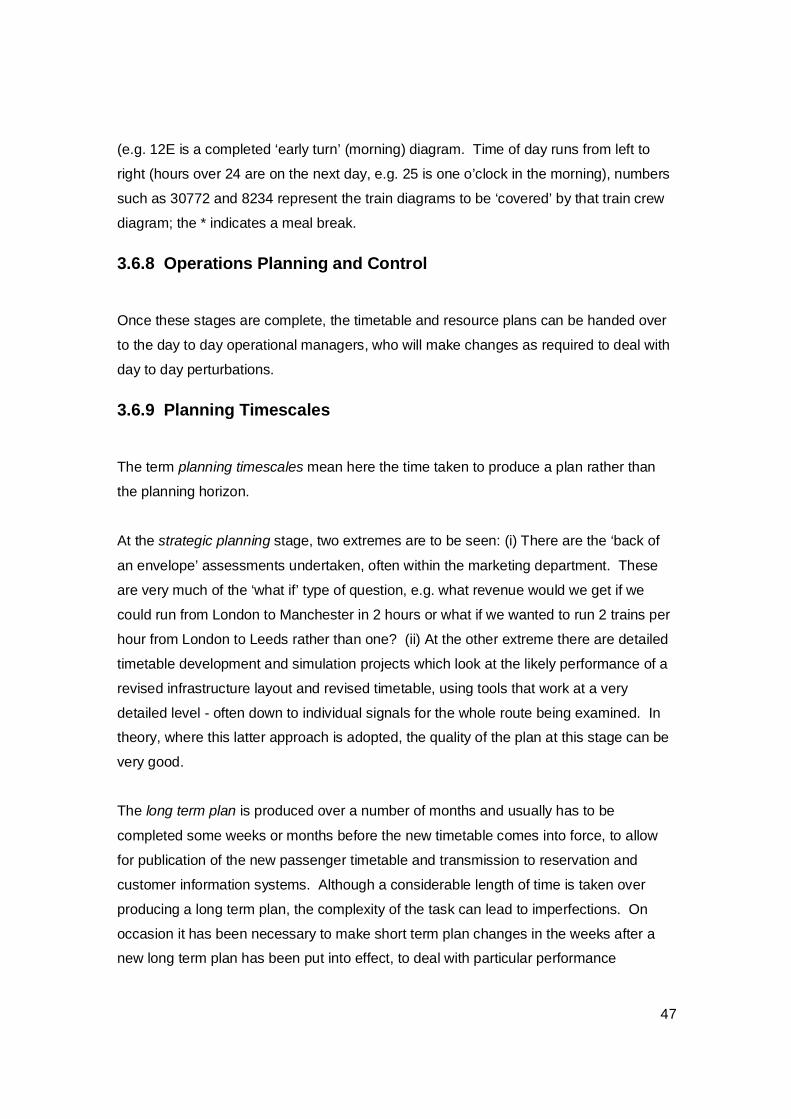
47
(e.g. 12E is a completed ‘early turn’ (morning) diagram. Time of day runs from left to
right (hours over 24 are on the next day, e.g. 25 is one o’clock in the morning), numbers
such as 30772 and 8234 represent the train diagrams to be ‘covered’ by that train crew
diagram; the * indicates a meal break.
3.6.8 Operations Planning and Control
Once these stages are complete, the timetable and resource plans can be handed over
to the day to day operational managers, who will make changes as required to deal with
day to day perturbations.
3.6.9 Planning Timescales
The term planning timescales mean here the time taken to produce a plan rather than
the planning horizon.
At the strategic planning stage, two extremes are to be seen: (i) There are the ‘back of
an envelope’ assessments undertaken, often within the marketing department. These
are very much of the ‘what if’ type of question, e.g. what revenue would we get if we
could run from London to Manchester in 2 hours or what if we wanted to run 2 trains per
hour from London to Leeds rather than one? (ii) At the other extreme there are detailed
timetable development and simulation projects which look at the likely performance of a
revised infrastructure layout and revised timetable, using tools that work at a very
detailed level - often down to individual signals for the whole route being examined. In
theory, where this latter approach is adopted, the quality of the plan at this stage can be
very good.
The long term plan is produced over a number of months and usually has to be
completed some weeks or months before the new timetable comes into force, to allow
for publication of the new passenger timetable and transmission to reservation and
customer information systems. Although a considerable length of time is taken over
producing a long term plan, the complexity of the task can lead to imperfections. On
occasion it has been necessary to make short term plan changes in the weeks after a
new long term plan has been put into effect, to deal with particular performance
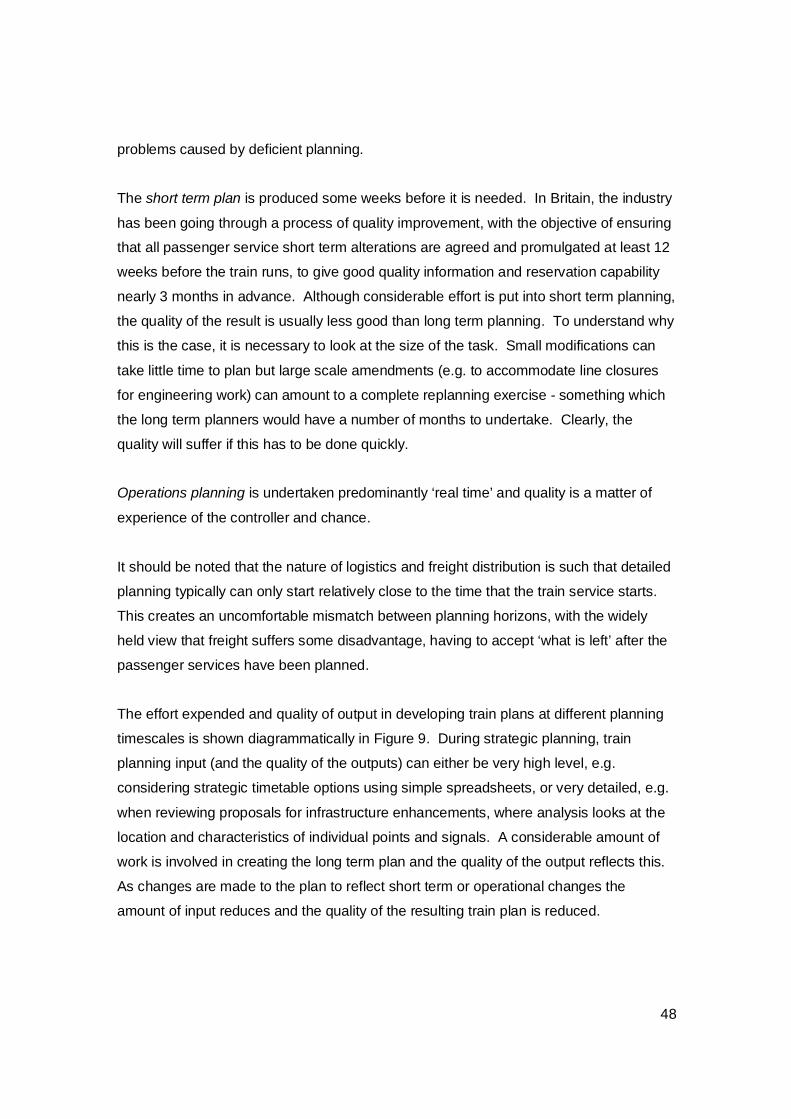
48
problems caused by deficient planning.
The short term plan is produced some weeks before it is needed. In Britain, the industry
has been going through a process of quality improvement, with the objective of ensuring
that all passenger service short term alterations are agreed and promulgated at least 12
weeks before the train runs, to give good quality information and reservation capability
nearly 3 months in advance. Although considerable effort is put into short term planning,
the quality of the result is usually less good than long term planning. To understand why
this is the case, it is necessary to look at the size of the task. Small modifications can
take little time to plan but large scale amendments (e.g. to accommodate line closures
for engineering work) can amount to a complete replanning exercise - something which
the long term planners would have a number of months to undertake. Clearly, the
quality will suffer if this has to be done quickly.
Operations planning is undertaken predominantly ‘real time’ and quality is a matter of
experience of the controller and chance.
It should be noted that the nature of logistics and freight distribution is such that detailed
planning typically can only start relatively close to the time that the train service starts.
This creates an uncomfortable mismatch between planning horizons, with the widely
held view that freight suffers some disadvantage, having to accept ‘what is left’ after the
passenger services have been planned.
The effort expended and quality of output in developing train plans at different planning
timescales is shown diagrammatically in Figure 9. During strategic planning, train
planning input (and the quality of the outputs) can either be very high level, e.g.
considering strategic timetable options using simple spreadsheets, or very detailed, e.g.
when reviewing proposals for infrastructure enhancements, where analysis looks at the
location and characteristics of individual points and signals. A considerable amount of
work is involved in creating the long term plan and the quality of the output reflects this.
As changes are made to the plan to reflect short term or operational changes the
amount of input reduces and the quality of the resulting train plan is reduced.

49
Figure 9: Amount of input and quality of output v. timeframe (Source: Author)
3.7 Further Investigation: Iterations Improve the Solution
The process described in the above section is sequential, with the exception of some
parallel activity required for defining business specifications and also with timetable
documentation being produced in parallel with detailed resource planning.
In the quest for the ‘best’ solution, reality is however different. As the process is followed
through sequentially, problems arise. Detailed analysis of the processes adopted by
train planners has been undertaken by the author based on the outputs from workshops
and interviews with train planners (see chapter 2 for details) shows that ‘iteration’ takes
place to correct problems and avoid inefficiency. Some of the most frequently found
iterations in practice are shown in Figure 10 below.
The explanation of some of these feedback loops is as follows:
1. When putting the timetable or the rolling stock plan together, the planners
may discover that there is insufficient capacity to meet all the requirements in
the business specification. Feedback is provided to the service specifiers,
who modify their requirements and resubmit;
2. It may be that the business specification includes running trains at a time of
day or week when the engineers intend to dig up the track. Dialogue will take
Strategic Long term Short term Operational
Quality of Output
X
X
X
X
X
Effort expended
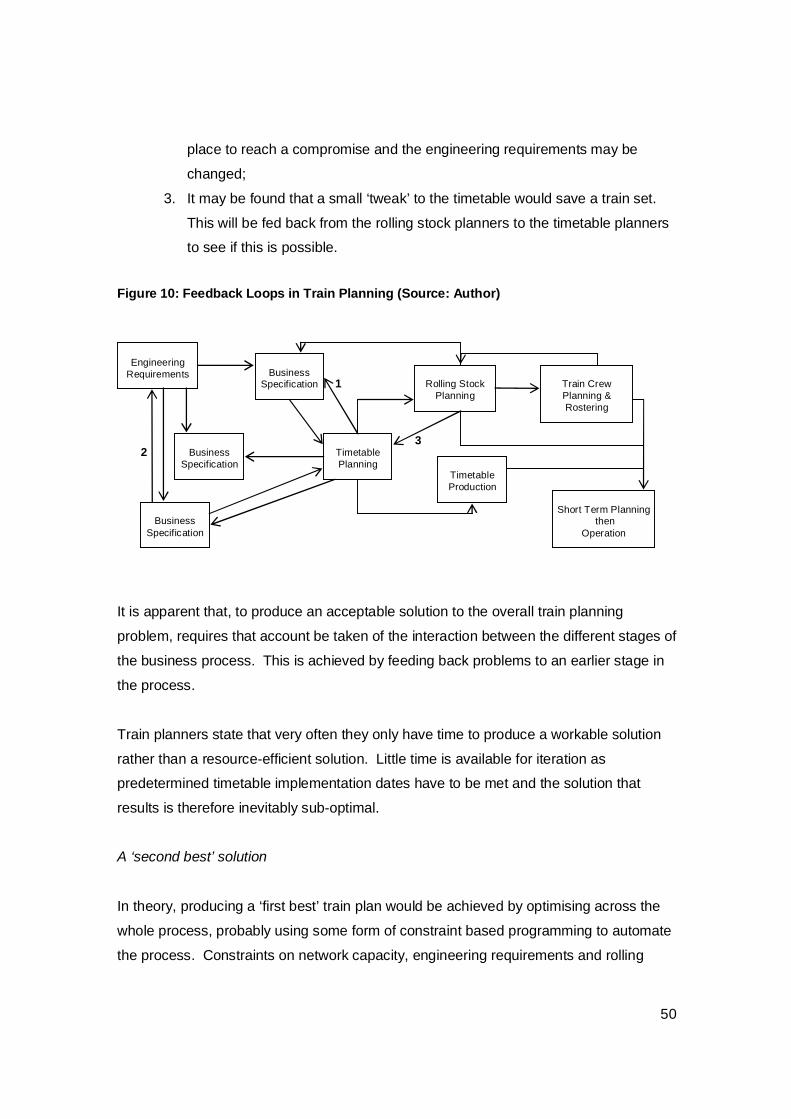
50
place to reach a compromise and the engineering requirements may be
changed;
3. It may be found that a small ‘tweak’ to the timetable would save a train set.
This will be fed back from the rolling stock planners to the timetable planners
to see if this is possible. Figure 10: Feedback Loops in Train Planning (Source: Author)
It is apparent that, to produce an acceptable solution to the overall train planning
problem, requires that account be taken of the interaction between the different stages of
the business process. This is achieved by feeding back problems to an earlier stage in
the process.
Train planners state that very often they only have time to produce a workable solution
rather than a resource-efficient solution. Little time is available for iteration as
predetermined timetable implementation dates have to be met and the solution that
results is therefore inevitably sub-optimal.
A ‘second best’ solution
In theory, producing a ‘first best’ train plan would be achieved by optimising across the
whole process, probably using some form of constraint based programming to automate
the process. Constraints on network capacity, engineering requirements and rolling
Engineering
Requirements
Business Specification
Business
Specification
Business
Specification
Timetable Planning
Timetable Production
Short Term Planning
then Operation
Rolling Stock
Planning
Train Crew Planning & Rostering
1
2 3

51
stock and train crew availability would be set against the business requirements and an
optimum solution (or something close to it) would be found. To date, no attempt has
been made to undertake this, even in the relatively simple area of city-specific mass
transit scheduling programs, due to the complexity of the task. This issue is discussed
further in the chapters on software support for train planning processes (chapter 6
onwards).
What is clear is that it is currently only practical to solve each stage in the process
separately, often with the objective solely being to produce an operable solution, rather
than a good or ‘optimal’ solution. Iteration is therefore the only way available to take
account of the impact of the solution of one stage on another stage and to enable
amendments to be made as necessary. Close co-operation between the parties
involved in the various stages is essential, together with appropriate organisational
structures and internal procedures.
3.8 Further Investigation: Complexities
This research has discovered that there are a number of complexities that make train
planning difficult:
1. Railways have a ‘single degree of freedom’ - forward and backwards
(whereas road based transport has two degrees of freedom and air
three). Because of this all ‘overtaking’ of trains or ‘meeting of trains’ (on a
single track) or ‘crossing of trains’ (at junctions) has to be planned in
detail if delays are not to result;
2. A further complexity of the train planning problem, similar to that of other
scheduling problems, is the need to consider infrastructure and resource
efficiency alongside robustness and time taken to produce a solution;
3. The complexity and inter-linked nature of railway networks leads to the
timetable planning process of necessity requiring a network solution.
However, given the scale of the task and the need to develop a solution in
a reasonable time it is usually divided between a number of different
people and often between different locations;
4. The congested nature of many rail routes, either through infrastructure
52
rationalisation to reduce cost, or growth in traffic volumes leads to
timetable planners having difficulty finding solutions that meet all the
business requirements, if indeed such a solution exists at all;
5. Additional complexity has been introduced into the processes by the
current trend towards separation of infrastructure management and train
operation, leading to no one organisation or individual being in a position
to decide between possible compromises if no solution meets the
requirements of all the companies involved;
6. The relatively limited software support available to train planners.
Most of these are intrinsic factors that must be taken account of, rather than being
susceptible to change. Points 5 and 6, however, are definitely not intrinsic and are
discussed in later chapters covering (5) how privatisation has impacted on timetable
processes and (6) the extent to which better software support could be provided.
3.9 Further Investigation: Comparison with Manufacturing
Process Scheduling
Train planning is regarded by railway personnel as a specialist activity and practitioners
tend to consider that they are performing a task that no one else does. In order to
understand whether this is true or not, the following section is used to undertake a brief
comparison with scheduling in manufacturing plants.
The railway infrastructure is a network on which trains move. This has distinct parallels
with the ‘infrastructure’ of process industry plants: tracks replace pipes; storage tanks for
raw and finished materials translate in railway terms into depots and sidings; it is only
possible to have one material at one point in any pipe at any one time in the same way
that it is only possible to have one train on any one piece of track at any one time.
Trains and train crew can again be paralleled with the materials that flow through a
process plant: in the case of railways, the ‘mix’ of materials that is required is defined by
the train service specification and the various rules that apply to train crew.
A brief review of manufacturing scheduling literature confirms the great similarity in the
53
nature of the problem. Sanmarti et al (1998) characterise chemical batch production
plants as having a ‘high degree of flexibility’ and ‘a large number of variables’ that have
to be taken into account, including ‘unit assignments, product and/or task sequencing
and tasks timing’. Further similarities are revealed by Das et al (1998) who list a number
of batch process constraints, starting with ‘most processes are non-pre-emptive, that is,
it is not possible to start a new activity unless the previous activity has been completed’.
The reader will note that this exactly matches with the resource constraints that apply to
rolling stock and train crew. The overall scheduling problems that result are
‘combinatorially complex’ (Artiba and Riane 1998) and tend to have location or
organisation-specific features (Loos and Allweyer 1998), matching with comments about
railway problems from Cordeau et al. In manufacturing, typical constraints might include
machine capacity, raw material delivery times, maintenance periods, union rules, legal
work limitations, and staff capability (ILOG 2007). For railways the first two translate into
infrastructure capacity and rolling stock availability, the rest being exactly the same.
Whilst the close match outlined above does not necessarily mean that detailed
comparison will provide valuable analysis, Loos and Allweyer discuss how conflicts
within processing plants are solved interactively and how functions should not be treated
in isolation but seen as part of the overall business process, matching closely with the
points made earlier in this chapter.
3.10 Conclusions
In this chapter, the writer has set out the train planning processes and then considered
some of the issues and complexities that challenge train planners. It can be concluded
that train planning is always going to be complex in nature but that analysis can help by
explaining some of this complexity and by pointing towards areas for process
improvement (such as taking account of the iterative nature of the process) and also to
the potential for comparative analysis with other similar processes (e.g. manufacturing
processing scheduling).
The conclusion that there can be benefits from undertaking process analysis is
applicable to other processes and process analysis. In addition it is possible to
generalise that there will usually be similar processes in different settings that can be

54
used for comparative purposes or to ‘cross fertilize’.
This analysis now provides the basis for investigating train planning across several
different dimensions in the chapters that follow.

55
4 THE EFFECT OF PRIVATISATION ON TRAIN PLANNING PROCESSES IN BRITAIN
4.1 Introduction
Organisational change can be expected to impact on processes and, in this chapter, we
consider the effect of rail privatisation on train planning processes in Britain.
Discussions with railway personnel, together with direct involvement in the process of
change, led the author to want to evaluate the following hypothesis:
That the new structure imposed on the industry in Britain by the Railways Act 1993 hinders the development of effective timetables and resource plans by creating artificial boundaries in the middle of what needs to be a seamless process.
He aims to do this analysis by bringing together train planning and privatisation policy,
documenting an important part of the railway restructuring jigsaw - that of the
development of new train planning processes to accommodate the fragmentation of
responsibility for train planning. The extent to which the new processes adopted met the
needs of the evolving industry is then considered, with an appraisal of what went wrong
and why.
The work presented pertains specifically to the British situation, primarily because it is in
Britain that the division between infrastructure operator (responsible for the
management, control and improvement of the track and signalling) and the train
operators (responsible for running the train services on the infrastructure operator’s
network) first became reality (although Sweden had already made moves in this
direction) and hence the impact can be best described. Future work by other
researchers will no doubt consider the position as it develops in other countries and
compare and contrast that with the developments in Britain.
56
The understanding developed in this chapter is of importance for two key reasons:
1. Growth in the use of rail (both passenger and freight) relies on the ability of
the railway industry nationally and internationally to provide punctual train
services that meet the available demand, maximise the use of available
infrastructure capacity and be resource-efficient. An effective timetabling
process is needed to achieve this;
2. European Union pressure to separate infrastructure management from train
operation (see for instance European Union, 1991) means that lessons that
can be learnt from the situation in Britain are potentially of great value to
continental railways that are required to restructure; the opportunity also
arises for the EU to understand and address some of the problems that its
policy in this area will cause.
Substantial sections of this chapter were published in Transport Reviews (Watson 2001).
4.2 Method
This chapter has been developed using a number of research techniques.
Firstly, a range of secondary material, both published and working documents, has been
reviewed, c.f. Timetable Planning Strategic Development Group (1993), Class
Representative Committee (1996), Railtrack Timetable Project Control Group (1996),
Loose W. and Temple G. (1997), Office of the Rail Regulator (1997, 1998);.
Secondly, retrospective participant observation was employed, with personal
recollections from being Head of Access Planning for Railtrack (from 1995 to 1998)
being documented during 1999 in the preparation of the Transport Reviews paper
(Watson 2001) when memories were relatively fresh and many personal papers (for
instance, notes of meetings) were readily accessible.
Thirdly, informal discussions with a range of industry personnel have been used to fill
gaps in understanding. These had to be informal because most of these individuals
were and still are attempting to work within the structure created and did not wish to
57
prejudice their careers by being quoted.
There is no separate literature review in this chapter – references are woven into the
story as it unfolds.
4.3 British Rail
4.3.1 Background The railway system of Great Britain was originally built as a patchwork of railway lines operated by private, often local, railway companies. Over the course of the 19th and early 20th centuries these amalgamated or were bought by competitors. The entire network was brought under government control during the First World War and in 1923 the remaining companies were grouped into what became known as the ‘Big Four’, the Great Western Railway, the London and North Eastern Railway, the London, Midland and Scottish Railway and the Southern Railway companies. The ‘Big Four’ were public companies and they continued to run the railway system until the end of 1947, at which point, desperate for investment following the Second World War, they were nationalised to form British Railways (usually known as British Rail). During the 1960s the network was substantially rationalised, with route miles reduced from 17,830 (BRB, 1963) to 10,304 in 2008 (Department for Transport, 2007). Modernisation of the remaining network took place in parallel, with major infrastructure enhancements (including the first long distance main line electrification in the U.K., of the West Coast Main Line) and introduction of container trains and ‘merry go round’ to improve the efficiency of freight operations. The remaining network continues to serve a number of different markets – commuting in the South East (and to a more limited extent into cities other than London), long distance business and leisure passenger travel, freight services in ‘trainloads’ (most of the ‘wagonload’ services had disappeared by the mid 1980s) and, where lines were not closed, for political reasons rather than economic, inter-urban and rural passenger travel. Throughout this period British Rail was organised in much the same way as it had been pre-nationalisation, with geographic ‘regions’ that were for the most part closely aligned with the ‘Big Four’ networks and functional organisations within the regions keeping engineering separate from operations and marketing.

58
4.3.2 Management and Structure
British Rail, from when it came into existence in 1948 (then known as the British
Railways Board), underwent a number of reorganisations. However, from 1948 until the
1980s, train planning had been affected relatively little, with the work being undertaken
through a regional structure of train planning offices, where the regions matched quite
closely with the pre-nationalisation railway companies. During the 1980s the pace of
change quickened, with ‘Sector Management’ being introduced. All traffic flows were
allocated to one of five business sectors (Inter City, London and South East, Other
Provincial Services, Freight and Parcels) and, through the 1980s, decision making was
gradually transferred from the existing functions (operations, civil engineering, etc.) to
the new ‘Sectors’. ‘Matrix management’ was an inevitable consequence of this process,
with many managers pulled in different directions by their functional superiors and the
new sector managers (Cochrane 1992). The final stage of the transition to business
management was undertaken under the banner of ‘Organising for Quality’. With the new
organisation that came into effect in 1993, just a year before privatisation, the functions
were finally subsumed in the Sectors, with matrix management replaced by ‘contracts’
(in truth internal agreements rather than legally binding contracts, as all the Sectors were
still part of British Rail). Gourvish (2002) provides a very detailed review of this whole
period.
Much discussed during the late 1980s, railway privatisation only became a serious topic
on the political agenda in the early 1990s. Several potential new industry structures
were considered, including privatising British Rail as a single entity (rather as British Gas
had been some years before), splitting the railway into regional monopolies (harking
back to the situation that existed prior to nationalisation), selling the newly formed
Sectors separately or dividing the railway into an infrastructure provider, competing train
operating companies and supply companies (owning the rolling stock, maintaining and
renewing the track and so on). For reasons discussed by Preston (1996), Harris and
Godward (1997), White (1998), Kain (1998) and others, the latter option was adopted,
with an Act of Parliament becoming law in 1993 and 1st April 1994 being set as the date
for implementation of the first phase of the restructuring process - setting up Railtrack as
a separate ‘GoCo’ (Government Owned Company) responsible for maintenance,
renewal and operation of the infrastructure. ‘Sectorisation’ had brought some changes
59
to the train planning processes, but the chosen method of privatisation was to have a
much more significant impact.
4.3.3 Timetabling Pre-Privatisation
Prior to restructuring, the timetable development process started a little over a year in
advance of the commencement date for the timetable with the engineering requirements
being defined. Within the constraints these impose (typically in Britain limiting overnight
trains and Saturday night/Sunday trains) business specifications were then produced.
Train service specifications were given to the timetable planners, who, as described in
detail in the preceding chapter, produced detailed train schedules, taking into account
the exact details of the infrastructure and characteristics of the trains, accurate to
fractions of minutes whereas the specification may be rounded to five or even fifteen
minutes. These were then put onto a ‘graph’, that is to say they overlaid the schedules
on a graphical representation of the railway network to assess whether they were
mutually compatible. The timetable was complete once all the train schedules had been
put on the graph and the graph had been made ‘conflict free’, that is to say that no train
would be delayed by any other if there were no external perturbations - e.g. points
failures or locomotive breakdowns.
A key principle in the un-restructured railway was that of ‘first on the graph’. Long
distance passenger ‘Inter City’ trains were treated as top priority, local services had to fit
around them, and freight trains fitted into whatever space was left. This principle
simplified the planning task, as it substantially reduced the number of permutations that
had to be considered. Despite this, considerable complexity still existed. The timetable
planning responsibility for British Rail was split across a number of geographic offices,
with substantial interface issues for the planning of services that passed through a
number of these.
Once all the services were ‘on the graph’ then they had to be allocated to rolling stock
‘diagrams’. A diagram would be made up of a listing of the services that a notional item
of rolling stock undertakes during a day. It would be constructed by ‘associating’
(linking) the end of one service with the start of another to form a continuous string.
Various rules regarding associations had to be applied, e.g. the end of one service must

60
be in the same location as the start of the next, unless an ‘empty stock’ service is added,
and the start of the next service must be at least a certain number of minutes later than
the end of the previous service.
Once all the services had been allocated to diagrams, it was then possible to overlay this
with a train crew plan (known in the UK as ‘train crew diagrams’). All the rolling stock
diagrams had to have matching train crew diagrams, taking into account how many crew
are required, the various rules regarding train crew working hours and route knowledge
and various ancillary tasks that had to be performed (such as signing on and off,
handing in cash, training). This part of the train crew plan development was complete
when all rolling stock diagrams had been covered by the appropriate train crew
diagrams. The second part of the train crew planning task was to produce train crew
rosters. This involved putting the diagrams together in sequence to produce ‘links’ such
that, when a named member of staff is allocated to that link, it provides a series of
diagrams that make up a working week (or number of weeks) that matches with the
various rules on working hours. When put together, the overall roster must be made up
of links that cover all of the work to be undertaken.
This process produced workable timetables and resource plans. However, it is
worthwhile noting that internal British Rail documents of the time (including a survey of
internal users and customers) indicated a number of dissatisfactions (Willis, 1992).
Those responsible for services that were not ‘first on the graph’ felt, with some
justification, that their business was being adversely affected. This was particularly the
case for the freight profit centres, which often had little opportunity to run daytime trains.
The linear nature of the process, whilst ensuring delivery of timetables, took little account
of the efficiencies that could be achieved by looking at resource utilisation as part of the
timetabling equation. Robustness of the timetables produced was mostly a matter for
the professionalism of the train planners and, without technical support, this occasionally
led to major problems when untested new timetables were put into operation. Where
minor operators crossed a number of train planning boundaries, their services tended to
take a low priority - the Cross Country profit centre, running trains from Scotland and the
North of England to the South Coast and South West of England, felt particularly
aggrieved by this. Finally, the process was felt to be unduly costly, with 1000 members
of staff involved full time in tactical train planning.
61
4.4 Privatisation 1993-1999
In 1993 it became apparent to senior management within British Rail that privatisation
was actually going to happen and preparations started to be made. A committee known
as the ‘Timetable Planning Strategic Development Group’ had been in existence for
some time, with responsibility for improving the quality and effectiveness of train
planning. It was made up of staff responsible for train planning and those who could be
regarded as the ‘customers’ of the train planners - those tasked with producing the
business specifications and accepting the output of the process.
The work already undertaken to understand the weaknesses of the existing process was
put together with an assessment of the best view available at the time, of the needs of
the privatised railway to produce a synopsis of the key issues to be addressed. It was
accepted that the known problem of the train planning process being inflexible and time
consuming would become even more critical with privatisation, as new operators sought
to compete and innovate.
Much has been written about the then government’s objectives for privatisation of the
railways, cf. Harris and Godward (1997); Shaw et al. (1998); Kain (1998); Welsby and
Nichols (1999). This literature supports the view taken within British Rail that the
Conservative government regarded competition as the most effective way of achieving
improvements in services. Indeed the Regulator’s objectives were explicitly framed to
focus his attention on achieving competition between rail services. It was therefore a
‘given’ for the new train planning process that it should accommodate competition
effectively. This was taken to imply that, in addition to permitting competition, the
process should be fair and it should be confidential. There could no longer be train
operators who had rights to be ‘first on the graph’; neither could there be expected to be
discussion between operators in advance of their ‘bidding’ for access to the network.
Indeed it was suggested that such discussions would amount to collusion and
contravene competition law.
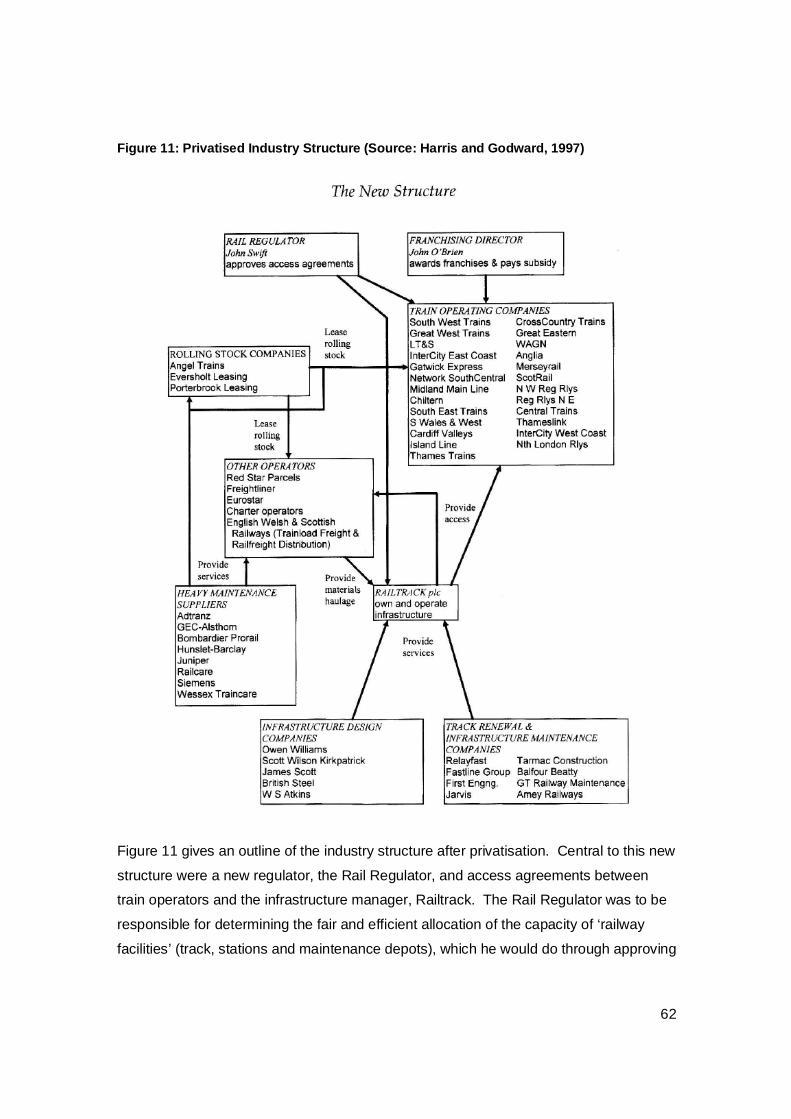
62
Figure 11: Privatised Industry Structure (Source: Harris and Godward, 1997)
Figure 11 gives an outline of the industry structure after privatisation. Central to this new
structure were a new regulator, the Rail Regulator, and access agreements between
train operators and the infrastructure manager, Railtrack. The Rail Regulator was to be
responsible for determining the fair and efficient allocation of the capacity of ‘railway
facilities’ (track, stations and maintenance depots), which he would do through approving
63
or ‘determining’ access agreements where he felt it appropriate to change the proposed
agreement. The access agreements would set out how much capacity the train operator
was permitted to use, the conditions which he must observe, the obligations of Railtrack,
how much was to be paid for the access, and what was to happen if things went wrong.
It was expected that, for the most part, a train operator would agree the terms of the
access agreement with Railtrack. Once agreed, the agreement would be sent to the
Regulator for his approval, which he could give with or without modifications - or he
could reject it, if he felt that the access agreement was unfair in some way (e.g. to
another operator) or made inappropriate use of capacity. If an agreement could not be
reached between the Train Operator and Railtrack, the operator could ask the Regulator
to force Railtrack to enter into an access agreement.
The Regulator is required by the Railways Act 1993 (as subsequently amended by the
Transport Act 2000) to have regard to “considerations beyond the commercial wishes or
interests of the facility owner [Railtrack] and the prospective user, and to consider
whether the proposed access contract is in the overall public interest….. In doing so, he
consults other users and prospective users of the railway facility in question, the
Strategic Rail Authority (SRA) and other funders, and other interested parties”
(Shaw,1998).
Access agreements were only to set out an ‘envelope’ of times within which train
operators could bid for paths and Railtrack had to offer them, with new timetabling
processes needed to facilitate this ‘bid and offer’ process.
4.5 Devising a new Train Planning Process
It was anticipated that the private sector would demand great flexibility, with frequent
service changes to match perceived demand and to deal with competitive threats and
with the government, through the Office of Rail Passenger Franchising, interfering as
little as possible, setting only minimum service levels through ‘Passenger Service
Requirements’. Major timetable changes had previously been restricted to once per
year (the start of the Summer timetable in late May/early June) or, if really essential, e.g.
if new rolling stock deliveries required it, twice per year, with less substantial changes at
the start of the Winter timetable in September. It was considered that this would be
64
wholly inadequate for the private sector and that something more akin to the bus
industry norm would be required, with a gestation period measured in weeks rather than
something around a year and an opportunity to amend the timetable every few weeks.
Finally it was anticipated that the new processes would have to be documented as
contractual terms, as the new structure of separate legal entities would require a process
that was clear, precise and enforceable.
It was against this background, one of acceptance of the need for substantial process
change and improvement, that the group developed a revised process.
A series of workshops explored the objectives that the revised process had to meet and
‘minimum change’ options were explored. The most straightforward approach was to
continue with the existing ‘twice a year’ timetable, with the train operators responsible for
business specification and resource planning and Railtrack responsible for the other
functions.
This had the attraction of simplicity but had a number of disadvantages when judged
against the high level objectives set to the working group, including:
1. No additional flexibility to make changes to the timetable;
2. No positive impact on staff costs;
3. No positive effect on quality of timetables produced;
4. Difficult for Railtrack to produce a timetable that was resource-efficient as well
as network-efficient;
5. Difficult for the train operators to judge whether Railtrack had produced the
best plan possible as the train operator’s requirements would only be input to
Railtrack in general terms, leading to substantial potential for dispute.
In addition the Railtrack representatives saw that this approach would move a
substantial number of train planners into an organisation (Railtrack) that was intended to
be ‘lean’ (Foster and Castles, 2004). A much more radical proposal was therefore put
forward which was intended to much more closely meet with the high level objectives
and, at the same time, reduce the resources Railtrack would need to undertake its part

65
of the process.
The crux of the new proposal was that the timetabling element of the train planning
process would be split between train operators and Railtrack. Figure 12 (see following
page) highlights where boundaries between organisations were to be introduced. Each
train operator would be required to produce an internally consistent detailed timetable for
its services, where internally consistent meant that, if it existed on its own, it could be
operated successfully without amendment; detailed meaning that all the necessary en-
route timings would be provided. These would be transmitted electronically as ‘bids’ to
Railtrack who would ‘stack them up’ and deal with any conflicts (i.e. trains from different
train operators who were planning to be on the same track at the same time) by ‘flexing’
those trains to run a few minutes earlier or later to achieve a ‘conflict free’ timetable.
Revised times where necessary would then be ‘offered’ back to the train operators. This
bid and offer process would be repeated a further 4 times, with the timetable gradually
being refined over this period, as train operators ‘accepted’ the offers made or rejected
the offer and re-bid. There would be 6 timetables per year, with each of the timetables
having 5 ‘iterations’ of bids and offers. The identity of bidders would be kept secret until
the timetable was published. To achieve an overall process length no longer than
previously, the bid and offer periods would be restricted to 4 weeks each, whereas
previously there had been approximately 16 weeks to stitch together the business
specifications alone.
This proposal had a good fit with most of the high level objectives but implied a much
greater workload in train planning offices to deal with multiple iterations running in
parallel rather than a single iteration in series and required data transfer where
previously none had existed. Substantial new software would be required in a short
timescale to make this proposal workable.
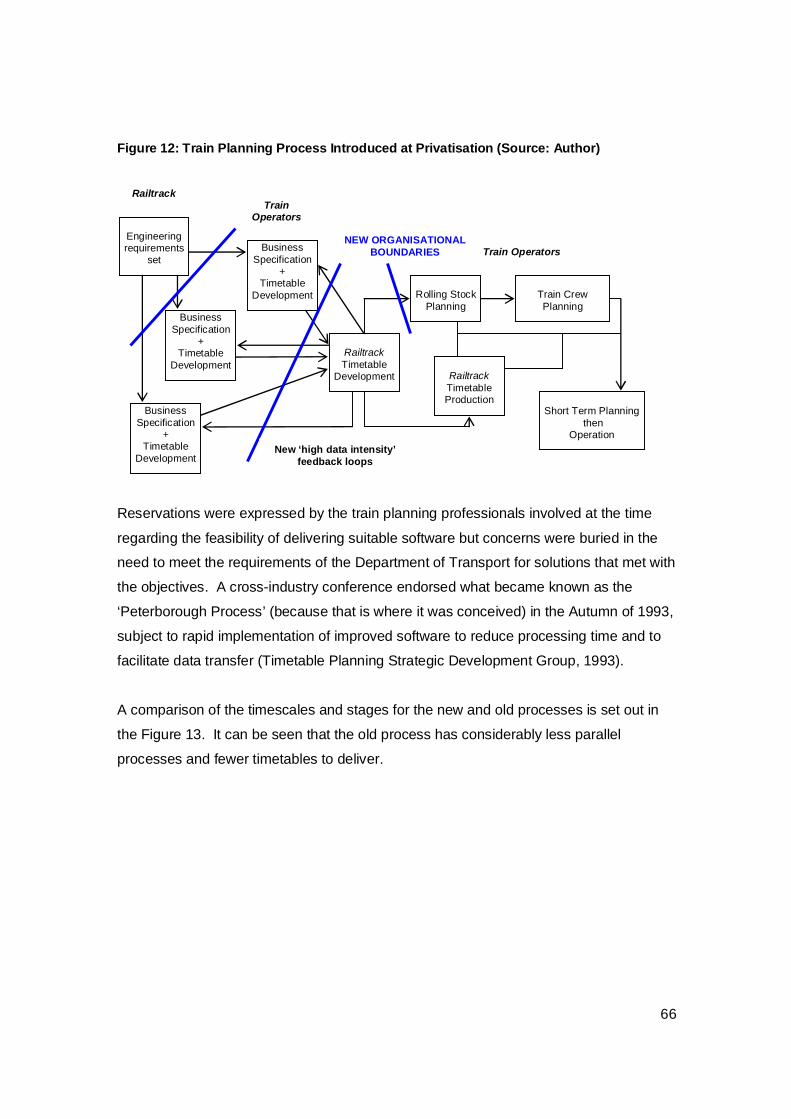
66
Figure 12: Train Planning Process Introduced at Privatisation (Source: Author)
Reservations were expressed by the train planning professionals involved at the time
regarding the feasibility of delivering suitable software but concerns were buried in the
need to meet the requirements of the Department of Transport for solutions that met with
the objectives. A cross-industry conference endorsed what became known as the
‘Peterborough Process’ (because that is where it was conceived) in the Autumn of 1993,
subject to rapid implementation of improved software to reduce processing time and to
facilitate data transfer (Timetable Planning Strategic Development Group, 1993).
A comparison of the timescales and stages for the new and old processes is set out in
the Figure 13. It can be seen that the old process has considerably less parallel
processes and fewer timetables to deliver.
Engineering requirements
set Business
Specification +
Timetable Development
Business Specification
+ Timetable
Development
Business Specification
+ Timetable
Development
Railtrack Timetable
Development
Railtrack Timetable Production
Short Term Planning then
Operation
Rolling Stock
Planning
Train Crew Planning
Train Operators
NEW ORGANISATIONAL BOUNDARIES
Train Operators
Railtrack
New ‘high data intensity’ feedback loops
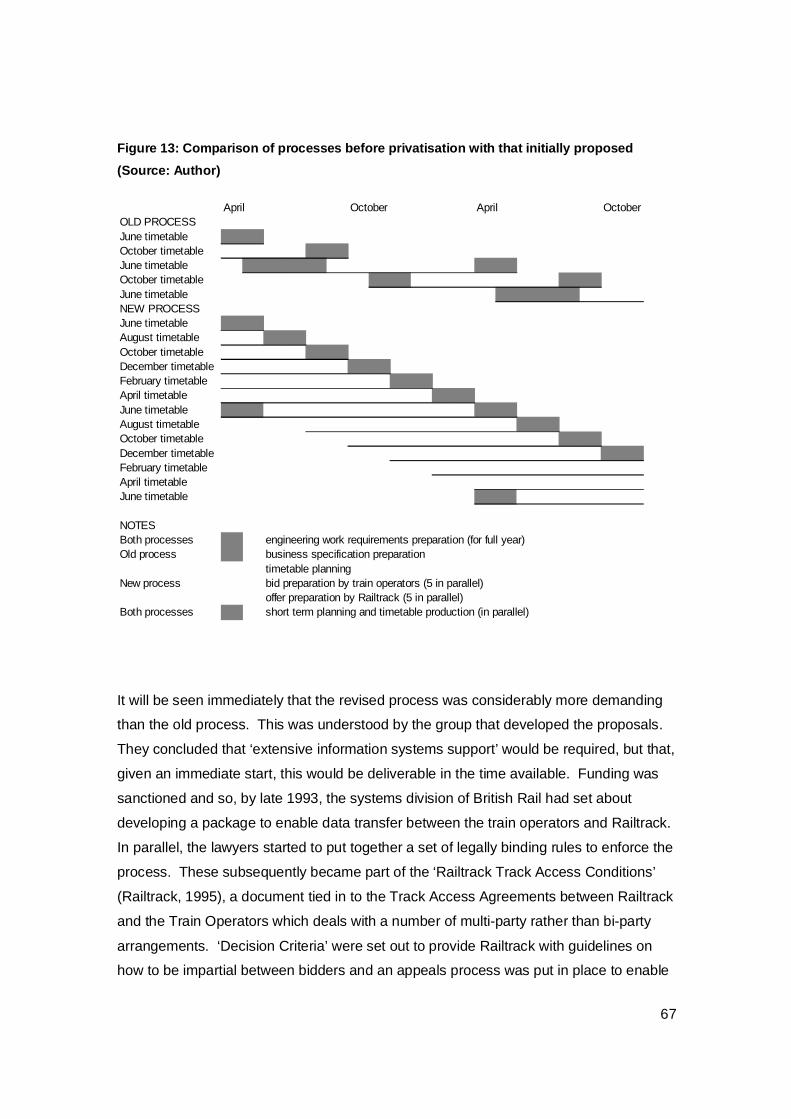
67
Figure 13: Comparison of processes before privatisation with that initially proposed (Source: Author)
April October April OctoberOLD PROCESSJune timetableOctober timetableJune timetableOctober timetableJune timetableNEW PROCESSJune timetableAugust timetableOctober timetableDecember timetableFebruary timetableApril timetableJune timetableAugust timetableOctober timetableDecember timetableFebruary timetableApril timetableJune timetable
NOTESBoth processes engineering work requirements preparation (for full year)Old process business specification preparation
timetable planningNew process bid preparation by train operators (5 in parallel)
offer preparation by Railtrack (5 in parallel)Both processes short term planning and timetable production (in parallel)
It will be seen immediately that the revised process was considerably more demanding
than the old process. This was understood by the group that developed the proposals.
They concluded that ‘extensive information systems support’ would be required, but that,
given an immediate start, this would be deliverable in the time available. Funding was
sanctioned and so, by late 1993, the systems division of British Rail had set about
developing a package to enable data transfer between the train operators and Railtrack.
In parallel, the lawyers started to put together a set of legally binding rules to enforce the
process. These subsequently became part of the ‘Railtrack Track Access Conditions’
(Railtrack, 1995), a document tied in to the Track Access Agreements between Railtrack
and the Train Operators which deals with a number of multi-party rather than bi-party
arrangements. ‘Decision Criteria’ were set out to provide Railtrack with guidelines on
how to be impartial between bidders and an appeals process was put in place to enable
68
‘case law’ to be created.
Looking back at the issues raised earlier in the chapter, it can be seen that some but not
all had been addressed. In particular, the complexity of the new process meant that
there was not expected to be any improvement in the overall length of the process,
although bids could be made in one of the later ‘iterations’ if desired. In addition there
were considerable concerns that the new process would require more people rather than
less to operate it. Overall, however, it appeared that a smooth transition to the new
process would be achieved when restructuring took place on 1st April 1994.
4.6 Assessment of the new Process
4.6.1 What to judge against?
Two assessments are made:
1. Firstly, a consideration of the fit of the process with the high level objectives
set by government and described above;
2. Secondly, a review of what happened when the industry attempted to work to
the processes.
Note that a fuller discussion of the objectives for train planning is provided in the
following chapter.
4.6.2 The new process compared with high level objectives
Competition
The new process was required to be fair. This was achieved, on the face of it: The
process required Railtrack to treat all bidders equally, subject to certain rational
constraints, such as the bidder having or being in the process of negotiating a track
access agreement.
The new process was required to be confidential. This was achieved only up to a point.
69
To enable train operators to bid where space was available on the network, during the
later iterations it was deemed necessary to advise all train operators of offers that had
been made. This could be done without divulging the name of the operator but, in
practice, it would usually be self-evident who the bidder was. In any event, the
Regulator’s processes for the approval of access rights required comments from
interested parties, so competitors had to show their hand early anyway.
Innovation
The process was required to enable operators to make frequent service changes. Even
before the new processes had been tried in practice, this had been substantially watered
down. In reality there were still to be only two opportunities to make changes each year.
Cost reduction
The process was to deliver more efficient solutions, i.e. producing more resource-
efficient solutions so that less rolling stock and staff were required for a given output,
and require less train planning staff. At the time it was envisaged that the software
improvements underway would produce benefits in both of these areas. In retrospect
this was clearly never going to be the case. The software enhancements that were put
into development merely supported the transfer of data in the bid and offer process. No
additional help was being provided in the traditional train planning tasks and the multiple
parallel iterations suggested substantial additional work in checking offers and preparing
re-bids.
Improvements to quality of service
Better quality timetables were to result. As for cost reductions, nothing in the revised
process could reasonably be expected to bring about better punctuality or faster journey
times.
Retention of ‘network benefits’
Retention of effective connections between services from different operators was a
70
necessary condition of the new process. The new process militated against achieving
this objective, as bids for erstwhile connecting services would come to Railtrack in
different iterations and there was, hence, no chance to co-ordinate them. A ‘network
benefits’ objective (that is the ability to use a number of different train operators’ services
to efficiently complete a journey) conflicts with the competition objective, of course. At
the time the process was being put together, the facilitation of competition was
dominant.
Split of infrastructure management from train operations
The process facilitated this, and it was thought that it met Railtrack’s objective of
minimising staff numbers.
4.6.3 Problems in practice
By late summer of 1994, it was clear that the software development was not going to be
ready in time for development of the timetables in 1995. Hence, dispensation was
sought from the Railway Regulator, who had the responsibility for overseeing the new
railway industry and with express powers set out in the Access Conditions to reduce the
number of bids in the first few years, if considered necessary, to enable the new
processes to bed in, to have only two timetables in 1995 and to have only two bids for
the summer timetable and one bid for the winter timetable.
The first timetable to be prepared using the ‘bid and offer’ process, but without any
additional software support, was thus that for Summer 1995, with preparation starting
soon after the formal split of the industry in 1994. Problems were evident: bid quality
was considered by Railtrack to be inadequate from some Train Operators, with
suggestions that either they lacked the necessary staff to undertake the work or because
they misunderstood what was required. However, the restructuring process had used up
so much management time that there were relatively few service changes in the
Summer 1995 timetable and so the process, whilst creaking, delivered a public timetable
that was not noticeably worse than previously. Much overtime was worked and
comments from practitioners indicate that corners were cut,
71
The Winter 1995 timetable was a different matter. Winter timetables in the UK
traditionally contain rather more data than Summer timetables. They cover a longer
period (eight months against four) and the bulk of the engineering work–related weekend
alterations are contained within the Winter period. Focusing on customer information
priorities, some train operators and Railtrack train planners sought to include the vast
majority of changes in the bid and offer process, rather than dealing with them later as
had been more generally the practice.
Poor quality bids were delivered late by these train operators due to lack of time to
prepare them; Railtrack in turn had insufficient time or resource to return adequate
offers. Preparation of the public timetable documentation was therefore only partially
complete when it had to go to press and the scale of the inaccuracies was known to only
a few junior staff. Lack of management information meant that, by the time Railtrack HQ
knew about the scale of the problems, a damage limitation exercise was all that could be
hoped for - the passenger timetable was already on sale and the only way forward was
to produce an extensive supplement to provide corrections. For two weeks the national
press were full of articles highlighting the difficulties (e.g. ‘Timetable of errors’ - Daily
Telegraph Editorial, 1995, ‘timetable disaster’ Wolmar, 1996).
Analysis of the cause of the problems
On the basis of comparison of the new and old processes undertaken by the author,
evidence provided by the new railway companies to the Railway Regulator as part of his
review of train planning processes (Office of the Rail Regulator, 1997 and 1998) and
discussions with key staff involved at the time, there were deficiencies in a number of
areas. These are now considered.
Firstly the range of issues to be addressed by the introduction of the new process was
over-ambitious and also contradictory in several ways. It was assumed that a step
change could be made in the effectiveness of the process. In retrospect this appears
over-ambitious when it is considered that, despite a considerable amount of
management attention, only modest change had been achieved over many years. In
addition, there was insufficient management time available at this time due to the scale
of the overall restructuring task.
72
In terms of being contradictory, the issue of the trade off between staffing levels and
output has already been alluded to. It was decided that no additional staff would be
employed as a result of restructuring and, indeed, in some areas staff were allowed to
retire early. This was despite the extra workload implied by the new processes. A
further problem that caused strain was that, whilst the process had been set up to
facilitate competition, the government required (if rather as an afterthought) that
‘network benefits’ should be protected. On the one hand the process had to be
confidential so that competitive advantage could be maintained and, on the other,
sharing proposals was necessary to ensure that travellers that needed to use the
services of several train operators would get good quality journeys. Inevitably this led to
confusion, irritation and differing practices.
More fundamentally, it can be argued that the split of responsibilities between the
infrastructure operator (Railtrack at this time) and the Train Operators worked against
the development of efficient integrated resource plans. The total train planning ‘problem’
was no longer any one organisation’s responsibility and, hence, inevitably, Railtrack
concentrated on efficient network utilisation and train operators on efficient resource
utilisation.
The outcome of these inconsistencies was uncertainty and substantial differences within
Railtrack and the Train Operators about what to do with substantial arguments about
priorities.
How did this come to happen? Firstly, there have been many who suggested that the
government’s thinking was muddled and inconsistencies abounded (c.f. Welsby, 1999).
It was hence inevitable that some of these inconsistencies would appear in process
change. The urgency to implement the restructuring forced on British Rail did not give
time to contemplate and debate what were often seen as minor irritations that would
have to be lived with to meet the government’s implementation targets.
Secondly, there were substantial problems with software development. The second half
of this thesis concentrates in detail on software for train planning. The intention here is
to deal with software issues only so far as they impacted on the ability of the processes
73
to deliver. Train planning software, in common with most scheduling software, is
complex. The detail associated with mapping the infrastructure and then overlaying the
characteristics and constraints of the rolling stock and personnel that run the services
over that network cannot be over emphasised. As Wren (1995) points out (in this case
in the parallel, but simpler context of bus scheduling): ’the constraints on schedule
construction vary greatly….as do the “shapes” of the underlying bus schedules’.
Prior to privatisation, bespoke software developed in-house by B.R.’s computing division
was widely used to support train planning. This software was used predominantly to
document solutions since timetables were often drawn by hand onto graph paper in the
first instance. Little of the development work on automated scheduling undertaken at
universities had found its way into production use although Wren had been involved in
some initial work on driver scheduling. This software had evolved slowly over a number
of years, gradually providing more support to the users.
What was now required, however, was a step change in the functionality provided. Most
critically, the software now had to be capable of supporting the ‘bid and offer’ process by
passing detailed train schedule information backwards and forwards between the train
operators and Railtrack. This requirement was understood and the work put in hand in
late 1993 to develop the necessary software. The other ‘new’ task that the bid and offer
process demanded was the assessment of changes made by the other party.
Railtrack’s planners needed to know, down to the smallest detail, if a train operator had
amended its bids. Similarly, the train operators needed to know what changes Railtrack
or other train operators had made. This requirement became known as ‘version
comparison’, which was added to the specification in late 1994. After various problems
along the way, some of which reached the specialist computing press and national
papers (Harper, 1995, Moore, 1995, Collins, 1996), this functionality finally came into
partial use only in 1996.
This functionality eliminated much of the additional work caused by the split of
responsibilities between Railtrack and the train operators, but did nothing to reduce or
automate the workload to allow for the fact that the new process also required the ability
to ’turn round’ bids and offers in four weeks rather than as previously.

74
In summary, the software development programme was under-specified to meet the
needs of the new processes and yet, even as specified, it was over-ambitious given the
time available. The reasons for the size of the gap between expectation and delivery are
not clear. A combination of poor specification due to a lack of formal process analysis
(see below) and an unjustified belief in the ability of software developers to produce
software rapidly without a good understanding of the process to be supported appear to
be key contributory factors.
Thirdly, there had been a lack of formal ‘process analysis’ (the documentation and
assessment of a process in terms of its inputs, outputs and flows, physical and
information). This would almost certainly have revealed that the software was
substantially under-specified to meet the needs of the revised process and would have
raised serious questions about the operability of the process.
Process analysis could and should have been undertaken prior to signing off of the new
process. So why was there so little analysis? Urgency to meet preordained dates in the
privatisation process appears to be one reason; a belief in the practicability of rapidly
delivering new software to support the new process was another; a third was a belief
that train planners were/are as a breed pessimists and that their views, negative as they
were to the new process, should therefore be discounted.
Finally, the lack of process analysis led inevitably to a lack of procedures, documentation
and training - at the time when the substantial changes and the formality of the new
industry structure required this.
Put these four factors together and disaster, in retrospect, was almost inevitable.
4.7 Conclusions 1993-1999
The train planning process evolved slowly up until 1994, at which point substantial
changes were made in an attempt to accommodate the policy objectives and revised
structure imposed on the UK railway industry by the then Conservative government.
The author has so far described the process that was in use prior to restructuring, looked
at the changes made and then considered why the new process did not work effectively.
75
It is now time to consider the ‘lessons learned’.
A lack of clarity in the government’s policy objectives created substantial difficulties in
the development of new processes. For instance, was the introduction of competition
paramount? To what extent was integration of services to provide the best overall
package to customers to be encouraged? Clear, compatible policy objectives would
have provided a much better basis for the development of a new process.
As Adamson et al note (1991), “co-ordination [is] inherent in the timetabling process,
which in practical terms is impossible to replicate through market mechanisms”. Whilst
one might object in principle to such an absolute rejection of market forces in this area,
practical experience in working a competition orientated process suggests that train
planning is not easily adapted to work within a competitive environment. Policy
decisions need to be worked up on the basis of what is practically possible.
Timescales for railway privatisation in the UK appear to have been driven in part by the
then Conservative government’s desire to have the process completed before the next
General Election. Industry sources and politicians of the time (e.g. Roger Freeman,
Channel 4 interview, 2001) indicate that this ‘time-boxed’ the implementation process to
such an extent that there was little time for process analysis, with many key processes
only developed at a very high level at the point that Railtrack was split from British Rail.
Not giving enough time to develop processes in detail before decisions on future
responsibilities are agreed leaves the risk that it will not in practice be possible to
produce workable detailed processes and procedures that match the sketched out high
level proposals. Adequate time needs to be available to enable proposed new
processes to be assessed and tested properly.
Software development is very often an essential precursor to implementing change. It is,
in retrospect, not surprising that a realistic assessment was not made of the size of the
development task to produce software to support complex under-specified new
processes. If essential supporting software cannot be made available with certainty by
the required date, then implementation must be delayed.
Some problems with the process emerged later. The ‘Passenger Service Requirements’
76
that formed the minimum service specification that passenger train operators must
deliver, whilst providing some protection against service reductions, to some extent
‘ossified’ the timetable. Whilst this perhaps kept the train planning task to more
manageable proportions, questions were subsequently to be asked as to whether the
optimum timetable resulted. The continued use of British Rail’s internal revenue
allocation system (ORCATS, ‘Operational Research Computerised Allocation of Tickets
to Services’) to divide revenue between the passenger train operators also appeared to
be interfering with the train planning process - with trains being planned to ‘raid’ revenue
from ORCATS rather than to best meet customer needs.
Passenger and freight traffic volumes have grown since privatisation, despite the issues
discussed. However, it was clear that there was a very real need for further changes to
be made to train planning processes and systems to enable resources, especially track
capacity, to be used as effectively as possible, otherwise objectives for further growth
and performance improvement would not be met.
4.8 Further Problems and Process Changes 1999-2003
4.8.1 Process changes
Railtrack proposed and implemented, with industry agreement, a series of changes to
the timetabling processes in an attempt to remedy the problems described in the last
section, reducing the number of timetable changes back to pre-privatisation levels and
introducing a ‘timetable conference’ each year, modelled on continental European
practice for international trains. At this timetable conference the timetable plans of the
various train operators for the following year are shared, conflicting demands for
capacity discussed and preliminary solutions found, for subsequent working up in detail.
The major benefit of the conference approach in Britain has been that competition and
confidentiality in timetabling have been substantially replaced by collaboration.
Despite these changes, problems continued to arise. A number of specific cases are
now described and then the issues raised are discussed.

77
4.8.2 Case Study A: Overselling available capacity – Cross Country service improvements
Some of the franchises required the franchisee to do little more than efficiently manage
current operations, whilst others required major investment (Harris, 1999). British Rail
had operated a number of ‘cross country’ services focused on Birmingham and offering
an hourly service pattern to the South West, South Coast, North West and North East.
These were offered as a new "Cross County" franchise, and Virgin's bid promising to
double the service frequency with a new fleet of trains was a clear winner.
The procurement and supply of the new trains went relatively smoothly, despite the
introduction of technically advanced new diesel electrical multiple units, some of which
had ‘tilting’ technology to allow higher speeds round curves, but obtaining the necessary
paths for the extra services did not. Railtrack had the task of providing paths for these
extra services across the network whilst working within the access agreements of other
operators and with the constant risk of being accused of being unfair to these operators.
The challenge was to produce a new timetable with two trains per hour on the ‘core’
sections of route from Birmingham to York, Crewe, Reading and Bristol and with an
hourly service extending beyond these points. Overall, Cross Country’s services passed
across the territory of 18 of the 25 franchised passenger operators. After nearly ninety
timetable iterations over two years of planning, Railtrack produced a timetable which met
the rules of the plan and had the reluctant agreement of other train operators (who
remained concerned about the implications for their revenue and for the performance of
the network). The new service was introduced in Autumn 2002 and within a few weeks it
was clear that it would not work. Punctuality plummeted.
What went wrong? Discussions with industry insiders indicate that Railtrack had set out
to please everyone – partly because of constraints placed on it by the access
agreements it was committed to and partly because it lacked the level of analysis
necessary to convince train operators (or the Regulator) that it could not achieve all that
it was being asked to do.
The net effect was too many trains on certain sections of the network, particularly major
78
'pinch points' at stations and junctions, leading to knock on delays that persisted through
the day. In addition, turn round times for many services were insufficient to allow for late
running, compounding delay or leading to station stops being missed out to make up
time. To make matters worse, junction upgrades considered necessary for the new
service were delayed, and, whilst it was assumed the new trains' power and speed
would enable them to recover from delays and regain timetable slots, this rarely
happened in practice. A Virgin Trains spokesman confirmed the problems, saying ‘the
timetable worked in theory, but if a couple of trains were late, then it had an impact’
(Knight, 2003).
4.8.3 Case Study B: Overselling capacity – West Coast Main Line
Virgin Trains provided a compelling bid for the West Coast franchise too, promising
better services through a major upgrade of both infrastructure and trains. A profit
sharing deal with Railtrack was signed whereby the infrastructure would be upgraded to
permit 140mph tilting trains to run services from London to Birmingham, Liverpool,
Manchester and Glasgow.
Railtrack underestimated the cost of the infrastructure works but also, after persuading
the Regulator to approve its access agreement with Virgin Trains, found that the
combined access rights of all operators on the route could not be met even after the
upgrade. It was a widely held view amongst industry insiders that Railtrack simply could
not meet its commitments on the West Coast route and indeed Railtrack had been
unable to meet the terms of an enforcement notice placed on it by the Regulator (Office
of the Rail Regulator, 1999). Railtrack was potentially in breach of contract with a
number of train operators and, had the government not intervened in 2001 by putting
Railtrack into receivership, this could potentially have bankrupted the company.
One example of the problems with Railtrack's contract with Virgin Trains was the
planned separation of services on the West Coast Main Line between London and
Rugby, where the fast lines were to be used exclusively by Virgin Train's 140 mph tilting
trains, with up to 14 trains an hour. Other passenger and freight services also use these
tracks, and analysis ,undertaken after the contract had been signed, demonstrated that
there was not sufficient capacity on the slow lines for all other services to be taken off
79
the fast lines. In addition, local train franchisee Silverlink, running between London and
Northampton, had access rights over the fast lines, to which a number of solutions were
suggested, including 140mph express trains from London to Northampton. A further
problem, only understood after the contract had been signed, was that station stops
were required for the Virgin trains at Watford Junction and Milton Keynes Central, both
major traffic generators. On other high speed railways worked to this intensity, such as
the French Lignes à Grande Vitesse and the Japanese Shinkansen, the author has seen
through visits to these railways (several visits to French railways, a study tour to Japan
in 2002) that trains stop in platform loops so they can be overtaken by the following non-
stop train. See also O’Brien (2001) for a review of Japanese high speed line planning
and operation. Such infrastructure was not part of the West Coast plan.
Many of these problems were the result of timetabling work undertaken by Railtrack
being inadequate.
4.8.4 Case Study C: Open Access
Anglia Railways sought 'open access' access rights (that is access rights outside its
franchise commitments) to operate a new service from East Anglia round north London
and through to Basingstoke and Southampton. South West Trains, seeing the revenue
risk from this service, managed to agree paths with Railtrack that prevented most of the
paths that Anglia Railways wanted from being deliverable. Anglia Railways therefore did
not get the access rights and hence the paths it required to operate a coherent service.
The outcome does not appear to have been the best possible for either operator or for
the passenger: Anglia Railways did not get a sufficiently frequent service to provide good
journey opportunities and attract passengers and withdrew the service; South West
Trains has until recently (December 2005) been running an additional service each hour
which was not needed to meet demand and which impacted adversely on the
performance of the network overall.
4.8.5 Case Study D: ORCATS Raiding
Most tickets can be used on any operator on a route and, since it would be prohibitively
80
expensive to do more than a small sample count of which passengers use which trains,
some allocation mechanism is required. ORCATS was developed by British Rail to help
understand passenger decisions and therefore offer the best overall service. It was the
only available system to allocate revenue between operators and has been used since
privatisation to allocate revenue between train operators running along the same route.
Since ORCATS was not designed to ensure rational competition decisions would be
made by train operators, an important perverse incentive exists resulting in what is
known by railway insiders as the ‘ORCATS raid’.
By understanding how the ORCATS algorithms work, it is possible for train operators to
adjust their timetables so as to get the maximum revenue allocation, without necessarily
offering any extra passenger benefits. See Doe (2003) for a brief example of the
problem.
From a network capacity point of view, these extra trains mean extra congestion and
hence extra delays and industry insiders say that there were often insufficient passenger
benefits from the extra services, as many were designed to increase revenue allocation
rather than provide better journey opportunities.
Again, better processes within Railtrack should have enabled arguments to be made to
prevent perverse actions being permitted.
4.8.6 Analysis
Analysis of the case studies set out above suggests that there were a number of
weaknesses within the access regime as formulated at privatisation and the timetable
process as implemented. In particular, mechanisms to ensure that the best overall
capacity usage was achieved were not in place, with train operators encouraged by the
low marginal cost written into the access agreements to run extra trains even where
there was insufficient overall benefit (case studies C and D), and with no mechanism in
place to take off services that had a smaller benefit than the new service proposed (case
studies A and B) to ensure performance remained at acceptable levels. However, this
must be seen in the context of a network that was not considered to be congested and
where industry players for the most part did not fully understand the extent of the
81
performance reduction that would result from the additional trains they proposed to run.
In retrospect, train operators should have used the appeals mechanism permitted by the
Access Conditions and, if necessary, the right to appeal to the Rail Regulator, rather
than acquiescing to Railtrack’s proposals.
On the positive side, it should be noted that the access regime allowed a significant
number of extra services to run that were worthwhile and these additional services have
contributed, along with fare rises that were below inflation levels initially and the buoyant
performance of the UK economy, to passenger numbers and freight volumes growing
substantially since privatisation.
4.8.7 Remedying the deficiencies
4.8.7.1 Network Rail replaces Railtrack
It is a widely held view that Railtrack was a dysfunctional organisation (c.f. Wolmar 2005)
with inappropriate processes and poor leadership, not only in the area of train planning.
The more general problems came to a head following the derailment near Hatfield on 17
October 2000 in which 4 people were killed. It was not the accident itself which caused
the demise of Railtrack, rather the way in which the senior management had a corporate
‘mental breakdown’ in the following hours, imposing draconian speed limits across the
network because they felt that they could not be certain that a similar accident was about
to happen somewhere else on the network. Railtrack had few engineers on its staff, with
the process it had devised at its inception being to rely on its contractors to identify work
required. There was of course a direct incentive for Railtrack to minimise renewals as
this reduced payments to the contractors and an important indirect one too as when
‘possessions’ of the track were granted to contractors to carry out work Railtrack would
have to make payments to the train operators to compensate them for the loss of
revenue as their trains had been cancelled or diverted. Whilst this provided an
appropriate commercial incentive on Railtrack not to take unnecessary possessions, if,
as proved to be the case, Railtrack did not have appropriate expertise to judge when
work was essential then it could postpone work which was safety-critical: the renewal of
the faulty rail at Hatfield was postponed by several months to avoid higher compensation
82
payments to the train operators.
The implication for Railtrack of imposing speed limits across the network was massive
compensation payments to the train operators. It later compounded this outflow of cash
by throwing money at the contractors to improve the condition of the track. Railtrack
went ‘cap in hand’ to government on several occasions asking for grants to cover this
extra expenditure. Railtrack appeared to government and others to be ‘out of control’
and, on 7th October 2001, the government decided to use a mechanism set up as a ‘last
resort’ in the Railways Act 1993 (and intended for use with train operators in difficulty
rather than Railtrack) – Railway Administration. In a speech to the House of Commons
the following week, Stephen Byers, Secretary of State for Transport, Local Government
and the Regions, set out how the government intended to replace Railtrack (Hansard,
2001):
“We shall be proposing to the Administrator that a private company limited by guarantee
be established to take over Railtrack's responsibilities. Any operating surplus it makes
would be re-invested in the railway network itself. Such a company would have the
needs of the travelling public and other users as its priority. With no shareholders we
would remove the conflict between the need to increase shareholder value with the
interests of rail passengers. The company we propose would have responsibility for
operations, maintenance and renewals. It would have a small professional Board of
executive and non-executive directors. Performance targets would be set linked to levels
of service, safety and value for money. A Board working on commercial lines but
focused solely on delivering a safe well-maintained rail network that is fit for the 21st
century.”
Network Rail took over Railtrack in 2002 and immediately started to get the organisation
and its activities back ‘under control’. How it did this and the extent to which it
succeeded will no doubt in time be recorded by other researchers. Turning to train
planning, the first formal position statement by Network Rail appeared in its March 2003
Business Plan, in which Network Rail accepted that there were problems – as it
describes them, ‘historical shortcomings’:
1. “inadequate understanding of future traffic patterns, whether arising from
83
existing commitments or changing customer requirements;
2. gaps in our modelling and strategic access planning systems capability;
3. outdated rules and standards used in timetable construction;
4. late availability of engineering access requirements and short notice
change requests;
5. a labour intensive and inefficient timetabling process;
6. failure to meet the required timescales for notification of timetable
changes (Informed Traveller); and
7. validation of train paths only partially completed prior to operation.”
In the Business Plan it also set out what it intended to do:
“Over the next two years we have identified priority actions to deliver our goals:
1. working closely with the SRA (Strategic Rail Authority) to support its
Capacity Utilisation Policy and to develop Route Utilisation Strategies
which optimise capacity usage and clarify future requirements; (discussed
in the text below on the SRA);
2. completing development and implementation of a suite of Strategic
Access Planning tools and systems to ensure the impact of changing
capacity and traffic patterns is understood prior to timetable development;
(see chapter 6);
3. continuing review of the rules on which timetables are developed, in
conjunction with the SRA; (see chapter 4);
4. national coordination of regional Integrated Planning Units to ensure the
improvements in engineering planning also benefit the timetabling
process; (a restructuring to reduce the internal interfaces; in addition,
Network Rail set up a ‘Strategic Access Planning’ unit to focus its forward
capacity planning activities in a single team);
5. begin a comprehensive overhaul of our timetabling systems and tools,
which is scheduled to continue until 2007 (see chapter 6); and
6. contribute to an industry-wide recovery plan to meet the Informed
Traveller timescales, through improved engineering planning and cutting
process cycle time“. (‘Informed Traveller’ was a project to ensure that
passenger information systems and reservations systems were up to date
84
10 to 12 weeks before the day the train ran – following Hatfield forward
information, particularly for weekends, had deteriorated to the position
that sometimes the changes were only notified by Railtrack/Network Rail
to the train operators a few days before the day the trains ran).
“In addition, we will implement EU Directive requirements to move to a single annual
timetable change each December” (this was to bring all EU countries into line to
simplify the timetabling of trains crossing national boundaries – this of course has
very little impact on the UK).
4.8.7.2 The Strategic Rail Authority
The Strategic Rail Authority (SRA) came into being on 1 February 2001, following the
passage of the Transport Act 2000, after running in ‘shadow mode’ for a period of time
before that. It was set up to “create a clear, coherent and strategic programme for the
development of the railways and provide a single body accountable to the Secretary of
State for strategic planning, co-ordinating and supervising the activities of the rail
industry and for the disbursement of appropriate public funds” (SRA, 2003,1). The
formation of the SRA was seen as necessary to ensure that the overall direction that the
railway industry took was focused on meeting government objectives, particularly its
‘Ten Year Plan’ for transport (Department for Transport, 2000), as the government, even
before the Hatfield accident, was aware that strategic direction was lacking.
Of particular importance to this thesis is that the SRA was required to “develop a policy
for the utilisation of network capacity” (Directions and Guidance to SRA from the
Secretary of State, SRA, 2001). The Directions and Guidance go on to say that “in an
ideal world sufficient capacity would be available for all users. Much more can be done
to optimise the capacity of the existing network and the SRA should work closely with
Railtrack and the industry to identify measures to achieve this. Where this is not
possible, for instance where physical locations are constrained, hard choices may have
to be made to identify priorities where operators’ aspirations may conflict with one
another”.
From the beginning of 2002, the SRA studied how it could achieve better capacity
85
utilisation. It published several documents which set out its position: its Capacity
Utilisation Policy consultation (SRA, 2002), Statement of Principles (SRA, 2002,1),
Network Utilisation Strategy (SRA, 2003, 2) and its first route-specific study, the Midland
Main Line Route Utilisation Strategy (SRA, 2004,1). In addition, it published its Strategic
Plan (SRA, 2002, 2003), setting out its wider objectives and plans and its Appraisal
Guidelines (SRA, 2003, 3), which set out how different options would be judged. The
SRA reviewed how much freedom it gave franchisees to set their own timetables and, to
control their activities in this area, new franchisees were required to get the SRA’s
approval before seeking access rights or bidding for specific paths. This was done to
enable the SRA to work towards more effective use of network capacity.
Returning to the case studies, the SRA was able to use its power (as funder of the
industry and specifier of the franchises) to put right some of the problems caused. For
the cross country services (case study A), the SRA worked with all operators to produce
a coherent service pattern, agreeing reductions in service levels with other operators
(e.g. Central Trains) where duplication existed and where benefits were exceeded by
costs, particularly performance disbenefits. For the West Coast (Case Study B), a
Strategy was developed and published (SRA, 2004), setting out a rational set of
infrastructure enhancements focused on cost-effectively meeting the needs of the many
users of the route – this proposal being based on detailed timetabling analysis. 140mph
running was ruled out, at least for the short term, as the capacity and performance
problems that this higher speed creates have been judged to outweigh the benefits of
shorter journey times. The problems of case studies C and D have to some extent been
resolved by restricting franchised operators’ freedom to bid for additional or varied paths
– franchise agreements now require any train operator seeking to vary its access rights
or paths to get the SRA’s permission first. However it was not possible for the SRA, or,
since the demise of the SRA, the Department for Transport, to control Open Access
operators. Although the Office of Rail Regulation does take account of effective network
utilisation when considering requests for access from open access operators in the
same way as it does for access requests from franchised operators, issues have re-
emerged more recently (see the discussion in the following section regarding Grand
Central).
Two further examples demonstrate how capacity utilisation was improved through the
86
SRA working with train operators. The first related to a proposal put forward in 2002 by
First Great Western, the train operator running franchised services from London to the
West Country and South Wales (First Great Western, 2002). By restructuring the
timetable between London and Reading and changing the types of trains used, the train
operator found that it would be possible to increase the number of peak hours seats by
30% and, at the same time, improve performance. The second example is the work
undertaken to develop the Midland Main Line Route Utilisation Strategy, in which it was
found that extra peak hour seats and extra inter-urban services could be provided
without a material performance impact through the introduction of longer trains and
restructuring the timetable to reduce knock-on delays.
4.9 Conclusion 1999-2003
Structural and process change during this period led to a focus on ‘capacity utilisation’
rather than material change to the timetable process itself.
The SRA’s approach appeared to get all industry organisations focused on improving
performance and on better matching capacity to demand and there appeared to be a
common view that effective use of the available capacity is an essential element of a
successful rail industry. Richard Bowker, then Chairman of the SRA, highlighted that
unless the rail industry could demonstrate that it is using what it has now effectively,
there was little justification for funding of further major enhancements (SRA, 2003).
There also appeared to be an acceptance at the time that the SRA had a key role to play
(Modern Railways ‘Railtalk’ 1999).
Discussions with Network Rail and train operator personnel suggest that the changes
described above were successful in improving capacity utilisation and that doing this
helped the timetable process to work more effectively, as some of the hardest to resolve
conflicts between the aspirations of different operators have already been resolved.
It was recognised that more needed to be done, particularly to understand how different
capacity utilisation impacts on demand and on train running performance. The SRA and
ORR recognised this and, in a ‘concordat’ (ORR, 2002), stated that “the ORR and the
SRA will work together to develop better measures of network capacity, and a better

87
analytical toolkit for informing decisions on the allocation of capacity between different
types of passenger and freight flows”.
In addition, as set out in Network Rail’s business plan, work started to improve the
systems used in the timetable processes. More is said about these in later chapters.
4.10 2003-2007
4.10.1 Demise of the SRA
The most important structural change to the industry in this period was the demise of the
SRA. The government’s proposals were set out in its White Paper ‘The Future of Rail’
published in July 2004. In his foreword to this document, Alistair Darling, the then
Secretary of State for Transport, commented that privatisation had led to “inefficient and
dysfunctional organisation coupled with a failure to control costs”. In particular the
Secretary of State had been persuaded that the SRA was not adding sufficient value to
justify its existence and that a stronger Network Rail and more direct control by the
Department for Transport would yield better results more quickly.
The White Paper stated that the existing public-private partnership structure of the
industry would remain and set the rail industry’s key priorities as to “control its costs and
live within the level of public funding available to it, and to improve its performance for
passengers and freight users”. It gave the ORR an expanded role, taking on safety
regulation as well as economic regulation. It brought back into direct government control
the task of setting the strategy for the railways including determining the level of public
expenditure and the key outputs to be delivered. Responsibility for franchising
passenger services also passed to DfT. A DfT-Network Rail “binding arrangement” was
to be created setting out the outputs required of Network Rail, with a licence obligation
enforced by ORR as the mechanism to ensure that these outputs were delivered.
Network Rail was to have overall responsibility for operating the network and its
performance including “leading industry planning, setting timetables and directing
service recovery”. The number of franchises would be reduced and more closely
aligned with Network Rail’s regional structure. It also provided for the devolved
governments in Scotland and Wales and regional and local funders (Passenger

88
Transport Executives and Transport for London) to have an increased role in specifying
and funding services.
The direct impact on train planning was minimal, as Network Rail already had the
responsibility for ‘setting timetables’, although there was some discussion about whether
the ‘leadership’ role meant that Network Rail could or should be more prescriptive. An
indirect impact was that Network Rail took on responsibility for overall capacity utilisation
and development of route utilisation strategies.
Network Rail now has a rolling programme for the development and update of Route
Utilisation Strategies and has expanded their coverage to include a longer timeframe
and possible enhancement options, whereas the SRA focused much more on making
best use of the available capacity (see Network Rail, 2007)
4.10.2 Further Minor Process Change
The Network Code has continued to have minor changes made to it to improve the day
to day working of the timetabling process. The author has had access to internal
industry documents, c.f. O’Brien (2005), Freeman (2005), and the following key points
have been extracted from these.
Some of these are a natural extension of the work previously undertaken by the SRA to
better understand capacity utilisation – changing the Decision Criteria to recognise the
concept of maximum capacity allowed, ensuring that timetabling decisions made by
Network Rail are consistent with the Route Utilisation Strategies and matching the
timetabling processes to EU legislation (European Union, 2001) which sets out a
process for infrastructure managers, such as Network Rail, to identify ‘Congested
Infrastructure’ and propose how this congestion is to managed or remedied.
Recognising the reality that timetable evolution is the norm rather than complete
‘recasts’, the Network Code is being changed such that the train operators are only
required to notify Network Rail of any changes in the rights they intend to exercise,
rather than having to notify Network Rail of all of the services they wish to run.

89
In an attempt to ensure that changes being requested by operators (or flexing by
Network Rail) are beneficial overall, it will in future be necessary to accompany any
proposal for change to the timetable with a reasoned explanation.
Network Rail is considering establishing mechanisms to accredit, where appropriate,
train operators’ train planners to undertake timetable planning on Network Rail’s behalf,
with Network Rail providing assurance of their work and ensuring that there is no
discriminatory behaviour. It is intended that this enables the interface between Network
Rail and train operators to be more flexible (for instance, the train operators’ train
planners resolving conflicts between the trains of different operators in advance of
submitting their bids to Network Rail). This could have the benefit of improving the
understanding by train planners of the end to end process and lead to better decisions
being made.
4.10.3 Open Access Timetabling Issues Reappear
A new open access passenger operator – Grand Central - spent several years getting
access to the rail network and in Spring 2006 finally achieved its ambition to get
approval to run services from Sunderland to London. The ORR granted access rights in
the face of considerable opposition from Network Rail, who argued that the capacity did
not exist and Great North Eastern Railways, the then operator of the East Coast main
line passenger franchise, who argued that it would abstract considerable amounts of
revenue from their services.
Although Network Rail undertook high level capacity analysis (Network Rail, 2005), it is
clear that this was substantially inadequate to support their position and hence the ORR
was not persuaded that adequate capacity did not existed (ORR, 2006). The conclusion
that must be reached from this outcome is that there is still a considerable amount of
change required before timetabling processes and systems can be regarded as ‘fit for
purpose’.
4.10.4 Development of Systems to Support Train Planning
Network Rail launched a major project to improve its train planning systems in 2006. No
90
outputs are yet available for review; time will tell whether a step change is to be
achieved. The nature of the changes needed and the possible improvements that could
be made are discussed in chapters 6, 7 and 8.
4.11 Conclusions
Evidence has been presented suggesting that the restructuring and subsequent
privatisation of British Rail had an adverse effect on the output achieved from the
timetabling and resource scheduling processes. There are several possible factors at
play:
1 Management attention may have been diverted from day to day issues to the
major reorganisation task;
2 Key personnel may have been displaced or retired; and/or
3 It may be that the nature of the restructuring undertaken was not conducive to
effective train planning.
Undoubtedly, the first two factors have played a part; it can be argued that these have
had an effect across the industry - ‘when we reorganise we bleed’ as Fiennes’ said in his
book on running the railways in the 1960s (Fiennes, 1967), quoted for instance by Peter
Snape MP in Parliament (Hansard, 1st May 2001).
This thesis is focused on processes and systems, however, and attention has therefore
been concentrated on the effect of the third factor. It has been shown that the new
structure imposed on the industry in Britain by the Railways Act 1993 has hindered the
development of effective timetables and resource plans by creating an artificial boundary
in the middle of what needs to be a seamless process. The hypothesis set out at the
beginning of this chapter has been proven, within the level of certainty possible using
qualitative research methods.
It is further concluded that, whilst the changes made since the initial process introduced
at privatisation have improved the timetables delivered, there is still much to be done
before the process can be considered as truly ‘fit for purpose’.
Overall it is evident that better planning prior to privatisation, together with more realism

91
as to what was practically possible, could have made the transition far less traumatic
than it was. This conclusion is of considerable importance to governments and other
railway administrations that might be planning railway privatisation – if other railways
start from the same position and make the same mistakes the same difficulties can be
expected.
The case specific nature of the research presented in this chapter means that attempting
to make generalisation outside railways requires caution. Having said this, the
conclusion that serious problems are likely to result from poor planning and rushed
implementations, with processes not redesigned to match with new organisational
structures, is a conclusion that is not surprising and the general lessons are transferable
to other sectors and other circumstances.
92
5 OBJECTIVES FOR TRAIN PLANNING
5.1 Introduction
The purpose of any process is to deliver objectives. In this chapter the author reviews
and assesses the objectives that impact on and/or influence railway timetabling.
Inevitably, the structure of the industry will impact on objectives in a variety of ways and
this chapter is focused solely on objectives in the privatised railway in Britain. After
setting out the data collection and analysis methods used and a brief review of the
literature on objectives, the business objectives of the key organisations within Britain’s
railway industry are documented and discussed (focusing down on train planning), then
the views of railway managers and timetablers. An attempt is made to categorise these
objectives in a structured manner. This analysis will be returned to in a later chapter as
it forms the basis for timetable generation software development. Finally conflicts
between these objectives are considered and the extent to which these objectives are
being met is assessed.
What value is intended to be gained from the analysis in this chapter? Firstly the author
seeks to assess alignment in objectives, as to the extent these are not aligned, there will
be tension and, for some, non-achievement. This could facilitate realignment of
objectives. Secondly he seeks to consider the extent to which the processes adopted
are appropriate for the achievement of these objectives. This could highlight changes
that need to be made to the processes. Thirdly, the analysis in this chapter could be
used as an input to researchers and suppliers to the rail industry who are working on
operational research techniques and associated software to support timetabling
processes through automating the development of timetables that meet these objectives.
Finally this work will be of interest to researchers looking at scheduling in other
industries, as typically they have diverse and conflicting objectives too.
Some of this chapter (much of the section on management and train planner objectives)
has been published in the paper ‘Prospects for computer aided railway scheduling:
perspectives from users and parallels from mass transit’ (Watson, 2000); other elements
93
were included in a peer reviewed paper to the 2nd International Seminar on Railway
Operations Modelling and Analysis, Hannover, March 2007 (Watson, 2007). A short
paper on key issues was presented at a Passenger Transport Networks seminar in York,
UK (Watson and Boodoo, 2002).
5.2 Methods
The methods adopted to investigate organisational objectives and their impact on
timetabling have been a combination of the study of written material published by the
organisations and interviews with railway personnel. Some interviews were undertaken
directly by the author. Other interviews and some preparation of the data from these
interviews was undertaken by an EPSRC funded researcher during 2001-02. Initial
findings were published jointly in a conference paper in October 2003 (Boodoo et al.,
2003).
The data collection exercise undertaken by Boodoo consisted of a series of semi-
structured interviews with stakeholders in the railway timetabling process in the UK. The
interviews included passenger operators from the former Inter City, Network South East
and Regional Railways groups, Railtrack/Network Rail, a Passenger Transport Executive
(PTE), the SRA and the Rail Regulator. The interviewees held various positions, from
timetablers working on the mechanics of the timetabling process to management and
strategic roles. In addition to providing insights into objectives, the transcripts revealed
contentions and conflicts within the current processes and also wider issues regarding
the industry structure in the UK. Practitioners revealed how they overcame the problems
they faced and highlighted the practical differences between the theory and practice of
the timetabling process Boodoo produced a data set from these interviews which has
been drawn on in the analysis undertaken in this chapter.
This analysis has been reviewed with industry players to ensure that it accurately
reflects their understanding of their organisation’s objectives.
The sections on managerial and train planner objectives also use data built up over a
number of years working with Britain’s train planners in a management capacity, with a
Scandinavian railway as an advisor on train planning process improvement and software
development, c.f. Gardermoen Railway Project (1998-99), together with a survey of
94
senior views within Britain’s railway industry undertaken in April 2005. This analysis
focuses on ‘tactical’ objectives for the timetabling process rather than the over-arching
objectives set out in the previous section.
5.3 Literature on Objectives
Objectives in the context of organisations can be defined as “specific results that an
organisation seeks to achieve in pursuing its basic mission” (David 2005) or, more
bluntly, “an objective is a statement of what is to be achieved” (Byars et al. 1996).
Drucker (1954) pointed out that “objectives are needed in every area where performance
and results directly and vitally affect the survival and prosperity of the business”. He
highlighted that in any organisation there is no one objective – to search for one is ‘not
only likely to be as unproductive as the quest for the philosopher’s stone; it is certain to
do harm and to misdirect’. He stressed that each job within an organisation must be
focused on the success of the whole – managers are not automatically focused on a
common goal, with a number of facets of organisations working against common goals -
specialised work, where professional objectives may dominate over organisational
objectives, hierarchical structure, with goals getting diffused or distorted between top
and bottom, and differences in vision between different parts of an organisation.
Byars et al. highlight that objectives can be categorised by the timeframe for
achievement, that is, short range (less than a year) or long range, with writers and
investigators sometimes also adding an intermediate timeframe – typically one to three
years. Objectives can also be classified according to their breadth of influence, whether
they are corporate or organisational, divisional functional and by their focus, for instance
profitability, service to customers, employee needs and well-being, social responsibility.
Variants on these categorisations are used later in this chapter as a method of codifying
train planning objectives.
A different stream of literature looks at the ‘fit’ between objectives at different levels of
the organisation. David (2005) highlights that in all but the smallest organisations there
is a split in responsibility between objective setting and objective delivery and he notes
that “managers and employees are motivated more by perceived self-interests than by
95
organisational interests, unless the two coincide”. Byers et al. note that there will be
bargaining amongst the conflicting interests within the organisation and further note that
objectives should be cascaded down, to ensure that there is consistency. However,
Cyert and March (1963) found that organisational objectives at different levels in the
organisation are rarely consistent, often for perfectly good reasons. For example the
objective of manufacturing to keep unit costs down by long production runs is likely to
conflict with the objective of marketing to satisfy customers with urgent orders. Gee
(1969) found that, in the long run, there did tend to be internal consistency in behaviour
with reference to objectives in successful organisations, but noted that, in the short term,
‘satisficers’ could be prioritised ahead of achievement of objectives, just to ‘get by’. The
level of ‘fit’ between objectives for train planning will be discussed in a later section of
this chapter.
5.4 Business Objectives of Key Organisations
5.4.1 Introduction
The objectives of each of the major players in the privatised railway industry are now set
out, focusing on how they impact on train planning. The extent to which they are
consistent with each other and being achieved is then discussed.
5.4.2 Government
The government department responsible for rail policy is the Department for Transport.
The policy for rail needs to be seen in the context of the government’s 10-year plan for
transport which sets the government’s objectives as follows (Department for Transport,
2000):
“Our vision is that by 2010 we will have a transport system that provides:
• Modern, high quality public transport, both locally and nationally. People will have
more choice about how they travel, and more will use public transport;
• More light rail systems and attractive bus services that are fully accessible and
integrated with other types of transport;
• High quality park and ride schemes so that people do not have to drive into
96
congested town centres;
• Easier access to jobs and services through improved transport links to
regeneration areas and better land use planning;
• A modern train fleet, with reliable and more frequent services, and faster trains
cutting intercity journey times;
• A well-maintained road network with real-time driver information for strategic
routes and reduced congestion;
• Fully integrated public transport information, booking and ticketing systems, with
a single ticket or card covering the whole journey;
• Safer and more secure transport accessible to all;
• A transport system that makes less impact on the environment.”
More specifically for rail, the Department for Transport sets out its objectives as follows:
“The 10-year plan aims to increase rail passenger numbers by delivering a high
quality, reliable and efficient railway network. We are also working to develop a
stronger customer focus, improved punctuality, increased capacity, reduced
overcrowding, growth in freight and enhanced safety throughout the industry.”
[Department for Transport, 2000, http://www.dft.gov.uk/stellent/groups/
dft_railways/ documents/sectionhomepage/dft_railways_page.hcsp ]
Analysis of these objectives by the author suggests that it is possible to synthesise the
statements in the 10 year plan into a set of high level objectives for rail, as follows:
• Support growth of the economy;
• Reduce road congestion by achieving modal shift;
• Minimise environmental impact/support achievement of Kyoto objectives;
• Improve reliability, provide faster and more frequent services;
• Improve accessibility;
• Do the above at an acceptable cost to the Treasury.
Although government does not explicitly state its expectations for the train planning
processes, it is reasonable to assume that it would expect them to help to plan the use
of the network at a strategic level to deliver train services that support the higher level
objectives.

97
5.4.3 The Strategic Rail Authority
The SRA’s responsibilities were in 2005 passed to DfT (Rail Directorate) and Network
Rail, with the SRA being ‘wound up’. The section that follows therefore sets out the
position prior to 2005. The objectives that are discussed have been largely passed back
to DfT, although some change of emphasis is emerging, particularly a higher priority
being given to reducing the cost of the railway.
The SRA’s primary functions were set out by government in ‘Directions and Guidance’
(SRA, 2001). These refer back to the Transport Act (2000) as follows:
“Section 205 of the Act sets out the Authority's purposes as:
1. To promote the use of the railway network for the carriage of
passengers and goods;
2. To secure the development of the railway network; and
3. To contribute to the development of an integrated system of transport
for passengers and goods.
Section 207 of the Act requires the Authority to exercise its functions with a
view to furthering its purposes and it must do so in accordance with any
strategies that it has formulated with respect to them. In so doing the
Authority must act in the way best calculated:
4. To protect the interests of users of railway services;
5. To contribute to the achievement of sustainable development;
6. To promote efficiency and economy on the part of persons providing
railway services;
7. To promote measures designed to facilitate passenger journeys
involving more than one operator (including, in particular,
arrangements for the issue and use of through tickets);
8. To impose on operators of railway services the minimum restrictions
consistent with the performance of its functions; and
9. To enable providers of rail services to plan their businesses with a
reasonable degree of assurance.”
98
Later in the Directions and Guidance are set out the objectives that flow through from
through from the government’s 10 year plan:
“The Government's key targets for the railway are set out in Annex 2 to the 10
Year Plan, and include the following:
1. To increase rail use in Great Britain (measured in passenger
kilometres) from 2000 levels by 50% by 2010, with investment in
infrastructure and capacity, while at the same time securing
improvements in punctuality, reliability and safety;
2. To reduce overcrowding in London to meet SRA standards by 2010;
3. A significant increase in rail freight's share of the freight market by
2010. The Government believes it ought to be possible to increase
market share resulting in an increase of up to 80% in rail freight by
2010.
Other relevant targets set out in the 10 Year Plan, to which the railway will
contribute, include:
1. To reduce road congestion on the inter-urban network and in large
urban areas in England below current levels by 2010;
2. To improve air quality by meeting National Air Quality Strategy
targets; and
3. To reduce greenhouse gas emissions by 12.5% from 1990 levels, and
move towards a 20% reduction in carbon dioxide emissions by 2010.
Specific outcomes which the railway is expected to achieve (including the targets
set out above) are:
1. A 50% increase in passenger journeys overall;
2. More frequent services, faster journey times and an 80% increase in
patronage on inter-city lines;
3. More frequent services on commuter lines;
4. Better cross-country network connections;
5. Increased reliability and punctuality;
6. Better integrated information for customers;
7. Improved levels of customer satisfaction with the quality of services
99
and of stations;
8. An increase in rail's share of the freight market to around 10%,
equating to an additional 15 billion tonnes-km of rail freight a year;
9. A more efficient and competitive service from rail freight.
And in addition
Since the publication of the 10 Year Plan, the performance of the railway, in
terms of the punctuality and reliability of services, has declined. The Authority is
required, as an equal primary objective, to work with the rail industry to achieve
substantial lasting improvements in performance.”
The key objectives can be summarised as:
• 50% growth in passenger km by 2010;
• 80% growth in freight km by 2010;
• Reduced levels of ‘Passengers in Excess of Capacity (PIXC)’ where PIXC is
defined as when peak hour loadings in the South East exceed a tolerable level of
overcrowding, this level being set dependent on journey time ;
(these first three were often described by SRA personnel in short hand as the
‘50-80-PIXC target’)
• A substantial improvement in train running performance;
• Achieving modal shift (road to rail) and working towards Kyoto pollution
objectives;
• Demonstrating VFM and using private sector funding wherever possible.
It is worth noting here potential contradictions between these objectives, e.g. growth may
well be most easily achieved by generating additional long distance leisure travel rather
than diverting from road shorter distance commuter journeys (cutting across the modal
shift objective) and by providing services that encourage commuters to live further from
where they work (cutting across pollution objectives).
In the Appendices of the Directions and Guidance, further detail is given of the SRA’s
objectives in the area of ‘capacity planning’.
100
“To secure increases in the capacity of the railway to accommodate the expected
growth in passenger and freight traffic. Primary responsibility for the network
rests with Railtrack, with whom the Authority should work closely to identify
priorities for investment. Proposals for franchise replacement may include
specific measures to increase capacity. The Authority may wish to finance
capacity enhancements directly where to do so would achieve value for money
and the investment would otherwise not be made.
To develop a policy for the utilisation of network capacity. In an ideal world
sufficient capacity would be available for all users. Much more can be done to
optimise the capacity of the existing network and the Authority should work
closely with Railtrack and industry to identify measures to achieve this. Where
this is not possible, for instance when physical locations are constrained, hard
choices may have to be made to identify priorities where operators' aspirations
may conflict with one another. The Authority's policy should be designed to
inform operators and to assist the Regulator in his consideration of proposed
access agreements.”
Assessment of these stated objectives (alongside interview responses) leads to the
deduction of the following SRA objectives for the train planning process:
• Best possible use of existing capacity (Capacity Utilisation Policy);
• Facilitate the provision of extra train services at the right times going to the right
destinations to permit growth targets to be met;
• Facilitate the provision of extra train services to reduce ‘PIXC’;
• Develop timetables that support punctual train running ‘on the day’ to achieve
improved train running performance;
• Do all this without significant extra government funding – i.e. as far as possible
without the need for investment in additional infrastructure.
5.4.4 The Office of the Rail Regulator (until 2004 – now the Office of Rail Regulation)
The Rail Regulator set out his aims and objectives as follows (ORR, 2003,2):

101
“Aims
Through independent, fair and effective regulation to create and maintain the
incentives and conditions necessary to achieve the continuous improvement of a
safe, well-maintained and efficient railway which meets the needs of its users,
and facilitate investment in capacity to satisfy the demands of growth in
passenger and freight traffic at the time it is needed.
In all their work, ORR staff aim to provide a service to the rail industry that is
thorough, constructive, timely and fair.
Key objectives:
• To ensure the monopoly infrastructure provider’s effective and efficient
stewardship of the national rail network;
• To ensure the fair and efficient consumption of rail capacity, and promote
effective and efficient working relationships between players in the rail
industry
• To prevent anti-competitive agreements and practices in the rail industry
and promote competitive markets for the benefit of users of the railway.”
From this can be synthesised one key objective for the train planning process:
• To ensure the fair and efficient consumption of rail capacity
The Rail Regulator undertook a detailed review of and consultation on the timetabling
processes. Following this review, the Regulator made the following statement regarding
what the objectives for the timetabling process should be (ORR, 1998):
“(a) facilitating the development and operation of train services which best meet
the needs of passengers and freight customers and encouraging innovation in
the provision of train services;
(b) optimising the sharing of capacity on the network in accordance with the
public interest criteria as defined by the Regulator's statutory duties, and
102
encouraging cooperation between train operators, and between train operators
and Railtrack, to improve overall service to passengers and freight customers,
and provide overall service patterns and connections which meet the needs of
users;
(c) preserving and developing network benefits, ensuring that connections
between services (both passenger and freight) are maintained and improved;
(d) enabling delivery of accurate and timely information about train services;
(e) achieving stability, efficiency and responsiveness in operation of the
processes, and an efficient deployment of industry resources;
(f) facilitating the effective maintenance, renewal and development of the
network;
(g) facilitating the development of an appropriate level of competition as a
stimulus to better services, whilst ensuring that adequate mechanisms are in
place to prevent behaviour detrimental to the public interest;
(h) recognising the obligations on passenger train operators to meet their
franchise agreement commitments to the Government and Passenger Transport
Executives, and also the needs of freight operators to meet the developing needs
of their current and potential customers; and
(i) recognising that the objectives are more likely to be achieved if they are linked
to commercial incentives on operators and Railtrack.”
In the same way as government objectives cascaded to SRA to be delivered, the above
set of objectives must be delivered by Network Rail with the support of Train Operators.
More guidance is provided to the industry in the form of Decision Criteria, set out in the
Access Conditions and Network Code:
“The Decision Criteria consist of the necessity or desirability of the following
(none of which necessarily has priority over any other):
(a) sharing the capacity, and securing the development, of the Network for the
carriage of passengers and goods in the most efficient and economical manner
in the interests of all users of railway services having regard, in particular, to
safety, the effect on the environment of the provision of railway services and the
proper maintenance, improvement and enlargement of the Network;
(b) enabling a Train Operator to comply with any contract to which it is party

103
(including any contracts with their customers and, in the case of a Train Operator
who is a franchisee or franchise operator, including the franchise agreement to
which it is a party), in each case to the extent that Railtrack is aware or has been
informed of such contracts:
(c) maintaining and improving the levels of service reliability;
(d) maintaining, renewing and carrying out other necessary work on or in relation
to the Network;
(e) maintaining and improving connections between railway passenger services;
(f) avoiding material deterioration of the service patterns of operators of trains
(namely the train departures and arrival frequencies, stopping patterns, intervals
between departures and journey times) which those operators possess at the
time of the application of these criteria;
(g) ensuring that, where the demand of passengers to travel between two points
is evenly spread over a given period, the overall pattern of rail services should be
similarly spread over that period;
(h) enabling operators of trains to utilise their railway assets efficiently and
avoiding having to increase the numbers of railway assets which the operators
require to maintain their service patterns;
(i) facilitating new commercial opportunities, including promoting competition in
final markets and ensuring reasonable access to the Network by new operators
of trains;
(j) avoiding wherever practicable frequent timetable changes, in particular for
railway passenger services; and
(k) taking into account the commercial interests of Railtrack and existing and
potential operators of trains in a manner compatible with the foregoing.
In its consideration of paragraph (d) of this Condition D4, Railtrack shall not be
entitled to determine that its possessions of any part of the Network shall be as
contemplated by any relevant maintenance contract by reason only of the terms
and conditions of that contract. In this paragraph, "relevant maintenance
contract" is a contract which Railtrack shall have entered into, or shall intend to
enter into, with any person for the maintenance, renewal or the carrying out of
any other work on or in relation to the Network.”
It should be noted that these objectives are to some extent conflicting. The ORR has
104
made it clear that specific circumstances need to be taken into account and has left the
industry to create ‘case law’.
5.4.5 Network Rail
Network Rail’s ‘corporate goals’ (Network Rail, 2003) are to:
• “Improve safety. To reduce the number of accidents;
• Improve service performance. To enable greater punctuality and reliability of train
services;
• Increase system capability. To facilitate achievement of the SRA’s Strategic Plan
and increase passenger and freight capacity;
• Improve customer and stakeholder relationships. To increase the satisfaction of
passenger and freight rail users and other stakeholders;
• Improve financial control. To increase our financial efficiency and maximise what
we can deliver for each pound spent;
• Improve asset stewardship. To take better care of the infrastructure and deliver
greater value for money;
• Improve business performance. To make the most of our people’s skills and
effort.”
Interviews with Network Rail personnel broadly supported this set of goals, but added to
it the important role of meeting the Rail Regulator’s expectations.
The Business Plan provides more detail on train planning (which Network Rail calls
Operational Planning):
“Operational Planning is the process which translates customer requirements for
access to the network into detailed plans for the provision of safe and reliable
train paths. Delivering these requirements ensures that we are compliant with
our network licence and the cross-industry Track Access Conditions in respect
of:
1. The production of the National Rail Timetable (Licence Condition 3);
2. The timetabling process (Access Condition D); and
105
3. The Informed Traveller process (Licence Conditions 3 and 9).
Approach
The Operational Planning process must ensure at every stage that there is an
appropriate balance between the requirements of train operators to provide train
services and the need to maintain, renew and enhance the network. Also, a
proportion of capacity must remain unoccupied to enable recovery from any
disruptions to the plan.
Our goal is to implement an efficient and effective Operational Planning process,
with three key components:
1. Robust capacity planning over a 10 year horizon to ensure that plans
for provision of network capacity and plans for train services which will
consume that capacity are synchronised and are aligned with
customer and stakeholder expectations;
2. Annual access planning which produces the “permanent” timetable,
published as the National Rail Timetable (NRT), which provides a
sound basis for delivering train paths safely and reliably; and
3. Efficient daily access planning which incorporates temporary changes
into the timetable to meet short-term traffic demands and
requirements for engineering works on the network, while ensuring
that the timetable remains robust.
The final output of the process is the detailed plan which is used by our front-line
production staff and train operators to deliver the real-time operation of the
railway on each individual day.”
Interviews revealed a more detailed and extensive list of objectives:
• Meet contractual agreements - Train Operating Company/Freight Operating
Company access rights (schedule 5), Access Conditions/Network Code
(timescales/decision criteria), Regulatory / Licence requirements;
• Sufficient (low cost) Engineering Access for maintaining & renewing the network
(ROTR);
106
• Maximise Performance – to minimise Schedule 8 (penalty) payments to train
operators;
• Reduce Cost of producing a timetable;
• Risk Mitigation – ensuring that the timetable does not import safety risk into the
railway;
• Customer Satisfaction: Train Operators/Freight Operating Companies,
maintenance and renewal contractors, SRA, passengers, freight customers.
5.4.6 Franchised Passenger Train Operators
The TOCs are private sector organisations, focused on commercial objectives – profit,
growth and, ultimately, survival. At a high level these objectives are achieved by
keeping their franchises (to keep the revenue stream intact in the short term), make
profits for shareholders (by making the most of opportunities within the terms of their
franchises) and winning future franchises (to keep the profit stream going for the long
term). It is outside the scope of this thesis to investigate the extent to which these
particular motivations apply to particular train operators at particular times in their
existence. A number of TOCs have however moved from profit and growth to survival
as the key objective – and several have not managed to survive at all (e.g. Prism,
rescued by National Express Group) or have left the rail franchising market place (e.g.
Connex, losing one franchise in a re-bidding competition and having its other franchise
taken away from it due to poor financial performance (see National Audit Office, 2005).
In summary franchised passenger operators have the following objectives:
• Retain franchise;
• Improve profitability during franchise period;
• Grow revenue as a route to improving profitability;
• Manage costs down;
• Win bidding competitions for franchises.
Train Operators have not made public statements of their objectives for train planning.
The following objectives have therefore been deduced from interviews (in particular
detailed analysis of the structured interviews undertaken by Boodoo) and are focused on
how train planning processes can influence the profitability and growth potential of train
operators:
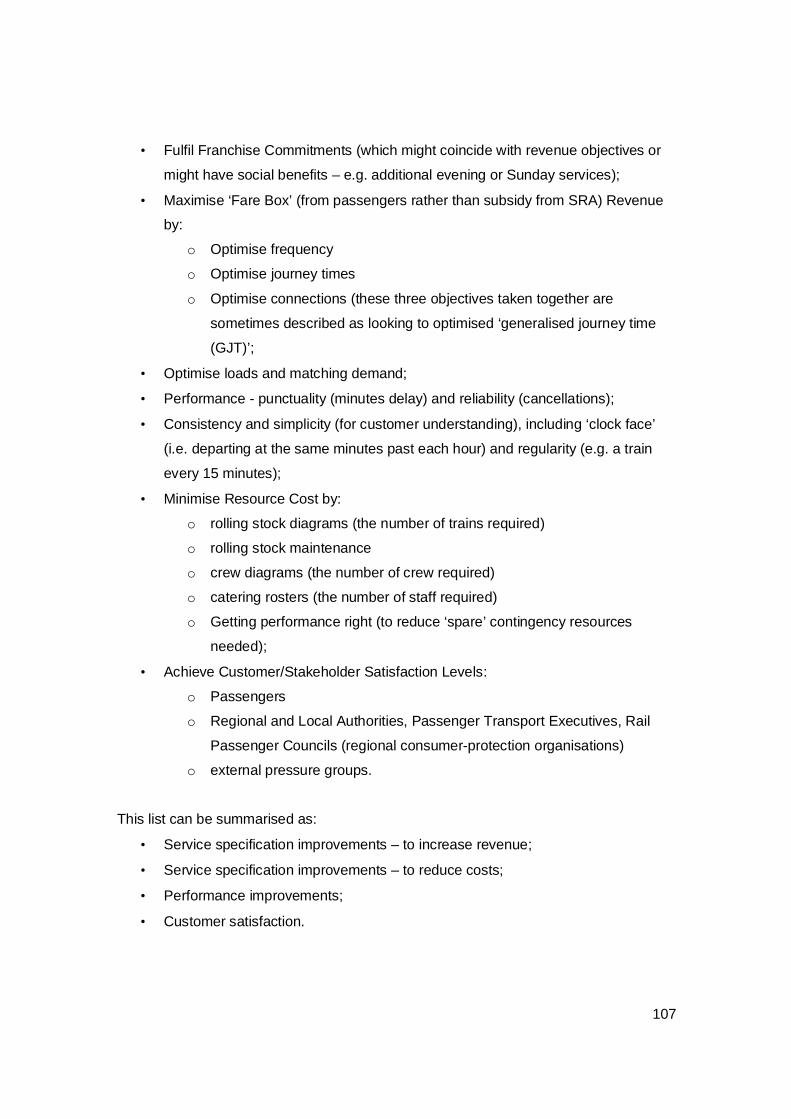
107
• Fulfil Franchise Commitments (which might coincide with revenue objectives or
might have social benefits – e.g. additional evening or Sunday services);
• Maximise ‘Fare Box’ (from passengers rather than subsidy from SRA) Revenue
by:
o Optimise frequency
o Optimise journey times
o Optimise connections (these three objectives taken together are
sometimes described as looking to optimised ‘generalised journey time
(GJT)’;
• Optimise loads and matching demand;
• Performance - punctuality (minutes delay) and reliability (cancellations);
• Consistency and simplicity (for customer understanding), including ‘clock face’
(i.e. departing at the same minutes past each hour) and regularity (e.g. a train
every 15 minutes);
• Minimise Resource Cost by:
o rolling stock diagrams (the number of trains required)
o rolling stock maintenance
o crew diagrams (the number of crew required)
o catering rosters (the number of staff required)
o Getting performance right (to reduce ‘spare’ contingency resources
needed);
• Achieve Customer/Stakeholder Satisfaction Levels:
o Passengers
o Regional and Local Authorities, Passenger Transport Executives, Rail
Passenger Councils (regional consumer-protection organisations)
o external pressure groups.
This list can be summarised as:
• Service specification improvements – to increase revenue;
• Service specification improvements – to reduce costs;
• Performance improvements;
• Customer satisfaction.

108
5.4.7 ‘Open Access’ Passenger Operators
There are a small number of ‘open access’ passenger operators (Hull Trains, Grand
Central, Wrexham Shrewsbury and Marylebone Railway, Heathrow Express and
Eurostar being the open access operators who run regular passenger services) and
whilst it might have been interesting to explore their views, no interviews have been
undertaken with them so that the author could concentrate on key issues for train
planning processes. Perhaps the most significant difference is that Open Access
operators rely on the train planning process to get paths for their services, whereas
franchised passenger operators to a very large extent have paths pre-existing in the
timetable when they take over a franchise. Of course those objectives related
specifically to franchising do not apply to open access operators.
5.4.8 Freight Operators
These operators are ‘open access’ operators with no commitments to SRA or
government other than grants for a small proportion of their services.
Discussions with representatives of these operators suggest that their objectives are:
• Retaining existing business;
• Growing revenue;
• Reducing costs.
For the timetabling process, the stated objectives were similar to those for the passenger
operators, although customer satisfaction was always considered most important (due, it
is suspected, to the small number of customers on which these operators depend):
• Customer satisfaction;
• Service specification improvements – to increase revenue;
• Service specification improvements – to reduce costs;
• Performance improvements (to give better service to customers and to reduce
costs.
109
5.5 Train Planning Objectives for Railway Management and
Train Planners
5.5.1 Priorities for Railway Management
High on any management action list will be the improvement of the efficiency of the
organisation’s operation. In railways, this can be split between the efficiency of use of
the infrastructure (the ‘network efficiency’) and the efficiency inf the use of the resources
that run on the network (‘rolling stock planning’ and ‘train crew planning’). Network
efficiency can be considered as having three main facets: capacity, reliability and cost
effective maintenance. Usually the overall capacity is fixed over the timescales under
consideration since modifications to the infrastructure take an extended period to plan
and implement. Capacity and cost effective maintenance are closely linked - it is
necessary to move all the traffic on offer and, at the same time, to enable all necessary
maintenance to be undertaken in a cost effective manner. This sets a ‘minimum’
condition on any timetabling solution. Management expect that this will be achieved
whilst also achieving increasing service reliability, giving a ‘target’ - to produce a
timetable that minimises the effect of perturbations.
Different railway managements have different objectives for rolling stock planning.
Some railways (including several of the larger European state railways) have ample
rolling stock in many areas: the requirement here is simply to match the rolling stock to
the required services. This minimum condition is more often now supplemented by a
target to use the smallest number of rolling stock units possible, especially where
expensive new trains have been or are being purchased. An alternative, and in some
ways more sophisticated, target for passenger rolling stock is to maximise the mileage
run by the fleet available, employing the logic that making more train-miles available
gives more journey opportunities and (if properly targeted) increases revenue.
Objectives for personnel are often more complex. There is typically a basic objective to
minimise staff numbers. More appropriate, however, is to look to minimise the total staff
cost, taking into account likely overtime payments and any other enhancements that
110
labour agreements dictate. Further management objectives for staff planning revolve
around flexibility (coping with changes in demand - e.g. special trains and changes in
supply - e.g. sickness) and staff/union satisfaction, e.g. meeting union agreements and
having appropriate mixes of duties to meet the aspirations of different individuals.
Railway managers indicate that they want simple solutions to these often complicated
questions. They want timetables and schedules that use their network, rolling stock and
staff efficiently, achieving the minimum level of resources consistent with achieving the
required level of reliability. They want solutions quickly and they want to minimise the
number of staff involved in the train planning process. They are prepared to spend
money on software if it can be shown to achieve an improvement in the achievement of
some or all of these objectives – but bitter experience has made them sceptical of that
benefits can be achieved quickly from new software. Finally, they want a ‘no-hassle’
solution.
Many managers can cite examples of where train planners have, in their view, frustrated
change or been unable to undertake the process in a way which gives a satisfactory
outcome: examples include the Virgin Cross Country timetable introduced and then
within a matter of weeks amended because it did not work (Ford, 2003), Stagecoach’s
actions to reduce driver numbers in the early days of its operation of South West Trains
(Haskel, 1997),with the train planners being blamed for not being able to properly assess
the number of drivers that would be needed, and, more recently, the inability of Network
Rail timetablers to assess the performance impact of new Open Access requests for
paths on the East Coast Main Line (Office of Rail Regulation, 2006).
A small number of railway managers suggest that train planners have a reputation as
trouble makers and pessimists. ‘Black box’ solutions that offer the possibility of reducing
the need for train planners are attractive to these people. These managers cite
examples of where train planners have rejected new business specifications as
unworkable, with the managers asserting that this was not based on proper assessment
but on an unwillingness to consider new ideas or laziness. There is not the space to
explore these cultural and motivational issues here, suffice to say that train planners do
not agree with this view!
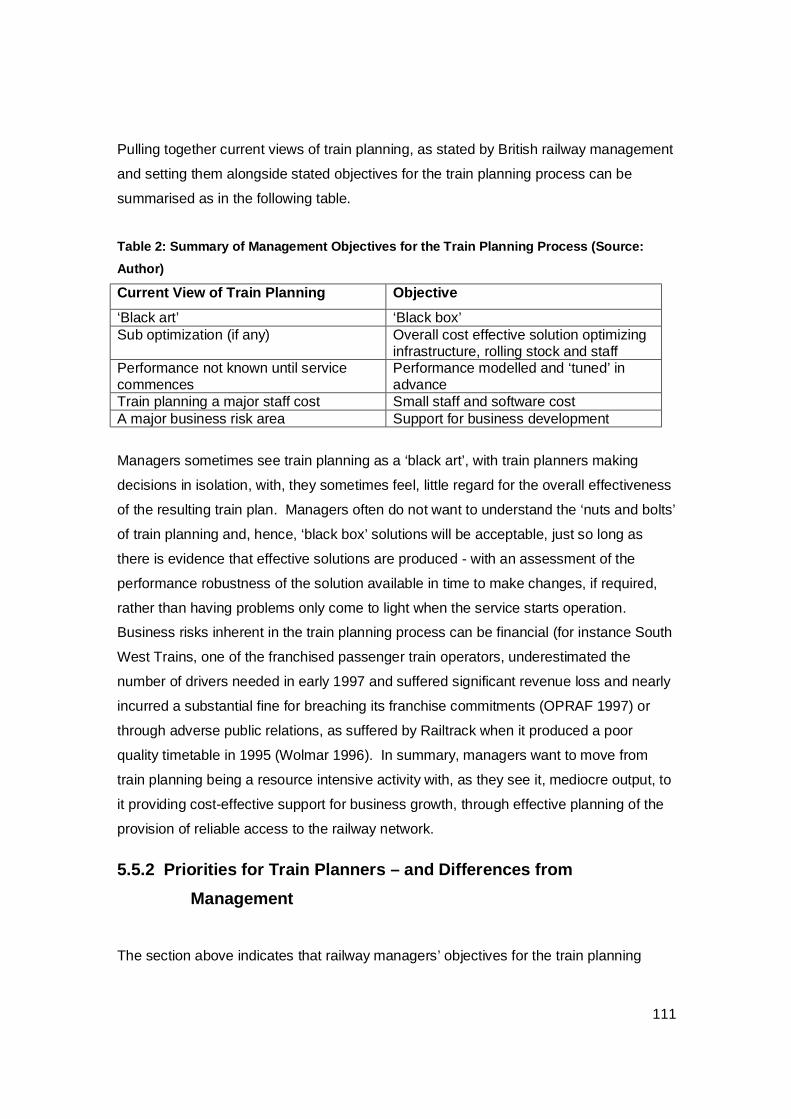
111
Pulling together current views of train planning, as stated by British railway management
and setting them alongside stated objectives for the train planning process can be
summarised as in the following table.
Table 2: Summary of Management Objectives for the Train Planning Process (Source: Author)
Current View of Train Planning Objective
‘Black art’ ‘Black box’ Sub optimization (if any) Overall cost effective solution optimizing
infrastructure, rolling stock and staff Performance not known until service commences
Performance modelled and ‘tuned’ in advance
Train planning a major staff cost Small staff and software cost A major business risk area Support for business development
Managers sometimes see train planning as a ‘black art’, with train planners making
decisions in isolation, with, they sometimes feel, little regard for the overall effectiveness
of the resulting train plan. Managers often do not want to understand the ‘nuts and bolts’
of train planning and, hence, ‘black box’ solutions will be acceptable, just so long as
there is evidence that effective solutions are produced - with an assessment of the
performance robustness of the solution available in time to make changes, if required,
rather than having problems only come to light when the service starts operation.
Business risks inherent in the train planning process can be financial (for instance South
West Trains, one of the franchised passenger train operators, underestimated the
number of drivers needed in early 1997 and suffered significant revenue loss and nearly
incurred a substantial fine for breaching its franchise commitments (OPRAF 1997) or
through adverse public relations, as suffered by Railtrack when it produced a poor
quality timetable in 1995 (Wolmar 1996). In summary, managers want to move from
train planning being a resource intensive activity with, as they see it, mediocre output, to
it providing cost-effective support for business growth, through effective planning of the
provision of reliable access to the railway network.
5.5.2 Priorities for Train Planners – and Differences from Management
The section above indicates that railway managers’ objectives for the train planning

112
process are predominantly about cost effective delivery of reliable train services. ‘Hands
on’ train planners, perhaps unsurprisingly, indicate that they have a different agenda. As
part of a Quality Improvement initiative undertaken within what was then British Rail,
aimed at improving train planning processes, the following set of priorities was
developed by the train planning function, ranked in order of perceived importance:
1. “Achieve all timetable production timescales 2. Achieve shortest production timescale 3. Adopt best practice 4. Robust to perturbation 5. Meet customer expectations 6. Error free 7. Achieve service reliability standards 8. Economically efficient in the management of resources required to
prepare, deliver and operate the plan.” (Willis, 1992)
This list was used as a prompt in later interviews and it was found that priorities had not
changed over the intervening period.
That production timescales (1) dominate the thinking of train planners should come as
no surprise. Timetable commencement dates (the date that new timetables start from)
are agreed in Europe years in advance on an international basis and there is little scope
for delaying this date, even on a local basis, due to the knock on implications for other
railway operators and other parts of the planning process. Railway budgets and
planning cycles are all focused on making changes at these pre-determined dates.
Achieving a shorter production timescale (2) is also an on-going objective - aimed at
being more customer focused by enabling railway marketing organisations to make
service changes at shorter notice, currently it is not atypical for marketing specifications
to be required by the train planners at least a year before the new timetable commences.
Best practice (3) was and is about getting train planning offices to improve the
effectiveness of the train planning process. There are many different processes
employed to undertake basically the same function. As an example, there are different
practices regarding display of timetable data: some train planners requiring ‘line graph’
representation, others preferring numeric tabulation.
Robustness (4) gives the first match between management’s and train planners’ stated
113
objectives, with managers being aware of the adverse impact on revenue and costs of
persistent poor performance and train planners having the added incentive of wanting to
avoid criticism from their operations colleagues and the potential need for an urgent
‘rework’ of the train plan.
Meeting customer needs (5) is another objective that the evidence indicates that
management and train planners share.
The train planner looks for an error free (6) ‘perfect solution’, in the sense that there
must be no conflicts, errors or omissions remaining before starting to attempt to improve
the efficiency of the solution: offers to help produce a more effective solution will only be
of interest if it can be shown that a ‘perfect solution’ is obtained as well - so simplifying
assumptions or approximations are unlikely to be acceptable. Having said this, under
more detailed questioning train planners will reveal that they habitually ‘break the
planning rules’ themselves to achieve workable solutions (e.g. by reducing the turnround
time at terminus stations below the norm).
Delivery of service reliability (7) again matches with management’s stated objectives.
Perhaps the biggest mismatch is that ‘economic efficiency’ is only ranked 8th by train
planners, whereas management see this of prime importance.
Of as much significance as the ranking of these objectives is data provided by train
planners regarding their level of achievement of these objectives. Train planners noted
that it is not always possible to achieve production dates; on other occasions they only
achieve (1) and (4) of the priorities outlined above, and the latter just to the extent that
they succeed in avoiding negative feedback from the day to day operational staff.
Documented examples were given of where these basic priorities have not been met,
c.f. Wolmar 1996: the ‘Great Timetabling Disaster’, where train planners ran out of time,
with a timetable being published before the timetable planning processes had been
completed, with the inevitable consequence that many alterations had to be published
subsequently in ‘supplements’. Timetablers explain their inability to reliably hit
production dates as being caused by uncertainty and unpredictability regarding the size
of the task and by late changes imposed by management. They note that the task size
114
varies dependent upon the number of conflicting train service requirements to be
processed (i.e. where two or more train services would be on the same piece of track at
the same time) and the difficulty of finding a solution that adequately meets the needs of
the businesses asking for those services, it is sometimes not possible to predict in
advance whether there is in fact a solution that will satisfy everyone.
It is a point for discussion that of the objectives and needs of railway management and
train planners do not at first appear to be compatible. However, resolution of the
immediate issues for the planners of production timescales and quality of the process
(best practice and error elimination) leads to the list of needs converging.
5.5.3 Trade-offs between conflicting objectives
Railway managers and timetablers were asked how trade-offs should be made between
objectives. It quickly became apparent that, for the most part, they do not explicitly
make trade-offs. As a result there are few generalised rules currently applied. Certainly
quantification, of the sort needed to set objective weightings in a timetable generation
tool, is not available.
When asked how decisions could be improved, bearing in mind this lack of generalised
rules, one respondent highlighted ‘optioneering’ as the pragmatic approach to take, that
is, generating a number of different potential timetables with emphasis on different
objectives and then appraising each of these against a ‘basket’ of criteria, including
public interest benefit, ‘fare box’ revenue, investment and operating cost, value for
taxpayer’s money, robustness.
In discussion, it became apparent that this is currently the only effective method of
making trade offs. In time, rules for making trade-offs and explicit objective weightings,
must emerge.
115
5.5.4 Achievement of Objectives
5.5.4.1 Adherence to production timescales
Willis highlighted achievement of all production timescales as the top priority.
Discussion with train planners across the industry indicates that this is still not being
consistently met, with bids from train operators and offers from Network Rail not being
achieved by the required date.
5.5.4.2 Shortened production timescales
At the strategic planning stage, detailed timetable development and performance
modelling projects, which look at the likely performance of a revised infrastructure layout
and revised timetables, produce timetables at a very detailed level, often with timings
planned down to when trains would pass individual signals, for the whole route being
examined. This process can take many months. As business growth makes the need
for greater capacity more pressing, timescales for these assessments need to be
reduced.
Within tactical planning, the long term planning process typically starts 12 to 15 months
in advance of the commencement date for the timetable, i.e. before the previous
timetable has even commenced. There is, unsurprisingly, considerable pressure to
reduce these timescales, to permit assessment of the effectiveness of a timetable in
practice before planning the next one and to be more responsive to changing customer
needs.
A further issue for ‘mixed’ traffic railways, that is, railways that carry both passengers
and freight, is that the nature of logistics and freight distribution is such that the tactical
planning takes place much closer to the train running, with timescales measured in
weeks, days or even hours, rather than the months ahead that passenger trains need to
be planned. This creates an uncomfortable mismatch between planning horizons, with
the widely held view in passenger service-dominated railways that freight suffers some
disadvantage, having to accept ‘what is left’ after the passenger services have been
planned. This still needs to be addressed, for instance by providing ‘standard hour’ slots

116
that the freight operators can use without having to book them many months in advance.
5.5.4.3 Robust to Perturbation
‘Robustness’, by which is meant the extent to which a timetable can accommodate minor
perturbations due to, for instance, train or infrastructure failures without substantial
‘knock on’ delays to other services, is still usually only tested when the timetable
becomes operational. This means that there is a risk that there will be substantial
delays, should the timetable or resource plan not be capable of coping with the
inevitable problems that occur, as happened when the Virgin Cross Country increased
frequency timetable was introduced. This can have serious financial implications for
Network Rail due to the performance regime in place with the train operators, whereby
poor performance due to defects in the timetable results in penalty payments to the train
operators.
5.5.4.4 Meeting Customer Expectations
The time required to produce a workable solution means that a wide variety of timetable
options cannot be considered as part of the tactical planning process. Typically, in
Britain, no radically different options are considered. In the time available, the task is
simply to produce a timetable that is operationally feasible and meets most of the
commercial aspirations of the train operators. This prevents sensible discussion about
the merits of different timetables and can lead to timetables being implemented that are
short of what could have been achieved in terms of meeting train operators’ aspirations.
This can mean that business is turned away because the planners cannot find enough
paths, with revenue implications for the infrastructure operator as well as the train
operator. Similar problems apply to resource planning.
Train planning, then, is in practice predominantly sequential, with the feedback loops
shown on Figure 10 little used. As discussed, achieving an optimum solution requires
account to be taken of the interaction of the different stages of the business process. In
theory, this could be achieved by seeking to optimise across the whole process using
some sophisticated operations research technique. However, currently, optimisation
across the whole process is unachievable due to the complexity of the problem. The

117
practical alternative is feedback from one part of the process to others, sometimes called
‘iteration’. This has already been discussed in Chapter 3. For instance if a particular
timetable results in inefficient use of train crew then it will be necessary for ‘feedback’ to
be given from the train crew scheduler to the timetable planner, with sufficient time in the
process to allow the timetable planner to take account of this feedback and develop an
improved timetable.
5.5.4.5 A cost-effective process
As already discussed, train planning is a costly function within Network Rail and train
operators. No interviewees considered that the process is as cost-effective as it could
be, blaming the structure of the privatised railway and the lack of good quality software
support. In addition, the difficulty of managing train planning effectively is evident.
5.6 Analysis
5.6.1 Purpose of this analysis
Having reported the objectives of railway organisations, railway managers and train
planners, these objectives are categorised across several of the dimensions suggested
in the literature.
5.6.2 Categorisation of objectives (1) – growth, cost or performance related
Many of the objectives across all of the organisations, both at a high level and at the
timetabling level, can by put into the following categories:
1. Growth focused;
2. Cost management focused;
3. Performance.
118
Growth focused objectives
Government is looking to rail to support growth of the economy, including reducing road
congestion by achieving modal shift and reducing the environmental impact of transport,
again through modal shift. The SRA had objectives set by government to grow
passenger kilometres travelled by 50% and freight tonne kilometres by 80% by 2010. In
support of these overall objectives the SRA had timetabling objectives to make best
possible use of existing capacity and to facilitate the provision of extra train services.
Network Rail was and is committed to increasing passenger and freight capacity and
exploiting that capacity effectively. Train operators and FOCs want to grow their
businesses through running more trains and attracting more revenue.
Cost management objectives
Government needs to ensure that it gets the best benefits it can from a limited budget
and this fed into SRA’s objectives to ensure best ‘value for money’ and to use private
funding where possible. Network Rail is committed to improving financial control,
improving asset stewardship and improving business performance. Its objectives for
timetabling only explicitly mention cost in the context of reducing the cost of the
timetabling process, rather than reducing the cost of operating the timetables produced.
However the commitment to customer satisfaction requires consideration of the costs to
the train operators and FOCs of operating the agreed timetable. Train operators and
FOCs of course want to reduce the costs of their business, subject to meeting their
overall profitability objectives and franchise or contractual commitments. At the
timetabling level, their objective is always to ‘tune’ the timetable to save resources
(rolling stock and crew) wherever possible.
Performance objectives
All organisations within the railway industry are concerned about perceived poor levels
of train service punctuality, as is the government and MPs, see for instance exchange
between Duncan Smith and Blair (Hansard, 2003). Poor punctuality affects revenue,
discouraging travel by rail and also affects cost adversely as ‘spare’ resources are
required for contingencies. Hence, all organisations expect timetabling processes to
119
deliver ‘robust’ timetables, i.e. timetables that work in practice, with delays caused by
minor failures being accommodated without significant knock-on delays.
5.6.3 Categorisation of objectives (2) – time horizon
Byars et al. (1996) sets out the proposition that objectives can be assessed on a
strategic vs. operational dimension. The railway industry timetabling processes are in
practice split along this dimension, being divided into ‘strategic access planning’ (2-10
years out), tactical or ‘annual’ planning (6 months to 2 years out) and ‘short term’
planning (less than 6 months out). This section is used to set out each organisation’s
overall and timetabling objectives against these horizons.
Figure 14 (on the following page) sets out over-riding objectives by organisation by time
horizon.
The government, the SRA and Network Rail have the primary interests in the strategic
timeframe. The government’s 10 year plan seeks growth and the SRA was charged with
delivering this. Network Rail has a long term interest in the infrastructure which it owns
and manages. The ORR’s role extends to a small extent beyond the 5 year time horizon
as it has the responsibility for ensuring that Network Rail’s stewardship of the network is
appropriate for the long term.
In the 5 year time horizon, freight operators have mostly contracts of up to 5 years
duration (although some extend to 10 years) and franchised passenger operators hold
their franchises for predominantly between 5 and 10 years (although Chiltern Railways
and Merseyrail have longer franchises). The primary objective of Network Rail over this
time horizon of relevance for this thesis is to increase system capacity, which, to the
extent that it involves physical work to the infrastructure, typically takes 2 to 5 years to
plan and bring to fruition. The government is interested in this timeframe particularly for
the railways need for funding. This is considered in ‘spending reviews’ lead by the
Treasury.
ORR also undertakes funding reviews over this timeframe – specifically focused on

120
Network Rail’s funding needs. This is the period over which SRA attempted to meet its
longer term objectives through franchise letting and freight grants.
Figure 14: Objectives by Organisation (Source: Author)
10 year plan - growth
50-80-PIXC
Performance improvement
Spending reviews -costs
Growth through franchises/grants
Capacity utilisation
Performance improvement
Funding of the Network Rail
Regulation of Network Rail, ‘Fair and efficient consumption of rail capacity’, Competition
Operation of the timetabling process
Increase system capacityAsset stewardship Performance improvement
Delivery of access agreements + other contractual obligations
Revenue increase and cost reduction
Performance improvement
Meeting franchise commitments
Revenue increase and cost reduction
Government
SRA
ORR
Network Rail
TOCs
FOCs
Strategic Operational(10 years +) 5 years 2 years Real Time
In the short term, all organisations are interested in performance improvement. Network
Rail, overseen by ORR, focuses on delivery of contracts. It should be noted that
Network Rail focuses on contractual compliance at this stage, whereas train operators
and FOCs are looking for timetables that give them the best possible bottom line – this
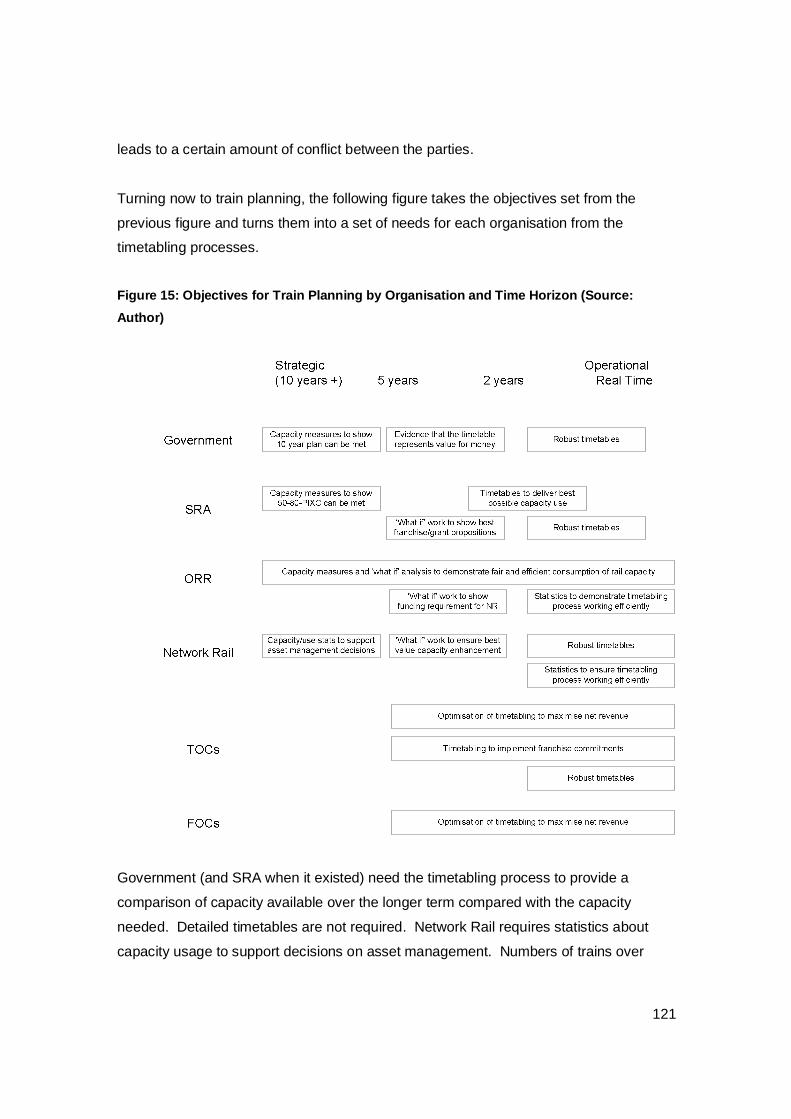
121
leads to a certain amount of conflict between the parties.
Turning now to train planning, the following figure takes the objectives set from the
previous figure and turns them into a set of needs for each organisation from the
timetabling processes.
Figure 15: Objectives for Train Planning by Organisation and Time Horizon (Source: Author)
Government (and SRA when it existed) need the timetabling process to provide a
comparison of capacity available over the longer term compared with the capacity
needed. Detailed timetables are not required. Network Rail requires statistics about
capacity usage to support decisions on asset management. Numbers of trains over
122
sections of line are needed to ensure that the track and signalling configuration is
appropriate; total tonnages and vehicle movements are needed to assess wear and tear
on the infrastructure to assist in the prediction of maintenance and renewal activity
levels.
In the medium term government needs to see that the timetable that is to apply will
represent the best value for money. A range of different timetable options are needed to
convince the government that it is achieving value for money through the franchises it
lets and the grants it gives to freight operators. Train operators and FOCs want the
timetabling process to deliver the best possible timetable – that is the best possible
timetable, from their point of view, giving them the best possible profit. The train
operators also need timetabling processes to deliver their medium term franchise
commitments.
In the short term, all organisations want the timetabling process to deliver robust
timetables. Network Rail needs statistics to demonstrate to the industry and especially
ORR that it is managing the process ‘fairly and efficiently’.
5.6.4 Categorisation of Objectives (3) – Business Objectives, Physical Constraints and Robustness
5.6.4.1 Business Objectives
When looking at the timetabling task, it is possible to divide up objectives in a further
way – splitting out ‘constraints’ from objectives, where constraints in this context are
physical limitations imposed on the timetable, such as the number of available platforms
or the minimum time between trains. This is particularly important as a precursor for the
analysis of timetable generation software which comes in chapter 7, as is being able to
measure the extent to which a particular timetable meets the objectives set.
As already discussed, some of these objectives are of a strategic nature, revolving
around the achievement of the overall objectives of the organisation, others are of a
more operational nature, focusing on practical issues, such as trade-offs between
journey time and stopping patterns for specific services.

123
At the highest level there are what could be described as ‘public interest’ objectives,
focused around the guidance given to the Strategic Rail Authority by government about
what it expects the railway industry to achieve – growth of passenger and freight traffic
and value for taxpayers’ money. Next come the commercial objectives of the train
operators and Network Rail – primarily to ensure profitability, but also to ensure
continued existence through, in the case of Train Operators, the retention and extension
of their franchises, by meeting the franchise commitments made to the DfT. In the case
of Train Operators and Network Rail, this includes delivery of the licence obligations
made to the Office of Railway Regulation.
In terms of measuring the effectiveness of a given timetable in meeting these strategic
objectives, the industry ‘standard’ system used to assess the revenue capability of a
timetable is (MOIRA), although the system used to divide revenue between Train
Operators (ORCATS) is also considered to be of great importance by Train Operators.
From a commercial point of view there was seen to be little benefit in developing a
timetable with good revenue earning potential if all that revenue then goes to a different
operator. There is no standard mechanism for assessing the cost implications of a
timetable (different organisations use spreadsheet or database solutions). Neither is
there a standard approach to assessing the implications of different levels of punctuality
delivered by different timetables, although there is now some degree of agreement on
the methodology for assessing the level of punctuality that might be achieved by a
timetable. This is discussed in chapter 8.
Railway managers and timetablers had difficulty turning these high level objectives into
operational objectives and were generally unable to prioritise between these operational
objectives, although some linkages were described by a number of respondents.
Journey time was seen as a key driver of revenue. Regular interval services and ‘clock
face’ times were considered to be beneficial, particularly for shorter distance services.
Appropriate use of stopping patterns was also seen as important. Perhaps the most
significant finding here was that respondents had a number of trade-offs that were in
their minds when developing a specification for timetables:
124
1. Carrying more people v. running less trains;
2. Providing the best possible service v. minimise cost;
3. Customer focused service v. resource utilisation;
4. Regular interval v. train service defined to meet demand;
5. Individual organisation objectives v. overall industry/’UK plc’ benefit;
6. Competition v. co-operation;
7. Passenger need v. freight need.
5.6.4.2 Physical constraints
Train planners were, unsurprisingly, in agreement that it is essential that timetables are
developed that are physically possible to operate and that are contractually ‘compliant’
(many respondents used this term). Because these are largely limitations on the
timetable (that is to say they MUST be met) rather than business objectives (that should
be met to the maximum extent possible), these can be regarded as physical constraints
on the timetable. This is not to say that they are absolutes in the medium or long term –
contracts can be renegotiated and the railway infrastructure and rolling stock changed so
that different constrains apply.
Timetables typically are built to comply with a set of planning rules, which, for Britain’s
rail industry, are laid out in Network Rail’s documents the Rules of the Route and the
Rules of the Plan – the former stating when engineering work is to take place and hence
trains must not run and the latter setting out the base data to be used in developing
timetables, for instance, the running times between stations and the required separation
(‘headway’) between trains.
Timetables must be operable with the resources available to the Train Operators – in
particular the number of train sets and train crew that they expect to have available.
They must match with the contractual commitments made by Railtrack/Network Rail to
the Train Operators, by the franchised Train Operators to DfT and by Freight Operators
to their customers.
Safety was only mentioned in passing by railway managers and train planners in the
context of timetabling. It was noted that timetable planners have only a limited
125
responsibility for safety in specific circumstances, e.g. not planning trains where they
could not go, for instance because they are too heavy or too long, and not developing
timetables that due to the interaction of trains might increase the risk of ‘Signals Passed
At Danger’ incidents (drivers passing signals at red).
5.6.4.3 Perception of Robustness
Robustness was well defined by one train planner as the ‘ability of a timetable to recover
effectively and quickly from perturbation’. To the customer this means a train service
that is punctual and does not suffer from cancellations. To the Train Operators
robustness is in fact part of the commercial specification – because a more punctual
service generates more revenue. Robustness also matters because resource costs are
driven in part by the need to allow resources to recover from poor performance. At
present better robustness is also seen by respondents as an end in itself – government
has set the industry a specific objective to improve punctuality; Train Operators and
Network Rail are heavily incentivised through ‘performance regimes’ in their contracts to
improve robustness.
What was very interesting – and problematic from the perspective of the desire of the
author to find ways to improve the quality of timetables produced was that respondents
had great difficulty in setting out the characteristics of a robust timetable. One
correspondent stated that robustness was ‘an area not often considered in timetabling’!
The following issues were raised, all of which are physical constraints:
1. Lack of platform space;
2. Bottlenecks at major stations;
3. Too many flat junctions;
4. Doors, passenger boarding and alighting times.
It can be noted that a trade-off is at work here: robustness vs. resource utilisation, be
that infrastructure capacity or rolling stock and train crew. Greater robustness can be
achieved by using resources less intensively, but this of course increases costs and may
also reduce revenue – particularly if less trains are run.
5.6.4.4 Robustness – from first principles

126
The paucity of feedback on robustness objectives has led to it being necessary to
consider from first principles what the characteristics of a robust timetable would be.
What quickly becomes apparent is that the complexity of the physical network makes
this very difficult to describe. For instance, on a simple ‘single track’ railway, maximising
the separation between trains should minimise the chance of one train causing a delay
on another one. However, as soon as the network becomes more complex, say with a
junction with trains crossing in front of each other, the best performance may come from
‘flighting’ trains on one route (that is to say, running them close together) so that they
clear the junction as rapidly as possible.
This problem warrants further research. In the meantime a certain amount of ‘trial and
error’ is inevitable, with simulation tools (see chapter 8) being used to compare the
performance of different timetables and to highlight issues that require ‘reworking’ by
train planners.
5.7 Delivering organisational objectives
This thesis is focused on train planning rather than railway privatisation and so this is not
the place to discuss whether privatisation has ‘worked’ or not – a number of papers and
books (e.g. Harris and Godward, 1997; Freeman and Shaw Eds., 2000) have covered
this. Instead, the author looks at the issues that have been uncovered through this
research which work against the achievement of organisational objectives.
As has been alluded to in earlier sections, over-arching objectives are not the same for
different organisations in the rail industry today. At its crudest level, there is the conflict
between the government’s desire to get the best value for money from the rail industry
(where value for money means getting the maximum benefits for the funds it has
available) whereas the deliverers of the services to the customers of the railway (be they
passenger or freight) are focused on profit and, in the case of franchised passenger
operators, short term profit. In the middle there is now Network Rail, without the
shareholder and stock market priorities of Railtrack and focusing more on value for
money (see Network Rail’s Business Planning Criteria, Network Rail, 2006) and
appearing to many to be an ‘arm of government’ (‘to all intends and purposes in the
public sector’, TSSA, 2004; ‘the curious case of Network Rail’s status, Jupe, 2007). In
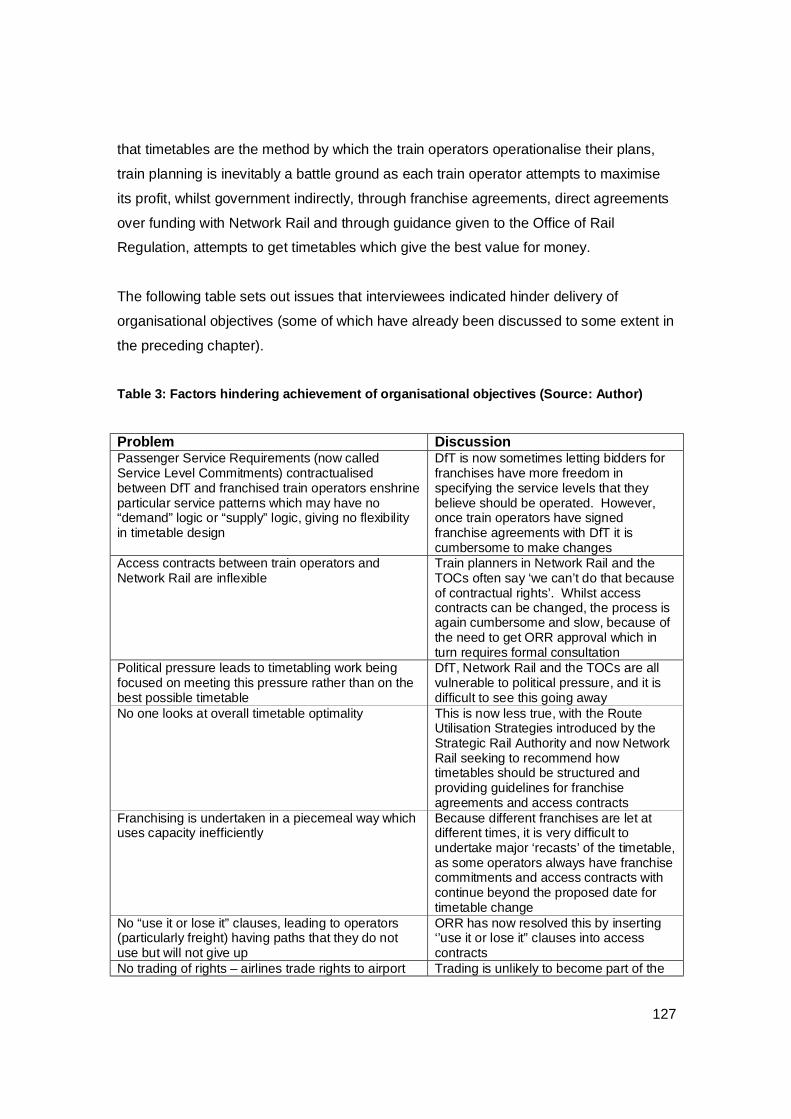
127
that timetables are the method by which the train operators operationalise their plans,
train planning is inevitably a battle ground as each train operator attempts to maximise
its profit, whilst government indirectly, through franchise agreements, direct agreements
over funding with Network Rail and through guidance given to the Office of Rail
Regulation, attempts to get timetables which give the best value for money.
The following table sets out issues that interviewees indicated hinder delivery of
organisational objectives (some of which have already been discussed to some extent in
the preceding chapter).
Table 3: Factors hindering achievement of organisational objectives (Source: Author)
Problem Discussion Passenger Service Requirements (now called Service Level Commitments) contractualised between DfT and franchised train operators enshrine particular service patterns which may have no “demand” logic or “supply” logic, giving no flexibility in timetable design
DfT is now sometimes letting bidders for franchises have more freedom in specifying the service levels that they believe should be operated. However, once train operators have signed franchise agreements with DfT it is cumbersome to make changes
Access contracts between train operators and Network Rail are inflexible
Train planners in Network Rail and the TOCs often say ‘we can’t do that because of contractual rights’. Whilst access contracts can be changed, the process is again cumbersome and slow, because of the need to get ORR approval which in turn requires formal consultation
Political pressure leads to timetabling work being focused on meeting this pressure rather than on the best possible timetable
DfT, Network Rail and the TOCs are all vulnerable to political pressure, and it is difficult to see this going away
No one looks at overall timetable optimality This is now less true, with the Route Utilisation Strategies introduced by the Strategic Rail Authority and now Network Rail seeking to recommend how timetables should be structured and providing guidelines for franchise agreements and access contracts
Franchising is undertaken in a piecemeal way which uses capacity inefficiently
Because different franchises are let at different times, it is very difficult to undertake major ‘recasts’ of the timetable, as some operators always have franchise commitments and access contracts with continue beyond the proposed date for timetable change
No “use it or lose it” clauses, leading to operators (particularly freight) having paths that they do not use but will not give up
ORR has now resolved this by inserting ‘’use it or lose it” clauses into access contracts
No trading of rights – airlines trade rights to airport Trading is unlikely to become part of the
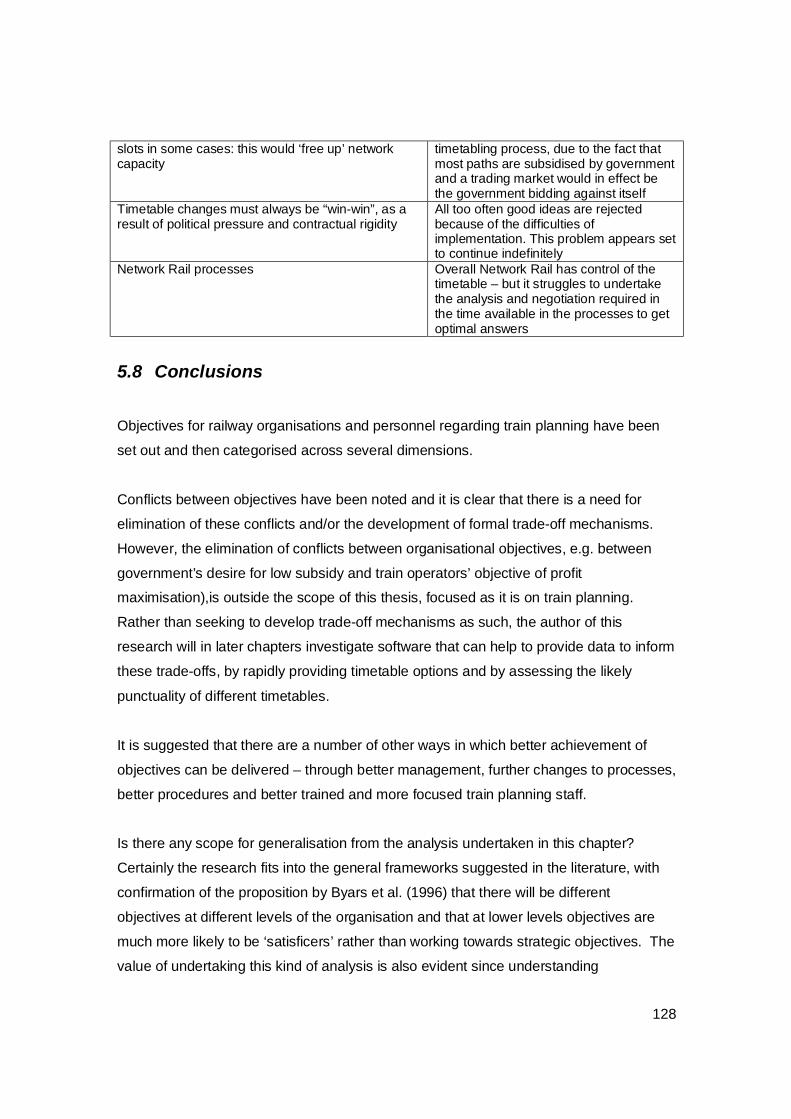
128
slots in some cases: this would ‘free up’ network capacity
timetabling process, due to the fact that most paths are subsidised by government and a trading market would in effect be the government bidding against itself
Timetable changes must always be “win-win”, as a result of political pressure and contractual rigidity
All too often good ideas are rejected because of the difficulties of implementation. This problem appears set to continue indefinitely
Network Rail processes Overall Network Rail has control of the timetable – but it struggles to undertake the analysis and negotiation required in the time available in the processes to get optimal answers
5.8 Conclusions
Objectives for railway organisations and personnel regarding train planning have been
set out and then categorised across several dimensions.
Conflicts between objectives have been noted and it is clear that there is a need for
elimination of these conflicts and/or the development of formal trade-off mechanisms.
However, the elimination of conflicts between organisational objectives, e.g. between
government’s desire for low subsidy and train operators’ objective of profit
maximisation),is outside the scope of this thesis, focused as it is on train planning.
Rather than seeking to develop trade-off mechanisms as such, the author of this
research will in later chapters investigate software that can help to provide data to inform
these trade-offs, by rapidly providing timetable options and by assessing the likely
punctuality of different timetables.
It is suggested that there are a number of other ways in which better achievement of
objectives can be delivered – through better management, further changes to processes,
better procedures and better trained and more focused train planning staff.
Is there any scope for generalisation from the analysis undertaken in this chapter?
Certainly the research fits into the general frameworks suggested in the literature, with
confirmation of the proposition by Byars et al. (1996) that there will be different
objectives at different levels of the organisation and that at lower levels objectives are
much more likely to be ‘satisficers’ rather than working towards strategic objectives. The
value of undertaking this kind of analysis is also evident since understanding
129
mismatches between objectives is the starting point for making changes.
One recurring theme mentioned by railway personnel is the need for better software to
support the processes and the people in delivering the objectives set. It is perhaps
surprising that train planning tasks are performed largely without significant computer
support and indeed from time to time researchers developing optimisation algorithms or
packages for use in solving train planning problems note this (c.f. Wren, 1996),
recognising that ”very few [models] are actually implemented and used in railway
operations” (Cordeau et al., 1998). This is an area that warrants research and hence the
remainder of this thesis is devoted to understanding the software currently in use by train
planners and to highlight were research and development could increase the ability of
train planners to deliver effective timetables efficiently.

130
6 THE ROLE OF SOFTWARE IN SUPPORTING TRAIN
PLANNING
6.1 Introduction
This chapter provides a summary of the software currently in use by train planners in
Britain and then sets out the views of train planners as to where more help is needed. A
comparative analysis is then undertaken of the software support available in the closely
aligned (in process terms) area of scheduling of mass transit operations.
In addition to providing the groundwork for the analysis of specific software in the two
chapters that follow, this chapter is intended to provide an insight into areas where
software research and development would be of most benefit to train planners.
Some of this chapter (including much of the section on train planners’ software
requirements) has been developed from the author’s paper ‘Prospects for computer
aided railway scheduling: perspectives from users and parallels from mass transit’
(Watson, 2000).
6.2 Method
The review of train planning software has been built up from a literature review together
with the unstructured interviews with the users of some of the packages. These
interviews, undertaken in 1999, were also used to construct the section which sets out
the views of train planners regarding the improvements to software that they would like
to see to support them.
The comparative analysis with mass transit was undertaken through a literature review
together with written questionnaires sent to the leading providers of software for mass
transit scheduling. These questionnaires were developed with the support of ICL Ltd. in
2000, as ICL was at the time investigating the potential for these packages for a railway
131
application in Scandinavia.
6.3 Literature
In line with the aims and objectives of this research, the literature reviewed focuses on
application rather than theory or development.
Earl (1989) suggests that software can be applied in four strategic ways:
1. To gain a competitive advantage;
2. To improve productivity and performance;
3. To facilitate new ways of managing and organising;
4. To develop new businesses.
Each of these objectives can be related to train planning:
1. Competitive advantage might be achieved by bidders for franchises – producing
train plans that better match the requirements of the DfT, matching qualitative
requirements more closely than other bidders or through producing timetables
that will generate more revenue or train plans that will cost less;
2. Improved productivity might be either of train planners or the resources they plan.
Improved performance could again refer to the outputs of the train planners or
the punctuality of the timetables produced;
3. An example of a new organisational structure that software was intended to
support has been described in chapter 4 above. More generally, improved
software could enable organisations to be restructured with fewer train planners
employed;
4. Better software might enable consultancies to enter markets that have been
traditionally the domain of the train operators themselves.
Peppard (1993) suggests that there are three types of software that can be applied in a
business context:
1. Data processing and transmission;
2. Decision support, where data is presented to a decision maker: scenarios are
modelled but no decision is made or proffered by the software;
3. Expert systems.
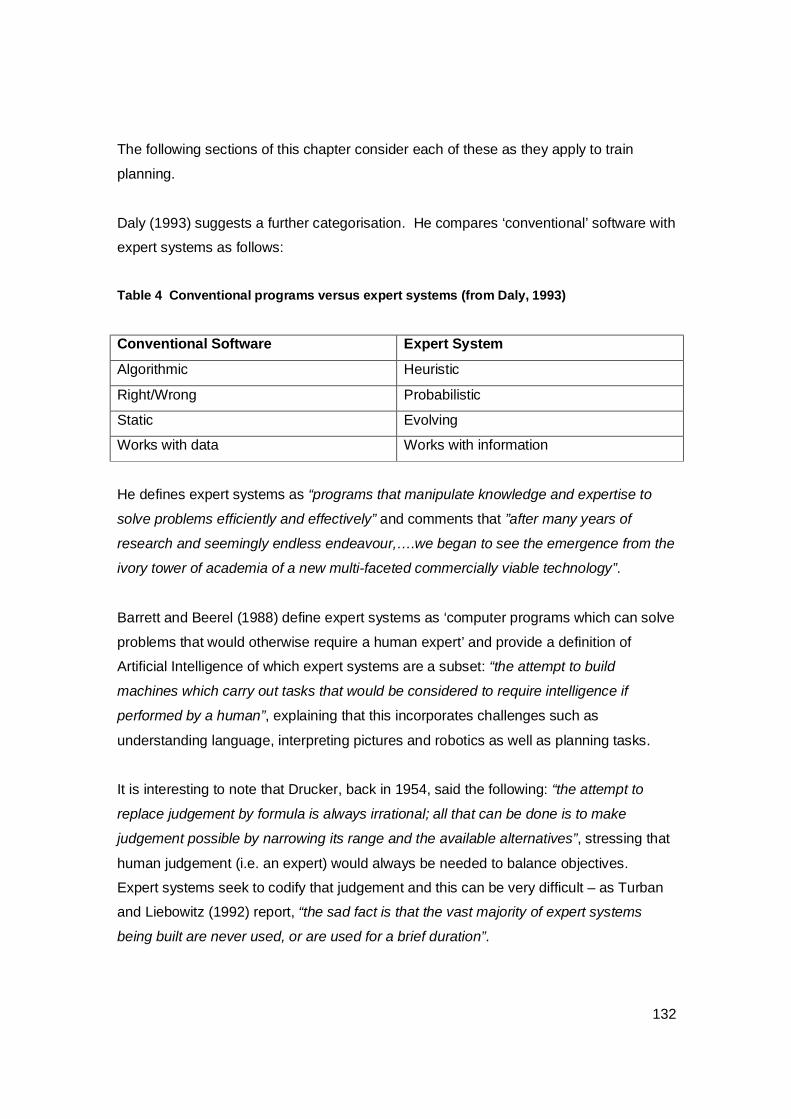
132
The following sections of this chapter consider each of these as they apply to train
planning.
Daly (1993) suggests a further categorisation. He compares ‘conventional’ software with
expert systems as follows:
Table 4 Conventional programs versus expert systems (from Daly, 1993)
Conventional Software Expert System
Algorithmic Heuristic
Right/Wrong Probabilistic
Static Evolving
Works with data Works with information
He defines expert systems as “programs that manipulate knowledge and expertise to
solve problems efficiently and effectively” and comments that ”after many years of
research and seemingly endless endeavour,….we began to see the emergence from the
ivory tower of academia of a new multi-faceted commercially viable technology”.
Barrett and Beerel (1988) define expert systems as ‘computer programs which can solve
problems that would otherwise require a human expert’ and provide a definition of
Artificial Intelligence of which expert systems are a subset: “the attempt to build
machines which carry out tasks that would be considered to require intelligence if
performed by a human”, explaining that this incorporates challenges such as
understanding language, interpreting pictures and robotics as well as planning tasks.
It is interesting to note that Drucker, back in 1954, said the following: “the attempt to
replace judgement by formula is always irrational; all that can be done is to make
judgement possible by narrowing its range and the available alternatives”, stressing that
human judgement (i.e. an expert) would always be needed to balance objectives.
Expert systems seek to codify that judgement and this can be very difficult – as Turban
and Liebowitz (1992) report, “the sad fact is that the vast majority of expert systems
being built are never used, or are used for a brief duration”.
133
A variety of reasons for this failure are cited by Watson and Buede (1987). “Failure to
involve the decision-maker in the experimental and iterative nature of the analysis;
failure to appreciate the organizational and personal context of decision making; failure
to explore ends as well as means”. Barrett and Beerel (1988) are more ‘upbeat’ noting
that “many experts seem to feel that they operate according to ‘intuition’ or ‘gut feel’, and
that this know-how which they have acquired can never be trapped in a computer. This
is not the case. Their know-how may be complex, and it may take effort to define, but if
an expert can describe what he does then at least some fraction of his expertise can be
recorded in an expert system”.
Clear (1998) asserts that developers must not only understand how the ‘expert’
processes information but must also have a working knowledge of the wider subject area
to define appropriately the series of ‘if...then’ rules.
The two chapters that follow consider software which to a greater or lesser extent can be
described as expert systems.
6.4 A Brief Review of Current Train Planning Software
6.4.1 ‘Data management’ packages
In the terminology of the literature review, these packages perform data manipulation
and transmission functions.
Train planning processes in Network Rail and the train operators are predominantly
supported by software tools that enable them to store and manipulate the core input data
to the train planning process (this includes infrastructure data and performance
characteristics about the trains that will run on that infrastructure, the ‘base data’
discussed in Chapter 3, together with the train schedules that are created from that base
data). Sophisticated graphical interfaces are used to enable train planners to move lines
on the graphs to ‘flex’ train times to attempt to achieve the commercial specification
required and eliminate any ‘conflicts’ between trains by ensuring that all trains obey the
‘headway’ and ‘junction margin’ rules for every section of track. The ‘headway’ is the
time that the signalling system requires between trains travelling along the same track in
134
the same direction, while the ‘junction margin’ is the time that the signalling system
requires between trains that cross one another’s paths. These packages do not at
present support the train planner by providing automatic ‘conflict detection’, defined as
situations where trains breach the minimum headways or junction margins laid out in the
Rules of the Plan. Development of these packages continues, to better cope with the
process of making short term variations to the timetable (e.g. to accommodate
engineering work), to improve the effectiveness and speed of the graphical interface and
to provide the planner with more information, by such facilities as ‘version comparison’
(listing where changes have been made from a previous edition of the timetable) and
conflict detection (listing or showing graphically where the paths proposed infringe the
rules for headways or junction margins).
The packages also provide support for rolling stock diagramming and train crew
diagramming, again without automatic identification of potential non-compliances with
planning rules. Again, developments are in hand by the suppliers to improve the
functionality in this area.
In Britain’s ‘main line’ railway industry, Trainplan and Voyagerplan (previously PROTIM)
are the commercially provided packages used for long term planning and short term
planning. For reviews of these packages see respectively Hammerton (1996) and
Brooke (1996) and the suppliers’ websites (as at 2007, Funkwerk Enterprise
Communications GmbH and Atos Origin respectively) for more up to date information.
Trainplan is used predominantly by Network Rail, with a national database as a client
server application accessed from the 4 train planning offices; Voyagerplan is used by
train operators and typically is a ‘single site’ client server application. London
Underground uses its own software, although during 2007 DeltaRail were commissioned
to replace this with a new system.
DeltaRail’s Capacity Management Suite (CMS) contains a timetable editor (TTED), a
national infrastructure data base (NID) and a rolling stock diagramming ‘bolt on’ and is
used by some train operator owning groups and consultancies for forward planning
work. This will be the foundation of London Underground’s new system.
The VIRIATO system is another package that sees limited use in Britain. It has some

135
capability to detect and resolve conflicts, although this is intended to support the
development of a regular interval ‘Swiss style’ timetable rather than the more complex
irregular services that are typically adopted, to some extent at least, in Britain (Moreira
and Oliveira, 2000).
6.4.2 Timetable Simulation Packages
Simulation packages represent an example of decision support software. They contain
some element of ‘expert systems’, in that some decisions are made by the software itself
(e.g. replicating the decisions made by a signaller). Ultimately though, the software does
not seek to produce an optimal solution but simply provides information on the
characteristics of different solutions for consideration by the train planner.
In the train planning arena, simulation packages are used to take timetables developed
using data management packages and to assess them for robustness (i.e. the amount of
delay that a particular timetable will typically incur). These are used by Network Rail,
consultancies providing support to Network Rail and the Department for Transport.
These packages take a timetable and overlay a number of possible perturbations (for
instance, points failures or train breakdowns) and assess how much overall delay might
be caused. Timetables where there is little ‘knock on’ delay caused by a failure are
robust; timetables where a lot of incremental delay occurs need further work, or,
perhaps, indicate that the infrastructure is being used rather too close to the capacity
limits for a robust timetable to be produced. Typically, simulation packages require very
detailed infrastructure maps, down to individual turnouts and signals and, hence, are
complex and time consuming to set up and run. By contrast the data management tools
described in the previous section use a less detailed – and therefore less accurate –
model of the railway. Simulation packages are frequently used as ‘strategic planning’
tools to validate infrastructure improvements for robustness and are also used, for the
same purpose, where major restructuring of a timetable is intended. Typically they are
run for a single station or just a few miles of infrastructure. Time constraints mean that
these packages are rarely used as part of the tactical planning process or, until recently,
to examine ‘whole route’ effects during strategic planning.
The use of simulation packages is discussed in detail in Chapter 8.
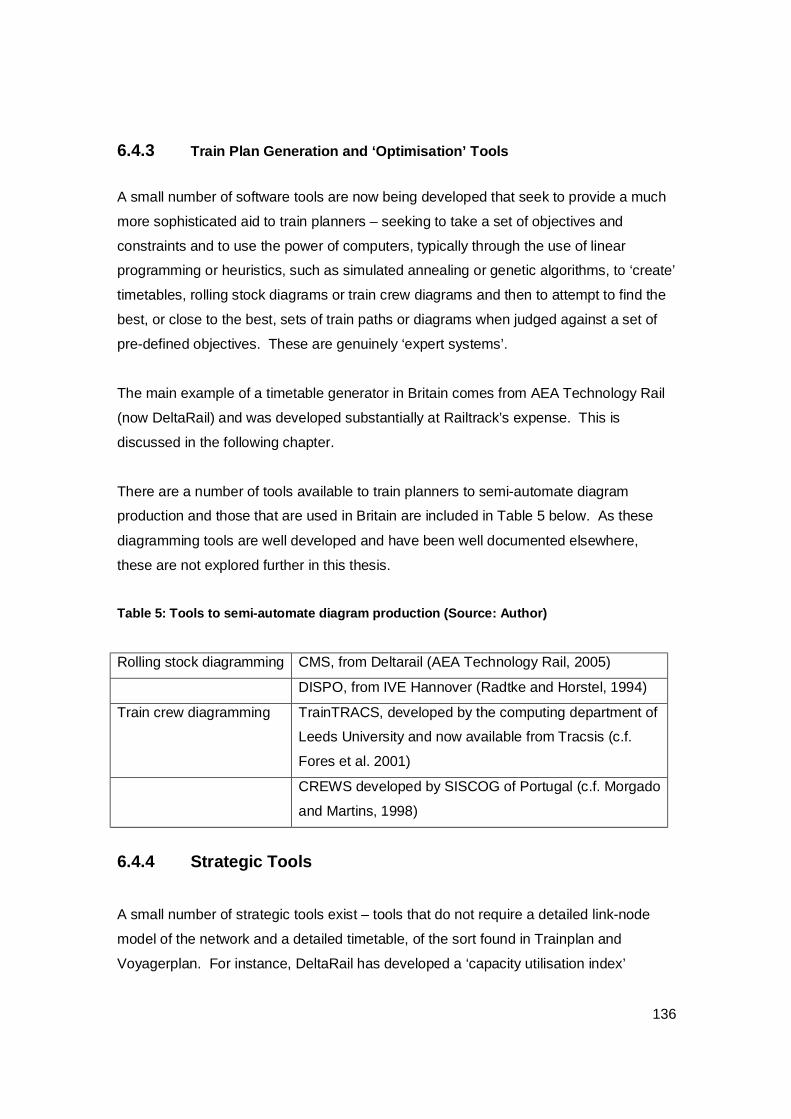
136
6.4.3 Train Plan Generation and ‘Optimisation’ Tools
A small number of software tools are now being developed that seek to provide a much
more sophisticated aid to train planners – seeking to take a set of objectives and
constraints and to use the power of computers, typically through the use of linear
programming or heuristics, such as simulated annealing or genetic algorithms, to ‘create’
timetables, rolling stock diagrams or train crew diagrams and then to attempt to find the
best, or close to the best, sets of train paths or diagrams when judged against a set of
pre-defined objectives. These are genuinely ‘expert systems’.
The main example of a timetable generator in Britain comes from AEA Technology Rail
(now DeltaRail) and was developed substantially at Railtrack’s expense. This is
discussed in the following chapter.
There are a number of tools available to train planners to semi-automate diagram
production and those that are used in Britain are included in Table 5 below. As these
diagramming tools are well developed and have been well documented elsewhere,
these are not explored further in this thesis.
Table 5: Tools to semi-automate diagram production (Source: Author)
Rolling stock diagramming CMS, from Deltarail (AEA Technology Rail, 2005)
DISPO, from IVE Hannover (Radtke and Horstel, 1994)
Train crew diagramming TrainTRACS, developed by the computing department of
Leeds University and now available from Tracsis (c.f.
Fores et al. 2001)
CREWS developed by SISCOG of Portugal (c.f. Morgado
and Martins, 1998)
6.4.4 Strategic Tools
A small number of strategic tools exist – tools that do not require a detailed link-node
model of the network and a detailed timetable, of the sort found in Trainplan and
Voyagerplan. For instance, DeltaRail has developed a ‘capacity utilisation index’
137
(Gibson et al., 2002; Lampkin, 2002) which attempts to assess how close to ‘full’
sections of the railway network are. These tools inevitably make considerable
simplifications, e.g. the CUI has difficulty in providing an appropriate value in complex
areas, as it has no understanding of ‘nodes’ (junctions and station), which are often the
factors that limit capacity.
Researchers abroad (c.f. papers in Hansen, 2007, Goverde and Odijk, 2002, Lucchini,
Curchod and Rivier, 2001) are putting considerable effort into attempting to develop high
level measures appropriate for forward planning, and so it may be the case in the future
that tools of this type come to be used with success in Britain.
These strategic tools have been regarded as ‘out of scope’ because they are usually
regarded as being outside the boundaries of train planning.
6.5 The Views of Train Planners on the Need for Improved
Software
6.5.1 Interview Results
Typically (but not necessarily obviously) train planners do not ask for support in solving
conflicting requirements and optimising resource utilisation (that could in theory be
solved by a ‘generator’ or ‘optimiser’) but rather ask for help with the elimination or
reduction of the repetitive data manipulation tasks that delay them from tackling the
‘interesting’ conflict resolution and optimisation work.
Thus the avoidance of data re-keying between systems is a primary requirement,
followed by support for data formatting and preparation (e.g. producing the printed
timetable at the end of the process) and then better visualisation of train schedules,
preferably with ‘interactive graphical edit’ to enable the planner to move around lines that
represent train services on screen and see the effect on other services immediately.
Next in priority for help comes ‘error detection’ and ‘conflict detection’, i.e. showing
where intervention is necessary.
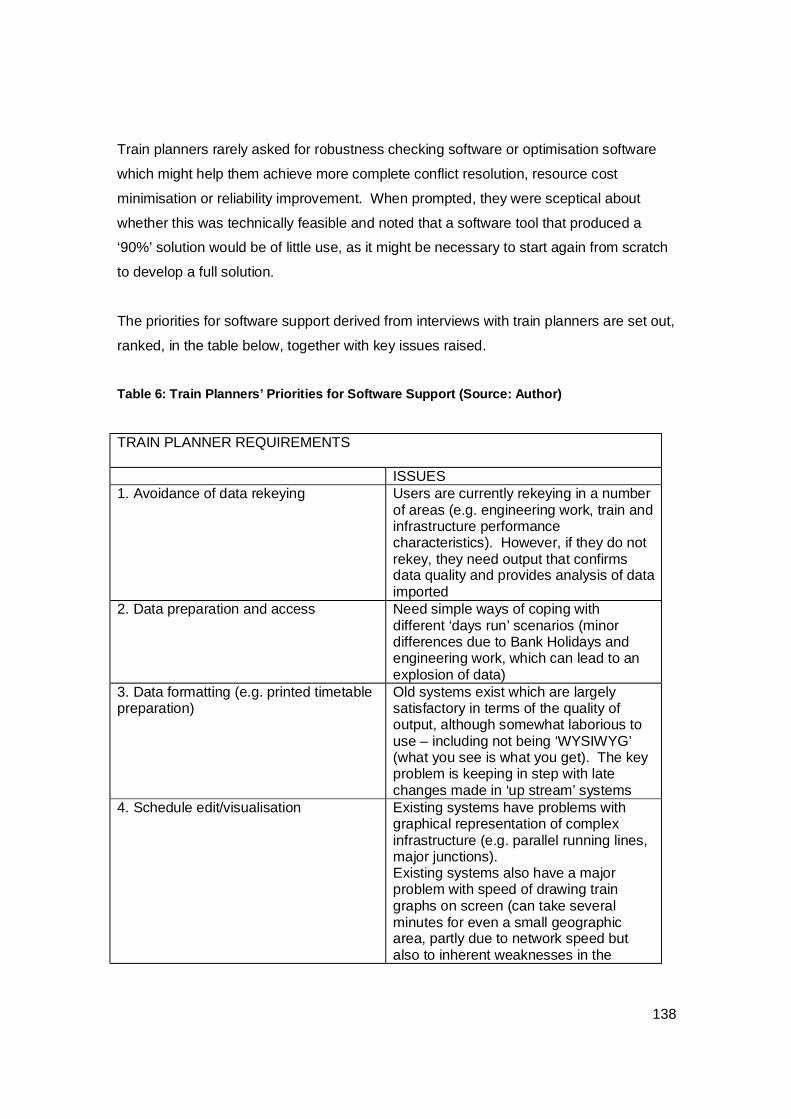
138
Train planners rarely asked for robustness checking software or optimisation software
which might help them achieve more complete conflict resolution, resource cost
minimisation or reliability improvement. When prompted, they were sceptical about
whether this was technically feasible and noted that a software tool that produced a
‘90%’ solution would be of little use, as it might be necessary to start again from scratch
to develop a full solution.
The priorities for software support derived from interviews with train planners are set out,
ranked, in the table below, together with key issues raised.
Table 6: Train Planners’ Priorities for Software Support (Source: Author)
TRAIN PLANNER REQUIREMENTS ISSUES 1. Avoidance of data rekeying Users are currently rekeying in a number
of areas (e.g. engineering work, train and infrastructure performance characteristics). However, if they do not rekey, they need output that confirms data quality and provides analysis of data imported
2. Data preparation and access Need simple ways of coping with different ‘days run’ scenarios (minor differences due to Bank Holidays and engineering work, which can lead to an explosion of data)
3. Data formatting (e.g. printed timetable preparation)
Old systems exist which are largely satisfactory in terms of the quality of output, although somewhat laborious to use – including not being ‘WYSIWYG’ (what you see is what you get). The key problem is keeping in step with late changes made in ‘up stream’ systems
4. Schedule edit/visualisation Existing systems have problems with graphical representation of complex infrastructure (e.g. parallel running lines, major junctions). Existing systems also have a major problem with speed of drawing train graphs on screen (can take several minutes for even a small geographic area, partly due to network speed but also to inherent weaknesses in the
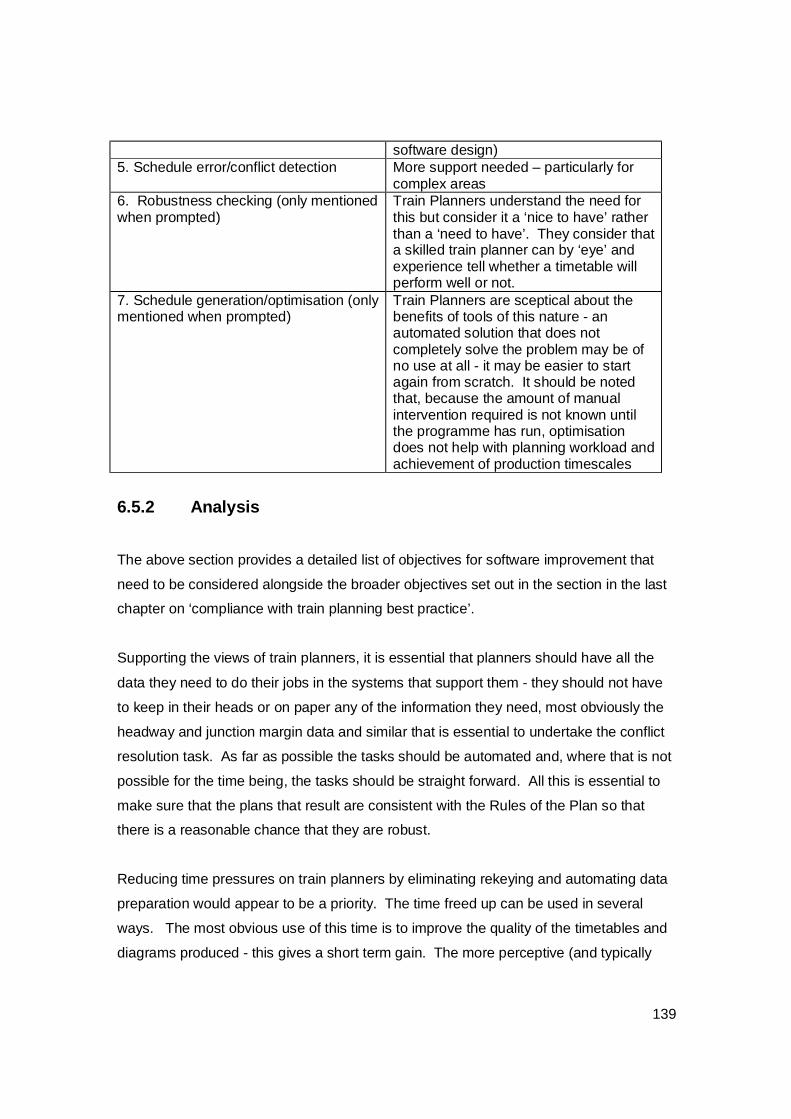
139
software design) 5. Schedule error/conflict detection More support needed – particularly for
complex areas 6. Robustness checking (only mentioned when prompted)
Train Planners understand the need for this but consider it a ‘nice to have’ rather than a ‘need to have’. They consider that a skilled train planner can by ‘eye’ and experience tell whether a timetable will perform well or not.
7. Schedule generation/optimisation (only mentioned when prompted)
Train Planners are sceptical about the benefits of tools of this nature - an automated solution that does not completely solve the problem may be of no use at all - it may be easier to start again from scratch. It should be noted that, because the amount of manual intervention required is not known until the programme has run, optimisation does not help with planning workload and achievement of production timescales
6.5.2 Analysis
The above section provides a detailed list of objectives for software improvement that
need to be considered alongside the broader objectives set out in the section in the last
chapter on ‘compliance with train planning best practice’.
Supporting the views of train planners, it is essential that planners should have all the
data they need to do their jobs in the systems that support them - they should not have
to keep in their heads or on paper any of the information they need, most obviously the
headway and junction margin data and similar that is essential to undertake the conflict
resolution task. As far as possible the tasks should be automated and, where that is not
possible for the time being, the tasks should be straight forward. All this is essential to
make sure that the plans that result are consistent with the Rules of the Plan so that
there is a reasonable chance that they are robust.
Reducing time pressures on train planners by eliminating rekeying and automating data
preparation would appear to be a priority. The time freed up can be used in several
ways. The most obvious use of this time is to improve the quality of the timetables and
diagrams produced - this gives a short term gain. The more perceptive (and typically
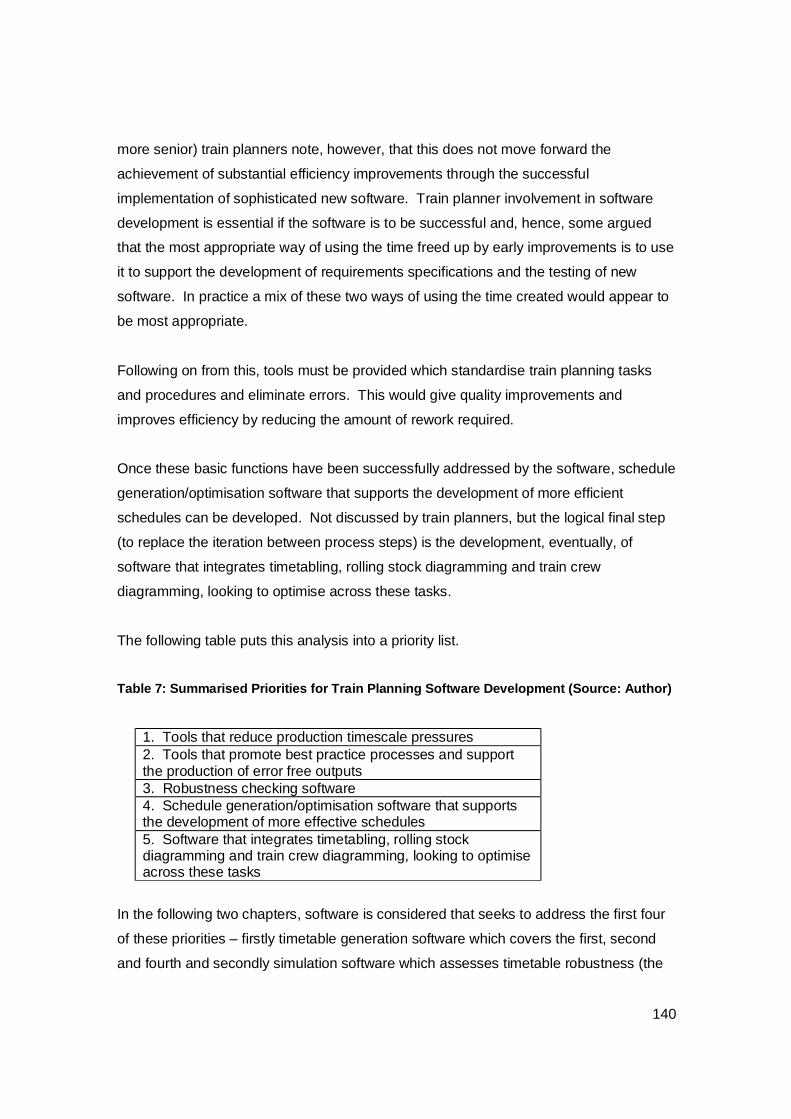
140
more senior) train planners note, however, that this does not move forward the
achievement of substantial efficiency improvements through the successful
implementation of sophisticated new software. Train planner involvement in software
development is essential if the software is to be successful and, hence, some argued
that the most appropriate way of using the time freed up by early improvements is to use
it to support the development of requirements specifications and the testing of new
software. In practice a mix of these two ways of using the time created would appear to
be most appropriate.
Following on from this, tools must be provided which standardise train planning tasks
and procedures and eliminate errors. This would give quality improvements and
improves efficiency by reducing the amount of rework required.
Once these basic functions have been successfully addressed by the software, schedule
generation/optimisation software that supports the development of more efficient
schedules can be developed. Not discussed by train planners, but the logical final step
(to replace the iteration between process steps) is the development, eventually, of
software that integrates timetabling, rolling stock diagramming and train crew
diagramming, looking to optimise across these tasks.
The following table puts this analysis into a priority list.
Table 7: Summarised Priorities for Train Planning Software Development (Source: Author)
1. Tools that reduce production timescale pressures 2. Tools that promote best practice processes and support the production of error free outputs 3. Robustness checking software 4. Schedule generation/optimisation software that supports the development of more effective schedules 5. Software that integrates timetabling, rolling stock diagramming and train crew diagramming, looking to optimise across these tasks
In the following two chapters, software is considered that seeks to address the first four
of these priorities – firstly timetable generation software which covers the first, second
and fourth and secondly simulation software which assesses timetable robustness (the
141
third priority).
6.6 Comparative Analysis – Mass Transit Use of Scheduling
Software
6.6.1 The Relevance of Mass Transit Experiences
The term Mass Transit is generally used to encompass urban public transport
operations, be they road (‘bus) or rail (tram, train or underground/subway). These are
substantial undertakings with often many hundreds or even thousands of vehicles, many
more staff and a complex network of connecting services.
To what extent are mass transit operations comparable with railways and therefore of
relevance to this thesis? Similarities include the need to schedule vehicles and people,
often based at a number of depots and, for the rail mode, to manage infrastructure
capacity issues. The basic rules for scheduling vehicles and people are inevitably
virtually identical, although there are typically more, and more complex, rules that apply
to railway operations and, hence, findings should be transferrable to ‘main line’ railways.
More obvious differences include the absence of freight traffic from mass transit
operations and the greater distances and often greater network complexity of ‘main line’
railway operations.
6.6.2 Mass Transit User Needs
The proceedings of the Computer Aided Transit Scheduling conferences, more recently
titled Computer-Aided Scheduling of Public Transport (Daduna and Wren, 1990,
Rousseau, 1992, Daduna et al., 1995, Wilson, 1999, Voss and Daduna, 2001) provide
rich coverage of the state of development of software to support mass transit scheduling.
Hoffstadt (1990, at the 1988 conference) considered management and planning staff
objectives. He found that management wants to reduce subsidies, reduce operating
costs or run more services for a given cost whilst planning staff want help with handling
time-consuming routine work to give time to process short term changes more
142
effectively.
Elms (1990), describing the experiences of London Buses, noted that scheduling
expertise is a key driver in controlling staff costs and observed that larger benefits can
be derived from tackling the schedule optimisation problems than data transfer and
management - because improvements in scheduling have greater ‘leverage’, attacking
the much larger operating staff cost rather than the relatively small scheduling team.
However, he conceded that addressing the support functions first may be ‘quicker and
cheaper’ and he indicated that, when addressed, substantial staff savings can be made.
Reporting on the successful implementation of scheduling software at SEMTA
(Southeastern Michigan Transportation Authority) Campbell (1990) set out some
features that the software needs to have, including speed of processing, so that the
scheduler does not have to wait for background tasks to complete, and a high quality
graphical interface. He notes that schedulers have good reasons for tending to use
large pieces of paper for manual scheduling.
Wallace (1995) set out what drove London Underground to invest in computer
scheduling. The driver for software development here was very different to the previous
reviews: automated signalling systems needed train service data to feed them; this data
in turn needed to be error and conflict free. Hence error and conflict detection software
was in place before schedule edit and generation programmes.
A common thread through these papers is that the speed of processing and efficiency of
the resulting schedules are key drivers in the introduction of scheduling software.
Another common thread is that basic ‘support functions’ are best encompassed first
(Elms 1990) with automation of scheduling functions coming later.
This matches well the priorities of train planners as set out in the last section.
6.6.3 Mass Transit and ‘Main Line’ Train Planning Software Compared
The close parallels between mass transit and railways would lead one to expect that
143
scheduling software would develop in parallel. The extent to which this is true is now
considered.
Daduna and Pinto Paxao (1995) noted that, for mass transit scheduling, initial effort (in
the 1960s) focused on data processing, with schedule generation and optimisation not
gaining wide acceptance due to the processing limits of the computers of the time and
the limited effectiveness of the algorithms. They also noted that a three stage process
needs to be supported (preparation, automatic scheduling and interactive alteration,
graphic and alpha-numeric). Hoffstadt (1990) predicted that major areas for software
development would be (and indeed were) in the provision of user-friendly interfaces,
data management systems and computer networks.
Today, mass transit scheduling software such as HASTUS (Giro, 2007) and Trapeze
(Trapeze, 2007) provides considerable support for mass transit schedulers, including
automated schedule generation and optimisation. Development is now extending into
‘real time’ scheduling. This compares with railway scheduling, where optimisation tools
are only just beginning to be developed and much software development effort is still
being spent on improving more basic data manipulation and edit functions. It is clear
that mass transit scheduling has become far more automated than railway scheduling
(c.f. Borndorfer et al., 1998).
Cordeau et al. (1998) suggest that solutions currently offered for rail have tended to lack
realism. Wren and Rousseau (1995) assert that the complicated rules that are so much
more prevalent in railway scheduling problems have a profound effect and note that, for
many specific railway problems, modification to the basic algorithm is needed to produce
a satisfactory solution (see also Ferriera, 1997). This is particularly true in the area of
timetabling, where rail networks are very significantly more complex than mass transit
networks. Wren also notes that changing rules are a particular problem where
algorithms have, of necessity, been adapted to particular circumstances.
Cordeau et al. also suggest that there has been a lack of urgency within railways to
improve efficiency and hence spend money on scheduling software.
A significant feature of the railway software development scene is that it is very
144
fragmented, with most railways having their own bespoke software. This can be
contrasted with the more successful mass transit scheduling packages, which have a
very wide international customer base, with the opportunity to share specification,
development and testing costs.
Overall it is apparent that railway scheduling software development is some years
behind mass transit scheduling software. There are a variety of reasons for this,
including the complexity of the problem, the commitment of the railway industry to use
advanced algorithms and the software supply industry structure.
6.7 Conclusions
It is clear that there is a considerable need for improved software to support train
planning processes. Even basic data management tasks are not fully automated, whilst
more sophisticated tools which could generate solutions and potentially optimise them
too are considered a ‘pipe dream’.
Whilst it would have been interesting and valuable to explore all of the areas of potential
software development set out in earlier sections it has been necessary to be selective for
reasons of time.
The investigation of how to enhance the basic data management software to better
support the needs of train planners has not been pursued because this does not require
substantial research – it requires detailed specification, software coding and
implementation. At the other end of the requirements list, the development of process-
wide optimisation tools that integrate timetabling, rolling stock diagramming and train
crew diagramming, looking to optimise across these tasks, is dependent on, firstly, being
able to construct software that reliably produces software for the individual process
steps. As tools to do this do not currently exist, there is no adequate base on which to
develop these tools at present.
This leaves simulation and timetable generation and optimisation as two key areas
where research could help hasten their deployment and hence these areas are explored
in the following chapters.

145
7 USE OF HEURISTICS IN TIMETABLE GENERATION AND OPTIMISATION
7.1 Introduction
This chapter has as its focus the use of expert systems and, in particular, heuristics in
timetable generation and optimisation.
This is not an Operations Research thesis and, hence, discussion of the principles of
heuristics and their development is restricted to a high level description of the nature of
the timetabling problem from an operations research prospective and a literature review
of research work in the area of heuristics as applied to timetabling. This is provided as
background to the discussion, from a business perspective, of timetable generation and
optimisation.
Following sections on research method and literature, the bulk of this chapter is
concentrated on analysing the only heuristic-based tool currently available in Britain, the
Planning Timetable Generator, and analysing the extent to which it is ‘fit for purpose’, in
the sense that it usefully supports train planners in meeting the objectives they are set
and where improvements need to be made. In particular, it is necessary to consider the
extent to which the software offers:
• A worthwhile reduction in timetable development timescales;
• Facilitation of the assessment of a wide range of timetables;
• Facilitation of the assessment of the feasibility of a range of different commercial
specifications over a variety of different possible future infrastructures.
Much of this chapter has been peer reviewed prior to presentation at conferences
(Watson et al., 2000; Watson, 2003; Watson, 2006).

146
7.2 Methodology
Two primary research methods have been used to provide material for this chapter.
Firstly, analytical reviews (in effect semi-structured interviews) have been undertaken
with the developers of the Planning Timetable Generator (PTG) and train planners
attempting to use the tool. These were focused on issues that have arisen in attempting
to get satisfactory results.
Secondly, participant observation and experiments have been undertaken through
‘hands on’ use of the software, thanks to support from Railtrack (now Network Rail) and
AEA Technology Rail (now DeltaRail). This included the provision of a researcher for a
year to gain additional ‘hands on’ experience of PTG.
A literature review follows, to provide background to the primary research.
7.3 Literature Review
7.3.1 Heuristics: Principles and Appropriateness for Train Planning Problems
Several primers in the use of heuristics are available, including: Burke and Kendall (eds.)
(2005), Michalewicz & Fogel (2000) and Reeves (1993). Taken together, these books
provide a good grounding in how to use heuristics and how to choose which heuristic to
use to address a particular problem. Gilroy and Robertson (2001) provide an
introduction to the use of heuristics in timetabling. The remainder of this section draws
heavily on this paper.
The development of train plans is in operations research terms a complex ‘search
problem’. There are many variables, broadly split between those that make up the
business specification (sometimes called objectives) and those that relate to the
feasibility of the timetable (sometimes called constraints). Robustness is also an

147
important issue (this is both an objective – good punctuality – and a constraint – there is
a minimum acceptable level of punctuality). Potentially millions of different combinations
of train schedules need to be created and compared, to assess which is the best in
terms of meeting the objectives, whilst not breaching any of the constraints. To use the
jargon of this research field, to find a solution the planner or computer has to examine
the problem’s ‘search space’.
Creating a timetable comes from a class of mathematical problems known as ‘NP-Hard’
because the search space can be very large as it expands as the number of trains is
increased but, more significantly, as the size of the model in terms of geographical
coverage and complexity increases. When considered by train planners the size of the
search space is often reduced very substantially by only considering small changes to
an existing timetable. When ‘recasts’ (major timetable changes) are considered
necessary, simplifying assumptions are typically and often sub-consciously made by the
train planner and a large range of potential solutions will simply be ignored. Although
computing power continues to increase year by year, the vast number of options that
exist means that it is not possible for a software tool to consider all the possibilities and
so the search for good solutions has to be ‘directed’ to some extent. In the case of
software this direction needs to be explicitly written into the tool, whereas the train
planner tends to use experience and intuition to decide on which timetable structures to
explore.
The literature suggests that heuristic based techniques are particularly appropriate for
this type of problem. Heuristics are methods of ‘trial and error’ that attempt to
progressively improve solutions to move towards an optimum. Heuristics do not
‘optimise’ in the absolute sense, as there is no guarantee that they will find the best
possible solution. The quality of the solution depends on the quality of the heuristic and
the number of attempts made to find the best solution, which in turn is usually a function
of the amount of computing power used. It is the huge leap in computing power over the
last decade, linked to the development of heuristics, that has made solving ‘real live’
timetabling problems using computers possible.
The method for using a heuristic approach to timetabling is to create a timetable and
then assess it using a set of ‘costs’ or ‘penalties’ which ‘score’ the timetable in terms of

148
its achievement of constraints and objectives. Having scored one timetable a further
timetable or timetables are generated, using a set of rules for how these timetable(s) are
to be devised, which may be to make major or minor changes to a timetable which has
already been created or to go ‘back to the drawing board’ and create another timetable
from scratch. Comparing the scores for these different timetables then provides
guidance on where in the ‘search space’ the tool should (or should not) look next. This
process continues until a pre-defined milestone is reached – which can be, for instance,
a number of iterations or a particular ‘score’.
7.3.2 Published Operations Research Work in the Area of Timetabling
Research work has been under way for some years to develop and implement software
that can provide much greater support and, gradually, should enable better schedules
(both in terms of robustness and efficient use of resources) to be produced in less time.
Bussieck et al. (1997), Caprara et al. (1997), Cordeau et al. (1998) and Ferreira (1997)
provide useful summaries of these developments up to the late 1990s, covering
timetable planning, crew and rolling stock scheduling, freight car routing, yard models,
car management (all focused on a freight-dominated North American/Australian-style
freight railway operation). More recent work has been presented at the on-going series
of Computer-Aided Scheduling of Public Transport conferences (2000, 2003, 2006) and
seminars of the International Association of Rail Operations Research (2005 and 2007).
Work focused on generating timetables was limited until the last few years, and, as
Carey (1994) highlighted (and this has not changed materially since), what there was
tended to focus on single track railways (c.f. Mees, 1995; Brannlund et al., 1998;
Higgins et al., 1996; and Salim and Cai, 1997), appropriate for North America and
Australia, but of very limited relevance for typical European railways or complex Mass
Transit networks, with short headways, trains every few minutes and diverging routes or
connections to be maintained.
Of relevance is work looking to construct timetables so as to achieve an overall
customer benefit, such as minimising passenger waiting time (c.f. Daduna & Voss,
1995), or a combination of this and operating cost (c.f. Chang et al., 2000; Nachtigall and
149
Voget, 1997). Whilst this is focused on the passenger, it does not fit very well with the
developing European railway industry structure, where railway infrastructure providers
need to focus on the requirements of their customers, the train operators, more than the
ultimate customer, the passenger or the freight shipper.
Carey worked for some years on the generation of timetables for complex European
railway networks. In papers in 1994, 1995, 2000, 2003 and 2007, he describes and
extends the discussion on algorithms to generate timetables, highlighting along the way
the particular problem of station infrastructure complexity and considering whether this
should be treated as a separate computing task. Comparable work has also been
undertaken in the Netherlands. Kroon et al. (1997) and Odijk (1996) providing early
papers setting out work to develop algorithms for generating railway timetables; this has
culminated in the development and implementation of the ‘DONS’ software package for
Railned, the Netherlands state-owned railway infrastructure provider (Hooghiemstra et
al., 1999).
More recently work on timetable generation has continued to emerge from Dutch
universities, but focused typically on generating a ‘standard hour’ timetable (Peeters and
Kroon, 2001; Liebchen, 2003) rather than the less regular type of timetable often found
in the UK. The number of papers, and the complexity of the timetabling problem being
investigate, have increased in the last few years, with Leibchen (2007), Rodrigue (2007),
Ingolotti et al. (2006), Tormos et al. (2007) describing research underway seeking to
generate feasible timetables for complex European railways. The European
Commission now provides a web site for researchers to share information on research
under way in this area (EU, 2008).
Also of interest is the approach adopted by London Underground through until 2008,
which was the subject of a paper presented by Wallace (1995), although ‘metro’
operations have rather simpler timetabling challenges than ‘main line’ railways.
A ‘Railway Timetabling Optimizer’ has been developed by Eurobios (a technology
consultancy) in conjunction with Italian Railways and a demonstration given by the
developers suggests that it has similarities with the software (PTG) discussed in detail in
the next section, although it lacks some of the sophisticated capability of PTG (see

150
Eurobios, 2007).
This researcher has not attempted to understand any of these research and
development projects in detail, but he has concluded from reviewing the literature that
none are especially suitable for the UK situation, where complex ‘all day’ timetables
need to be produced.
The remainder of this chapter focuses in on software that has been developed
specifically with British railway operations in mind – the Planning Timetable Generator.
7.4 An Example of Timetable Generation and Optimisation
Software – the ‘Planning Timetable Generator’
7.4.1 Early Development
The Planning Timetable Generator (PTG) started life as an MSc project undertaken in
1992. The project was carried out by Simon Adcock at the London School of Economics
as part of his studies towards an MSc in Operational Research (OR). It was sponsored
by the British Rail OR Division (BROR) and supervised by Stewart Robertson (whilst
working for AEA Technology Rail, the successor to BROR). The following description of
this research has been developed from conversations with Stewart Robertson and an
unpublished AEA report ‘the PTG Heuristic’ (Gilroy & Robertson, 2001).
The objective of the project was to investigate whether the heuristic technique known as
simulated annealing might be applicable to timetable optimisation. Simulated Annealing
is a heuristic optimisation method based on an analogy to the physical process of
annealing, where random changes made to a crystalline structure gradually decrease as
the temperature drops and the structure settles into its optimal form (Gilroy and
Robertson, 2001). A good introduction to Simulated Annealing is provided by Aarts et
al. (2005).
Adcock sought to prove the principle by using a simulated annealing heuristic to create a
timetable for a single direction on a single commuter line (Northampton-London). The
151
program determined the stopping patterns of a pre-specified number of trains in the peak
hour such that:
• Each station had at least a specified number of trains calling at it;
• The required headways were maintained;
• Passenger loadings (estimated using a very simple method) were balanced.
The project succeeded in demonstrating that the simulated annealing technique held
promise.
In the summers of 1993 and 1994, BROR sponsored a further student projects at LSE to
build on the Adcock work. The objective function was improved, for instance, by
incorporating the desirability of achieving even-interval services from each station. The
underlying representation of the utilisation of the railway network was extended to cover
the fast and slow lines on a commuter route (Reading-London). Increasingly
sophisticated methods of estimating the passenger loadings and revenue consequences
of each timetable were built in.
Unfortunately, with privatisation the research and development budget that BROR had
had the benefit of disappeared and, also as a result of privatisation, the train planning
process was fragmented, with no one party responsible for meeting demand and
developing the timetable. There was therefore a gap in development until, in 1997,
Graeme Cooper of Railtrack’s Access Planning department was given a remit to explore
new possibilities in operational planning, and he commissioned a feasibility study to
demonstrate the possibility of creating timetables using optimisation techniques to
achieve objectives set. In discussion with the author in 1999, prior to the author and Ian
Bradshaw reviewing the usefulness of PTG, Graeme described how development for
Railtrack of an automatic timetable generation package was originally justified for use in
strategic planning on the basis that Railtrack had a very substantial infrastructure
investment requirement to manage and the inability of train planners to test out large
numbers of options relating to the train service required in future years and the
infrastructure that might be provided was seen to be a key constraint. High level
business objectives for the development were set as facilitating an examination of a
wider range of options, a more thorough evaluation of the achievement of objectives by
each option and a better understanding of what could be achieved without infrastructure
investment.

152
This latter study was carried out by Stewart Robertson and Richard Mann, by then of
TCI, the company who had bought BROR (this company was subsequently bought by
AEA Technology Rail). The study implemented a simulated annealing heuristic, not,
they note, because this was necessarily the best way of approaching the problem, but
because the 1992-1994 studies had demonstrated that it was viable, in principle, and the
short timescales did not permit exploration and implementation of any alternatives.
The 1997 study was judged successful by Railtrack and further funding was provided to
improve the objective function and develop a ‘production quality’ package that could be
used by Railtrack staff. A number of enhancements were made which included:
(i) modelling trains in both directions on a multiple-track route; (ii) maintaining prescribed
headways and margins between trains; (iii) allowing even intervals between trains to be
specified;(iv) allowing ‘clock-face’ times (e.g. xx00, xx15, xx30, xx45) to be specified
[note that this definition of ‘clock-face’ is different from that usually employed which is ‘at
the same minutes past each hour’ (see e.g. Rail, 2008, in references); (v) allowing
minimum and maximum connectional times to be specified; and (vi) allowing minimum
and maximum turn-round times to be specified. As part of the development process
Railtrack commissioned a number of studies to trial the application of the model: these
studies included the East Coast Main Line, the Coventry-Birmingham corridor, the
London-Brighton line, the southern part of the West Coast Main Line and the Heathrow-
London routes.
7.4.2 Overview of PTG
Given a set of trains to be run and their times for trains to run between stations, PTG
initially creates a timetable using a random assignment of journey start times. This
timetable will [usually] breach constraints and be sub-optimal in meeting the objectives
set. The tool then attempts to move to a solution which is feasible (i.e. no constraints
are broken) and optimal (i.e. the best possible timetable in terms of meeting the
objectives set), based on the repeated application of a seven step process for a large
number of iterations:

153
1. Make a small change to the timetable;
2. Assess the cost of the new timetable compared with the old. The PTG cost
function evaluates both the operational constraints and the commercial
objectives shown in the table below:
Table 8: PTG Cost Function Variables (Source: Gilroy and Robertson, 2001)
Headways Bi-directional Reoccupation Absolute Block Reoccupation Run-throughs (trains ‘overtaking’ other trains on the same track) Junction Margins Platform Occupation
Operational
Pathing Key Times Clockface timings Evenness by Service Groups Turnround by Service Groups
Commercial
Connections 3. Decide whether to accept the change based on the cost difference and
temperature. A probability factor is applied which decides whether a new
timetable with a worse cost is still accepted. The ability to accept a worse
timetable is an important feature that prevents the heuristic from being ‘trapped’
in a region of the search space and only being able to find a local optimum for
that area. The probability of accepting a worse solution decreases as the
temperature decreases;
4. If the change was accepted then compare the new timetable to the best
timetable;
5. If it is better then make it the best;
6. Reduce the scope for the algorithm to make big changes to the timetable.
7. If the iteration limit has not been reached then repeat from (1), otherwise
terminate the application and output the best timetable.
PTG splits its search into two phases: phase 1 allows larger random changes than
phase 2. Phase 1 attempts to steer the heuristic to a good region of the search space
(i.e. one where the objectives are tending to be met relatively well and where constraints
are not being broken) by moving a train at a time by up to 59½ minutes. Phase 2 seeks
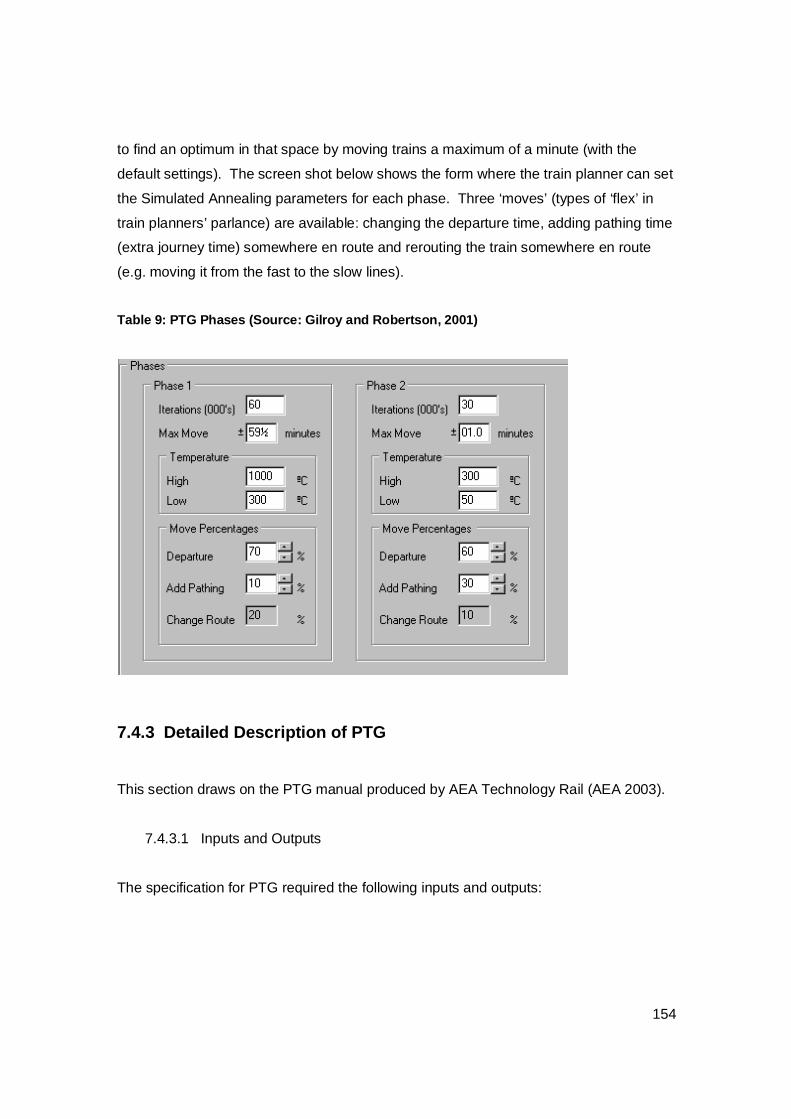
154
to find an optimum in that space by moving trains a maximum of a minute (with the
default settings). The screen shot below shows the form where the train planner can set
the Simulated Annealing parameters for each phase. Three ‘moves’ (types of ‘flex’ in
train planners’ parlance) are available: changing the departure time, adding pathing time
(extra journey time) somewhere en route and rerouting the train somewhere en route
(e.g. moving it from the fast to the slow lines).
Table 9: PTG Phases (Source: Gilroy and Robertson, 2001)
7.4.3 Detailed Description of PTG
This section draws on the PTG manual produced by AEA Technology Rail (AEA 2003).
7.4.3.1 Inputs and Outputs
The specification for PTG required the following inputs and outputs:

155
Table 10: PTG Inputs and Outputs (Source: Gilroy and Robertson, 2001)
Each of these elements is now considered.
7.4.3.2 The Commercial Specification
Considerable thought was put by the development team into how the train service
required should be specified. Whilst it was undoubtedly the case that passenger
volumes and the minimisation of passenger journey time were the underlying drivers of
the train service requirement, it was considered that this was too distant from the
business drivers for an infrastructure provider (Railtrack) and, hence, it was decided that
the ‘commercial specification’ should be based on the requirements of the infrastructure
provider’s customers, the train operators. Many of these requirements are now
enshrined in the access agreements that are in place between the train operators and
Railtrack (and subsequently Network Rail) and hence it was possible to use these
agreements as the starting point. Analysis concluded that the following elements would
need to be incorporated in the commercial specification to be input to the timetable
generator:
• A list of types of trains which were to feature in the timetable, with details of their
routes and stopping patterns;
• Details of specific times at which specific trains might have to run at (or very
close to) a specific time, (e.g. to meet a particular market need);
• Details of regular intervals required for those services made up of several trains
per hour (that is to say the need for even spacing of services, say every 20
minutes, rather than with gaps of 18, 17 and then 25 minutes);
• Turnaround times of trains at termini being within specified limits (recognising
that rolling stock utilisation is an important issue for train operators but that a
minimum turn round time is needed for servicing and robustness of the
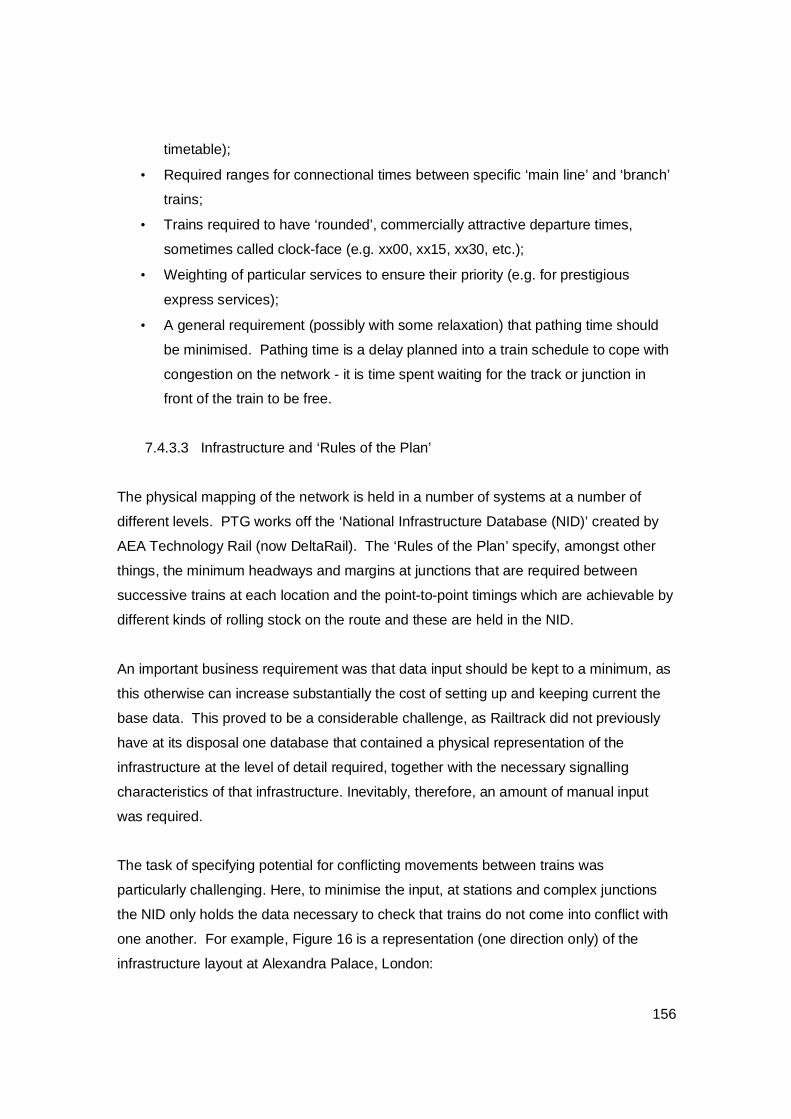
156
timetable);
• Required ranges for connectional times between specific ‘main line’ and ‘branch’
trains;
• Trains required to have ‘rounded’, commercially attractive departure times,
sometimes called clock-face (e.g. xx00, xx15, xx30, etc.);
• Weighting of particular services to ensure their priority (e.g. for prestigious
express services);
• A general requirement (possibly with some relaxation) that pathing time should
be minimised. Pathing time is a delay planned into a train schedule to cope with
congestion on the network - it is time spent waiting for the track or junction in
front of the train to be free.
7.4.3.3 Infrastructure and ‘Rules of the Plan’
The physical mapping of the network is held in a number of systems at a number of
different levels. PTG works off the ‘National Infrastructure Database (NID)’ created by
AEA Technology Rail (now DeltaRail). The ‘Rules of the Plan’ specify, amongst other
things, the minimum headways and margins at junctions that are required between
successive trains at each location and the point-to-point timings which are achievable by
different kinds of rolling stock on the route and these are held in the NID.
An important business requirement was that data input should be kept to a minimum, as
this otherwise can increase substantially the cost of setting up and keeping current the
base data. This proved to be a considerable challenge, as Railtrack did not previously
have at its disposal one database that contained a physical representation of the
infrastructure at the level of detail required, together with the necessary signalling
characteristics of that infrastructure. Inevitably, therefore, an amount of manual input
was required.
The task of specifying potential for conflicting movements between trains was
particularly challenging. Here, to minimise the input, at stations and complex junctions
the NID only holds the data necessary to check that trains do not come into conflict with
one another. For example, Figure 16 is a representation (one direction only) of the
infrastructure layout at Alexandra Palace, London:
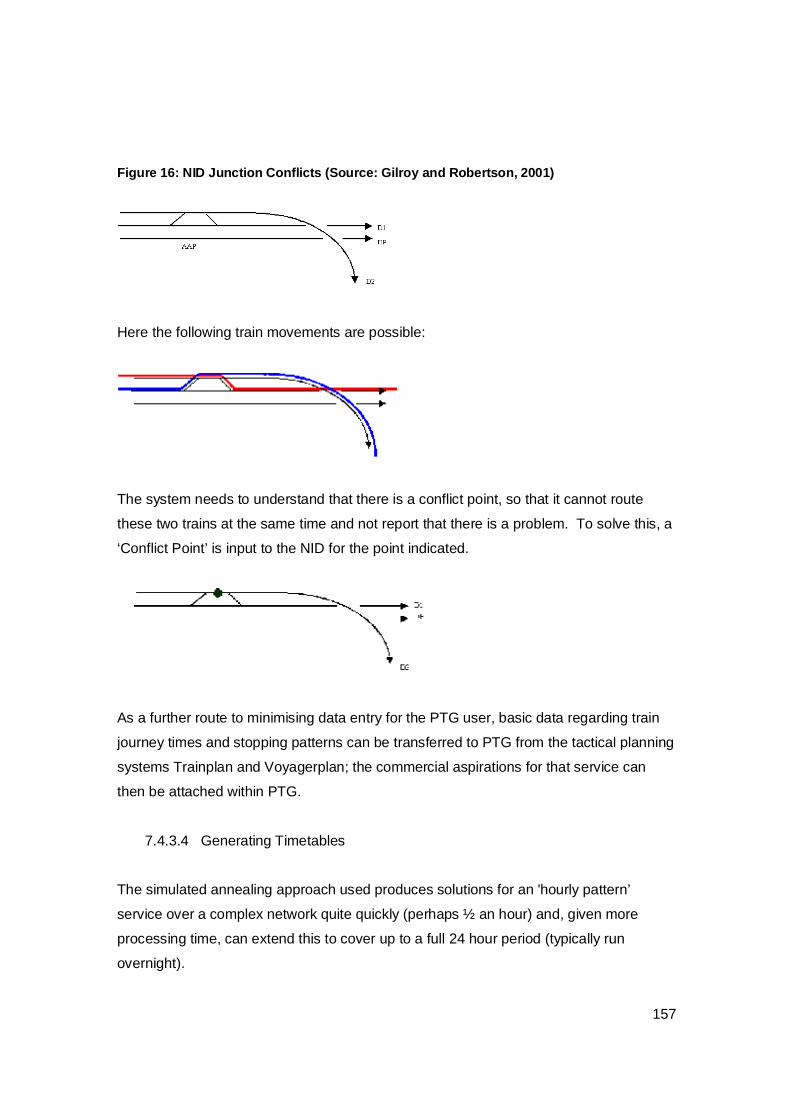
157
Figure 16: NID Junction Conflicts (Source: Gilroy and Robertson, 2001)
Here the following train movements are possible:
The system needs to understand that there is a conflict point, so that it cannot route
these two trains at the same time and not report that there is a problem. To solve this, a
‘Conflict Point’ is input to the NID for the point indicated.
As a further route to minimising data entry for the PTG user, basic data regarding train
journey times and stopping patterns can be transferred to PTG from the tactical planning
systems Trainplan and Voyagerplan; the commercial aspirations for that service can
then be attached within PTG.
7.4.3.4 Generating Timetables
The simulated annealing approach used produces solutions for an 'hourly pattern’
service over a complex network quite quickly (perhaps ½ an hour) and, given more
processing time, can extend this to cover up to a full 24 hour period (typically run
overnight).
158
PTG examines potentially hundreds of thousands of trial timetables during a run. Each
trial timetable contains a complete set of timings for each train listed in the commercial
specification. Since, in any particular situation, it is by no means guaranteed that a
feasible (i.e. conflict-free) timetable can be created, PTG allows the trial timetables to
contain conflicts between trains. It evaluates each trial timetable to determine the
number of conflicts, and the extent of departure from the 'ideal' commercial and
operational characteristics expressed in the commercial specification. There is a
'penalty' or 'cost' associated with each violation of operational rules (headway violations
etc) and each failure to meet the commercial specification. Each category of violation is
given a weight by the user to reflect its relative importance in the planning process. The
importance of each train can also be reflected so that contractual obligations can take
precedence over non-essential aspirations. The penalties for each train are combined
into a 'cost' for each timetable, and the algorithm searches for the timetable with the
lowest possible 'cost'.
The key operational cost categories used are:
1 Run through - the cost applied to ‘illegal overtakes’ and ‘collisions’ in a solution.
These are given a considerably higher cost than any other unwanted feature of
the timetable, as, however, low the costs might be in other categories, a 'run-
through' indicates that the timetable cannot be implemented as it stands;
2 Occupations - the cost applied per half minute (the standard unit of time in UK
timetables) of ‘headway’ or ‘margin’ infringement. This is evaluated by recording
when trains enter and depart each section of track and effectively occupying the
entry/exit from the track for the length of time specified by the headway.
Whenever more than one train is found to occupy that section’s entry or exit point
for half a minute, an occupation penalty is added to the total score for each
additional train. These again indicate that the timetable cannot be implemented
as it is and, hence, are given a high cost, although this is less high than for ‘run
throughs’.
The key objectives (known in PTG as commercial specification cost categories) are:
159
1. Turnaround - the cost applied when turnaround times have not been
achieved for specified groups of trains. This is assessed by pairing incoming
and outgoing services. Desired minimum and maximum turnaround times will
have been specified and a penalty will be applied for any pair which do not
achieve these targets. This is proportional to how far the turnaround is from
this window, as measured in half-minutes;
2. Connection - the cost applied when connection times for a pair of services
have not been achieved. Typically a connection 'window' will have been
specified. The penalty is proportional to the deviation from this window e.g. if
it were specified for two trains to connect between 5 and 10 minutes from the
time the first arrives to the time the second departs, and the best achieved
were 12 minutes, the penalty will be proportional to 4 half minutes;
3. Evenness - the costs applied when groups of trains have failed to run at even
intervals throughout the timetabling period. The trains within a group are
ordered in terms of departure times and a penalty is applied for each
consecutive pair which are not the required spacing apart. For example if the
required spacing is 15 minutes, and one consecutive pair were found to be 14
minutes apart, this would incur a penalty proportional to 2 half minutes of
deviation;
4. Roundness - the cost applied when a train has failed to achieve a clockface
departure or arrival time. This cost is proportional to the deviation from the
nearest clockface timing in half minutes e.g. xx:17 would be 4 half minutes
from xx:15, which would be used to cost this deviation rather than the six half
minutes from xx:20;
5. Deviation - the cost applied when a train fails to meet its fixed time. This cost
is proportional to the deviation in half minutes from the ideal time or time
window;
6. Pathing - the cost applied according to how much pathing has been inserted
into a train. This cost is not pro-rata (the only non-linear cost in the model at
present), but is weighted according to how much pathing has already been
inserted at other points in the train's journey. Thus the cost for a minute of
pathing is quite small, but the cost for five minutes of pathing is
disproportionately higher. This penalty is also applied when considering
switches as a means of assessing the increased journey time which may
160
result from a change to the original route.
7.4.3.5 Outputs
A complete timetable can be output, in forms that timetable planners are familiar with
(tabular and graphical). These outputs have been specified to enable timetable planners
to use their ability to assess timetables ‘by inspection’, meaning that no special new
skills would be required to undertake a review of timetables produced by PTG to ensure
their compliance with operational rules.
More significantly, ‘diagnostic information’ is provided to enable timetables generated to
be assessed on the basis of the ‘costs’ incurred through failing to comply with
operational constraints or the commercial specification set. ‘Costs’ are set out by
category and by magnitude, making it possible to compare costs for different timetables
generated and hence enabling the decision making process to be more quantitative than
had previously been the case.
More detailed reports, e.g. of the location and nature of any remaining conflicts, enable
the user to diagnose underlying causes, for instance inadequate infrastructure or over-
tight commercial requirements.
7.4.4 Case Studies
The author was given the opportunity to be involved in two case studies involving PTG
The first was a study undertaken of the feasibility of operating the ‘standard’ Sunday
timetable when engineering work reduces the number of tracks available on certain
stretches of the London to Brighton main line from four (two each way) to two (one each
way). The scale of this problem would represent a significant challenge to conventional
approaches. Some 68 trains were involved in the ‘standard hour’ service, although
some of these are making crossing moves and therefore were only on the route for a
short distance. The network considered comprised the full route from London to Brighton
(51 miles), with all tracks that could be used by passenger trains included in the data.
This study was undertaken jointly by Railtrack and AEAT and the outputs from PTG

161
were passed to the author for analysis. In addition the author met with the train planners
involved to understand their views on the outputs and usefulness of PTG.
This study was regarded by the train planners as having been largely successful in
meeting its objectives, with PTG demonstrating that the original proposal was
unworkable and enabling other scenarios, with less trains, to be rapidly tested. The
most promising were then passed to train planners to be worked up in detail.
More details of this case study can be found in Appendix 1, section 10.1.
The second case study involved the use of PTG for timetabling analysis on the East
London Line Extension Project (ELLE), a project to upgrade the East London Line (part
of the London Underground network) and to link it to the national rail network at Dalston
in the north east of London and New Cross Gate south of the Thames. The ELLE study
was undertaken by a ‘hands on’ team comprised of Ian Bradshaw, working under the
direction of the author, and with the support of experts from AEAT.
The study was designed to give a detailed understanding of PTG from a user
perspective, in addition to being designed to achieve some of the train planning work
which was required to enable the project configuration to be agreed in detail. The ELLE
was also regarded as a good ‘test case’ for PTG because it enabled the author to
examine how successful PTG was when faced with a series of very tight constraints and
a necessity for development of a regular interval timetable.
PTG performed much less well in this study, failing to produce a solution as good as had
been produced manually by train planners. A change to the code within PTG was
required to enable an adequate solution to be produced. Despite this problem, the
object of providing a user perspective was achieved and much was learnt about the
challenges of replacing conventional train planning methods with a heuristic.
Full details of this study are contained in a report produced jointly with Ian Bradshaw
(Watson and Bradshaw, 2001).
162
7.4.5 Analysis
7.4.5.1 Introduction
This section draws out issues and conclusions regarding the use and usefulness of PTG, focusing particularly on the ‘lessons learnt’ from the case studies.
7.4.5.2 A radically different way of working
The use of PTG changes the role of the timetable planner beyond recognition. Key
manual processes currently undertaken, in particular ‘conflict detection’ and ‘conflict
resolution’ to ensure operational feasibility, are substantially taken away from the
planner.
The first new task is to have a good understanding of customers’ real commercial
requirements. It is then necessary to make decisions on how parameters should be set
(such as the run time and the ‘seed’ to be used) and what weightings should be applied
to particular trains and to particular cost categories in order to achieve those commercial
requirements. For instance, PTG could well produce more interesting potential
timetables if the commercial requirements are left relatively unspecific; there is however
a natural tendency to give everything that train operators have asked for a high
weighting, potentially reducing the options that PTG will consider.
At a more detailed level, balances need to be struck, for instance between even-ness
and clock face - is it better to have departures at xx00, xx20 and xx30 (i.e. good ‘clock
face’ characteristics) or xx03, xx23, xx43 (good even-ness)? Another problem that has
emerged in practice again relates to even-ness: it is clearly better to have departures at
xx02, xx22, xx42 than at xx02, xx24 and xx43; but is this latter outcome better or worse
than xx02, xx20 and xx41?
The second new task for the user is to assess the outputs and, in particular, the
diagnostic information. Whilst an ‘overall cost’ of a timetable is now produced, the fact
that a substantial number of different timetables can easily be generated means that
there is now potentially a substantial comparative analysis to be undertaken.

163
Unfortunately, it is not easy or intuitive to compare the final score of one timetable with
another. Difficult questions that now have to be answered include assessing which is
more important, the number of individual violations or the overall cost. The total cost
incurred depends upon the number of trains and constraints, the utilisation of the
network, the weights placed upon each train and each compliance category and, hence,
it is necessary to work through the breakdown of costs. Once performance simulation of
the timetables is undertaken routinely, a further problem will be to trade off good
robustness against poorer compliance with the commercial specification, for instance,
one way of improving robustness is to reduce the number of train services operated.
Even getting a zero penalty cannot necessarily be regarded as a success with this type
of programme - it probably means that either the commercial requirements have been
under-specified or the network is under utilised. What is clear is that it takes some
experience to get full value from the diagnostics now made available by PTG.
An issue that has arisen in use is that PTG employs a weighting to encourage the
removal of operational ‘conflicts’ whereas the conventional timetable planner has been
trained to see the removal of conflicts as an absolute requirement. In reviewing the
output timetables, this training may lead the timetable planner to concentrate on minor
operational violations which could be put right manually, rather than fully considering the
more important issue of whether commercial requirements have been met.
All this leads to the conclusion that the role of the timetable planner changes very
substantially when PTG is used, from a craftsman, who manually creates a timetable on
the basis of intuition and training, to that of an analyst, who needs a set of analytical
tools to assess and compare timetables, once the system has generated them, after
which ‘fine tuning’ can be undertaken. This transformation is not unique to railway
timetabling. Eibl (1996) Ainger (1990) and Schmid et al. (1994) have found similar
issues regarding respectively the introduction of computer aided scheduling of road
vehicles and manufacturing systems.
The importance of training or retraining the planner cannot be overstated. This
conclusion matches closely that highlighted in papers presented to previous
conferences, c.f. Lamont 1988.
164
7.4.5.3 Quality of Conflict Detection
Much discussion took place with the train planners involved about the extent to which
the timetables generated must be operationally ‘conflict free’. Timetable planners are
trained to consider that, unless a timetable would work in practice, it has no value, even
if operational rules have only been infringed by a small margin. The logic behind this
view is that, ultimately, before implementation the planner will be expected to eradicate
these infringements and, until this has been done, it cannot be assumed that it will be
possible to produce a workable timetable. It was agreed that some flexibility was
possible when PTG was intended purely for strategic use; once some possible
timetables had been devised and assessed, they could be checked for full compliance
with operational rules and constraints by train planners.
The following problems were found with how PTG identified conflicts:
• The way in which the program interpreted single line bi-directional track resulted
in PTG missing conflicts, as it considered the trains as being on two separate
tracks;
• PTG did not have platform reoccupation time as a constraint. This is often
different to the standard headway for a route, reflecting the particular
circumstances of access into and out of a platform;
• Modelling of complex junctions was also limited and only a single junction margin
could be defined for each junction. Hence, a freight train which would take
several minutes to cross a junction was assumed to have the same margin as a
fast passenger train which would block the junction for a much shorter time.
Each of these could be remedied to improve the realism of the timetable produced.
7.4.5.4 Limitations in the Constraints Set Running PTG for time periods of less than 24 hours
It was found that PTG had difficulty correctly processing services which were running at
either the start or the end of the model time period. This could be ‘worked around’ by
running PTG with a time period set as from the middle of one night until the middle of the
165
next, but this substantially increased the running time.
PTG unable to make appropriate replatforming decisions in stations
The very simple nature of the algorithm within PTG gives an option to move a train from
one platform to another. Unfortunately it makes this move without any knowledge of
whether other platforms are being used at that time and because of the randomness
built in, it does not look at all the platform options before rejecting replatforming as
producing a better solution.
Limited number of turn rounds for a single train set
A turn round is when a train set finishes one journey and then starts another. On a short
route like the East London Line each train set performs a considerable number of these
each day. There was a very low limit on the number of turn rounds that PTG could
recognise for each train set (in fact only 2). This meant that platform working could not
be properly modelled for the ELLE project.
Joining of train sets not properly modelled
PTG did not have the functionality to ensure that two train sets that had to be joined
together both got to the station where they were to be joined before they had to leave.
Hence, PTG sometimes ‘flexed’ a service so that the train set got to the station after it
had to leave.
Evenness
The cost function only considers evenness at the start of services – hence PTG could
(and did) put pathing time into trains en route which reduced the evenness of trains in a
service group after that point but considered the timetable produced to have the same
‘score’ for evenness as a timetable that was even throughout.

166
7.4.5.5 Data Input
There was a substantial data management task to ensure that the infrastructure data
was in the required format. Whilst this was substantially a ‘one off’ task, finding
resources to undertake this task can be difficult, as the planners who have the skills to
do it are typically working full time on the development of timetables using traditional
manual means.
7.4.5.6 Where is the use of automatic timetable generation appropriate?
PTG has been used to tackle a variety of problems. It has proved particularly useful for
strategic what-if scenarios (such as the first case study) and less good at very detailed
studies that are heavily constrained (such as the second case study). The type of
problems that it has been used for include:
1. Assessment of network capacity resulting from infrastructure changes, both
proposed and actual (removing 'redundant' track, adding in new
track/crossovers);
2. Assessment of the impact of changes to station stop times and minimum
times between trains on key sections of the network;
3. Addition of completely new services (e g. London St. Pancras-Heathrow
airport express trains);
4. Exploration of possible improvements to current timetables.
Experience in using PTG, evidenced by Grant and Wood in providing interview evidence
for the paper presented at CASPT (Watson et al., 2000) and by the author in comparing
the success of Brighton line study and the ELLE project, has shown that it is best to
restrict the area of coverage of runs of the program to improve the effectiveness of the
search. This includes:
5. Concentrating on areas of high utilisation and/or congestion;
6. Concentrating on areas where there are many and varied options.
PTG, at the time these case studies were undertaken, took no account of the existing
timetable, except to the extent that the commercial requirements input dictated this, as it
always produced new timetables from scratch. Hence the approach was not very
167
suitable if there was a requirement to produce a timetable with only incremental change
from an existing timetable. This was an important limitation, as this is often the case -
either because of ‘traditional thinking’ that it is too difficult to do otherwise or for good
reasons to do with stability of the timetable for passengers.
7.4.5.7 Appropriateness of Objectives and Commercial Specification
As already described, PTG has a number of detailed commercial specification
categories incorporated:
• Evenness (regular interval), ‘roundness’ (achievement of ‘clock face’), deviation
(from a fixed time);
• Pathing (additional time above the minimum journey time added to remove
conflicts between trains);
• Connection quality;
• Turnround (time between arrival and departure of trains at a terminus).
The first three categories measure in part the revenue generating capability of the
timetable and turnround has a bearing on the resource cost of the service (longer
turnround suggesting more resources are needed) rather than the revenue achieved by
the service.
It was noted, in an earlier chapter, that the achievement of strategic objectives is of
particular importance to railway managers. PTG does not directly address any of these
– the inputs to the generator would need to be set with these objectives in mind and then
the outputs appraised against them. PTG can only play a small (if potentially important)
part in developing timetables to meet these objectives.
At an operational level, PTG does not consider a number of key trade-offs – again, the
inputs to the generator would need to be set with these objectives in mind and then the
outputs appraised against them:
• Revenue potential vs. resource cost (how many trains to run?);
• Regular interval vs. train service tuned to meet demand (particularly important for
commuter services);
168
• Stopping patterns;
• Passenger trains vs. freight trains.
7.4.5.8 Constraints and Feasibility
The primary constraints that PTG attempts to ensure are not broken are headways and
junction margins, that is ensuring that two trains are not planned to be on the same
stretch of track at the same time.
Other elements of the Rules of the Plan, such as running times between stations or
suitability of the route for the train are not addressed. Some of these (e.g. running
times) are set in the input files, and, as long as these are correct at input, the resultant
timetable will not infringe these; others (e.g. suitability of route for the type of traction)
could at present be violated by the timetable generation process. Currently these would
need to be manually checked and adjusted as part of an appraisal process.
Rules of the Route (engineering access requirements) are not handled by PTG and this
means that PTG cannot be used to create timetables where engineering access has to
be accommodated.
Train operator resources are implicitly considered through the input specification of the
train service to be operated. Currently however PTG does not assess how many units of
rolling stock or train crew would be required to operate a particular timetable generated.
Contractual commitments are not considered, meaning that PTG cannot be constrained
to ensure that contractual commitments are met.
Safety objectives are not considered. In particular train planners must ensure that new
timetables do not introduce increased risk of signals passed at danger, by making it
more likely that drivers will see red signals. PTG has no capability to limit the number of
red signals that drivers will see.
It will be apparent from the above that considerable checking of any timetable generated
will be required to ensure that it is in fact feasible. This could be added to PTG as a

169
‘post-process’ appraisal suite or through interfacing the timetables produced into other
software which can validate them against these objectives. It would be better to
incorporate these factors within the ‘scoring’ module of PTG so that, as the heuristic
searches for better solutions, it takes more elements of feasibility into account.
It is clear that as currently implemented, in some circumstances the output of the
timetable generator could be sufficiently poor to require a different software tool to be
used to produce a viable timetable.
7.4.5.9 Robustness
This is not currently considered at all in PTG. As is discussed in Chapter 9, it is of
considerable importance to the rail industry that timetables are delivered that will perform
satisfactorily, that is to say will have an acceptable level of punctuality. It is not sufficient
for a timetable to comply with a set of rules, the Rules of the Plan. Cases have been
found where the timetables generated using these rules were not robust. Because PTG
does not have any input parameters or variables to impact the performance of the
timetables produced, it is not possible to get PTG to find better performing timetables
and there is a risk that PTG will produce timetable options that do not have satisfactory
performance.
7.4.5.10 To what extent has automatic timetable generation met the business
needs?
In the introduction to this chapter, several key business needs were identified:
• A substantial reduction in timetable development timescales;
• Facilitation of the assessment of a wide range of timetables;
• Facilitation of the assessment of the feasibility of a range of different commercial
specifications over a variety of different possible future infrastructures.
The assessment of timetables for robustness during the timetable development process.
Some of these objectives are being achieved. Using PTG it is possible to generate
170
timetables quickly and, through rerunning the programme with different inputs, it is
possible to assess a wide range of commercial specifications and infrastructures. Using
the interface between PTG and RailSys, Network Rail’s simulation package, it is also
possible to undertake a rapid assessment of the robustness of timetables generated by
PTG. Further developments will enhance the capabilities of PTG. However, probably
the most important future issue is how to introduce the new ways of working that
automatic timetable generation facilitates.
Facilitation of the assessment of a wide range of timetables and facilitation of the
assessment of the feasibility of a range of different commercial specifications over a
variety of different possible future infrastructures
Heuristics can be used to solve timetabling problems. In principal, after initial data set
up, feasible timetable solutions can be found to answer ‘what if’ questions in a matter of
hours rather than the days or weeks that are required to produce a manual solution.
This has substantial benefits. Tools such as PTG can test a number of different options,
e.g. various commercial specifications and a variety of different infrastructure
configurations, rather than just developing one feasible timetable. This should in
principle lead to the design and construction of more appropriate infrastructure in the
future, better able to cope with a range of possible future commercial requirements.
What is clear, however, is that further research and software development are required,
looking at many aspects of the scope and design of timetable generation tools. The next
section considers what might be done.
7.4.5.11 Using PTG for Production Quality Timetabling
The intention to extend usage of PTG to tactical planning and short term planning
requires more rigorous solutions. It became apparent that it was necessary to define
two types of ‘conflict’ in timetables output, with different actions required. Firstly, there
were conflicts that remained because there was no feasible solution - where there were
too many trains for the available capacity. It was agreed that, in this circumstance,
outputs must clearly indicate that the timetable or the proposed infrastructure would
have to be altered. Secondly, there were conflicts that remained which the software had
171
not detected. In this case it would be necessary to consider enhancing the programme
to ensure that the outputs included warnings about these non-compliances. A number of
minor problems of this type have now been identified, for instance, variable headways
where the speed of trains differ and the accommodation of a number of trains in the
same platform at the same time.
7.4.6 Areas for Development
7.4.6.1 Improved heuristic
It has proved difficult to get answers from PTG that are recognisably close to being as
good at meeting the commercial specification set as those that can be produced by
experienced train planners – albeit that it takes train planners many times longer to
produce those solutions. Why is this? The very limited understanding of performance
robustness is a problem that has already been discussed. However in practice there
has been a more fundamental problem - PTG often completely misses what is to the
train planner the ‘obvious’ answer and produces something considerable less good
(measured against the commercial objectives). This appears to be a result of the
heuristic approach being used in PTG. Analysis of the search algorithm used indicates
that there is too much randomness to produce solutions that are good in the eyes of the
train planner. Because of the way in which the algorithm moves around the problem
space early on it often discards solutions which might ultimately lead towards a very
good solution and then later it becomes too constrained and searches for a local
optimum which is ultimately considerably sub optimal.
Discussions with leading U.K. researchers in the area of heuristics (Raymond Kwan of
the University of Leeds and Chris Hinde of Loughborough University) indicate that work
is needed to improve the search method. This is very likely to lead to the replacement of
the simulated annealing approach with a more guided search such as, for instance, a
genetic algorithm. To date it has not proved possible for DeltaRail to find funding for this
work and unfortunately until this development is undertaken it is very likely that PTG will
continue to be used to only a very limited extent.
172
7.4.6.2 Improved realism
Fully replicating the manual timetabling processes of conflict detection and conflict
resolution is expensive, both in terms of software development and computer run time.
However, initial project planning and ‘what if’ work does not require a fully conflict free
timetable to be output and hence PTG was initially put into production use in this area.
Further development work has been undertaken to make the solutions more precise,
through the inclusion of more detailed data regarding what constitutes a conflict within
station limits and at junctions. There is some way to go before the software will be
capable of providing solutions which could be used operationally with just some minor
‘tweaking’ by the timetable planner.
7.4.6.3 Base data
Timetable generators are ‘data hungry’. To produce realistic solutions they need to
know a lot of detail about the network – much of which is not held on one system and
some of which is only in timetable planners heads. There is a substantial initial ‘set up’
cost in using PTG as data is collected together, validated and input. More of this needs
to either be generated within the software or transferred electronically.
7.4.6.4 Functional development
There are a number of functional enhancements in development or needed:
1. Linkage into tactical train planning systems - so train planners can use the full
suite of tools to view, check and improve the solutions generated;
2. Linkage to other Railtrack/Network Rail systems, e.g. ARDV, which validates
timetables against the contractual rights of train operators (described in
Harris and Cooper 2000), and SCORES, a passenger demand forecasting
model;
3. Refinement of cost functions (currently mostly linear);
4. The inclusion of weightings for performance robustness;
5. Inclusion of additional operational violation checks;
6. The ability to include or exclude complexity of layouts at junctions and major
173
terminals;
7. The ability to ‘fix’ part of the timetable and get PTG to only vary the
remainder.
7.4.6.5 Training and Implementation
Currently there are only a limited number of trained users. Decisions have to be made
regarding the extent to which PTG is ‘rolled out’ to existing timetable planning offices, or
whether it might be better to develop a small team of expert ‘analysts’ instead.
There is much to learn by watching this process in action and conclusions about how
best to undertake this important stage will be drawn as implementation progresses.
Irrespective of this final outcome, advanced training, based on the portfolio of case
studies already to hand, is already being organised, initially for a small group of selected
train planners.
7.4.6.6 Wider use
Integration of PTG into tactical timetable planning processes appears to be a realistic
objective in the medium term, once the software has a sufficient user base and any
residual operational compliance issues have been resolved.
In addition the relevance of these techniques to mass transit needs to be explored
further. Although the importance of operational compliance has been a particular focus
of the work to date, the inclusion of connections and turnrounds in the heuristic means
that it could produce useful outputs, especially if there are also infrastructure constraints,
such as platform capacity, junctions between lines or even bus station congestion.
7.4.6.7 Comparative analysis
The work in the Netherlands and that of Carey has been referred to. It would now be of
considerable value to compare the strengths and weaknesses of these different
approaches, with the standard hour approach in the Netherlands and the station/platform
optimisation work of Carey both representing solutions to part of the overall problem for
Britain’s railways.
174
7.5 Connecting Timetable Optimisation Research and
Development to Reality
The assessment of user needs highlights that there is a gap between what will be
acceptable to users and most of the optimization models developed. This results from
these models not being embedded in software that already meets users’ basic needs
and by the models not taking into account all the facets of real railway operation.
It is argued that these problems can be overcome by a combination of the following
factors:
1. The integration of optimisation models with software packages that meet
schedulers’ data management needs;
2. The development of partnerships between researchers and commercial
software houses to achieve this integration;
3. Work focused on extending the applicability of optimization models to cover
more real-life circumstances, rather than an emphasis on the development of
more elegant models;
4. A focus on the development of solutions which can be implemented in many
different railway environments without major customisation, so that it is
possible to achieve ‘economies of scale’ in software development.
Interviews with railway personnel have provided a detailed assessment of what railway
managers and schedulers consider to be their key objectives and needs and give a
‘hierarchy of needs’ for researchers to consider, starting with basic data collation and
processing, then incorporating quality checks and only then moving on to the use of
schedule generation and optimisation software. It is clear from this that any software
that does not meet these basic needs fully is unlikely to be a success in the railway
environment. This is an important finding that may go some way towards explaining why
optimisation algorithms are little used. This result confirms the principle that advanced
software must be built on a firm foundation (Booch, 1994, Downs et al., 1992), that is,
meeting the basic data management needs of train planners before being extended to
175
include more advanced functions.
The concern of Cordeau et al. (1998) that optimisation solutions have tended to lack
realism warrants further consideration. Put together with other comments regarding the
need to match specific circumstances and rules that apply, it is apparent that a particular
problem is that solutions do not cover all these circumstances. The importance of
developing this flexibility cannot be over-emphasised. The author is aware of two
European railway scheduling software developments that have been aborted due to their
inability to cope with the changing nature of the operational rules that apply. This can be
addressed by a change of focus, from the development of more elegant optimization
algorithms to the extension of existing algorithms to deal with a global set of rules and
constraints, enabling models to address the needs of different railways and the changing
rules of individual railways without the need for substantial rewrites.
Probably the best chance that researchers have of seeing their models in operational
use is if they work with commercial organisations that already have software that meets
the basic needs of schedulers. This will require these companies to have the foresight
to realise that an appropriate way forward is to gradually incorporate schedule
generation and optimization into their product portfolio and appropriate partnership
arrangements will need to be put in place, with user involvement and requirements
specifications, together with funding provided by the commercial partner and improved
models being delivered in return.
There are now signs of consolidation of suppliers in the way that happened some years
ago in mass transit, with companies such as Funkwerk with their Trainplan product
(Hammerton 1996) and Siscog (Morgado and Martins 1998) with their CREWS package
penetrating international markets. These could become the stepping stones to
packages that have world-wide applicability. Globalisation is an inevitable trend in many
areas, and there are no obvious reasons why railway scheduling software should be any
different. There are signs that railway undertakings are becoming less national in
orientation and it appears inevitable that systems will follow suit. It can be argued that
those that achieve a global presence early will have some distinct ‘economies of scale’
advantages. Firstly a larger user community means that more funding is likely to be
forthcoming. As important, a larger user community means that there is potentially more
176
experience to draw on to enable the production of solutions that meet a variety of
different circumstances. The advice to researchers must therefore be to choose a
commercial partner early and to make sure that the partner has global aspirations.
7.6 Conclusions
Timetable generation software has, in principle, considerable application. However, the
research reported here has indicated that, to date, software of this type has not proven
successful ‘in the field’.
Further work now needs to be undertaken to assess commercial software and research
activity against this framework: indeed it should be possible to predict the likely success
of scheduling software on this basis. Not covered in this thesis, but of considerable
importance to users, is the issue of implementation. Evidence collected from Britain’s
railway industry indicates that the approach taken to implementation can have a very
significant impact on the success of computer aided scheduling. This warrants further
analysis, possibly along the lines adopted by Eibl (1996) in considering the
implementation of computerised vehicle scheduling in road transport. It would also be
beneficial for analysis to be undertaken to assess over what timescales railway
management should reasonably expect software enhancements to be developed and
implemented and what level of funding is required to achieve the desired results.
Lessons of general applicability from this chapter are the challenges of implementing
sophisticated software in complex processes and the importance of undertaking
research and development for this kind of software in close communication with users,
so as to ensure that it meets their needs.
177
8 TIMETABLE SIMULATION SOFTWARE
8.1 Introduction
In this chapter the author looks in detail at timetable simulation software - software which
takes timetables and assesses them for robustness, taking into account the
infrastructure configuration, train performance characteristics and levels of primary
delay.
Following a description of the methods employed and a short literature review, the tools
currently available in Britain are described. A detailed case study relating to one
particular tool is described in the Appendix (Section 10.2). Using this and other data as
the base, issues with the simulators currently available are then assessed, before
suggestions are made as to the research work which still needs to be undertaken.
The intention is that this chapter provides a more complete assessment of timetable
simulation tools than is available elsewhere and also provides guidance for other
researchers on where attention should be focused to make simulation more accurate
and more efficient.
Key sections of this chapter have been published in a conference paper (Watson, 2006,
2); a short paper on issues relevant to the UK has been published in a relevant trade
journal (Watson and Radtke, 2007).
8.2 Method
This chapter has been developed through a synthesis of several complementary
investigation methods. Interviews with suppliers/developers undertaken as part of the
Gardermoen Railway Project (1998-99), have been brought together with analysis of
promotional material from suppliers (referenced in the relevant section below), interviews
with users of a number of the models documented in O’Brien (2002) and ‘hands on’
experience of RailSys, including the case study included in the Appendix.
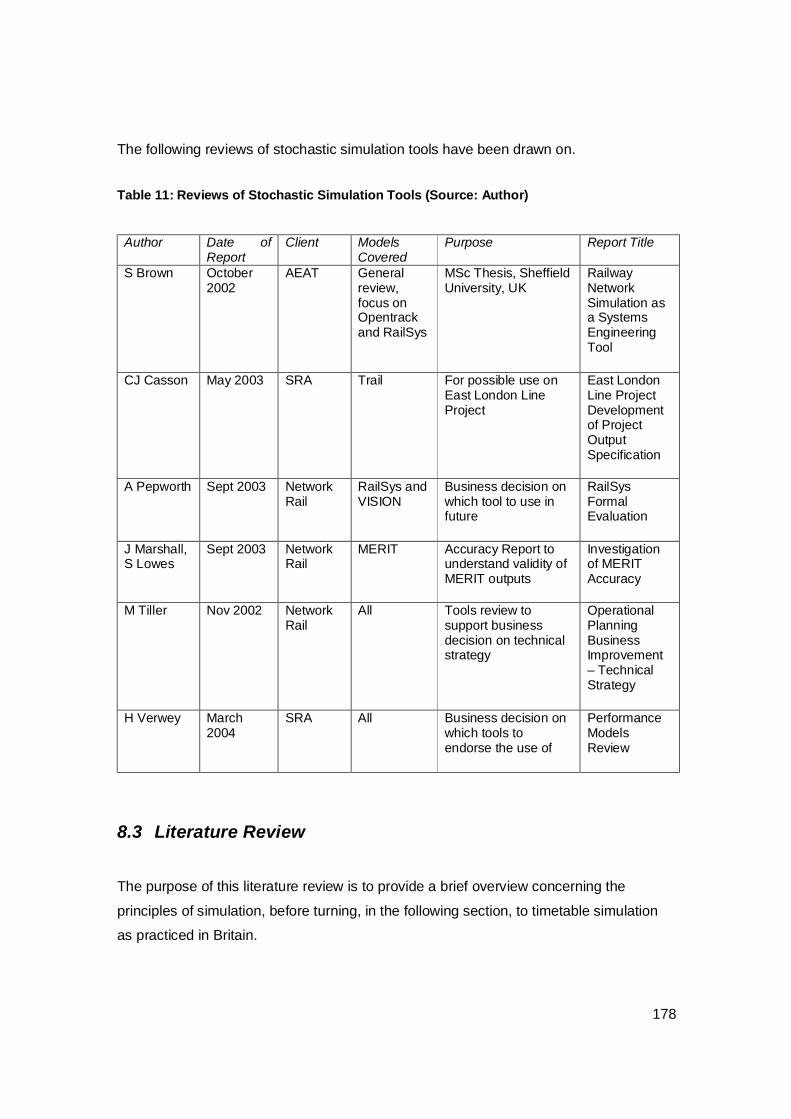
178
The following reviews of stochastic simulation tools have been drawn on. Table 11: Reviews of Stochastic Simulation Tools (Source: Author)
Author Date of
Report Client Models
Covered Purpose Report Title
S Brown October 2002
AEAT General review, focus on Opentrack and RailSys
MSc Thesis, Sheffield University, UK
Railway Network Simulation as a Systems Engineering Tool
CJ Casson May 2003 SRA Trail For possible use on East London Line Project
East London Line Project Development of Project Output Specification
A Pepworth Sept 2003 Network Rail
RailSys and VISION
Business decision on which tool to use in future
RailSys Formal Evaluation
J Marshall, S Lowes
Sept 2003 Network Rail
MERIT Accuracy Report to understand validity of MERIT outputs
Investigation of MERIT Accuracy
M Tiller Nov 2002 Network Rail
All Tools review to support business decision on technical strategy
Operational Planning Business Improvement – Technical Strategy
H Verwey March 2004
SRA All Business decision on which tools to endorse the use of
Performance Models Review
8.3 Literature Review
The purpose of this literature review is to provide a brief overview concerning the
principles of simulation, before turning, in the following section, to timetable simulation
as practiced in Britain.
179
Simulation has been defined by Robinson (1994) as ‘a model that mimics reality’ and by
Gamerman and Lopez (2006) as ‘treatment of a real problem through reproduction in an
environment controlled by the experimenter’.
Simulation can be deterministic, where the results are entirely predictable, or stochastic
(also called probabilistic in some texts, e.g. Selia, Ceric and Tadikamalla, 2003) where
“behaviour cannot be entirely predicted, though some statements may be made about
how likely certain events are to occur” (Pidd, 2004) or, as Gamerman and Lopes (2006)
put it, “stochastic simulation is the area of science dealing with when some or all of its
components are subject to random variations”. This kind of random variation clearly
occurs in railway operations – be it caused by points’ failures, extended station dwell
times or whatever.
Monte Carlo simulation is particularly appropriate in these circumstances, using “a
method of sampling in such a way that the sample represents the whole” (Jones, 1972).
For railway timetable simulation this method is used to sample delay events to affect the
running of trains in a way which, if repeated over enough simulation days, will produce
by the average of all these days a good approximation of performance on a typical day.
Authors (e.g. Robinson 1994) note that simulation is more appropriate than
mathematical models where there are many variables and that mathematical models are
not good at assessing ‘knock on’ impacts, e.g., in the case of railway operations,
‘secondary delay’ caused by one train delaying another.
The appropriateness of using simulation in a business situation has been described by
Jones (1972) as follows: “a company may feel that before committing itself to a plan of
action it would be useful to see what the effect of alternative actions would be – a sort of
look before you leap”. Robinson (1994) sets out the potential benefits as being:
• Risk reduction;
• Greater understanding;
• Operating cost reduction;
• Lead time reduction;
• Faster planned changes;
• Capital cost reduction;

180
• Improved customer service.
All of these are sought in the use of simulation in railway timetabling.
Particular problems with using stochastic simulation are noted by writers as being
associated with assessing what is ‘good’ in terms of a simulation package – across at
least three measures: run speed, visualisation, ability for interaction between the user
and the software (Robinson, 1994). Railway timetable simulations are typically discrete
event simulations, and run speed can very much be impacted by whether a time-slicing
approach is adopted (moving forward in equal time intervals, usually a few seconds at a
time for railway timetable simulators) or an event based approach. Visualisations vary in
how user friendly they are (some replicate signal box ‘panels’; others are less
sophisticated). Some simulators allow the operator to ‘play signaller’, planning each
train through the model area; others allow little or no interaction, relying on predefined
(or hard-coded) ‘regulation rules’. The latter is equivalent to the Automatic Route Setting
deployed in modern signal boxes – but often switched off by the signallers when things
go badly wrong!
It is noted that it is possible to create over-elaborate simulators, where elements are
included which are not material but, more commonly, over simplification is a problem –
with insufficient detail being provided to enable the simulator to properly handle the full
complexity of the simulated system.
Validation of the model can be by inspection of the detailed workings of the model,
sometimes called ‘white box’ simulation (Pidd, 2004), comparison with other models, or,
best of all, comparison with ‘real life’.
8.4 Timetable Simulation in Britain
8.4.1 Background
Simulation tools have now been in regular use in Britain for over a decade to model the
performance of different infrastructure and timetable combinations. Initially, simulators
were capable of simulating the running of single trains but this was then expanded to

181
allow the simulation of a number of trains at the same time, with the interaction between
these trains an output of the simulation. However, these tools were deterministic in
nature and, hence, were not able to predict with any accuracy the performance
(punctuality) impact of different infrastructure and timetable options, by taking into
account in a statistically valid way the failures and delays that occur every day. In
addition, these tools, limited by their design and computing power, were only able to
model limited geographic areas and limited timetable options.
Researchers have always understood the potential to address these issues, seeking to
turn timetable simulation from a representation of physical facts (railway geography, train
acceleration and braking) to tools that exhibit some of the facets of an expert system, at
least to the extent of replicating signallers’ decision making processes.
More recently, railway managers have also come to realise the need for better tools,
capable of predicting the performance of railway networks when the infrastructure and/or
timetable is changed. Why this greater interest in simulation from railway managers?
Many railway infrastructure managers are finding that there is more demand for train
paths on their networks than they are able to provide, c.f. European Conference of
Ministers of Transport (2002), requiring capacity management of one form or another to
resolve this conflict. Investment in the infrastructure to increase capacity is an option,
but this is expensive and will not always represent the best value for money. Often
better, and certainly more cost effective, is to ensure that the capacity already available
is used as effectively as possible. Central to this proposition is the need to understand
the impact that options to change the way capacity is used have on train running
performance (punctuality).
Whilst the author concentrates on developments in Britain, it should be noted that the
European Union has also, indirectly, been instrumental in focusing attention on software
tools in this area. It has undertaken work on path allocation with a key objective of
making best use of available capacity (EU, 1998) and Directive 2001/14/EC (EU, 2001)
requires member states to put in place standard processes to analyse capacity problems
and propose solutions. This directive defines the role of infrastructure manager (in
Britain this is Network Rail) and requires that this body produces a capacity
enhancement plan and cost/benefit analysis wherever it cannot accommodate current or
182
forecast bids for capacity. In addition, the infrastructure manager must publish a
network statement covering the nature of the infrastructure, the capacity allocation and
timetabling process, procedures and criteria for dealing with congested infrastructure
and restrictions on the use of infrastructure, as well as the charging arrangements.
Analysis of the relevance of simulation techniques has extended to considering the
Japanese and European situations. Japanese railways operate in ways that the UK
should aspire to but, in the performance modelling area (as in a number of others) the
business situation is distinctly different, with Japan having such small levels of delay that
it has little need for performance modelling tools capable of handling a large range of
failure and delay types. European experiences, however, have been found to be very
relevant and the potential of a number of European modelling tools has been explored.
8.4.2 The British Rail Inheritance
British Rail Research (BRR) and British Rail Operational Research (BROR), both
divisions of the British Railways Board prior to privatisation, were active in the simulation
area. BR Research developed and used its deterministic ‘signal berth’ level tool
simulation tool GATTS (later re-named VISION) to model the infrastructure down to
individual signals and track circuits. This tool was designed originally to model
infrastructure schemes over small geographic areas. BROR developed a stochastic
simulator, MERIT, which did not use a signal berth level infrastructure model, relying
instead on a simplified set of track layouts, routing tables and rules, and using a Monte
Carlo sampling of failure data and multiple simulation runs to attempt to predict
performance changes due to changes in the timetable over whole routes. At
privatisation first BRR and later BROR were acquired by AEA Technology (then a
subsidiary of the Atomic Energy Authority) and, in 2006, the rail activities of AEAT were
acquired by DeltaRail, which still owns VISION. DeltaRail has exploitation rights for
MERIT but Railtrack and then Network Rail invested heavily in the development of this
tool and Network Rail now has full rights to it for its own use.
183
8.4.3 Stochastic Simulation Software in Regular Use in Britain
8.4.3.1 The models
There are now a number of stochastic simulation packages in use in Britain. They take
a timetable, overlay this with a number of possible perturbations (for instance points
failures or train breakdowns) and assess how much overall delay might be caused as a
result. Typically these packages use a Monte Carlo approach to sampling historic delay
data which is then applied to specific trains. With the software running a significant
number of timetable days, with delays sampled for each of these days using Monte
Carlo principles, the average of all these days gives a good approximation of the
performance on a typical day. A timetable where there is little ‘knock on’ delay caused
by a failure is called ‘robust’ and is what is sought; timetables where a lot of incremental
delay occurs need further work or, perhaps, indicate that the infrastructure is being used
rather too close to capacity for it to be possible to produce a robust timetable.
Software of this type is frequently used as a ‘strategic planning’ tool to validate
infrastructure improvements for robustness and is also used, for the same purpose,
where major restructuring of a timetable is intended. Simulations have until recently
been run for a single station or just a few miles of infrastructure, due to computer run
times becoming significantly larger as the model size grows. Typically simulation
packages require very detailed infrastructure maps, down to individual turnouts/switches
and signals and are hence complex and time consuming to set up and run. Time
constraints mean that these packages are rarely used as part of the annual planning
process or to examine ‘whole route’ effects during strategic planning. VISION has been
the ‘industry standard’ in the UK until recently, with RailPlan being used by some
consultancies; in the late 1990s these tools were joined by Opentrack, RailSys and
Trackattk.
MERIT and the tools most closely associated in technical terms (TRAIL and TTRA)
adopt a different approach to the assessment of robustness, employing an event-based
Monte Carlo approach to assess robustness over a line of route and using a full
timetable, but with a simplified link-node view of the infrastructure and failure rates for

184
components of the system.
The following table lists the simulation models in use in Britain. Table 12: Simulation models in use in Britain (Source: Author)
Link-Node Level Signal Berth Level
MERIT Opentrack
TRAIL RailPlan
TTRA RailSys
Trackattk
VISION
8.4.3.2 MERIT
As already mentioned, MERIT (Modeling the Reliability of Infrastructure and Timetables)
is supplied by AEA Technology (AEAT), now DeltaRail, who describe it as a ‘strategic
simulation tool’ (AEAT, 2002).
The data requirements for a MERIT run, particularly with regard to the infrastructure, are
deliberately simplified - for instance it knows the track layout of each “place” on the
network, and knows whether each line is bi- or uni-directional, but does not explicitly
know which of the physically possible routes are signalled. Junction margins are
generally somewhat simplified to reduce data preparation time and because MERIT
does not contain the data necessary to calculate junction margins from basic principles.
MERIT relies on ‘planning’ (Rules of the Plan) values for headways and junction
margins, with the technical values approximated from the planning values. It does not
simulate the traction characteristics of trains, instead assuming that the timetable
supplied as an input is achievable (before any delays are applied) for the traction types
specified. However, MERIT checks for trains which would need to exceed line speed
limits between locations in order to meet the supplied schedule and warns the user.
These simplifications increase MERIT’s speed and usability, but reduce its accuracy.
MERIT has also been known to give counter-intuitive results and the limited views of
185
results and how they were generated has not helped to build confidence in its accuracy.
The greatest strengths of MERIT are seen by its advocates to be its national coverage of
the network and timetable. The other key feature of MERIT is its link with individual,
randomly sampled incidents which cause delays to trains – whereas other systems
either require the user to undertake a pre-process to supply a distribution function or
simulate individual ‘days’ and then require the user to make assumptions about how
typical that day is.
MERIT has been used by Network Rail (and AEAT on Network Rail’s behalf) for a
number of years but has not come to be generally accepted by the UK Rail Industry, with
industry experts saying that this is because, in particular, MERIT can produce counter-
intuitive results due to it not having sufficient understanding of the infrastructure. In
March 2005, Network Rail decided to stop using MERIT.
8.4.3.3 TRAIL
TRAIL is a railway system reliability simulation tool supplied by Jardine (Jardine and
Associates, 2002). TRAIL is very different from to the other tools described here in that
its primary function is to compare scenarios relating to different asset types in the rail
industry. It can be used to a limited extent to simulate differences in infrastructure layout
or timetable but that is not what it is best suited for. TRAIL is a dynamic equipment
reliability simulator, which takes rail operations into account as far as utilising assets and
determining consequential delay due to incidents. It uses a link-node infrastructure
model.
8.4.3.4 TTRA
TTRA (Timetable Robustness Analyser ) is a Vossloh (now Funkwerk) tool that
simulates a detailed timetable over an approximate network to test timetable quality and
robustness (Stallybrass, 2002).
TTRA enables users to get a coarse indication of a detailed timetable’s performance
over an approximate network within hours. Independent assessment of TTRA suggests
186
that the model will give an accurate indication of problem areas. However, delays
calculated by the model are subject to a number of approximations. An approximation in
TTRA is the division of link sections by the number of signals to give a number of equal
length block sections. Concerns have been expressed (e.g. by Operational Planners
within Network Rail) that in heavily operated network sections this approximation could
inadequately describe headway conflicts and hence influence capacity and performance
indications.
8.4.3.5 OpenTrack
Opentrack is a detailed signal berth simulation model developed by the Institute for
Transport Planning and Systems (IVT) of the Swiss Federal Institute of Technology
(ETH Zurich). It is used by a small number of consultancies in the UK.
OpenTrack is considered by users to be a modern, easy to use detailed signal berth
simulation system. The system is viable for a detailed study and simulations of up to 20
runs but user intervention is required to separate simulation run information in different
files. It is understood that the system has been set up for multiple simulation in this
limited way because the Swiss rail system does not suffer the same amount of daily
service variance as Britain.
The main benefits of the system appear to be the user friendly interface, fast and
effective information input, detailed information being taken into account in the
simulation, RailML data files and the simulation animation.
More information can be found on the supplier’s website (OpenTrack Railway
Technology, 2008).
8.4.3.6 RailPlan
RailPlan is another detailed signal berth simulation model, which simulates
infrastructure, timetable and rolling stock information in detail (Comreco Rail, 1997).
RailPlan was first developed in 1987 and is of Swedish origin, now being developed and
sold by Funkwerk (the current owner of the York-based business that previously traded

187
as Comreco Rail and then Vossloh). In the UK, the system is mostly used by
consultancies, including Funkwerk’s own consultancy team.
Probably the key limitation of the tool is the lack of a graphical interface. It makes it
impossible to see the actual operations of trains during a simulation (although this can
be done as a ‘post process’ using a separate tool) and makes data entry difficult.
An ‘add-on’ is PowerPlan, a post-processor for RailPlan that allows the modelling of
electrical networks. Not all tools have this capability.
8.4.3.7 RailSys
RailSys is a comprehensive signal berth simulation package developed by the Institute
for Transport, Railway Construction and Operation, University of Hanover and RMCon.
It is used by Network Rail as well as a number of consultancy companies in the UK.
RailSys was the most functionally-rich railway simulation package evaluated, which
gives the user great flexibility in simulation and analysis. The user is supported with
graphics and RailSys has the best output analysis module. .csv outputs and log files are
also available. An important strength of RailSys is its sophisticated simulation algorithm,
which combines time-based and event-based techniques to avoid “deadlock” situations
during perturbed simulations. This means that RailSys can be used to rapidly simulate a
statistically valid number of stochastic simulations. Areas where some interviewees
consider RailSys as perhaps inferior to VISION or OpenTrack are the user interface for
data preparation and, to a greater extent, the graphical interface during simulation.
RailSys can be used over the whole range of timetabling and performance modelling
tasks that are required in the strategic planning environment and this has made the tool
very attractive not only to consultancies who want to have all this capability in a single
tool, but also for Network Rail’s Strategic Access Planning Team. RailSys was selected
for detailed evaluation by this team and, ultimately, purchased by Network Rail on the
basis that it was more advanced than the British tools available and that its predictive
capabilities had been satisfactorily validated in Germany (Pepworth, 2003). This team is
now makes full use of RailSys, following the decision to discontinue the use of MERIT.
188
It is believed to be now the most frequently used railway performance modelling tool in
the UK. A more detailed description is provided as part of the case study provided in the
Appendix.
8.4.3.8 TrackAttk
TrackAttk is a signal berth model developed by the Railway Consultancy (based in
London) that simulates track layout and signalling accurate to the nearest 20 metres,
while leaving out details such as gradients, curvature, setting time for signals, power,
platform lengths etc. The timetable is simulated to the level of individual trains with
planned schedules including station stops and dwell times. Rolling stock types are not
recognised other than by maximum speed and train length for each schedule. Specified
acceleration and deceleration characteristics are therefore not simulated for each train
type.
TrackAttk is therefore a simplified signal berth model, which should give users a good
understanding of operational performance of the network, although not accurate to the
nearest second. It is viewed by its suppliers as a cost effective, quick to use
performance model, which will identify problems in small network sections and provide a
reasonably accurate approximation of delay figures.
The model can be used quickly to support option assessment, with a good simulation
visualisation. However, it is not regarded as being sufficiently accurate for signalling
system design, running time calculation or performance regime cost forecasting and the
author’s understanding is that it is very little used.
8.4.3.9 VISION
VISION (Visualisation and Interactive Simulation of Railway Networks) has been until
recently the most widely used simulation package in the UK. It is the signal berth model
owned and supported by DeltaRail.
VISION is considered to have a good graphical interface during simulation and this
189
enables UK railway operators (and non railway specialists) to easily understand the
visualisation. Built-in outputs are limited however, e.g. there are no statistical analysis
graphs drawn directly by the software. The model focuses on the infrastructure design
for small network sections. This is reflected in the output format and tool features.
The main drawbacks to VISION are, however, its lack of scalability and slow simulation
run times. VISION is cumbersome to use for simulation compared with the other tools
described – this is substantially because it has lacked investment in recent years.
Rerouting is only semi-automated and the route-setting (or “dispatching”) methods are
less sophisticated than those of other tools. This is primarily because VISION is a purely
time-based incremental simulator and cannot therefore test the consequences of
decisions before making them, e.g. to check that no “deadlock” situations will occur.
Statistically valid stochastic simulation using VISION is therefore time consuming.
A detailed description of VISION is provided in Brown (2002).
8.4.3.10 Comparison
Comparisons have been undertaken by the author, judging the capability of each
simulator against the priorities recommended by the literature (see section 6.3).
Technical ‘white box’ analyses of these tools have been put alongside reviewing the
results of a number of real projects and interviews with users and procurers of
performance modelling.
The following table (the format based on Verwey’s work) attempts to provide a formal
ranking of the tools. Each tool has been scored by the author from 0 to 3 against a
number of measures for different railway simulation tasks. The highest scoring tools are
then highlighted in green for each of these tasks.

190
Table 13. Scoring for simulation software packages for typical tasks (Source: Author)
TASK
MER
IT
TR
AIL
TT
RA
Ope
ntra
ck
Rai
lPla
n
Rai
lSys
Tra
ckA
ttk
VIS
ION
Detailed layout design (requires detailed infrastructure and exact replication of UK signalling to score maximum)
0 0 0 2 2 2 1 3
Determining the effect of re-signalling on line capacity (requires detailed infrastructure and functionality to output capacity utilisation statistics)
0 0 0 3 1 3 1 3
Determine the approximate running time of specified rolling stock for a new rail extension (requires detailed infrastructure and knowledge of traction data)
0 0 0 3 3 3 1 3
Determine the effect of infrastructure expansion (new sidings, extra platforms in a station, etc) on operational capacity. (detailed infrastructure and stochastic simulation will give the most reliable answers)
1 1 1 2 2 3 2 1
Determine the effect of equipment reliability on performance (the best score will be achieved by a tool that can use equipment failure rates as an input; an above average score will be achieved by a tool that requires equipment failure rates to be pre-processed and input as distributions)
2 3 0 2 1 2 0 1
Design a new timetable for a re-franchising exercise. (a timetable editor is required to score on this task; scores of 3 are not achieved by any of the simulators – tools designed specifically for timetable development (e.g. CMS) do better)
0 0 0 2 0 2 0 0
Adjust the timetable to insert 2 extra train schedules in the peak hour timetable (simple timetable editing capability is required to score on this task)
2 0 1 3 1 3 1 0
Determine the robustness of the timetable (some stochastic simulation capability is required to score well on this task)
2 1 2 1 2 3 1 1
Design contingency plans for maintenance work (tools with functionality specifically designed to facilitate this kind of test will score best)
1 1 1 2 1 3 1 1
Simulate the high level operations of a 3 0 3 1 0 2 3 0
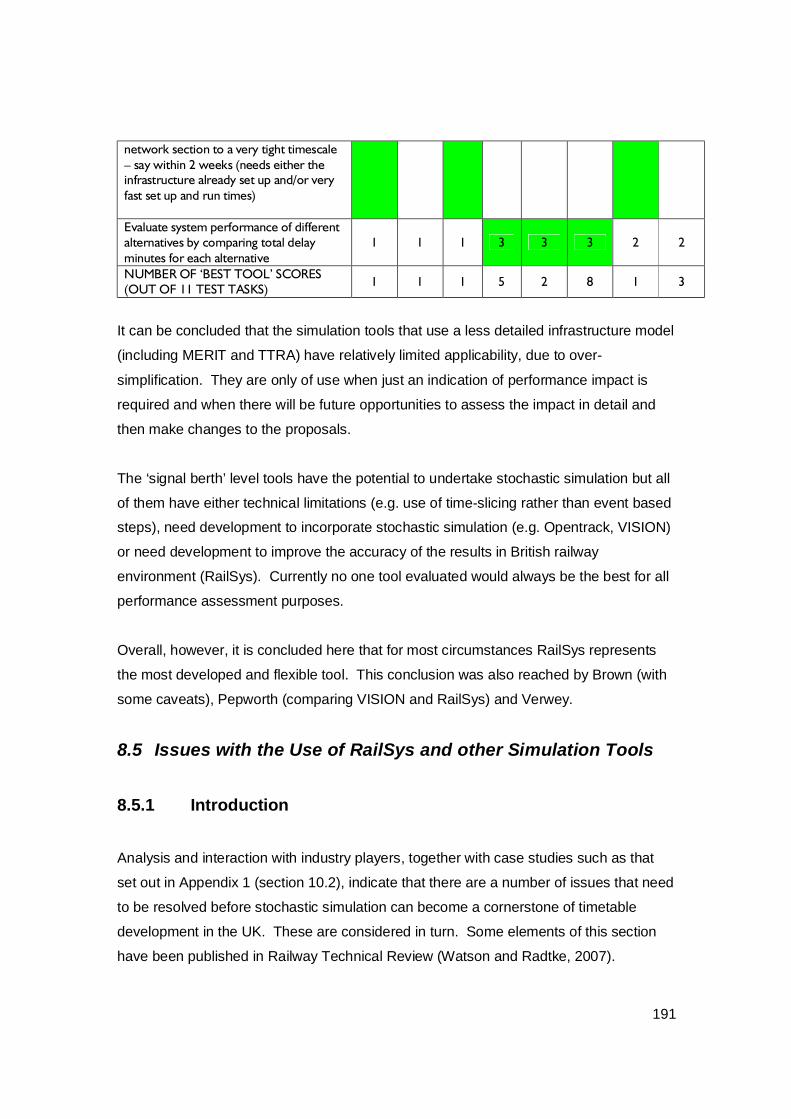
191
network section to a very tight timescale – say within 2 weeks (needs either the infrastructure already set up and/or very fast set up and run times) Evaluate system performance of different alternatives by comparing total delay minutes for each alternative
1 1 1 3 3 3 2 2
NUMBER OF ‘BEST TOOL’ SCORES (OUT OF 11 TEST TASKS) 1 1 1 5 2 8 1 3
It can be concluded that the simulation tools that use a less detailed infrastructure model
(including MERIT and TTRA) have relatively limited applicability, due to over-
simplification. They are only of use when just an indication of performance impact is
required and when there will be future opportunities to assess the impact in detail and
then make changes to the proposals.
The ‘signal berth’ level tools have the potential to undertake stochastic simulation but all
of them have either technical limitations (e.g. use of time-slicing rather than event based
steps), need development to incorporate stochastic simulation (e.g. Opentrack, VISION)
or need development to improve the accuracy of the results in British railway
environment (RailSys). Currently no one tool evaluated would always be the best for all
performance assessment purposes.
Overall, however, it is concluded here that for most circumstances RailSys represents
the most developed and flexible tool. This conclusion was also reached by Brown (with
some caveats), Pepworth (comparing VISION and RailSys) and Verwey.
8.5 Issues with the Use of RailSys and other Simulation Tools
8.5.1 Introduction
Analysis and interaction with industry players, together with case studies such as that
set out in Appendix 1 (section 10.2), indicate that there are a number of issues that need
to be resolved before stochastic simulation can become a cornerstone of timetable
development in the UK. These are considered in turn. Some elements of this section
have been published in Railway Technical Review (Watson and Radtke, 2007).
192
8.5.2 ‘Implementation’ Issues
8.5.2.1 National Infrastructure Database
There is only an emerging national infrastructure database, so any new simulation
requires either a new infrastructure model to be built from signalling plans or an existing
model to be updated and extended. Where an existing model is held in a different
format conversion is required and careful checking and amendment are needed to
ensure the model works properly in its new environment. This lack of base data in
compatible electronic form leads to simulations being expensive and time consuming to
set up.
8.5.2.2 Validation and Calibration
There is limited validation and calibration of models, partly due to the relatively recent
introduction of performance modelling (meaning that there are not as yet ‘before and
after’ actual results to compare with the model results) and partly due the UK rail
industry not being prepared to undertake ‘head to head’ comparative studies (partly for
cost reasons and partly because of vested interests by some the existing suppliers).
This has lead to results from all of the tools being challenged.
It is accepted that analysis needs to be undertaken but, at present, no way of resourcing
and funding this has been found.
8.5.2.3 User and procurer expertise
Growth in the use of stochastic simulation in the UK has led to the majority of users of
the tools (and clients seeking results from the tools) being inexperienced. This in turn
has led to examples of these sophisticated tools being used in inappropriate ways (e.g.
without appropriate delay data being used), leading to invalid results being produced.
There are examples of project managers requesting performance modelling without any
understanding of which tools are appropriate. They are generally unaware of what to
193
specify as output, how to be sure that the results delivered are appropriate and how to
incorporate this output into the project.
Both users and clients of performance models lack understanding of the statistical
principles underlying stochastic simulation – this leads to modellers not using the models
appropriately and clients not understanding what the results mean.
Clients and project managers are insufficiently aware of all the performance modelling
packages available and their various strengths and weaknesses.
All of these issues can be overcome in time through appropriate training and
development of modellers.
8.5.2.4 Modelling Standards
There is a lack of standards as to how the models should be set up and run, with
different organisations setting up their models in different ways and then arguing over
which way is appropriate. A range of areas lack standard parameters, e.g. what braking
curves should be used, how best to represent driving practice and signaller actions, the
number of simulation runs that should be undertaken in different circumstances, how to
model specific ‘worst cases’. The author of this thesis is currently working with Network
Rail to develop appropriate standards.
8.5.3 Technical Issues
Perhaps of most interest to researchers, there are a number of limitations within the
modelling tools currently available which either restrict the nature of problems that they
can address or which impact on the quality of the results.
8.5.3.1 Cancellation and ‘terminating short’
A particularly important example is the inability of stochastic simulators, as currently
available in the UK, to cancel or ‘terminate short’ trains when this is the appropriate
regulation decision to make. This means that these simulators cannot easily be used to
194
assess the delays which will occur when major disruption occurs. As a small number of
major disruptions can cause more delay on a route than a large number of small failures,
this is an area which needs research and development to enable a better estimation of
the overall performance impact of timetable or infrastructure changes.
8.5.3.2 Representing UK driving practices accurately
‘Defensive’ or ‘professional’ driving has been introduced in the UK over the last few
years as one of a series of actions to reduce the number of SPADS (signals passed at
danger). Drivers are now trained to brake earlier and to approach red signals and
stations very slowly. This has had the practical effect of reducing capacity and increasing
journey times and makes using standard braking rates within modelling tools inaccurate.
Tools (such as RailSys) which have a range of signalling and braking options will give a
better result, but more analysis is required.
8.5.3.3 Representing en route delay accurately
The UK has more en route infrastructure failures, e.g. track circuit failures, temporary
speed restrictions, than many other countries and simulators from abroad tend to focus
delays more on station areas.
In addition, some simulators do not have the capability to apply delays to a number of
trains in a row as part of the Monte Carlo sampling of delay data, e.g. where a track
circuit failure causes a number of trains in a row to be brought to a stand to be cautioned
by the signaller.
8.5.3.4 Representing signaller/signalling systems accurately Replication of signaller or ARS/ATC (automatic route setting/automatic train control)
actions is often constrained, with the modeller having limited options. Circumstances
have arisen where a more sophisticated ‘despatch’ function is needed to enable the
modeller to set up priorities in the modelling tool which reflect how the signaller regulates
trains, in reality.
195
8.5.4 Where Next for Simulation?
8.5.4.1 Addressing the issues
Researchers, consultancies and the railway companies need to cooperate to ensure the
issues described above are analysed and appropriate solutions produced.
8.5.4.2 Use of heuristics alongside simulation
Simulators for the most part require a complete timetable and resource plan as inputs.
Tools are required, either separate or integrated into a suite of tools with a performance
simulator, to turn specifications provided by railway marketing people into detailed
timetables. Some tools are already being developed or extended to do this and at least
are seeing some live use, e.g. AEAT’s Planning Timetable Generator – see Chapter 7
and Watson, 2006, RMCon’s ‘train slot search’ – see Klemenz and Schultz (2007), and
Eurobios’ Railway Timetable Optimiser, see Eurobios (2007).
8.5.4.3 Part of the annual timetabling process?
Some thought is now being invested by the author, working with Network Rail, as to
whether it might be possible to use stochastic simulation as part of the annual timetable
development process rather than it being specifically a strategic planning tool. Some
years ago it was accepted that the ‘objective should be for every timetable to be
stochastically simulated before being signed off’ (Network Rail Operational Planning
Business Improvement Design Group, 2002) and so it is clear that senior management
within Britain’s rail industry understands the benefits of assessing the likely performance
of the annual timetable before it is implemented. However, analysis demonstrates that
there are a number of process and technical issues to be resolved before this can
become reality.
To be of value, stochastic simulation has to deliver the following, when compared with
current ‘expert judgement’: better train running performance, which all industry players
want, and better use of capacity, i.e. the potential to run more trains at an acceptable
level of performance, a key objective for government. It has to deliver these benefits at
196
an acceptable implementation and on-going resource cost and in an acceptable
timeframe.
A number of ‘precursors’ to the use of stochastic simulation in the annual timetabling
process have been found:
• Firstly, a national infrastructure model is needed or at least one that covers all
the main lines (some lightly used lines have insufficient traffic to warrant
simulation). Network Rail has now funded a substantial model building,
conversion and update programme is needed, so that by some time in 2009 the
lack of ready-built infrastructure will no longer be an issue;
• Standard automated routines are needed for delay data analysis and input,
together with the validation of the base model that is required before variations
can be run. Again, progress is being made, with Network Rail having developed
semi-automated delay day analysis tools and most main lines now having fully
validated base models;
• Users only become expert over time, using the chosen tool full time and for some
time (many months). A substantial group of UK users needs to be trained and
retained. The kind of people who make good modellers are in short supply and,
to date, Network Rail has had trouble retaining them, once trained. On-going
coaching will be required from a limited pool of real expert modellers;
• Limitations in the tools which require manual intervention need eliminating.
Examples of these problems include fully replicating signaller practice and
handling ‘joining and splitting’ of trains. Without these substantially resolved,
results will not be achieved sufficiently quickly to influence the timetable under
development.
• A key issue, without as yet a worked through solution is how to deal with
incompleteness in the timetable being input to the simulation tool. Typically,
during the timetable development process the following ‘incompleteness’ issues
will arise; very often, freight services will not be in the timetable or, if they are,

197
they will not have been ‘conflict resolved’ (i.e. there will still be theoretical
‘clashes’ between passenger and freight trains); platforming at key stations will
be incomplete; associations between trains (where one train working then forms
another) will not be explicit. In addition, current data exports from the main
timetabling tool (TrainPlan) are not complete, in particular routing of trains is
often not clear - current RailSys import needs manual work arounds and pre-
processing.
8.6 Conclusions
Performance modelling of railway timetables is being undertaken more and more by and
for the British industry. Much analysis has been undertaken of the various tools
available and their strengths and weaknesses and the level of understanding about
these tools and their capabilities, whilst still low, is improving. It is beginning to become
clear in Britain that RailSys will be the dominant tool going forward, but with other
packages being used where they are more appropriate, because RailSys’ functionality
does not match well with the business need.
A number of issues with simulation tools in general have been described and where a
way forward has become clear this has been set out. A number of issues require further
study and the development of technical solutions.
198
9 CONCLUSIONS
9.1 Purpose of this chapter
This chapter demonstrates that the aims and objectives set for the research have been
met and the author then discusses the extent to which the methods adopted have
proved appropriate.
Conclusions and recommendations for further work are then brought together. Finally
the value of the research is assessed, measured against the extent to which it has
contributed to the body of knowledge in the area of train planning.
9.2 Have the Aims and Objectives been met?
Three aims were set for this research (chapter 1):
• Firstly the researcher aims to analyse the processes which are used to develop
train plans and the extent to which they meet the objectives that they might be
expected to meet;
• Secondly, the researcher aims to understand the impact that privatisation of the
railways in Britain has had on train planning processes;
• Thirdly, the researcher aims to investigate selected new and innovative software
approaches that might make a material difference to the effectiveness and/or
efficiency of train planning processes.
Train Planning processes have been described and key factors and issues analysed in
chapters 3 and 4. The objectives that they should meet have been collated in chapter 5
and a qualitative assessment made of the extent to which these objectives are being
met.
199
The second aim is addressed in chapter 4, where the impact that privatisation of the
railways in Britain has had on train planning processes is described in detail and it is
concluded the impact is substantially negative.
After an introductory chapter on train planning systems (chapter 6), two key areas have
been investigated in which software can better support train planning processes –
timetable generation (chapter 7) and timetable performance simulation (chapter 8). In
each area, after a general description of the problem that the software seeks to address,
case studies using the most developed software in the area have been set out and
analysis has been undertaken of the issues and challenges with using the software to
meet train planning objectives successfully.
It is contended that the aims set have been achieved, to the extent possible within the
relevant resource and time constraints.
A number of more detailed objectives were set out in the first chapter. These are now
considered in turn.
1 To describe train planning processes at a high-level and to discuss generic
issues with these processes
Chapter 3 described train planning processes, with charts and descriptions
setting out the high level process and discussing some of the key stages
(particularly timetabling) in more detail. Generic issues discussed were the
importance of iterations to improve the solution and complexities in the process,
both physical and organisational. A comparison with manufacturing process
scheduling was also undertaken to gain some understanding as to whether train
planning processes are unique, concluding that this is not the case - there are
significant similarities.
2 To describe the timetabling processes as they existed in the UK prior to
privatisation.
These were described in chapter 4 (4.3), with the importance explained of the
200
hierarchical ‘first on the graph’ principle to the satisfactory operation of train
planning processes.
3 To describe how the processes changed at the point of privatisation and to
assess the issues that the new processes created
The new processes introduced with privatisation were described in chapter 4 (4.4
to 4.7). The significance of the split of timetabling tasks between Railtrack and
Train Operators and the large number of ‘iterations’ between these organisations
proposed was explained. Whilst a good fit was achieved between the new
processes and the high level objectives for privatisation set by government, the
‘Peterborough Process’, as it became known, was never fully implemented, and
the ‘watered down’ version of it still had many problems and was unfavourably
compared with pre-privatisation processes in terms of efficiency and
effectiveness.
4 To describe how the processes have subsequently evolved and to assess the
extent to which they are now ‘fit for purpose’
The evolution of processes since privatisation were described, along with
emerging problems and remaining issues, in chapter 4 (4.8 to 4.11).
5 To understand the objectives that train planners should be attempting to meet
In chapter 5 (5.4) a review of high level objectives for the key organisations was
synthesised into a set of objectives for train planning.
6 To understand what railway practitioners (timetablers and managers) think needs
to be done to improve train planning processes
In chapter 5 (5.5) results of interviews with railway practitioners have been
synthesised into a set of priorities for improvements needed to train planning
processes.
201
7 To describe the current role of software in supporting timetabling processes
Chapter 6 (6.4) delivers this objective.
8 To understand the key gaps in software support
Chapter 6 (6.5) describes the limitations of current software and sets out the
gaps that need filling.
9 To investigate selected promising software avenues for making a material
improvement to the quality of the efficiency and effectiveness of train planning
Chapter 7 has been used to investigate timetable generation and optimisation
and Chapter 8 covers timetable simulation, both of which offer considerable
potential for improving the efficiency and effectiveness of train planning.
9.3 Have the Methods adopted proved Appropriate?
As Gill and Johnson (2002) point out, choice of research methods is always a
compromise, often influenced by resource availability. The breadth of the aims and
objectives inevitably ruled out quantitative methods of analysis because they required
large amounts of data collection and analysis. The decision to use qualitative and case
study methods in turn inevitably limits the opportunities to generalise. It also makes it
hard to prioritise, e.g. which software improvement might give the biggest benefit?
It would seem appropriate to ask the question ‘how else could the aims and objectives
have been better met, given the resources available?’. It is not obvious that alternative
methods would have better met the aims and objectives. More depth in some areas
would inevitably have meant less in others.
202
9.4 Train Planning Processes – Conclusions and
Recommendations for Further Work
In chapter 3, looking at train planning processes, it was concluded that train planning is
always going to be complex in nature but that analysis can help by explaining some of
this complexity and pointing towards areas for process improvement.
It can be expected that these conclusions are applicable to processes that take place in
different contexts. Research undertaking more comparative analysis would be very
beneficial, both with similar processes in other industries and the train planning process
used in other countries.
In chapter 4, it was concluded that the restructuring and subsequent privatisation of
British Rail had an adverse effect on the output achieved from the timetabling and
resource scheduling processes. It was suggested that several possible factors were at
play. Management attention may have been diverted from day to day issues to the
major reorganisation task, key personnel may have been displaced or retired and/or it
may be that the nature of the restructuring undertaken was not conducive to effective
train planning. Undoubtedly the first two factors played a part – however these were not
investigated in this research. There is an important area here for further research.
The author of this thesis focused on processes and systems and attention has therefore
been concentrated on the effect of the third factor. It has been concluded that the new
structure imposed on the industry in Britain by the Railways Act 1993 has hindered the
development of effective timetables and resource plans by creating an artificial boundary
in the middle of what needs to be a seamless process.
It has also been concluded that, whilst the changes made since the initial process was
introduced at privatisation have improved the timetables delivered, there is still much to
be done before the process can be considered as truly ‘fit for purpose’.
Overall it is evident that better planning prior to privatisation, together with more realism
as to what was practically possible, could have made the transition far less traumatic
203
than it was. This conclusion is of considerable importance to governments and other
railway administrations that might be planning railway privatisation.
With other nationalised railways now being restructured and privatised across Europe,
research is needed to see whether the same problems are emerging and whether the
lessons learnt in the UK are directly transferrable.
The case specific nature of the research presented in this thesis means that attempting
to make generalisation outside railways requires caution. Having said this, it is clear that
the conclusion that serious problems are likely to result from poor planning and rushed
implementations with processes not redesigned to match with new organisational
structures is transferable to other sectors and other circumstances.
Chapter 5 considered objectives for railway organisations regarding train planning.
Conflicts between objectives were noted and it was concluded that there is a need for
elimination of these conflicts and/or the development of formal trade-off mechanisms.
Investigating ways to eliminate conflicts between organisational objectives (e.g. between
government’s desire for low subsidy and train operators’ objective of profit maximisation)
has had to be excluded from the scope of this thesis. Strategic research is now needed
to investigate the extent to which conflicting objectives are inevitable or whether it is
possible to better align objectives whilst involving the private sector.
9.5 Train Planning Systems – Conclusions and
Recommendations for Further Work
In Chapter 6 it was concluded that there is a considerable need for improved software to
support train planning processes. It was noted that even basic data management tasks
are not fully automated.
It has been necessary in this thesis to select specific areas for detailed investigation
(timetable generation and timetable performance simulation) and research and
development is needed in many other areas, from relatively straightforward data
204
management methods and software, through better optimisation tools for all the process
steps, to the development of process-wide optimisation tools that integrate timetabling,
rolling stock diagramming and train crew diagramming.
Timetable generation software was discussed in Chapter 7. It was concluded that
timetable generation software has, in principle, considerable application but that to date
software of this type has not proven successful ‘in the field’.
Lessons of general applicability from this chapter are the challenges of implementing
sophisticated software in complex processes and the importance of undertaking
research and development for this kind of software in close communication with users,
so as to ensure that it meets their needs.
Further research work is now needed to develop timetable generation heuristics and the
associated software.
Not covered in this thesis, but of considerable importance to users, is the issue of
implementation. This warrants further analysis, possibly along the lines adopted by Eibl
(1996). It would also be beneficial for analysis to be undertaken to assess over what
timescales organisations should reasonably expect software enhancements to be
developed and implemented and to develop better metrics to help define what level of
funding is likely to be required to achieve particular results.
Chapter 8 investigated the use of simulation to assess the performance of railway
timetables. Analysis of the various tools available led to conclusions as to which tool
was most likely to be appropriate for particular types of study.
A number of issues with simulation tools in general have been described and, where a
way forward has become clear, this has been set out. A number of issues, for instance
the ability to simulate days when primary delay is very significant, require further
research.
For both timetable generation and simulation, more case studies should be undertaken
by different researchers using different software, to validate further the conclusions
205
reached in this research and to explore the extent to which the conclusions can be
generalised.
9.6 The Value of the Research Undertaken
The research that has been the basis of this thesis has contributed to the body of
knowledge in the area of train planning in a number of ways:
• Train planning processes have been documented in outline and the timetable
development process documented in detail, providing a ‘way into’ this complex
area for other researchers and students;
• The effectiveness of train planning processes has been analysed, providing a
baseline for the assessment of future developments;
• The impact of changes in industry and organisational structures on train planning
processes in the UK has been analysed. It is hoped that this analysis will enable
railways who are following similar structural changes to make less mistakes than
were made in the UK;
• High level objectives for train planning have been collated and categorised. This
is now available to assess the achievement of train planning processes and
systems. It can also be used to inform the development of objective sets for
timetable generation and optimisation;
• The needs of railway managers and train planners for better software have been
collected, collated and documented. This can be used to inform both
researchers and commercial software developers about where their attentions
should be addressed;
• The use of heuristics to permit automated timetable generation and optimisation
has been analysed in detail and a range of recommendations have been made
for further research and development;
• The use of simulation to assess timetable performance has been investigated in
detail; again a range of recommendations have been made for further research
and development.
Papers have been published in academic journals or presented at academic

206
conferences to disseminate much of the analysis undertaken.
Of all the work undertaken, which does the author regard as the most significant?
Without doubt, the analysis of the use of heuristics to permit automated timetable
generation and optimisation. Although the results of the appraisal of PTG indicated that
more work is necessary before it can play a key role in supporting train planners, the
principle has been demonstrated. This appears to be a key area in which researchers
could provide early benefits to the effectiveness of train planning and the author believes
that the documentation of the issues to be resolved provides a firm base for that
research and development.
207
10 Appendix 1 – Case Studies 10.1 PTG Case Study - Brighton Main Line
10.1.1 General description
One of the uses to which PTG has been put was to assess the feasibility of operating the
‘standard’ Sunday timetable when engineering work reduces the number of tracks
available on certain stretches of the London to Brighton main line from four (two each
way) to two (one each way). The scale of this problem would represent a significant
challenge to conventional approaches. Some 68 trains were involved in the ‘standard
hour’ service, although some of these are making crossing moves and therefore were
only on the route for a short distance. The network considered comprised the full route
from London to Brighton (51 miles), with all tracks that could be used by passenger
trains included in the data. This study was undertaken jointly by Railtrack and AEA
Technology Rail and the outputs from PTG passed on for analysis.

208
Figure 17: PTG Case Study 1 Model Area (screenshot from the NID)
Figure 18: Screenshot from the NID showing the level of detail held within the National Infrastructure Database
209
10.1.2 Preparation
Before any data input was undertaken, the analyst who undertook the study talked at
length to staff who understood the commercial requirements for the various trains on the
route. Some of these were:
• A regular 15 minute interval ‘fast’ service was required, made up of train to key
destinations;
• Airport express trains were to have ‘clockface’ regular interval times (in effect
they could not be changed from the existing timetable);
• Trains running through London Bridge station to north London should not have
their times in the north affected at that station or beyond, to avoid consequential
effects on services outside the scope of the study;
• Certain turnarounds and connections were required.
It was at this stage that bounds were put on the network to be assessed and
simplifications agreed; in addition the restrictions to be placed on the use of the network
by engineering work were agreed.
Infrastructure data and the current timetable were then input to the system, the trains
being manually edited where required to pass on the two tracks not affected by
engineering work and the commercial aspirations placed against each train in the form of
weightings.
This preparatory work took 4 to 5 man days to complete, of which perhaps half might be
attributed to the need for the staff involved to acclimatise themselves to this new
approach.
10.1.3 Running PTG
Over the next 5 days (elapsed time rather than man days) 18 separate runs were
undertaken. Considering 300,000 different timetables took a little over ½ an hour;
900,000 different timetables took about an hour and a half; greater numbers of iterations
were run overnight. The machine used had a Pentium II chip and hence greater speed
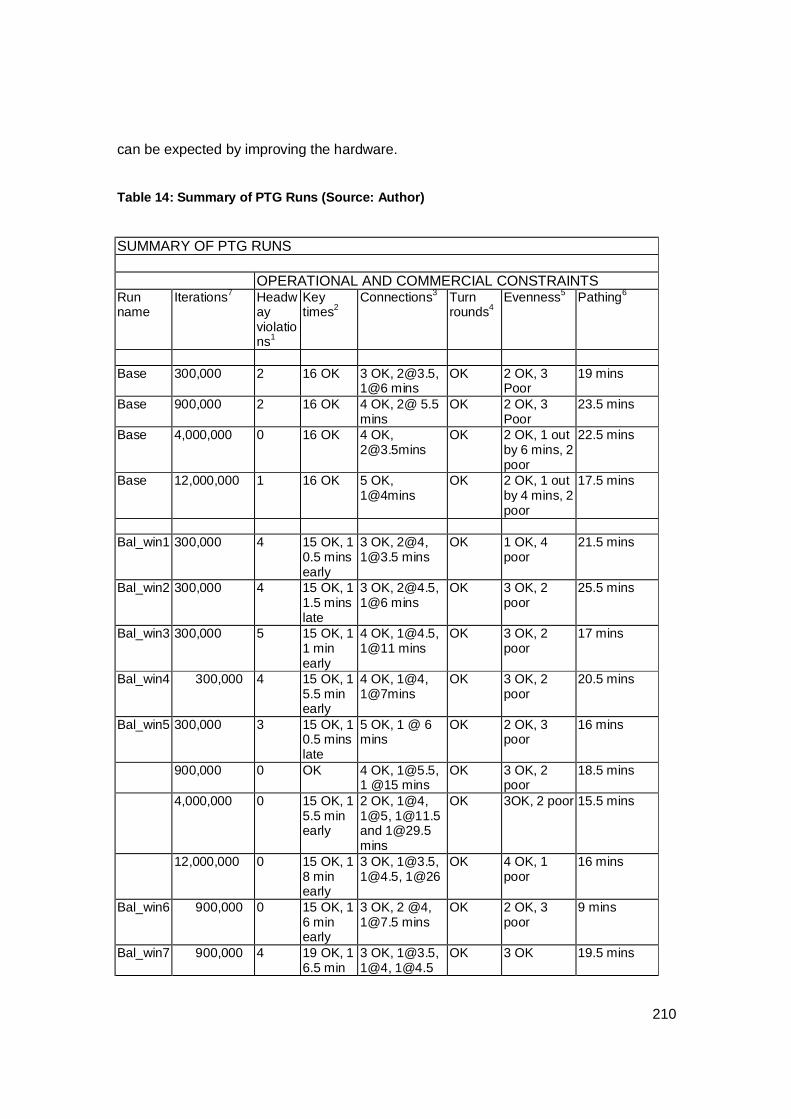
210
can be expected by improving the hardware.
Table 14: Summary of PTG Runs (Source: Author)
SUMMARY OF PTG RUNS OPERATIONAL AND COMMERCIAL CONSTRAINTS Run name
Iterations7 Headway violations1
Key times2
Connections3 Turn rounds4
Evenness5 Pathing6
Base 300,000 2 16 OK 3 OK, [email protected],
1@6 mins OK 2 OK, 3
Poor 19 mins
Base 900,000 2 16 OK 4 OK, 2@ 5.5 mins
OK 2 OK, 3 Poor
23.5 mins
Base 4,000,000 0 16 OK 4 OK, [email protected]
OK 2 OK, 1 out by 6 mins, 2 poor
22.5 mins
Base 12,000,000 1 16 OK 5 OK, 1@4mins
OK 2 OK, 1 out by 4 mins, 2 poor
17.5 mins
Bal_win1 300,000 4 15 OK, 1
0.5 mins early
3 OK, 2@4, [email protected] mins
OK 1 OK, 4 poor
21.5 mins
Bal_win2 300,000 4 15 OK, 1 1.5 mins late
3 OK, [email protected], 1@6 mins
OK 3 OK, 2 poor
25.5 mins
Bal_win3 300,000 5 15 OK, 1 1 min early
4 OK, [email protected], 1@11 mins
OK 3 OK, 2 poor
17 mins
Bal_win4 300,000 4 15 OK, 1 5.5 min early
4 OK, 1@4, 1@7mins
OK 3 OK, 2 poor
20.5 mins
Bal_win5 300,000 3 15 OK, 1 0.5 mins late
5 OK, 1 @ 6 mins
OK 2 OK, 3 poor
16 mins
900,000 0 OK 4 OK, [email protected], 1 @15 mins
OK 3 OK, 2 poor
18.5 mins
4,000,000 0 15 OK, 1 5.5 min early
2 OK, 1@4, 1@5, [email protected] and [email protected] mins
OK 3OK, 2 poor 15.5 mins
12,000,000 0 15 OK, 1 8 min early
3 OK, [email protected], [email protected], 1@26
OK 4 OK, 1 poor
16 mins
Bal_win6 900,000 0 15 OK, 1 6 min early
3 OK, 2 @4, [email protected] mins
OK 2 OK, 3 poor
9 mins
Bal_win7 900,000 4 19 OK, 1 6.5 min
3 OK, [email protected], 1@4, [email protected]
OK 3 OK 19.5 mins
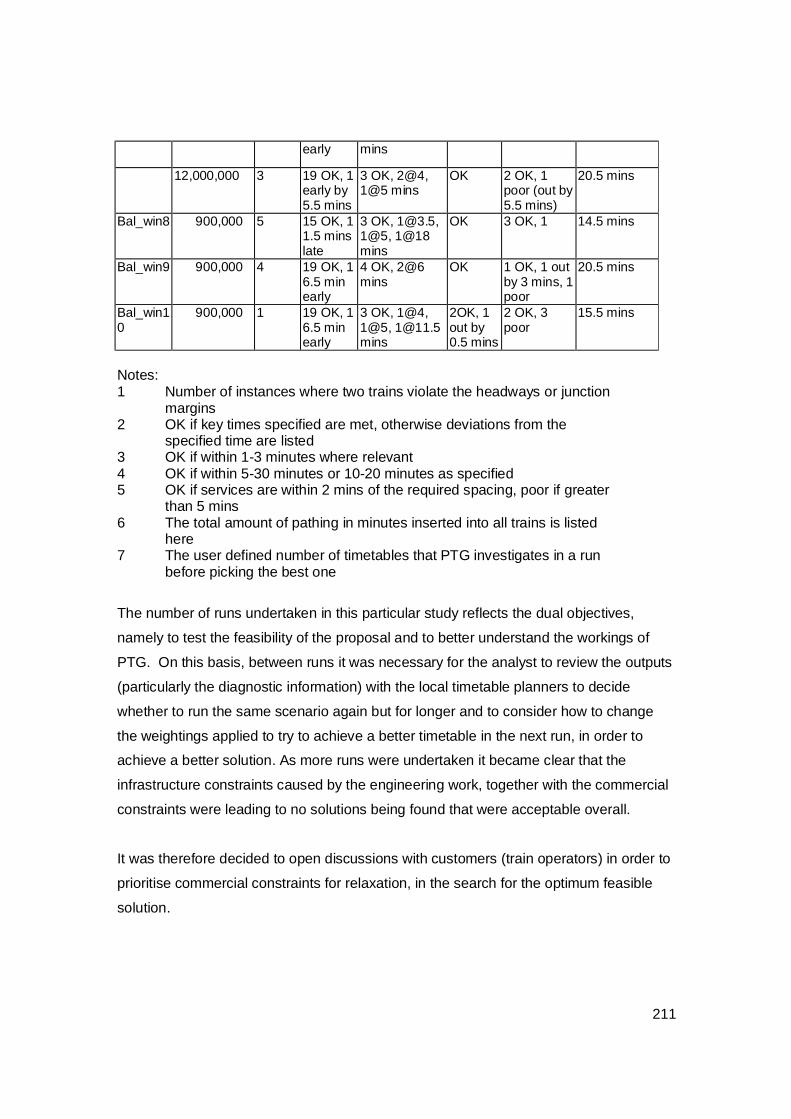
211
early mins
12,000,000 3 19 OK, 1 early by 5.5 mins
3 OK, 2@4, 1@5 mins
OK 2 OK, 1 poor (out by 5.5 mins)
20.5 mins
Bal_win8 900,000 5 15 OK, 1 1.5 mins late
3 OK, [email protected], 1@5, 1@18 mins
OK 3 OK, 1 14.5 mins
Bal_win9 900,000 4 19 OK, 1 6.5 min early
4 OK, 2@6 mins
OK 1 OK, 1 out by 3 mins, 1 poor
20.5 mins
Bal_win10
900,000 1 19 OK, 1 6.5 min early
3 OK, 1@4, 1@5, [email protected] mins
2OK, 1 out by 0.5 mins
2 OK, 3 poor
15.5 mins
Notes: 1 Number of instances where two trains violate the headways or junction
margins 2 OK if key times specified are met, otherwise deviations from the
specified time are listed 3 OK if within 1-3 minutes where relevant 4 OK if within 5-30 minutes or 10-20 minutes as specified 5 OK if services are within 2 mins of the required spacing, poor if greater
than 5 mins 6 The total amount of pathing in minutes inserted into all trains is listed
here 7 The user defined number of timetables that PTG investigates in a run
before picking the best one
The number of runs undertaken in this particular study reflects the dual objectives,
namely to test the feasibility of the proposal and to better understand the workings of
PTG. On this basis, between runs it was necessary for the analyst to review the outputs
(particularly the diagnostic information) with the local timetable planners to decide
whether to run the same scenario again but for longer and to consider how to change
the weightings applied to try to achieve a better timetable in the next run, in order to
achieve a better solution. As more runs were undertaken it became clear that the
infrastructure constraints caused by the engineering work, together with the commercial
constraints were leading to no solutions being found that were acceptable overall.
It was therefore decided to open discussions with customers (train operators) in order to
prioritise commercial constraints for relaxation, in the search for the optimum feasible
solution.
212
10.1.4 Conclusions
After the initial time spent on data input, a wide variety of timetables were generated in a
short space of time. This quickly confirmed that with the number of trains specified, all
the commercial requirements could not be met. In addition, further runs provided the
evidence needed to go back to the train operators to set out what could be achieved,
either with compromises in the commercial requirements or in the number of trains to be
run each hour.
Overall the use of PTG was regarded as a success on this project, as it demonstrated
that the original specification could not be met and enabled Network Rail and its
customers to focus on options that could be achieved.
10.2 RailSys Case Study - ERTMS
10.2.1 Introduction
ERTMS (European Rail Traffic Management System) is an advanced train control
system which provides Automatic Train Protection (ATP), together with potentially more
capacity from the existing track configuration. It will eliminate, when fully implemented,
most Signals Passed at Danger (SPADs) and increase capacity, particularly at
bottlenecks. There are different levels of ERTMS systems, depending on whether
lineside signals are eliminated through the use of radio communication and ultimately
the elimination of fixed signalling sections through the adoption of ‘moving block
signalling’. See Hall (2003), Rail Safety (2003), UNIFE (2007) for introductory
descriptions of ERTMS.
This study was undertaken for the National ERTMS Project (NEP), an SRA project, to
obtain an indication of the benefits of ERTMS System D (level 2) on a congested
commuter railway. System D uses fixed block sections but does not have lineside
signalling. In-cab signalling enables shorter block sections than is practicable with
drivers having to ‘read’ fixed signals and eliminates the impact of sighting distances, as
drivers can be advised immediately of any change in signal aspect ahead. The study

213
was also to intended to demonstrate the suitability of the RailSys simulation tool for
studies of this type. Because of the limited time available for the study, to meet NEP
deadlines, only a small number of options were considered and analysis time was short.
Hence a number of questions that arose during the analysis had to be left only partially
answered.
RailSys was operated by Ian Bradshaw for this study.
The route between London Victoria and East Croydon was chosen for the study as it is a
busy commuter route. Indeed the model incorporates more than 1700 trains in a single
day with 30 trains, one every two minutes, arriving in Victoria in the peak hour). There
are a number of busy junctions and stations in the model area.
The remit consisted of the following options:
• Running the current timetable on the current infrastructure, to validate the model
and provide a base case;
• Running the current timetable on an ERTMS infrastructure, with a limited number
of additional blocks added at 3 key pinch points (Victoria, Balham, East
Croydon);
• Adding in trains in the peak periods on the ERTMS infrastructure (whilst leaving
existing trains untouched) to assess the extent to which additional services would
‘soak up’ the performance gains from the introduction of ERTMS;
• Additional blocks at further locations (Windmill Bridge Junction and Clapham
Junction);
• ‘Unconstrained’ platforming at Victoria.
10.2.2 Detailed Description of RailSys
RailSys is a railway timetable and infrastructure simulator that was developed initially by
Hanover University and is now developed and marketed by the spin-off company
RMCon. It has been widely used for a number of years in Northern Europe and also in
Australia. A number of UK consultancies have now purchased the software and
Network Rail, following an extensive comparison between Vision and RailSys (Pepworth
2003), has chosen the latter as its standard package.
214
RailSys has two in-built simulation tools:
• Simulation of the ‘nominal’ timetable;
• Multiple simulation.
Nominal timetable
The nominal timetable simulator can be used to highlight direct conflicts between trains
as a result of inaccuracies or lack of precision in the scheduled timetable. Conflicts
include headway conflicts, double occupation or crossing conflicts as well as any
incidence where a train driver will see and react to a restrictive aspect signal.
The nominal timetable simulator is only suitable for:
• Running time analyses for future infrastructure and rolling stock;
• Headway calculations and capacity analyses;
• Feasibility studies where performance prediction is not immediately required, for
example timetable construction reflecting future infrastructure;
• Modelling and testing of current and future timetables for conflicts;
• Certain types of what-if-analyses, for example track possessions.
Multiple simulation
Delays on railways can be replicated reasonably reliably by using multiple simulation
techniques. The modelling work starts by setting up delay distributions representing
primary failure rates at locations in a study area and at the entry points to the area.
These distributions are then sampled using the Monte Carlo statistics principle. The
multiple simulation tool within RailSys creates a number of timetables to be perturbed by
overlaying these samples of primary delay. Simulating these timetables gives
punctuality results for, in effect, a range of possible operating days with different primary
delays and hence different secondary delays.
The number of timetables, required in a multiple simulation run to provide a good level of
215
likelihood that the overall average delay reflects reality, can vary between 30 and 250,
depending on the nature of delays in the study area and the complexity of the network
and timetable. Higher levels of congestion usually require higher numbers of runs as
overall delay levels can be more sensitive to small changes in primary delay.
The Multiple Simulation tool can be used for:
• Bottleneck analyses of infrastructure and/or timetables;
• Understanding the knock on impact of delays;
• Evaluating robustness and quality of the modelled system;
• Comparing and evaluating different infrastructure and timetable versions.
Outputs
After simulation the results can be evaluated in RailSys’ internal application performance
evaluator. Results can be filtered, and a wide range of information can be extracted
including the following:
• Arrival and Departure Delays - RailSys computes delays considering the arrival
or departure of trains at each station in the network;
• Additional Delays - The increase or decrease of secondary delays between two
adjacent stations;
• On Time Running Performance - Each station can be evaluated in respect of the
on time running of train types;
• Number of Delayed Trains - The number of delayed trains and the delay per
delayed train can be computed for every station;
• Number of Operational Manoeuvres - RailSys counts the operational
manoeuvres in each station during a simulation;
• Block Occupation - The block occupation by trains during the simulation of a
timetable can be used to describe the use of each block in the railway network
statistically.
216
10.2.3 Scope and Set Up of the Model
10.2.3.1 Infrastructure set up
The infrastructure model used by RailSys can be populated either by manual input from
signalling diagrams or through conversion from a different signal-berth level model. For
this particular case study, up to date infrastructure data in VISION format was provided
by Network Rail, Southern Region. RMCon (the supplier of RailSys) undertook the
conversion to RailSys and then this raw conversion had added to it the extra data not
provided in the Network Rail model (e.g. routing). Signalling diagrams were not supplied
and so this level of validation was not possible.
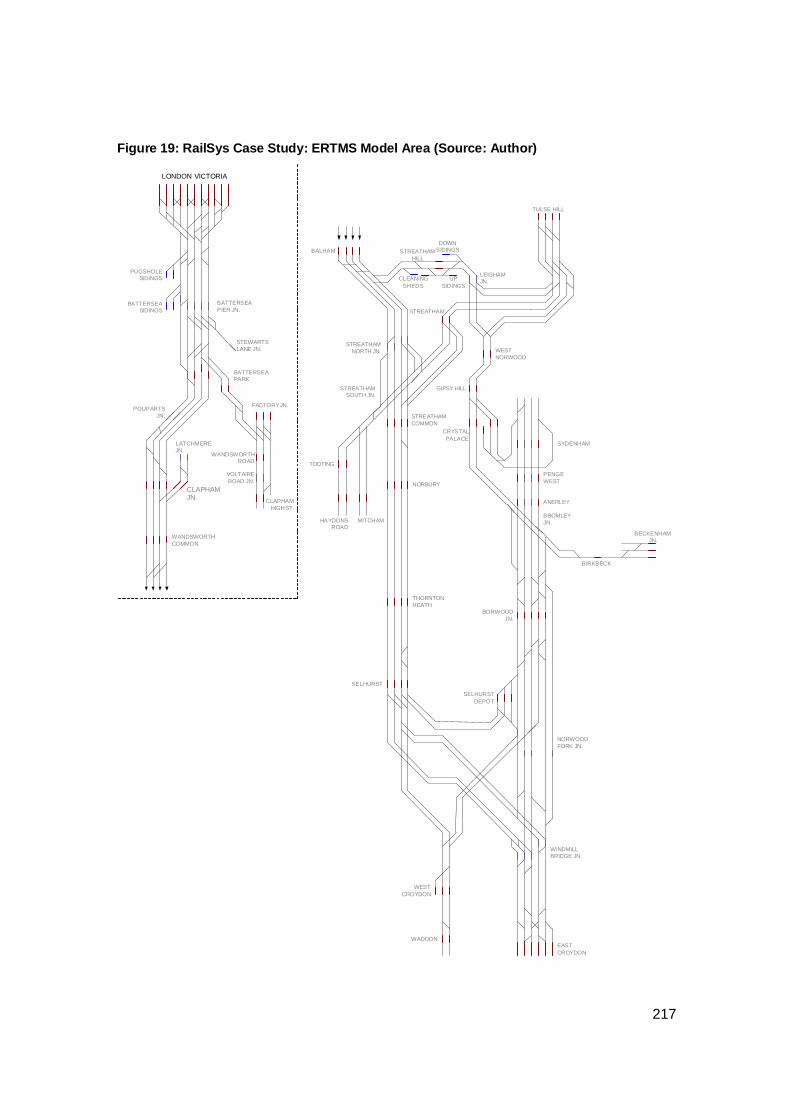
217
Figure 19: RailSys Case Study: ERTMS Model Area (Source: Author)
LONDON VICTORIA
BATTERSEAPARK
STEWARTSLANE JN.
BATTERSEAPIER JN.
BATTERSEASIDINGS
PUGSHOLESIDINGS
POUPARTSJN.
FACTORY JN.
WANDSWORTHROAD
VOLTAIREROAD JN.
CLAPHAMHIGH ST.
LATCHMEREJN.
CLAPHAMJN.
WANDSWORTHCOMMON
BALHAM STREATHAMHILL
CLEANINGSHEDS
UPSIDINGS
DOWNSIDINGS
LEIGHAMJN.
TULSE HILL
STREATHAM
WESTNORWOOD
STREATHAMNORTH JN.
STREATHAMSOUTH JN.
STREATHAMCOMMON
GIPSY HILL
CRYSTALPALACE
TOOTING
HAYDONSROAD
NORBURY
SYDENHAM
PENGEWEST
THORNTONHEATH
BROMLEYJN.
ANERLEY
BIRKBECK
BECKENHAMJN.
BORWOODJN.
SELHURST
SELHURSTDEPOT
NORWOODFORK JN.
WINDMILLBRIDGE JN.
WESTCROYDON
WADDONEASTCROYDON
MITCHAM
218
10.2.3.2 Timetable preparation
Trains were added using a series of files containing weekday train records (known as
CIFs – common interface files) provided by Network Rail, Southern Region, for Winter
2002-03 including all passenger trains, all timetabled empty stock workings and freight
trains. The Winter timetable period was used because performance data for the period
March to May is regarded as more representative than for the Summer period.
Performance is typically better in Summer due to less bad weather problems, except for
problems caused by excessive heat, and there are fewer commuters travelling.
The CIFs were converted using RMCon’s import software. A number of complexities in
the CIFs led to considerably more manual amendment being necessary than expected,
in particular due to reuse of train IDs and multiple variants of trains for different days of
the week (the import routine is being improved to eliminate these problems in future).
The density of the train service and the fact that some paths (in particular, as is common
practice, empty stocks) appear not to have been fully validated by the Region, led to a
considerable number of timetable ‘conflicts’ within the model that had to be eliminated.
This was achieved by moving the trains the minimum number of seconds necessary.
The high capacity utilisation on this route was confirmed by the fact that moving some
trains just a few seconds led to knock-on conflicts.
All train movements on the main running lines and stations within the geographic model
were included in the simulation. Train movements to and from yards and sidings onto
and from running lines were modelled but train movements within yards and sidings
have been not been simulated.
10.2.3.3 Performance data input
Performance data for period 11 2002-2003 was provided for the model area by Network
Rail, Southern Region, with initial analysis being undertaken by the ERTMS team.
Primary delays were consolidated into delay distributions for entry points to the model
and stations within the model.

219
10.2.3.4 Assumptions
To ensure that driver and signaller behaviour is simulated in a satisfactory method the
following assumptions were made:
A driver will not accelerate if the train has less than 800 metres to go before a speed
decrease is required. If the train’s current speed is less than the line speed further down
the line then the train will accelerate towards the next line speed if possible.
If a train is being delayed by more than 120 seconds then the following delayed train is
permitted to overtake, if possible, to prevent further delay.
If a train is more than 120 seconds late arriving at a station then it will be re-platformed if
possible.
The delay statistics supplied by Southern Region of Network Rail were run over typically
125 days to simulate 6 months worth of operational days. No account was taken of
weekends or ‘special’ days, such as sporting events where extra / reduced services may
be run. In addition the statistics have been cleaned of ‘abnormal adverse performance’
days, to ensure that the model represents typical performance properly.
For the purpose of clarity, a conflict in RailSys is not defined as simply as physical
contact between trains, but any incidence where a train driver will see and react to a
restrictive aspect signal displayed.
It should be noted that RailSys does not check for Rules of the Plan (ROTP)
infringements, with regard to minimum headway values. RailSys will consider a
timetable valid, and conflict free, if the trains can run as timetabled without the driver
seeing a restrictive aspect signal.
Minimum and desired dwell times are adhered to throughout the modelling process.

220
10.2.4 Modelling the Existing Infrastructure and Working Timetable
When the base infrastructure and working timetable had been input to RailSys a number
of conflicts were discovered. On further examination these conflicts were only minor but,
due to the density of the traffic around London Victoria and East Croydon, even a delay
of a few seconds was found to escalate into a much larger problem, particularly in the
morning peak.
Where possible all of the conflicts within the base timetable were removed – only 2
minor delays (totalling 22 seconds) remained. None of the errors within the timetable
were caused by the Operational Planning department within Southern Region, but are a
direct result of the inaccuracies associated with the timetabling tools used - only
calculating times to the nearest 30 seconds - and the rounding methods used to achieve
this. Removing these conflicts did not require re-timing of trains by more than a small
number of seconds.
There were also a small number of inconsistencies between different source documents.
With recognition of all these errors the identification of the correct platform became
obvious and did not cause any additional problems / conflicts within the base timetable.
No unusual problems were found with making the base timetable work in RailSys.
10.2.5 Modelling ERTMS System D in RailSys
The ERTMS System D signalling system was set up to use the current interlocking
times, as these were presumed to be unchanged (no better information being available),
with an additional 3 second delay for the ERTMS system to send and receive
transmissions to / from trains. The current interlocking times take into account the
average time required for signals to change aspect and points to be moved, locked and
detected. It should be noted that, throughout this chapter, where signals are referred to,
for the ERTMS models this means in-cab messages about track occupation in front of
the train and the resulting maximum permitted speed, rather than lineside signals.
221
RailSys was set up so that the aspects of ‘signals’ in advance of the train are known
immediately. The trains are under constant communication with the ERTMS system so
that any changes in position of the train or signal aspect / point positions are known by
the train (driver) when it happens. This gives an improvement in performance, in most
circumstances, because it enables the driver to adjust his speed earlier than under
conventional signalling.
Within the model the train begins to react to that signal as soon as a change in aspect is
known. Where braking is required, the model will allow the train to coast, giving the
signal in front of the train more time to clear. This increases the likelihood of the train
not reaching a stand at the signal and this can improve journey times.
However, when the ERTMS system was imposed on to the current infrastructure and
timetable a number of additional conflicts were identified that were not present in the
timetable operating in today’s infrastructure. All of these new conflicts were less than 20
seconds and were due to trains reacting earlier to restrictive aspect signals and,
therefore, causing small conflicts with following trains, demonstrating that coasting is not
always the most appropriate driving strategy from a capacity point of view.
The constant notification of changes in aspect allows the trains to accelerate again as
soon as the restriction is lifted, with better flow of trains in this circumstance. The overall
effect of ERTMS is a smoothing of the acceleration and deceleration curves of train
services, resulting in a more reliable service and increased timetable robustness,
combined with energy savings. There is, however ,a small negative impact on
headways: technical headways under the ERTMS system are slightly greater (with
existing block sections kept) due to this earlier notification of signal aspect. This can be
remedied by inserting additional block sections when ERTMS is implemented to mitigate
against this (but note that this has not been done in this modelling exercise) or could be
mitigated by changing driving practices.
A minimum block section of 200m has been assumed and between 200m and 250m has
been used for the approaches to junctions at Balham, Victoria and East Croydon (where
possible). This has enabled existing blocks (typically 450-500m) to be split in two. For
main running lines the existing block lengths (mostly 500m) have been left untouched.

222
10.2.6 Options Run and Results
Options run
A substantial number of simulation runs were undertaken with different infrastructures
and minor variations to parameters and the timetable. Runs of 25 perturbed timetable
days were undertaken to confirm that the model is functioning satisfactorily and to give
indicative performance figures. Runs of 125 perturbed timetable days were undertaken
to give more robust performance figures (consistent with Monte Carlo modelling rules).
At the end of the analysis period, the key options were re-run with all parameters
comparable and the same timetable (except where stated). The figures tabulated cover
only these final runs.
CURRENT
The first option run was the current timetable on the current infrastructure, to validate the
model and provide a base case.
ERTMS SYSTEM D WITH NO EXTRA BLOCKS
The infrastructure was then modified to ERTMS System D, using the principles
described in an earlier section. The current timetable was overlaid on this infrastructure
and a limited number of minor adjustments were made to the timetable to make it work
satisfactorily when simulated.
SMALL AREA EXPERIMENTS
Additional blocks were added, to separate models, at Balham and East Croydon to test
the behaviour of the models with shorter blocks. A substantial number of extra blocks
were added at Balham and train flow improved substantially. However, as was found in
later runs, much of the benefit was lost once the area with extra blocks was left, as the
trains simply get delayed a little further along their journeys. A smaller level of
223
improvement was found at East Croydon.
ERTMS SYSTEM D WITH LIMITED NUMBER OF EXTRA BLOCKS
Following these experiments and subsequent review with the NEP team, the ERTMS
infrastructure file was amended to have extra blocks on the approaches to Victoria,
Balham and Windmill Bridge Junction/East Croydon. Initial runs restricted the ability of
the model to re-platform trains at Victoria and, in fact, the extra blocks caused UP trains
on some lines to restrict DOWN moves, causing delays not already in the base case.
For the final results, the model was permitted freedom to re-platform trains if a 2 minute
or more delay would otherwise result.
ERTMS SYSTEM D PLUS EXTRA TRAINS
A key requirement of the analysis was to see the extent to which additional services
would ‘soak up’ the performance gains from the introduction of ERTMS. This was tested
by adding in trains in the peak periods on the ERTMS infrastructure, whilst leaving
existing trains untouched – due to time constraints. It was not possible to find ‘conflict
free’ paths on the slow lines, but three return ‘fast’ paths were found in each 3 hour peak
period – adding 12 trains over these 6 hours – about a 3% increase in trains in and out
of Victoria in each peak hour.
It was decided not to add in trains in the off peak because it was understood that the
SRA did not expect additional off peak trains to be required in the foreseeable future
(demand growth being accommodated by longer trains where necessary). Separate
results for the two peak periods were prepared so that the impact of the extra trains on
performance could be fully understood.
ERTMS WITH ADDITIONAL BLOCKS
To investigate whether the specification for extra blocks in the ERTMS model had been
too cautious to get a high level of performance benefit, the ERTMS infrastructure was
modified to increase the number of blocks between Clapham Junction and Victoria plus
around Windmill Bridge Junction. Options without and with the extra trains were run

224
over this revised infrastructure.
REMOVAL OF STOCK WORKING AT VICTORIA
To investigate the extent to which the Victoria throat and platforms were the key
constraint on ERTMS benefits, all ‘connections’ between inbound and outbound trains
were removed, providing something closer to a ‘free flow’ situation (although the throat
still limits train movements to some extent). ‘Up’ trains go into the first available free
platform and then ‘disappear’ from the model; ‘down’ trains appear in the relevant
platform shortly (30 seconds, the default dwell time value) before departure time.
Results
The results cover the route from Selhurst Junction to Victoria and vv. Summaries of the
results for each option are set out below. Differences in average delay (in seconds)
between ERTMS System D and the current signalling are shown. A negative number
means this option has less delay than the current timetable and infrastructure. The %
change in delay minutes is also shown. Negative value again mean that the option is
better than current position.
East Croydon to Selhurst Junction delay figures were excluded because of an
unexplained issue. In the morning peak the timetable performance was worse with
ERTMS than with the current signalling between Windmill Hill Junction and Selhurst
Junction in both directions. The ‘down’ am peak figure was taken at Balham, because
the Selhurst Junction value suffers from ‘blocking back’ as a result of the problems with
ERTMS between Windmill Bridge Junction and Selhurst Junction. These issues
provided an interesting insight into the complexity of simulation and the great care
necessary to ensure that the results were representative.
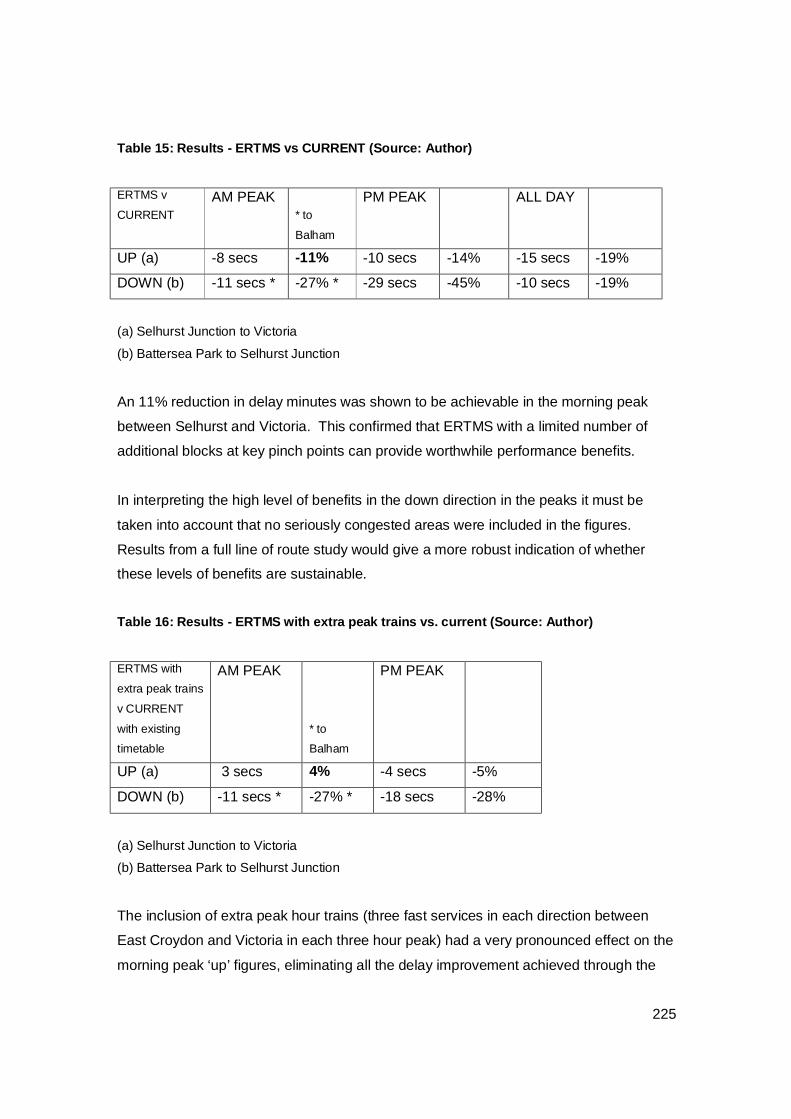
225
Table 15: Results - ERTMS vs CURRENT (Source: Author)
ERTMS v
CURRENT AM PEAK
* to
Balham
PM PEAK ALL DAY
UP (a) -8 secs -11% -10 secs -14% -15 secs -19%
DOWN (b) -11 secs * -27% * -29 secs -45% -10 secs -19%
(a) Selhurst Junction to Victoria
(b) Battersea Park to Selhurst Junction
An 11% reduction in delay minutes was shown to be achievable in the morning peak
between Selhurst and Victoria. This confirmed that ERTMS with a limited number of
additional blocks at key pinch points can provide worthwhile performance benefits.
In interpreting the high level of benefits in the down direction in the peaks it must be
taken into account that no seriously congested areas were included in the figures.
Results from a full line of route study would give a more robust indication of whether
these levels of benefits are sustainable.
Table 16: Results - ERTMS with extra peak trains vs. current (Source: Author)
ERTMS with
extra peak trains
v CURRENT
with existing
timetable
AM PEAK
* to
Balham
PM PEAK
UP (a) 3 secs 4% -4 secs -5%
DOWN (b) -11 secs * -27% * -18 secs -28%
(a) Selhurst Junction to Victoria
(b) Battersea Park to Selhurst Junction
The inclusion of extra peak hour trains (three fast services in each direction between
East Croydon and Victoria in each three hour peak) had a very pronounced effect on the
morning peak ‘up’ figures, eliminating all the delay improvement achieved through the
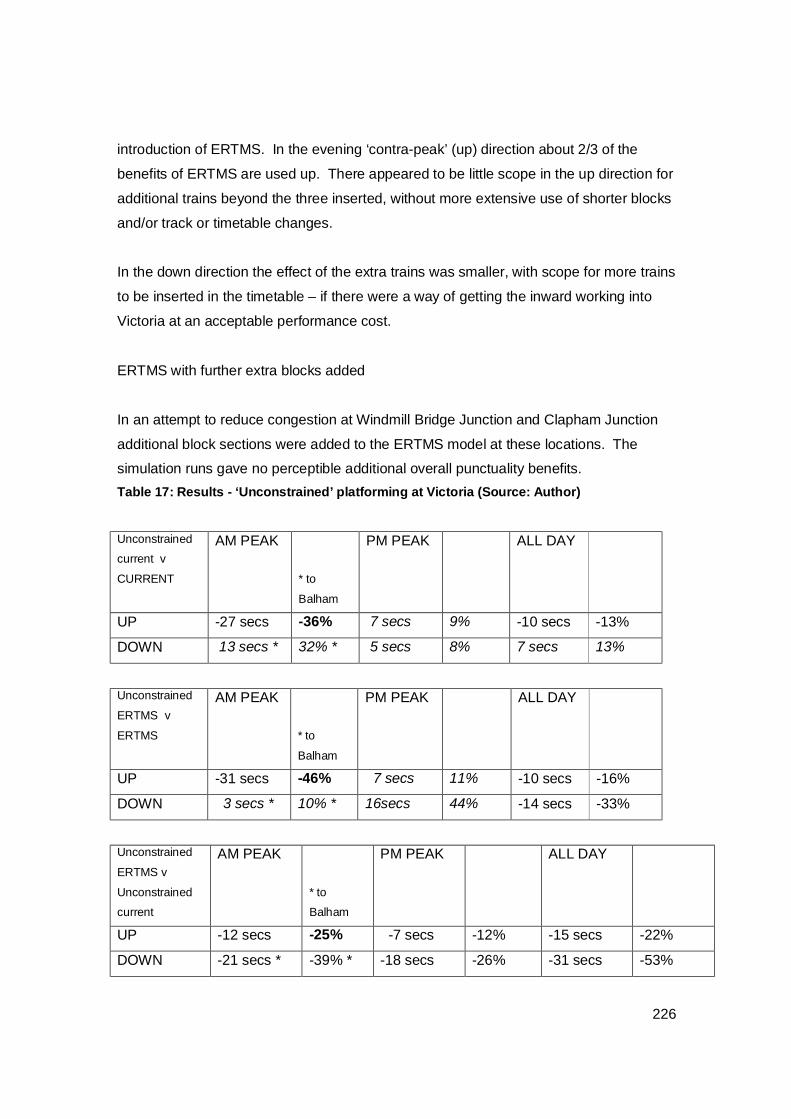
226
introduction of ERTMS. In the evening ‘contra-peak’ (up) direction about 2/3 of the
benefits of ERTMS are used up. There appeared to be little scope in the up direction for
additional trains beyond the three inserted, without more extensive use of shorter blocks
and/or track or timetable changes.
In the down direction the effect of the extra trains was smaller, with scope for more trains
to be inserted in the timetable – if there were a way of getting the inward working into
Victoria at an acceptable performance cost.
ERTMS with further extra blocks added
In an attempt to reduce congestion at Windmill Bridge Junction and Clapham Junction
additional block sections were added to the ERTMS model at these locations. The
simulation runs gave no perceptible additional overall punctuality benefits. Table 17: Results - ‘Unconstrained’ platforming at Victoria (Source: Author)
Unconstrained
current v
CURRENT
AM PEAK
* to
Balham
PM PEAK ALL DAY
UP -27 secs -36% 7 secs 9% -10 secs -13%
DOWN 13 secs * 32% * 5 secs 8% 7 secs 13%
Unconstrained
ERTMS v
ERTMS
AM PEAK
* to
Balham
PM PEAK ALL DAY
UP -31 secs -46% 7 secs 11% -10 secs -16%
DOWN 3 secs * 10% * 16secs 44% -14 secs -33%
Unconstrained
ERTMS v
Unconstrained
current
AM PEAK
* to
Balham
PM PEAK ALL DAY
UP -12 secs -25% -7 secs -12% -15 secs -22%
DOWN -21 secs * -39% * -18 secs -26% -31 secs -53%
227
To better understand the impact of capacity constraints at Victoria the model was run
without inbound and outbound workings ‘connected’. This means that platform
congestion and ‘blocking in’ of trains in the platform could not occur and this was
intended to give a picture of what System D would deliver if some of the constraints at
Victoria did not exist.
Not all of the results were as expected, with those in italics counter-intuitive – with the
constrained platforming working better than the unconstrained. This appears to indicate
that except when congestion is at its highest (am peak in the up direction) the problems
with the model not knowing where trains are going to depart from (because as currently
modelled they ‘appear’ in the platform 30 seconds before departure time) are greater
than the benefits of unconstrained platforming for up services. There was insufficient
time in this study to investigate these results further – a logical next step would be to
increase the ‘dwell time’ for down trains at Victoria so that the model can see platform
occupancy further ahead.
Overall however the results demonstrated that platforming constraints have a very
serious impact on delay levels, and therefore a very important impact on the scale of
benefits that ERTMS can generate.
10.2.7 Comparison with Previously Published Results on Benefits
of ERTMS
The opportunity was taken to compare the results from the above case study with
another study, undertaken by AEA Technology Rail using different software (a
combination of MERIT and VISION) and for different routes, with the results set out in an
SRA internal report (Morgan 2003). This comparison highlighted important differences –
in particular that the Victoria to East line did not show the large capacity benefits from
the introduction of ERTMS that had been shown elsewhere. Bearing in mind that routes
out of Victoria are more congested than most in the UK, this conclusion was
disappointing, and needed explaining.
Analysis concluded that the route between Victoria and East Croydon is different from
228
those considered by AEAT in several important ways:
• Signal sections were largely 500 yards or less already (impacting negatively on
the benefits of ERTMS);
• Significant terminus congestion at Victoria, which ERTMS cannot eliminate on its
own, leading to the benefits of ERTMS being somewhat dissipated;
• A number of important converging and diverging junctions (giving a worthwhile
ERTMS benefit).
Because of these differences comparable results should not necessarily be expected.
Looking at terminal impact specifically, in the peak hours, trains queue up waiting to get
into a platform at Victoria. It has not been possible to reduce block lengths across the
throat and into the platforms and, therefore, this congestion remains with ERTMS.
Options for remedying this might be:
• Advisory speed limits. Conceptually these might improve the flow across the
throat, if up trains did not have to stop and restart. However, this benefit could
be very hard to realise, as predicting when the throat block would clear would be
difficult to do far enough in advance, with trains starting from the platforms just a
few seconds before crossing the throat
• Re-model the throat and approaches to seek to make the most of reduced
ERTMS block lengths. This idea might also be applied at East Croydon/Windmill
Bridge Junction.
The capacity utilisation vs. secondary delay relationship also helps to explain different
results from different models.
The principle that the performance of a transport network degrades as traffic volumes
approach the theoretical maximum that the network can accommodate is well known
(c.f. Banks, Bayliss and Glaiser, 2007). In addition it is well understood that, at some
point, exactly when depending on the particular features of the network, the level of
delay that an extra unit of traffic volume causes starts to grow very rapidly (and
ultimately exponentially).
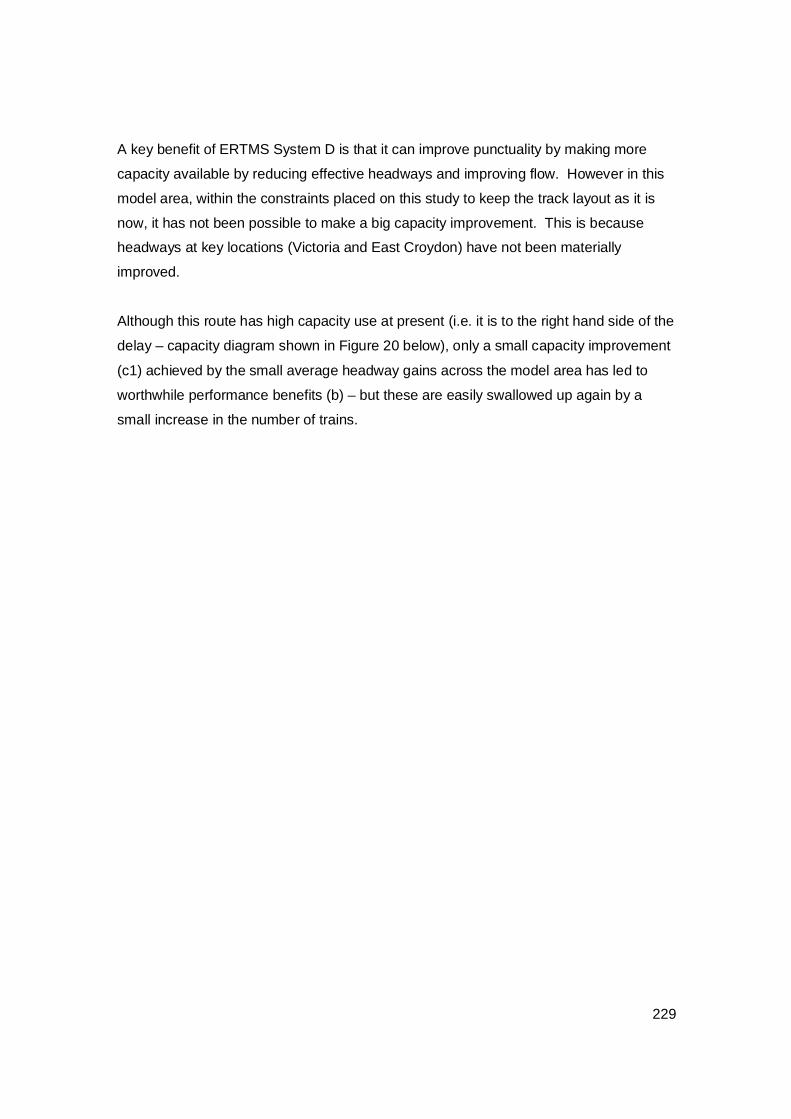
229
A key benefit of ERTMS System D is that it can improve punctuality by making more
capacity available by reducing effective headways and improving flow. However in this
model area, within the constraints placed on this study to keep the track layout as it is
now, it has not been possible to make a big capacity improvement. This is because
headways at key locations (Victoria and East Croydon) have not been materially
improved.
Although this route has high capacity use at present (i.e. it is to the right hand side of the
delay – capacity diagram shown in Figure 20 below), only a small capacity improvement
(c1) achieved by the small average headway gains across the model area has led to
worthwhile performance benefits (b) – but these are easily swallowed up again by a
small increase in the number of trains.
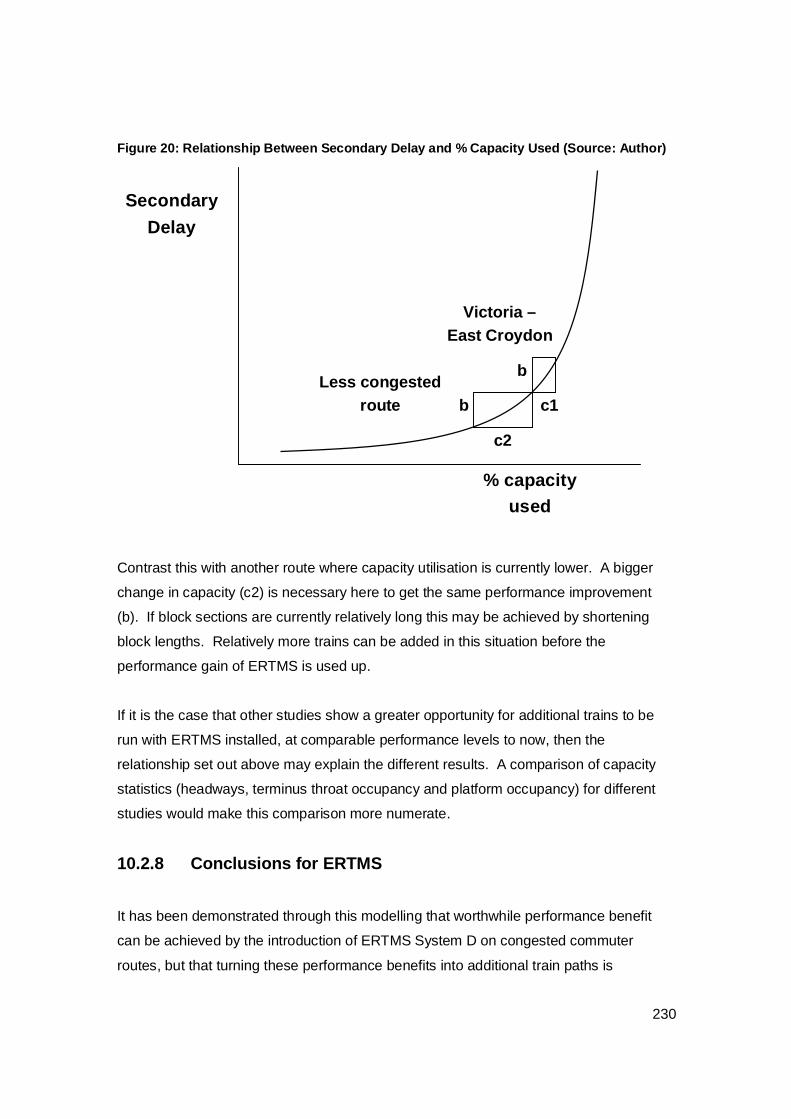
230
Figure 20: Relationship Between Secondary Delay and % Capacity Used (Source: Author)
Contrast this with another route where capacity utilisation is currently lower. A bigger
change in capacity (c2) is necessary here to get the same performance improvement
(b). If block sections are currently relatively long this may be achieved by shortening
block lengths. Relatively more trains can be added in this situation before the
performance gain of ERTMS is used up.
If it is the case that other studies show a greater opportunity for additional trains to be
run with ERTMS installed, at comparable performance levels to now, then the
relationship set out above may explain the different results. A comparison of capacity
statistics (headways, terminus throat occupancy and platform occupancy) for different
studies would make this comparison more numerate.
10.2.8 Conclusions for ERTMS
It has been demonstrated through this modelling that worthwhile performance benefit
can be achieved by the introduction of ERTMS System D on congested commuter
routes, but that turning these performance benefits into additional train paths is
Secondary Delay
% capacity used
Victoria – East Croydon
Less congested
route
b
b
c2
c1

231
problematic.
Performance benefits (change in delay minutes over the section of route assessed)
achieved range from 11% in the UP am peak to all-day benefits of 19%. These figures
relate to Selhurst Junction to Victoria and vv. Potential ‘down side’ risks to the validity of
these numbers in ERTMS business case work is that they may include improvements to
performance that could be delivered by other means with existing signalling. Also, it
may be that benefits are not sustainable at these percentage levels when the full route to
the south coast is modelled. On the ‘up side’ changes to the timetable or infrastructure
might enable greater savings to be made.
Within the physical constraints of the study area and the constraints placed on the study
due to its limited scope, only 3 additional trains each way in each 3 hour peak could be
pathed without reducing performance with ERTMS to below current performance with
existing signalling.
A number of important factors that could possibly limit the scale of the benefits
achievable from ERTMS System D implementation have been exposed:
• The level of performance benefits achievable was constrained in this study area
by the inability to easily reduce headways through the introduction of additional
blocks because many block sections are already less than 500m and reductions
in block lengths are also being constrained by crossovers adjacent to platform
ends;
• Because headways were not significantly reduced, the extra capacity created
was relatively small (particularly at Victoria and East Croydon), meaning that just
a few additional trains (three each way) could be added in the morning peak to
the ERTMS model without performance deteriorating to below the level of
performance achieved with current signalling;
• The significance of terminus congestion in achieving benefits from ERTMS has
been clearly demonstrated;
• A need to amend the timetable, perhaps substantially, is apparent to get the best
from ERTMS.
These issues certainly warrant further investigation but this is outwith the scope of the
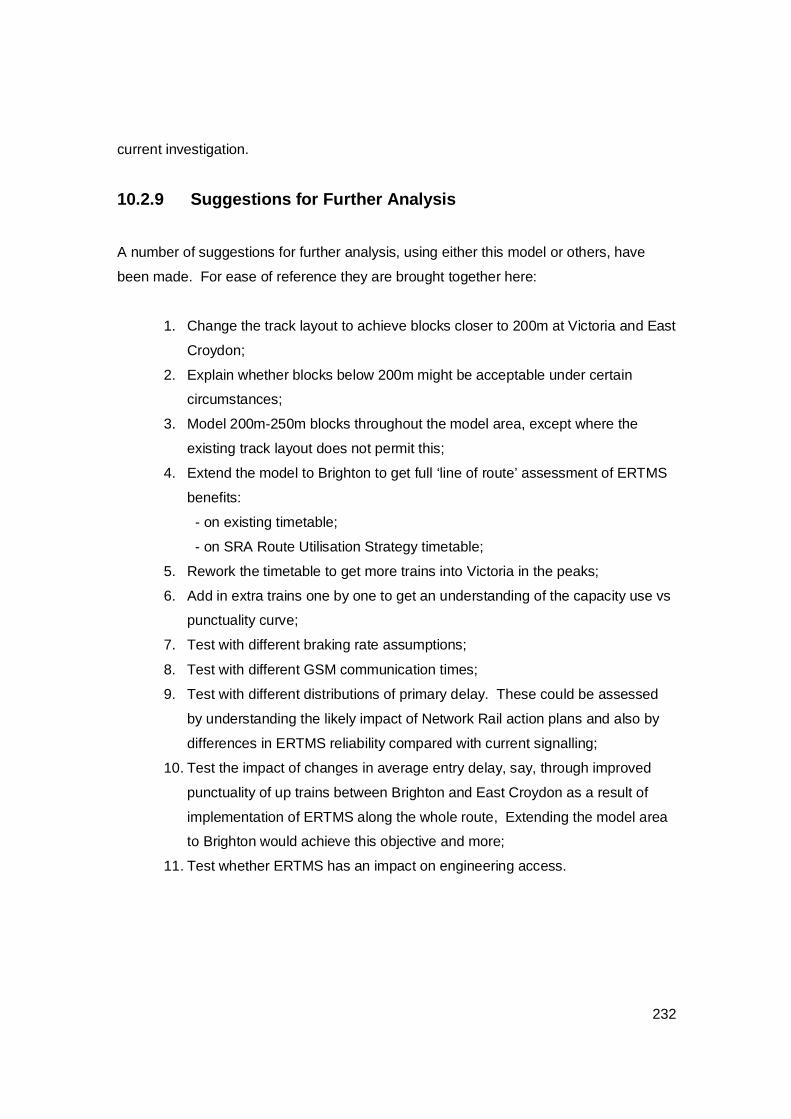
232
current investigation.
10.2.9 Suggestions for Further Analysis
A number of suggestions for further analysis, using either this model or others, have
been made. For ease of reference they are brought together here:
1. Change the track layout to achieve blocks closer to 200m at Victoria and East
Croydon;
2. Explain whether blocks below 200m might be acceptable under certain
circumstances;
3. Model 200m-250m blocks throughout the model area, except where the
existing track layout does not permit this;
4. Extend the model to Brighton to get full ‘line of route’ assessment of ERTMS
benefits:
- on existing timetable;
- on SRA Route Utilisation Strategy timetable;
5. Rework the timetable to get more trains into Victoria in the peaks;
6. Add in extra trains one by one to get an understanding of the capacity use vs
punctuality curve;
7. Test with different braking rate assumptions;
8. Test with different GSM communication times;
9. Test with different distributions of primary delay. These could be assessed
by understanding the likely impact of Network Rail action plans and also by
differences in ERTMS reliability compared with current signalling;
10. Test the impact of changes in average entry delay, say, through improved
punctuality of up trains between Brighton and East Croydon as a result of
implementation of ERTMS along the whole route, Extending the model area
to Brighton would achieve this objective and more;
11. Test whether ERTMS has an impact on engineering access.
233
11 References
Aarts E., Korst J. and Michiels W. (2005). Simulated Annealing. In: Burke E.K. and Kendall G.
(Eds.) (2005). Search Methodologies: Introductory Tutorials in Optimization and Decision
Support Techniques, Springer, New York.
Adamson, M., Jones, J., and Pratt, R. (1991). Competitive Issues in Privatisation: Lessons for
the Railways. In: Transport in a Free Market Economy, edited by Banister, D., and Button, K.
(Basingstoke, UK: Macmillan).
AEA Technology Rail (2002). MERIT Manual, Unpublished user manual, London.
AEA Technology Rail (2003). PTG Manual, Unpublished user manual, London.
AEA Technology Rail (2005). Timetable Planning and Validation, Unpublished product
description, London.
Ainger A.W.S. (1990). Aspects of an experimental industrial application of a human-centered
CIM system, IEE Colloquium on Human Factor in CIM, Jan. 1990, pp 3/1 – 3/5.
Artiba A. and Riane F. (1998). An application of a planning and scheduling multi-model
approach in the chemical industry. Computers in Industry, 1998: 36.
Assad A. (1980). Models for rail transportation, Transportation Research Part A, 14, pp.205-220.
Association of Train Operating Companies (2005). Ten-year European Rail Growth Trends.
www.atoc.org
Auger, B., and Galimont, J-M. (2003). In favour of clockface timetables, 1: Making the most of
the Capacity Utilisation Policy, Modern Railways, June 2003, pp.42-45.
234
Banks N., Bayliss D. and Glaister S. (2007). Motoring towards 2050: Roads and Reality. RAC
Foundation, London.
Barrett M.L. and Beerel A.C. (1988). Expert Systems in Business: A Practical Approach, Ellis
Horwood, Chichester, UK.
Bechhofer F. (1974). Current approaches to empirical research: some central ideas. In: Rex J.
(Ed.) Approaches to Sociology, Routledge, London.
Blumberg B., Cooper D.R., and Schindler P.S. (2005). Business Research Methods, McGraw
Hill, Maidenhead, UK.
Booch G. (1994). Object-oriented analysis and design, Addison-Wesley, Menlo Park, CA
Boodoo A., Gillingwater D. and Watson R. (2003). The Effect of Competitive Capacity Allocation
on UK Railway Timetabling. Paper to Association for European Transport conference October
2003.
Borndorfer R., Grotshel M., and Lobel A., (1998). Optimization of Transportation Systems,
Preprint SC98-09, Konrad-Zuse-Zentrum fur Informationstechnik, Berlin.
Brannlund U., P.O. Lingberg, A. Nou, J.E. Nilsson (1998). Railway timetabling using Lagrangian
relaxation. Transportation Science (32), pp.358-369.
British Broadcasting Corporation (1999). Review of the Year, Annual Report and Accounts
98/99.
British Railways Board (1963). The Reshaping of British Railways, HMSO, London.
Brooke D.F. (1996). Train planners’ toolkit - an integrated approach to train planning, rostering
and simulation. In: Allan J., Brebbia C.A., Hill R.J., Sciutto G., Sone S. (Eds.). Computers in
Railways V, Volume 1: Railway System and Management, Southampton: Computational
Mechanics Publications, pp437-446.
235
Brown R.B. (1997). You can’t expect rationality from pregnant men: Reflections on Multi-
disciplinarity in Management Research, British Journal of Management, 8.1, pp.23-30. Quoted
in Gill and Johnson (2002).
Brown S. (2002). Railway network Simulation as a Systems Engineering Tool, MSc thesis,
University of Sheffield.
Bryman A. (1988). Quantity and Quality in Social Research, Routledge, London.
Burke E.K. and Kendall G. (Eds.) (2005). Search Methodologies: Introductory Tutorials in
Optimization and Decision Support Techniques, Springer, New York.
Burrell G. and Morgan G. (1979). Sociological Paradigms and Organisational Analysis,
Heinemann, London.
Bussieck M.R., P. Kreuzer, U.T. Zimmermann (1997). Discrete Optimisation in Public Rail
Transport. Mathematical Programming (79), pp.415-444.
Byars L.L., Rue L.W. and Zahra S.A. (1996). Strategic Management, Irwin, Chicago.
Campbell R.L. (1990). The SEMTA experience with computer-aided scheduling, In: Daduna
J.R. and Wren A. (Ed.), Computer-Aided Transit Scheduling. Lecture Notes in Economics and
Mathematical Systems 308, 279-287.
Caprara A., Fischetti M., Toth P., Vigo D., Guida P.L. (1997). Algorithms for Railway Crew
Management, Mathematical Programming (79), pp.123-141.
Carey M. (1994). A model and strategy for train pathing with choice of lines, platforms and
routes, Transportation Research Part B (28), pp.333-353.
Carey M., Lockwood D. (1995). A Model, Algorithms and Strategy for Train Pathing, Journal of
the Operational Research Society (46), pp.988-1005.
Carey M, Carville S. (2000). Testing schedule performance and reliability for train stations,
236
Journal of the Operational Research Society (511), pp666-682.
Carey M. Carville S. (2003). Scheduling and platforming trains at busy complex stations.
Transportation Research (37A), pp.195-224.
Carey M. Crawford I. (2007). Scheduling trains on a network of busy complex stations.
Transportation Research (41B), pp159-178. Special Issue on Advanced Modelling of Train
Operations in Stations and Networks.
Casson C.J. (2003). East London Line Project Development of Project Output Specification,
internal SRA document, London.
Chang Y.H., Yeh C.H., Shen C.C. (2000). A multiobjective model for passenger train services
planning: application to Taiwan’s high-speed line. Transportation Research Part B (34), pp.91-
106.
Channel 4, A Secret History of Rail, Broadcast 1st December 2001.
Class Representative Committee (1996). Track Access Conditions, Minutes of Meeting 3
October 1996, London.
Clear T. (1998). Business Information Technology, Financial Times Management, London.
Cochrane R. (1992). The Management of Operations. In: Planning Passenger Railways, edited
by Harris, N.G., and Godward E.W., Transport Publishing Company, Glossop, UK.
Collins A. (1996). Railways fall down on timetabling software, Computer Weekly, 25 April.
Computer Aided Scheduling in Public Transport, 8th International Conference, Berlin June 2000.
Computer Aided Scheduling in Public Transport, Proceedings of the 5th International Workship
on Computer-Aided Scheduoling of Public Transport, Montreal August 1990. Some papers
publised in Rousseau J.M. (1992). Lecture Notes in Economics and Mathematical Systems,
Vol. 386.
237
Comreco Rail (1997). RailPlan guide, York, UK.
Cordeau J.-F., Toth P. and Vigo D. (1998). A Survey of Optimization Models for Train Routing
and Scheduling, Transportation Science (32), pp.380-404.
Cordeau J.-F., Soumis F. and Desrosiers J. (2000). A Benders Decomposition Approach for the
Locomotive and Car Assignment Problem, Transportation Science 34, pp.133-149.
Cyert R.M. and March J.G. (1963). A Behavioural Theory of the Firm, Prentice Hall, New
Jersey. Quoted in Gee (1969).
Daduna, J R, Branco, I & Pinto Paixao, J (Ed.) (1992). Computer-Aided Transit Scheduling,
Springer, Berlin.
Daduna J.R. and Pinto Paixao, J.M., (1995). Vehicle scheduling for public mass transit - an
overview, Computer-Aided Transit Scheduling. Lecture Notes in Economics and Mathematical
Systems 430, pp.76-90.
Daduna J.R. and Wren A. (Ed.) (1990). Computer-Aided Transit Scheduling 1988. Lecture
Notes in Economics and Mathematical Systems 308, Springer, Berlin
Daduna J.R., Branco I.M. and Pinto Paixao J.M. (Ed.) (1995). Computer-Aided Transit
Scheduling 1993. Lecture Notes in Economics and Mathematical Systems 430.
Daduna J.R., Voss S. (1995). Practical Experiences in Schedule Synchronisation. In: Daduna
J.R., Branco I.M., Pinto Paixao J.M. (Eds.) Computer-Aided Transit Scheduling, Berlin: Springer, pp.39-55.
Daily Telegraph Editorial, (1995). Timetable of Errors, Daily Telegraph, 27 September.
Daly D. (1993). Expert Systems. In Peppard (1993).
Das B.P., Shah N. and Chung P.W.H. (1998). Off-line scheduling a simple chemical batch
process production plan using the ILOG scheduler. Computers in Chemical Engineering, 1998:
238
22 (Suppl.).
David F.R. (2005). Strategic management: concepts and cases (10th Edition). Pearson
Education, New Jersey.
Deacon D., Bryman A., Fenton N. (1998). Collision or collusion? A discussion and case study
of the unplanned triangulation of quantitative and qualitative research methods, International
Journal of Social Research Methodology, Vol. 1, no. 1, pp 47-63.
.
Department for Transport (2000). Transport 2010: The 10 Year Plan.
www.dft.gov.uk/trans2010/plan/index.htm
Department for Transport (2004). The Future of Rail, Crown Copyright, London.
Department for Transport (2007). Transport Statistics Great Britain, 2007 Edition, National
Statistics, London, UK.
Doe B. (2003). Can ORCATS be trusted? Rail, Vol. 461, p.52.
Downs E., Clare P. and Coe I. (1992). Structured systems analysis and design method:
application and context. Prentice Hall International, Hemel Hempstead, UK.
Drucker P.F. (1954). The Practice of Management, Heinemann, New Hampshire.
Earl M.J. (1989). Management Strategies for Information Technology, Prentice Hall, New
Jersey. Quoted in Peppard (1993).
Easterby-Smith M., Thorpe R. and Lowe A. (2002). Management Research (2nd Edition), Sage,
London.
Editorial, Modern Railways, various issues, (2003-2005).
Eibl P. (1996). Computerised Vehicle Routing and Scheduling in Road Transport, Avebury,
Aldershot, UK.

239
Elms J.M. (1990). The Use of Computers in Bus and Crew Scheduling by London Buses and its
Predecessors: A User’s View, In: Computer-Aided Transit Scheduling. Lecture Notes in
Economics and Mathematical Systems 308, pp.262-271.
Eurobios (2007). Railway Timetabling Optimizer, www.eurobios.com.
European Conference of Ministers of Transport (2002). The European Integration of Rail Freight
Transport, Conclusions of Round Table 125, Paris 28-29 November 2002. Available on line at
http://www.internationaltransportforum.org/europe/ecmt/railways/pdf/rt125e.pdf.
European Economic Community (1991). Council Directive of 29 July 1991 on the development
of the Community’s railways (91/440/EEC), Official Journal of the European Communities no.
L237, 24.8.1991, pp.25-28.
European Railways Optimisation Planning Environment - Transportation Railways Integrated
Planning TRIP Contract RA-97-AM-1165 June 2000.
European Union (2001). Directive 2001/14/EC of the European Parliament and of the Council of
26 February 2001 on the allocation of railway infrastructure capacity and the levying of charges
for the use of railway infrastructure and safety certification, Official Journal of the European
Communities no. L75, 15.3.2001, pp.29-46 as amended.
European Union, Community Preparatory Act (1998). Proposal for a Council Directive relating
to the allocation of railway infrastructure capacity and the levying of charges for the use of
railway infrastructure and safety certification, document 98/C 321/07.
European Union (2008). Information Society Technologies website,
http://arrival.cti.gr/index.php/Documents/ListWP1
Fenelon K.G. (1939). British Railways To-day, Thomas Nelson and Sons Ltd., London.
Ferreira L. (1997). Planning Australian Freight Rail Operations: an overview, Transportation
Research Part A, (31), pp.335-348.

240
Fiennes G. (1967). I tried to run a railway, Ian Allan, Shepperton, UK.
First Great Western (2002). Major boost proposed for rail passengers, First Great Western
Press Release, www.firstgreatwestern.co.uk
Ford R. and Haydock, D. (1992). Signalling and Timetabling. In: Harris, N.G., and Godward
E.W. (Eds.). Planning Passenger Railways, Transport Publishing Company, Glossop, UK.
Ford R. (2003). Princess feels the pinch, Informed Sources, www.alycidon.com
Ford R. (2007). Alycidon Rail Acronym Translator, www.alycidon.com [Glossary]
Fores S., Proll L. and Wren A. (1999). Experiences with a Flexible Driver Scheduler. In: Voss
S. and Daduna J.R. (Eds.). Computer-Aided Scheduling of Public Transport, Springer, Berlin.
Foster Sir C. and Castles C. (2004). Creating a viable railway for Britain – what has gone wrong
and how to fix it. Paper presented to The International Consulting Economists’ Association, 8th
July 2004.
Freeman R. and Shaw J. (Eds.) (2000). All Change: British Railway Privatisation, McGraw-Hill,
London.
Freeman R. (2005). Operational Planning Agenda for Change, Internal Network Rail document,
London.
Gable G. (1994). Integrating Case Study and Survey Research Methods: An Example in
Information Systems, European Journal of Information Systems, Volume 3 issue 2, pp.112-126.
Gamerman D. and Lopes H.F. (2006). Markov Chain Monte Carlo: Stochastic Simulation for
Bayesian Inference. Chapman and Hall, Boca Raton, USA.
Gardermoen Railway Project (1998-99). High Level Specifications, Rolling Stock Plan Process, Personnel Planning, Daily Allocation and Planned Maintenance, GMB timetable rolling stock and personnel planning systems, internal project documents, Oslo, Norway.
241
Gee K.P. (1969). A Positive approach to Corporate Objectives. Sir Frederic Hooper Essay
Award 1969, Industrial Education and Research Foundation, London.
Gibson S., Cooper G. and Ball B. (2002). Developments in Transport Policy: The Evolution of
Capacity Charges on the UK Rail Network, Journal of Transport Economics and Policy, (36:2),
pp.341-354.
Giddens A. (1978). Positivism and its criticisms. In: Bottomore T. and Nesbit R. (Eds.). A
History of Sociological Analysis, Heinemann, London. Quoted in Gill and Johnson.
Gill J. and Johnson P. (2002). Research Methods for Managers (3rd Edition), Sage, London.
Gilroy J. and Robertson S. (2001). The PTG Heuristic, Unpublished AEA Technology Rail
report.
Giro (2008). Transit scheduling and operations, http://www.giro.ca/en/
Glaser B.G. and Strauss A.L. (1967). The Discovery of Grounded Theory, Aldine. Chicago.
Glover J. (1996). Abc National Railways: A Guide to the Privatised Railway, Ian Allan,
Shepperton, UK.
Goverde R.M.P. and Odijk M.A. (2002). Performance evaluation of network timetables using
PETER. In Allan J., Andersson E., Brebbia C.A , Hill R.J., Sciutto G., Sone S. (Eds.).
Computers in Railways VIII, Southampton: Computational Mechanics Publications.
Gourvish T. (2002). British Rail 1974-1997: from Integration to Privatisation, Oxford University
Press, UK.
Haase K., Desaulniers G. and Desrosiers J. (2001). Simultaneous Vehicle and Crew
Scheduling in Urban Mass Transit Systems, Transportation Science 35, pp.286-303.
Hall S. (2003). Is ERTMS becoming an irrelevance?, Rail 454 (5-18 February 2003), pp.28-31.

242
Hammerton J.R. (1996). Delivering scheduling solutions for a changing business world. In:
Allan J., Brebbia C.A , Hill R.J., Sciutto G., Sone S. (Eds.). Computers in Railways V, Volume 1:
Railway System and Management, Southampton: Computational Mechanics Publications,
pp467-477.
Hansard (2001). Westminster Hall Debates, Volume 267, Part 77, 1 May 2001.
Hansard (2003). Oral Answers to Questions — Prime Minister, 2 July 2003.
Hare B. (1930). British Railway Operation, Modern Transport Publishing, London.
Hare B. (1930?). Practical Railway Operating, Modern Transport Publishing, London.
Hansen I.A., Radtke A., Pachl J. and Wendler E. (Eds). Proceedings of the 2nd International
Seminar on Railway Operations Modelling and Analysis, Hannover, Germany, March 28-30,
2007.
Harper K. (1995). Hi-tech system ditched in new Railtrack blow, The Guardian, 11 October.
Harris N.G. and Godward E.W. (Ed.) (1992). Planning Passenger Railways, Transport
Publishing Company, Glossop, UK
Harris N.G., Cooper G. (2000). An Access Rights Database and Validator. In: Allan J., Hill R.J.,
Brebbia C.A., Sciutto G., Sone S. (Eds.) Computers in Railways VII, Bologna, WIT Press,
Southampton.
Harris N.G. (1999). Competitive strategies for railways in the UK: a corporate perspective.
Transport Reviews, 19.2, pp.191-202.
Harris N.G. and Godward E.W. (1997). The Privatisation of British Rail, The Railway
Consultancy Press, London.
Haskel, Lord (1997). Lords Hansard, 20 Feb 1997: Column 782.
243
Higgins A., Kozan E., Ferreira L. (1996). Optimal scheduling of trains on a single line track.
Transportation Research Part B (30), pp.147-161.
Hoffstadt J., (1990). Computer-Aided Scheduling in Urban Mass Transit Companies: Past,
Present and Future, In: Computer-Aided Transit Scheduling. Lecture Notes in Economics and
Mathematical Systems 308, pp.1-7.
Hooghiemstra J.S., Kroon L.G., Odijk M.A., Salomon M., Zwaneveld P.J. (1999). Decision
Support Systems support the search for win-win solutions in railway network design. Interfaces
(29:2), pp.15-32.
House R.J. (1970). Scientific investigation in management, Management International Review,
Vol. 4/5 no. 10, pp.139-150.
ILOG (2007). Industry Solutions: Manufacturing, http://www.ilog.com/industries/manufacturing/
Industry Insider (2008). Why clockface timetables are not the answer to customer demand, Rail
July 30 – August12, p597.
Ingolotti L., Barber F., Tormos P., Lova A., Salido M.A., Abril M. (2006). A Scheduling order-
based method to solve timetabling problems, Current Topics in Artificial Intelligence. Lecture
Notes in Artificial Intelligence 4177, pp52-61.
Jardine and Associates (2002). Trail description, working paper provided to Railtrack, East Kilbride, UK. Johnson R. (1996). The APlan Project – Lessons Learned Report, Parity Consulting report to Railtrack, London.
Jones G.T. (1972). Simulation and Business Decisions, Penguin Education, Harmondsworth,
Middlesex, England.
Jupe R (2007). Public (Interest) or Private (Gain)? The Curious Case of Network Rail's Status,
Journal of Law and Society, Volume 34, Number 2, June 2007 , pp.244-265.

244
Kain P. (1998). The reform of rail transport in Great Britain, Journal of Transport Economics and
Policy, (32:2), pp.247-266.
Klein M. and Methlie L.B. (1990). Expert Systems: A Decision Support Approach, Addison-
Wesley Publishers Ltd., Wokingham, England.
Klemenz M. and Schultz S (2007). Modelling Aspects of a Railway Slot Allocation. In: Hansen
I.A., Radtke A., Pachl J. and Wendler E. (Eds). Proceedings of the 2nd International Seminar on
Railway Operations Modelling and Analysis, Hannover, Germany, March 28-30, 2007.
Knight S. (2003). Better train regulation needed, says Virgin. Rail, 462, 14.
Knights D. and Willmott H. (1997) The hype and hope of interdisciplinary management studies,
British Journal of Management 8 pp.9-22, quoted in Gill and Johnson.
Knights D. and Morgan G. (1991). Strategic discourse and subjectivity, Organizational Studies,
12.2, pp. 251-274.
Kroon L.G., Romeijn H.E., Zwaneveld P.J. (1997). Routing trains through railway stations:
complexity issues. European Journal of Operational Research (98), pp.485-498.
Kuhn T. (1970). The Structure of Scientific Revolution (2nd Edition), University of Chicago Press,
Chicago. Quoted in Gill and Johnson.
Lamont J. (1988). The transition to computerized bus and crew scheduling at the Montreal
urban community transit company. In: Daduna, J.R., Wren A. (Eds.), Computer-Aided Transit
Scheduling in Public Transport, Berlin: Springer, pp.272-278.
Lampkin M. (2002). Capacity Utilisation Analysis: Development of modelling tools and appraisal
guidance, Unpublished report by NERA and Jacobs Consultancy for the Strategic Rail Authority.
Liebchen C. (2003). Symmetry for Periodic Railway Timetables, Electronic Notes in Theoretical
Computer Science 92 No. 1.

245
Liebchen C. (2007). The 2005 Timetable of Berlin Underground - the First Mathematically
Optimized Service Concept for Railways in Practice, Proceedings of the 2nd International
Seminar on Railway Operations Modelling and Analysis, Hannover, Germany, March 28-30,
2007.
Loos P. and Allweyer T. (1998). Application of production planning and scheduling in the
process industries. Computers in Industry, 1998: 36.
Loose W., Temple G. (1997). Railtrack Access Planning: Consultancy Support of Winter 1995
Reissue and Summer 1996 and Winter 1996 Timetable Planning: Assignment Report, London.
Lords Hansard 15 October 2001, as repeated by Lord Falconer of Thornton.
Lucchini L., Curchod A., and Rivier R. (2001). Transalpine Rail Network: A Capacity
Assessment Model (CAPRES). Presented at: 1st Swiss Transport Research Conference, Monte
Verità/Ascona, March 2001.
Lynch R (2002). Setting the record straight on Network Rail, news release from National
Statistics, 11 July 2002.
Marshall J. and Lowes S. (2003). Investigation of MERIT Accuracy, internal Network Rail
document, London.
Martin P. (1999). Train Performance and Simulation. In P. A. Farrington, H. B. Nembhard, D. T.
Sturrock, and G. W. Evans, (Eds.), Proceedings of the 1999 Winter Simulation Conference.
McGrath M.A. (1989). An ethnography of a gift store: trappings, wrappings and rapture, Journal
of Retailing, Vol. 65, no 4, pp.421-429.
Mees A.I. (1995). Railway scheduling by network optimisation, Mathematical and Computer
Modelling (15:1), pp.33-42.
Michalewicz Z. and Fogel D.B. (2004). How to solve it: Modern Heuristics, Springer, Berlin.
246
Modern Railways (1999). Problems freeing up paths for Thameslink – two operators with
different objectives. Railtalk, March.
Modern Railways (1999). Timetabling – all together now. Conferences and the new procedure.
Informed sources, Modern Railways, March.
Modern Railways ‘Railtalk’ (1999). A job for the SRA. Modern Railways, March.
Modern Railways (1991). Timetabling Freight Trains. Modern Railways, March.
Moore T. (1995). Railtrack forced back to BR ways of timetabling, Daily Telegraph, 11 October.
Moreira N.A.B.S. and Oliveira R.C. (2000). A Decision Support System for operational planning
in railway networks. Paper to Computer-Aided Scheduling of Public Transport, 8th International
Conference, Berlin.
Morgado E.M. and Martins J.P., (1998). CREWS_NS - Scheduling train crews in the
Netherlands, AI MAGAZINE, 19 (1), pp.25-38.
Morgan G. (2003). Capacity Concept CP12. Internal SRA (ERTMS Project Team) report.
Nachtigall K., Voget S. (1997). Minimising waiting times in Integrated Fixed Interval Timetables
by Upgrading Railway Tracks. European Journal of Operational Research, (103), pp.610-627.
National Audit Office (2005). The South Eastern Passenger Rail Franchise, The Stationary
Office, London.
Network Rail Operational Planning Business Improvement Design Group (2002). Precise
Planning – current status of analysis; next steps, Network Rail internal document, London.
Network Rail (2003). 2003 Business Plan, www.networkrail.co.uk
Network Rail (2005). Report on Capacity Analysis Study on the East Coast Main Line,
www.networkrail.co.uk
247
Network Rail (2006). Business Planning Criteria, www.networkrail.co.uk
Network Rail (2007). Route Utilisation Strategies, www.networkrail.co.uk
O’Brien R. (2001). Operational Planning Research Report Japan 2001, Railtrack internal report, London.
O’Brien R. (2002). Access Planning Process Improvement, Railtrack internal paper, London.
O’Brien R. (2004). Existing Timetables – Fitness for Purpose, Railtrack internal paper, London.
O’Brien R. (2005). Further Changes to Part D of the Network Code, Network Rail internal
document, London.
Odijk M.A. (1996). A constraint generation algorithm for construction of periodic railway
timetables. Transportation Research Part B (30), pp.455-464.
Office of Rail Regulation (2005). Implementing the future of rail: proposed modifications to
Network Rail’s Network Licence, www.rail-reg.gov.uk
Office of Rail Regulation (2006). Office of Rail Regulation’s decision on applications for the
Track Access Rights necessary to operate additional passenger services on the East Coast
Main Line, www.rail-reg.gov.uk
Office of Rail Regulation (2006). Hearing on applications for the track access rights
necessary to operate additional passenger services on the East Coast Main Line, www.rail-
reg.gov.uk
Office of the Rail Regulator (1997). The Timetabling of the Railtrack Network: A Consultation
Document, www.rail-reg.gov.uk
Office of the Rail Regulator (1998). The Timetabling of the Railtrack Network: A Policy
Statement, www.rail-reg.gov.uk
248
Office of the Rail Regulator (1999). West Coast Main Line: Statement by the Rail Regulator,
www.rail-reg.gov.uk
Office of the Rail Regulator (2002). Concordat between the Strategic Rail Authority and the
Office of the Rail Regulator, www.rail-reg.gov.uk
Office of the Rail Regulator (2003). The Access Regime, www.rail-reg.gov.uk
Office of the Rail Regulator (2003, 2). Business Plan 2003-2004, www.rail-reg.gov.uk
OpenTrack Railway Technology, (2008).
http://www.opentrack.ch/opentrack/opentrack_e/opentrack_e.html
OPRAF (1997). Office of Passenger Rail Franchising, Annual Report 1996-1997, OPRAF,
London.
Pachl J. (2002). Railway Operation and Control, VTD Rail Publishing, USA.
Pachl J. (Ed.) (2008). Railway Timetabling & Traffic, Eurailpress, Hamburg.
Peeters L. and Kroon L. (2000). A Cycle Based Optimization Model for the Cyclic Railway
Timetabling Problem. In: Voss S. and Daduna J.R. (Eds.) (2001). Computer-Aided Scheduling
of Public Transport, Springer, Berlin.
Peppard J. (1993). Information, Technology, and Strategy. In Peppard J. (Ed.) (1993). I.T.
Strategy for Business, Pitman Publishing, London.
Pepworth A. (2003). RailSys Formal Evaluation, Network Rail internal document, London.
Pidd M (2004). Computer Simulation in Management Science, Wiley, Chichester, UK.
Preston J.M. (1996). The economics of British rail privatisation: an assessment, Transport
Reviews, vol.16, pp.1-22.
249
Radtke A. and Horstel J. (1994). DISPO – Optimal disposition of traction units in large railway
systems. In: Brebbia C.A., Murthy T.K.S., Mellitt B., Sciutto G. and Sone S. Computers in
Railways IV, Volume 1: Railway Design and Management, Southampton, UK.
Radtke A. and Watson R. (2007). Railway simulation in the United Kingdom, Railway Technical
Review 2007, 1, pp. 24-28.
Ragin C.C. (1987). The comparative method: moving beyond qualitative and quantitative
research. University of California Press, Berkeley.
Railtrack plc (1994). APlan 2 – User Requirements Specification. Railtrack internal document,
London.
Railtrack plc (1995). Railtrack Track Access Conditions 1995 (and subsequent revisions; later
renamed Network Code), London.
Railtrack plc Timetable Project Control Group (1996). Lessons Learnt during Production of the
Winter 1995 Great Britain Passenger Timetable, Paper to Group sponsored by David Moss,
London.
Railtrack plc (2000). 2000 Network Management Statement for Great Britain. London: Railtrack
plc, London.
Railtrack plc (2000). Operational Planning Training (Level 1) Student Notes, London.
Railtrack plc (2000). Operational Planning Training (Level 2) Student Notes, London.
Railway Safety (2003?). ERTMS: towards a better safer rail system. Undated pamphlet
published jointly with SRA, London.
Railways Act (1993). Crown Copyright, London.
Rappoport R.N. (1970). Three dilemmas in action research. Human Relations, 23 (4), pp.499-
513. Quoted in Easterby-Smith et al.
250
Reeves C.R. (Ed.) (1993). Modern Heuristic Techniques for Combinatorial Problems, Halsted
Press, New York.
Remenyi D., Williams B., Money A. and Swartz E. (1998). Doing Research in Business and
Management, Sage, London.
Robinson S. (1994). Successful Simulation: A Practical Approach to Simulation Projects,
McGraw Hill, London.
Rodriguez J. (2007). A study of the use of state resources in a constraint-based model for
routing and scheduling trains, Proceedings of the 2nd International Seminar on Railway
Operations Modelling and Analysis, Hannover, Germany, March 28-30, 2007.
Rousseau J.M. and Desrochers M. (Ed.) (1992). Computer-Aided Transit Scheduling. Lecture
Notes in Economics and Mathematical Systems 386, Springer, Berlin.
Salido M.A., Abril M., Barber F., Ingolotti L., Tormos P., Lova A. (2007). Domain-dependent
distributed models for railway scheduling, Knowledge Based Systems (20), pp186–194.
Salim V., Cai X.Q. (1997). A genetic algorithm for railway scheduling with environmental
considerations. Environmental modelling and software (12), pp.301-309.
Sanmarti E., Friedler F. and Puigjaner L. (1998). Combinatorial technique for short term
scheduling of multipurpose batch plants based on schedule-graph representation. Computers in
Chemical Engineering, 1998: 22 (Suppl.).
Schmid F., Evans S., Ainger A.W.S., Grieve R.J. (Ed.s) (1994). Computer Integrated
Production Systems and Organizations: The Human-Centred Approach. NATO ASI Series /
Computer and Systems Sciences, Springer, Berlin.
Schmid F. and König R. (2008). Systems Engineering and the Natural Technical Characteristics
of the Rail Mode of Transport, Presented at IEE International Conference on Railway
Engineering, Hong Kong.
251
Selia A.F., Ceric V. and Tadikamalla P. (2003). Applied Simulation Modeling, Thomson,
Belmont, USA.
Shaw J., Charlton C. and Gibb R. (1998). The competitive spirit re-awakens the ghost of railway
monopoly, Transport Policy, vol. 5, pp.37-49.
Schramm W. (1971). Notes on case studies of instructional media projects, Working paper, the
Academy for Educational Development, Washington DC. Quoted in Yin (1994)
Stallybrass M. (2002). Timetable Robustness Analyser, Paper presented at VST User Conference. York, UK.
Strategic Rail Authority (2001). Directions and Guidance to the Strategic Rail Authority, London.
Strategic Rail Authority (2002). Capacity Utilisation Policy consultation.
Strategic Rail Authority (2002, 1). Statement of Principles.
Strategic Rail Authority (2002). Strategic Plan.
Strategic Rail Authority (2003). Strategic Plan.
Strategic Rail Authority (2003, 1). About us, www.sra.gov.uk.
Strategic Rail Authority (2003, 2). Network Utilisation Strategy.
Strategic Rail Authority (2003, 3). Appraisal Criteria.
Strategic Rail Authority (2004). West Coast Main Line Strategy.
Strategic Rail Authority (2004,1). Midland Main Line Route Utilisation Strategy.
The Times (2006). It's all over for Grandstand after 48 years. 25 April 2006.

252
Tiller M. (2003). Operational Planning Business Improvement – Technical Strategy, internal
Network Rail document, London.
Timetable Planning Strategic Development Group (1993). The Quality Timetable – Towards
Privatisation, Volumes I, II and III.
Tormos P., Lova A., Barber F., Ingolotti L., Abril M., and Salido M.A. (2007). A Genetic
Algorithm for Railway Scheduling Problems, Chapter 8 in Metaheuristics for Scheduling In
Industrial and Manufacturing Applications (Springer Series in Computational Intelligence), (to
appear). Available on line from http://arrival.cti.gr/index.php/Documents/0081.
Transport Act (2000). Crown Copyright, London.
Trapeze (2007). Company Overview, http://www.trapezegroup.com/
TSSA (2004?). Public Ownership: the right track for our railway, TSSA pamphlet, undated.
Turban E. and Liebowitz J. (Ed.) (1992). Managing Expert Systems, Idea Group, Harrisburg,
Pennsylvania.
Tyler J. (2003). In favour of clockface timetables, 2: A Taktfahrplan for Britain, Modern
Railways, June 2003, pp.46-49.
UNIFE (2007). Welcome to the world of ERTMS. www.ertms.com [Web site explaining and
promoting ERTMS]
van de Velde D. (1999). Changing Trains. Railway reform and the role of competition: the
experience of six countries. Aldershot, UK: Ashgate.
Verwey H. (2004). Performance Model Review, consultancy study for SRA, London.
Voss S. and Daduna J.R. (Eds.) (2001). Computer-Aided Scheduling of Public Transport,
Springer, Berlin.
253
Wall Street Transcript (1999). CEO interview: Gerald Corbett, Railtrack PLC, The Wall Street
Transcript, 31.5.99. Available on-line at http://www.twst.com/pdf/rtk.pdf
Wallace R. (1995). Train scheduling - migration from manual methods to scalable computer
platforms. In: Daduna J.R., Branco I.M., Pinto Paixao J.M. (Eds.) Computer-Aided Transit
Scheduling, Berlin: Springer, pp.321-333.
Watson R. (1982). Towers and Turnover: an action research study of induction and socialisation
in a voluntary organisation, Thesis (MPhil), University of Oxford.
Watson R. and Humphreys I. (1999). Resource Planning Processes - linear, iterative or holistic?
The case of train planning. In: Aisbett J., Gibbon G. (Eds.), Proceedings of the Second
International Conference on Managing Enterprises, Newcastle NSW, The University of
Newcastle, pp87-91. ISBN 0 7259 1078 X.
Watson R. (2000). Prospects for computer aided railway scheduling: perspectives from users
and parallels from mass transit. Transport Planning and Technology (12), pp.303-321.
Watson R., Cooper G., Nicholls S., Grant B., Wood D. (2000). The role of automated timetable
generation in the development of improved railway/mass transit timetables and infrastructure
configurations - a simulated annealing approach assessed from a business perspective, 8th
International Conference in Computer Aided Scheduling of Public Transport, Berlin 2000.
Watson R. and Bradshaw I. (2001). The East London Line Extension - A PTG Case Study,
Unpublished report prepared for Railtrack.
Watson R. (2001). Railway Scheduling. In: Button K.J. and Hensher D.A. (Ed.), Handbook of
Transport Systems and Traffic Control, pp.527-538. Elsevier Science, Oxford.
Watson R. (2001). The effect of railway privatisation on train planning: a case study of the UK,
Transport Reviews, Vol 21, no 2, pp.181-193.
254
Watson R. and Boodoo A. (2002). Objectives for timetable planning in Britain, Railway
timetabling, policy, institutions and practice. Lessons from mainland Europe, York, February
2002.
Watson R. (2003). The role of timetable generation software in the planning and exploitation of
railway infrastructure capacity. Universities Transport Studies Group Conference, January
2003.
Watson R., Gillingwater D., and Boodoo A. (2003). Using network capacity effectively where
train operators compete for paths - the UK experience, Proceedings of the World Congress on
Railway Research 2003, Edinburgh.
Watson R. (2006). Automated Railway Timetable Generation – progress in the UK? Presented
to 10th Computer Aided Scheduling in Public Transport conference, Leeds, UK.
Watson R. (2006, 2). Using stochastic simulation to predict timetable performance – status and
developments in the UK, paper to 1st International Seminar on Railway Operations Modelling
and Analysis, Delft.
Watson R. (2007). Timetable Optimisation Objectives - priorities, categories and problems. In:
Hansen, I.A., Radtke A., Pachl J. and Wendler E. (Eds). Proceedings of the 2nd International
Seminar on Railway Operations Modelling and Analysis, Hannover, Germany, March 28-30,
2007.
Watson R. and Radtke A. (2007). Railway simulation in the United Kingdom, The International
Journal for Rail Engineering, Operators and Scientists, Railway Technical Review, Volume 47,
2007, p24-28.
Watson S.R. and Buede D.M., (1987). Decision Synthesis: The Principles and Practice of
Decision Analysis, Cambridge University Press, Cambridge UK. Quoted in Klein and Methlie
(1990).
Watson T.J. (1997). Theorizing Managerial Work: a Pragmatic Pluralist Approach to
Interdisciplinary Research, British Journal of Management, 8 (1), pp.3-9.

255
Welsby J. and Nichols A. (1999). The privatisation of Britain's railways - An inside view, Journal
of Transport Economics and Policy, vol. 33/1, pp. 55-76.
White P. (1995). Public Transport: Its planning, management and operation, The natural and
built environment series 3, UCL Press, London.
White P. (1998). Impacts of railway privatization in Britain, Transport Reviews, vol. 18, pp.109-
130.
Williamson J.W. (1938). Railways To-day, Oxford University Press, London.
Willis G. (1992). Train Planning: An investigation into Train Planning Processes and Systems as
used throughout Network SouthEast. Unpublished British Rail internal report.
Wilson N H M Ed. (1999). Computer-Aided Transit Scheduling, Springer, Berlin.
Wolmar C. (1996). The Great British Railway Disaster, Ian Allan, Shepperton, UK.
Wolmar C. (2005). On The Wrong Line: How Ideology and Incompetence Wrecked Britain's
Railways, Aurum Press, UK.
Wren A. and Rousseau J.M. (1995). Bus driver scheduling - an overview, In: Computer-Aided
Transit Scheduling. Lecture Notes in Economics and Mathematical Systems 430, pp.173-188.
Wren A. (1996). Scheduling, Timetabling and Rostering - A Special Relationship?, In Ed. Burke
E. and Ross P. Practice and Theory of Automated Timetabling: First International Conference
1995. Lecture Notes in Computer Science 1153, pp.46-71.
Yin R.K. (1994). Case Study Research: Design and Methods (2nd Edition), Sage, Thousand
Oaks, California.
Yin R.K. (2003). Applications of Case Study Research (2nd Edition), Sage, Thousand Oaks,
California.