Embed Size (px)
Citation preview

Training ICE Basics
TRACE32 Online Help
TRACE32 Directory
TRACE32 Index
TRACE32 Training ............................................................................................................................
Training ICE Emulator ...................................................................................................................
Training ICE Basics .................................................................................................................... 1
System Architecture TRACE32-ICE ....................................................................................... 4
Module Structure 4
SCU32 - System Controller Unit 5
ECU32 - Emulation Controller Unit 6
HA120 - High Speed State Analyzer 7
ICE Base 7
CPU Pod 7
Block Diagram of TRACE32 Hardware 8
TRACE32 Software 9
Setup the TRACE32 Software ................................................................................................ 10
The Properties Window (Windows only) 10
The Configuration File 11
Starting-up the Emulator ........................................................................................................ 16
System Settings 16
Select the System Mode 17
Dual-Port Access 19
Mapper 20
Mapper Configuration 21
Memory Attributes 25
Examples 26
Download the Program 27
Initialize the Registers 27
Start-Up File 28
TRACE32 GUI ........................................................................................................................... 31
Main Menu Bar and Accelerators 32
Main Tool Bar 33
Window Area 34
Command Line 37
Command Structure 37
Command Examples 38
The Online Help for a specific Command 39
Training ICE Basics 1 ©1989-2018 Lauterbach GmbH

Standard Parameter Syntax 40
Message Line 41
Softkeys 42
State Line 43
Registers .................................................................................................................................. 44
Display the CPU Registers 44
Colored Display of changed Registers 45
Modify the Contents of a CPU Register 46
Display the Special Function Registers 47
Tree Display 47
Full Display 48
Details about a Single SFR 49
The PER Definition File 50
Modify a Special Function Register 51
Data and Program Memory ..................................................................................................... 53
Dualport Access 53
Display a Hex Dump 55
Data Dump Dialog Box 59
Dump Window 61
Indirect Dump 64
Modify Memory 65
Display a Source Listing 66
Changing Code Lines 68
Breakpoints .............................................................................................................................. 69
Implementation 69
Synchronous/Asynchronous Breakpoints 71
Program Breakpoint (Synchronous) 71
HLL Breakpoints (Synchronous) 72
Read Breakpoint (Asynchronous) 73
Write Breakpoint (Asynchronous) 75
Spot Breakpoints (Synchronous/Asynchronous) 76
Permanent/Temporary Breakpoints 78
Breakpoint Handling 79
Set Breakpoints 79
Set any breakpoint using the Break.Set Dialog Box 81
Single Address
HLL-Range
HLL Expression
Display Breakpoints 84
Delete Breakpoints 85
Deletes all Breakpoints except the hll Breakpoints
Store Breakpoint Settings 86
Training ICE Basics 2 ©1989-2018 Lauterbach GmbH

Breakpoint Control .................................................................................................................. 88
Emulator Main Trigger Unit 88
Trigger Sources 89
Trigger Modes 92
Spot System 92
Debugging ................................................................................................................................ 93
Basic Debug Control 93
Flag Memory ............................................................................................................................ 96
Display Flag Information 97
Code Coverage 98
Checking Variables 99
Unused Variables 99
Uninitialized Variables 100
Stack Depth Analysis 102
Document your Results .......................................................................................................... 103
Print your Results 103
Save your Results to a File 105
Training ICE Basics 3 ©1989-2018 Lauterbach GmbH

Training ICE Basics
Version 16-Nov-2018
System Architecture TRACE32-ICE
TRACE32 product idea:
• Modularity
Allows to configure TRACE32-ICE to fit your project requirements (host interface, size of the emulation memory, adaptation etc.)
• Universality
Most of the system is universal for all CPUs supported by TRACE32-ICE ➨ moving to another CPU or an other architecture requires only a few changes in the hardware configuration
Module Structure
System Controller Unit (SCU32)
Emulation Controller Unit (ECU32)
Static Emulation Memory (SRAM)
High Speed State Analyzer (HA120)
ICE-Base (ICE xxx)
Pod
CPU independentmodules
Training ICE Basics 4 ©1989-2018 Lauterbach GmbH

SCU32 - System Controller Unit
• Processing Unit
The SCU32 contains a 32-bit CPU that runs the TRACE32-ICE system software. All operations are performed in the emulator. The debug information is also downloaded to the emulator and is maintained there.
• SCU memory
The SCU has its own memory. Default size is 64 MByte and the memory can be upgraded up to 128 MByte.
• Connection to host
The download time also includes the time to build up the internal symbol data base.
• Power Supply
SETUP.MEMory
Download Times
Parallel Interface (LPT) 100-500 KByte/s
USB up to 900 KByte/s
Ethernet Interface for 10 BaseT ethernet(Twisted Pair Interface, AUI Connector)
up to 900 KByte/s
Total memory Free memory
USBInterface
LPTInterface
Twisted PairInterface
AUIConnector
ERRORLEDs
SYNCConnector
Training ICE Basics 5 ©1989-2018 Lauterbach GmbH

ECU32 - Emulation Controller Unit
The Emulation Controller Unit contains all parts of an emulator which are not CPU specific:
• Mapper
• Emulator Trigger Unit
• Universal Counter
• VCO
• etc.
The Emulation Controller can also contain the Emulation Memory Card (SDIL).
Probe connectors:
Probe Connectors
BANK Input Input for external banking.If your target is using specific ports or addresses for bank selec-tion, these signals have to be fed back into the emulator espe-cially for the use of breakpoints and tracing.
EXTERNAL Input The EXTERNAL probe allows you to combine asynchronous or synchronous events and to synchronize these events with the trigger units of TRACE32-ICE.The EXTERNAL input can be configured by the TrIn com-mand.
STROBE Output The STROBE outputs provides information on the internal state of TRACE32-ICE and on the occurrence of trigger events.
PODBUS Connector to add additional devices to TRACE32-ICE like Stim-uli Generator, BDM Debugger etc.
ECU32 BANK EXTERNAL STROBE PODBUS
Training ICE Basics 6 ©1989-2018 Lauterbach GmbH

HA120 - High Speed State Analyzer
The HA120 consists of 3 parts:
1. Trace Memory
Up to 376 CPU lines can be recorded on each CPU cyclesmallest cycle time is 50ns trace depth is 32k frameseach entry to the trace buffer is marked by a timestamp with a resolution of 25 ns
2. Programmable Trigger Unit
Trigger programs can be used to do selective tracing or to generate an event depending on the current state of the system
3. Performance Analyzer
For performance analysis based on programs, functions or modules. The resolution of the performance analyzer is 1s.
Probe connectors:
ICE Base
The ICE-Base usually supports a complete CPU family. It includes all parts of the emulator, that are specific for the supported CPU family
• Exception handler
• Dual-port controller
• etc.
CPU Pod
Probe Connectors
TRIGGER A/TRIGGER B
Input 16 external trigger inputs
TRACEBUS Not used
OUT Output Trigger outputs (C and D)
HA120 TRIGGER A TRIGGER B TRACEBUS OUT
Training ICE Basics 7 ©1989-2018 Lauterbach GmbH

Block Diagram of TRACE32 Hardware
CPUdual port logic
emulation ram
MAP
MAP
MAP
R/W
MAPinternal/external
flagram
break ram
TRIGGER system trigger signals
address
data
TARGET
TRACEmemory
extension
addressdatastrobesevents...
Training ICE Basics 8 ©1989-2018 Lauterbach GmbH

TRACE32 Software
• Display:
- User programs: ASM and HLL mode, different program languages
- Data: different formats, structures
- Register: CPU register, periphery register (bits and sense)
• Program control:
- Step and Go: MIX and HLL mode
- Break: program (synchronous) and data (asynchronous) break
• Analyzer:
- Program flow
- Selectiv trace
• Performance Analyzer:
- Performance analysis
- Statistic information using analyzer memory and trigger unit
• Code Coverage using flag ram
- Controling of read and write access: HLL lines, variables and data areas
Training ICE Basics 9 ©1989-2018 Lauterbach GmbH

Setup the TRACE32 Software
The Properties Window (Windows only)
The properties window of your application allows some basic setting for the ICE.
1. Definition of a user specific configuration file.
The configuration file defines how the TRACE32 software works together with the other components of the host system.
By default the configuration file config.t32 in the system directory is used. The option -c allows you to define your own location and name for the configuration file.
Example:
C:\T32_ICE68020\t32win.exe -c G:\AND\config_USB.t32
Definition of a start-up script.
It is also possible to define a .cmm script, that should automatically be executed when the TRACE32 software is started.
Example:
C:\T32_ICE68020\t32win.exe -c G:\and\config_USB.t32 -s G:\and\start.cmm
2. Definition of a working directory.
It is recommended not to work in the system directory.
3. Definition of the start-up size of the application program.
1
2
3
Training ICE Basics 10 ©1989-2018 Lauterbach GmbH

The Configuration File
The configuration file config.t32 is automatically generated by the installation software and stored to the system directory.
The configuration file defines which hardware drivers are loaded and how they are configured.
Required Hardware Drivers
Host Interface LINK=
Environment OS=ID=<id>TMP=<temp directory>SYS=<system directory>
Printer PRINTER=
OS=SYS=c:\t32 ; system directoryTMP=c:\tmp ; tmp directory
LINK=USB
PRINTER=WINDOWS ; printer configuration
• Drivers are defined block wise in the config file
• The first line/headline defines the driver type
• Each definition ends with an empty line
• If no driver is defined, the default driver will be loaded
Training ICE Basics 11 ©1989-2018 Lauterbach GmbH

Configuration File for Parallel Interface
Configuration file for standard mode:
Configuration file for ECP mode:
; Host interfaceLINK=PARLPT1 ; or optional LPT2/LPT3
; Environment variablesOS=ID=T32TMP=C:\tempSYS=d:\t32\par
; temp directory for TRACE32; system directory for TRACE32
; Printer settingsPRINTER=WINDOWS ; all standard windows printer can be
; used from the TRACE32 user interface
; Host interfaceLINK=PARLPT1 ECP ; 2-5 times faster then standard mode
; Environment variablesOS=ID=T32TMP=C:\tempSYS=d:\t32\par
; temp directory for TRACE32; system directory for TRACE32
; Printer settingsPRINTER=WINDOWS ; all standard windows printer can be
; used from the TRACE32 user interface
Training ICE Basics 12 ©1989-2018 Lauterbach GmbH
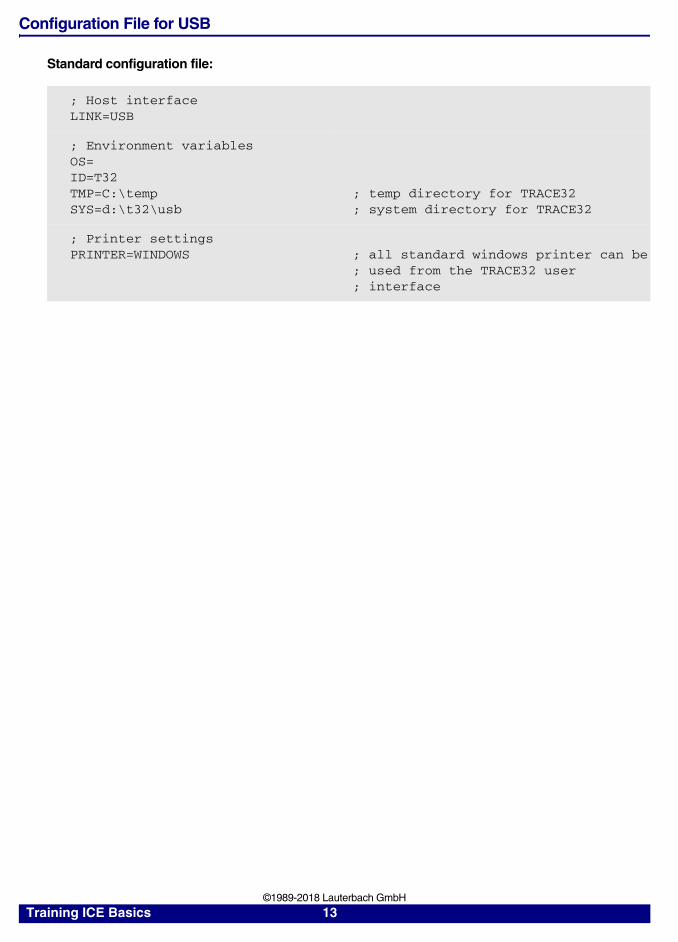
Configuration File for USB
Standard configuration file:
; Host interfaceLINK=USB
; Environment variablesOS=ID=T32TMP=C:\tempSYS=d:\t32\usb
; temp directory for TRACE32; system directory for TRACE32
; Printer settingsPRINTER=WINDOWS ; all standard windows printer can be
; used from the TRACE32 user; interface
Training ICE Basics 13 ©1989-2018 Lauterbach GmbH

Configuration File for PODETH
Standard configuration file:
; Host interfaceLINK=NETNODE=t32PACKLEN=1024
; Environment variablesOS=ID=T32TMP=C:\tempSYS=d:\t32\eth
; temp directory for TRACE32; system directory for TRACE32
; Printer settingsPRINTER=WINDOWS ; all standard windows printer can be
; used from the TRACE32 user; interface
Training ICE Basics 14 ©1989-2018 Lauterbach GmbH

Additional Hardware Drivers
Display SCREEN=FONT=SMALL ; Use smaller fontsHEADER=<name> ; Define header text for window
Training ICE Basics 15 ©1989-2018 Lauterbach GmbH

Starting-up the Emulator
Starting up the emulator is done in the following steps:
1. Set the system settings and activate the emulator
2. Configure the mapper
3. Download the program
4. (Set PC and SP)
System Settings
System is Down (emulator in reset) or Up (emulator is active).
Reset the emulator
Triggers the CPU reset command, which initializes the peripherals (not available on all CPUs)
Display the type and the max. frequency of the emulation CPU
Clock select
Training ICE Basics 16 ©1989-2018 Lauterbach GmbH

Select the System Mode
StandBy Emulator is in StandBy mode and waits for target power and clock. As soon as the target power and clock is available, the EmulExt mode is activated.
This is useful, if there are several CPUs on the target, which should be started synchronously.
Not available on all CPUs.
AloneInt Emulator is working in stand-alone mode. The internal (emulator) clock is used and all lines to the target are blocked.
AloneExt The emulator is working in stand-alone mode. The external (target) clock is used and all lines to the target are blocked.
EmulInt The emulator works with access to the target system and uses the internal (emulator) clock.
EmulExt The emulator works with access to the target system and uses the external (target) clock.
Training ICE Basics 17 ©1989-2018 Lauterbach GmbH

If the internal clock is used (AloneInt and EmulInt mode) you can select the clock here.
The external clock can be checked by using:
VCO Clock is set using the VCO. The frequency range for the VCO is 2 … 70 MHz
Low 2.5 MHz
Mid 5 MHz
High 10 MHz
Up and Down in 50 kHz steps
Training ICE Basics 18 ©1989-2018 Lauterbach GmbH

Dual-Port Access
Via the Emulator Controller Unit the memories within the ICE can be read or written to while the CPU is executing the program. This means for the user:
• Read and write access to the emulation memory
• Trigger programming
• Read access to the flag memory
is supported while the program execution is running.
There is no effect on the realtime behavior or the effect is very small.
Timeout for the dualport access and for the access to the target memory
TimeOut Timeout for access to the target memory. When an access to the target memory is not terminated within this time, the emulator will terminate the bus cycle. Timeout error message is then displayed in the emulator state line.
TimeRequest Timeout for the dualport access. After the specified time the attempt to do a dualport access will be aborted and an error message will be displayed.
Targ
et
CPU/MCU
DebugMonitor
Mapper
Emulator Controller Unit
Emulation Memory
Break Memory
Dual-portController
synch
ron
ou
s access ‘E‘
access ‘C‘
Flag Memory
breakp
oin
ts
Training ICE Basics 19 ©1989-2018 Lauterbach GmbH

Mapper
The mapper is used to simulate the target memory configuration within the emulator and to set memory attributes.
The emulator has 3 different memories:
• Emulation memory
Emulation memory has to be allocated and assigned.
• Flag memory
Flag memory has to be allocated.
• Break memory
Break memory is automatically allocated, when a breakpoint is set.
The memories can be mapped independently.
MAP.state State of mapper
Training ICE Basics 20 ©1989-2018 Lauterbach GmbH

Mapper Configuration
The configuration of the mapper is done in 3 steps:
1. Select the mapper mode
2. Define the memory organization
3. Activate the memory
Select the Mapper Mode
The emulator supports 2 mapper modes:
For information which mapper mode you should use, please refer in the ICE Target Guide to the section Emulation Frequency. For some CPUs the dualport access has also influence on the max. cpu speed.
Mapper Mode SLOW:
Map.Mode Slow
For some CPUs the CPU can not reach high frequencies in this mode. But memory mapping is done in 4 KByte blocks.
Map.Mode Fast
The CPU can work up to a higher speed, but memory mapping is done in 512 KByte blocks.
A0
A10
A23
RAM
MAPPER
Training ICE Basics 21 ©1989-2018 Lauterbach GmbH
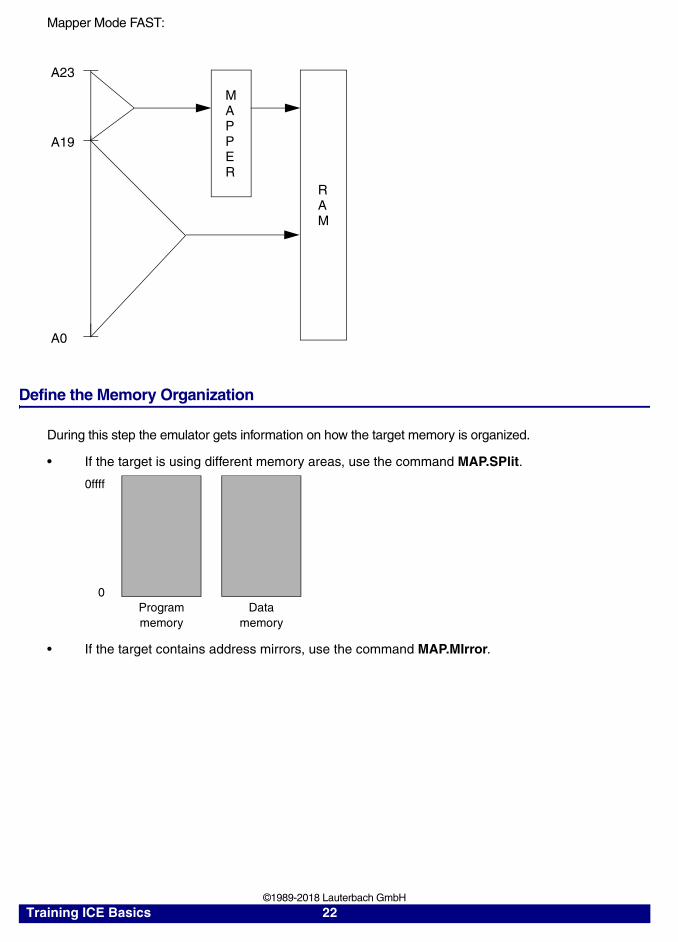
Mapper Mode FAST:
Define the Memory Organization
During this step the emulator gets information on how the target memory is organized.
• If the target is using different memory areas, use the command MAP.SPlit.
• If the target contains address mirrors, use the command MAP.MIrror.
A0
A19
A23
RAM
MAPPER
0
0ffff
Programmemory
Datamemory
Training ICE Basics 22 ©1989-2018 Lauterbach GmbH

• If you are using a 32-bit CPU use MAP.PRE to define the workbenches.
The basic mapper of TRACE32 uses an address area of 16 MByte. The CPU however supplies 32 address lines, which means an address range up to 4 GByte. TRACE32 solves this problem by a 2-stage mapping system. The first system, named premapper, allows to define 16 different 1 MByte areas named workbenches. Within this areas it is possible to set breakpoints on a byte by byte level. Outside this area breakpoints may only be set on ranges limited by 1 MByte.
All settings done within the first 2 steps are locked and can only be changed after MAP.RESet.
A0
A19
A23
RAM
MAPPER
A31PREMAPPER
4
Training ICE Basics 23 ©1989-2018 Lauterbach GmbH

Activate the Memory
During this step the memories are allocated and you have to define, for which memory range the emulator should use emulation/overlay memory.
Commands for Memory Allocation:
By default (no mapping is done) the emulator always sees the target memory.
MAP.Data [<range>] Map data memory
MAP.Break [<range>] Map break memory
MAP.Flag [<range>] Map flag memory
MAP.Ram [<range>] Map RAM
MAP.NoBreak [<range>] Release break memory
Training ICE Basics 24 ©1989-2018 Lauterbach GmbH

After the memory allocation you have to decide where you want to use emulation memory and where you want to use target memory.
If emulation memory is mapped, the emulation memory will be located parallel to the target memory.
Memory Attributes
The protect attribute is used to simulate a ROM using the emulation memory. The protection is only active, when the realtime emulation is running (write cycles are ignored).
MAP.Intern [<range>] Internal memory
MAP.Extern [<range>] External memory
MAP.DEFault [<range>] [/<option>] Standard memory mapping
MAP.Wait <waitcycles> [<range>] Wait cycles
MAP.Protect [<range>] Write protection
MAP.BUS8 [<range>] Bus width mapping
Processor Specific Memory Attributes [<range>] Bus width mapping
Emulation CPU
Target MemoryEmulation Memory
Memory Write Cycles
Emulation CPU
Target MemoryEmulation Memory
Memory Read Cycles
At memory read cycles the mapperdecides which data are used by the CPU
Training ICE Basics 25 ©1989-2018 Lauterbach GmbH

Examples
Example for 80386
Example for 80535
map.resetmap.mode fast
map.pre c:0000000--00fffffmap.pre c:3f00000--3ffffff
map.ram ap:0000000--00fffffmap.intern ap:0000000--00fffff
; reset mapper (all external); use fast mode
; premapper: use low 1MB; use top 1MB
; use overlay/emulation memory ; for the low 1MB
map.reset
map.split p:0--0ffff
map.ram p:0--0ffffmap.intern p:0--0ffff
; reset mapper (all external)
; separate the 64K code area
; use overlay/emulation memory for; the code area
Training ICE Basics 26 ©1989-2018 Lauterbach GmbH

Download the Program
Compiler-specific load command can be found in the ICE Target Guide.
Menu: HelpICE Target Guide, section Compilers.
Initialize the Registers
Data.LOAD <filename> </option> Load file
Register.Set <register> <value> Modify register contents
Data.Set [<address>|<range>] %<format> /<option> Modify memory
Training ICE Basics 27 ©1989-2018 Lauterbach GmbH

Start-Up File
It is recommended to write a batch job to setup the emulator to guarantee an proper start-up sequence.
Default extension for a batch job is .cmm.
Example for 68HC12:
SYStem.RESetSYStem.CPU M68HC12BC
SYStem.CPU SpSingle
SYStem.Option v33 on
SYStem.Option A16 OFF
SYStem.Option CSP0 OFF
; reset system settings ; define the used CPU
; selects bus operation mode
; 3.3 V target
; off: A16 is used as general I/O pin; on: A16 is used as address line
; off: Chip select program 0 is used as; general I/O pin; on: Chip select program 0 is used; as address line
SYStem.Access DUMMY ; the emulator uses dummy cycles for; hidden access
map.resetmap.mode fastmap.ram 0x08000--0x0FFFFmap.intern 0x08000--0x0FFFF
MAP.OPFetch 0x0C000--0x0FFFF
; reset mapper; use fast mode; emulation RAM; memory accesses in the range from; 08000--0ffff are done to internal; emulation RAM; define the area 0C000--0FFFF as code; area -> the area from 0--0BFFF is; treated as data area
vco.clock 16. ; frequency: set to 16 MHz; (necessary if internal clock used)
system.mode emulint ; system up: emulation external; (target, ext. clock); or: system.mode aloneint; (stand alone, int. clock)
Training ICE Basics 28 ©1989-2018 Lauterbach GmbH

A first example for a start up batch job can be found in the ICE Target Guide.
Menu: HelpICE Target Guide, section Quick Start.
Data.Set d:0x038 0x0F
Data.Set d:0x03C 0x030
Data.Set d:0x037 0x0C0
; specify which lines of Port G are used; as general purpose I/O and which are; used as address lines by writing MXAR; activate used chip selects by writing ; CSCTL registers; activate used windows by writing; WINDEF registers
Data.Load.COSMIC file.cos12 /verify
; load application file and verify if it; is written correct to memory
ENDDO
Training ICE Basics 29 ©1989-2018 Lauterbach GmbH

Run the Start-up File
DO <filename> [<parlist>] Start PRACTICE program
Training ICE Basics 30 ©1989-2018 Lauterbach GmbH

TRACE32 GUI
The structure and functionality of the GUI is defined by the file t32.men in the TRACE32 system directory.
TRACE32 allows you to modify the GUI so it will better fit to your requirements.
Main Menu Bar +Accelerators
Main Tool Bar
Local Popup
Local Buttons
Menu
Training ICE Basics 31 ©1989-2018 Lauterbach GmbH

Main Menu Bar and Accelerators
The main menu bar provides all important TRACE32 functions sorted by groups.
For often used commands accelerators are defined.
A user specific menu can be defined very easily:
MENU.AddMenu <name> <command> Add a user menu
MENU.RESet Reset menu to default
Menu.AddMenu "Set PC to main" "Register.Set pc main"
Menu.AddMenu "Set PC to main, ALT+F10" "Register.Set pc main"
; User menu with accelerator
For more complex changes to the main menu bar refer to the training section:Menu Programming
Accelerators
User Menu
Training ICE Basics 32 ©1989-2018 Lauterbach GmbH

Main Tool Bar
The main tool bar provides fast access to often used commands.
The user can add his own buttons very easily:
Information on the <tool image> can be found in Help -> TRACE32 Documents -> IDE User Interface -> -> IDE Reference Guide -> MENU -> Programming Commands -> TOOLITEM.
MENU.AddTool <tooltip text> <tool image> <command> Add a button to the toolbar
MENU.RESet Reset menu to default
MENU.AddTool "Set PC to main" "PM,X" "Register.Set PC main"
For more complex changes to the main tool bar refer to the training section: Menu Programming
User specificbutton
Training ICE Basics 33 ©1989-2018 Lauterbach GmbH
Window Area
Save Page Layout
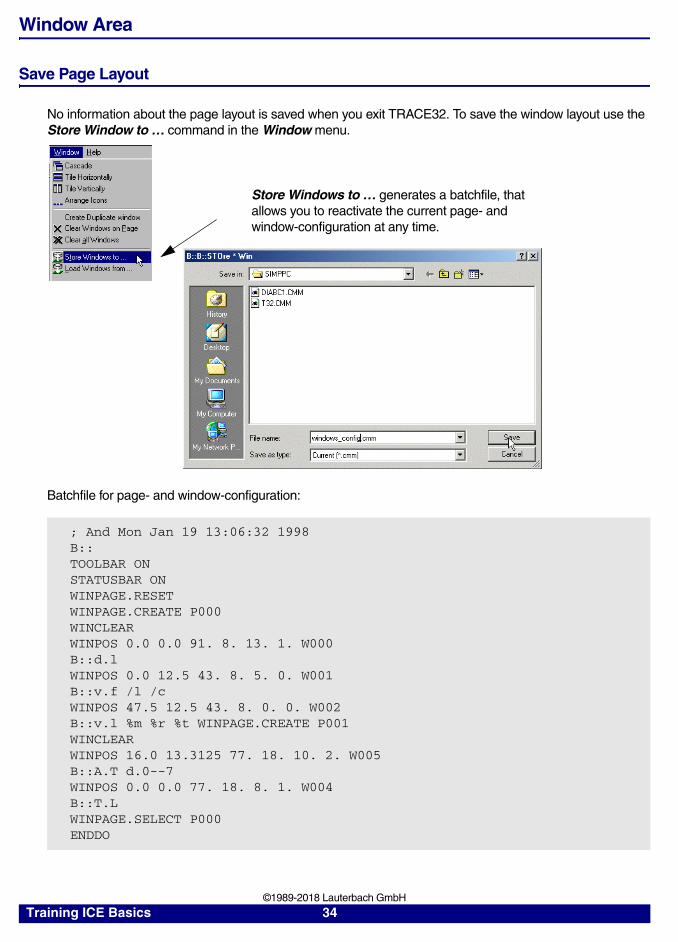
No information about the page layout is saved when you exit TRACE32. To save the window layout use the Store Window to … command in the Window menu.
Batchfile for page- and window-configuration:
; And Mon Jan 19 13:06:32 1998B::TOOLBAR ONSTATUSBAR ONWINPAGE.RESETWINPAGE.CREATE P000WINCLEARWINPOS 0.0 0.0 91. 8. 13. 1. W000B::d.lWINPOS 0.0 12.5 43. 8. 5. 0. W001B::v.f /l /cWINPOS 47.5 12.5 43. 8. 0. 0. W002B::v.l %m %r %t WINPAGE.CREATE P001WINCLEARWINPOS 16.0 13.3125 77. 18. 10. 2. W005B::A.T d.0--7WINPOS 0.0 0.0 77. 18. 8. 1. W004B::T.LWINPAGE.SELECT P000ENDDO
Store Windows to … generates a batchfile, that allows you to reactivate the current page- and window-configuration at any time.
Training ICE Basics 34 ©1989-2018 Lauterbach GmbH

Run the batchfile to reactivate the storedpage- and window-configuration
Training ICE Basics 35 ©1989-2018 Lauterbach GmbH
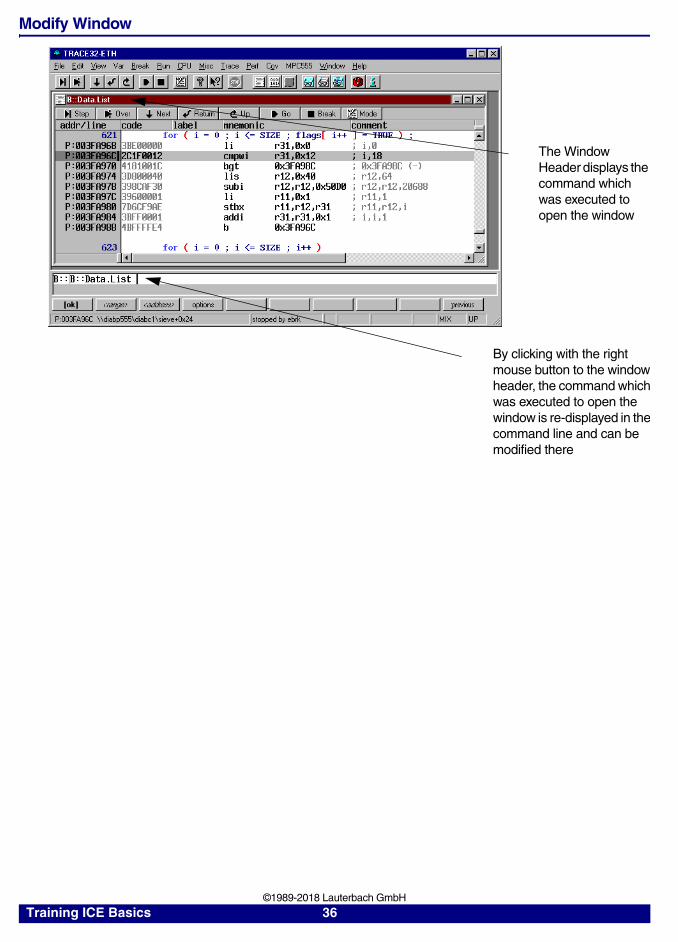
Modify Window
The Window Header displays the command which was executed to open the window
By clicking with the right mouse button to the window header, the command whichwas executed to open the window is re-displayed in thecommand line and can be modified there
Training ICE Basics 36 ©1989-2018 Lauterbach GmbH

Command Line
Command Structure
Device Prompt
Selects the command set used by the TRAC32:
no device prompt TRACE32-IDE
E:: command set for TRACE32-ICE
B:: command set for TRACE32-ICD (Debugger)
F:: command set for TRACE32-FIRE (RISC Emulator)
Command line
Training ICE Basics 37 ©1989-2018 Lauterbach GmbH

Command Examples
Each command can be abbreviated. The significant letters are always written in upper case letters.
Data Command group to display, modify … memory
Data.dump Displays a hex dump
Data.List Displays a source listing
Data.LOAD Loads code to the target memory
Break Command group to set, list, delete … breakpoints
Break.Set Sets a breakpoint
Break.List Lists all set breakpoint
Break.Delete Deletes a breakpoint
Data.dump 0x1000--0x2000 /Byte
Command groupSubcommand
Parameter
Option
Training ICE Basics 38 ©1989-2018 Lauterbach GmbH

The Online Help for a specific Command
Enter the command to the command line.
Push F1 to get the on-line help for the specified command.Add one blank.
Training ICE Basics 39 ©1989-2018 Lauterbach GmbH

Standard Parameter Syntax
The RADIX defines the input format for numeric values.
Examples:
To see the currently used parameter syntax, enter RADIX. to the command line.
RADIX.<mode> Define parameter syntax
RADIX.Decimal Number base is decimal and C-like operators are used
RADIX.Hex Number base is hex and C-like operators are used (default)
Decimal Hex
Data.dump 100 100d 100h
Data.dump 100. 100d 100d
Data.dump 0x100 100h 100h
Training ICE Basics 40 ©1989-2018 Lauterbach GmbH

Message Line
• Message line for system and error messages
• Message Area window for the display of the last system and error messages
Message Line
Message Area
Training ICE Basics 41 ©1989-2018 Lauterbach GmbH

Softkeys
The softkey line allows to enter a specific command step by step.
Select the command group
Select the subcommand
Angle brackets request an entry from the user. Here e.g. the entry of an <address> or a <range>.
Get a display of all options
Select an option
Training ICE Basics 42 ©1989-2018 Lauterbach GmbH

State Line
Symbolic and absoluteaddress at the blue cursor
State of the system Debug mode
Training ICE Basics 43 ©1989-2018 Lauterbach GmbH

Registers
Display the CPU Registers
Training ICE Basics 44 ©1989-2018 Lauterbach GmbH

Colored Display of changed Registers
Register.view [/<option>] Display CPU registers
SETUP.Var %SpotLight Switch the option SpotLight on for all Variable windows, the Register window, the Peripheral window, the HLL Stack Frame window and all Data.dump windows
Register.view /SpotLight
The registers changed by the last step are markedin dark red. The registers changed by the step beforethe last step are marked a little bit lighter. This worksup to a level of 4.
If SpotLight is ON, the SpotLight feature is automatically on for:1.) all Variable windows2.) the Register window this includes also register bits3.) the Peripheral window4.) the hll stack frame5.) all Data.dump windowsThe SpotLight feature will be only valid for windows, which will be opend after activating this feature.
Training ICE Basics 45 ©1989-2018 Lauterbach GmbH

Modify the Contents of a CPU Register
Register.Set <register> <value> Modify CPU register
By double clicking to the register contents a Register.Set command is automatically displayed
in the command line.Enter the new value and press Return to modify the
register contents.
Training ICE Basics 46 ©1989-2018 Lauterbach GmbH

Display the Special Function Registers
TRACE32 supports a free configurable window to display/manipulate configuration registers and the on-chip peripheral registers at a logical level. Predefined peripheral windows are available for most standard CPUs.
Tree Display
The individual configuration registers/on-chip peripherals are organized by TRACE32 in a tree structure. On demand, details about a selected register can be displayed.
Training ICE Basics 47 ©1989-2018 Lauterbach GmbH

Full Display
Sometimes it might be useful to expand the tree structure from the start.
The following command sequence can be used to save the contents of all configuration registers/on-chip peripheral registers to a file.
PER.View , "Clocks and Power Control" ; Display the functional unit; "Clocks and Power Control" in; expanded mode
PER.View , "*" ; Display all functional units in; expanded mode
PRinTer.FileType ASCIIE ; Select ASCII ENHANCED as output; format
PRinTer.FILE Per.lst ; Define Per.lst as output file
WinPrint.Per.view , "*" ; Save contents of all; configuration registers/on-chip; periperal registers to the; specified file
Use the right mouse and select Show all
Training ICE Basics 48 ©1989-2018 Lauterbach GmbH

Details about a Single SFR
The address, bit position and the full name of the selected item are displayed in the state line; the full name of the selected item is taken from theCPU manual.
Training ICE Basics 49 ©1989-2018 Lauterbach GmbH

The PER Definition File
The layout of the PER window is described by a PER definition file.
The definition can be changed to fit to your requirements using the PER command group.
The path and the version of the actual PER definition file can be displayed by using:
VERSION.SOFTWARE
PER.view <filename> [<tree-search-item>] Display the configuration registers/on-chip peripherals
PER.view C:\T32\perarm9t.per Use the peripheral file perarm9t.per instead of the default PER definition file
Training ICE Basics 50 ©1989-2018 Lauterbach GmbH

Modify a Special Function Register
You can modify the contents of a configuration/on-chip peripheral register:
• By pressing the right mouse button and selecting one of the predefined values from the pull-down menu.
• By a double-click to a numeric value. A PER.Set command to change the contents of the selected register is displayed in the command line. Enter the new value and confirm it with return.
PER.Set.simple <address>|<range> [<%format>] <string> Modify configuration register/on-chip peripheral
Data.Set <address>|<range> [<%format>] <string> Modify memory
PER.Set.simple D:0xF87FFF10 %Long 0x00000b02
Training ICE Basics 51 ©1989-2018 Lauterbach GmbH

Training ICE Basics 52 ©1989-2018 Lauterbach GmbH

Data and Program Memory
Depending on the setting of the mapper target memory or emulation memory is displayed and can be modified.
Dualport Access
The default memory access is done by the Emulation CPU. Depending on the mapper settings target memory or emulation/overlay memory is accessed. Using the default access it is not possible to display or modify memory by the TRACE32 user interface while the Emulation CPU is executing the application program.
Using the Dualport access, the memory access is done via the Emulation Controller Unit. Using this memory access it is possible to display and modify the emulation/overlay memory while the system in running in real-time.
EmulationController Unit
EmulationMemory
DebugMonitor
EmulationCPU
DualportController
Internal/ExternalMapping
Targ
etDualport
Controller
EmulationController Unit
EmulationMemory
DebugMonitor
EmulationCPU
DualportController
Internal/ExternalMapping
Targ
et
DualportController
Training ICE Basics 53 ©1989-2018 Lauterbach GmbH

Training ICE Basics 54 ©1989-2018 Lauterbach GmbH

Display a Hex Dump
Address
Training ICE Basics 55 ©1989-2018 Lauterbach GmbH

Address Range
If you enter an address range, only the specified address range will be displayed. This is useful if a memory area close to an I/O area should be displayed and you do not want the development tool to generate read cycles for the I/O area.
Conventions for address ranges:
• <start address>--<end address>
• <start address>..<end address>
• <start address>++<offset_in_byte>
Training ICE Basics 56 ©1989-2018 Lauterbach GmbH

Symbol or Label
Use i to select any symbol name or label from the internal symbol data base.
By default an oriented displayis used (line break at 2x).A small arrow indicates,where the selected dumparea starts.
Training ICE Basics 57 ©1989-2018 Lauterbach GmbH

HLL Expression
If HLL is ON and the entered variable is a pointerthe address range where the pointer is pointing to is displayed
Training ICE Basics 58 ©1989-2018 Lauterbach GmbH

Data Dump Dialog Box
Display Width
Run-time Update
Other Options
Track: (see section Indirect dump)
Default is the data bus width of the CPU
default: the Dump window is only updated, when the program execution is stopped
Other options
Training ICE Basics 59 ©1989-2018 Lauterbach GmbH

Oriented: By default an oriented display is used (line break at 2x). If Orient is OFF, the Dump window starts at the given address.
Ascii: By default ASCII characters are displayed together with the hex. memory contents.
Spotlight: The option Spotlight can be used to highlight the memory locations that changed while single stepping.
Oriented display
No oriented display
The memory location changed by the last step is markedin dark red. The memory location changed by the step beforethe last step is marked a little bit lighter. This worksup to a level of 4.
Training ICE Basics 60 ©1989-2018 Lauterbach GmbH

Dump Window
Find
With the Find button a Find in Memory Dialog Box is opened, that allows to search a specific data in a specified memory range.
Training ICE Basics 61 ©1989-2018 Lauterbach GmbH

Modify
With the Modify Button a Modify Memory Dialog Box is opened, that provides a number of operations to modify or test memory.
Operation
Fill Fill the specified memory range with the user defined data (see also Data.Set command).
Pattern Fill the specified memory range with a predefined pattern (see also Data.PATTERN command).
Test Test the specified memory range (see also Data.Test command).
Copy Copy data from one memory range to another (see also Data.COPY command).
Compare Compare the specified memory ranges (see also Data.ComPare command).
Sum Build the checksum over the specified memory range (see also Data.SUM command).
Training ICE Basics 62 ©1989-2018 Lauterbach GmbH

Display Width
Check Boxes
Switch ON/OFF the run-time memory access
Switch ON/OFF the track option
Switch the hex display ON/OFF
Switch the ASCII display ON/OFF
Training ICE Basics 63 ©1989-2018 Lauterbach GmbH

Indirect Dump
Data.dump [<address>|<range>] [/<option> ] Display a memory dump
Data.View %<format> [<address>|<range>] [/<option>] Display a detailed dump
Indirect dump indexed byregister R1
With the track option the address indexed by the current contents of register R1/SP is always displayed in the middle of the window and is highlighted
Training ICE Basics 64 ©1989-2018 Lauterbach GmbH

Modify Memory
Data.Set [<address>|<range>] %<format> /<option> Modify memory
By double clicking to a data field a Data.Set command is automatically
displayed in the command line,you can enter the new value and
confirm it with return.
Training ICE Basics 65 ©1989-2018 Lauterbach GmbH

Display a Source Listing
Displays Source listing around the PC
If the debug mode “Mixed” is active a mixed source listing is displayed. If the “HLL” mode is active only the hll lines are displayed.
Training ICE Basics 66 ©1989-2018 Lauterbach GmbH

Displays Source listing of the selected Function
Data.List [<address>] [/<option>] Display source listing
Data.ListAsm [<address>] [/<option>] Display source listing in assembler
Data.ListHll [<address>] [/<option>] Display source listing in hll
Data.ListMix [<address>] [/<option>] Display source listing in assembler and hll
Select the function youwant to display
Training ICE Basics 67 ©1989-2018 Lauterbach GmbH

Changing Code Lines
TRACE32 provides its own assembler.
Data.Assemble [<address>] <mnemonic> Assemble code line
Use Assemble here … to enternew assembler code
Use Modify here … to modify the current assembler code
Training ICE Basics 68 ©1989-2018 Lauterbach GmbH

Breakpoints
Implementation
TRACE32-ICE has a memory based breakpoint system. 1 byte of break memory can be assigned to each address. That means 8 different breakpoints can be set for each address.
PHSRWABC
Program breakpoint
HLL breakpoint
Spot breakpoint
Read breakpoint
Write breakpoint
Alpha breakpoint
Beta breakpoint
Charly breakpoint
Training ICE Basics 69 ©1989-2018 Lauterbach GmbH

The break memory can be activated independent from the other TRACE32-ICE memories. It is not necessary to explicitly map break memory. Break memory is automatically mapped, when a breakpoint is set.
There is always the same amount of emulation memory and break memory available on the system.
8 different breakpoints can be set for each address
Training ICE Basics 70 ©1989-2018 Lauterbach GmbH
Synchronous/Asynchronous Breakpoints
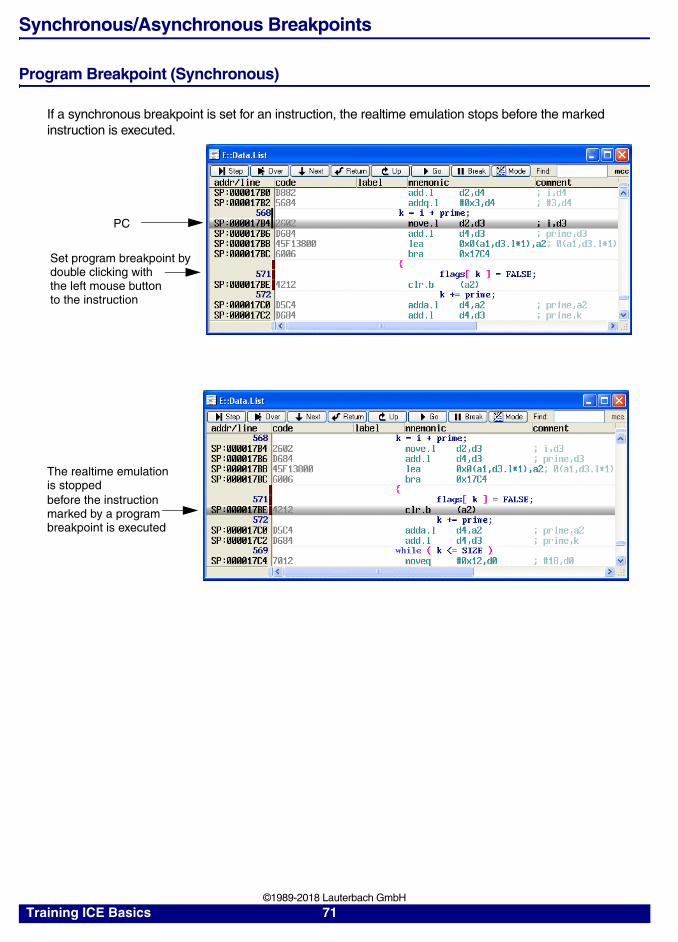
Program Breakpoint (Synchronous)
If a synchronous breakpoint is set for an instruction, the realtime emulation stops before the marked instruction is executed.
PC
Set program breakpoint by double clicking with
The realtime emulation
before the instruction marked by a program breakpoint is executed
the left mouse buttonto the instruction
is stopped
Training ICE Basics 71 ©1989-2018 Lauterbach GmbH

HLL Breakpoints (Synchronous)
High level language debugging is implemented by Hll breakpoints. All hll lines are marked with an Hll breakpoint, when debug information is loaded with the file.
If you switch to HLL mode, debugging is done on hll level.
Mode is used to togglebetween MIXed and
HLL debugging mode
Training ICE Basics 72 ©1989-2018 Lauterbach GmbH

Read Breakpoint (Asynchronous)
Read breakpoints are used to break on read access to variables/data.
Select a variable and press the right mouse button to set a Read Breakpoint
The reason why the system stops is displayed in the message line
Training ICE Basics 73 ©1989-2018 Lauterbach GmbH

A Read breakpoint is an asynchronous breakpoint, because the realtime emulation is stopped shortly after the address is read.
A T marks the trigger event inthe trace buffer
Training ICE Basics 74 ©1989-2018 Lauterbach GmbH

Write Breakpoint (Asynchronous)
Write breakpoints are used to break on write access to variables/data.
A Write breakpoint is an asynchronous breakpoint, because the realtime emulation is stopped shortly after the write access to the address.
Select a variable and press the right mouse button to set a Write Breakpoint
The reason why the system stops is displayed in the message line
A T marks the trigger event inthe trace buffer
Training ICE Basics 75 ©1989-2018 Lauterbach GmbH

Spot Breakpoints (Synchronous/Asynchronous)
Spot breakpoints are synchronous in the program range.
They are used as watchpoints. So whenever the program reaches a spot breakpoint, the realtime emulation is interrupted shortly to update the information displayed on the screen. This will usually take 100 … 500 s.
The information on the screen is updated, whenever the program reaches the Spot Breakpoint
An red S in the state line indicates that there is a spot point and the system is no longer running in realtime
Training ICE Basics 76 ©1989-2018 Lauterbach GmbH

Spot breakpoints are asynchronous in the data range.
The information on the screen is updated, whenever the program reaches the Spot Breakpoint (access to data address)
Training ICE Basics 77 ©1989-2018 Lauterbach GmbH

Permanent/Temporary Breakpoints
Permanent Breakpoints
Permanent breakpoints remain set until they are deleted (default).
Temporary Breakpoints
Temporary Breakpoints remain set until the realtime emulation is stopped the next time.
Start emulation
Breakpoints are no longer set when the realtime emulation stops
Training ICE Basics 78 ©1989-2018 Lauterbach GmbH
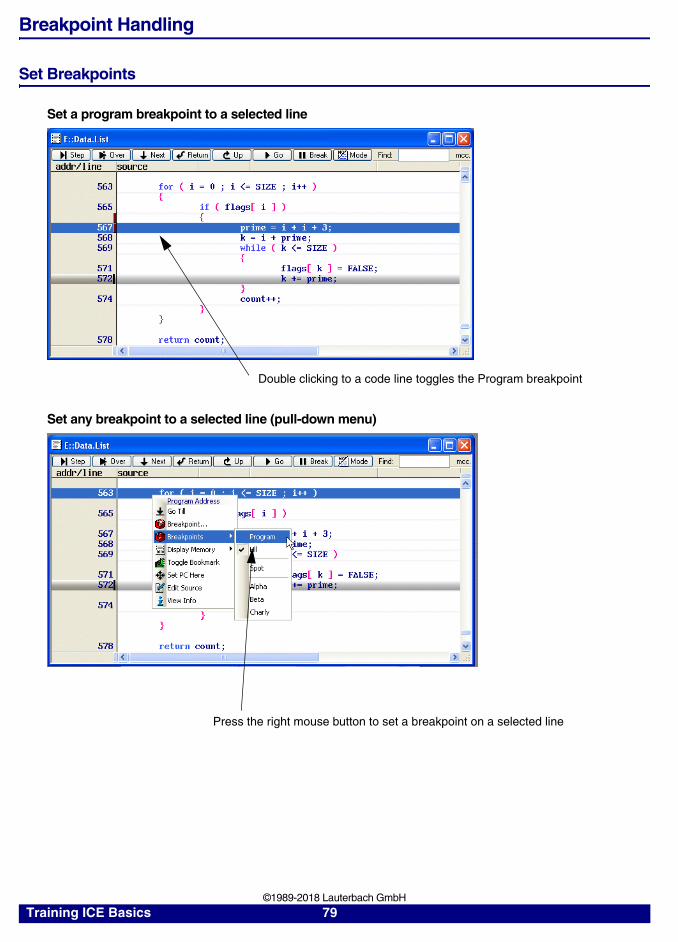
Breakpoint Handling
Set Breakpoints
Set a program breakpoint to a selected line
Set any breakpoint to a selected line (pull-down menu)
Double clicking to a code line toggles the Program breakpoint
Press the right mouse button to set a breakpoint on a selected line
Training ICE Basics 79 ©1989-2018 Lauterbach GmbH

Set any breakpoint to a selected line
Click here to set a breakpoint
Training ICE Basics 80 ©1989-2018 Lauterbach GmbH

Set any breakpoint using the Break.Set Dialog Box
Single Address
HLL-Range
Training ICE Basics 81 ©1989-2018 Lauterbach GmbH

HLL Expression
Break.Set <address>|<range> [/<breakpoint_type>] Sets permanent breakpoint on assembler level
Break.Set 1788 /ProgramBreak.Set flags /WriteBreak.Set 1788--17ff /Beta
Var.Break.Set <hll-expression> [/<breakpoint_type>]
Sets permanent breakpoint on HLL level
Var.Break.Set flags /WriteVar.Break.Set ast->left /ReadVar.Break.Set sieve /Program
Break<address>|<range> [/<breakpoint_type>] Sets temporary breakpoint on assembler level
Break sieve
Var.Break <address>|<range> [/<breakpoint_type>] Sets temporary breakpoint on HLL level
Training ICE Basics 82 ©1989-2018 Lauterbach GmbH

Var.Break flags[4] /read
Training ICE Basics 83 ©1989-2018 Lauterbach GmbH

Display Breakpoints
Break.List [<address>|<range>] [/<breakpoint_type>] Display breakpoints
Training ICE Basics 84 ©1989-2018 Lauterbach GmbH

Delete Breakpoints
Deletes all Breakpoints except the hll Breakpoints
Break.Delete [<address>|<range>] [/<breakpoint_type>] Delete breakpoints
Var.Break.Delete <hll-expression> [/<breakpoint_type>] Delete breakpoint on variable
Be careful when using Break.Delete /ALL. This will also delete the HLL breakpoints. So HLL-debugging will no longer be possible.
Push the right mouse button
to delete all breakpoints inthe selected line
Training ICE Basics 85 ©1989-2018 Lauterbach GmbH

Store Breakpoint Settings
The STOre command generates a batchfile, that allows you to reactivate the current breakpoint settings at any time.
STOre <filename> Break | BreakANH | BreakAll Store a setting
Store b1 break ; Store the default breakpoint (P, R, W)
E:: MAP.NOBREAK BREAK.RESET MODE.MIX BREAK.ENABLE FORE OFF BREAK.ENABLE BACK ON BREAK.ENABLE PROGRAM ON BREAK.SET C:17A6 /PROGRAM BREAK.SET C:2540--0002553 /PROGRAM BREAK.SET C:2540--0002553 /READ BREAK.SET C:2540--0002553 /WRITE BREAK.SET C:2774--0002786 /WRITE ENDDO
Run the batchfile to reactivate the storedbreakpoint settings
Training ICE Basics 86 ©1989-2018 Lauterbach GmbH
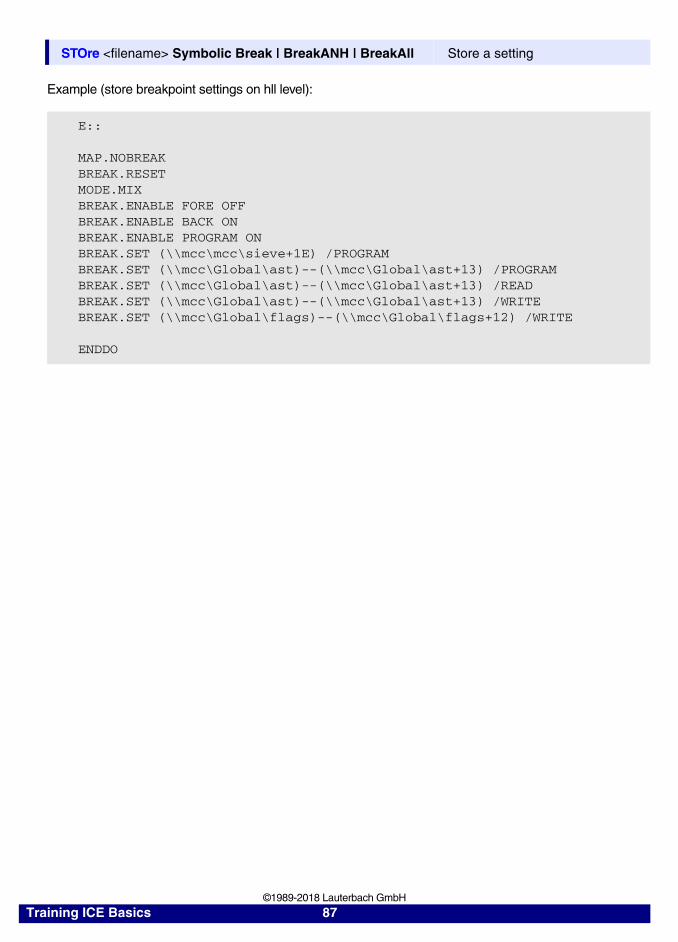
Example (store breakpoint settings on hll level):
STOre <filename> Symbolic Break | BreakANH | BreakAll Store a setting
E:: MAP.NOBREAK BREAK.RESET MODE.MIX BREAK.ENABLE FORE OFF BREAK.ENABLE BACK ON BREAK.ENABLE PROGRAM ON BREAK.SET (\\mcc\mcc\sieve+1E) /PROGRAM BREAK.SET (\\mcc\Global\ast)--(\\mcc\Global\ast+13) /PROGRAM BREAK.SET (\\mcc\Global\ast)--(\\mcc\Global\ast+13) /READ BREAK.SET (\\mcc\Global\ast)--(\\mcc\Global\ast+13) /WRITE BREAK.SET (\\mcc\Global\flags)--(\\mcc\Global\flags+12) /WRITE ENDDO
Training ICE Basics 87 ©1989-2018 Lauterbach GmbH
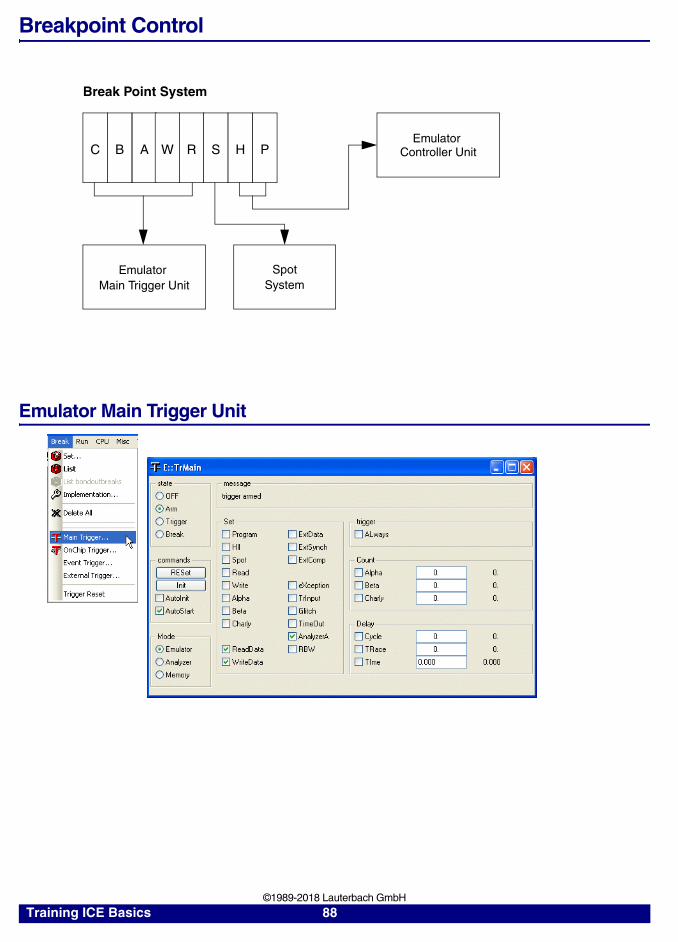
Breakpoint Control
Emulator Main Trigger Unit
Break Point System
PHSRWABC
Emulator Main Trigger Unit
SpotSystem
Emulator Controller Unit
Training ICE Basics 88 ©1989-2018 Lauterbach GmbH

Trigger Sources
The Emulator Main Trigger Unit accepts only trigger events, that are enabled in the Emulator Main Trigger Window.
Breakpoints Alpha, Beta, Charly breakpointsIf you want to use an Alpha, Beta, Charly breakpoint, they have to be enabled here
ReadData (Default Setting is enabled)
Opfetch cycles to an address are ignored.
WriteData (Default Setting is enabled)
Trigger Sources
&Data Read Signal
Read Breakpoint
&Data Write Signal
Write Breakpoint
Training ICE Basics 89 ©1989-2018 Lauterbach GmbH

Exception Allows an exception to break the realtime emulation
Enable eXception
Select an exception in the Trigger Field
Training ICE Basics 90 ©1989-2018 Lauterbach GmbH

TimeOut
AnalyzerA Allows the trigger unit of the analyzer to activate a trigger event.
ReadBefore Write
Allows the accesses to uninitialized variables as a trigger event.
Defines TimeOutfor external bus
accesses
Enables TimeOut
Training ICE Basics 91 ©1989-2018 Lauterbach GmbH

Trigger Modes
Spot System
SPot.state State display
Trigger Modes
EmulatorController Unit
EmulatorTrigger Unit
Trace/Analyzer
EmulationMemory
Trigger Events
Break realtime emulation(Emulator)
Stop analyzer(Trace) Freeze emulation memory
(Memory)
Training ICE Basics 92 ©1989-2018 Lauterbach GmbH

Debugging
Basic Debug Control
Step Single stepping e.g. Step 10.
Over The Call is executed in real time but for the user it seems to be only one step over the call.
Next Next sets a temporary breakpoint to the next assembler or hll line and starts then the program execution. This command is useful to overstep a subroutine call or to leave a loop.
There are local buttons in the Data.List window for all basic debug commands
Program Counter
With Next a temporary breakpoint is set to the next written code line, here e.g. to leave the loop
Training ICE Basics 93 ©1989-2018 Lauterbach GmbH

Return Return sets a temporary breakpoint to the last instruction of a function and then starts the program execution.
Up This command is used to return to the function that called the current function. For this a temporary breakpoint is set at the instruction directly after the function call.
After pressing Return the program execution is stopped at the last instruction of the function
Press Up to return to the function that called the current function
Display the hll stack tosee the function nesting
Training ICE Basics 94 ©1989-2018 Lauterbach GmbH

Step <count> Single step
Step.Over Step over call
Step.Change <expression> Step until <expression> changes
Step.Till <boolean _expression> Step until <boolean _expression> becomes true
Var.Step.Change <hll_expression> Step until <hll_expression> changes
Var.Step.Till <boolean _hll_expression> Step until <boolean _hll_expression> becomes true
Go [<address>|<label>] Start program execution
Go.Next Run program until the next code line is reached
Go.Return Run program until the end of the hll function is reached
Go.Up [<level>|<address>] Run program until it returns to the caller function
Training ICE Basics 95 ©1989-2018 Lauterbach GmbH

Flag Memory
TRACE32-ICE has a third memory, called Flag Memory that can be used for software analysis. It is a 2 bit memory. Flag memory has always to be allocated (MAP.Flag).
• When there is a read or opfetch to an address, the ReadFlag is set.
• If there is a write access to an address, the Write Flags is set.
The Flag memory can be used for:
• Code coverage
• Checking variables
• Stack depth analysis
The Flag system can not decide, if a prefetched instruction is executed or not.
• Short skips are not detected as not executed code.
• Prefetches at the end of a functions sets some flag bits in the next function
The analyzer base code coverage can do this without problems.
A read bit is set for all fetched instructions
Read Flag and Write Flags are set corresponding to the access to a variable/data
Training ICE Basics 96 ©1989-2018 Lauterbach GmbH

Display Flag Information
FLAG.List <address>|<range> [/<option>] Display flags
FLAG.List /Read /NoWrite
Training ICE Basics 97 ©1989-2018 Lauterbach GmbH

Code Coverage
FLAG.ListFunc <address>|<range> [/<option>] Code-coverage functions
Double click to the functionto get detailed information
Fetched code lines are boldprinted on a colored background
Training ICE Basics 98 ©1989-2018 Lauterbach GmbH

Checking Variables
Unused Variables
Variables which are never read are unused variables.
Double click to the variableto get detailed information
Address which were read are boldprinted on a colored background
Training ICE Basics 99 ©1989-2018 Lauterbach GmbH

Uninitialized Variables
Variables which are read before there initialization value is written to them, are uninitialized variables.
1. Set up the Emulator Main Trigger Unit to stop the program on a ReadBeforeWrite access.
2. Pre-set write flags to the program area and to the initialized data area of your application.
Usually the section information is provided by the compiler.
sYmbol.List.SECtion [<address>] Display physical sections
The Emulator Main Trigger Unit allowsto trigger on ReadBeforeWrite
to an address
Training ICE Basics 100 ©1989-2018 Lauterbach GmbH

If the section information is provided by the compiler, use the Flag.SetSec to preset write flags to the code area and initialized data area, to prevent RBW triggering on these areas.
If now an access to an not-initialized variable happens, the realtime emulation will be stopped.
FLAG.SetSec Mark sections
Training ICE Basics 101 ©1989-2018 Lauterbach GmbH
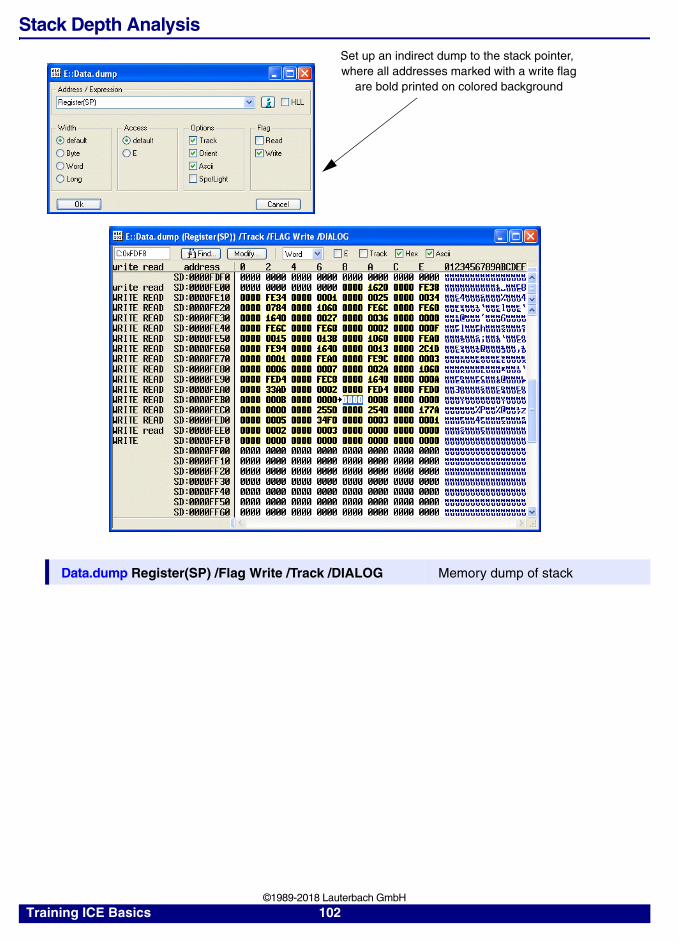
Stack Depth Analysis
Data.dump Register(SP) /Flag Write /Track /DIALOG Memory dump of stack
Set up an indirect dump to the stack pointer, where all addresses marked with a write flag
are bold printed on colored background
Training ICE Basics 102 ©1989-2018 Lauterbach GmbH

Document your Results
Print your Results
Requires a printer configuration in the file config.t32.
E.g. for Windows
PRINTER=WINDOWS
For other host platform refer to the host platform specific section of the Installation Guide.
Print a Hardcopy of the TRACE32 Application Window
Training ICE Basics 103 ©1989-2018 Lauterbach GmbH

Print the Contents of a Specific Window
Print any Result
To print more complex results e.g over several pages:
WinPrint.<command> Pre-command for complex outputs
WinPrint.Data.dump 0x1000--0x1fff
WinPrint.Trace.List (-1000.)--(-500.)
Select the Print item in the window manager menu to print the window contents.
Training ICE Basics 104 ©1989-2018 Lauterbach GmbH

Save your Results to a File
Select the Output Format for the File
PRinTer.FileType <format> Select file format
Switch the Fileradio button to ON
Training ICE Basics 105 ©1989-2018 Lauterbach GmbH

Open the File for Printing
Print 1 output to 1 file
WinPrint.Data.dump 0x1000++0xfff
Training ICE Basics 106 ©1989-2018 Lauterbach GmbH

Print n outputs to n files
If the file name includes a number, this number is automatically incremented after each output.
WinPrint.Data.dump 0x1000++0xfff
Go
Break
WinPrint.Data.dump 0x1000++0xfff
The number within the file nameis automatically incremented
Training ICE Basics 107 ©1989-2018 Lauterbach GmbH

Print n outputs to 1 file
PRinTer.OPEN [<filename>] Open permanent output file for results
PRinTer.CLOSE Close permanent output file for results
PRinTer.OPEN outpd
WinPrint.Data.dump 0x1000++0xfff
Go
Break
WinPrint.Data.dump 0x1000++0xfff
PRinTer.CLOSE
Training ICE Basics 108 ©1989-2018 Lauterbach GmbH

Reset Output to Printer
Switch the Printerradio button to ON
Training ICE Basics 109 ©1989-2018 Lauterbach GmbH