Embed Size (px)
Citation preview

Sanitation, Hygiene and Water (SHAW) Programme
for East Indonesia
Training modules developed for
“Training of Trainers on SHAW
performance monitoring”
September 2013
Prepared for

IRC International Water and Sanitation Centre, an independent non-profit-organisation based in The
Hague, the Netherlands, is a knowledge centre in the field of drinking water supply, sanitation, hygiene
and integrated water resources management in developing countries.
Since its foundation in 1968, IRC has facilitated the sharing, promotion and use of knowledge. We work
with people in the poorest communities in the world, with local and national governments, and with non-
governmental organisations, to help them develop water, sanitation and hygiene services that last not for
years, but forever. We identify barriers to making this happen and we tackle them. We help people to
make the change from short-term interventions to long-term services that will transform their lives and
their futures. Our overarching goal is “safe and sustainable WASH services for all by 2030.”
IRC employs a multi-disciplinary and multi-cultural task force of some 60+ professionals. They work with
international partners and in selected focus countries and regions towards IRC’s goal and objectives.
IRC International Water and Sanitation Centre
P.O. Box 82327, 2508 EH The Hague, the Netherlands
T +31 (0)70 3044000
www.irc.nl
The performance monitoring training modules were developed by Erick Baetings, IRC Senior Sanitation
Specialist for use by the SHAW partners. The training modules formed the basis for a Training of Trainers
(TOT) on performance monitoring conducted from 9 to 13 September 2013 in Maumere, Flores, East
Indonesia.
The training modules could not have been developed without the tremendous support of Christine
Aristanti (Programme Coordinator for Yayasan Dian Desa) who reviewed both the English and Indonesian
versions of all the modules, and Abang Rahino (Simavi Yogyakarta) who took care of the translation work.
The findings, interpretations, comments and conclusions contained in this report are those of the author
and may not necessarily reflect the views of either Simavi or the partner NGOs.
Baetings, E. (September 2013) Training modules developed for Training of Trainers (TOT) on SHAW
performance monitoring, Sanitation, Hygiene And Water (SHAW) Programme for East Indonesia; IRC
International Water and Sanitation Centre, The Hague, the Netherlands.
This training manual and other materials and documents related to the SHAW Programme can be found
on: http://www.irc.nl/page/53746

Content list
1. Introduction to the SHAW programme ....................................................................... 1
2. Introduction to SHAW performance monitoring and the Trainers of Training.............. 3
2.1 Background ........................................................................................................ 3
2.2 Introduction to the SHAW performance monitoring system ................................ 4
2.3 Introduction to the Trainers of Training ............................................................... 6
3. Training modules ....................................................................................................... 9
Module 1.1: Introduction to performance monitoring ................................................ 9
Module 1.2: Introduction to the SHAW monitoring system ....................................... 14
Module 1.3: Understanding the OUTPUT indicators .................................................. 20
Module 1.4: Understanding the OUTCOME indicators .............................................. 40
Module 1.5: Planning and organising monitoring ..................................................... 61
Module 1.6: Data collection techniques ................................................................... 70
Module 1.7: Village level data recapitulation ........................................................... 80
Module 1.8: Quality control ..................................................................................... 86
Module 1.9: Analysing monitoring data .................................................................... 96
Appendixes .................................................................................................................. 107
Appendix 1: Outcome of capacity development needs assessment ......................... 108
Appendix 2: Training schedule for Training of Trainers on SHAW performance
monitoring ............................................................................................................ 110

Training modules on SHAW performance monitoring 1
1. Introduction to the SHAW programme
The Sanitation, Hygiene and Water (SHAW) programme runs from mid-2010 to end-2014. The overall
goal of the SHAW programme is to reduce poverty by contributing to the sustainable improvement of the
health status of rural communities in East Indonesia. This is to be achieved through sustained changes in
sanitation and hygiene behaviours and practices according to the five pillars of STBM1.
Five
pillars
of
STBM
1. Ending the practice of open defecation
2. Hand washing with soap
3. Household water treatment and safe storage of drinking water
4. Household solid waste management
5. Household liquid waste management
The SHAW programme is implemented in partnership with the Indonesian government, five Indonesian
NGOs, one Dutch NGO and other relevant stakeholders in nine districts in East-Indonesia: Rumsram on
Biak, Yayasan Dian Desa on Flores, Yayasan Masyarakat Peduli on Lombok, CD-Bethesda on Sumba and
Plan Indonesia on Timor. The Dutch NGO Simavi coordinates the SHAW Programme and supports the
central Indonesian Government on STBM policy and scaling up initiatives.
The programme aims to achieve full coverage in selected areas by strengthening the capacity of local
governments, private sector and other local stakeholders for more effective service delivery in rural
sanitation and hygiene. The programme is expected to reach over 1.1 million persons in more than 1,000
villages. Funding for the € 15.4 million programme is provided by the Embassy of the Kingdom of the
Netherlands, Simavi, the Indonesian NGOs and the local communities.
SHAW
targets
In excess of 1.1 million people
More than 1,000 villages in nine districts
400 primary schools
The SHAW approach consists of several integrated components with the potential to implement
sustainable sanitation and hygiene programmes at scale in rural communities and schools. Sustainable
sanitation and hygiene does not merely mean increasing access to facilities, it is about realising sustained
behaviour change. The approach therefore focuses on changing sanitation and hygiene behaviour and
practices through effective hygiene promotion interventions that create the conditions (opportunity,
ability and motivation) for sustained change.
The approach demands a joint effort by a wide range of stakeholders: local governments, private sector
actors and other local stakeholders including the communities. The SHAW partners initiate the start-up in
each district, inform and train stakeholders, and then facilitate and support implementation by these
stakeholders. The aim of this approach is to strengthen the capacity of the stakeholders and to create an
enabling environment so that programme achievements can be sustained and the approach can be
replicated in other areas.
1 STBM (Sanitasi Total Berbasis Masyarakat meaning “Community-Based Total Sanitation”) was adopted by the Ministry
of Health as the national sanitation strategy in 2008. In essence STBM applies the same principles as CLTS (e.g. non-subsidy approach) to a multitude of hygiene related behaviours and practices.

2 Training modules on SHAW performance monitoring
The programme introduced a new methodology for community-based monitoring to measure progress
towards programme targets over time. Both output data (increased access and improved quality to
sanitation and hygiene facilities such as toilets, hand washing facilities, etc.) and outcome data (degree in
changes in sanitation and hygiene behaviours and practices) are collected by the communities. The data
is aggregated, analysed and then used at community, sub-district and district level.
Figure 1: SHAW programme partner NGOs and their areas of operation
Plan Indonesia inSouth-Central and North-Central
Timor of Nusa Tenggara Timur
Yayasan Dian Desa inSikka and East Flores in Nusa
Tenggara Timur
Yayasan Masyarakat Peduli inEast Lombok of Nusa Tenggara
Barat
Yayasan Rumsram inBiak Numfor and Supiori in
Papua
CD Bethesda inCentral and West Sumba of Nusa
Tenggara Timur

Training modules on SHAW performance monitoring 3
2. Introduction to SHAW performance monitoring and the
Training of Trainers
2.1 Background
The SHAW performance monitoring system aims to inform on developments made with regards to STBM
status in each village, sub-district and district. In actual fact it measures progress towards meeting and
thereafter sustaining the STBM status that is to be used for planning the content and intensity of follow-
up activities and for reporting purposes during two different stages:
1) During the implementation stage of the SHAW Programme (measuring progress towards STBM
status);
2) After the conclusion of the SHAW Programme (measuring whether STBM status is sustained).
A short timeline on the development, introduction and application of the SHAW programme’s generic
performance monitoring system is provided in the table below.
Year Timeline activities
201
0
To kick off the SHAW programme a monitoring workshop was conducted by IRC in May 2010 to
agree on a set of performance monitoring indicators as a first step to start preparations for one
collective baseline and monitoring system for the SHAW programme. A draft monitoring toolbox
prepared by IRC was shared with the partner NGOs in August 2010.
During the Inception Period, the partner NGOs developed an initial baseline for the SHAW
programme intervention areas on the basis of secondary data obtained from either district studies
or earlier studies carried out by the partner NGOs.
Although it was originally the intention that IRC together with the partner NGOs would elaborate on
their earlier work and jointly develop a generic monitoring system towards the end of 2010 it was
decided that the partner NGOs would develop their own monitoring systems.
201
1
During 2011, the partner NGOs developed their own SHAW programme performance monitoring
systems. Although IRC provided technical support on a range of issues, including monitoring, to the
partner NGOs it became clear that it was more difficult than expected to develop fully functioning
monitoring systems for each partner NGO.2
In October 2011 it was decided to undertake a review of the monitoring systems developed by the
partner NGOs and to assess whether it would make sense to develop a generic monitoring system
with the main aim to harmonise monitoring practices.
201
2
In March 2012 the review outcomes were discussed during a SHAW Programme Coordinators
meeting and it was then decided to develop a generic monitoring system for use by all five partner
NGOs with the main aim to harmonise monitoring practices across the partner NGOs.
A first test run was executed by YDD in May 2012 and after some modifications a second test run
was organised by all five partners in June 2012.
2 Although it was initially thought that the partner NGOs would be able to adopt and where necessary modify their
existing monitoring systems, it was discovered that the specific monitoring requirements of the SHAW programme warranted the development of completely new monitoring systems. For most of the partner NGOs this meant enormous investments of limited resources.

4 Training modules on SHAW performance monitoring
Year Timeline activities 2
01
2
During the June 2012 SHAW Programme Coordinators meeting in Jakarta, it was decided to go
ahead with the development of the monitoring system. On the basis of the test runs a number of
modifications were incorporated.
In October 2012 the partner NGOs started to use the new monitoring system. An agreement on
monitoring and reporting frequencies was reached during a SHAW Programme Coordinators
meeting in Mataram. During the same meeting it was also decided to conduct a ‘light’ review of the
new monitoring system following the monitoring and reporting cycle of January to March 2013.
20
13
In May 2013 a ‘quick and dirty’ review was carried out to assess whether the new output and
outcome monitoring system had been introduced successfully and whether it was providing reliable
information necessary for adequate programme steering. The outcomes of the review were
presented and discussed during the June 2013 SHAW Programme Coordinators meeting in Jakarta.
The review findings were discussed during the June 2013 SHAW Programme Coordinators meeting.
Considering the range of issues that needed to be addressed and the fact that no specific training or
any other type of capacity development initiative had been undertaken to introduce the new
monitoring system. It was then decided to organise a Training of Trainers for partner NGOs.
Table 1: Short timeline on the development and introduction of the SHAW performance monitoring system
The main findings of the May 2013 review can be summarised as follows:
In general all five partner NGOs are content with the performance monitoring system. However,
that does not mean that there are no issues.
To date the output and outcome data files do not provide complete sets of data. To illustrate this
a few examples:
YDD and CDB had noticeable differences between output and outcome data, in particular,
differences were noted in the total number of villages (desa), sub-villages (dusun) and
households whereas these should be identical.
Except for CDB, most partners had noticeable differences between baseline data and
outcome data. It is obvious that the baseline data is not complete!
The roles and responsibilities of the different stakeholders are not always clear and in a number
of cases the SHAW partners are still in the driving seat instead of handing over responsibilities to
local stakeholders. Local ownership is perceived to be a challenge. The IRC mission to Maumere
in February 2013 revealed that some of the partners have difficulties in ‘thinking big’ and/or
organising the monitoring exercises efficiently.
The data entries in the data files show that data recapitulation or data aggregation at the
different village levels remains a serious problem resulting in unreliable data/information.
The correct understanding and application of the outcome monitoring indicators remain a big
challenge for all stakeholders. A number of SHAW partners indicated that they themselves had
problems with these indicators.
2.2 Introduction to the SHAW performance monitoring system
The SHAW monitoring system consisting of both OUTPUT and OUTCOME indicators was developed to
measure progress over time in realising the five STBM pillars, and specifically:
Increased access to facilities (OUTPUTS);
Increased quality of the facilities (OUTCOMES); and
Degree in changes in sanitation and hygiene behaviour and or practices (OUTCOMES).

Training modules on SHAW performance monitoring 5
Figure 2: Elements of the SHAW performance monitoring system
The focus of the SHAW performance monitoring system in relation to the generic programme result chain
is presented in the following figure.
Figure 3: Focus of the SHAW performance monitoring system
6 Training modules on SHAW performance monitoring
2.3 Introduction to the Training of Trainers
During the June 2013 SHAW Programme Coordinators meeting the SHAW partners expressed the need
for organising training to develop the capacity of their field staff. For that purpose a capacity
development needs assessment was carried out for all the different stakeholders during the meeting. The
outcome of this assessment is provided in Appendix 1.
The following is an overview of the main capacities that need to be developed so that SHAW partner staff
can:
1) Plan, organise and facilitate the application of the output and outcome monitoring system;
2) Analyse the monitoring data so that the results from the monitoring exercises (evidence) is used
to steer the programme (adjust operational annual activity plans) and to adopt working
modalities (providing more specific tailor-made post-triggering follow-up support to meet the
actual conditions and developments found in the different villages);
3) Build or strengthen the capacity of the stakeholders involved in monitoring and programme
implementation; and
4) Adapt overall programme approaches on the basis of lessons learned.
A more specific overview of SHAW partner capacity needs is provided below:
Capacity to translate and transfer old baseline data in the new data files.
Capacity to understand and apply the Qualitative Information System3 (QIS) inspired outcome
monitoring indicators.
Capacity to organise monitoring more efficiently by improving work processes and by maximising
the involvement of stakeholders, particularly at community and sub-district levels.
Capacity to strengthen the capacity of stakeholders at all different levels so that these
stakeholders are able to plan, organise and execute regular monitoring activities independently
with quality.
Capacity to carry out simple quality control checks to assess whether data is complete and
correct (reliable).
Capacity to develop and introduce simple tools to enhance the quality and reliability of the
monitoring system.
Capacity to read, understand, interpret and analyse the results of monitoring activities to
improve field activities so that more efficient and effective programme results are achieved.
In August 2013 a set of training modules were developed by IRC. The modules were initially used during
the Training of Trainers on SHAW performance monitoring organised from 9 to 13 September 2013 in
Maumere, Flores, East Indonesia to strengthen the capacity of a selected group of staff from the five
SHAW partners. As a next step, the SHAW partners were then expected to use the modules and their
newly gained capacity to strengthen the capacities of their colleagues and subsequently the capacities of
local stakeholders involved in collecting, analysing and using the monitoring data.
3 Outcome indicators need to be quantifiable to be useful. Changes in behaviour and practices and changes in
performance are in actual fact the results of qualitative processes and therefore not always easy to quantify in terms
of numbers. For that purpose the Qualitative Information System (QIS) was developed by IRC and WSP at the end of
the 1990s as a means to quantify qualitative data used in process indicators and outcome indicators. Further details
are provided in Training Module 1.2 and 1.4.

Training modules on SHAW performance monitoring 7
The training modules include individual training sessions on:
Module Training topic
1.1 Introduction to performance monitoring
1.2 Introduction to the SHAW monitoring system
1.3 Understanding the OUTPUT indicators
1.4 Understanding the OUTCOME indicators
1.5 Planning and organising monitoring
1.6 Data collection techniques
1.7 Village level data recapitulation
1.8 Quality control
1.9 Analysing monitoring data
Table 2: Overview of SHAW performance monitoring training modules
The relation between the nine training modules and the main sub-activities in monitoring – which formed
the basis for developing and organising the training of trainers – is shown in the following figure.
Figure 4: Relation between training modules and the main monitoring sub-activities
A set of individual training modules was developed as this will provide opportunities for the SHAW
partners to use specific modules when and where needed depending on the training audience (e.g.
background, experiences, expertise, and specific roles and responsibilities). Whereas the complete set of
training modules will be used for training of new stakeholders, only certain training modules will be used
to enhance the capacities of stakeholders that are already involved in monitoring by organising specific
tailor-made refresher trainings. Due to the difference in roles and responsibilities among the range of
stakeholders, certain modules will be more relevant for one group then for another group of
stakeholders.
The draft training modules were used and tested during the Training of Trainers conducted in Maumere
in September 2013. During the training the modules were reviewed by a number of small groups of
training participants. Following these reviews improvements and modifications were made on the sport
by the trainers (Erick Baetings and Christine Aristanti). By the end of the training a complete set of the
final training modules was shared with all the participants for use by them in their respective areas of
operation.

8 Training modules on SHAW performance monitoring
The complete set of nine training modules is provided in Section 3.
The programme developed for the Trainers of Training is presented in Appendix 2.

Training modules on SHAW performance monitoring 9
3. Training modules
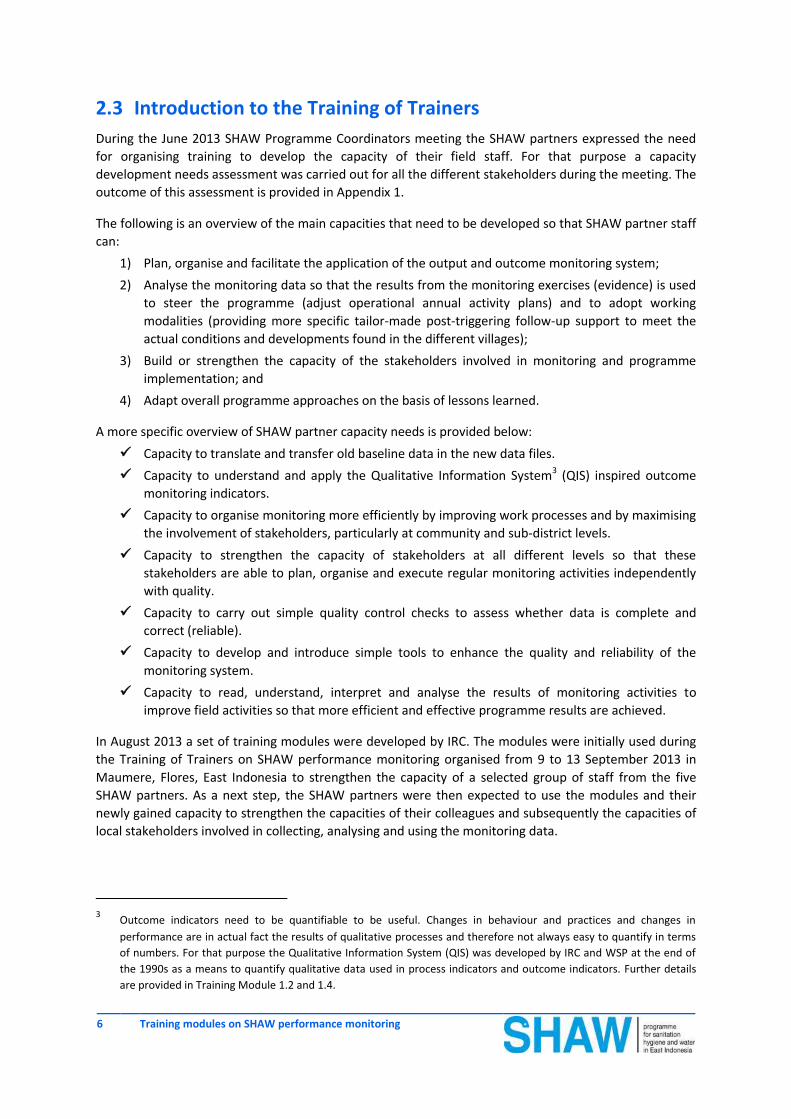
Module 1.1: Introduction to performance monitoring
Introduction to performance monitoring 1.1 Module
10 Training modules on SHAW performance monitoring
Relevance Audience
The concept of and need for monitoring may not be understood by some of the
stakeholders involved in monitoring the progress and results of programmes.
Without establishing a shared understanding, we run the risk that monitoring will
not be taken serious and or owned by those that are responsible for it.
Cadres / RT
Kepala dusun
Desa STBM team and
desa government staff
Kepala desa and
village secretary
Kecamatan STBM
team
Camat and Kecamatan
secretary
Dinas Kesehatan and
Pokja AMPL
SHAW Partner NGO
staff
Objective
To elicit participant’s current understanding of performance monitoring.
To clarify or deepen participants’ understanding of performance monitoring.
To start the process of empowerment.
Steps Materials
1. Break participants into several groups (preferably three equal groups) and ask
them to discuss their understanding of performance monitoring. Participants
should write on cards key words that capture the essence of their discussions.
One group discusses ‘what is monitoring’;
One group discusses ‘why do we monitor’; and
One group discusses ‘monitoring for whom and by whom’.
2. Come back together. Each group presents its key words to the full group. Tape
the cards to a flip chart on the wall, grouping similar words or ideas together.
3. Display the different definitions and purpose of performance monitoring and
ask the participants to read them out loud. Participants then identify key words
or ideas from this list that corresponds with their own. Underline these words
or ideas.
4. Identify key words or ideas that are found on one list but not on the other list.
Circle and discuss these differences.
5. Wrap up this session by attempting to synthesise the two lists of definitions,
creating a third list of key words and ideas that describe the shared
understanding of performance monitoring.
Meta cards (two
different colours)
Markers
Flipcharts
Masking tape

Module 1.1 Introduction to performance monitoring
Training modules on SHAW performance monitoring 11
Key messages
1. Monitoring is the systematic and routine collection and analysis of information to check the progress
and or quality of something over a period of time against plans and targets.
2. We monitor:
To review progress;
To identify problems;
To be able to make adjustments;
To learn from experiences;
To have internal and external accountability;
To promote empowerment of beneficiaries.
3. The performance monitoring system used for the STBM programme is a community-owned result-
based monitoring system which put communities and their leaders in the driving seat so that they
have all the information needed to successfully implement the programme activities and steer their
community towards 100% STBM status.
4. The information provided by the monitoring system allows implementing agencies and local
government actors to take informed decisions on where to focus and the form of their support.
Tips and tricks Encourage participants to write down only key words or phrases on the cards. Only one idea per card.
Keep the final list of key words posted during the rest of the training and review the list from time to
time.

Introduction to performance monitoring 1.1 Module
12 Training modules on SHAW performance monitoring
Background information
What is monitoring?
Monitoring is checking the progress and or quality of something over a period of time against plans and
targets set during the planning phase. It is the systematic and routine collection and analysis of information
aimed at improving the efficiency and effectiveness of an activity, project, programme or organisation.
Monitoring helps to keep the work on track. It informs you when things are going wrong. It enables you to
determine whether the resources you have available are sufficient and are being well used, whether the
capacity you have is sufficient and appropriate, and whether you are doing what you planned to do.
Furthermore, monitoring is geared towards learning from what you are doing and how you are doing it.
Why do we monitor?
To review progress;
To identify problems in planning and/or implementation;
To take informed decisions on the future of the initiative by making adjustments so that you are
more likely to “make a difference” and realise the plans and achieve the targets;
To learn from experiences to improve practices and activities in the future;
To have internal and external accountability of the resources used and the results obtained;
To promote empowerment of beneficiaries of the initiative.

Module 1.1 Introduction to performance monitoring
Training modules on SHAW performance monitoring 13
Monitoring for whom and by whom?
The SHAW / STBM monitoring system is developed in such a way that it enables those who are responsible
for the programme and its results to monitor progress towards realisation of their results and
achievements. As a consequence special emphasis was given to the issue of local ownership and the
possibility to show gradual improvements in sanitation and hygiene behaviours and practices:
Local communities own the monitoring and participatory methods to monitor the programme are
preferred.
Local governments own the monitoring and as far as possible alignment should be sought with
national STBM criteria.
The community-owned result-based monitoring system not only aims to generate the appropriate
information but also seeks to strengthen local decision-making, public education, community capacity and
effective public participation in local development programmes. Ultimately, the monitoring system is a tool
to facilitate more inclusive decision-making on issues deemed important to the members of a community.
Community-owned monitoring provides the local leaders with all the information needed to successfully
implement the programme activities and steer their community towards 100% STBM status. The
information also allows the implementing agencies (SHAW partners) and the local government actors to
take informed decisions on where to focus their support.
The overall role of the implementing agencies (SHAW partners) is to facilitate and support the processes in
the communities and to build the capacity of communities and local government actors to plan, implement,
monitor and steer the SHAW / STBM programme.

14 Training modules on SHAW performance monitoring
Module 1.2: Introduction to the SHAW monitoring system
Module 1.2 Introduction to the SHAW monitoring system
Training modules on SHAW performance monitoring 15
Relevance Audience
The SHAW / STBM programme has developed its own unique performance
monitoring system that goes well beyond the regular monitoring of facilities.
Without establishing a shared understanding for the need to measure increased
access to improved facilities as well as changes in behaviour and practices we run
the risk that monitoring will not be taken serious and or owned by those that are
responsible for it.
Cadres / RT
Kepala dusun
Desa STBM team and
desa government staff
Kepala desa and
village secretary
Kecamatan STBM
team
Camat and Kecamatan
secretary
Dinas Kesehatan and
Pokja AMPL
SHAW Partner NGO
staff
Objective
To enhance the participants’ understanding of the SHAW performance
monitoring system.
To introduce and explain the difference between OUTPUT and OUTCOME
monitoring.
Steps Materials
1. Start with a short explanation (mini lecture) of what the SHAW programme
wants to achieve.
2. Provide a short explanation (mini lecture) how the objectives are to be
achieved.
3. Explain the link between facilities and behaviour change (mini lecture).
4. Provide an overview of what we measure focusing on facilities (output), and
quality of the facilities and changes in behaviours and practices (outcome).
5. Wrap up this session:
Ask one or two participants to tell the entire group what main messages
they have remembered.
Provide a quick recap by summarising the key messages of this session.
Markers
Flipcharts
Masking tape

Introduction to the SHAW monitoring system 1.2 Module
16 Training modules on SHAW performance monitoring
Key messages
1. The overall goal of the SHAW programme is to reduce poverty by improving the health status of rural
communities by realising healthier sanitation and hygiene conditions and behaviours.
2. The programme focuses on sustained changes in sanitation and hygiene behaviour and practices in
accordance with the STBM policy of the Ministry of Health.
3. The objective of STBM is to reduce the incidences of diarrhoea and other environmentally based
diseases which are caused by poor sanitation and hygiene conditions.
4. Behaviour change goes beyond the provision of sanitation facilities such as toilets. Benefits are only
obtained if the facilities are used and used correctly.
5. No changes in behaviour can be expected without access to facilities, knowledge and skills, and
motivation. Effective hygiene promotion interventions are needed to achieve sustained behaviour
change.
6. The SHAW monitoring system measures the following:
Increased access to facilities (outputs)
Increased quality of the facilities (outcomes)
Degree in changes in sanitation and hygiene behaviour and or practices (outcomes)
Tips and tricks Limit the time of the mini lectures and keep the amount of information in check. Don’t overdo it
otherwise the participants might get lost and lose interest!
Adjust the depth of the introduction and the explanations of the different concepts to the audience.
Actors at the Kecamatan and Kabupaten level might be more interested and may find it easier to
understand the in-depth explanation provided in the background information section.
When inviting participants to assist in wrapping up the session, you may want to help them by asking
the right questions that leads them to the correct answers.
Put an emphasis on the key messages during the mini lectures when you are explaining the different
concepts as well as during the final wrap up session.

Module 1.2 Introduction to the SHAW monitoring system
Training modules on SHAW performance monitoring 17
Background information
What is it that the SHAW programme wants to achieve?
The overall goal of the programme is to reduce poverty by improving the health status of rural
communities in Indonesia.
The overall objective of the programme is that by 2014 a sustainable healthy living environment is realised
through coordinated action to promote improved sanitation and hygiene and to increase access to safe
drinking water.
Specific objectives at community level:
1. Communities have the capacity and interest to claim, access and use sustained and equitable
services for improved sanitation, hygiene and water supply in households and schools.
2. Adequate sanitation and hygiene conditions and behaviours have been realised for targeted
communities, leading to Open Defecation Free (ODF) sub-districts in which hand-washing and
other key hygiene behaviours (in line with STBM principles) are common practice.
Mention here specific targets for your organisation, for example the number of villages and the number of
people you want to reach.
How are the objectives to be achieved?
The SHAW programme consists of several integrated components with the potential to implement
sustainable sanitation and hygiene programmes at scale. Sustainable sanitation and hygiene does not
merely mean increasing access to facilities, it is about realising sustained behaviour change. The approach
therefore focuses on changing sanitation and hygiene behaviour and practices. Ensuring sustained
behaviour change requires effective hygiene promotion interventions that create the conditions
(opportunity, ability and motivation) for sustained change.
The objectives are to be achieved through sustained changes in sanitation and hygiene behaviours and
practices in accordance with the STBM (Sanitasi Total Berbasis Masyarakat) approach which was adopted
by the Ministry of Health as the national sanitation strategy in 2008. The five pillars of STBM are:
Open defecation free (ODF)
Hand washing with soap
Household water treatment and safe storage of drinking water
Household solid waste management
Household wastewater management
Access to facilities versus changes in behaviour and practices
Historically, there has been – and in some places there remains – a focus on the provision of hardware. The
primary or sole question being: does a household have a toilet? Traditional approaches to improving
sanitation, which aim at building facilities, have not resulted in significant increases in coverage and
sustained used of the facilities. The benefits of sanitation facilities are only obtained if they are used and
used correctly. This requires changes in behaviour on the part of users.
Concentrating on the provision and usage of toilets is on its own insufficient. Other behaviours and
practices with potential high health risks need to be improved to be able to improve the health status and
living conditions of rural communities.
Risky hygiene practices account for almost 30% of the total disease burden in developing countries. Within
this group, 75% of all life years lost are due to the lack of safe or improved water supply and sanitation and
the prevalence of risky hygiene behaviour. Improvements in water supply, sanitation and hygiene are the

Introduction to the SHAW monitoring system 1.2 Module
18 Training modules on SHAW performance monitoring
most important barriers to many infectious diseases, because with appropriate facilities and safe behaviour
people reduce their risk of becoming exposed to disease.
Most water and sanitation related diseases can only be prevented by improving a number of hygiene
behaviours. The most significant appear to be:
Sanitary disposal of faeces;
Hand washing with soap after defecation and before handling food; and
Safe handling and storage of drinking water to keep it free from contamination.
Reduction in diarrhoeal morbidity in percentage per invention type
Source: Global Hand Washing Day, Planners Guide, Second Edition (2009)
Behaviour change depends on sanitation behaviour determents – factors that can facilitate or prevent a
behaviour – that can be classified under the following three headings:
1) Opportunity: Does the individual have the chance to perform the healthier behaviour?
2) Ability: Is the individual capable of performing the healthier behaviour?
3) Motivation: Does the individual want to perform the healthier behaviour?
A couple of examples of what this means:
Access to a toilet falls under opportunity. For example, if a family does not have access to a toilet
nearby their home, then it is likely that the family members will defecate in the open.
Knowledge how to wash your hands and when to wash your hands is related to ability. Inaccurate
or incomplete knowledge, as well as lack of knowledge altogether, may prevent individuals from
engaging in appropriate or healthier sanitation and hygiene behaviours.
Skill is another type of knowledge. In many communities, households tend to build their toilets
themselves rather than hire a mason. These self-builders will need the skills for example how to
select the most appropriate technology option based on geological and other factors, how deep to
dig a pit, how to line the pit, or how to construct a proper slab.
It is basically very simple: no changes in behaviour can be expected without access to facilities, knowledge
and skills.

Module 1.2 Introduction to the SHAW monitoring system
Training modules on SHAW performance monitoring 19
What do we measure?
The SHAW monitoring system is developed so that the following elements are measured:
Increased access to facilities (OUTPUTS);
Increased quality of the facilities (OUTCOMES); and
Degree in changes in sanitation and hygiene behaviour and or practices (OUTCOMES).
Both OUTPUT and OUTCOME monitoring systems measure progress over time in realising the five STBM
pillars. .
Documents used:
Christine van Wijk and Tineke Murre (date unknown) Motivating Better Hygiene Behaviour: Importance
for Public Health Mechanisms of Change, UNICEF in partnership with IRC International Water and
Sanitation Centre
Devine, J. (October 2009) Introducing SaniFOAM: A Framework to Analyse Sanitation Behaviours to
Design Effective Sanitation Programs, Water and Sanitation Program (WSP)

20 Training modules on SHAW performance monitoring
Module 1.3: Understanding the OUTPUT indicators
Module 1.3 Understanding the OUTPUT indicators
Training modules on SHAW performance monitoring 21
Relevance Audience
Without a thorough and common understanding of the SHAW / STBM programme
OUTPUT indicators it will be unlikely that the data will be collected completely,
correctly, consistently and uniformly, and in a reliable manner.
At the same time the increase in understanding and knowledge may also avoid a
feeling of helplessness and frustration on the part of the people responsible for
collecting the data in the villages.
Cadres / RT
Kepala dusun
Desa STBM team and
desa government staff
Kepala desa and village
secretary
Kecamatan STBM team
Camat and Kecamatan
secretary
Dinas Kesehatan and
Pokja AMPL
SHAW Partner NGO
staff
Objective
To create a clear and common understanding of the OUTPUT indicators.
To provide all the detailed explanations and examples so that data can be
collected completely, correctly, consistently and uniformly.
Steps Materials
1. Start with a short introduction explaining:
What are OUTPUT indicators; and
What OUTPUT indicators we use to measure progress and results in the
SHAW programme.
2. Distribute the OUTPUT monitoring data collection forms and the handouts
with detailed explanations and examples.
3. Introduce the OUTPUT indicators and take time to thoroughly explain each
and every indicator. Use the handout with detailed explanations and examples
to explain the context of the questions and to illustrate the different options.
OUTPUT monitoring
data collection forms
Handouts with detailed
explanations and
examples
Markers
Flipcharts
Masking tape

Understanding the OUTPUT indicators 1.3 Module
22 Training modules on SHAW performance monitoring
Key messages
1. OUTPUT indicators are used to measure progress over time with regards to the increased availability
of sanitation and hygiene facilities (such as number of latrines, number of hand washing facilities, etc.)
covering the five STBM pillars and household clean drinking water sources.
Tips and tricks If and where appropriate invite and encourage participants to read parts of the handout in turns.
Alternate the introduction and explanations of the different indicators between different facilitators.
Participants are likely to get bored when listening to the same facilitator for an extensive period of
time.
Adjust your speed of explaining the indicators to the capacity and speed of the participants to take up
and comprehend all the new knowledge.
Take a note of those indicators that were difficult to comprehend by the participants. You may want to
pay extra attention to these indicators when practising data collection in the villages.
Module 1.3 Understanding the OUTPUT indicators
Training modules on SHAW performance monitoring 23
Background information
What are OUTPUT indicators?
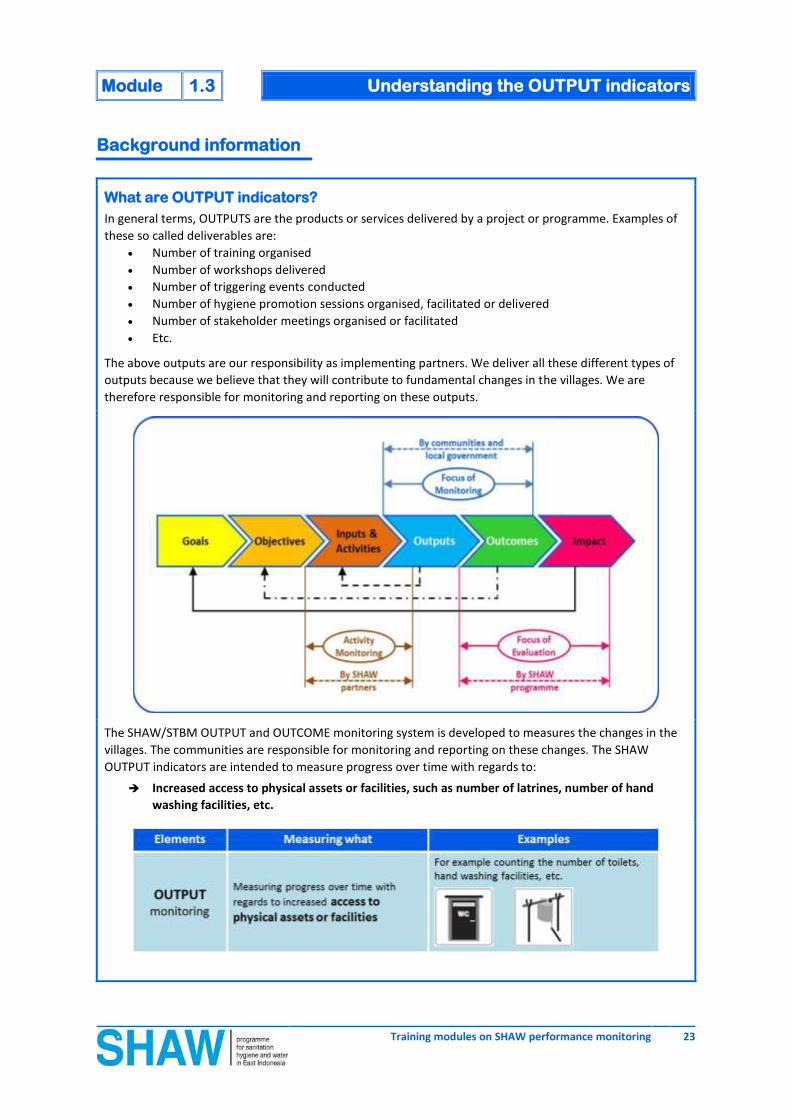
In general terms, OUTPUTS are the products or services delivered by a project or programme. Examples of
these so called deliverables are:
Number of training organised
Number of workshops delivered
Number of triggering events conducted
Number of hygiene promotion sessions organised, facilitated or delivered
Number of stakeholder meetings organised or facilitated
Etc.
The above outputs are our responsibility as implementing partners. We deliver all these different types of
outputs because we believe that they will contribute to fundamental changes in the villages. We are
therefore responsible for monitoring and reporting on these outputs.
The SHAW/STBM OUTPUT and OUTCOME monitoring system is developed to measures the changes in the
villages. The communities are responsible for monitoring and reporting on these changes. The SHAW
OUTPUT indicators are intended to measure progress over time with regards to:
Increased access to physical assets or facilities, such as number of latrines, number of hand
washing facilities, etc.
Understanding the OUTPUT indicators 1.3 Module
24 Training modules on SHAW performance monitoring
What OUTPUT indicators do we use?
Both OUTPUT and OUTCOME indicators measure progress towards achieving the five STBM pillars. The
OUTPUT indicators are intended to measure progress in achieving the following five STBM pillars:
STBM Pillar 1: Stop open defecation (OD), and in particular access by households to improved
sanitary facilities
STBM Pillar 2: Hand washing with soap, and in particular access by households to hand washing
facilities
STBM Pillar 3: Household drinking water treatment and safe storage
STBM Pillar 4: Household solid waste management
STBM Pillar 5: Household wastewater management
In addition there is one more OUTPUT indicator:
Household clean drinking water, and in particular access by households to an improved source of
drinking water
The complete set of OUTPUT indicators is attached to this module.
Module 1.3 Understanding the OUTPUT indicators
Training modules on SHAW performance monitoring 25
Detailed explanations
General Detailed explanations
() Provide a tick or preferably a 1 as this makes it easier to add up all the ticks
(#) Provide a number, for example the number of latrines or the number of
hand washing facilities
General information
Questions Detailed explanations
Number of people living in the house (#)
Obtain a complete picture of all the people living in this house at the time of
the monitoring visit. Include all people that are staying at the house for at
least one month. Do not include short-term guests, visitors and other
passers-by in your count.
Pillar 1: Stop Open Defecation (Stop OD)
Questions Detailed explanations
Does this house have a latrine? This question is about owning a toilet not about having access to a latrine
owned by someone else.
YES () Provide a tick if this house has its own latrine.
NO () Provide a tick if this house does not have its own latrine.
If YES, how many latrines does this house
have? (#) Provide the total number of latrines owned by this house.
If YES, what is the type of latrine and
how many are there? (#)
Select the correct type (a – d) and provide the number of each of these type
of latrines.
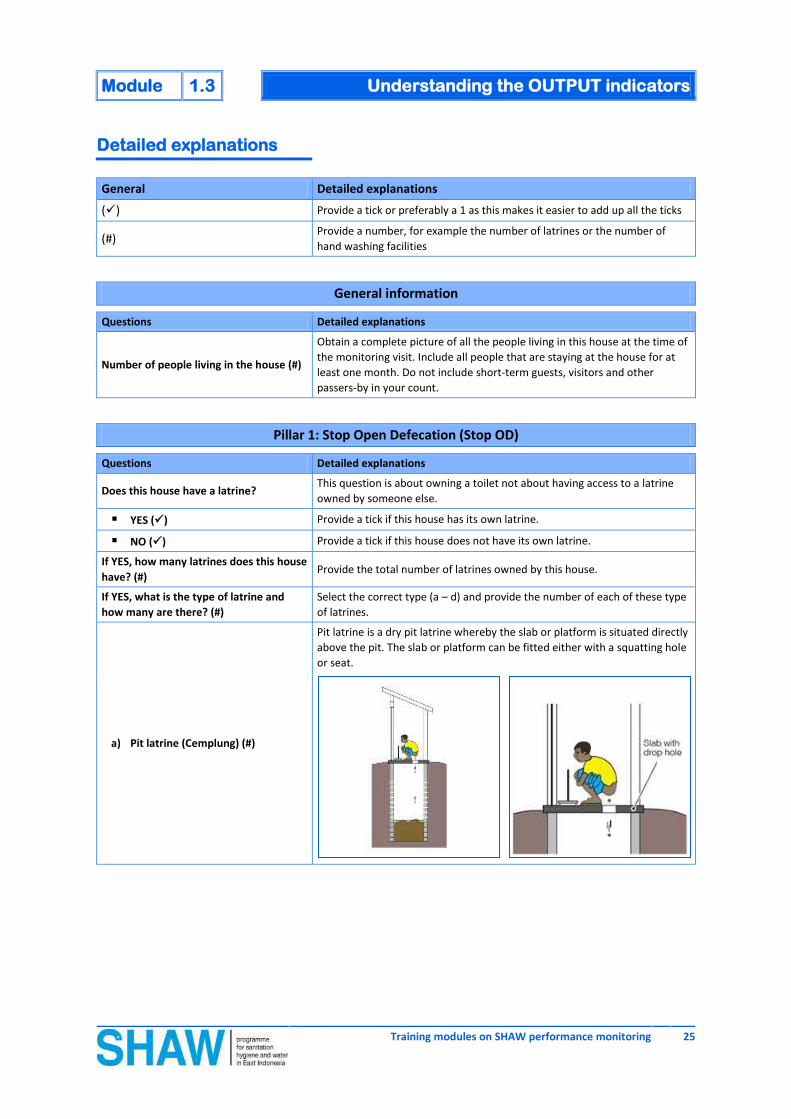
a) Pit latrine (Cemplung) (#)
Pit latrine is a dry pit latrine whereby the slab or platform is situated directly
above the pit. The slab or platform can be fitted either with a squatting hole
or seat.
Understanding the OUTPUT indicators 1.3 Module
26 Training modules on SHAW performance monitoring
Pillar 1: Stop Open Defecation (Stop OD)
Questions Detailed explanations
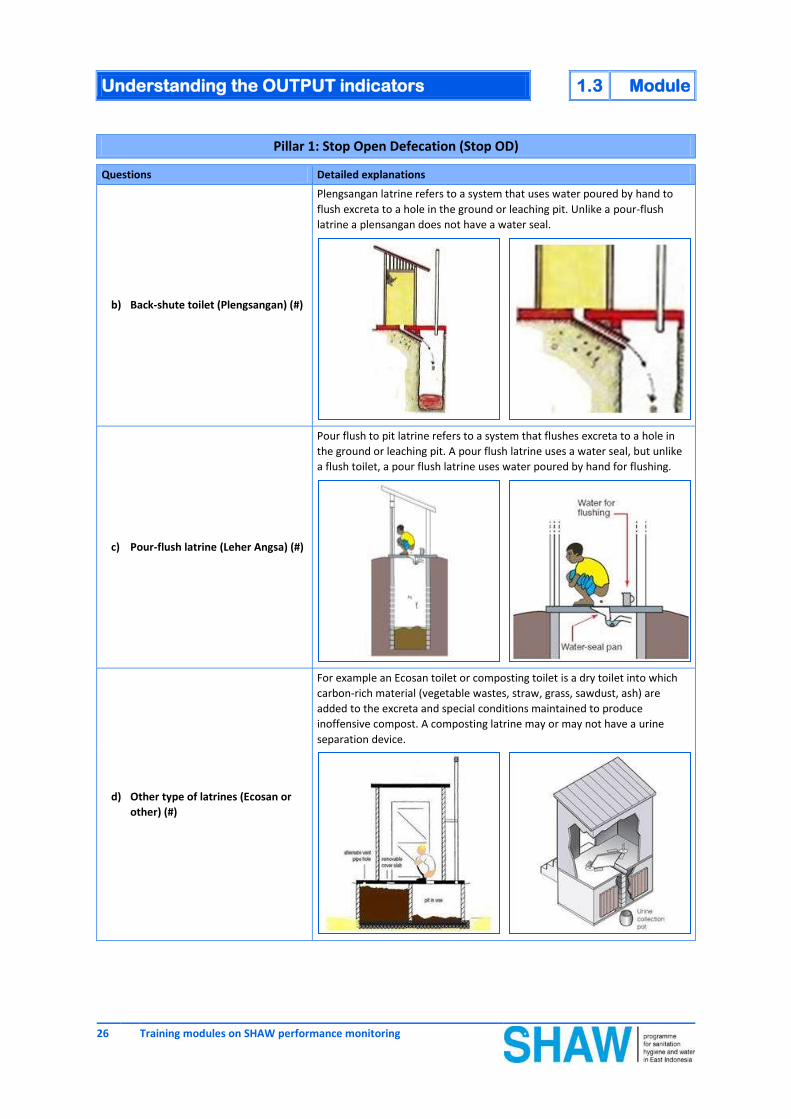
b) Back-shute toilet (Plengsangan) (#)
Plengsangan latrine refers to a system that uses water poured by hand to
flush excreta to a hole in the ground or leaching pit. Unlike a pour-flush
latrine a plensangan does not have a water seal.
c) Pour-flush latrine (Leher Angsa) (#)
Pour flush to pit latrine refers to a system that flushes excreta to a hole in
the ground or leaching pit. A pour flush latrine uses a water seal, but unlike
a flush toilet, a pour flush latrine uses water poured by hand for flushing.
d) Other type of latrines (Ecosan or
other) (#)
For example an Ecosan toilet or composting toilet is a dry toilet into which
carbon-rich material (vegetable wastes, straw, grass, sawdust, ash) are
added to the excreta and special conditions maintained to produce
inoffensive compost. A composting latrine may or may not have a urine
separation device.
Module 1.3 Understanding the OUTPUT indicators
Training modules on SHAW performance monitoring 27
Pillar 1: Stop Open Defecation (Stop OD)
Questions Detailed explanations
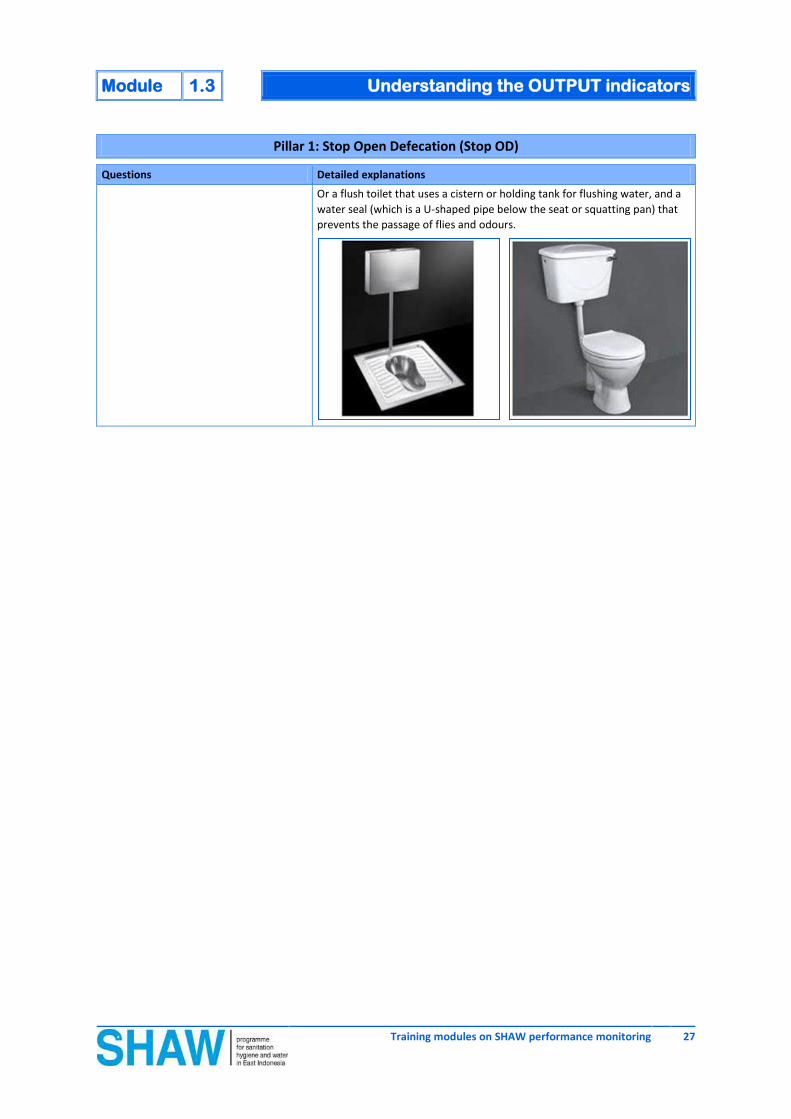
Or a flush toilet that uses a cistern or holding tank for flushing water, and a
water seal (which is a U-shaped pipe below the seat or squatting pan) that
prevents the passage of flies and odours.

Understanding the OUTPUT indicators 1.3 Module
28 Training modules on SHAW performance monitoring
Pillar 2: Hand Washing With Soap (HWWS)
Questions Detailed explanations
Does this house have a specific place to
wash hands?
This question is about having one or more designated hand washing places
or facilities in or around the house.
YES () Provide a tick if this house has a designated place or facility for hand
washing.
NO () Provide a tick if this house does not have a designated place or facility for
hand washing.
If YES, how many hand washing places
does this house have? (#)
Provide the total number of designated places or facilities for hand washing
installed by this house.
If YES, what types and how many are
there? (#)
Select the correct type (a – e) and provide the number of each of these type
of hand washing facilities.
a) Hand washing facility with running
water (piped) (#)
This hand washing device requires running (piped) water and a faucet. It
may therefore not be appropriate in many rural houses where access to
piped water systems is still a dream.
b) Tippy tap/treadle tap (#)
The tippy tap is a hands free way to wash your hands that is especially
appropriate in rural areas where there is no running water. It is operated by
a foot lever and thus reduces the chance of bacteria transmission as the user
only touches the soap. It requires only a little bit of water to wash hands.

Module 1.3 Understanding the OUTPUT indicators
Training modules on SHAW performance monitoring 29
Pillar 2: Hand Washing With Soap (HWWS)
Questions Detailed explanations
c) Hand washing basin with dipper (#)
This can be any type of (preferably closed and covered) water container
(bucket, drum, etc.) where water is taken out by using a handheld dipper
without having to touch the water with (dirty) hands.
d) Hand washing basing with a tap or
other closure (#)
This is often a covered bucket or (used) container with a fixed faucet to
make it easier and more hygienic to drawn water.
For example hand washing devices made of earthen jars

Understanding the OUTPUT indicators 1.3 Module
30 Training modules on SHAW performance monitoring
Pillar 2: Hand Washing With Soap (HWWS)
Questions Detailed explanations
e) Other type of hand washing device
(#)
For example hand washing devices made of bamboo
For example hand washing devices made of jerry cans
Or a hand washing device that makes use of a jug.
If YES, where is the hand washing place
located and how many are there? (#)
Select the correct location (a – c) and provide the number of hand washing
facilities at these locations.
a) Near or in the toilet (#) Provide a number equal to the number of hand washing facilities located
inside the toilet or within 10 paces of the toilet.
b) Near on in the kitchen (#) Provide a number equal to the number of hand washing facilities located
inside the kitchen or within 10 paces of the kitchen.
c) In front of the house or any other
location (#)
Provide a number equal to the number of hand washing facilities located at
any other place inside or outside the house including any hand washing
facility located more than 10 paces away from the toilet and kitchen.

Module 1.3 Understanding the OUTPUT indicators
Training modules on SHAW performance monitoring 31
Pillar 3: Household Water Treatment and safe Storage (HWTS)
Questions Detailed explanations
Is the water treated prior to drinking? This question relates to the treatment of drinking water in the house.
YES () Provide a tick if the inhabitants of the house drink water that has been
treated in the house.
NO () Provide a tick if the inhabitants of the house do no drink water that has
been treated in the house.
If YES, what is the treatment for drinking
water which is most often used?
Household-level approaches to drinking water treatment and safe storage
are also commonly referred to as managing the water at the point of use
(POU). The family members gather water, preferably from an improved
source, and then treat and store it in their home.
Select the treatment option that is most commonly used by the inhabitants
of the house. Only one tick per house is allowed here.
a) Boiling / cooking ()
Boiling is considered the world’s
oldest, most common, and one of
the most effective methods for
treating water. If done properly,
boiling kills or deactivates all
bacteria, viruses, protozoa and
helminths that cause diarrhoeal
disease. The water needs to be
heated until it boils this is when the
temperature reaches 100 degrees
Celsius.
b) Water filtration system (ceramic
filter, slow sand filter, other filters
available in the market) ()
For example water filters fitted with one or more ceramic candles. The filter
consists of two containers, the top one fitted with the ceramic candles and
the bottom one is used to store the filtered water. This system both treats
the water and provides safe storage until it is used.
For example ceramic pot filters where a ceramic pot is fitted inside a
container. The same container is also used to store the treated water until
needed, protecting it from recontamination.

Understanding the OUTPUT indicators 1.3 Module
32 Training modules on SHAW performance monitoring
Pillar 3: Household Water Treatment and safe Storage (HWTS)
Questions Detailed explanations
For example a concrete or plastic biosand filter filled with layers of sieved
and washed sand and gravel.
c) SODIS ()
Solar disinfection (SODIS) uses sunlight to destroy pathogens. It can be used
to disinfect small quantities of water with low turbidy. Contaminated water
is put into transparent plastic bottels and exposed to full sunlight for six or
more hours depending on the intensity of the sun.

Module 1.3 Understanding the OUTPUT indicators
Training modules on SHAW performance monitoring 33
Pillar 3: Household Water Treatment and safe Storage (HWTS)
Questions Detailed explanations
d) Buy bottled water ()
Water can be bought in a variety of bottles of different shapes and sizes. As
people are obsessed with drinking safe and easily accessible water, this
industry is exploding all around the world and is big business. Some
questions its sustainability because it is expensive and wasteful.
e) Other treatment options ()
Is there a special, closed vessel or
container to store treated water?
Households do a lot of work to collect, transport and treat their drinking
water. Even after the water is treated, it should be handled and stored
properly to keep it safe. If it is not stored safely, the treated water quality
could become worse than the source water and may cause illness.
Recontamination of safe drinking water is a significant issue. There is a high
risk of diarrhoea due to water contamination during household storage.
Therefore, treated water needs to be stored in plastic, ceramic or metal
containers.
Examples of closed vessels or containers are provided below.
YES ()
Provide a tick if the treated water is stored in a designated vessel or
container with a strong and tightly-sealing lid or cover that prevents
contamination of the treated water.
NO ()
Provide a tick if the water is not stored in a designated water storage vessel
or container or if it is not stored in a vessel or container with a strong and
tightly sealing lid.

Understanding the OUTPUT indicators 1.3 Module
34 Training modules on SHAW performance monitoring
Pillar 4: Household Solid Waste Management (HSWM)
Questions Detailed explanations
Is there garbage thrown or scattered in
or around the house?
This indicator concerns the proper management (collection and safe
disposal) of waste (garbage, rubbish, litter, etc.) originating from and
generated in private homes on a daily basis.
Household waste can consist of bottles, cans, clothing, food waste, food
packaging, used plastic bags, used paper scraps, etc.
YES, there is garbage in or around
the house ()
Provide a tick if domestic waste is visible inside the home and or outside in
the yard.
NO, no garbage in or around the
house ()
Provide a tick if no domestic waste is visible inside the home and or outside
in the yard.
Pillar 5: Household Waste Water Management (HWWM)
Questions Detailed explanations
Is there household wastewater that
stands stagnant around the house?
This indicator concerns the management (collection and safe disposal) of
liquid waste originating from and generated in and around private homes on
a daily basis. If wastewater is managed properly stagnant pools of water are
likely to occur. Stagnant water can be a major environmental health hazard
as it can allow mosquitoes to breed and reproduce.
Household wastewater or liquid waste can consist of water used for cleaning
the home, water used in the kitchen during food preparation and cleaning
or washing up of kitchen utensils, water used for bathing, spill over water
from a domestic water point, etc.
YES, there is stagnant water
around the house ()
Provide a tick if a stagnant pool of domestic wastewater or liquid waste is
visible inside the home and or outside in the yard.
NO, no stagnant water is visible
around the house ()
Provide a tick if no stagnant pool of domestic wastewater or liquid waste is
visible inside the home and or outside in the yard.
Module 1.3 Understanding the OUTPUT indicators
Training modules on SHAW performance monitoring 35
Household Clean Drinking Water
Questions Detailed explanations
The water source which is most often
used by the family
This indicator concerns the identification of the water source that is most
commonly or most frequently used by the family for domestic water
purposes such as for drinking.
“Improved” sources of drinking water:
An improved drinking-water source is defined by the JMP as one that, by
nature of its construction or through active intervention, is protected from
outside contamination, in particular from contamination with faecal matter.
a) Piped water into house or into yard
()
This is either:
Piped water into house, also called a household connection, defined as a
water service pipe connected with in-house plumbing to one or more
taps (e.g. in the kitchen and bathroom).
Piped water to yard/plot, also called a yard connection, defined as a
piped water connection to a tap placed in the yard or plot outside the
house.
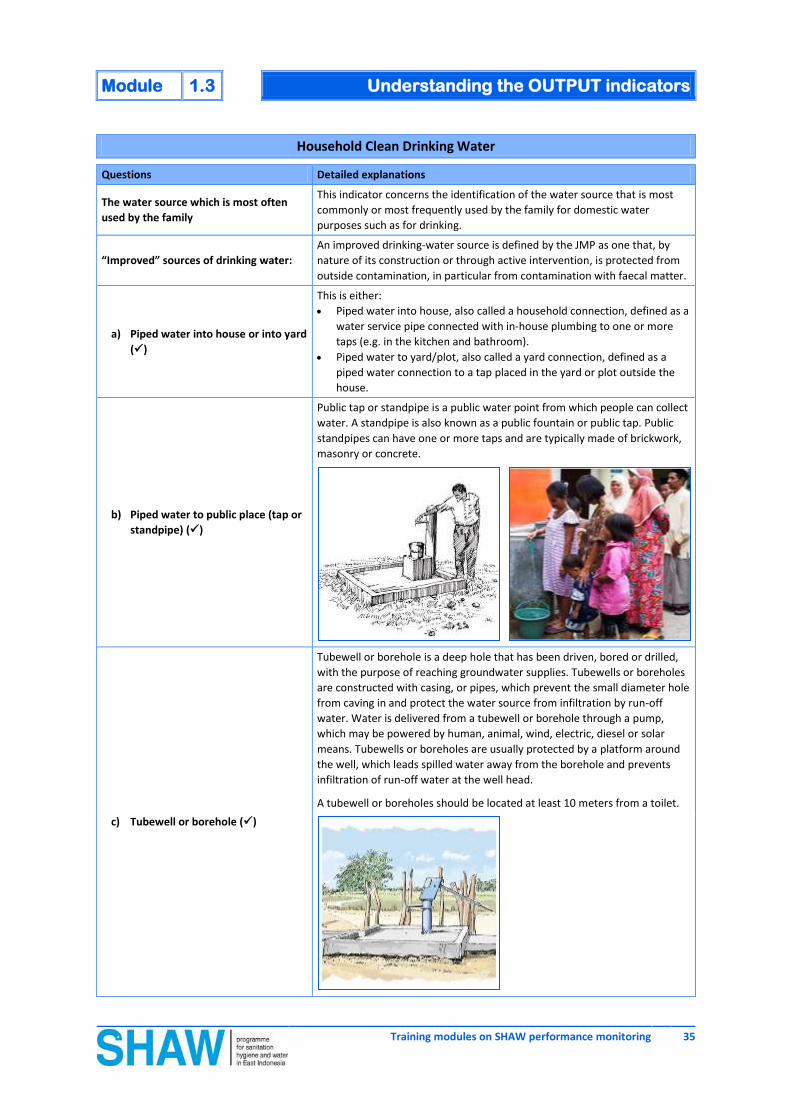
b) Piped water to public place (tap or
standpipe) ()
Public tap or standpipe is a public water point from which people can collect
water. A standpipe is also known as a public fountain or public tap. Public
standpipes can have one or more taps and are typically made of brickwork,
masonry or concrete.
c) Tubewell or borehole ()
Tubewell or borehole is a deep hole that has been driven, bored or drilled,
with the purpose of reaching groundwater supplies. Tubewells or boreholes
are constructed with casing, or pipes, which prevent the small diameter hole
from caving in and protect the water source from infiltration by run-off
water. Water is delivered from a tubewell or borehole through a pump,
which may be powered by human, animal, wind, electric, diesel or solar
means. Tubewells or boreholes are usually protected by a platform around
the well, which leads spilled water away from the borehole and prevents
infiltration of run-off water at the well head.
A tubewell or boreholes should be located at least 10 meters from a toilet.

Understanding the OUTPUT indicators 1.3 Module
36 Training modules on SHAW performance monitoring
Household Clean Drinking Water
Questions Detailed explanations
d) Protected dug well ()
Protected dug well is a dug well that is protected from runoff water by a
well lining or casing that is raised above ground level and a platform that
diverts spilled water away from the well. A protected dug well is also
covered, so that bird droppings and animals cannot fall into the well.
Protected dug wells should be located at least 10 meters from a toilet.
e) Protected spring ()
Protected spring. The spring is typically protected from runoff, bird
droppings and animals by a "spring box", which is constructed of brick,
masonry, or concrete and is built around the spring so that water flows
directly out of the box into a pipe or cistern, without being exposed to
outside pollution.
f) Rainwater stored in a container or
tank until used ()
Rainwater refers to rain that is collected or harvested from surfaces (by roof
or ground catchment) and stored in a container, tank or cistern until used.

Module 1.3 Understanding the OUTPUT indicators
Training modules on SHAW performance monitoring 37
Household Clean Drinking Water
Questions Detailed explanations
“Unimproved” sources of drinking water:
An unimproved drinking-water source provides drinking water from either
an unknown source (e.g. tanker truck or water vendor) or from a known
source which is unlikely to protect the water from contamination.
g) Tanker truck or cart with small
tank/drum ()
This is either:
Tanker-truck, this refers to water trucked into a community and sold
from the water truck.
Or:
Cart with small tank/drum, this refers to water sold by a provider who
transports water into a community. The types of transportation used
include donkey carts, motorized vehicles and other means.
h) Unprotected spring, unprotected
dug well, surface water from river,
reservoir, lake, rainwater stored in
an open container or tank ()
This is either:
Unprotected spring, refers to a spring that is subject to runoff, bird
droppings, or the entry of animals. Unprotected springs typically do not
have a "spring box".

Understanding the OUTPUT indicators 1.3 Module
38 Training modules on SHAW performance monitoring
Household Clean Drinking Water
Questions Detailed explanations
Or:
Unprotected dug well, refers to a dug well for which one of the following
conditions is true: 1) the well is not protected from runoff water; or 2)
the well is not protected from bird droppings and animals. If at least one
of these conditions is true, the well is unprotected.
Or:
Surface water, refers to water located above ground and includes rivers,
dams, lakes, ponds, streams, canals, and irrigation channels.

Module 1.3 Understanding the OUTPUT indicators
Training modules on SHAW performance monitoring 39
Documents used:
CAWST (December 2011) Introduction to Household Water Treatment and Safe Storage, Centre for Affordable
Water and Sanitation Technology, Alberta, Canada. Available at:
http://resources.cawst.org/system/files/HWTS_Manual_2011-12_en.pdf
WEDC (June 2005) Preparation of pictorial illustrations on access to water supply and sanitation facilities for use in
national households survey, Final report (revised), Prepared for the Joint Monitoring Programme on Water Supply
and Sanitation (JMP), WHO and UNICEF.
WEDC (2012) An engineer’s guide to latrine slabs, Water, Engineering and Development Centre, Loughborough
University, Leicestershire, UK.
WEDC (2012) An engineer’s guide to apron slabs for water points, Water, Engineering and Development Centre,
Loughborough University, Leicestershire, UK.
WHO and UNICEF, Joint Monitoring Programme (JMP) for Water Supply and Sanitation, Types of drinking water
sources and sanitation. Available at: http://www.wssinfo.org/definitions-methods/watsan-categories/
WSP Enabling Technologies for Handwashing with Soap website. Available at::
http://www2.wsp.org/scalinguphandwashing/enablingtechnologies/index.cfm?Page=Browse
Appendix:
KARTU DATA MONITORING OUTPUT – PER RUMAH – PER TINGKAT RT
(OUTPUT monitoring data collection form)

40 Training modules on SHAW performance monitoring
Module 1.4: Understanding the OUTCOME indicators
Module 1.4 Understanding the OUTCOME indicators
Training modules on SHAW performance monitoring 41
Relevance Audience
Without a thorough and common understanding of the SHAW programme
OUTCOME indicators it will be unlikely that the data will be collected completely,
correctly, consistently and uniformly, and in a reliable manner.
At the same time the increase in understanding and knowledge may also avoid a
feeling of helplessness and frustration on the part of the people responsible for
collecting the data in the villages.
Cadres / RT
Kepala dusun
Desa STBM team and
desa government staff
Kepala desa and village
secretary
Kecamatan STBM team
Camat and Kecamatan
secretary
Dinas Kesehatan and
Pokja AMPL
SHAW Partner NGO
staff
Objective
To create a clear and common understanding of the OUTCOME indicators.
To provide all the detailed explanations and examples so that data can be
collected completely, correctly, consistently and uniformly.
Steps Materials
1. Start with a short introduction explaining:
What are OUTCOME indicators; and
What OUTCOME indicators do we use to measure progress and results in
the SHAW programme.
2. Distribute the OUTCOME monitoring data collection forms and the handouts
with detailed explanations and examples.
3. Introduce the OUTCOME indicators and take time to thoroughly explain each
and every indicator. Use the handout with detailed explanations and examples
to explain the context of the questions and to illustrate the different options.
OUTCOME monitoring
data collection forms
Handouts with detailed
explanations and
examples
Markers
Flipcharts
Masking tape
Understanding the OUTCOME indicators 1.4 Module
42 Training modules on SHAW performance monitoring
Key messages
1. OUTCOMES are the (end) results that follow from an activity or an intervention.
2. OUTCOME indicators need to be specific, measurable and observable.
3. OUTCOME indicators are used to measure progress over time with regards to:
Increased quality of the facilities; and
Degree in changes in sanitation and hygiene behaviour and or practices.
4. OUTCOME indicators are developed to measure progress on all the five STBM pillars.
5. The SHAW / STBM OUTCOME indicators make it possible to quantify qualitative information such as
behavioural change by using fixed scales (0-3).
Tips and tricks If and where appropriate invite and encourage participants to read parts of the handout in turns.
Alternate the introduction and explanations of the different indicators between different facilitators.
Participants are likely to get bored when listening to the same facilitator for an extensive period of
time.
Adjust your speed of explaining the indicators to the capacity and speed of the participants to take up
and comprehend all the new knowledge.
Take a note of those indicators that were difficult to comprehend by the participants. You may want to
pay extra attention to these indicators when practising data collection in the villages.

Module 1.4 Understanding the OUTCOME indicators
Training modules on SHAW performance monitoring 43
Background information
What are OUTCOME indicators?
In general terms, OUTCOMES are the (end) results that follow from an activity or an intervention. It can be
assumed that any action, activity, intervention, project or programme generates outcomes for the
beneficiaries and other stakeholders. However, we need to be able to prove that the outcomes we are
claiming are actually achieved, and we also need to understand how much change is experienced by the
beneficiaries and other stakeholders.
Outcomes can be tricky to measure, but they can be measured using outcome indicators. An indicator is
basically what it says it is; an indication that a particular outcome has occurred. An OUTCOME indicator is a
specific, observable, and measurable characteristic or change that will represent achievement of the
outcome. To be useful, indicators need to be quantifiable in some way; they need to indicate a change and
they need to be appropriate to the outcome.
Sanitation and hygiene related outcomes reflect the sanitation and hygiene conditions in a community at a
point in time); changes in sanitation and hygiene conditions over a period of time; and changes in sanitation
and hygiene conditions as a result of an intervention.
The SHAW/STBM OUTPUT and OUTCOME monitoring system is developed to measures the changes in the
villages. The communities are responsible for monitoring and reporting on these changes. The SHAW
OUTCOME indicators are intended to measure progress over time with regards to:
Increased quality of the facilities; and
Degree in changes in sanitation and hygiene behaviour and or practices.
The SHAW OUTCOME indicators focus on sanitation and hygiene behaviours and practices that will show
whether households and communities have the adopted the five STBM pillars.

Understanding the OUTCOME indicators 1.4 Module
44 Training modules on SHAW performance monitoring
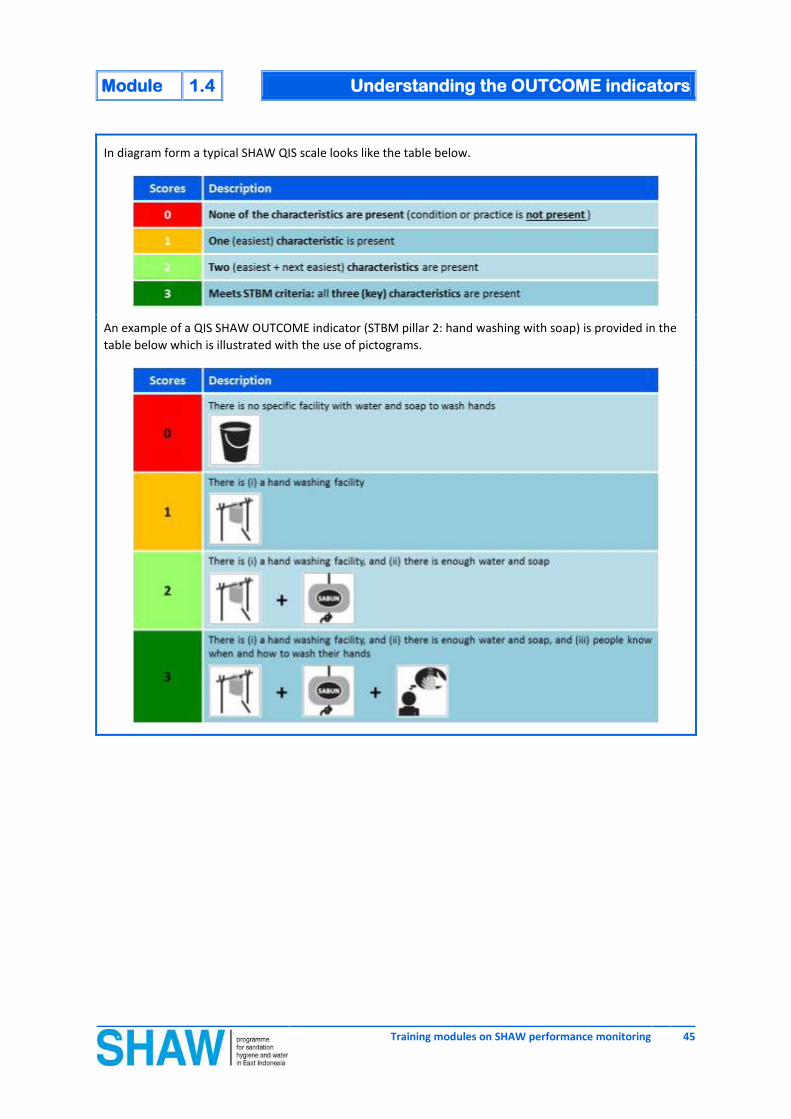
Note: The above examples correspond to level 3 where all three characteristics (STBM criteria) have been
met!
What OUTCOME indicators do we use?
Both OUTPUT and OUTCOME indicators measure progress towards achieving the five STBM pillars. The
OUTCOME indicators are intended to measure progress in achieving the following five STBM pillars:
STBM Pillar 1: Stop open defecation (OD)
Indicator 1.1: Access to a sanitary latrine
Indicator 1.2: Maintenance and hygienic status of the latrine
Indicator 1.3: Usage of the latrine
STBM Pillar 2: Hand washing with soap
Indicator 2: Washing hands with soap at critical times
STBM Pillar 3: Household drinking water treatment and safe storage
Indicator 3: Safe household treatment of drinking water and storage
STBM Pillar 4: Household solid waste management
Indicator 4: Safe household solid waste disposal
STBM Pillar 5: Household wastewater management
Indicator 5: Safe household wastewater disposal
The complete set of OUTCOME indicators is attached to this module.
How to measure OUTCOMES?
As mentioned earlier, outcome indicators need to be quantifiable to be useful. Behavioural changes are in
actual fact outcomes of qualitative processes and therefore not always easy to quantify in terms of
numbers. For that purpose the Qualitative Information System (QIS) has been developed to quantify
qualitative process indicators and outcome indicators such as behavioural change.
“Quantifying Qualitative Information”
Qualitative information is quantified with the help of progressive scales called ‘ladders’. Each step on the
‘ladder’ has a short description, called a mini-scenario, which describes the situation for a particular score.
Scoring is done jointly with respondents using participatory methods. Each scale ranges from the absence of
the particular indicator at the lowest level (score 0) to the optimal mini-scenario at the highest level (score
4). The QIS methodology allows for comparison across areas, groups and time.
Module 1.4 Understanding the OUTCOME indicators
Training modules on SHAW performance monitoring 45
In diagram form a typical SHAW QIS scale looks like the table below.
An example of a QIS SHAW OUTCOME indicator (STBM pillar 2: hand washing with soap) is provided in the
table below which is illustrated with the use of pictograms.

Understanding the OUTCOME indicators 1.4 Module
46 Training modules on SHAW performance monitoring
Detailed explanations
General Detailed explanations
() Provide a tick or preferably a 1 as this makes it easier to add up all the ticks
(#) Provide a number, for example the number of latrines or the number of
hand washing facilities
General information
Questions Detailed explanations
Number of families living in the house (#) Provide the number of families living in this house. A family is a group
consisting of parents and children living together in a household.
Number of people living in the house
Obtain a complete picture of all the people living in this house at the time of
the monitoring visit. Include all people that stay in the house for at least one
month. Do not include short-term guests, visitors and other passers-by in
your count.
Female members (#) Provide the number of all females living in this house (e.g. grandmothers,
wives, adult women, teenage girls, young girls, baby girls, etc.
Male members (#) Provide the number of all males living in this house (e.g. grandfathers,
husbands, adult men, teenage boys, young boys, baby boys, etc.
Where do the family members go to
defecate?
This question is not about owning a toilet but whether the people in the
house have access to any latrine or whether they defecate in the open.
a) Own toilet () Provide a tick if the people living in this house defecate in their own toilet.
b) Use toilet of neighbours /others
()
Provide a tick if the people living in this house use the toilet owned by a
neighbour, a relative, family friends or so on.
c) Use public toilet (MCK, or other)
() Provide a tick if the people living in this house use a public toilet.
d) Do no use a toilet (defecate in the
open) ()
Provide a tick if the people living in this house do not have access to any
toilet and have to defecate somewhere in the open.
Module 1.4 Understanding the OUTCOME indicators
Training modules on SHAW performance monitoring 47
Pillar 1: Stop Open Defecation (Stop OD)
Indicator 1.1: Access to a sanitary latrine
This indicator assesses the design and quality of construction of the latrine and not its maintenance (see indicator 1.2)
and its use (see indicator 1.3).
This indicator deals with the quality of construction of the latrine and in particular whether it meets the WHO / UNICEF
Joint Monitoring Programme for Water Supply and Sanitation (JMP) criteria for an improved sanitation facility. An
improved sanitation facility is defined as one that hygienically separates human excreta from human contact. In the
context of the SHAW programme we consider a ‘sanitary’ or healthy or toilet4 to be one which separates human faecal
matter from the environment (including people, insects, rodents, etc.).
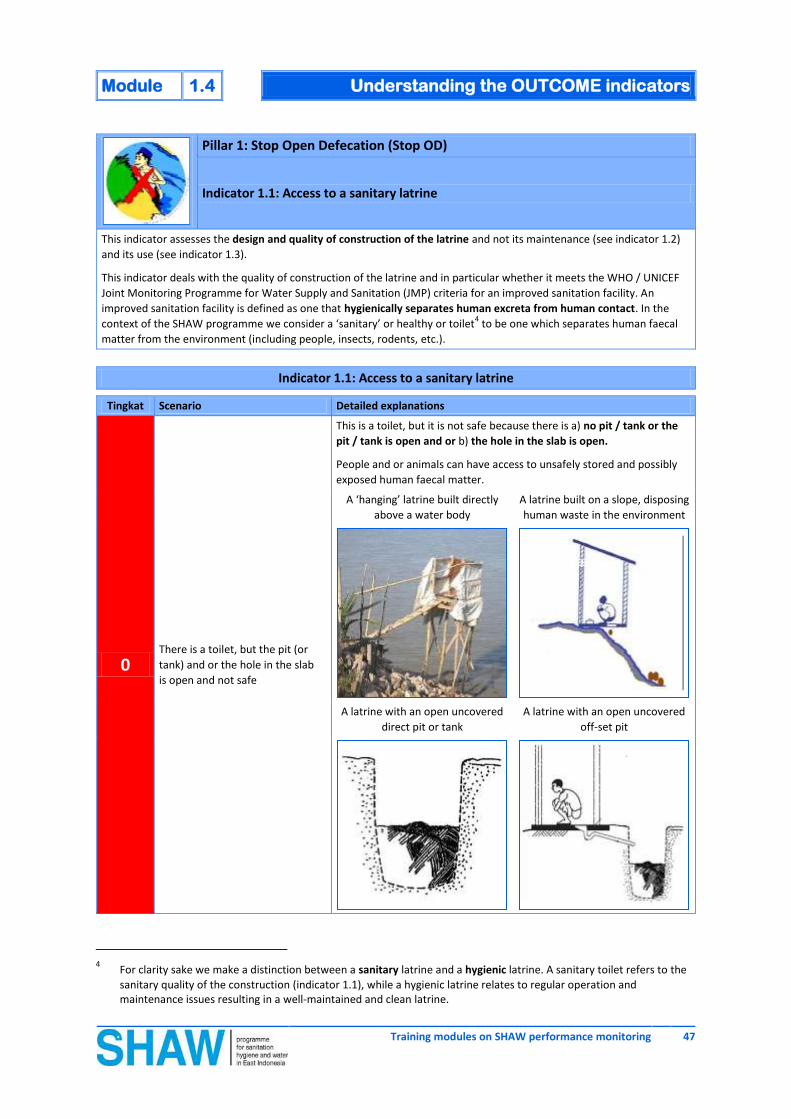
Indicator 1.1: Access to a sanitary latrine
Tingkat Scenario Detailed explanations
0 There is a toilet, but the pit (or
tank) and or the hole in the slab
is open and not safe
This is a toilet, but it is not safe because there is a) no pit / tank or the
pit / tank is open and or b) the hole in the slab is open.
People and or animals can have access to unsafely stored and possibly
exposed human faecal matter.
A ‘hanging’ latrine built directly
above a water body
A latrine built on a slope, disposing
human waste in the environment
A latrine with an open uncovered
direct pit or tank
A latrine with an open uncovered
off-set pit
4 For clarity sake we make a distinction between a sanitary latrine and a hygienic latrine. A sanitary toilet refers to the
sanitary quality of the construction (indicator 1.1), while a hygienic latrine relates to regular operation and maintenance issues resulting in a well-maintained and clean latrine.

Understanding the OUTCOME indicators 1.4 Module
48 Training modules on SHAW performance monitoring
Indicator 1.1: Access to a sanitary latrine
Tingkat Scenario Detailed explanations
1 There is a toilet, and (i) the pit (or
tank) is closed and safe
This is a toilet with
i) a closed and safe pit or tank.
People and or animals cannot access the contents of the pit or tank and
therefore cannot get in contact with human excreta.
A closed and covered single direct
pit
A closed and covered single or
double off-set pit
2
There is a toilet, and (i) the pit (or
tank) is closed and safe, and (ii)
the hole in the slab is closed and
safe
This is a toilet with
(i) a closed and safe pit or tank, and
(ii) a closed and safe slab.
People, animals and or flies cannot access the contents of the pit or tank
and therefore cannot get in contact with human excreta. Also because
the slab is closed, flies cannot enter and emerge from the pit and you
cannot smell the contents of the pit. Examples of a closed and safe slab
are provided below.
The squatting hole of a pit latrine is
covered with a (wooden) cover
that completely covers the hole
Pour-flush toilet pan with a
functioning syphon where the
water seal is intact
3
There is a toilet, and (i) the pit (or
tank) is closed and safe, and (ii)
the hole in the slab is closed and
safe, and (iii) it is at least 10 meter
from a water source
This is a toilet with
(i) a closed and safe pit or tank,
(ii) a closed and safe slab, and
(iii) the toilet is located at least 10 meters away from a water source.
On top of the two elements described under level 2, the toilet is also
safely located away from a water source. This to avoid that human
excreta (faecal sludge) accumulated in the pit or tank contaminates the
groundwater and or surface water that may be used for domestic
purposes.

Module 1.4 Understanding the OUTCOME indicators
Training modules on SHAW performance monitoring 49
Indicator 1.1: Access to a sanitary latrine
Tingkat Scenario Detailed explanations
The toilet should be located at least 10 meter away from any ground
and or surface water source that is used for domestic purposes.
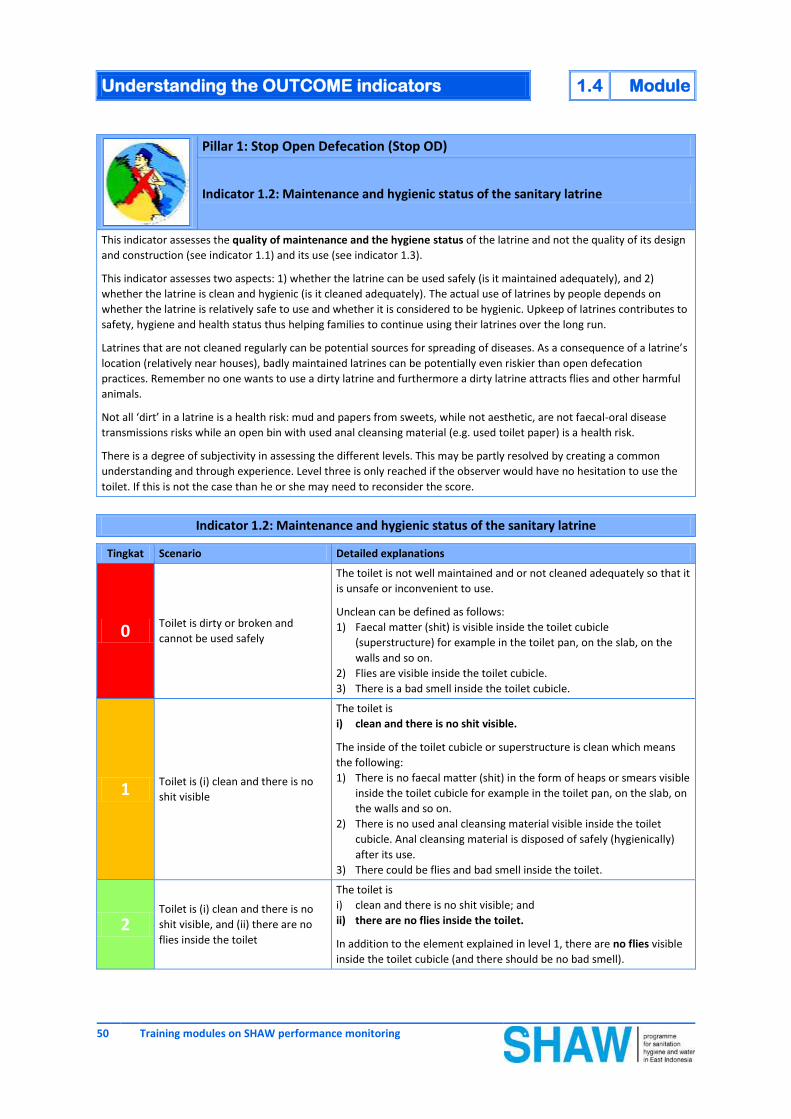
Understanding the OUTCOME indicators 1.4 Module
50 Training modules on SHAW performance monitoring
Pillar 1: Stop Open Defecation (Stop OD)
Indicator 1.2: Maintenance and hygienic status of the sanitary latrine
This indicator assesses the quality of maintenance and the hygiene status of the latrine and not the quality of its design
and construction (see indicator 1.1) and its use (see indicator 1.3).
This indicator assesses two aspects: 1) whether the latrine can be used safely (is it maintained adequately), and 2)
whether the latrine is clean and hygienic (is it cleaned adequately). The actual use of latrines by people depends on
whether the latrine is relatively safe to use and whether it is considered to be hygienic. Upkeep of latrines contributes to
safety, hygiene and health status thus helping families to continue using their latrines over the long run.
Latrines that are not cleaned regularly can be potential sources for spreading of diseases. As a consequence of a latrine’s
location (relatively near houses), badly maintained latrines can be potentially even riskier than open defecation
practices. Remember no one wants to use a dirty latrine and furthermore a dirty latrine attracts flies and other harmful
animals.
Not all ‘dirt’ in a latrine is a health risk: mud and papers from sweets, while not aesthetic, are not faecal-oral disease
transmissions risks while an open bin with used anal cleansing material (e.g. used toilet paper) is a health risk.
There is a degree of subjectivity in assessing the different levels. This may be partly resolved by creating a common
understanding and through experience. Level three is only reached if the observer would have no hesitation to use the
toilet. If this is not the case than he or she may need to reconsider the score.
Indicator 1.2: Maintenance and hygienic status of the sanitary latrine
Tingkat Scenario Detailed explanations
0 Toilet is dirty or broken and
cannot be used safely
The toilet is not well maintained and or not cleaned adequately so that it
is unsafe or inconvenient to use.
Unclean can be defined as follows:
1) Faecal matter (shit) is visible inside the toilet cubicle
(superstructure) for example in the toilet pan, on the slab, on the
walls and so on.
2) Flies are visible inside the toilet cubicle.
3) There is a bad smell inside the toilet cubicle.
1 Toilet is (i) clean and there is no
shit visible
The toilet is
i) clean and there is no shit visible.
The inside of the toilet cubicle or superstructure is clean which means
the following:
1) There is no faecal matter (shit) in the form of heaps or smears visible
inside the toilet cubicle for example in the toilet pan, on the slab, on
the walls and so on.
2) There is no used anal cleansing material visible inside the toilet
cubicle. Anal cleansing material is disposed of safely (hygienically)
after its use.
3) There could be flies and bad smell inside the toilet.
2 Toilet is (i) clean and there is no
shit visible, and (ii) there are no
flies inside the toilet
The toilet is
i) clean and there is no shit visible; and
ii) there are no flies inside the toilet.
In addition to the element explained in level 1, there are no flies visible
inside the toilet cubicle (and there should be no bad smell).
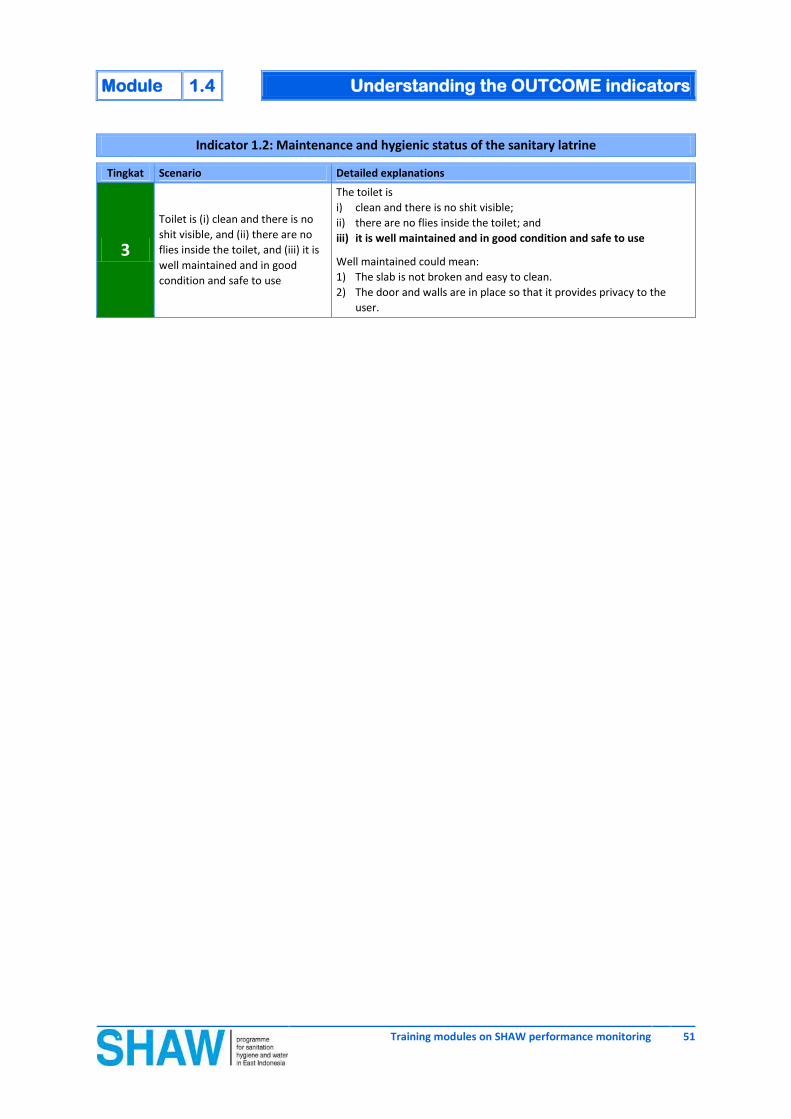
Module 1.4 Understanding the OUTCOME indicators
Training modules on SHAW performance monitoring 51
Indicator 1.2: Maintenance and hygienic status of the sanitary latrine
Tingkat Scenario Detailed explanations
3
Toilet is (i) clean and there is no
shit visible, and (ii) there are no
flies inside the toilet, and (iii) it is
well maintained and in good
condition and safe to use
The toilet is
i) clean and there is no shit visible;
ii) there are no flies inside the toilet; and
iii) it is well maintained and in good condition and safe to use
Well maintained could mean:
1) The slab is not broken and easy to clean.
2) The door and walls are in place so that it provides privacy to the
user.

Understanding the OUTCOME indicators 1.4 Module
52 Training modules on SHAW performance monitoring
Pillar 1: Stop Open Defecation (Stop OD)
Indicator 1.3: Usage of the sanitary latrine
This indicator assesses the actual use of the latrine and not the quality of its design and construction (see indicator 1.1)
and the quality of maintenance and the hygiene status of the latrine (see indicator 1.2).
This indicator assesses whether the latrine is being used consistently by all household members when they are in or
around the house. Having access to a latrine does not mean that the latrine is used by all at all times. There can be many
reasons (e.g. accessibility, convenience, privacy, security, location, type of slab and squatting hole, etc.) why certain
members of the household will not use a latrine at all times. The creation of Open Defecation Free villages goes well
beyond the construction of latrines. It requires that all the villagers have access to a latrine and that they consistently
use it when in the village.
Considering that certain members of the family may not be able to use the latrine independently, this indicator assesses
the safe disposal of human faeces of all family members. Safe disposal means either defecating or disposing of faeces in
a latrine. Exposure to human faeces is a primary source of diarrhoeal disease. It is therefore essential for hygiene
improvements that households safely dispose of both adult and child faecal matter. Exposure to children’s faeces,
especially faeces from children under the age of three, is a critical factor, because young children are more likely to
contaminate the household environment since they are less likely to use a latrine.
Indicator 1.3: Usage of the sanitary latrine
Tingkat Scenario Detailed explanations
0 Nobody uses the toilet
The toilet is not used by any of the people living in the house.
This is easy to ascertain by inspecting the toilet carefully, for example:
1) Are there any actual signs that the toilet is used? Consider the
following: :
Are there any anal cleansing materials?
Is there water for flushing in case of a pour-flush toilet?
Is there any hint of a smell inside the toilet?
Are there any faecal smears on the floor (slab)?
2) Are there any signs of Open Defecation around the house, for
example:
Is there any faecal matter of babies and infants (poop) visible in
or around the house?
3) In the case of a simple direct pit latrine it is rather easy to assess
usage by inspecting the amount of faecal matter in the pit with the
use of a dipstick made out of bamboo or any other local material.
1 Toilet is (i) used by women and
girls
The toilet is used by:
i) women and girls
Here we mean all abled females living in the house. Although practices
differ from place to place, women and adolescent girls are usually the
first to use a toilet. This for the simple reason that a toilet provides more
privacy and safety than most places used for open defecation.
2 Toilet is (i) used by women and
girls, and (ii) men and boys
The toilet is used by
i) women and girls; and by
ii) men and boys
Here we mean all abled males living in the house. This is not necessarily
a category that easily changes their habits. Men might prefer the outside
over a potentially foul smelling or dark toilet. Young boys might feel
insecure or scared in direct pit latrines with large squatting holes.

Module 1.4 Understanding the OUTCOME indicators
Training modules on SHAW performance monitoring 53
Indicator 1.3: Usage of the sanitary latrine
Tingkat Scenario Detailed explanations
3
Toilet is (i) used by women and
girls, and (ii) men and boys, and
(iii) the faeces of all other persons
are disposed safely in the toilet
The toilet is used by:
i) women and girls;
ii) men and boys; and the
iii) faeces of all other persons living in the house are disposed safely
inside the toilet
This concerns the safe disposal by caretakers of human faeces of other
family members who may not be able to go to the toilet on their own.
Consider for example:
1) The faeces (stools) of babies or infants.
2) The faeces of boys and girls under the age of five who are either too
young or who are afraid to go to the toilet on their own.
3) The faeces of elderly or disabled people who are not able to go to
the toilet on their own.
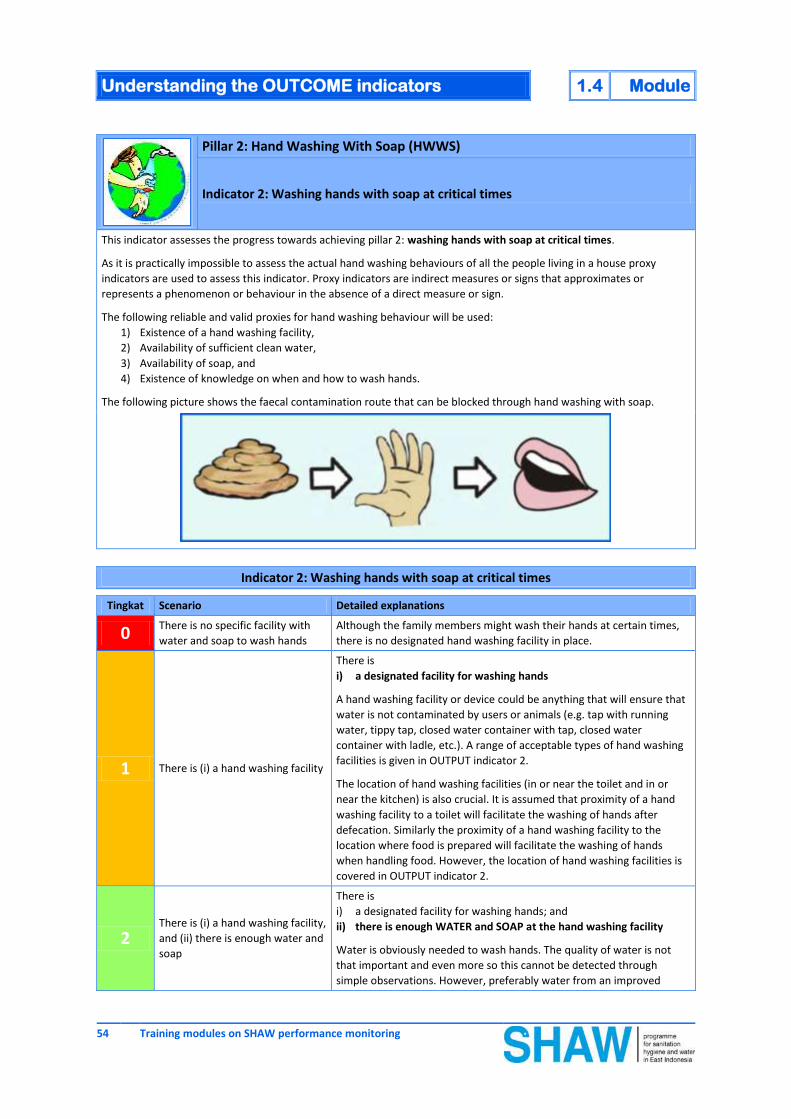
Understanding the OUTCOME indicators 1.4 Module
54 Training modules on SHAW performance monitoring
Pillar 2: Hand Washing With Soap (HWWS)
Indicator 2: Washing hands with soap at critical times
This indicator assesses the progress towards achieving pillar 2: washing hands with soap at critical times.
As it is practically impossible to assess the actual hand washing behaviours of all the people living in a house proxy
indicators are used to assess this indicator. Proxy indicators are indirect measures or signs that approximates or
represents a phenomenon or behaviour in the absence of a direct measure or sign.
The following reliable and valid proxies for hand washing behaviour will be used:
1) Existence of a hand washing facility,
2) Availability of sufficient clean water,
3) Availability of soap, and
4) Existence of knowledge on when and how to wash hands.
The following picture shows the faecal contamination route that can be blocked through hand washing with soap.
Indicator 2: Washing hands with soap at critical times
Tingkat Scenario Detailed explanations
0 There is no specific facility with
water and soap to wash hands
Although the family members might wash their hands at certain times,
there is no designated hand washing facility in place.
1 There is (i) a hand washing facility
There is
i) a designated facility for washing hands
A hand washing facility or device could be anything that will ensure that
water is not contaminated by users or animals (e.g. tap with running
water, tippy tap, closed water container with tap, closed water
container with ladle, etc.). A range of acceptable types of hand washing
facilities is given in OUTPUT indicator 2.
The location of hand washing facilities (in or near the toilet and in or
near the kitchen) is also crucial. It is assumed that proximity of a hand
washing facility to a toilet will facilitate the washing of hands after
defecation. Similarly the proximity of a hand washing facility to the
location where food is prepared will facilitate the washing of hands
when handling food. However, the location of hand washing facilities is
covered in OUTPUT indicator 2.
2 There is (i) a hand washing facility,
and (ii) there is enough water and
soap
There is
i) a designated facility for washing hands; and
ii) there is enough WATER and SOAP at the hand washing facility
Water is obviously needed to wash hands. The quality of water is not
that important and even more so this cannot be detected through
simple observations. However, preferably water from an improved

Module 1.4 Understanding the OUTCOME indicators
Training modules on SHAW performance monitoring 55
Indicator 2: Washing hands with soap at critical times
Tingkat Scenario Detailed explanations
water source should be used.
If there is no soap at a hand washing facility, hand washing with soap
will not occur. Consequently, checking to see if soap is present at a hand
washing facility is a simple and important indicator. The visible presence
of soap at a hand washing facility acts as a cue and thus a reminder that
it needs to be used.
Soap could be any kind of soap not necessarily a bar of soap but any
kind of locally available cleansing agent (e.g. soap in liquid form,
detergent, etc.).
3
There is (i) a hand washing facility,
and (ii) there is enough water and
soap, and (iii) people know when
and how to wash their hands
There is
i) a designated facility for washing hands;
ii) there is enough water and soap at the hand washing facility; and
iii) people living in the house know WHEN and HOW to wash their
hands
This level requires assessing or testing increases in knowledge of the
family members in regards to WHEN they need to wash their hands and
HOW to wash their hands.
Re WHEN: Critical times to wash hands are first and foremost those
occasions when people can get in contact with human excreta and when
people get in direct contact with food; namely:
After defecating (after using the toilet);
After cleaning a child who has defecated; and
Before handling food (this includes preparing food, eating food
and feeding food to for example an infant).
Re HOW: there are many posters with instructions on how to wash
hands. To be frankly the knowledge on critical times is much more
relevant than being able to remember exactly all the steps on how to
wash hands. An example of a hand washing poster is provided below.

Understanding the OUTCOME indicators 1.4 Module
56 Training modules on SHAW performance monitoring
Pillar 3: Household Water Treatment and safe Storage (HWTS)
Indicator 3: Treatment of drinking water and safe storage
This indicator assesses the progress towards achieving pillar 3: treatment of drinking water and safe storage at
household level. This indicator measures the % of households practicing recommended household water treatment
technologies.
Health can be compromised when pathogens (microorganisms that cause disease) contaminate drinking water. This
contamination can occur at the source or within a piped distribution system. Even unhygienic handling of water during
transport or within the home can contaminate previously safe water. For these reasons, many people who have access
to improved water supplies through piped connections, protected wells or other improved sources are still, in fact,
drinking contaminated water.
The main advantage of household water treatment and safe storage is that it can be adopted immediately in the homes
to improve drinking water quality. It is proven to be an effective way to prevent disease from unsafe water. Household
water treatment and safe storage allows people to take responsibility of their own water security by treating and safely
storing water themselves.
Households may opt for one of the effective methods available to treat their drinking water to improve water quality
and reduce diarrhoeal disease. This indicator captures those practices, regardless of which treatment option is used.
Safe storage of treated drinking water is important to avoid recontamination of the treated water. Therefore, treated
water needs to be stored in plastic, ceramic or metal containers preferably with the following characteristics:
A narrow mouth or opening (under 10 cm)
A lid or securely fitted cover
A tap
These characteristics prevent users from placing potentially contaminated item (e.g. hands, cups, ladles) into the stored
water. Some household water treatment and storage products and methods include safe storage (e.g. lid and tap) that
are integral to the design. This is the case for some ceramic filters and solar disinfection (SODIS), and therefore these are
the preferred options. Others such as boiling and biosand filters do not include safe storage and will require additional
steps to ensure safe storage. The risks of water contamination are given in the picture below.
Indicator 3: Treatment of drinking water and safe storage
Tingkat Scenario Detailed explanations
0 People drink raw/untreated water The water used for drinking purposes is not treated in any way. Water
collected from the water source is consumed directly.
1 Drinking water is (i) treated
Drinking water is
i) treated
Households may opt for any one or a combination of available and
appropriate effective water treatment options. A range of treatment
options is given in OUTPUT indicator 3.

Module 1.4 Understanding the OUTCOME indicators
Training modules on SHAW performance monitoring 57
Indicator 3: Treatment of drinking water and safe storage
Tingkat Scenario Detailed explanations
2 Drinking water is (i) treated, and
(ii) stored in a clean and closed
container
Drinking water is
i) treated, and
ii) stored in a clean and closed container
Treated water must be safely stored in plastic, ceramic or metal
containers to avoid recontamination prior to use. Safe storage means
keeping treated water away from sources of contamination by using a
clean and covered container however the utensils or tools used to
withdraw the water is still left out in the open (uncovered). Storage
containers are deemed to be safe when they meet the following
characteristics:
a narrow mouth or opening
a lid or securely fitted cover
a tap
3
Drinking water is (i) treated, and
(ii) stored in a clean and closed
container, and (iii) withdrawn or
taken out safely
Drinking water is
i) treated,
ii) stored in a clean and closed container, and
iii) withdrawn or taken out safely.
Unhygienic handling of water within the home can contaminate
previously safe water. For example it not properly handled, treated and
stored drinking water can be easily contaminated when water is taken
out of the storage container. This means that water should be drawn
from the container in a way that won’t recontaminate the water and
cause sickness. The container therefore should prevent hands and cups
from touching the water.
Preferably the water storage container should have a tap or any other
device so that water can be withdrawn safely without potentially dirty
hands or dirty objects and utensils getting in contact with the treated
and stored water. Examples of appropriate drinking water storage
containers are shown below:
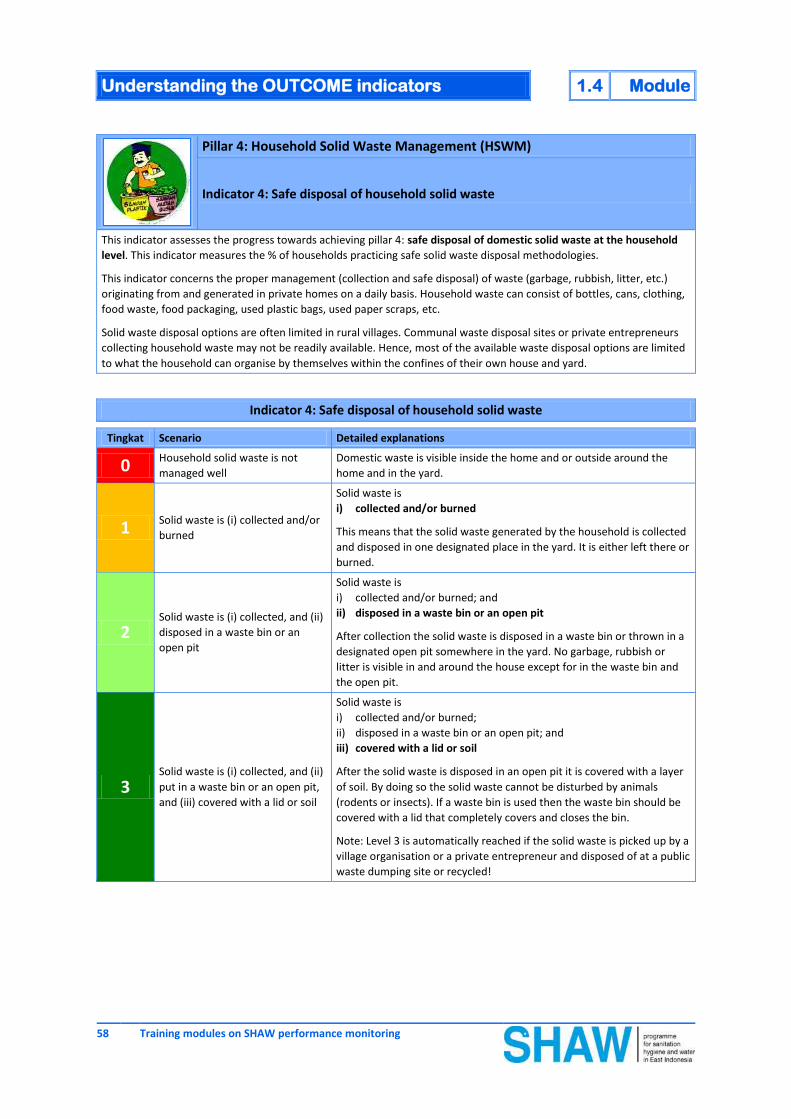
Understanding the OUTCOME indicators 1.4 Module
58 Training modules on SHAW performance monitoring
Pillar 4: Household Solid Waste Management (HSWM)
Indicator 4: Safe disposal of household solid waste
This indicator assesses the progress towards achieving pillar 4: safe disposal of domestic solid waste at the household
level. This indicator measures the % of households practicing safe solid waste disposal methodologies.
This indicator concerns the proper management (collection and safe disposal) of waste (garbage, rubbish, litter, etc.)
originating from and generated in private homes on a daily basis. Household waste can consist of bottles, cans, clothing,
food waste, food packaging, used plastic bags, used paper scraps, etc.
Solid waste disposal options are often limited in rural villages. Communal waste disposal sites or private entrepreneurs
collecting household waste may not be readily available. Hence, most of the available waste disposal options are limited
to what the household can organise by themselves within the confines of their own house and yard.
Indicator 4: Safe disposal of household solid waste
Tingkat Scenario Detailed explanations
0 Household solid waste is not
managed well
Domestic waste is visible inside the home and or outside around the
home and in the yard.
1 Solid waste is (i) collected and/or
burned
Solid waste is
i) collected and/or burned
This means that the solid waste generated by the household is collected
and disposed in one designated place in the yard. It is either left there or
burned.
2 Solid waste is (i) collected, and (ii)
disposed in a waste bin or an
open pit
Solid waste is
i) collected and/or burned; and
ii) disposed in a waste bin or an open pit
After collection the solid waste is disposed in a waste bin or thrown in a
designated open pit somewhere in the yard. No garbage, rubbish or
litter is visible in and around the house except for in the waste bin and
the open pit.
3 Solid waste is (i) collected, and (ii)
put in a waste bin or an open pit,
and (iii) covered with a lid or soil
Solid waste is
i) collected and/or burned;
ii) disposed in a waste bin or an open pit; and
iii) covered with a lid or soil
After the solid waste is disposed in an open pit it is covered with a layer
of soil. By doing so the solid waste cannot be disturbed by animals
(rodents or insects). If a waste bin is used then the waste bin should be
covered with a lid that completely covers and closes the bin.
Note: Level 3 is automatically reached if the solid waste is picked up by a
village organisation or a private entrepreneur and disposed of at a public
waste dumping site or recycled!

Module 1.4 Understanding the OUTCOME indicators
Training modules on SHAW performance monitoring 59
Pillar 5: Household Waste Water Management (HWWM)
Indicator 5: Safe disposal of household wastewater
This indicator assesses the progress towards achieving pillar 5: safe disposal of wastewater at the household level. This
indicator measures the % of households practicing safe wastewater disposal methodologies.
This indicator concerns the proper management (collection and safe disposal) of wastewater or liquid waste originating
from and generated in and outside private homes on a daily basis as well as rain water. Wastewater or liquid waste can
consist of water used for cleaning the home, water used in the kitchen during food preparation and cleaning or washing
up of kitchen utensils, water used for bathing, spill over water from a domestic water point, etc. as well as rain water.
In the absence of sewers and or drains for collecting and transporting wastewater, wastewater disposal options are
often limited in rural villages. Hence, most of the available waste disposal options are limited to what the household can
organise by themselves within the confines of their own house and yard.
Indicator 5: Safe disposal of household wastewater
Tingkat Scenario Detailed explanations
0 Wastewater is not managed well Wastewater is standing in pools around the home and in the yard.
1 Wastewater is (i) collected in one
place
Wastewater is
i) collected in one place
This means that any wastewater or liquid waste is led to and or collected
in one designated place in the yard. This will avoid the accumulation of
excess water in a number of unpredictable and erratic pools.
2
Wastewater is (i) collected in one
place, and (ii) disposed of in a
drain away from the house and
yard
Wastewater is
i) collected in one place; and
ii) disposed of in a drain away from the house and yard
After collecting the wastewater in one place it is disposed of in a drain
away from the house and yard. No pools of standing water are visible in
and around the house.
3
Wastewater is (i) collected in one
place, (ii) disposed of in a drain,
and (iii) the drain leads to a safe
place, for example a soak away
pit, a vegetable garden, a rice
field, a river, or a public drain
Wastewater is
i) collected in one place;
ii) disposed of in a drain; and
iii) the drain leads to a safe place, for example a soak away pit, a
vegetable garden, a rice field, a river, or a public drain
Here the wastewater is collected, led to a drain and disposed of in a safe
place away from the home and the yard. The wastewater is either
disposed of in a designated soak away or leaching pit on or of the yard,
reused in vegetable gardens or rice fields, or taken to an open water
body or public drain. No pools of standing water are visible in and
around the home and in the yard.
Note: Level 3 is automatically reached if there is no stagnant water
throughout the year!
Understanding the OUTCOME indicators 1.4 Module
60 Training modules on SHAW performance monitoring
Documents used:
CAWST (December 2011) Introduction to Household Water Treatment and Safe Storage, Centre for Affordable
Water and Sanitation Technology, Alberta, Canada. Available at:
http://resources.cawst.org/system/files/HWTS_Manual_2011-12_en.pdf
CAWST (January 2012) Household Water Treatment and Safe Storage Fact Sheets, Centre for Affordable Water and
Sanitation Technology, Alberta, Canada. Available at:
http://resources.cawst.org/system/files/HWTS%20Fact%20Sheets_Pathogen%20Removal_Detailed_2012-
01_en.pdf
USAID (2010) Access and Behavioural Outcome Indicators for WASH. Available at:
http://www.hip.watsan.net/page/4148
WSP Enabling Technologies for Handwashing with Soap website. Available at::
http://www2.wsp.org/scalinguphandwashing/enablingtechnologies/index.cfm?Page=Browse
Appendix:
KARTU DATA MONITORING OUTCOME – PER RUMAH – PER TINGKAT RT
(OUTCOME monitoring data collection form with pictograms)
Training modules on SHAW performance monitoring 61
Module 1.5: Planning and organising monitoring
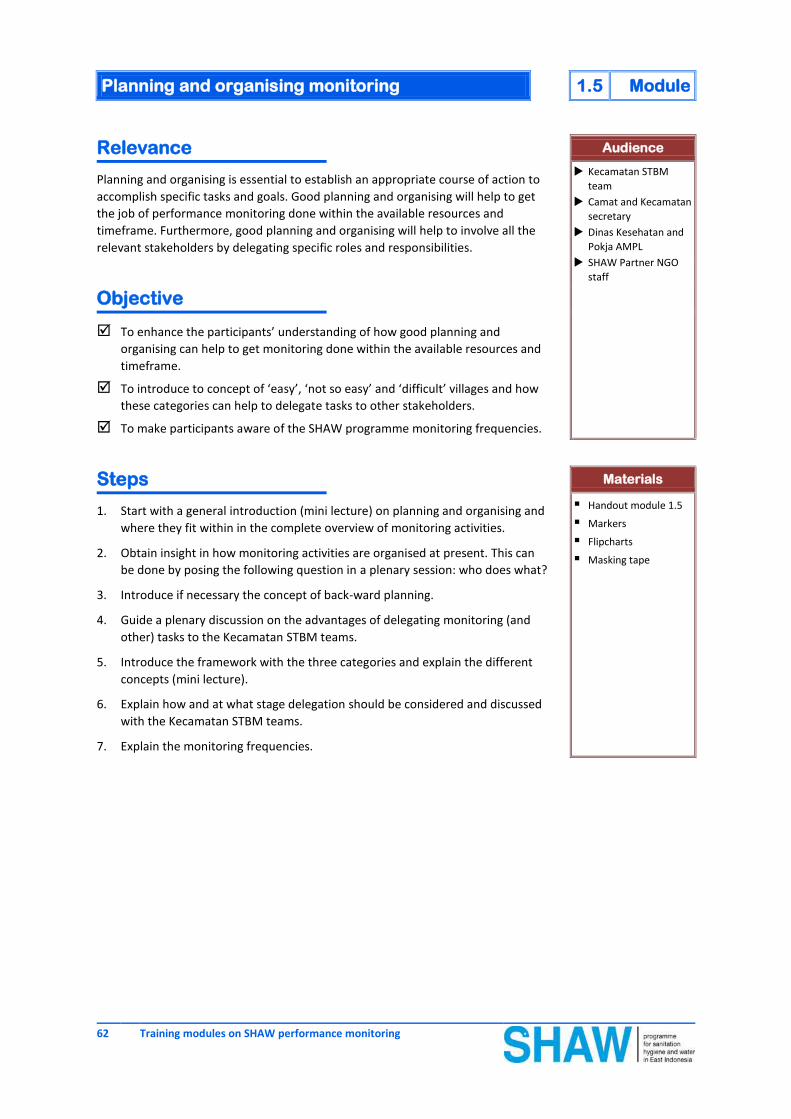
Planning and organising monitoring 1.5 Module
62 Training modules on SHAW performance monitoring
Relevance Audience
Planning and organising is essential to establish an appropriate course of action to
accomplish specific tasks and goals. Good planning and organising will help to get
the job of performance monitoring done within the available resources and
timeframe. Furthermore, good planning and organising will help to involve all the
relevant stakeholders by delegating specific roles and responsibilities.
Kecamatan STBM
team
Camat and Kecamatan
secretary
Dinas Kesehatan and
Pokja AMPL
SHAW Partner NGO
staff
Objective
To enhance the participants’ understanding of how good planning and
organising can help to get monitoring done within the available resources and
timeframe.
To introduce to concept of ‘easy’, ‘not so easy’ and ‘difficult’ villages and how
these categories can help to delegate tasks to other stakeholders.
To make participants aware of the SHAW programme monitoring frequencies.
Steps Materials
1. Start with a general introduction (mini lecture) on planning and organising and
where they fit within in the complete overview of monitoring activities.
2. Obtain insight in how monitoring activities are organised at present. This can
be done by posing the following question in a plenary session: who does what?
3. Introduce if necessary the concept of back-ward planning.
4. Guide a plenary discussion on the advantages of delegating monitoring (and
other) tasks to the Kecamatan STBM teams.
5. Introduce the framework with the three categories and explain the different
concepts (mini lecture).
6. Explain how and at what stage delegation should be considered and discussed
with the Kecamatan STBM teams.
7. Explain the monitoring frequencies.
Handout module 1.5
Markers
Flipcharts
Masking tape

Module 1.5 Planning and organising monitoring
Training modules on SHAW performance monitoring 63
Key messages
1. Planning and organising is the first step in monitoring.
2. Good planning ensures that monitoring is carried out and completed in time.
3. Think and act ‘smart’ by delegating tasks to the Kecamatan STBM teams, to
Optimise the use of limited resources; and to
Develop their capacity to enable continued monitoring and provision of support to villages.
4. Divide tasks on the basis of three categories: ‘easy’; ‘not so easy’; and ‘difficult’ villages.
Kecamatan STBM teams, with relatively less experience and or less capacity than the SHAW
partners, should be responsible for the ‘easy’ villages; and
SHAW partners, with relatively more experience and capacity than the Kecamatan STBM teams,
should be responsible for the ‘not so easy’ villages.
5. Stick to the monitoring frequencies set by the SHAW programme and plan and organise the
monitoring activities in line with these frequencies. Ensure that sufficient time is available for each sub-
activity.
Tips and tricks Limit the time of the mini lectures and keep the amount of information in check. Don’t overdo it
otherwise the participants might get lost and lose interest!
Adjust the depth of the introduction and the explanations of the different concepts to the audience.
Actors at the Kecamatan level might be more interested to understand the in-depth explanation
provided in the background information section as it directly involves them.
The concept of ‘easy’, ‘not so easy’ and ‘difficult’ Kecamatan STBM teams is potentially a sensitive issue
which needs to be addressed carefully when dealing with Kecamatan and Kabupaten level
stakeholders.
Put an emphasis on the key messages during the mini lectures when you are explaining the different
concepts as well as during the final wrap up session.

Planning and organising monitoring 1.5 Module
64 Training modules on SHAW performance monitoring
Background information
What is planning and organising?
Planning and organising is the first step to take before any activity can be implemented. This is no different
for undertaking monitoring activities. The main sub-activities or steps in monitoring are shown in the figure
below.
Planning is the process of thinking about and organising a set of activities required to achieve a desired task
or goal. Planning involves the development and maintenance of a course of action. Maintenance here refers
to keeping the plans relevant and up to date. The thought process that goes into the creation and
refinement of a plan, or integration of it with other plans, is a crucial part of the planning stage. You can
develop a plan of action after you have decided the order in which you must carry out the activities. A plan
of action lists who will do what tasks at what period.
Without a plan you will never succeed. If you happen to succeed any way, it will have been by luck or
chance and you will not be able to repeat this success.
Organising is the act of placing different tasks in a coherent, systematic and logical arrangement to ensure
efficient and effective implementation. Organising is necessary to realise your plan; to make it happen.
Organising may involve one or more of the following:
Ensuring that everything is ready ahead of when it is required (e.g. duplication of data collection
and data recapitulation forms, databases)
Preparing the actors involved in the activity (e.g. informing, training, instructing, delegating,
motivating)
Organising transportation
Planning and organising monitoring
Good planning will help to ensure that monitoring is carried out and completed in time. As the reporting
deadlines are known and fixed, this requires basically a back-ward planning exercise. This is shown in the
picture below.
On the basis of past experience it should be possible to establish or calculate the total time required for
carrying out all the different monitoring activities. The actual time required depends on:
The number of villages that are to be monitored
The time that is required in the villages to collect and recapitulate all the data
The number of staff available to support the activities in the villages (supervision, quality control
and collection of data recapitulation forms
The number of motivated and trained Kecamatan STBM teams
The time that is required for data entries
The time that is required for data analysis
The time that is required for reporting

Module 1.5 Planning and organising monitoring
Training modules on SHAW performance monitoring 65
The SHAW programme is implemented at scale. This is particularly the case in West Timor (Plan Indonesia)
and Flores (YDD) where the programme is implemented across two entire districts. With an increasing
number of villages that are to be monitored on a regular basis and the same number of programme staff we
need to ‘think smart’. There is another reason to think smart. Sustaining 100% STBM villages in the long run
is only possible when village-level monitoring continues after the termination of the SHAW programme. It is
therefore essential that the capacities of the different local stakeholders are developed during the duration
of the SHAW programme as this will enhance the organisational capabilities and individual capacities of the
local stakeholders to plan, organise and implement STBM monitoring without the need for external
support.
The monitoring plans must therefore reflect that roles and responsibilities are to be handed over to the key
local stakeholders. This requires an extra effort from the SHAW partners as ‘doing it yourself’ is initially
easier than building capacities of others to carry out ‘our tasks’. Delegation of tasks starts with building the
necessary capacities. Delegating does not mean that we are not involved or responsible anymore. But it
requires that we adopt a different approach and that we assume different roles and responsibilities. Instead
of being in the lead it requires informing, guiding, supporting, coaching and so on depending on the
motivation and capacities of the actors that will take over our responsibilities.
Delegation of roles and responsibilities should be done on the basis of a simple but logical framework.
Considering that we are still in the middle of a capacity building process, we start with handing over the
relatively easy tasks. This will allow other actors to build their capacity and confidence. Delegation should
be done on the basis of a simple matrix which groups cadres, villages and Kecamatan STBM teams in three
distinct categories: 1) easy; 2) not so easy; and 3) difficult. Motivation and capacity are the main criteria for
the different categories. The matrix is shown below.
The above concept requires that the cadres and villages are ranked according to the three categories. This
can only be done after gaining sufficient experience working with the cadres and in the villages. It therefore
requires us to be actively involved during the first three months following triggering. This coincides with the
monthly OUTPUT monitoring cycle immediately following triggering. After the first three months we should
have gained sufficient insight to rank the cadres and villages in close consultation with the Kecamatan STBM
teams. The overview so generated would then be the departure point for dividing the different villages
between the SHAW partners and the Kecamatan STBM teams.

Planning and organising monitoring 1.5 Module
66 Training modules on SHAW performance monitoring
Although it will not be covered in this training module – as it has less relevance to the topic at hand:
planning and organising – there are likely to be also:
‘Easy’, ‘not so easy’ and ‘difficult’ dusun; and
‘Easy’, ‘not so easy’ and ‘difficult’ households.
Cadres and villages – as well as Kecamatan STBM teams – belonging to the different categories will require
different approaches or strategies where it concerns providing guidance and capacity building support. In
general terms work could be divided as follows:
Easy cadres and easy villages: hand over the responsibilities to the Kecamatan STBM team;
Not so easy cadres and villages: SHAW partners remain responsible; and
Difficult cadres and villages: this may require a different approach or strategy depending on how
bad the situation is.
The above is summarised in the following matrix.

Module 1.5 Planning and organising monitoring
Training modules on SHAW performance monitoring 67
We should ‘act wise’ and therefore we need to prioritise ‘easy’ and ‘not so easy’ villages in order to make
steady progress. After we have been successful in the ‘easy’ villages and ‘not so easy’ villages, resources will
become available to focus on the ‘difficult’ villages. An added advantage is that by that time our capacity
and confidence – as well as that of the Kecamatan STBM teams - has grown to an extent that we should be
able to deal with more demanding or more challenging situations.
Delegating monitoring (as well as post-triggering follow up) tasks to motivated and (potentially) capable
Kecamatan STBM teams is the most efficient and effective way to make optimal use of the limited
resources. By following the above logic, it is possible to match the right people with the right job. This can
be concluded as follows:
Kecamatan STBM teams, with relatively less experience and or less capacity than the SHAW
partners, should take responsibility for the ‘easy’ villages.
SHAW partners, with relatively more experience and capacity than the Kecamatan STBM teams,
should be responsible for the ‘not so easy’ villages.
Monitoring frequencies
Monitoring should be conducted at intervals sufficiently frequent for the purposes for which monitoring is
intended (see Module 1.1 for the different objectives). For example, monitoring carried out to review
progress, to identify problems and to make adjustments during programme implementation has to be done
at regular and frequent intervals to allow for timely adjustments to plans and approaches. Monitoring
carried out to assess whether changes are being sustained – after the programme targets have been
achieved – can be done at less demanding intervals.
The monitoring frequencies set up for the SHAW programme follow the same logic:
Baseline surveys5 are conducted only once prior to triggering to assess the conditions in the village
before programme interventions commence.
5 A baseline survey gathers key information that reflects the situation before you do anything. It is very difficult to
measure the impact of your project or programme if you do not know what the situation was when you began it. The baseline survey is the first time in the monitoring cycle that data is collected. Data is collected using the same tools as used in regular performance monitoring exercises to systematically assess the circumstances and conditions at the start of the project or programme.

Planning and organising monitoring 1.5 Module
68 Training modules on SHAW performance monitoring
Immediate post-triggering monitoring: monitoring frequencies are highest immediately following
triggering (demand creation) to be able to assess the mood in the village. Are village leaders
committed and villagers motivated to take action and work towards 100% STBM status?
Regular progress monitoring: after the first three months following triggering, monitoring
frequencies are reduced to once every three months. Are villages steadily moving towards 100%
STBM status?
Post-STBM declaration monitoring: after STBM declaration, monitoring frequencies are reduced
even more to once every six months in line with the bi-annual SHAW reporting frequencies. Are
villages maintaining or sustaining their 100% STBM status?
The monitoring frequencies were discussed and agreed upon in November 2012. The following table
provides an overview of the monitoring frequencies.
The above monitoring frequencies are presented in a schematic fashion attached to this training module.

Module 1.5 Planning and organising monitoring
Training modules on SHAW performance monitoring 69
Overview of SHAW monitoring frequencies
JAN
FEB
MA
RA
PR
MA
YJU
NJU
LA
UG
SEP
O
CT
NO
VD
EC
Trig
geri
ng
De
clar
atio
n
OU
TPU
TO
UTP
UT
OU
TPU
TO
UTP
UT
OU
TPU
T
OU
TCO
ME
OU
TCO
ME
OU
TCO
ME
OU
TCO
ME
Trig
geri
ng
OU
TPU
TO
UTP
UT
OU
TPU
TO
UTP
UT
OU
TPU
TO
UTP
UT
OU
TCO
ME
OU
TCO
ME
OU
TCO
ME
Trig
geri
ng
OU
TPU
TO
UTP
UT
OU
TPU
TO
UTP
UT
OU
TCO
ME
OU
TCO
ME
OU
TPU
TO
UTP
UT
OU
TPU
TO
UTP
UT
OU
TCO
ME
OU
TCO
ME
OU
TCO
ME
OU
TCO
ME
Dat
afile
s to
be
sub
mit
ted
by
30 A
pri
l30
Ju
ly30
Oct
ob
er
30 J
anu
ary
Re
gula
r 3
mo
nth
ly
mo
nit
ori
ng
De
sa #
1
De
sa #
2
De
sa #
3

70 Training modules on SHAW performance monitoring
Module 1.6: Data collection techniques
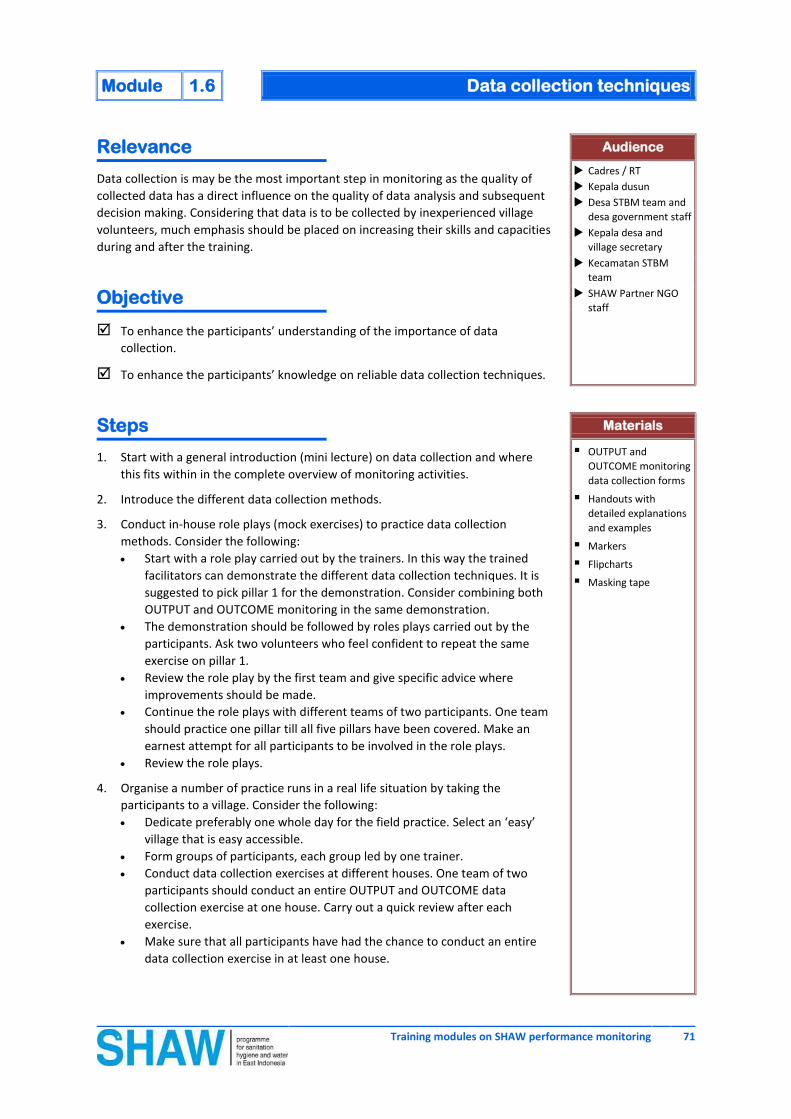
Module 1.6 Data collection techniques
Training modules on SHAW performance monitoring 71
Relevance Audience
Data collection is may be the most important step in monitoring as the quality of
collected data has a direct influence on the quality of data analysis and subsequent
decision making. Considering that data is to be collected by inexperienced village
volunteers, much emphasis should be placed on increasing their skills and capacities
during and after the training.
Cadres / RT
Kepala dusun
Desa STBM team and
desa government staff
Kepala desa and
village secretary
Kecamatan STBM
team
SHAW Partner NGO
staff
Objective
To enhance the participants’ understanding of the importance of data
collection.
To enhance the participants’ knowledge on reliable data collection techniques.
Steps Materials
1. Start with a general introduction (mini lecture) on data collection and where
this fits within in the complete overview of monitoring activities.
2. Introduce the different data collection methods.
3. Conduct in-house role plays (mock exercises) to practice data collection
methods. Consider the following:
Start with a role play carried out by the trainers. In this way the trained
facilitators can demonstrate the different data collection techniques. It is
suggested to pick pillar 1 for the demonstration. Consider combining both
OUTPUT and OUTCOME monitoring in the same demonstration.
The demonstration should be followed by roles plays carried out by the
participants. Ask two volunteers who feel confident to repeat the same
exercise on pillar 1.
Review the role play by the first team and give specific advice where
improvements should be made.
Continue the role plays with different teams of two participants. One team
should practice one pillar till all five pillars have been covered. Make an
earnest attempt for all participants to be involved in the role plays.
Review the role plays.
4. Organise a number of practice runs in a real life situation by taking the
participants to a village. Consider the following:
Dedicate preferably one whole day for the field practice. Select an ‘easy’
village that is easy accessible.
Form groups of participants, each group led by one trainer.
Conduct data collection exercises at different houses. One team of two
participants should conduct an entire OUTPUT and OUTCOME data
collection exercise at one house. Carry out a quick review after each
exercise.
Make sure that all participants have had the chance to conduct an entire
data collection exercise in at least one house.
OUTPUT and
OUTCOME monitoring
data collection forms
Handouts with
detailed explanations
and examples
Markers
Flipcharts
Masking tape

Data collection techniques 1.6 Module
72 Training modules on SHAW performance monitoring
5. Review or evaluate the field practice at the training venue. Assess the
performance of the participants and create a preliminary list of ‘easy’, ‘not so
easy’ and ‘difficult’ cadres.
6. Wrap up this session by emphasising what went well and what requires further
attention in future and by summarising the key messages of this session
Key messages
1. Data collection is possibly the most important step in monitoring.
2. The quality of data collected has a direct impact upon the quality of analysis. Quality of data requires
that the data is collected in a reliable manner to ensure correctness, completeness, consistency, and
uniformity.
3. Data collection for the OUTPUT indicators is rather straightforward by using a combination of
structured interviews and direct observations.
4. Data collection for the OUTCOME indicators is more complex and requires that guided self-
assessments are facilitated. The levels are determined in a participatory way where decisions are made
in close consultation with the interviewees.
5. House level monitoring visits are used to promote the STBM pillars and where necessary re-trigger
individual families. Don’t overdo promotion: one visit - one pillar.
6. Checking and cross-checking of completed questionnaires for completeness and accuracy is essential
to ensure quality of data.
Tips and tricks Limit the time of the mini lectures and keep the amount of information in check. Don’t overdo it
otherwise the participants might get lost and lose interest!
Adjust the depth of the introduction and the explanations of the different concepts to the audience.
Actors at the Kecamatan level might be more interested to understand the in-depth explanation
provided in the background information section as it directly involves them.
Practise the different data collection methods both at the training venue and in villages. Learning by
doing is what it takes to become proficient. Role plays are important training techniques to develop
knowledge and understanding but skills or capacities and confidence are built while carrying out tasks
in real life settings.
Make sure that each individual participant is provided with an opportunity to be actively involved in
the different exercises.
Organise future support (on-the-job training, coaching, guidance, etc.) on the basis of a preliminary
ranking of the participants in the three categories: ‘easy cadres’, ‘not so easy cadres’, and ‘difficult
cadres’.

Module 1.6 Data collection techniques
Training modules on SHAW performance monitoring 73
Background information
What is data collection and why is it important?
After planning and organising the monitoring activities, data collection is the first activity that takes place
when conducting monitoring. The main sub-activities or steps in monitoring are shown in the figure below.
Data collection is the process of gathering (or obtaining) specific information about a phenomenon or an
activity. It is done in an established systematic fashion that enables one to measure progress and evaluate
results. While methods vary, the emphasis on ensuring accurate, honest and complete collection of
information remains the same.
Once collected, data can be stored in records or databases, analysed and used for purposes of monitoring
or evaluation. The quality of data collected has a direct impact upon the quality of analysis that can be
performed using the data, which ultimately impacts upon the quality of decisions that can be made. Poor
data is the basis for poor decision. Ensuring the quality of data requires that the data is collected in a
reliable manner to ensure correctness, consistency, completeness, and uniformity.
Both the selection of appropriate data collection tools and clear instructions for their correct use reduce the
likelihood of errors occurring. Consequences from improperly collected data include:
inability to provide a reliable and truthful insight in the status of the programme;
inability to repeat and validate the results of monitoring;
distorted findings resulting in wasted resources; and
incorrect findings that lead to compromising decisions.
While organising and conducting monitoring exercises, the following five principles should be observed:
Relevance: the collected data should be relevant to the expected results of the activity or
programme.
Simplicity: the collected data should be simple in concept and easy to measure.
Accuracy: the collected data can accurately describe the activity or issue you are studying.
Clarity: the collected data should be clear, unambiguous, easy to interpret and easy to understand.
Practicability: the collected data can be easily accessed and reliably used.
These principles may be summarised simply as the following ‘5-right principles’:
Get the right data: collect data which are relevant to the specific topic or issue. For example, to
better understand if villages are moving towards 100% STBM status, one must collect data that
give insight on the STBM criteria of all five pillars.
Get the data right: collect data with precise definition and appropriate method of measurement.
For example, to obtain insight in the different types of hand washing facilities it is important that
everybody agrees on and uses the same definitions.
Get the data right away: get current and timely data. For example, baseline surveys should be
organised as close to the triggering as possible.

Data collection techniques 1.6 Module
74 Training modules on SHAW performance monitoring
Get the data the right way: get data through a rigorous process which can guarantee data quality
and ensure consistency. Instructions about methods and data standards must be explained clearly
and the people involved in data collection should be well trained.
Get the right data management: collect reliable data which is guaranteed by good quality control
conducted by relevant stakeholders. It is important to involve all the stakeholders at different
levels to check that the collected data are reliable and complete before they are processed,
analysed and used.
There is often a tendency to collect more data and in greater detail, but then failing to make full use of the
collected data. This should be avoided because the more data you require the less reliable data you will
actually get. Therefore ‘do not collect data that will not be used’ and remember:
Focus on data that you ‘need to know’ to be able to measure progress towards achieving the
programme’s targets and objectives.
Don’t worry about data that is ‘nice to know’ but which will not help you to stay on course.
Data collection methods
The choice of data collection method depends on a number of issues such as the accuracy required, the
total population, the basic sampling unit, and the skills of the enumerators. The main data collection
methods are:
Questionnaires: forms which are completed and returned by respondents. An inexpensive method
that is useful where literacy rates are high and respondents are co-operative.
Interviews: forms which are completed through an interview with the respondent. More time
consuming than questionnaires, but they are better for more complex questions, low literacy or
less co-operation.
Direct observations: making direct observations is the most accurate method for many indicators
but is time consuming.
Reporting: the main alternative to making direct observations is to require village authorities to
report their activities. Reporting requires high levels of literacy and co-operation, but can be
backed up by a legal requirements and direct measurements.
The process of data collection must be systematic and based on well-defined procedures that are
appropriate to the context within which the data are being collected. Questionnaire-based data collection
methods are the most commonly used to collect information in WASH programmes.
In the SHAW programme the (physical) ‘house’ has been selected as the basic sampling unit6 when
collecting data in the villages. At the house level data is collected principally by using a combination of
interviews and direct observations. However the exact methodology used differs when collecting data on
OUTPUT and OUTCOME indicators.
Data collection techniques for OUTPUT monitoring
Data collection on the OUTPUT indicators is rather straightforward. As OUTPUT indicators measure the
increased access to facilities, it is basically a matter of counting the different sanitation and hygiene
facilities. More complex matters such as measuring the quality and use of the facilities are covered by the
OUTCOME indicators.
6 A basic sampling unit in monitoring refers to one member of a set of entities being monitored. Common examples of
a sampling unit would be a single person, a family, a household, a house, a school, etc. that belongs to a larger collection of such entities being monitored.
Module 1.6 Data collection techniques
Training modules on SHAW performance monitoring 75
The following paragraphs provide an insight in how the different data collection methods are to be used.
Structured interviews
In interviews information is obtained through inquiry and the information is then recorded by enumerators.
Structured interviews are performed by using survey forms or questionnaires, whereas open interviews are
notes taken while talking with respondents. To ensure consistency only structured interviews are used.
The OUTPUT monitoring related structured interviews are conducted with a well-designed form. The data
collection forms are filled in by the enumerators (interviewers), instead of by the respondents
(interviewees). Although this approach is more time consuming, more complicated questions can be asked
and data can be validated as it is collected, thereby improving data quality. The OUTPUT questionnaire
includes only closed-ended questions7. There are basically only two options for answering the questions:
1) Choose between ‘yes’ or ‘no’; for example to answer the question: do you have a latrine? Any
other option then ‘yes’ or ‘no’ is not possible here.
2) Select one answer from a list of options; for example to answer the question: what is the type of
latrine and how many are there? The questionnaire provides a limited but core list of options that
are most likely to provide the correct answer. An additional category of ‘others’ is included in case
the actual situation cannot be captured by the core answers. The interviewer selects the right
option on the basis of structured questioning and direct observations and then puts the correct
figure (1 for one latrine; 2 for two latrines; and so on) in the row matching the correct answer.
The structured interviews are undertaken in person at the house with one or more persons (interviewees)
with the ability to represent the house. Interviewees should meet the following criteria:
Live permanently in the house; being a full member of the household living in the house;
Be at least 18 years of age; and
Be preferably the head of the household or another person with decision-making power.
Direct observations
The interviewers should make direct observations when visiting the houses. In practice, the interviewers
combine the conducting of structured interviews with direct observations. This is to be done so that the
information gathered during the interviews are immediately verified and validated.
Specific examples
Output indicator 1: after questioning the interviewee whether they have a toilet, the interviewer then asks
whether it is acceptable for him or her to visit the toilet. The visit to and observation of the toilet is first of
all necessary to verify that the interviewee is giving reliable information but it is also necessary to assess the
type of the toilet.
Output indicators 2 and 3: same as for indicator 1.
Output indicator 4: this is basically a matter of observing the conditions (in and) around the house to check
if there is any unmanaged solid waste.
Output indicator 5: same as for indicator 4.
Important considerations:
Provide concise general instructions in the beginning about how the questionnaires are to be
completed.
Additional detailed instructions and explanations should be provided and used when collection
OUTPUT data as this will avoid ambiguities and difficulties in the questions and therefore enhance
the likelihood that reliable and consistent data is collected (see Module 1.3).
7 A closed-ended question is a question that limits respondents with a list of answer choices from which they select one
answer. Commonly these types of questions are in the form of multiple choices.

Data collection techniques 1.6 Module
76 Training modules on SHAW performance monitoring
The interviewers should be advised to take time to read the general instructions and detailed
explanations before starting data collection.
Actual conditions on the ground (in and around the house) must be recorded in the data collection
form. Work in progress or good intentions – although important in the long term – are not to be
considered at the time of monitoring.
All questions must be answered and recorded in the questionnaire to avoid incomplete or missing
data, as this would otherwise result in incomplete reporting on data.
Interviewers should not just go to a house, make their own individual observations and then move
on to the next house. The main principle of community-based monitoring is that it has to be
participatory. The interaction with the people living in the house is crucial for two reasons:
The advantage of participatory monitoring is that the interviewees get a chance to realise their
own situation and conditions. Realization is often the first trigger to consider changes.
Data collection creates ideal moments to retrigger, motivate and or encourage the people
living in the house to take action or continue to make changes and improvements.
Some parts of the questionnaire may change from time to time. It is important to indicate what
has changed and to explain the changes.
Data collection techniques for OUTCOME monitoring
Data collection on the OUTCOME indicators is less straightforward. As OUTCOME indicators measure the
increased quality of the facilities and the degree in changes in sanitation hygiene behaviour and or
practices, it is not just a matter of counting different facilities.
For OUTCOME monitoring the QIS system explained in module 1.4 is used. The QIS scales allow the
measurement of purely qualitative aspects such as quality of facilities and changes in behaviour in a
quantified and comparable manner.
The complexity of applying the OUTCOME indicators is caused by the following facts:
The QIS system is a completely new methodology for all stakeholders involved in monitoring;
The data has to be collected in a highly participatory manner; and
The collected data is very much based on personal opinion and therefore potentially subject to
errors and bias. For example the term ‘clean’ is subjective, as different people may have different
perceptions of what is meant by ‘clean’. What ‘clean’ is to one interviewer might be ‘dirty’ to
another interviewer.
The following paragraphs provide an insight in how the different data collection methods are to be used.
Similarly to what was explained above in relation to OUTPUT data collection, OUTCOME data is collected
through a combination of structured interviews and direct observations. There are however a couple of
essential differences, namely:
The multiple-choice answers to the closed-ended questions are given in a scale format with four
options (levels 0, 1, 2 and 3). Interviewers and interviewees should decide to rate the situation in
line with the scenarios described in the different levels.
The questionnaire should ideally be completed through a guided self-assessment carried out by
the interviewees under the guidance and with the support of the interviewer. This implies that the
interviewer takes time to explain the different scales to the interviewees and then together come
to a decision. Some of the reasons why we should encourage guided self-assessments are:
A self-assessment is a participatory process of collecting and analysing data in which people
are put in a position to identify and solve problems or short-comings together. This creates the
important sense of self-realisation of current circumstances and conditions, and awareness
that change may be necessary.

Module 1.6 Data collection techniques
Training modules on SHAW performance monitoring 77
A self-assessment emphasises opportunities for improvement; it is not meant to be a ‘blame
game’.
It is the best way to ensure ‘buy-in’ and to create ‘ownership’ for the subsequent actions that
may need to take place.
It provides an opportunity for the interviewer to address specific sanitation and hygiene
related issues on which the family did not score well.
Specific example
Outcome indicator 1.1: after questioning the interviewee whether they have a latrine, the interviewer
should then ask the interviewee whether it is okay to observe the latrine. The interviewer should invite the
interviewee to accompany him or her to the latrine. With the help of the detailed explanations and
examples provided in Module 1.3, the interviewer asks the interviewee to select the picture that best
reflects their latrine. The interviewer together with the interviewee verifies and validates the final choice
and then relates the picture back to the specific level.
If a level less then level 3 has been reached, then the interviewer takes the opportunity to explain what
additional work is required to achieve the desired level 3. This can best be done by explaining in detail the
conditions (criteria) that must be met to reach the highest level.
The above example should be followed during regular progress monitoring after triggering has taken place.
During the baseline survey the data should be collected similarly to what is described for OUTPUT
monitoring: structured interviews combined with direct observations led by the interviewer. At this stage it
does not make sense to conduct guided self-assessments as the villagers are not aware of the STBM criteria.
Source: http://www.righttoplay.com/switzerland/our-impact/Pages/Methodik.aspx
Data verification
Data verification is the process of cross-checking the completed questionnaires for completeness and
accuracy. Data verification is an important step in ensuring the data collected is of high quality.
It is not uncommon for the interviewers to make errors or omissions while completing the questionnaire.
Some of the errors can be detected directly by the individual interviewers and corrected by them. Other
errors and omissions can be identified when tabulating the data at RT, dusun or desa level. In such
instances, the persons responsible for data tabulation should contact the interviewer to clarify and rectify
these errors.
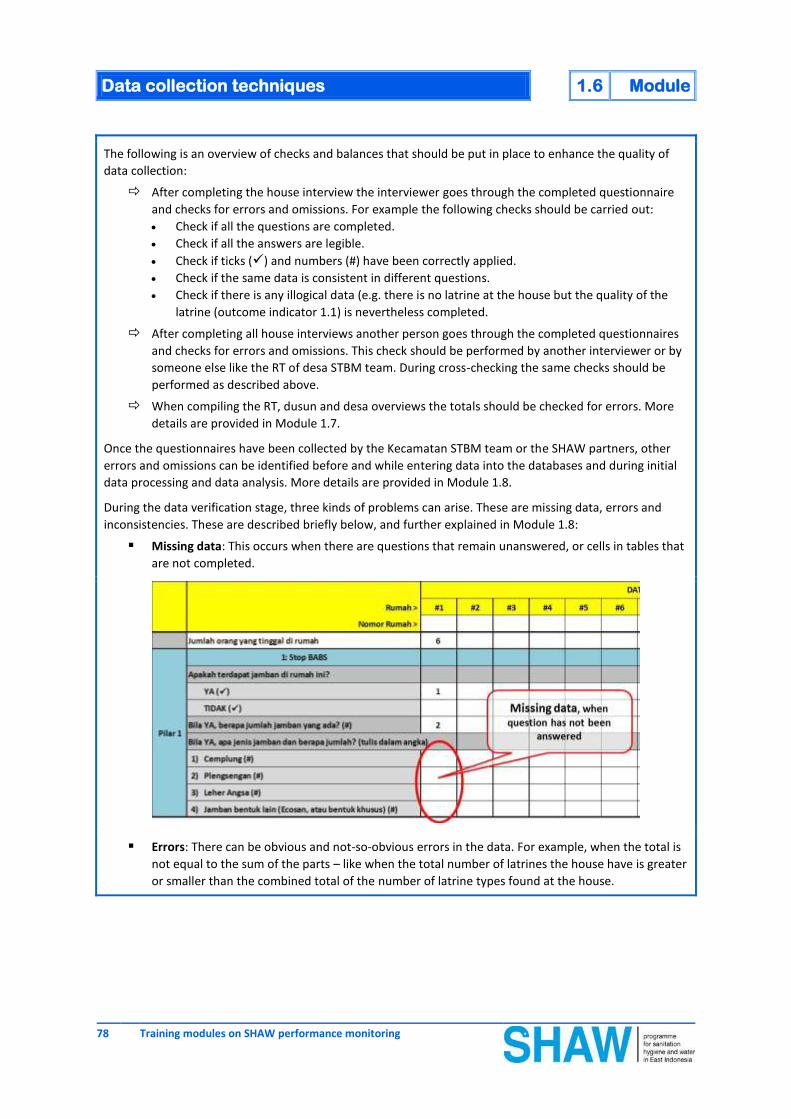
Data collection techniques 1.6 Module
78 Training modules on SHAW performance monitoring
The following is an overview of checks and balances that should be put in place to enhance the quality of
data collection:
After completing the house interview the interviewer goes through the completed questionnaire
and checks for errors and omissions. For example the following checks should be carried out:
Check if all the questions are completed.
Check if all the answers are legible.
Check if ticks () and numbers (#) have been correctly applied.
Check if the same data is consistent in different questions.
Check if there is any illogical data (e.g. there is no latrine at the house but the quality of the
latrine (outcome indicator 1.1) is nevertheless completed.
After completing all house interviews another person goes through the completed questionnaires
and checks for errors and omissions. This check should be performed by another interviewer or by
someone else like the RT of desa STBM team. During cross-checking the same checks should be
performed as described above.
When compiling the RT, dusun and desa overviews the totals should be checked for errors. More
details are provided in Module 1.7.
Once the questionnaires have been collected by the Kecamatan STBM team or the SHAW partners, other
errors and omissions can be identified before and while entering data into the databases and during initial
data processing and data analysis. More details are provided in Module 1.8.
During the data verification stage, three kinds of problems can arise. These are missing data, errors and
inconsistencies. These are described briefly below, and further explained in Module 1.8:
Missing data: This occurs when there are questions that remain unanswered, or cells in tables that
are not completed.
Errors: There can be obvious and not-so-obvious errors in the data. For example, when the total is
not equal to the sum of the parts – like when the total number of latrines the house have is greater
or smaller than the combined total of the number of latrine types found at the house.
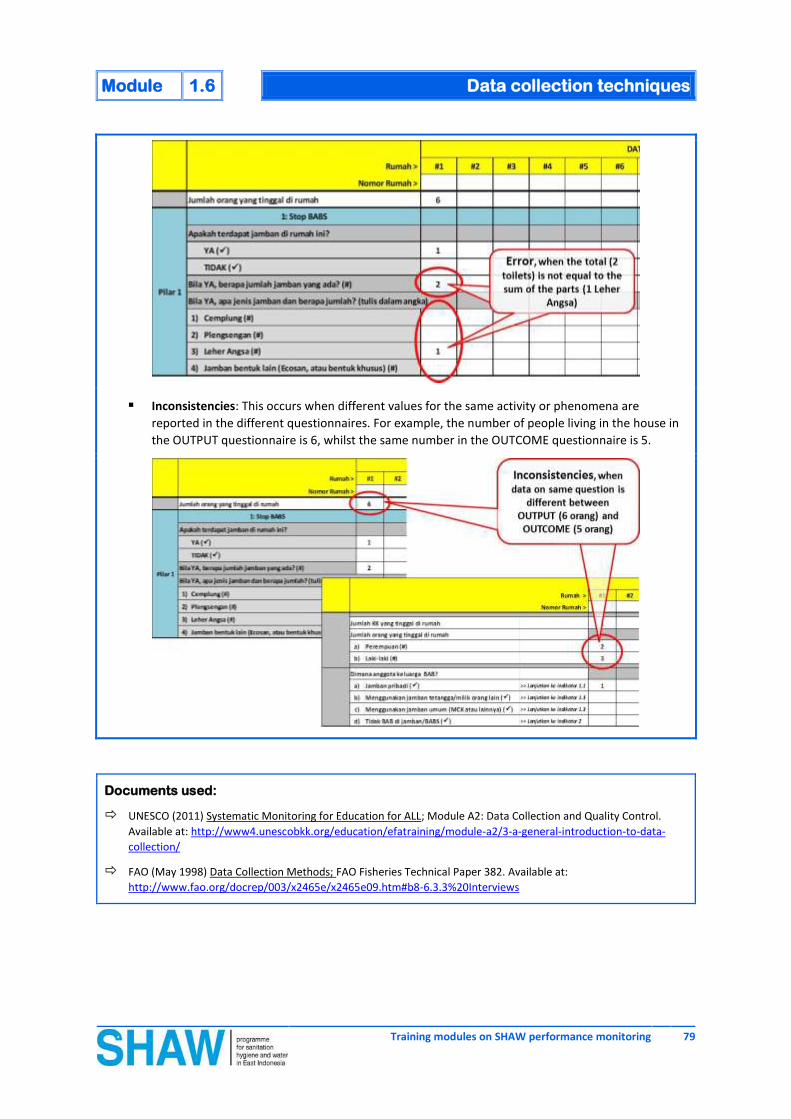
Module 1.6 Data collection techniques
Training modules on SHAW performance monitoring 79
Inconsistencies: This occurs when different values for the same activity or phenomena are
reported in the different questionnaires. For example, the number of people living in the house in
the OUTPUT questionnaire is 6, whilst the same number in the OUTCOME questionnaire is 5.
Documents used:
UNESCO (2011) Systematic Monitoring for Education for ALL; Module A2: Data Collection and Quality Control.
Available at: http://www4.unescobkk.org/education/efatraining/module-a2/3-a-general-introduction-to-data-
collection/
FAO (May 1998) Data Collection Methods; FAO Fisheries Technical Paper 382. Available at:
http://www.fao.org/docrep/003/x2465e/x2465e09.htm#b8-6.3.3%20Interviews
80 Training modules on SHAW performance monitoring
Module 1.7: Village level data recapitulation

Module 1.7 Village level data recapitulation
Training modules on SHAW performance monitoring 81
Relevance Audience
Data collection is may be the most important step in monitoring as the quality of
collected data has a direct influence on the quality of data analysis and subsequent
decision making.
Data recapitulation is an integral part of data collection. It allows for data checking
and verification at the level where data is collected by those responsible for data
collection and data reporting. It is an essential step to ensure that reliable
monitoring results are used for analysis.
Cadres / RT
Kepala dusun
Desa STBM team and
desa government staff
Kepala desa and
village secretary
Kecamatan STBM
team
SHAW Partner NGO
staff
Objective
To develop the skills and capacities of the participant’s to generate complete
and reliable data overviews at RT, dusun and desa level.
Steps Materials
1. Start with a general introduction (mini lecture) on data recapitulation and
where this fits within in the complete overview of monitoring activities.
2. Explain how data checking and verification is linked to data recapitulation at
RT, dusun and desa levels and introduce the different data recapitulation
forms.
3. Divide the participants into several groups. Each group should have one trainer.
Consider the following:
First of all explain the steps provided in the background information
section.
Facilitate the process of data checking and verification followed by data
recapitulation by providing space and opportunity for the participants to
actually carry out the different steps. Divide the tasks among the
participants so that every participant gets an opportunity to be in the lead
for one of the process steps.
Use the data collection forms completed during the field practice.
Complete the whole process at the three different levels.
4. Come back together. Each group presents the results to the full group.
OUTPUT and
OUTCOME data
recapitulation forms
Markers
Flipcharts
Masking tape

Village level data recapitulation 1.7 Module
82 Training modules on SHAW performance monitoring
Key messages
1. The SHAW/STBM monitoring system is a community-owned results-based monitoring system which
puts communities and their leaders in the driving seat. This implies that initial data checking and the
compilation of overviews with monitoring results is carried out in the villages by the responsible
individuals.
2. Data recapitulation is the summing up or compilation of monitoring results to be able:
To check and verify the results of data collection for missing data, errors and inconsistencies;
To analyse the monitoring results at RT, dusun and desa level; and
To process the results in a computerised database (data entry).
3. Data recapitulation, including the checking and verifying of collected data, is carried out by the
responsible individuals at three levels: RT, dusun and desa level.
4. All data collection and data recapitulation forms should have a ‘check totals column’ to make the
process of checking easier.
Tips and tricks Limit the time of the mini lectures and keep the amount of information in check. Don’t overdo it
otherwise the participants might get lost and lose interest!
Practise data recapitulation on the basis of the data collected during the field practice. Learning by
doing is what it takes to become proficient.
Make sure that each individual participant is provided with an opportunity to be actively involved in
the exercise.
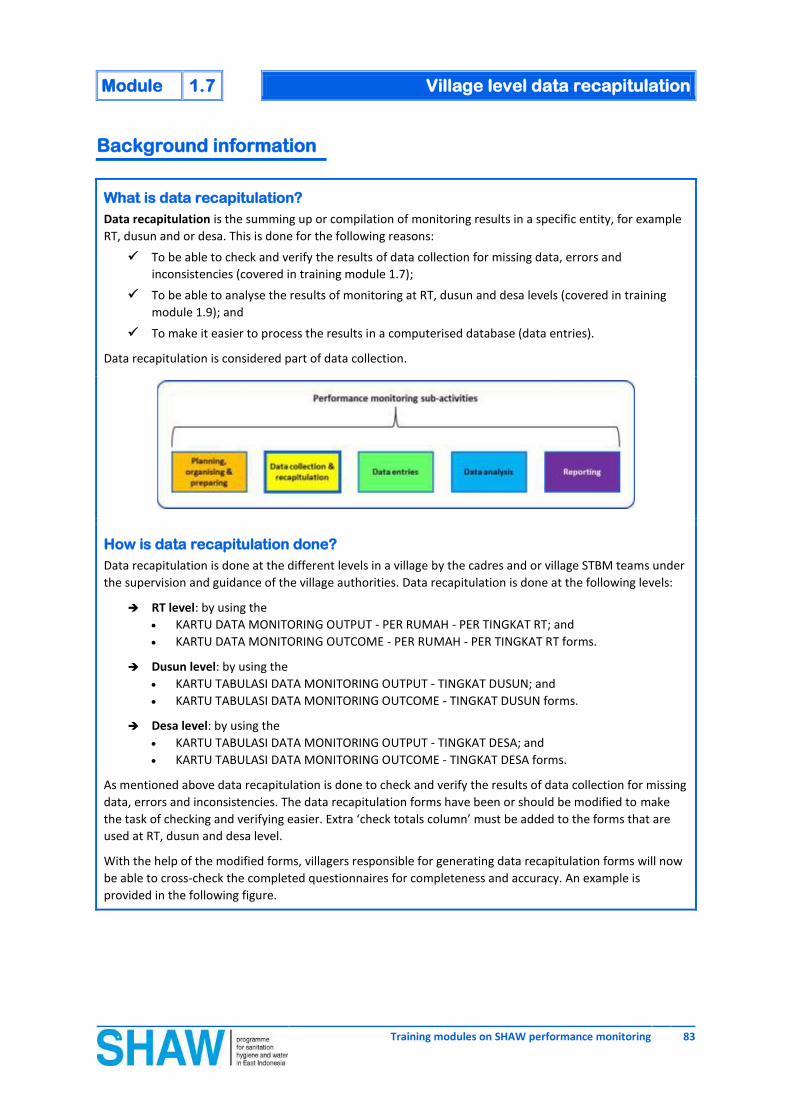
Module 1.7 Village level data recapitulation
Training modules on SHAW performance monitoring 83
Background information
What is data recapitulation?
Data recapitulation is the summing up or compilation of monitoring results in a specific entity, for example
RT, dusun and or desa. This is done for the following reasons:
To be able to check and verify the results of data collection for missing data, errors and
inconsistencies (covered in training module 1.7);
To be able to analyse the results of monitoring at RT, dusun and desa levels (covered in training
module 1.9); and
To make it easier to process the results in a computerised database (data entries).
Data recapitulation is considered part of data collection.
How is data recapitulation done?
Data recapitulation is done at the different levels in a village by the cadres and or village STBM teams under
the supervision and guidance of the village authorities. Data recapitulation is done at the following levels:
RT level: by using the
KARTU DATA MONITORING OUTPUT - PER RUMAH - PER TINGKAT RT; and
KARTU DATA MONITORING OUTCOME - PER RUMAH - PER TINGKAT RT forms.
Dusun level: by using the
KARTU TABULASI DATA MONITORING OUTPUT - TINGKAT DUSUN; and
KARTU TABULASI DATA MONITORING OUTCOME - TINGKAT DUSUN forms.
Desa level: by using the
KARTU TABULASI DATA MONITORING OUTPUT - TINGKAT DESA; and
KARTU TABULASI DATA MONITORING OUTCOME - TINGKAT DESA forms.
As mentioned above data recapitulation is done to check and verify the results of data collection for missing
data, errors and inconsistencies. The data recapitulation forms have been or should be modified to make
the task of checking and verifying easier. Extra ‘check totals column’ must be added to the forms that are
used at RT, dusun and desa level.
With the help of the modified forms, villagers responsible for generating data recapitulation forms will now
be able to cross-check the completed questionnaires for completeness and accuracy. An example is
provided in the following figure.
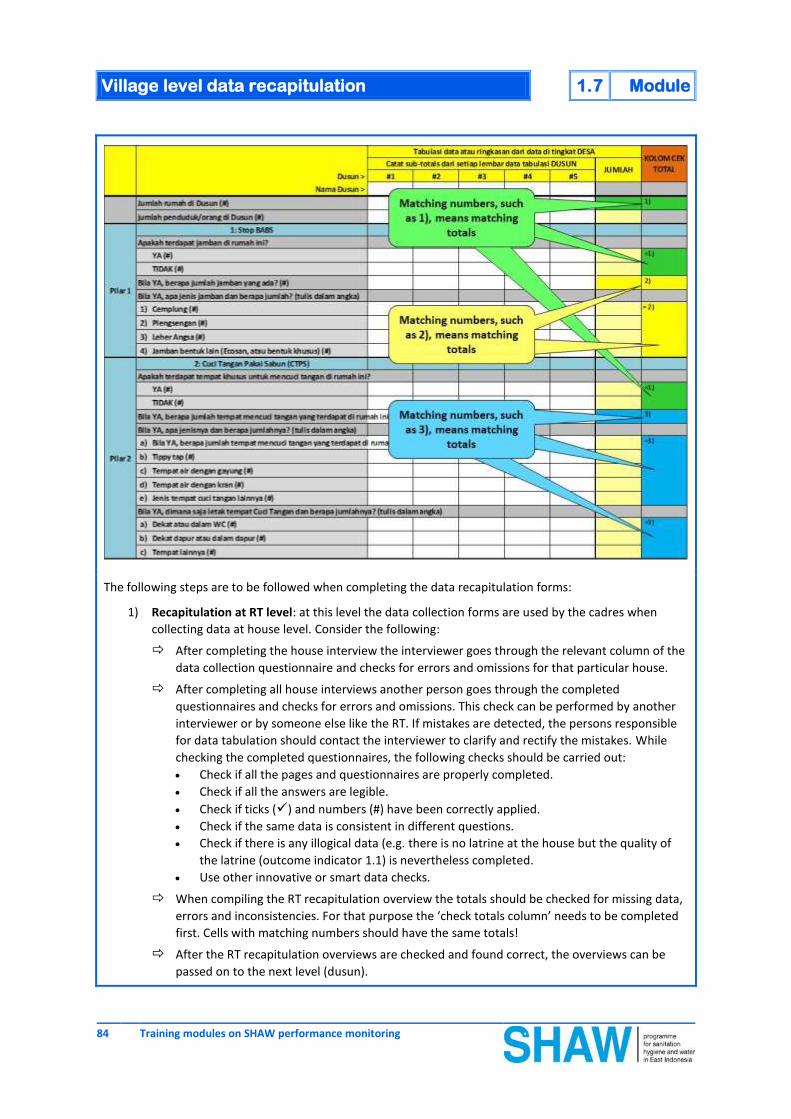
Village level data recapitulation 1.7 Module
84 Training modules on SHAW performance monitoring
The following steps are to be followed when completing the data recapitulation forms:
1) Recapitulation at RT level: at this level the data collection forms are used by the cadres when
collecting data at house level. Consider the following:
After completing the house interview the interviewer goes through the relevant column of the
data collection questionnaire and checks for errors and omissions for that particular house.
After completing all house interviews another person goes through the completed
questionnaires and checks for errors and omissions. This check can be performed by another
interviewer or by someone else like the RT. If mistakes are detected, the persons responsible
for data tabulation should contact the interviewer to clarify and rectify the mistakes. While
checking the completed questionnaires, the following checks should be carried out:
Check if all the pages and questionnaires are properly completed.
Check if all the answers are legible.
Check if ticks () and numbers (#) have been correctly applied.
Check if the same data is consistent in different questions.
Check if there is any illogical data (e.g. there is no latrine at the house but the quality of
the latrine (outcome indicator 1.1) is nevertheless completed.
Use other innovative or smart data checks.
When compiling the RT recapitulation overview the totals should be checked for missing data,
errors and inconsistencies. For that purpose the ‘check totals column’ needs to be completed
first. Cells with matching numbers should have the same totals!
After the RT recapitulation overviews are checked and found correct, the overviews can be
passed on to the next level (dusun).

Module 1.7 Village level data recapitulation
Training modules on SHAW performance monitoring 85
2) Recapitulation at dusun level: at this level the RT overviews are compiled in dusun overviews.
Consider the following:
First of all the RT overviews are checked to ensure that the totals are correct. If mistakes are
detected, the persons responsible for data tabulation should contact the responsible persons
at RT level to clarify and rectifiy the mistakes.
Thereafter the totals of the individual RT overviews are transferred to the dusun recapitulation
overview.
After the dusun recapitulation overviews have been generated, the totals should be checked
for missing data, errors and inconsistencies. For that purpose the ‘check totals column’ needs
to be completed first. Cells with matching numbers should have the same totals!
After the dusun recapitulation overviews are checked and found correct, the overview can be
passed on to the next level (desa).
3) Recapitulation at desa level: at this level the dusun overviews are summed up in a desa
recapitulation overview. This requires carying out the same steps as done at dusun level.
The above steps are identical for OUTPUT as well as for OUTCOME monitoring.

86 Training modules on SHAW performance monitoring
Module 1.8: Quality control
Module 1.8 Quality control
Training modules on SHAW performance monitoring 87
Relevance Audience
As the quality of collected data has a direct influence on the quality of data analysis
and subsequent decision making, quality control on data collection is extremely
important.
Data quality checks and controls should be done as close to the data source as
possible. Checking and verifying of collected data by village level actors and
authorities has been addressed in training module 1.7. This training module
although providing a complete overview focuses primarily on the quality control
aspects that are the responsibility of SHAW partners and Kecamatan STBM teams.
Kecamatan STBM
team
SHAW Partner NGO
staff
Objective
To enhance the participants’ understanding and knowledge on data quality
control concepts and measures.
To develop the skills and capacities of the participants’ to carry out data quality
control activities.
Steps Materials
1. Start with a general introduction (mini lecture) on quality control and where
this fits within in the complete overview of monitoring activities.
2. Introduce and explain the different data quality control measures.
3. Divide the participants into several groups. Each group should have one trainer.
Consider the following:
Focus on the data quality control measures undertaken by the SHAW
partners and Kecamatan STBM teams in the villages.
First of all explain the steps provided in the background information
section.
Determine realistic sample sizes.
Conduct a number of role play sessions to practise the role of the SHAW
partners and Kecamatan STBM teams in carrying out quality control tasks
in the village and simultaneously building the capacity of the cadres
responsible for data collection.
Divide the tasks among the participants so that every participant gets an
opportunity to be in the lead for one of their specific tasks.
Use the data collection forms completed during the field practice.
4. Instruct the groups to determine a limited number of key hygiene promotion
messages for the different STBM pillars. Different groups should work on the
different STBM pillars.
5. Come back together and review and finalise the key hygiene promotion
messages.
OUTPUT and
OUTCOME data
recapitulation forms
Markers
Flipcharts
Masking tape
Quality control 1.8 Module
88 Training modules on SHAW performance monitoring
Key messages
1. Quality control (QC) is a procedure or set of procedures for verifying and maintaining a desired level of
quality of data.
2. To ensure data quality, data control measures must be applied at every stage of the data collection
process.
3. Additional data quality controls should be applied when entering the data into computerised
databases, during data analysis, interpretation and use.
4. Follow up visits to villages should be used to build the capacity of the village cadres to collect reliable
data and to be able to provide adequate and tailor-made post-triggering follow up.
5. Limit the number of key hygiene promotion messages per visit by focusing on one STBM pillar. Follow
the sequence of the STBM pillars starting with pillar 1 and concluding with pillar 5.
Tips and tricks Limit the time of the mini lectures and keep the amount of information in check. Don’t overdo it
otherwise the participants might get lost and lose interest!
Practise the different data quality control measures on the basis of the data collected during the field
practice. Learning by doing is what it takes to become proficient.
Make sure that each individual participant is provided with an opportunity to be actively involved in
the exercise.
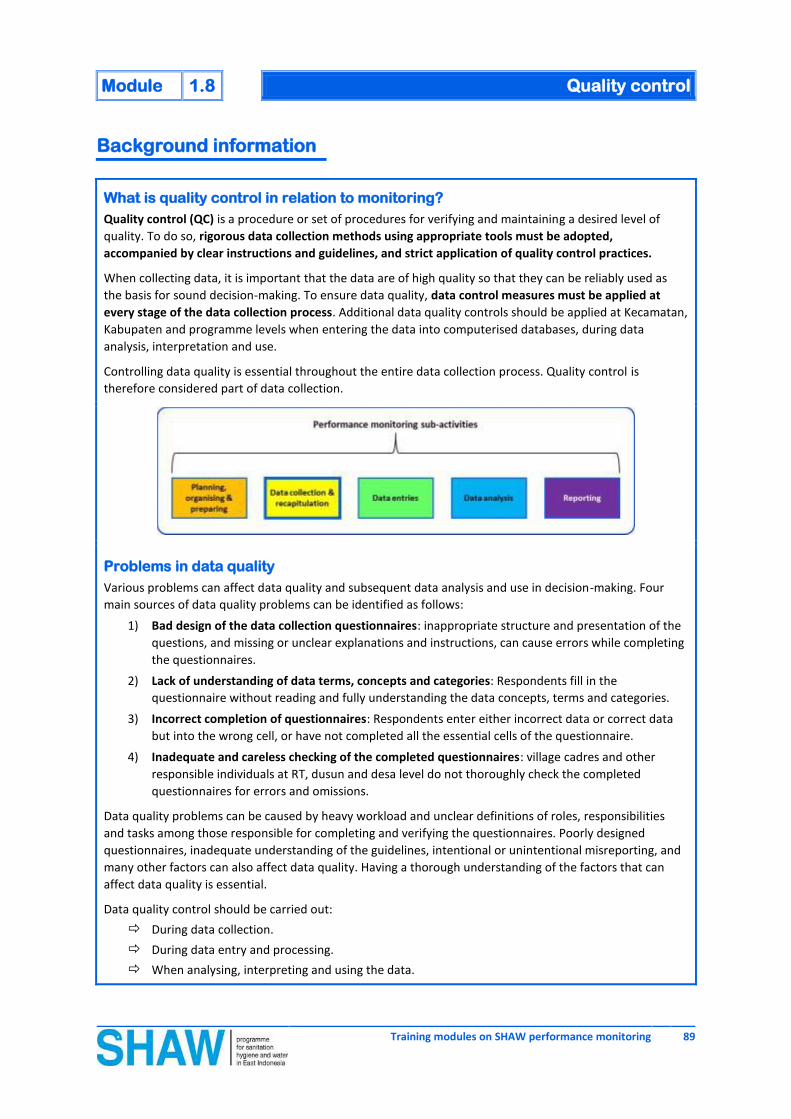
Module 1.8 Quality control
Training modules on SHAW performance monitoring 89
Background information
What is quality control in relation to monitoring?
Quality control (QC) is a procedure or set of procedures for verifying and maintaining a desired level of
quality. To do so, rigorous data collection methods using appropriate tools must be adopted,
accompanied by clear instructions and guidelines, and strict application of quality control practices.
When collecting data, it is important that the data are of high quality so that they can be reliably used as
the basis for sound decision-making. To ensure data quality, data control measures must be applied at
every stage of the data collection process. Additional data quality controls should be applied at Kecamatan,
Kabupaten and programme levels when entering the data into computerised databases, during data
analysis, interpretation and use.
Controlling data quality is essential throughout the entire data collection process. Quality control is
therefore considered part of data collection.
Problems in data quality
Various problems can affect data quality and subsequent data analysis and use in decision-making. Four
main sources of data quality problems can be identified as follows:
1) Bad design of the data collection questionnaires: inappropriate structure and presentation of the
questions, and missing or unclear explanations and instructions, can cause errors while completing
the questionnaires.
2) Lack of understanding of data terms, concepts and categories: Respondents fill in the
questionnaire without reading and fully understanding the data concepts, terms and categories.
3) Incorrect completion of questionnaires: Respondents enter either incorrect data or correct data
but into the wrong cell, or have not completed all the essential cells of the questionnaire.
4) Inadequate and careless checking of the completed questionnaires: village cadres and other
responsible individuals at RT, dusun and desa level do not thoroughly check the completed
questionnaires for errors and omissions.
Data quality problems can be caused by heavy workload and unclear definitions of roles, responsibilities
and tasks among those responsible for completing and verifying the questionnaires. Poorly designed
questionnaires, inadequate understanding of the guidelines, intentional or unintentional misreporting, and
many other factors can also affect data quality. Having a thorough understanding of the factors that can
affect data quality is essential.
Data quality control should be carried out:
During data collection.
During data entry and processing.
When analysing, interpreting and using the data.

Quality control 1.8 Module
90 Training modules on SHAW performance monitoring
The following section introduces some general methods and practical tips for carrying out data quality
control during different monitoring sub-activities.
Data quality control measures
Designing the data collection questionnaire
Data quality control mechanisms should be built into the design of the monitoring tools including
data collection questionnaires.
Data collection questionnaire should be designed with clear structure, presentation and
explanations.
Clear and concise instructions should be made available to all the stakeholders involved in
monitoring.
Completing the questionnaire during data collection
Adequate training must be organised so that the interviewers fully understand the data collection
questionnaires and the accompanying instructions.
Post-training follow up is necessary to enhance the knowledge and capacities of the interviewers
(cadres). The extent of on-the-job follow up (e.g. coaching, guiding, instructing, training, etc.)
depends on the skills and capacities of the individuals. Maintain frequent communication with
them to monitor progress while they carry out data collection tasks, and to offer help if and when
necessary.
Post-training follow up is the responsibility of the SHAW partners and the Kecamatan STBM
teams. Divide tasks on the basis of the categorisation of ‘easy’, ‘not so easy’ and ‘difficult’
cadres and villages as outlined in Module 1.5 ‘Planning and organising monitoring’.
It goes without saying that ‘not so easy’ cadres will require more attention and support than
‘easy’ cadres. Don’t spend too much time on ‘difficult’ cadres in the beginning.
Interviewers must carefully check and re-check the data for omissions and errors during and after
completing the questionnaires. The process of checking and verifying data is described in detail in
Module 1.7 ‘Village level data recapitulation’.
Data verification and quality control
Data quality checks and controls should be done as close to the data source as possible.
During data recapitulation at RT, dusun and desa level, responsible individuals should check for
data omissions, inconsistencies within and across OUTPUT and OUTCOME questionnaires, and
errors in calculations. The process of checking and verifying data at RT, dusun and desa level is
described in detail in Module 1.7 ‘Village level data recapitulation’.
SHAW partners and Kecamatan STBM teams should systematically check for omissions,
inconsistencies, and errors in calculations when visiting the villages and especially when collecting
the completed desa recapitulation forms.
Training in data quality control procedures should be provided to the Kecamatan STBM teams
to ensure that they can carry out the task of checking and controlling the quality of data.
Data quality control during data entry and processing Additional data quality controls should be applied during data entry and processing.
Automatic data verification checks have been incorporated in the computerised databases. When
entering data automatic data verification checks signal, with the use of different colour codes,
whether there are any data errors. For example, the system automatically indicates when
individual values do not match the correct totals.

Module 1.8 Quality control
Training modules on SHAW performance monitoring 91
With the introduction of the modified data collection and data recapitulation forms which now
includes a ‘check totals column’ and rigid quality control measures in the villages, the
likelihood of data errors is expected to be minimal to the maximum extent possible. This
should make it easier for individuals responsible for data entries to do a correct job.
Once data entries have been completed, key OUTPUT and OUTCOME data should be compared for
inconsistencies. OUTPUT and OUTCOME data is collected at the same time and by the same
individuals, there should therefore be no reason for inconsistencies or differences. Below a list is
given where inconsistencies were noted in the past:
Total number of houses in a village;
Total number of dusun and or villages in a Kecamatan;
Total number of houses with a latrine; and so on…
Data quality control during analysis and interpretation The processes of analysing and interpreting the information from the villages can help to highlight and
identify other data anomalies.
Calculation of indicators and comparing them among villages, Kecamatan and Kabupaten can
reveal unlikely or illogical results that can be traced back to data or calculation errors. In this way a
number of calculation errors in the databases were revealed in the past year.
Further data errors and inconsistencies can be detected while interpreting the analytical results to
draw conclusions. For example, the results of monitoring should match the results of STBM
verification and declaration.
Having other persons to review the analytical results may help to identify data anomalies that were
not obvious during the initial analysis.
When disseminating monitoring results, encourage the users to query the information.
How to build the capacity of village cadres responsible for data collection?
Training the village cadres to be able to carry out monitoring independently is the first step in the process of
capacity building. Remember, although formal training is necessary, most of the learning and capacity
building actually happens on-the-job. Hence, it would be unwise to expect all the village cadres to be able to
conduct proper monitoring after one short training. It is the responsibility of the SHAW partners and the
Kecamatan STBM teams to continue the process of capacity building. Consider the following:
Baseline survey: the training on monitoring should be followed immediately by the baseline
survey. As this is the first time that village cadres will collect OUTPUT and OUTCOME monitoring
data, the exercise should be carried out under the close supervision and guidance of the SHAW
partners and Kecamatan STBM team.
Immediate post-triggering monitoring: this normally starts with OUTPUT monitoring which is
rather straightforward and relatively easy. Except for ‘difficult’ cadres one may expect that the
village cadres should be able to do this on their own under the supervision and guidance of the
village STBM team. Even so, the SHAW partners and or Kecamatan STBM teams have the
responsibility to provide oversight and verify the data. How can this be done?
It is impossible and unnecessary to redo the work of the village cadres by revisiting all the
houses they monitored. Follow these two principles:
‘Trust but verify’: while a village cadre should be considered trustworthy, one should
perform additional checks and balances to verify that the data collected by the village
cadre is accurate and reliable; and
‘Be smart’: conduct checks and balances in such a manner that it can be done relatively
easy without taking too much effort and time.
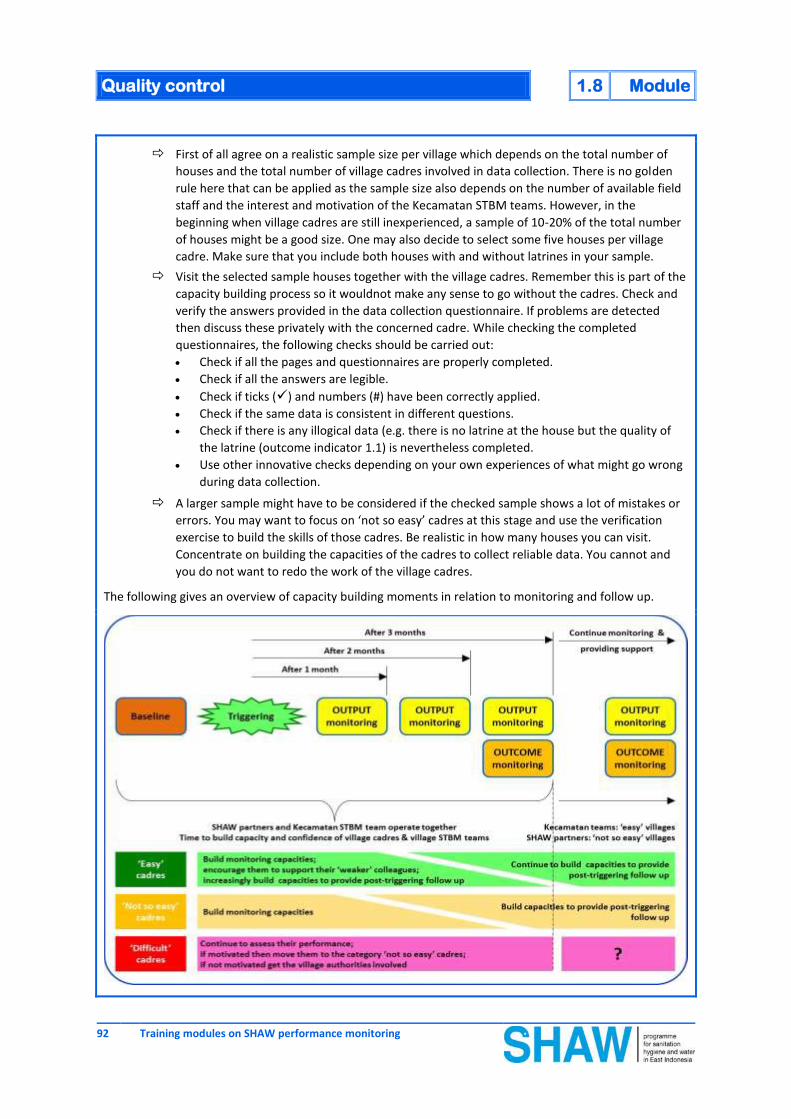
Quality control 1.8 Module
92 Training modules on SHAW performance monitoring
First of all agree on a realistic sample size per village which depends on the total number of
houses and the total number of village cadres involved in data collection. There is no golden
rule here that can be applied as the sample size also depends on the number of available field
staff and the interest and motivation of the Kecamatan STBM teams. However, in the
beginning when village cadres are still inexperienced, a sample of 10-20% of the total number
of houses might be a good size. One may also decide to select some five houses per village
cadre. Make sure that you include both houses with and without latrines in your sample.
Visit the selected sample houses together with the village cadres. Remember this is part of the
capacity building process so it wouldnot make any sense to go without the cadres. Check and
verify the answers provided in the data collection questionnaire. If problems are detected
then discuss these privately with the concerned cadre. While checking the completed
questionnaires, the following checks should be carried out:
Check if all the pages and questionnaires are properly completed.
Check if all the answers are legible.
Check if ticks () and numbers (#) have been correctly applied.
Check if the same data is consistent in different questions.
Check if there is any illogical data (e.g. there is no latrine at the house but the quality of
the latrine (outcome indicator 1.1) is nevertheless completed.
Use other innovative checks depending on your own experiences of what might go wrong
during data collection.
A larger sample might have to be considered if the checked sample shows a lot of mistakes or
errors. You may want to focus on ‘not so easy’ cadres at this stage and use the verification
exercise to build the skills of those cadres. Be realistic in how many houses you can visit.
Concentrate on building the capacities of the cadres to collect reliable data. You cannot and
you do not want to redo the work of the village cadres.
The following gives an overview of capacity building moments in relation to monitoring and follow up.

Module 1.8 Quality control
Training modules on SHAW performance monitoring 93
Regular progess monitoring: the first few months following triggering should be used to build the
capacity of the village cadres. Depending on the degree of increase in the capacity of cadres, the
sample size of houses that are to be visited could be reduced over time. Again focus primarily on
the ‘not so easy’ cadres and continue to build their capacity. Consider the following:
After the first three months of monitoring following triggering, the villages should be divided
among the SHAW partners and the Kecamatan STBM teams as described in Module 1.5
‘Planning and organising monitoring’8:
Kecamatan STBM teams, with relatively less experience and or less capacity than the
SHAW partners, should take responsibility for the ‘easy’ villages; and
SHAW partners, with relatively more experience and capacity than the Kecamatan STBM
teams, should be responsible for the ‘not so easy’ villages.
Determine a realistic sample size of houses that are to be visited. The sample size should
decrease proportionally to the increase in capacity of the village cadres. Select the houses to
be included in the sample on the most recent OUTPUT and OUTCOME monitoring data.
Houses that have achieved or are getting close to 100% STBM status also know as ‘easy’
houses: pick a few houses to check whether or not the information in the data collection
forms is correct and present a true reflection of the conditions in and around the house.
Houses that are making progess but that have not yet achieved 100% STBM status also
known as ‘not so easy’ houses: take a bigger sample and use the visit to build the capacity
of the cadres. First of all focus on the quality of data collection but thereafter the cadres
should also be encouraged to combine their monitoring tasks with post-triggering follow
up such as hygiene promotion. This is best done by supporting the cadre to discuss the
status with the people living in the house. Depending on the actual status and the level of
motivation of the people living in the house, support the cadre to motivate (retrigger) the
people or to deliver a limited number of key hygiene messages that is relevant to the
actual status of that particular house. Keep the following in mind:
Determine a limited number of key messages for each pillar before village level
activities commence. The key messages should be linked to the STBM criteria for the
different pillars.
Limit the key hygiene promotion messages to one pillar per visit.
Follow as much as possible the sequences of the STBM pillars: start with pillar 1, then
pillar 2, pillar 3, pillar 4 and conclude with pillar 5. The sequences of the STBM pillars
basically follow the sanitation and hygiene priorities.
If steady progress is being made on one pillar it might be a good idea to start
reinforcing hygiene promotion messages on another pillar. However keep a check on
the number of hygiene messages you deliver in one go. Do not expect households to
work on all five pillars at the same time.
Houses that are not making any progress also known as ‘difficult’ houses: you may want
to consider ignoring these houses for the time being until that time that the cadres are
sufficiently capable and confident to work with the people living in these houses.
A short summary of these three categories of houses is provided in the following table.
8 The different categories are attached to this training module.

Quality control 1.8 Module
94 Training modules on SHAW performance monitoring
Conclusion: during monitoring and follow-up, SHAW partners and or Kecamatan STBM teams should spend
most of their time with ‘not so easy’ cadres visiting ‘not so easy’ houses. This is because the visits provide
an excellent opportunity to continue building the capacity of those cadres when facing more challenging
situations.
Documents used:
UNESCO (2011) Systematic Monitoring for Education for ALL; Module A2: Data Collection and Quality Control;
Section 6: Data quality control. Available at: http://www4.unescobkk.org/education/efatraining/module-a2/3-a-
general-introduction-to-data-collection/
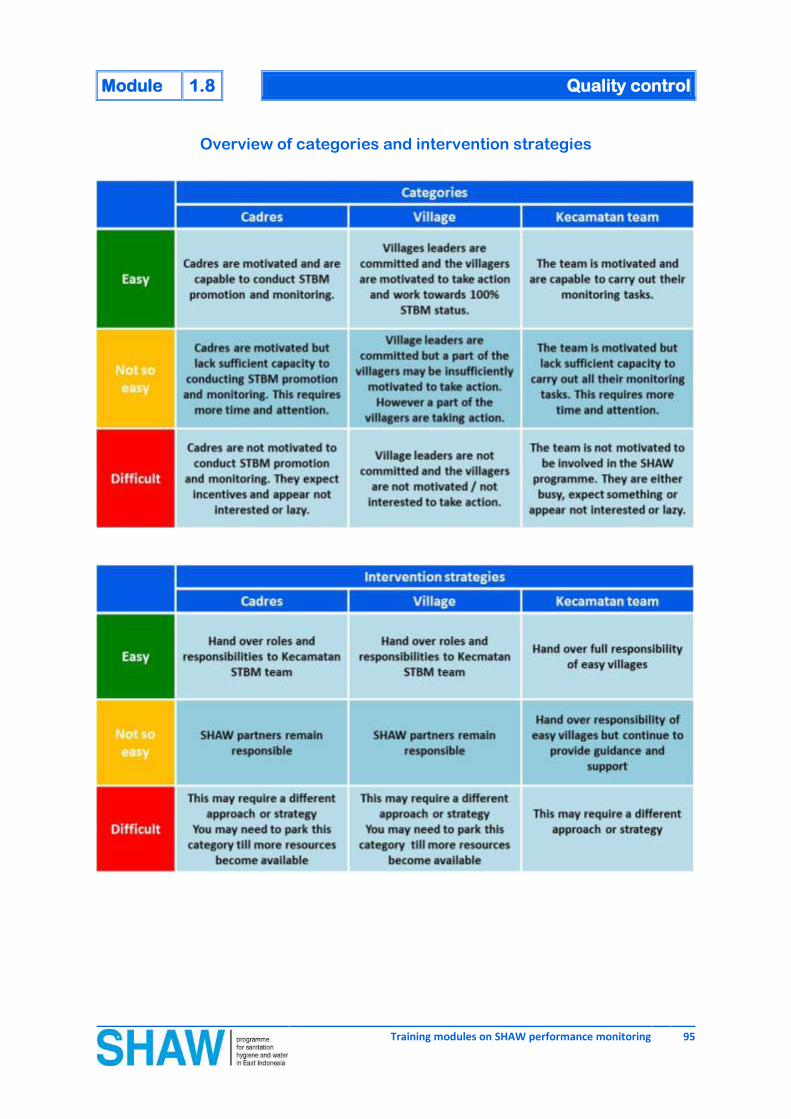
Module 1.8 Quality control
Training modules on SHAW performance monitoring 95
Overview of categories and intervention strategies

96 Training modules on SHAW performance monitoring
Module 1.9: Analysing monitoring data

Module 1.9 Analysing monitoring data
Training modules on SHAW performance monitoring 97
Relevance Audience
Collecting data without making sense of the data is a waste of time and effort. The
process of turning data into useful information that is required for decision-making
and learning requires more attention. Data analysis will help us to identify patterns
and trends which are essential for efficient and effective programme steering,
staying on course and for achieving the programme targets.
If we do not properly analyse the data we collect then we will never be able to
make the right decisions.
Kecamatan STBM
team
Camat and Kecamatan
secretary
Dinas Kesehatan and
Pokja AMPL
SHAW Partner NGO
staff
Objective
To deepen the participants’ understanding and knowledge on data analysis.
To develop the skills and capacities of the participants’ to carry out data
analysis with the help of the overviews and reports incorporated in the data
files.
Steps Materials
1. Start with a general introduction (mini lecture) on data analysis and where this
fits within in the complete overview of monitoring activities. Explain that this is
possibly the most important step in monitoring.
2. Explain with the use of some real examples how the reports and overviews
integrated in the databases and data files are to be used to analyse progress,
trends and gaps.
3. Break participants into several groups (may be per SHAW partner) and ask
them to analyse the most recent OUTCOME data for one Kecamatan. The
groups should answer the following questions:
What is the overall progress on all five pillars?
What are the overall gaps or differences between actual and expected
results? How much work remains to be done to achieve 100% STBM
status?
What is the overall trend for the Kecamatan and what are the trends for
the individual villages over the past six months? What is the speed of
progress?
What categories would you give to the Kecamatan as well as to the
individual villages?
4. Come back together. Each group presents their answers to the above
questions.
5. Wrap up this session.
Databases for all five
SHAW partners
Markers
Flipcharts
Masking tape

Analysing monitoring data 1.9 Module
98 Training modules on SHAW performance monitoring
Key messages
1. Data analysis is the process of inspecting, cleaning, transforming and modelling data. Data analysis is
necessary to turn detailed data into useful information for decision making.
2. Data is analysed:
To assess progress;
To identify and locate the gaps in terms of access, quality and changes in behaviour;
To categorise the villages, Kecamatan and Kabupaten to be able to provide tailor support.
3. Data analysis is done at the different levels (desa, Kecamatan and Kabupaten) with the help of the
overviews provided in the databases and data files.
4. Data analysis on the OUTCOME indicators follows the same process as for OUTPUT indicators.
Tips and tricks Limit the time of the mini lectures and keep the amount of information in check. Don’t overdo it
otherwise the participants might get lost and lose interest!
Explain how data analysis is done by providing a practical example. Try to avoid going into too much
detail.
Practise data analysis on the basis of existing databases and data files.
Make sure that the participants are provided with the opportunity to analyse their own data.

Module 1.9 Analysing monitoring data
Training modules on SHAW performance monitoring 99
Background information
What is data analysis?
Data analysis is the process of inspecting, cleaning, transforming, and modelling data with the goal of
discovering useful information, suggesting conclusions, and supporting decision making. Data analysis is
necessary to turn the enormous amount of detailed data into information that helps to identify and
understand patterns, trends, issues, key factors and possible consequences. Monitoring has little value if
the organisation or programme does not analyse the collected data and then act on the information that
comes out of the analysis.
Source: http://infolytics.wordpress.com/category/data-analysis/
This Module focuses on data analysis using the SHAW programme’s OUTPUT and OUTCOME indicators to
monitor and assess progress of villages, Kecamatan and Kabupaten towards the achievement of reaching
100% STBM status.
Data analysis follows the steps of data collection and data entry as shown in the figure below.
How to analyse data?
The basic steps for analysing the OUTPUT and OUTCOME data is as follows:
Assess progess and gaps in the achievement of the programme goals and targets.
Identify and locate the remaining gaps in terms of access, quality and changes in behaviour at the
different levels, namely: desa, Kecamatan and Kabupaten.
Group the desa, Kecamatan, Kabupaten into ‘easy’, ‘not so easy’ and ‘difficult’ categories.
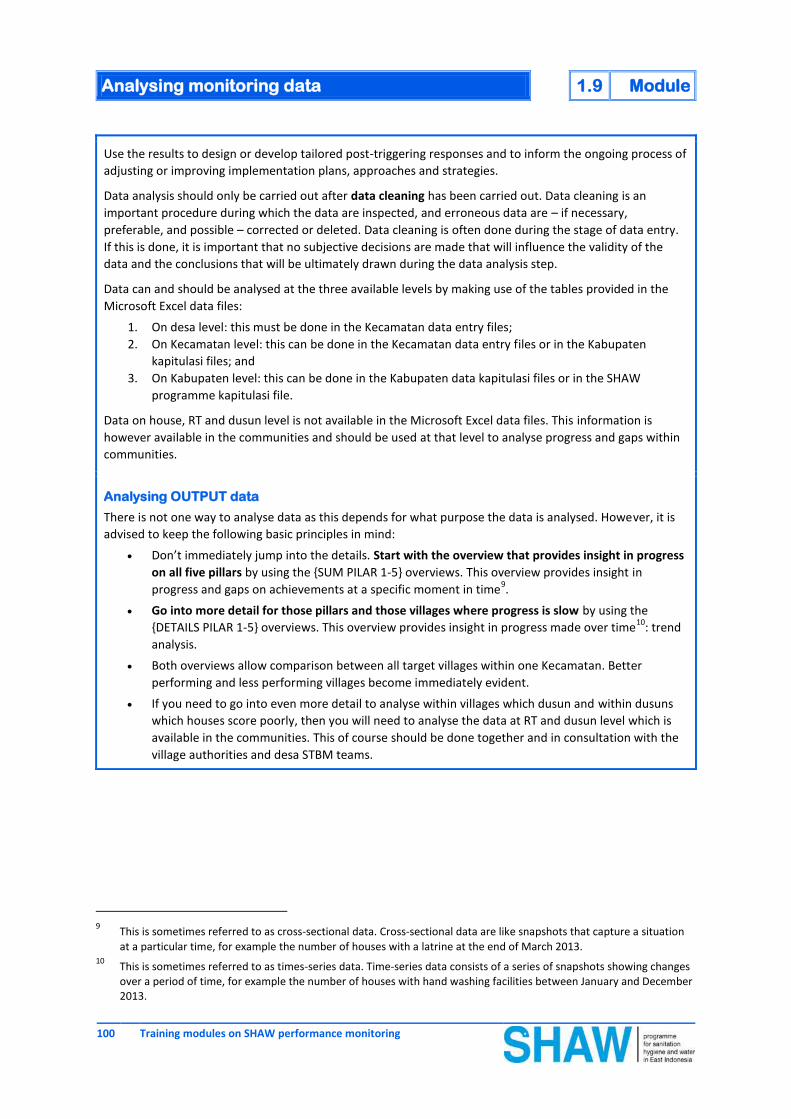
Analysing monitoring data 1.9 Module
100 Training modules on SHAW performance monitoring
Use the results to design or develop tailored post-triggering responses and to inform the ongoing process of
adjusting or improving implementation plans, approaches and strategies.
Data analysis should only be carried out after data cleaning has been carried out. Data cleaning is an
important procedure during which the data are inspected, and erroneous data are – if necessary,
preferable, and possible – corrected or deleted. Data cleaning is often done during the stage of data entry.
If this is done, it is important that no subjective decisions are made that will influence the validity of the
data and the conclusions that will be ultimately drawn during the data analysis step.
Data can and should be analysed at the three available levels by making use of the tables provided in the
Microsoft Excel data files:
1. On desa level: this must be done in the Kecamatan data entry files;
2. On Kecamatan level: this can be done in the Kecamatan data entry files or in the Kabupaten
kapitulasi files; and
3. On Kabupaten level: this can be done in the Kabupaten data kapitulasi files or in the SHAW
programme kapitulasi file.
Data on house, RT and dusun level is not available in the Microsoft Excel data files. This information is
however available in the communities and should be used at that level to analyse progress and gaps within
communities.
Analysing OUTPUT data
There is not one way to analyse data as this depends for what purpose the data is analysed. However, it is
advised to keep the following basic principles in mind:
Don’t immediately jump into the details. Start with the overview that provides insight in progress
on all five pillars by using the {SUM PILAR 1-5} overviews. This overview provides insight in
progress and gaps on achievements at a specific moment in time9.
Go into more detail for those pillars and those villages where progress is slow by using the
{DETAILS PILAR 1-5} overviews. This overview provides insight in progress made over time10
: trend
analysis.
Both overviews allow comparison between all target villages within one Kecamatan. Better
performing and less performing villages become immediately evident.
If you need to go into even more detail to analyse within villages which dusun and within dusuns
which houses score poorly, then you will need to analyse the data at RT and dusun level which is
available in the communities. This of course should be done together and in consultation with the
village authorities and desa STBM teams.
9 This is sometimes referred to as cross-sectional data. Cross-sectional data are like snapshots that capture a situation
at a particular time, for example the number of houses with a latrine at the end of March 2013. 10
This is sometimes referred to as times-series data. Time-series data consists of a series of snapshots showing changes over a period of time, for example the number of houses with hand washing facilities between January and December 2013.

Module 1.9 Analysing monitoring data
Training modules on SHAW performance monitoring 101
It is suggested that you start at the lowest available level: desa. This will give you an insight on how the
different villages are doing. An example of a {SUM PILAR 1-5} overview is given below.
How to proceed?
1) Go to the {SUM PILAR 1-5} overviews and pick the correct reporting period.
Assess overall progress on the different pillars. From the example pillar 3 (98%) and pillar 5
(99%) are doing very good. However, pillar 1 (40%), pillar 2 (38%) and pillar 4 (1%) are not
doing that well at this particular moment.
Assess progress across the different villages on the priority pillars. Follow the sequence of the
STBM pillars: start with pillar 1 and conclude with pillar 5 as described in Module 1.8.
Therefore in this example you should concentrate on pillar 1 as 60% of the houses do not have
access to a latrine. Progress on pillar 1 ranges from 26% in Wounabraidi to 51% in Wouna. This
means that all five villages are still far away from the 100% target.
2) Go to the {DETAILS PILAR 1-5} overviews and pick the correct pillar.
Pillar 1 is the first priority so go to the table providing details over time on pillar 1. In the
example below there appear to be some amazing developments. During the baseline survey
41% of the houses (# 131) had access to their own latrine. This goes up to 44% (# 143) in
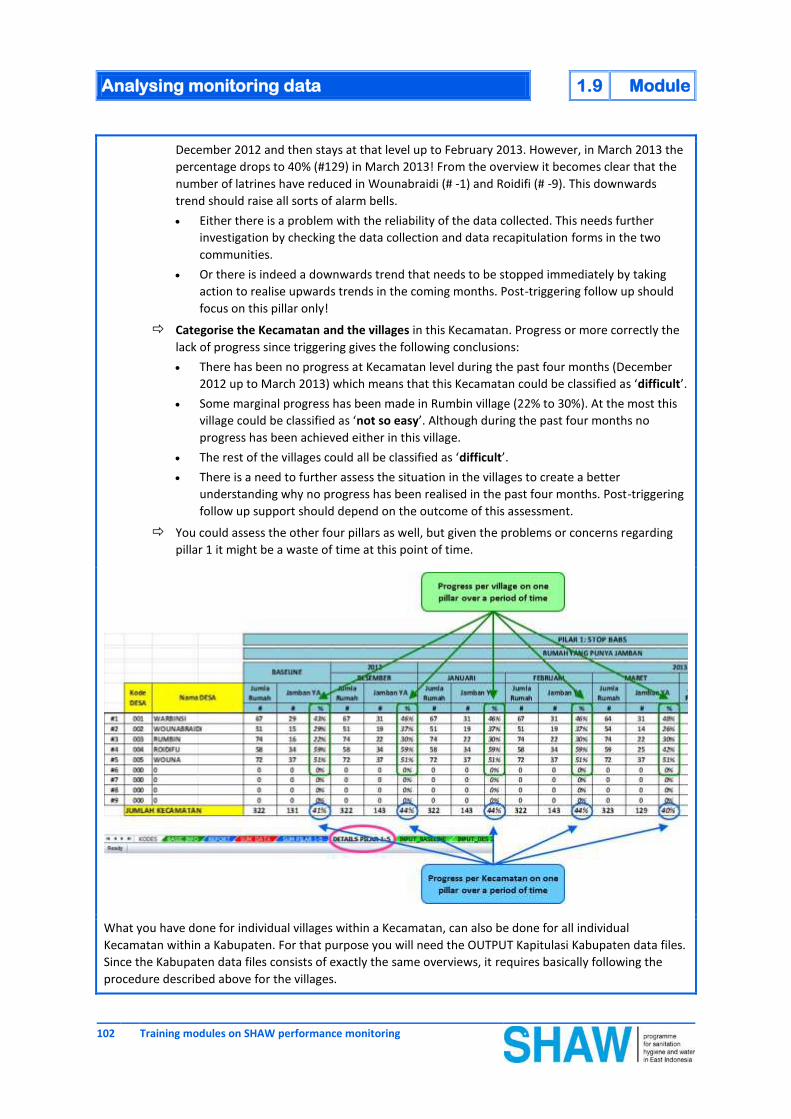
Analysing monitoring data 1.9 Module
102 Training modules on SHAW performance monitoring
December 2012 and then stays at that level up to February 2013. However, in March 2013 the
percentage drops to 40% (#129) in March 2013! From the overview it becomes clear that the
number of latrines have reduced in Wounabraidi (# -1) and Roidifi (# -9). This downwards
trend should raise all sorts of alarm bells.
Either there is a problem with the reliability of the data collected. This needs further
investigation by checking the data collection and data recapitulation forms in the two
communities.
Or there is indeed a downwards trend that needs to be stopped immediately by taking
action to realise upwards trends in the coming months. Post-triggering follow up should
focus on this pillar only!
Categorise the Kecamatan and the villages in this Kecamatan. Progress or more correctly the
lack of progress since triggering gives the following conclusions:
There has been no progress at Kecamatan level during the past four months (December
2012 up to March 2013) which means that this Kecamatan could be classified as ‘difficult’.
Some marginal progress has been made in Rumbin village (22% to 30%). At the most this
village could be classified as ‘not so easy’. Although during the past four months no
progress has been achieved either in this village.
The rest of the villages could all be classified as ‘difficult’.
There is a need to further assess the situation in the villages to create a better
understanding why no progress has been realised in the past four months. Post-triggering
follow up support should depend on the outcome of this assessment.
You could assess the other four pillars as well, but given the problems or concerns regarding
pillar 1 it might be a waste of time at this point of time.
What you have done for individual villages within a Kecamatan, can also be done for all individual
Kecamatan within a Kabupaten. For that purpose you will need the OUTPUT Kapitulasi Kabupaten data files.
Since the Kabupaten data files consists of exactly the same overviews, it requires basically following the
procedure described above for the villages.

Module 1.9 Analysing monitoring data
Training modules on SHAW performance monitoring 103
An example:
1) Go to the {SUM PILAR 1-5} overviews and pick the correct reporting period.
Assess overall results on the different pillars. From the example pillar 2 (54%) seems to be the
biggest problem, and pillar 3 (86%) is doing the best.
Assess the remaining gaps, for example:
Pillar 1: achievement is 78%; 1,827 houses are still without access to their own toilet;
Pillar 2: achievement is 54%; 3,910 houses do not have a hand washing facility;
Pillar 3: achievement is 86%: 1,182 houses do not treat their drinking water;
Pillar 4: achievement is 70%: 2,502 houses do not manage their solid waste; and
Pillar 5: achievement is 79%; 1,766 houses do not manage their liquid waste.
Kecamatan Umbu Ratu Nggay is behind on all pillars if compared with the other two
Kecamatan. However it is too early though to start classifying the three Kecamatan without
looking at the trends over the past months.
2) Go to the {DETAILS PILAR 1-5} overviews and pick the correct pillar.
Pillar 1 is the first priority so go to the table providing details over time on pillar 1. In the
example below there appear to be some amazing developments. Progress in Mamboro has
gone down during the first three months of 2013! Whereas progress was 78% in December
2012, it dropped to 74% in January 2013. From the overview it becomes clear that the number
of latrines have reduced in Mamboro. This downwards trend should raise all sorts of alarm
bells.
Either there is a problem with the reliability of the data collected.
Or there is indeed a downwards trend that needs to be stopped immediately.
Categorise the Kecamatan. Progress or more correctly the lack of progress since triggering
gives rise to the feeling that these could possibly be three ‘difficult’ Kecamatan.

Analysing monitoring data 1.9 Module
104 Training modules on SHAW performance monitoring
The trends can be expressed even more clearly in a graph as shown in the figure below. The graph shows
that a slight downwards trend is visible in January 2013 for Mamboro. Similarly a slight upwards trend is
visible in March 2013 for Umbu Ratu Nggay Barat. Both moments are learning points. What happened?
Unless we understand what transpired at these moments, we will not be able to learn from them and it will
be very difficult to take appropriate remedial action.
To be able to understand what happened it will be necessary to analyse the individual villages within these
Kecamatan.
A quick look at the details per village in Kecamatan Umbu Ratu Nggay Barat, reveals that the upward trend
in March 2013 was caused by noticeable increases in the number of new toilets in just two villages out of
the total of 18 villages, namely: Pondok and Anapalu.

Module 1.9 Analysing monitoring data
Training modules on SHAW performance monitoring 105
Use this information during team meetings to try to answer the following questions:
What happened between February and March 2013 in these two villages. Remember a total of 118
new toilets were completed in these two villages in March 2013.
Why was there no progess in nine villages. Remember not even one new toilet was completed in
those nine villages.
Where are we spending our time? Did we spent the same amount of time in Pondok as in for
example in Umbu Jodu?
If yes, why is Pondok doing so much better than Umbu Jodu? What are the key success
factors?
If yes, what are we doing in Umbu Jodu? We don’t appear to be very effective in this village?
If no, did we spent more time in Pondok than in Umbu Jodu?
Are we utilising our time effectively?
Are we focusing enough? Do we spent our time on all pillars in all villages?
Do we tailor our post-triggering responses to the conditions and circumstances found in the
different villages?
Overall this doesnot look like an ‘easy’ Kecamatan. How does this Kecamatan compare with other
Kecamatan?
How would you categorise the SHAW partner’s field staff on a scale from ‘easy’, ‘not so easy’,
to ‘difficult’?
How would you categorise the Kecamatan STBM team?
How would you categorise the village cadres?
And so on…..
All these and other questions should help us obtain a better understanding of what is happening in the
villages. Why is one village more successful than another?

Analysing monitoring data 1.9 Module
106 Training modules on SHAW performance monitoring
Analysing OUTCOME data
There is basically no difference between analysing OUTPUT data and OUTCOME data. The exact same
procedure can be followed when analysing the seven OUTCOME indicators.
Remember that the OUTCOME data files consist of exactly the same overviews as the OUTPUT data files:
{SUM PILAR 1-5} and {DETAILS PILAR 1-5}.

Training modules on SHAW performance monitoring 107
Appendixes
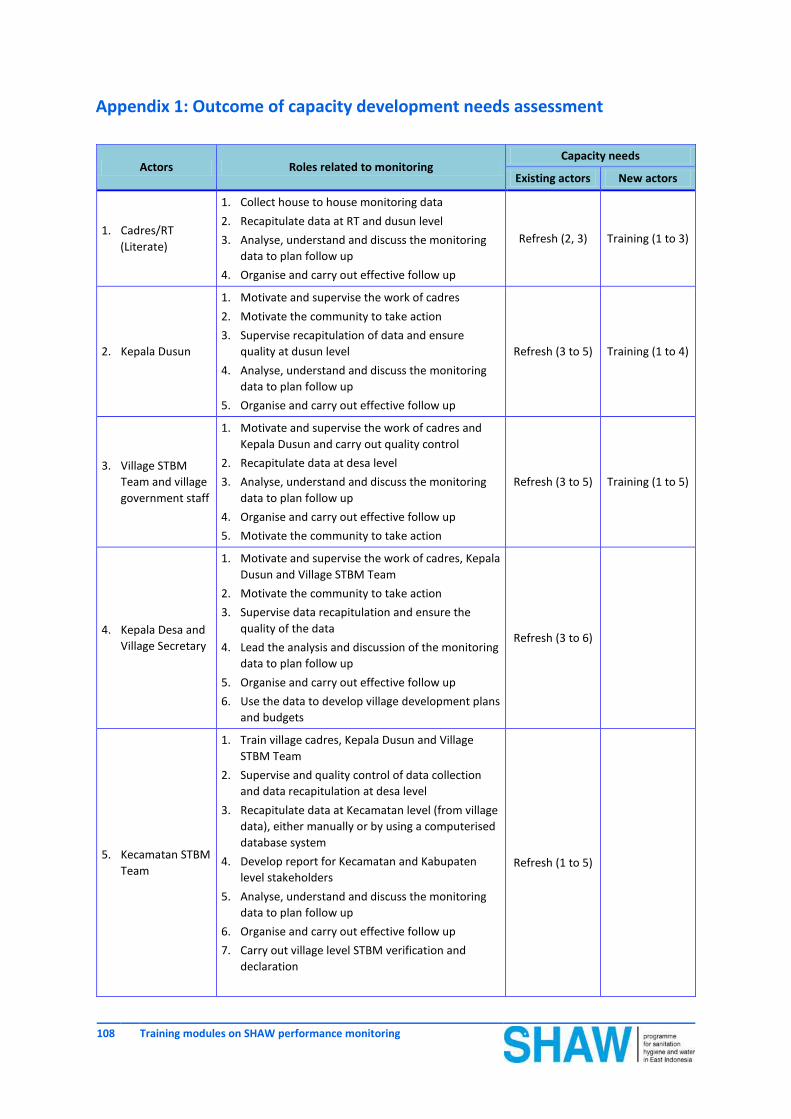
108 Training modules on SHAW performance monitoring
Appendix 1: Outcome of capacity development needs assessment
Actors Roles related to monitoring Capacity needs
Existing actors New actors
1. Cadres/RT
(Literate)
1. Collect house to house monitoring data
2. Recapitulate data at RT and dusun level
3. Analyse, understand and discuss the monitoring
data to plan follow up
4. Organise and carry out effective follow up
Refresh (2, 3) Training (1 to 3)
2. Kepala Dusun
1. Motivate and supervise the work of cadres
2. Motivate the community to take action
3. Supervise recapitulation of data and ensure
quality at dusun level
4. Analyse, understand and discuss the monitoring
data to plan follow up
5. Organise and carry out effective follow up
Refresh (3 to 5) Training (1 to 4)
3. Village STBM
Team and village
government staff
1. Motivate and supervise the work of cadres and
Kepala Dusun and carry out quality control
2. Recapitulate data at desa level
3. Analyse, understand and discuss the monitoring
data to plan follow up
4. Organise and carry out effective follow up
5. Motivate the community to take action
Refresh (3 to 5) Training (1 to 5)
4. Kepala Desa and
Village Secretary
1. Motivate and supervise the work of cadres, Kepala
Dusun and Village STBM Team
2. Motivate the community to take action
3. Supervise data recapitulation and ensure the
quality of the data
4. Lead the analysis and discussion of the monitoring
data to plan follow up
5. Organise and carry out effective follow up
6. Use the data to develop village development plans
and budgets
Refresh (3 to 6)
5. Kecamatan STBM
Team
1. Train village cadres, Kepala Dusun and Village
STBM Team
2. Supervise and quality control of data collection
and data recapitulation at desa level
3. Recapitulate data at Kecamatan level (from village
data), either manually or by using a computerised
database system
4. Develop report for Kecamatan and Kabupaten
level stakeholders
5. Analyse, understand and discuss the monitoring
data to plan follow up
6. Organise and carry out effective follow up
7. Carry out village level STBM verification and
declaration
Refresh (1 to 5)

Training modules on SHAW performance monitoring 109
Actors Roles related to monitoring Capacity needs
Existing actors New actors
6. Camat and
Kecamatan
Secretary
1. Motivate and supervise the work of Village Head
and Village Secretary
2. Supervise data recapitulation and ensure the
quality of the data
3. Lead the analysis and discussion of the monitoring
data to plan and organise follow up
4. Coordinate and initiate action to accelerate village
level STBM verification and declaration
5. Use the data to develop Kecamatan development
plans and budgets
Refresh (2 to 5)
7. Dinas Kesehatan
and Pokja AMPL
1. Analyse data for steering, planning and
coordination
2. Coordinate and initiate action to accelerate
Kecamatan level STBM verification and
declaration
3. Use the data to develop Kabupaten development
plans and budgets
Refresh (1 to 3)
8. SHAW Partner
NGOs
1. Initiate, organise and supervise performance
monitoring at all levels
2. Train, motivate, guide and coach all the above
actors
3. Supervise and quality control of data collection
and data recapitulation at desa and Kecamatan
level
4. Advise on data analyse and action planning on
Kecamatan and Kabupaten levels
5. Continue capacity building of all the above actors
by providing adequate and effective on-the-job
training
Refresh (1 to 5)
Develop training
modules and
organise a ToT
for selected
partner staff
who will then
train their
colleagues

110 Training modules on SHAW performance monitoring
Appendix 2: Training schedule for Training of Trainers on SHAW performance
monitoring
M
ON
DA
Y 09
SEP
TU
ESD
AY
10 S
EP
WED
NES
DA
Y 11
SEP
TH
UR
SDA
Y 12
SEP
FR
IDA
Y 13
SEP
MO
RN
ING
08.3
0-09
.00
Ope
ning
and
intr
odu
ctio
n of
part
icip
ants
08.3
0-09
.00
Rec
ap d
ay o
ne
Fiel
d tr
ip t
o p
ract
ice
data
co
llect
ion,
data
ver
ific
atio
n an
d da
ta
reca
pitu
lati
on
08.3
0-10
.30
Rec
ap a
nd e
valu
atio
n of
day
thre
e
08.3
0-09
.00
Rec
ap o
f da
y fo
ur
09.0
0-09
.30
Obj
ecti
ves
and
pro
gram
me
of
TOT
09.0
0-10
.30
Plan
ning
and
org
anis
ing
mo
nito
ring
(Mo
dule
1.5
)
09.0
0-10
.30
Pres
enta
tio
n of
res
ults
of d
ata
anal
ysis
09
.30-
10.3
0
Intr
odu
ctio
n to
mo
nito
ring
(Mo
dule
1.1
)
CO
FFEE
BR
EAK
CO
FFEE
BR
EAK
CO
FFEE
BR
EAK
CO
FFEE
BR
EAK
11.0
0-12
.30
Intr
odu
ctio
n to
SH
AW
mo
nito
ring
sys
tem
(Mo
dule
1.2
)
11-0
0-12
.30
Dat
a co
llect
ion
tech
niqu
es
(Mo
dule
1.6
)
11.0
0-12
.30
Qua
lity
cont
rol
(Mo
dule
1.8
) 11
.00-
12.3
0 D
iscu
ssio
n on
sch
oo
l
mo
nito
ring
indi
cato
rs
LUN
CH
LU
NCH
LU
NCH
LUN
CH
LU
NCH
AFT
ERN
OO
N
13.3
0-15
.00
Und
erst
andi
ng t
he
OU
TPU
T in
dica
tors
(Mo
dule
1.3
)
13.3
0-15
.00
Prac
tisi
ng d
ata
colle
ctio
n te
chni
ques
Cont
inua
tio
n of
mo
rnin
g pr
ogra
mm
e
in t
he fi
eld
13.3
0-15
.00
Prac
tisi
ng q
ualit
y
cont
rol m
easu
res
13
.30-
15.0
0 Sc
hoo
l mo
nito
ring
cont
inue
d
CO
FFEE
BR
EAK
CO
FFEE
BR
EAK
CO
FFEE
BR
EAK
CO
FFEE
BR
EAK
15.3
0.17
.00
Und
erst
andi
ng t
he
OU
TCO
ME
indi
cato
rs
(Mo
dule
1.4
)
15.3
0-17
.00
Vill
age
leve
l dat
a
reca
pitu
lati
on
(Mo
dule
1.7
)
15.3
0-17
.00
Dat
a an
alys
is
(Mo
dule
1.9
)
15.3
0-16
.30
Agr
eem
ent
on
fina
lisin
g
trai
ning
mo
dule
s
16.3
0-17
.00
Trai
ning
eva
luat
ion
DIN
NER
DIN
NER
D
INN
ER
D
INN
ER
D
INN
ER
EVEN
ING
Smal
l gro
ups
revi
ew
trai
ning
mo
dule
s
Prep
arat
ion
for
fiel
d
prac
tice
&
Smal
l gro
ups
revi
ew
trai
ning
mo
dule
s
Dat
a an
alys
is e
xerc
ise
per
SHA
W p
artn
er
&
Smal
l gro
ups
revi
ew
trai
ning
mo
dule
s