Embed Size (px)
Citation preview

TRANSACTIONS OF SOCIETY OF ACTUARIES 1979 REPORTS
R E P O R T OF T H E C O M M I T T E E ON SELF- A D M I N I S T E R E D R E T I R E M E N T PLANS
MORTALITY AMONG PENSIONERS AND SOME N O N R E T I R E D E X P E R I E N C E
p REVIOUS reports of this Committee are in the 1958 Reports (p. 115), 1962 Reports (p. 120), 1966 Reports (p. 182), I971 Reports (p. 257), and 1976 Reports (p. 151). Data from the 1971 Reports were used
in constructing the UP-1984 Mortality Table, the first such table based primarily on noninsured pensioner mortality experience for ages 65 and over? For the 1976 Reports, actual-to-expected mortality ratios were derived on the basis of the UP-1984 Table (set forward one year for males and set back four years for females, unless otherwise indicated) and also on the basis of the 1971 GAM Tables for males and females. For the purpose of analyzing the experience gathered for this report, actual- to-expected mortality ratios were derived on the basis of the UP-1984 Table adjusted as in 1976.
Reports prior to 1976 were limited to the mortality experience of non- disability retirements by number of lives. The 1976 report was expanded to include some disability pensioner mortality experience, and, for several of the nondisability mortality experiences, the results were shown on the basis of pension amounts and by number of lives. This report includes also some disability pensioner mortality experience and some results by amount as well as by number of lives. Each experience has been sum- marized and reported separately, as in prior reports, and, where available and of sufficient size to be meaningful, the experience for male and female pensioners has been shown separately. The data base includes the experiences for two large nonretired groups, as well as for the United States civil service retirement system and the social security program.
Data for a number of smaller groups, mainly governmental units, that were shown in the 1971 Reports were not included in the 1976 report and have not been included in this report either. The tables and sections in- cluded herein are num0ered as they were in the 1976 report for the sake of comparability. The experiences that have been included have not been regrouped on the basis of consistent quinquennial periods of time, nor are the experience periods coterminous, because of problems with data avail- ability and time constraints.
1 William W. Fellers and Paul H. Jackson, "N~minsured Pensioner Mortality: The UP-Iq84 Table," PCAPP, XXV, 456.
409
410 COMMITTEE ON SELF-ADMINISTERED RETIREMENT P L A N S
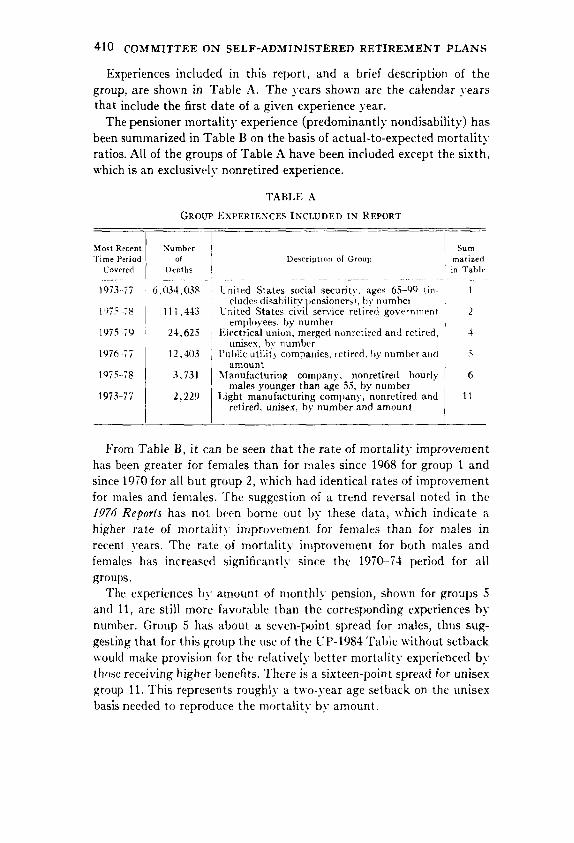
Experiences included in this report, and a brief description of the group, are shown in Table A. The }'ears shown are the calendar years that include the first date of a given experience 3'ear.
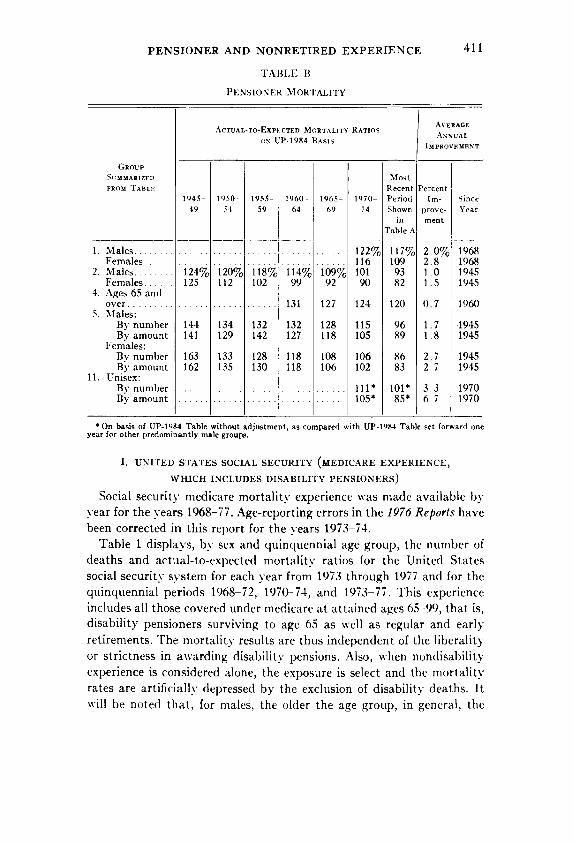
The pensioner mortality experience (predominantly nondisability) has been summarized in Table B on the basis of actual-to-expected mortality ratios. All of the groups of Table A have been included except the sixth, which is an exclusively nonretired experience.
TABLE A
GROUP EXPERIENCES INCLUDED IN REPORT
Most Recent Time Period
Covered
I973°~77
F)75-78
1¢17,5-79
1976-77
197578
1973-77
Number Sum- of Description of Group marized
Deaths in Table
6,034,038 United States social security, ages 65--90 (in- 1 eludes disability 1)ensioners), hy number
111,443 Ur~ited States civil service retired government 2 employees, t)y number
24,625 Electrical union, merged nonretired and retired, 4 unJ.sex, 13V n u m b e r
12. 403 Public utili£y companies, retired, by number and 5 amount
3,731 Manufacturing company, nonretired hourly 6 males younger than age 55, by number
2,229 Light manufacturing company, nonretired and 1l retired, unisex, by number and amount
From Table B, it can be seen that the rate of mortality improvement has been greater for females than for males since 1968 for group 1 and since 1970 for all but group 2, which had identical rates of improvement for males and females. The suggestion of a trend reversal noted in the 1976 Reports has not been borne out by- these data, which indicate a higher rate of mortality improvement for females than for males in recent years. The rate of mortality improvement for both males and females has increased significantly since the 1970--74 period for all groups.
The experiences by amount of monthly pension, shown for groups 5 and 11, are still more favorable than the corresponding experiences by number. Group 5 has about a seven-point spread for males, thus sug- gesting that for this group the use of the UP-1984 Table without setback would make provision for the relatively better mortality experienced by those receiving higher benefits. There is a sixteen-point spread for unisex group 11. This represents roughly a two-year age setback on the unisex basis needed to reproduce the mortality by amount.
P E N S I O N E R A N D N O N R E T I R E D E X P E R I E N C E
T A B L E B
PENSIONER ~IORTALITY
411
GROUP ~UMMARIZED FROM TABLE
1. Males . . . . . F emal e s .
2. Males . . . . . . F e m a l e s . . . . .
4. Ages 65 and over . . . . . . . .
5. Males: By n u m b e r By a m o u n t
Females : By n u m b e r By a m o u n t
11. Unisex: By number By a m o u n t
i24 125
144 141
163 162
AVERAGE ACTUAL-TO-EXPECTED MORTALITY RATIOS
ANNUAL I~N UP-1984 BASTS IMPROVEMENT
1950- 54
i20 112
134 129
133 135
102
132 142
128 130
1960- 1965 1970- 64 69 74
116 ii4% io9~ lOl
99 92 90
131 127 124
132 128 115 127 118 105
118 108 106 118 106 102
. . . . . . . . . . . . 111"
. . . . . . . . . . . . 105"
Most Recent IPercent Period I Ira- Shown I prove-
T a i l A ment
109 2 .8 93 1 .0 82 1.5
120 0 . 7
96 1.7 89 1.8
86 ~ 2 .7 83 2,7
101* l 3 .3 85* [ 6 ,7
Since Year
1968 1945 1945
1960
1945 1945
1945 1945
1970 1970
* On basis of UP-1084 Table without adjustment, as compared with UP-1984 Table set forward one year for other predominantly male groups.
I. UNITED STATES SOCIAL SECURITY (MEDICARE EXPERIENCE,
WHICH INCLUDES DISABILYFY PENSIONERS)
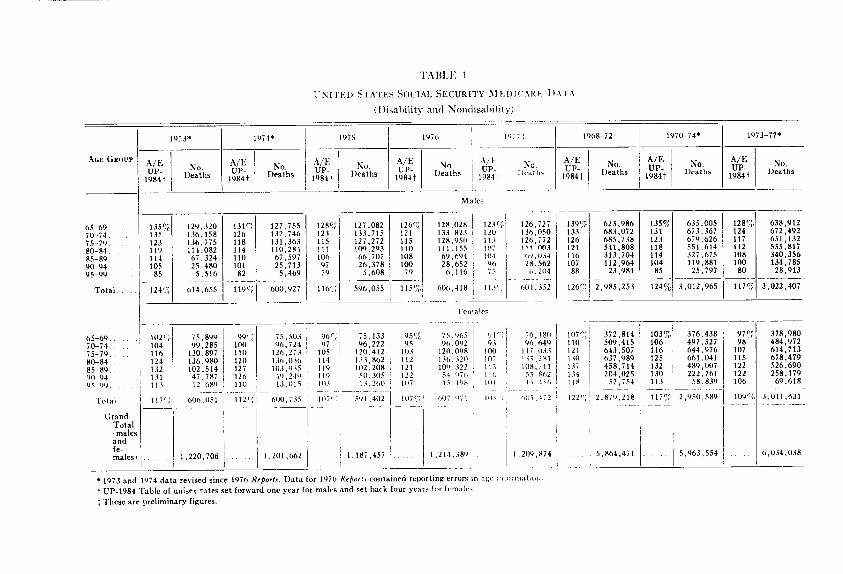
Social security medicare mortality experience was made available by )'ear for the years 1968-77. Age-reporting errors in the 1976 Reports have been corrected in this report for the years 1973-74.
Table 1 displays, by sex and quinquennial age group, the number of deaths and actual-to-expected mortality ratios for the United States social security system for each year from 1973 through 1977 and for the quinquennial periods 1968-72, 1970-74, and 1973-77. This experience includes all those covered under medicare at attained ages 65-99, that is, disability pensioners surviving to age 65 as well as regular and earl) retirements. The mortality results are thus independent of the liberality or strictness in awarding disability pensions. Also, when nondisability experience is considered alone, the exposure is select and the mortality rates are artificially depressed by the exclusion of disability deaths. It will be noted that, for males, the older the age group, in general, the
TABIA," 1
[TN ITE D STATES SOCIAL SECURITY 51 t ' D I ( A R E I )ATA
( D i s a b i l i t y a n d N o n d i s a b i l i t y )
AGE GRouP
65-69 . . . . . 70-74 . . . . . . 75-79 80-84 85-89 9~04 95-99
Total . . . .
65-60 . . . . 70-74 . . . . . . 75-70 . . . . . 8 0 - 8 4 85 8 9 . 90-94 95 99 . . . . .
Total
1973" 1974" 1975 1976 I ~77 l 1968-72
1 A/E N o ,'~ ~ 1.~ No. " ~ ! No. .~,p~ .,,,. A,p~ ~o. .~! No. u~_ e~ Deaths 19g4~ Deaths Deaths Deaths l )cldl~ Deaths 1984t , 1084t 1984~ 10841 1984t
Males
135c~1 129,320 [ 131~ I 127,755 128c '~ 127,082 12t, e~ 128,028 123% 126.727 131 ] 136,158 I 126 I 132,746 ] 123 [ 133,715 121 133,823 I 120 I 130,050 123 136,775 I 118 [ 131,363 / 115 [ 127,272 I 115 [ 28,950 t13 ~ 126.772 119 114,082 ] 114 110,284 / 111 [ t09,293 [ l l0 [ 111.155 107 [ 11t[003 114 I 671324 I 110 [ 67 597 106 66,707 f 108 [ 69[604] 104 ! t~)[03.| 105 25,480 101 251713 97 26,378 I 100 I 28,652 96 i 2g.562 85 5,516 82 5,469 t 79 I ,,608 79 t ,1,01
92,~: I -x, aTgs~-i--;,a@: I 6~0,027 1~6'i 5 - 9 6 , ~ 5 / 1~5~ 606,418{ 11.V:] ,,04,352
1970-74"
A/E UP- No.
Deaths 1984~
1973-77"
A/E UP- No.
Deaths 1984I"
139%1 623,986 [ 135% I 635.005 I 128~1 638,912 133 [ 683,072 I 131 ] 673,367 ] 124 I 672,492 126 685,738 [ 123 679,626 i 117 651,132 21 541,808 ] 118 [ 551.614 I 112 ] 555,817
116 I 313,704 114 327,675 108 340,356 107 I 112 964 104 119,881 100 134,785
~ / ~ l ~ , - ~ i ~ 1 3,02~,40-7 I:emales
i itt2,;! 75.89o 99,; 75,503 96~; 75,133 9sc~[ 75,9t,5 ,~4~ 76.180 104 99,285 100 06,724 O7 [ 96,222 19~ 96,002 o,, i o6,649 116 I 130,897 110 / 126 27.t 105 120.412 120.098 00 1 117.033 124 136 980 120 136 036 114 1331862 112 1361320 t07 ] 1351281 132 ! 102 514 127 I It '~,t~5 q 102,208 121 10o,322 7~ I08,711 131 47[787 126 ! 4u,240 I10 i 50,305 122 54,97I, 11¢, 35.R62 113 I 12.68,) 110 i 13 .015 i0,, ; 1,,,26t!, i..r 15,1.,~ , , ~ ~s~,
372,814 103%1 376,438 97Cr~i 378,980 509,415 106 i 497,527 98 ~ 484,972 643,507 116 i 644,976 107 ! 614,713 637,989 125 ] 661,041 115 678,479 458,714 132 489,007 122 526,690 204,025 130 222,761 122 258,179
52,754 113 ] 58,839 106 69,618
2,879,2181 117e~ 2,950,589 109% 3,01~,631 117c;[
Grand i Total / males t
rna es} .
006,051
1,220,706
112'7~ ] 600,735 107';! 5Ol,402 107'~ 607,97t
I I
1
. . . . . . 1,201.662 1,187,457 1,214.38') 1 , 2 ( I o , 8 2 4
107'7~i 110 121 130 137 134 l lg ,
122':~i
1 i
. . . . 5,864,471 . 5,063,554 6,034,038
* 1973 and lO74 data revised since 1976 Reports. Data for 1970 Reports contained reporting errors m age iaff~rmatitm. t UP-1984 Table of unisex rates set forward one year for males and set back four years for females
These are preliminary figures.
P E N S I O N E R AND N O N R E T I R E D E X P E R I E N C E 413
lower the ratio of actual-to-expected mortality. For females, however, the ratio of actual-to-expected mortality tends to increase by age until it reaches a maximum at ages 85-94, and drops thereafter.
Since the experience is so extensive, the actual-to-expected ratios for the older age groups have considerable credibility. For ages 95-99, the ratio of actual to expected mortality for males was less than 90 percent by this mortality standard for the full ten-year period. For females at ages 95 99, it was greater than 100 percent for all ten }'ears.
From 1976 to 1977, the overall actual-to-expected ratios showed marked improvement for females and less improvement for males. For the four-year period prior to 1977, the mortality improvement was also more significant for females than it was for males. For the nine-year period prior to 1977, this relationship held, too, but at a lower level than the more recent experience indicated. There appears to have been a sharp improvement in mortality from 1973 to 1975, followed by a very slight improvement in 1976 and 1977.
II. RETIRED GOVERNMENT EMPLOYEES (CIVIL SERVICE
"NONDISABILITY ANNUYI'ANTS ~)
The experience of the United States civil service retirement system for government employees for the four-year period from 1975 to 1978 included 111,443 deaths among pensioners classified as "nondisability annuitants."
Table 2 summarizes the mortality" experience since 1945 for males and females. Mortality during the 1975~78 period was roughly 8 percent more favorable for males and 9 percent more favorable for females than during the 1970-74 period. The results indicate an annual rate of mor- tality improvement of about 1~ percent for males and 2 percent for females. Since 1945, on the average, the female mortality improvement has been about 1] times that for males.
Another point to note is that at ages 80 and over the mortality" ratios are generally" less favorable for females than for males, whereas the reverse is more often true at ages under 80.
III. RAILROAD RETIREMENT (current experience not available)
IV. MERGED NONRETIRED AND RETIRED FXPERIENCES
FOR ELECTRICAL GROUP
Another experience of a "heavy industry" type is that of a large elec- trical union group. This group is predominantly male, and no separation

AGE GRot:P
' 7145-6/50
A 2 UP- No. 1084~ Deaths
TA B L E 2
R E T I R E D G O V E R N M E N T GMPLOYEE~;
(Ci','[1 Service "Nondisal)ilitv ,%nnuitar~ts")
7,50-6 ,55 __ 7 ,55-6 /60 A 7~6(} t ~,5 7 05 6/70
A /E UP- ii N o A E UP- No. No E UP 1% I- UP No. 1984~ Deaths 1984~ Deaths 1984f Deaths f ( i 8 1 ~ Deaths
7 /70-6/75 7 /75-9 /79*
A/E UP- No. 1984~ Deaths
A i E UP- No. 19845 Deaths
Under 55 . . . . . . . 55-59 . . . . . . . . . . 60-64 . . . . . . . . . . 65-69 . . . . . . . . . .
70-74 . . . . . . . . . . 75-79 ........... 80-84 . . . . . . . . . . .
85-89 . . . . . .
90 and over . . . . . 65 and over . . . . .
All . . . . . . . . . . .
I
132%f 3 3 154 ,940 130 ~,962 119 , 5,489 118 4,588 123 2,926 117 1~269 119 , 372 ,21 _! 124%! 20,889
I
84% 21 134 424 144 3 ,03 | 1 . ]4 6,333 114 7,649 112 6,556 112 4,229 114 1,908 115 658 117 27,333
120% 30 8(~
127% [ 47 118 565 130 4,169
101206 128 116 11,354 113 9,247
6,383 112 114 3,130 [ 106 t ,018 117 41,338
118% 46,119
Males
1(]6% 77 123 , 786 126 4,408 121 11,0t5 113 17,53(} t l i 13,149 111 8,782 110 4,538 108 1,767 114 5(t,801
114% 65.072
* /'our fiscal years, 1076-79, excluding the transition quarter of July 1, 1976, through September 30, 1(~7~, ? UP-t984 "Fable set forward one year for males and set back four years for females. $ Less than ten deaths.
97% is0 I05 1,171 118 1 5,341 I l i i 12,954 t09 22,269 107 , 19 492 107 ~ 12 244 107 6,125 103 2,601
103% 698 104 3,143 106 8,514 103 14,747 103 19,819 102 25,392 99 18,456 95 8,836 9O 3,843
101 108 75,685 91,093
109%( 82,347 lOl~/c {037448--
94%~ 533 83 3,079
5 i 7 , 6 5 8 9O I 13,875 t;.~ I 15,534 96 I 16,888 96 I 17,777 07 I 9,888 92 I 4,015 94 I 77,977
- - - - j . . . . . . .
93°/ot 89,247
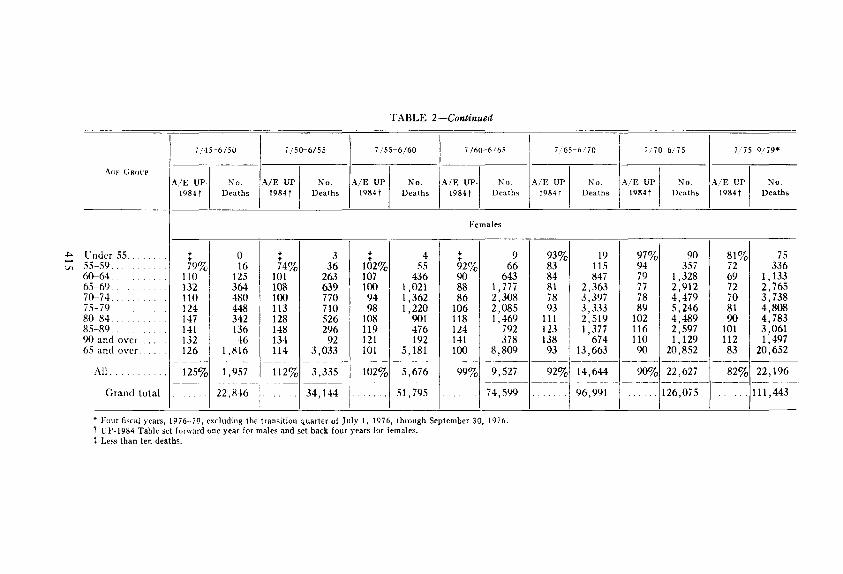
TABLE 2 - - C o n t i n u e d
7/45-6/50 7/50-6/55 7/55 6/60 7/60~6/65 7/65-6/70 7/71~6/75 7/75 0,/79*
AGr: GRouP ACE UP- No. A/E UP. No. A/E UP- No. A/E UP- No. A/E UP No. A/E UP- No. A/E UP- No.
1084{' Deaths 1984{' Deaths 1984{' Deaths 1984t Deaths 1984t Deaths 1984i" Deaths 1984'[" Deaths
Females
4a Under 55 . . . . . . . . 7, 55-59 . . . . . . . . . . .
60-64 . . . . . . . . . . . 65 69 . . . . . . . . . . 70 -74 . . . . . . . . . . .
75-79 . . . . . . . . . . .
80-84 . . . . . . . . . .
85-89 . . . . . . . . . . .
90 and over . . . . . . 65 and over . . . . . .
All . . . . . . . . . . .
Grand total
t 79% 10 32 10 24 47 41 32 26
364 480 448 342 136 46
1,816
1,957
74% 101 108 100 113 128 148 134 114
639 770 710 526 296 92
3,033
-35;;-
t 102% 107
98 108 119 121 101
4 55
436 ,021 ,362 ,220 901 476 192
,181
-/;72- 5 ,795
88 86
106 118 124 141 100
;4o
9 93% 19 66 83 ] 115
643 84 [ 847 1,777 81 I 2,363 2,3(18 78 [ 3,397 2,085 93 ] 3,333 1,469 111 2,519
792 123 [ 1,377 378 138 1 674
8,809 9 _ 3 13,6_63
9,527 92% 14,644
74 99 577.7 96199i
i? 77 78 89
102 116 110 90
--;4o
90 357
1,328 2,912 4,479 5,246 4,489 2,597 1,129
20,852
81% 75 72 [ 336 69 [ 1,133 72 ] 2,765 7 0 [ 3,738 81 1 4 , 8 0 8 90 4,783
101 [ 3,061 112 1,497 83 20,652
. . . . . . . 111,443
Four fiscal )'ears, 1976 79, excluding the transition quarter of July 1, 1976, through September 30, 1976. ~ UP-1984 Table set torward one year for males and set back four years tor iemales. :~ Less than ten deaths.

416 C O M M I T T E E O N SELF-ADMINISTERED RETIREMENT P L A N S
in data has been made bv sex. The experience is given on a merged basis
for nonretired and retired. Those at a t ta ined ages 65 and over are basically the retired group, although, in the absence of an)" mandatory retirement age, there are a considerable number of actives in the 65-69 and 7(~75 age groups. Unfortunately, separate retired and nonretired experiences are not available for this group on a regular basis. Thus the
degree to which pensioner mortal i ty is worse than active mortali ty that is due to the ret i rement of those in poor health cannot be studied for this group. Annui ty values based on the combined experience would tend to
overstate the cost of pensions. This experience is shown in Table 4 for the last four five-year periods
beginning in 1060. For the five-year period 1975-79 there were 24,625 deaths, of which 16,993 were at attained ages 65 and older. First, it will
be noted that this "heavy industry" experience is generally less favorable than others, including social security males at ages 75 and higher. Second, for the per:iod since 1o60, the compound annual rate of mortali~ x
T.~.RLE -1
ELECTRICAL UNION P E N S I O N AND I )EATH
B E N H : I T FUNDS FOR 5:I EMBERSHIP
(Normal Retirement Age Is 65)
AGE GROUP
Under 25 . . . . . . . . . .
25-29 . . . . . . . . . . . . . 30-34 . . . . . . . . . . . .
. . . . . . . . . . . I 45-49][[]][][][[[[[] 50-54 . . . . . . . . . . . . I 55-59 . . . . . . . . 60-64 . . . . . . . . . . 65-69 . . . . . . . . . . . .
70-74 . . . . . . . . . . . . .
75-79 . . . . . . . . . . . . . 80-84 . . . . . . . . . . . 85 and over . . . . . . Ages 65 and over...
Total . . . . . . . . .
1960-64
A /E UP- 984 '
t024 108 145 [26 118 123 129 133 134 127 132 134 128 150 131
130% 16,263
N o . Deaths
136 283 454 637 989
1,626 2,420 2,686 2,535 2,147 1,370
/ 597 / 301 /592 °_
1 9 6 5 - 6 9
A / E UP-
1984'
147% 146 148 119 117 113 116 128 128 124 130 127 127 137 127
1970 74
No. A / E No. Deaths UP- Deaths
1984"
213 112 208 259 143 290 368 119 323 658 107 501 980 111 963
1,445 11l 1,428 2,344 119 2,(D6 3,3Ol 118 2,944 3,411 120 4,049 3,164 126 4,023 2,3211122 13,163 1,2271124 I 2,011
556 133 I 1,040 0,679 124 14,286
1~-' 75 79
A / E . . U P - ~ o .
1984" Deaths
71%1 75 99 / 188
125 I 2!)2 108 [ 321
126%
92 97 96
103 104 109 115 122 126 142 120
113~
385 704
1,254 1,882 2,531 3,572 4,456 4,110 2,788 2,067
16,993
24,625
* UP-1984 Table set forward one year.
P E N S I O N E R AND NONRETIRED E X P E R I E N C E 417
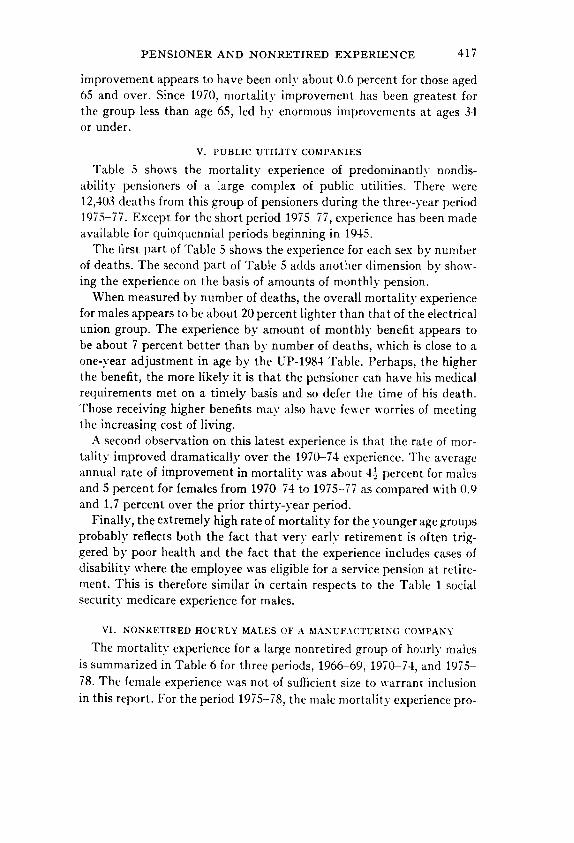
improvement appears to have been only about 0.6 percent for those aged 65 and over. Since 1970, mortality improvement has been greatest for the group less than age 65, led by enormous improvements at ages 34 or under.
V. PUBLIC UTILITY COMPANIES
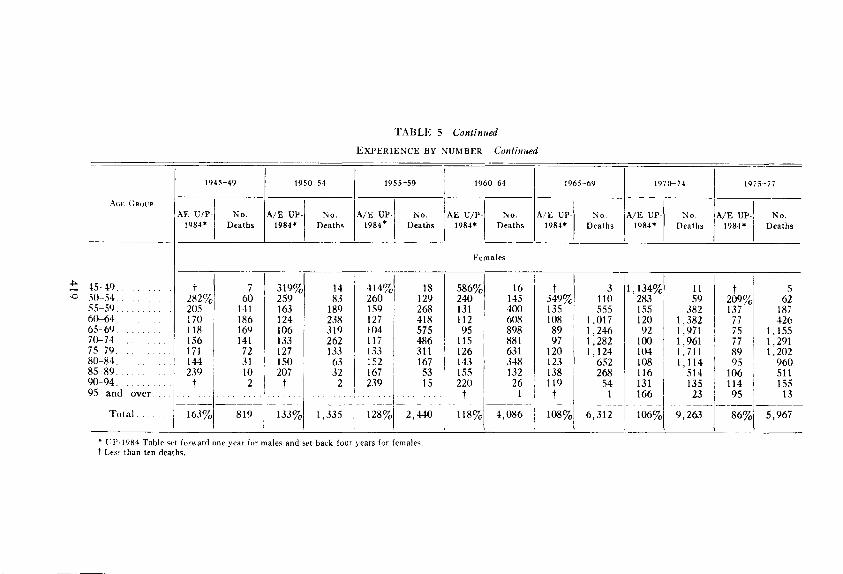
Table 5 shows the mortality experience of predominantly nondis- ability pensioners of a large complex of public utilities. There were 12,403 deaths from this group of pensioners during the three-year period 1975-77. Except for the short period 1975-77, experience has been made available for quinquennial periods beginning in 1945.
The first part of Table 5 shows the experience for each sex by number of deaths. The second part of Table 5 adds another dimension by show- ing the experience on the basis of amounts of monthly pension.
When measured by number of deaths, the overall mortality experience for males appears to be about 20 percent lighter than that of the electrical union group. The experience bv amount of monthly benefit appears to be about 7 percent better than by number of deaths, which is close to a one-year adjustment in age by the UP-1984 Table. Perhaps, the higher the benefit, the more likely it is that the pensioner can have his medical requirements met on a timely basis and so defer the time of his death. Those receiving higher benefits may also have fewer worries of meeting the increasing cost of living.
A second observation on this latest experience is that the rate of mor- tality improved dramatically over the 1970-74 experience. The average annual rate of improvement in mortality was about 4½ percent for males and 5 percent for females from 1970-74 to 1975-.-77 as compared with 0.9 and 1.7 percent over the prior thirty-year period.
Finally, the extremely high rate of mortality for the y'ounger age groups probably reflects both the fact that very ea rh retirement is often trig- gered by poor health and the fact that the experience includes cases of disability where the employee was eligible for a service pension at retire- ment. This is therefore similar in certain respects to the Table 1 social security medicare experience for males.
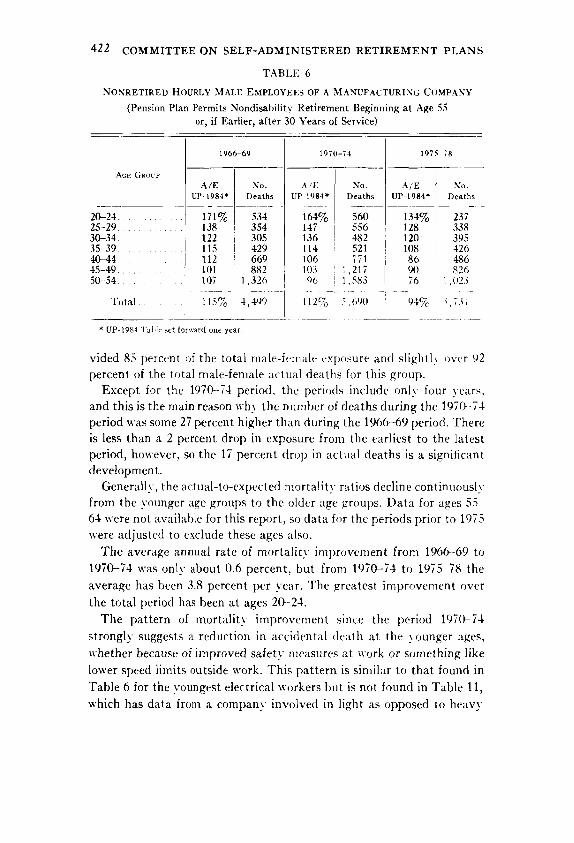
VI. NONRETIRED HOURLY MALES OF A MANUFACTURING COMPANY
The mortality experience for a large nonretired group of hourly males is summarized in Table 6 for three periods, 1966-69, 1970-74, and 1975- 78. The female experience was not of sufficient size to warrant inclusion in this report. For the period 1975-78, the male mortality experience pro-

TAB1,E 5
S E R V I C E P E N S I O N E R S OF A G R O U P OF P U B L I C U T I L I T Y (7OMPAN1E~ fTOVERICD U N D E R A U N I F O R M P L A N
(Ret irement Is Compulsory at Age 65, and Service Pensioners Include Employees Retired for Disability if Eligible for a Service Pension)
E X P E R I E N C E BY N U M t lE R
OO
AGE GROIP
45-49 . . . . . . . . . . 50-54 . . . . . . . . . . 55-59 . . . . . . . . . . 60-64 . . . . . . . . . . 65 -69 . . . . . . . . . . 70-74 . . . . . . . . . 75 79 . . . . . . . . . . 80-84 . . . . . . . . . . 85-89 . . . . . . . . . . 90-94 . . . . . . . . . . 95 and over . . . . .
Total . . . . . .
1945-49
A/E UP- No. 1984" Deaths
1050 54
A/E UP- 1984'
1055 59 1965-09 1970 74 1975-77 I
1960-64 j i
6~3% 5 35 377 [ 153 198 I 427 126 [ 768 132 573 128 339 135 156 86 37
126 14 , i 2
-h4 o -2,;o;
A ' E UP- I No. 1084" I Deaths
7 35
142 47l
1,13l 868 576 268 108
27
3,633
t 594% 384 173 127 129 117 117 135 127 151
-i3 G,
i
No, , UI' ~; No. Deaths 1~84" [ t)eaths
Males
t 594% 366 196 129 117 124 115 150 109
134 o
A,,E LTP - No. A / E UP- 1984' Deaths 1984"
i -- t
N o A 'E UP D-;tih~ VI84"
!
4 77
192 1,357 2,853 2,348 1,864 1,290
No. Deaths
491 i 100 686 88 [ 438 94 I 177 11910 I 6675 18626 8__9 __42 ....
9.262 115% i0.883 l 96% 6,436
* UP-1984 Table set forward one year for males and set back four years for females. t Less than ten deaths.
1 t 2 54 5 1 3 % 46
185 344 J 269 476 173 [ 800
1,367 126 i 1,630 1,365 126 t ,622
946 123 ~, 393 486 t 1 7 ] 864 205 1 3 0 [ 344
29 1 2 7 [ 74 12 f i 4
L_ i _ 126-- 132%] , ,048
-i [ i t i 6 f
7(~1%J 25 569% 369 / 276 305 181 I 1,469 180 116 I 2,122 114 122 [ 1,912 105 124 ! 1,694 109 114 L 1,138 106 102 103 t 6o
1 2 ; % , i i
I
3~6% 8 93 180 201 109 387 90 1,256 92 I 1,648 94 1,312 97 1 874
T A B L E 5 C o n t i n u e d
EXPERIENCE BY NUMBER C o n l i n u e d
AGE GROUP
45-49 . . . . . . . . . . . 50-54 . . . . . . . . . . 55-59 . . . . . . . . . . 60-64 . . . . . . . . . 65-69 ........... 70-74 . . . . . . . . . . .
75 79 . . . . . . . . . . . 80 84 . . . . . . . . . . . 85-89 . . . . . . . . . . . 90-94 . . . . . . . . . . . 95 and over . . . .
Tota l . . . . . .
1 9 4 5 - 4 9
r AE U/P-I No.
1984" i Deaths
1 9 5 0 - 5 4
A/E UP- No. 1984" Deaths
1 9 5 5 - 5 9
!A/E UP- No. 1984" Deaths
1960 64
AE U/P- No. 1984' Deaths
1 9 6 5 - 6 9
A/E UP- No, 1984" Deaths
I 9 7 0 - 7 4
A/E UP- No. 1984" Deaths
1 0 7 5 - 7 7
A/E UP- No. 1984" Deaths
F e m a l e s
2 2% 205 170 118 156 171 144 239
t
163%
l
60 t41 186 169 141
72 31 10 2
819
3 1 9 ~ 259 163 124 106 133 127 150
14 83 89 38 19 62 33 63
l I 35
414%1 18 260 [ 129 I~O I 268 127 i 418 104 I 575 117 I 486 133 F 311 152 I 167 167 ] 53 239 I 15
128%1-21ho
586%1 24O r 131 I 112 I
~ S J
115 ] 881 126 I 631 143 l 348 155 J 132 220 I 26
1
118%1 4 , ; 8 6
16 + 145 349% 400 135 608 1o8 898 89
97 120 123 138 119
+
108%
3 1 , 1 3 4 ~ 110 283 555 155
,017 120 ,246 92 ,282 100 ,124 104 652 108 268 116
54 131 1 I 166
. . . . I . . . . . . .
,312 I 106°-/o
11 t 59 209%
382 137 1,382 77 1,971 75 1,961 77 1,711 [ 89 t , 1 1 4 [ 95
514 t 106 135 I 114 _23 . . . . . . . . . . .
9,263 8 6 %
5 62
187 426
1,155 1,291 1,202
960 511 155
13
5 ,967
UP-1984 Table set forward one :..ear f.r males and set back four years for females. f Less than ten deaths.

TABIA'~ 5 ( ? o n t i n u a l
EXPERIENCE BY AMOUNT
o
AGE GROuv
45 49 . . . . . . . . 50-54 . . . . . . . . 55-59 . . . . . . . . . 60-64 . . . . . . . . 65-69 . . . . . . . . . 70-74 . . . . . . . . .
75-79 . . . . . . . . . 80-84 . . . . . . . . . 85-89 . . . . . . . . . 90-94 . . . . . . . . . 95 and over . . . .
Total . . . . .
1945-49
A / E UP- Monthly
1984" Benefit
1 c;50-54
A/E Monthly UP- Benefit
1o84"
t 1 1055-50 t960 ()t [ 1965 69
. . . . . . . i
A ~F A E i A Monthly /'/p" Monthly Monthly i UP-
1~84' Benefit 1984"UP" Benefit I ~,~84 * Benefit
A/E UP-
1984*
1'4'70 74
Monthly Benefit
1975-77
A/'E Monthly UP- Benefit
1984'
Males
t 724% 371 175 128 127 119 139 87
116 t
141%$232,879
478 3,289
14,968 41,093 75,445 21,435 i 117 J 176,319 [ 49,777 116 901441 1126 163,196 30,427 116 59,299 I 110 98,657 13 442 109 32,348 115 55,205 2 635 145 12,977 ~ 136 28,39l [ 1,052 105 [ 21815 i 127 3,196
273 . . . . . i !4[ 1,308
129%$398,078 142%.$639,355
~ s 770 ~ Is 111 ~%s 614% 3,973 687% 8,667 50 355 161073 3 6 6 27,168 [333 ~, 188 57,947 166 77,1271 153 119 113
121 117 122 127
307 8,361
56,707 174,842 296,854 251,079 188,689 115,639 43,773
123 ] lO,~7g t .~o7
12J%$1 ,14 , ,__6
t 675,°70 349 155 102 111 116 113 91 O0 6t
t IS% I
1,305 5,625
70,038 380,OO4 520,448 402,602 259,725 179,687 63,564 16,629
1,395
,941 ,022-
51~%$ 952 19,038
280 59,135 162 505,395 102 1,075,132 96 833,315
597 682 353,730
91 I 171,038 72 45,812 61 ~ 6,652
105%$3,667,881
t $ 2,831 305% 37,386 147 83,778 96 192,203 84 667,528 84 783,539 89 594,380 92 358,927 91 170,996
100 61,099 62 12,922
89~/o$2,965,589
* UP-1984 Table set forward one year for males and set back four years for females. Less than ten deaths.
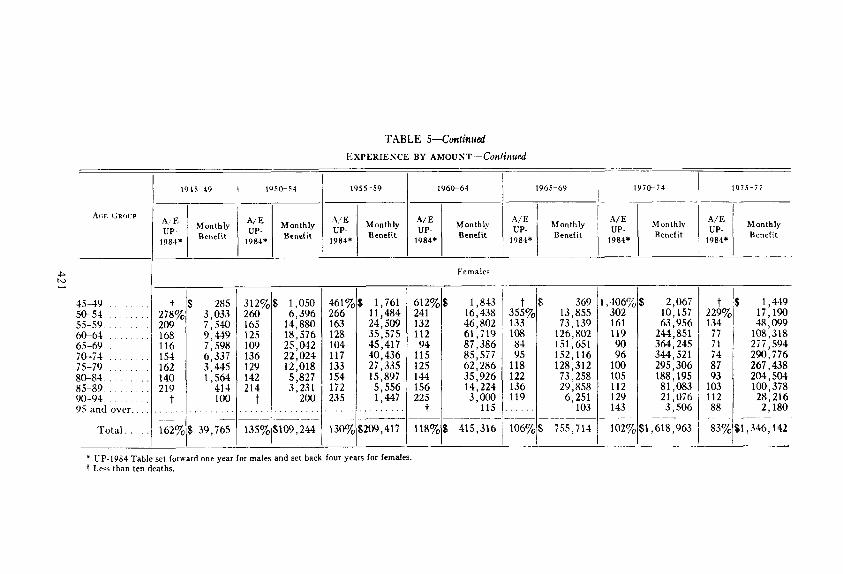
TABLE 5 - - C o n t i n u e d
E X P E R I E N C E BY AMOUNT--Conllm,ted
t-o
Acre (JRr)UP
45 -49 . . . . . . . . .
50-54 . . . . . . . . . 55-59 . . . . . . . . . 60-64 . . . . . . . . .
65-69 . . . . . . .
70-74 . . . . . . . . 75-79 . . . . . . . . . 80-84 . . . . . . . . 85-89 . . . . . . . . 90-94 . . . . . . . .
95 and over...
Total . . . .
1955-59 1960-64 1965-69 1970~74 1975 -77 1945-49 l 1950 54
A/E A/E A / E Monthly AlE Monthly A / E Monthly A/E Monthly. A /E Monthly Monthly_ Monthly UP- up - uP- up - up- up - 1984" Benefit UP- Benefit Benefi t Benefit Benefit Benefit Benefit 1984" 1984" 1984" 1984" 1984" 1984"
Females
t 278% 209 168 116 154 162 140
162~
285 3,033 7,540 9,449 7,598 6,337 3,445 1,564
414 100
$ 3 9 , ~ 5
312%8 1,050 260 I 6,396 165 I 14,880 125 1 18,576 1 0 9 ] 25,042 136 I 22,024 129 12,018 142 5,827 214 I 3,231
461% 266 I
lO4 I 117 I 133 I 154 [ 172 t
11, 761 ,484 ,5o9 ,575
45,417
~ ,436 ,335 ,897
~ , 556 ,447
612% 241 132 112 94
115 125 144 156
$ 1,843 16,438 46,802 61,719 87,386 85,577 62,286 35,926 14,224 3,000
115
$ 4t5,316
t 355% 133 108 84 95 i
118 ~ 122 i 136 1t9
369 13,855 73,139
126,802 151,651 152,116 128,312 73,258 29,858 6,251
103
755,714
406~ $ 2,067 t 302 I 10,157 229% 161 I 63,956 134 119 I 244,851 77 90 364,245 71 96 [ 344,521 74
100 / 295,306 87 105 188,195 93 112 81,083 103 129 I 21,076 112 143__ 3.506 ~ ____88
102% $1,618,963 - -83~
1,449 17,190 48,099
108,318 277,594 290,776 267,438 204,504 100,378 28,216 2,180
$1,346,142
" UP-1984 Table set forward one year for males and set back four years for females. t Less than ten deaths.
4 2 2 COMMITTEE ON SELF-ADMINISTERED RETIREMENT PLANS
TABLE 6
NONRETIRED HOURLY MALE EMPLOYEES OF A MANUFACTURING COMPANY (Pension Plan Permits Nondisability Retirement Beginning at Age 55
or, if Earlier, after 30 Years of Service)
1966-69
AGE (;ROUP A / E No.
UP- 1984* Deaths
2 5 - 2 9 . . . . . . . . . 138 354 30-34 . . . . . . . . . 122 305 35-39 . . . . . . . I 115 429
669
1970-74 1975-78
A / E No. UP-1984" Deaths
147 556 136 482 114 521
A / E No. UP-1984" Deaths
128 338 120 395 108 426
40-44 . . . . . . ] 112 106 771 86 486 45-49 . . . . . . . . I 101 882 1 103 1,217 90 826 50-54 . . . . . !07 ..... !:!!26 96 1,583 : 76 I .023
Total.. 115°/c, ' 4,,t90 l12q:~, I 5.6{R) {)4% ~,731
* UP- l%4 Table ~e!: forward one year.
vided 85 percent of the total male-female expc}sure and slightl) over 92 percent of the total male-female actual deaths for this group.
Except for the 1970-74 period, the periods include only four years, and this is the main reason why the number of deaths dur ing the 1970-74 period was some 27 percent higher than during the 1966-69 period. There is less than a 2 percent drop in exposure from the earliest to the latest period, however, so the 17 percent drop in actual deaths is a significant development .
Generally, the actual- to-expected mor ta l i tv ratios decline continuously from the younger age groups to the older age groups. D a t a for ages 55 64 were not availat)le for this report , so da ta for the periods prior to 1975 were adjusted to exclude these ages also.
The average annual rate of mor ta l i t y improvement from 1966--69 to
1970-74 was only about 0.6 percent , but from 1970-74 to 1975 78 the
average has been 3.8 percent per year. The greatest improvement over
the total period has been at ages 20-24.
The pa t te rn of mor ta l i ty improvement since the period 1970,74
s t rongly suggests a reduction in accidental death at the younger ages,
whether because of improved safe ty meastlres at work or something like
lower speed limits outside work. This pa t t e rn is s imilar to tha t found in
Table 6 for the youngest electrical workers but is not found in Table 11,
which has data from a company involved in light as opposed to heavy
PENSIONER AND NONRETIRED E X P E R I E N C E 423
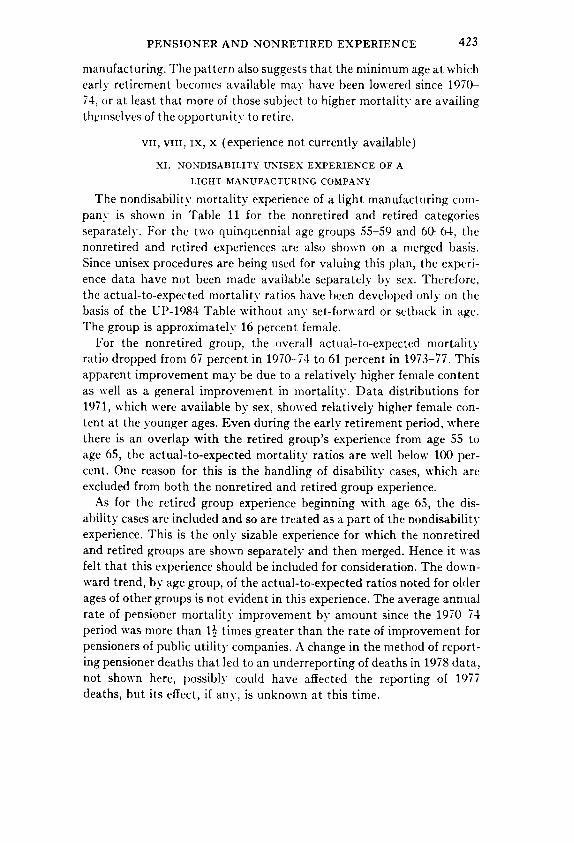
manufacturing. The pattern also suggests that the minimum age at which earl)" retirement becomes available may have been lowered since 1970 74, or at least that more of those subject to higher mortality are availing themselves of the opportunity to retire.
vii, viii, ix, x (experience not currently available)
XI. N O N D I S A B I L I T Y U N I S E X E X P E R I E N C E OF A
LIGHT M A N U F A C T U R I N G COMPANY
The nondisal)ilitv mortality experience of a light manufacturing corn- pan)" is shown in Table 11 for the nonretired and retired categories separately. For the two quinquennial age groups 55-59 and 60-64, the nonretired and retired experiences are also shown on a merged basis. Since unisex procedures are being used for valuing this plan, the experi- ence data have not been made available separately by sex. Therefore, the actual-to-expected mortality ratios have been developed only on the basis of the UP-1984 Table without an)' set-forward or setback in age. The group is approximately 16 percent female.
For the nonretired group, the overall actual-to-expected mortality ratio dropped from 67 percent in 1970-74 to 61 percent in 1973-77. This apparent improvement may be due to a relatively higher female content as well as a general improvement in mortality. Data distributions for 1971, which were available by sex, showed relatively higher female con- tent at the younger ages. Even during the early retirement period, where there is an overlap with the retired group's experience from age 55 to age 65, the actual-to-expected mortality ratios are well below 100 per- cent. One reason for this is the handling of disability cases, which are excluded from both the nonretired and retired group experience.
As for the retired group experience beginning with age 65, the dis- ability cases are included and so are treated as a part of the nondisability experience. This is the only sizable experience for which the nonretired and retired groups are shown separately and then merged. Hence it was felt that this experience should be included for consideration. The down- ward trend, by age group, of the actual-to-expected ratios noted for older ages of other groups is not evident in this experience. The average annual rate of pensioner mortality improvement by amount since the 1970-74 period was more than 1½ times greater than the rate of improvement for pensioners of public utility companies. A change in the method of report- ing pensioner deaths that led to an underreporting of deaths in 1978 data, not shown here, possibly could have affected the reporting of 1977 deaths, but its effect, if an), is unknown at this time.

"I'AB1A,] 11
NONDISABILITY UNISI-;X EXPERIEN(2E tlt," A
L I G I l T : X I A N U F A C T U R I N G ( f O M P A N Y
AGE (~-ROU P
U nde r 25 . . . . . . 25-29 . . . . . . . . 3 0 3~ . . . . . . . . 35 39 . . . . . . . . 4 0 - 4 4 . . . . . . . . .
45-49 . . . . . . . . . 50-54 . . . . . . . .
55 59 . . . . . . . .
6 0 - 6 4 . . . . . . . . .
65-69 . . . . . . . . 70-74 . . . . . . . . 75-79 . . . . .
80-84 . . . . . . . .
85 89 . . . . . . . 90-94 . . . . . . . . .
95 and over . . . .
T o t a l . . . . .
:N~ ON RICTIRI*:D
lO70 74
A / E *
55% 62 60 62 58 76
D e a t h s
46 123 1 2 0 132 147 212 215 73
81 63
19l 96
" i . . . . . . .
; ?+o 5-5s2- - ;t+,o
I
197zb 77 1070 74
A / E , No, I A E* No A , E * No.
' " D e a t h s Dea t h s D e a t h s . . . . .
5 6 % 28 55 79 62 131 48 1 1 3 59 1 7 4 . . . 73 245 . . 59 222 . . . . . . . . . . . . 60 199 07 °7o 12 78~, 20 53 74 86 66 96 t 28
I 12 232 93 272 125 197 113 231
... ~ ~s3 .~.~ is6
. . 7 s 17 ~0 2~ . . . . . . . . . . . 125 11 l.~s 12
....... l ss 2 is4 2
1 , ~ 5 l l l % f l 767 101%f ')64
s ignif icant female conten t . * On basis of UP-198-1 T a b l e wi thou t a d j u s t m e n t , s ince tmtsex procedures were used and there is a t On basis of amoun t s , the comparab le r a t io is I 0 5 ~ for 1970-74 and 8 5 3 for 1073-77.
NONRETIRED AND RETIRED
1 9 7 0 - 7 4 1 9 7 3 - 7 7
No. A / E * D e a t h s
82% . . . . . . 2 0 3 ' 71 162
No. A ' E ' D e a t h s
' 7 0 , ~ . . . . 2 i 9 74' 202