Embed Size (px)
Citation preview
Pak. J. Bot., 54(2): DOI: http://dx.doi.org/10.30848/PJB2022-2(23)
TRANSCRIPTOME ANALYSIS OF SUCROSE SIGNAL TRANSDUCTION PATHWAY
IN ZHOUMAI 18 (TRITICUM AESTIVUM L.)
YA-LAN FENG
1,2†, BIN-BIN GUO
1,2†, CHAO MA
1,2*, DE-HUI SHENG
1,2, MENG-YUAN WANG
1,2, KE XV
3,
JUN ZHANG1,2
, SHUANG ZHOU1,2
AND MING-CAN CHEN1,2*
1College of Agriculture, Henan University of Science and Technology, Luoyang 471023, Henan province, P.R. China
2Dry-Land Agricultural Engineering Technology Research Center in Henan, Luoyang 471023, Henan province, P.R. China 3Department of Agriculture and Rural Affairs of Shanzhou District, Sanmenxia 472100, Henan province, P.R. China
*Corresponding author's email: [email protected]; [email protected]
†Authors contributed equally to this work
Abstract
Sucrose is the primary form of photosynthetic products in plants, not only constituting the carbon skeleton of plants,
but also the energy source for sink organs. In addition, sucrose could function as a signaling molecule and participates in
multiple biological processes. Palatinose, an isomer of sucrose, does not participate in sugar metabolism, but regulates sugar
signaling in plants. The utilization of palatinose could overcome the problem of the conversion between hexose and sucrose,
and is conducive to studying the perception and transmission pathways of sucrose signals. In this study, Illumina HiSeq
platform was used to perform transcriptome and expression profiling on wheat leaves treated with sucrose and palatinose,
respectively. Through comparative transcriptome analysis, we identified 4,174 common differentially expressed genes
(DEGs). According to bioinformatics analysis including functional annotation and pathway enrichment, these DEGs were
divided into four categories, namely signaling (587), plant hormone regulation (121), transcription factor (210) and
metabolic pathways (890). These DEGs were most likely related genes of the sucrose signal transduction pathway. This
study provides a new insight and theoretical foundation for the enrichment of the sucrose signal transduction pathway and
the elucidation of its mechanism of action.
Key words: Sucrose; Palatinose; Expression profiling; Functional annotation; Signal transduction.
Introduction
Sucrose, which is composed of glucose and fructose,
widely exists in the plant kingdom and could be
considered as the representative of sugar (Zhang et al.,
2013). As the main form of transportation of
photosynthetic products in plants, sucrose not only
consists of the carbon skeleton of plants, but also works
as an energy source of fruits, seeds, roots and other sink
organs. In addition, sucrose also functions as a signal
molecule to participate in signal transduction in plants,
which in turn affects growth, development and stress
response, including germination (Barbier et al., 2015),
root growth (Dümmer et al., 2016), fruit maturation (Lia
et al., 2019) and stress resistance (Zhao et al., 2017a).
However, whether sucrose is a real signaling molecule has
been controversial for a long time. Sucrose is different
from glucose which is a recognized signaling molecule,
and the effect of sucrose has been questioned, especially
in the hexokinase signaling pathway. The reason for this
question is that sucrose can be rapidly degraded into
glucose and fructose by invertase, and therefore, it is
difficult to confirm whether sucrose itself or its
degradation products are involved in the signal
transduction process. However, Dümmer et al., (2016)
used the Arabidopsis ehb1 mutant, which exhibited
abnormal geotropism and phototropism, to confirm the
signal transduction function of sucrose. The upstream
promoter region of EHB1 had sucrose and light-
responsive elements, so after exogenous addition of
sucrose, the phenotype of the ehd1 mutant was restored.
Furthermore, sucrose is a crucial signaling molecule
during plant growth and development. Exogenous
addition of sucrose can upregulate the expression of auxin
synthesis genes, which are quite critical for the growth of
young shoots. The growth as well as differentiation of
buds also depends on the concentration of sucrose
(Barbier et al., 2015). Sucrose can also regulate fruit
ripening. Exogenous application of sucrose could increase
the glucose, fructose and sucrose contents in strawberry
fruits and regulate the accumulation of anthocyanins (Lia
et al., 2019). Although increasing number of studies have
confirmed the signal transduction function of sucrose, its
specific signal transduction pathway and mechanism are
still unrevealed.
Palatinose (6-O-2-D-glucopyranosyl-D-fructose),
also known as isomaltulose, is the isomers of sucrose
and consists of glucose and fructose, which are
combined with α-1, 6 glycosidic bond. Previous studies
have confirmed that palatinose can neither be recognized
by plant sucrose transporters (SUT), nor can be cleaved
by enzymes in plants to participate in sugar metabolism.
However, it can regulate sugar signaling pathway in
plants (Atanassova et al., 2003; Huang et al., 2015).
Fructokinase-like protein2 (FLN2) is a component of
plastid-encoded plastid RNA polymerase (PEP)
complex, whose activity is crucial for the green
phenotype of Arabidopsis. Arabidopsis fln2-4 mutant
plants could not grow green true leaves and still showed
albino leaves when grown on the nutrient medium
containing palatinose without sucrose. This phenotype is
the same as fln2 grown on sugar-free MS medium.
However, the medium containing sucrose shows a
delayed green phenotype, indicating that palatinose
cannot provide energy for the growth of the mutant
(Huang et al., 2015). Vitis vinifera Hexose Transporter
YA-LAN FENG ET AL., 2
1(VvHT1) encodes a hexose transporter during grape
ripening which could be induced by both sucrose as well
as palatinose during cell culture. Since palatinose can
hardly be transported, its effect may be mediated by a
sensor located in the plasma membrane (presumably a
sucrose sensor). These results indicate that sucrose and
its isomer palatinose may participate in the common
sugar sensing mechanism, but the sugar signaling
pathway is different, that is, the activity of VvHT1
promoter is activated through two independent signaling
pathways, i.e. hexose pathway and sucrose pathway
(Barbier et al., 2015).
Sucrose and its degradation products are all involved
in the carbon metabolism of plants. Therefore, it is not
easy to study the perception of sucrose as a specific signal
molecule, and the relationship between the perception of
sugar signals and sugar metabolism has become the
enormous obstacle to the research of sugar signaling
pathways. After sucrose is degraded, glucose and fructose
molecules can be detected by hexose sensors, and most
plant tissues can easily synthesize sucrose after feeding
hexose. The application of non-metabolizable or non-
cleavable sugars would overcome the problem of mutual
conversion between hexose and sucrose, in order to
investigate the perception and transmission pathways of
sucrose signals in this study, the Illumina HiSeq platform
was employed to sequence the transcriptome and
expression profiling on wheat leaves treated with sucrose
and palatinose, respectively. A large number of related
genes involved in the sucrose signal transduction pathway
were identified via comparative transcriptome analysis,
providing a theoretical basis for the improvement of the
sucrose signal transduction pathway and the elucidation
of its mechanism of action.
Materials and Methods
Plant materials, growth conditions and treatment:
Wheat cultivar Zhoumai 18 was taken as the experimental
material. Uniform and full-grained wheat grains were
chosen and disinfected. After being soaked in sterile water
for 12 h, the seeds were placed on the floating net, and
germinated for 3 d in the artificial growth chamber under
the constant temperature 25°C and in dark, and then
transplanted after being illuminated for 1 d. The wheat
seedlings with uniform growth were transplanted on the
floating plate for hydroponic cultivation. The volume of
hydroponic plastic box is 2 L, which could be
transplanted with 40 wheat plants. The hydroponic
nutrient solution was Hoagland culture solution (pH
6.6~6.8), which was replaced every 3 days. The nutrient
solution needed to be ventilated for 30 mins every day.
The culture photoperiod was 16h/8h (day/night), and the
temperature was 25°C/20°C (day/night). The treatment
began when the wheat seedlings grew to 2-leaves stage,
including CK (Hoagland nutrient solution), sucrose
(Hoagland nutrient solution + 1 mmol/L sucrose) and
palatinose (Hoagland nutrient solution + 1mmol/L
palatinose).Three days after treatment, samples were
taken for RNA sequencing analysis.
RNA isolation and qualification: In terms of the
description of Lia et al., (2019), the total RNA was
isolated and reversely transcribed. RNA concentration
was perceived by Nano Drop 2000 (Thermo Scientific).
The integrity of RNA was assessed via the RNA Nano
6000 Assay Kit of the Agilent Bioanalyzer 2100 system
(Agilent Technologies, CA, USA).
Library preparation, clustering and sequencing: A
total of 1 μg RNA from each sample was used as input
material for the RNA sample preparations. Sequencing
libraries were generated using NEB Next Ultra TM RNA
Library Prep Kit for Illumina (NEB, USA) following
manufacturer’s specification and index codes were
added to attribute sequences to each sample. The library
quality was assessed through the Agilent Bioanalyzer
2100 system (Agilent Technologies, CA, USA). Most
raw data quality could reach or exceed Q30. Before
conducting data analysis, the sufficient quality of these
reads needed to be ensured to guarantee the accuracy of
subsequent analysis. Biomarker Technologies
Corporation performed strict quality control on the data,
using the following filtering procedures. (1) Removed
the reads containing connectors; (2) Removal of low-
quality reads (including the removal of reads whose
proportion of N is higher than 10%; the removal of bases
with a quality value of Q≤10 accounts for more than
50% of the entire reads). The clustering of the index-
coded samples was performed on a cBot Cluster
Generation System by Tru Seq PE Cluster Kit v4-cBot-
HS (Illumina) according to the manufacturer’s
instructions. After clustering, the library was sequenced
on an Illumina Hiseq Xten platform and paired-end
reads were generated.
Data processing: The Illumina sequencing data were
processed further and analyzed by the Biomarker
Technologies Corporation. Based on the reference genome,
only these reads with a perfect match or one mismatch
would be further analyzed and annotated. The software
Tophat2 tool was used to map with reference genome.
Bioinformatics analysis: During the detection process
of differentially expressed genes (DEGs), fold change ≥
2 and false discovery rate (FDR) <0.01 were adopted as
screening criteria. Fold change represented the ratio of
expression between the two samples. The FDR was
obtained by correcting the p-value of the significance of
the difference. Since the differential expression analysis
of transcriptome sequencing is an independent statistical
hypothesis test for a large number of gene expressions,
there might be false positive problems. Therefore, in the
process of differential expression analysis, the accepted
Benjamini-Hochberg correction method was used to
correct the original hypothesis, and the significant p-
value obtained through the test was corrected, and FDR
was finally used as the key indicator for screening DEGs.
Gene function was annotated based on the following
databases: NCBI non-redundant protein sequences (Nr);
NCBI non-redundant nucleotide sequences (Nt);
GENES RELATED TO SUCROSE SIGNAL TRANSDUCTION IN WHEAT 3
Protein family (Pfam);Clusters of Orthologous Groups
of Proteins (KOG/COG); The manually annotated and
reviewed protein sequence database Swiss-Prot;KEGG
Ortholog database (KO); Gene Ontology (GO). GO
enrichment analysis of the genes with differential
expression was implemented by the GO seq R packages
based on Wallenius non-central hyper-geometric
distribution, which can adjust gene length bias in DEGs.
KEGG is a database resource for understanding high-
level functions and utilities of the biological system, like
the cell, the organism and the ecosystem, from
molecular-level information, especially large-scale
molecular datasets generated by genome sequencing and
other high-throughput experimental technologies
(http://www.genome.jp/kegg/). The KOBAS software
was used to detect the statistical enrichment of DEGs in
KEGG pathways.
qRT-PCR validation: Eight DEGs were selected to test
the expression level through qRT-PCR. The reaction
system and PCR procedures depend on the description of
Feng et al., (2019). The fold variation was calculated by
2-△△Ct
method (Livak & Schmittgen 2001). Take β-actin as
internal control.
Results
Transcriptome data acquisition, quality control and
identification of DEGs: Based on sequencing by
synthesis (SBS) technology, the Illumina HiSeq high-
throughput sequencing platform sequenced cDNA
libraries and produced a large amount of high-quality
data. Biomarker Technologies Corporation performed
strict quality control on the data. After the quality
control, 46 Gb high-quality clean data were obtained.
The indexes including clean reads and clean bases are
shown in (Table 1). The Q30 base percentage of each
sample was not lower than 87.66%. Gene expression
has temporal and spatial specificity. In the two
different conditions, genes or transcripts with
significantly different expression levels are called
DEGs. 10,152 and 10,441 DEGs were obtained from
sucrose and palatinose treated samples, respectively.
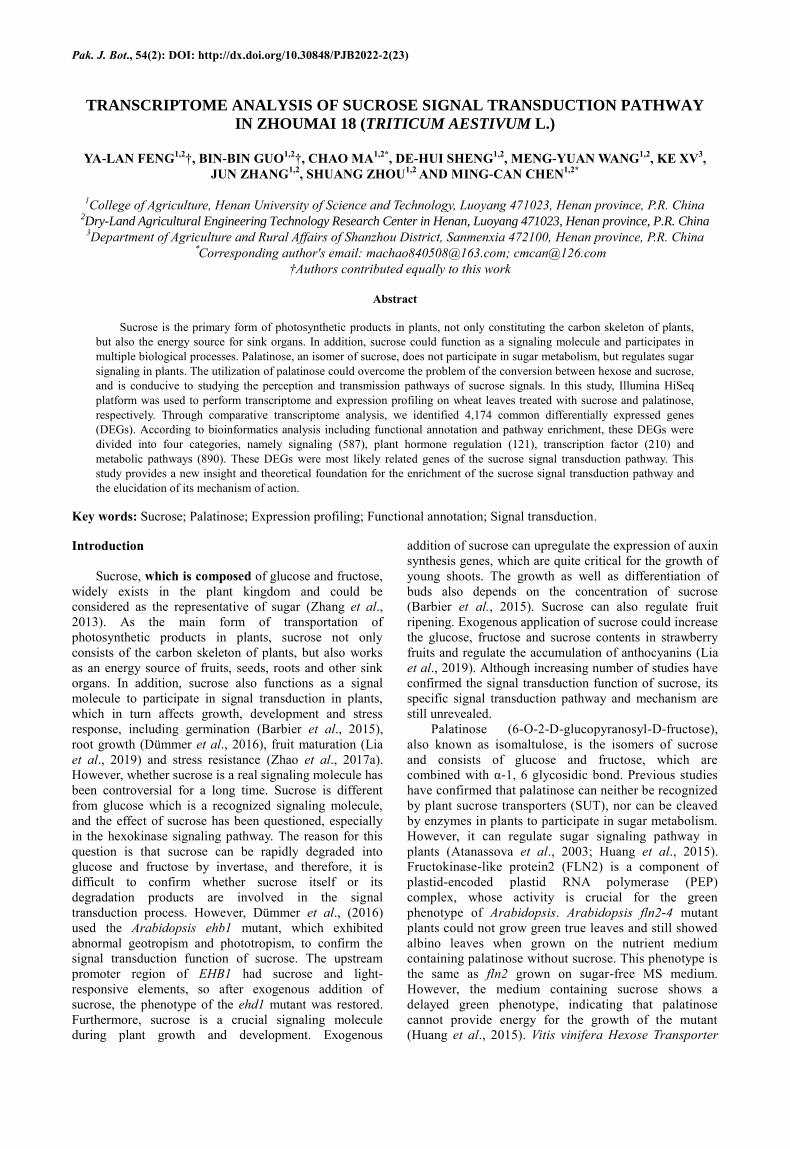
Under sucrose treatment, there were 1,160 and 8,992
DEGs up-regulated and down-regulated, respectively,
while palatinose treatment had 3,846 and 6,595 DEGs
up-regulated and down-regulated, separately (Fig. 1).
After further comparison and analysis of the DEGs
under the two treatments, 121 DEGs were up-regulated
and 4,053 DEGs were down-regulated (a total of 4,174
common DEGs). The down-regulated genes were far
more high in number than up-regulated genes under
these two treatments, which might indicate that there
were more negative regulatory patterns in the sucrose
and palatinose signaling pathways. Because palatinose
cannot participate in metabolism, it is more used as a
signaling molecule (Atanassova et al., 2003; Huang et
al., 2015), which could exclude some genes involved in
metabolism under sucrose treatment. Therefore, the
shared part of the two treatments is the focus of our
subsequent analysis and research.
Table 1. Statistics of RNA-seq data.
Samples Clean
reads Clean bases
GC
content %≥Q30
CK 82,939,265 24,773,709,458 56.81% 88.32%
Sucrose 46,208,811 13,769,352,624 56.63% 87.66%
Palatinose 31,177,051 9,320,856,688 55.58% 91.24%
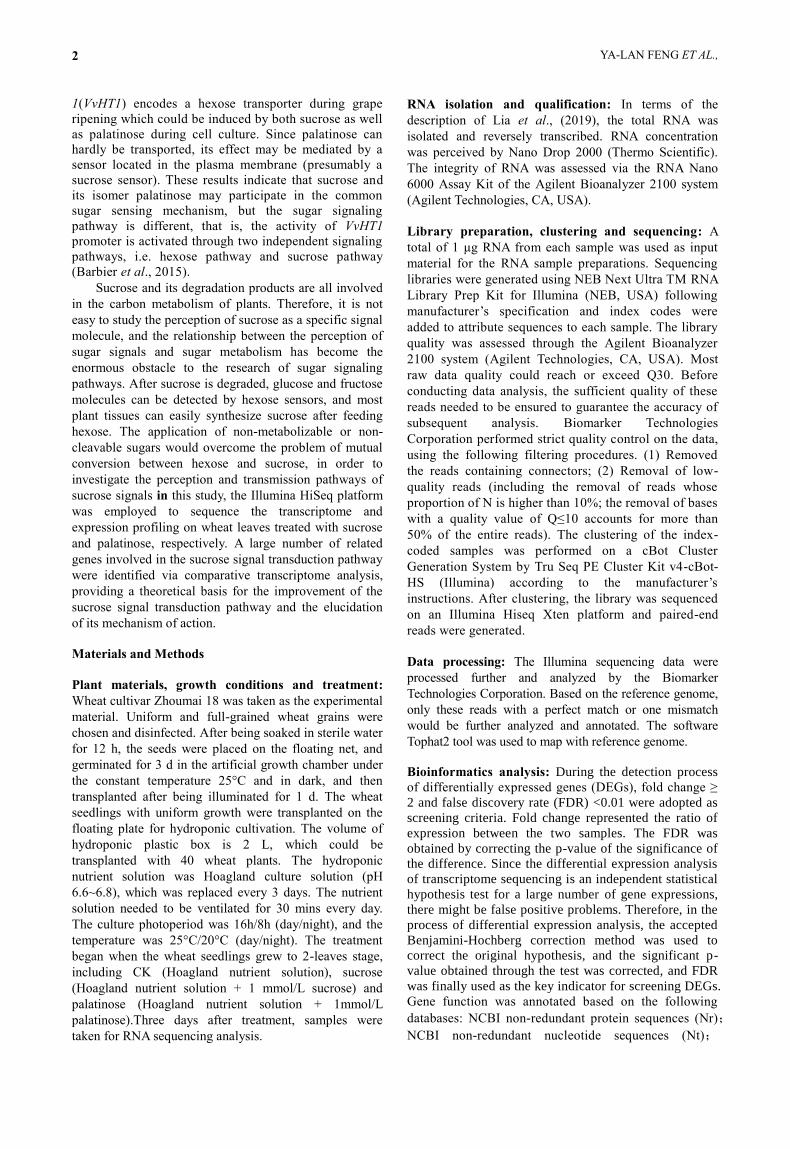
Bioinformatics analysis of common DEGs: The GO
database was a structured standard biological annotation
system constructed by the GO Organization (Gene
Ontology Consortium) in 2000. It aims to establish a
standard vocabulary system for knowledge of genes and
their products, which is applicable to various species. The
GO annotation system is a directed acyclic graph, which
contains three main branches, namely: Biological Process,
Molecular Function and Cellular Component. The GO
analysis and statistical results of the common DEGs under
the two treatments are shown in (Fig. 2). These shared
genes were mainly concentrated in catalytic activity and
binding (Molecular Function), cell part and cell (Cellular
Component), metabolic process, cellular process and
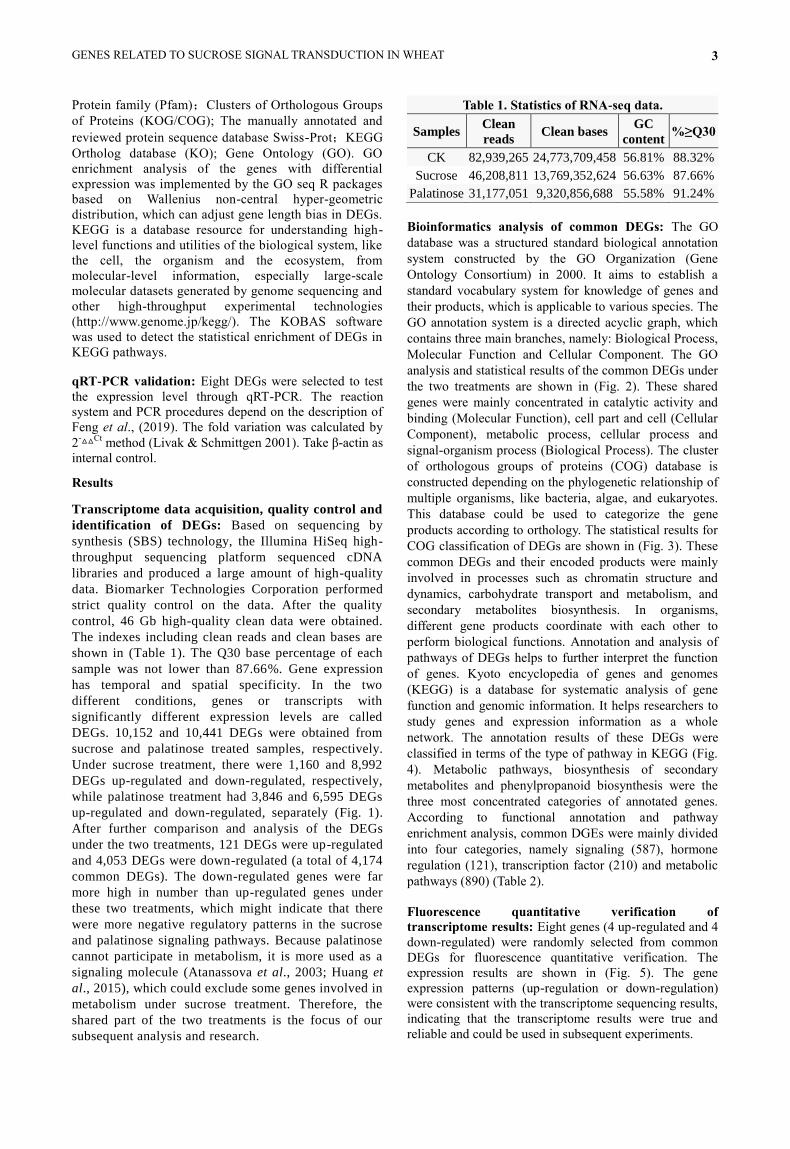
signal-organism process (Biological Process). The cluster
of orthologous groups of proteins (COG) database is
constructed depending on the phylogenetic relationship of
multiple organisms, like bacteria, algae, and eukaryotes.
This database could be used to categorize the gene
products according to orthology. The statistical results for
COG classification of DEGs are shown in (Fig. 3). These
common DEGs and their encoded products were mainly
involved in processes such as chromatin structure and
dynamics, carbohydrate transport and metabolism, and
secondary metabolites biosynthesis. In organisms,
different gene products coordinate with each other to
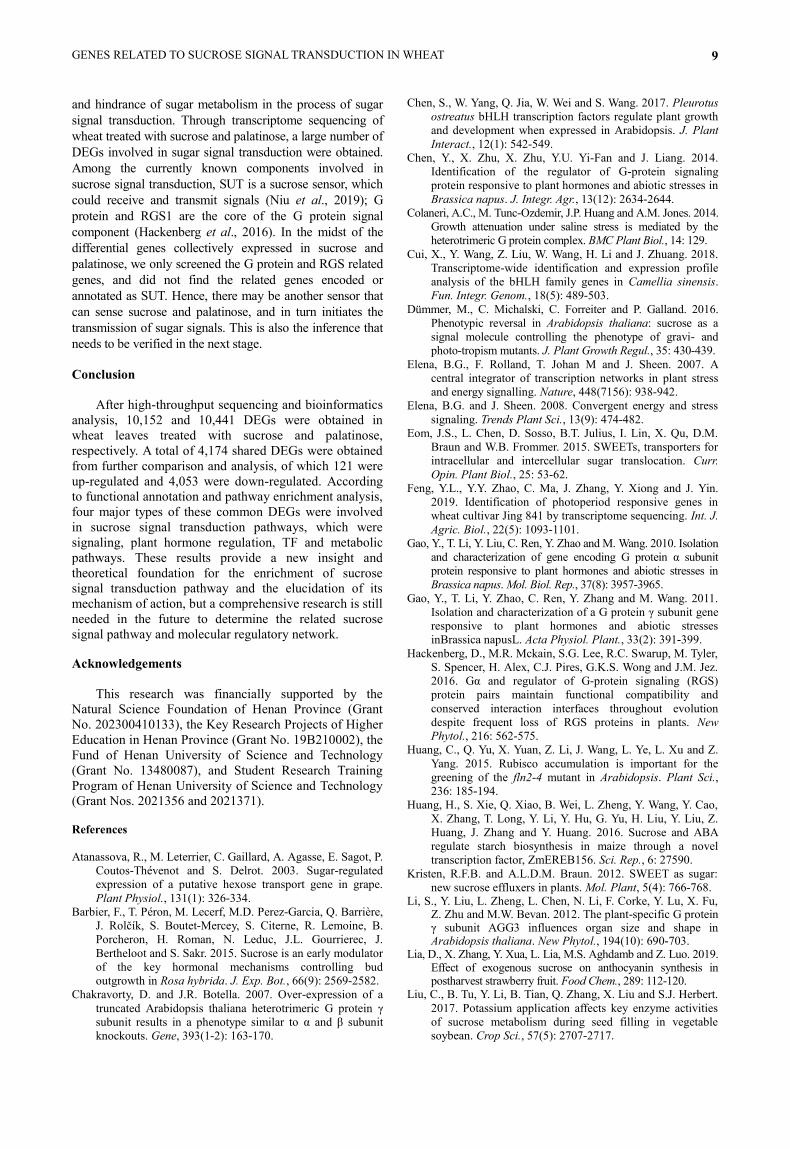
perform biological functions. Annotation and analysis of
pathways of DEGs helps to further interpret the function
of genes. Kyoto encyclopedia of genes and genomes
(KEGG) is a database for systematic analysis of gene
function and genomic information. It helps researchers to
study genes and expression information as a whole
network. The annotation results of these DEGs were
classified in terms of the type of pathway in KEGG (Fig.
4). Metabolic pathways, biosynthesis of secondary
metabolites and phenylpropanoid biosynthesis were the
three most concentrated categories of annotated genes.
According to functional annotation and pathway
enrichment analysis, common DGEs were mainly divided
into four categories, namely signaling (587), hormone
regulation (121), transcription factor (210) and metabolic
pathways (890) (Table 2).
Fluorescence quantitative verification of
transcriptome results: Eight genes (4 up-regulated and 4
down-regulated) were randomly selected from common
DEGs for fluorescence quantitative verification. The
expression results are shown in (Fig. 5). The gene
expression patterns (up-regulation or down-regulation)
were consistent with the transcriptome sequencing results,
indicating that the transcriptome results were true and
reliable and could be used in subsequent experiments.

YA-LAN FENG ET AL., 4
Fig. 1. Venn diagram shows number of DEGs under sucrose and palatinose treatments. (I) number of up-regulated genes in A1 (Suc)
and B1 (P); (II) number of downregulated genes in A2 (Suc) and B2 (P). C1, the common DEGs of A1 and B1; C2, the common
DEGs of A2 and B2. Suc, Sucrose; P, Palatinose.
Fig. 2. GO classification of common DEGs under sucrose and palatinose treatments.
Discussion
Sucrose is not only the main form of assimilation
products of photosynthesis between "source" and "sink",
but also can be used as a signal molecule to participate in
the growth as well as development of plants and respond to
adversity through complex regulatory mechanisms.
Currently known genes involved in sucrose signal
transduction include sucrose will eventually be exported
transporter (SWEET), sucrose transporter (SUT), regulator
of G protein signaling 1 (RGS 1), hexokinase (HXK),
sucrose non-fermentation 1 related protein kinase (SnRK1)
and some related transcription factors (TFs).
Sucrose is the primary carbohydrate transported in
higher plants (Wind et al., 2010), and exerts a significant
role in many physiological processes. The SWEETs protein
is a family of sugar transporter discovered later, which can
promote the diffusion of sucrose across the cell membrane

GENES RELATED TO SUCROSE SIGNAL TRANSDUCTION IN WHEAT 5
to the apoplast in a concentration gradient (Kristen &
Braun 2012). When the expression of IbSWEET10 was
inhibited in sweet potatoes, the low sucrose concentration
under tissue culture conditions would cause the decrease of
fresh weight in RNAi plants. At high sucrose
concentrations, the difference in fresh weight between
RNAi plants and controls was not significant. One reason
might be that the silenced expression of IbSWEET10
resulted in the output of sucrose in the source tissue (leaf)
to be restricted, which is not conducive to plant growth.
However, when the supply of sucrose is sufficient, the
silently expressed plants could obtain enough sucrose from
the medium for growth. The activity of SWEET is
regulated by the feedback of its substrate, thus, when the
supply of exogenous sucrose is sufficient, its expression is
down-regulated accordingly (Eom et al., 2015). In this
study, three of the genes collectively expressed in sucrose
and palatinose were annotated as SWEET, and their
expressions were all down-regulated, consistent with the
characteristics of SWEET protein, which further
demonstrated that palatinose could participate in sucrose
signaling pathway as a signaling molecule.
The SnRK1 in plants is homologous to yeast sucrose
non-fermenting-1 (SNF1) and mammalian AMP-activated
protein kinase (AMPK), which are energy receptors that
can be activated by energy deficiency. SnRK1 could retard
the growth as well as development in plants by inhibiting
the biosynthetic enzymes, whose activities are related to
carbon and nitrogen metabolism (Luo et al., 2018) and can
also affect metabolism, signal transduction, transcription,
and stress tolerance (Elena et al., 2007; Elena & Sheen
2008; Zhao et al., 2017b). In this experiment, the three
genes annotated as SnRK1 were down-regulated under the
treatment of exogenous sucrose and palatinose, and their
activities were suppressed, which was beneficial to the
growth of plants. G protein functions critically in regulating
numerous signaling pathways in eukaryotes kingdom,
whose core part is composed of a Gα, a Gβ and a Gγ
protein. Studies on plant G protein adopting gene knockout,
overexpression lines and mutants confirmed that G protein
was involved in nearly every aspect of plant life activities,
including regulating growth and development, cross-talk
with environmental and hormone signals, and responding
diverse stresses (Sona et al., 2006; Chakravorty & Botella
2007; Steffens & Sauter 2010; Li et al., 2012; Magdalena et
al., 2012; Liu et al., 2013). The RGS proteins family has a
vital role in signal transduction of G protein coupled
receptor (GPCR) by activating Gα subunits as well as
accelerating GTP hydrolysis. RGS proteins family is the
central interaction factor and regulator of Gα protein, and
the interaction between RGS and Gα proteins is
evolutionarily conserved among different species, including
plants, animals and humans (Hackenberg et al., 2016). G
protein and its interaction effectors are widely involved in
plant growth, development and stress response. Liu et al.,
(2013) cloned 6 genes encoding G protein signaling
pathway components from Morus atropurpurea. The
expression of G protein encoding genes could be induced
by PEG and NaCl under low temperature, but it would be
down-regulated by high temperature, resembling to the
results in Brassica napus and rice (Gao et al., 2010; Gao et
al., 2011; Yadav et al., 2013; Yadav et al., 2014; Xu et al.,
2018). The expression of MaRGS was upregulated by
NaCl, while it was suppressed by low temperature and high
temperature. This contradicts the results of Brassica napus
(Chen et al., 2014). In our transcriptome data, 6 G protein
genes and 13 RGS protein genes were screened, and their
expressions were all down-regulated. On one hand, the
reason might be that the treatment of exogenous sucrose
and palatinose did not only activate the stress response, but
also provided enough energy supply for plant growth. On
the other hand, it may be related to the functional
complexity of G protein and RGS. A previous study also
showed that salt stress could activate the G protein
signaling pathway, which in turn increased the salt
tolerance of plants (Colaneri et al., 2014). In addition, the
G protein signaling pathway can also interact or cross with
hormone signaling molecules such as ABA and some TFs
like bZIP and WRKY to regulate development and stress
response in plant (Wang et al., 2018b; Wu et al., 2020).
Fig. 3. COG classification of common DEGs under sucrose and palatinose treatments.

YA-LAN FENG ET AL., 6
Fig. 4. KEGG function classification of common DEGs under sucrose and palatinose treatments.
Fig. 5. Validation of the relative expression for 8 chosen common DEGs via qRT-PCR. Suc-qPCR, qPCR verification of sucrose
treatment; P-qPCR, qPCR verification of palatinose treatment; Suc-HiSeq, transcriptional result of sucrose treatment; P-HiSeq,
transcriptional result of palatinose treatment.

GENES RELATED TO SUCROSE SIGNAL TRANSDUCTION IN WHEAT 7
Table 2. Functional classification of major common DEGs (some representative genes).
Function categories
DEG ID Expression level
Functional annotation/pathway enrichment Suc_log2FC P_log2FC
Signaling
TraesCS2D01G551600a 4.69 5.46 Signal transduction mechanisms TraesCS7D01G005200 2.89 2.26 Signal transduction mechanisms TraesCS3A01G237400 1.56 1.40 Signal transduction mechanisms TraesCS5B01G094600 -7.91 -6.60 Signal transduction mechanisms TraesCS1D01G115400 -8.28 -6.94 Signal transduction mechanisms TraesCS1D01G115400 a -8.28 -6.94 Signal transduction mechanisms
Hormone regulatin
TraesCS3D01G401400 a 3.57 3.01 Gibberellin 20 oxidase 2 [Aegilops tauschii] TraesCS3A01G406200 2.62 1.97 Gibberellin 20 oxidase 2 [Aegilops tauschii] TraesCS4A01G398300 3.80 3.65 auxin polar transport TraesCS7A01G536900 3.11 2.39 cytokinin oxidase/dehydrogenase 3 [Triticum aestivum] TraesCS7A01G536900 3.11 2.39 cytokinin oxidase/dehydrogenase 3 [Triticum aestivum] TraesCS7A01G536900 3.11 2.39 cytokinin oxidase/dehydrogenase 3 [Triticum aestivum] TraesCS5D01G228400 2.65 2.02 Auxin-induced protein 5NG4 [Aegilops tauschii] TraesCS3B01G578400 -2.51 -2.06 ABA/WDS induced protein TraesCS3D01G038900 -2.66 -2.14 response to ethylene TraesCS6B01G274500 -3.10 -2.37 PREDICTED: ethylene-responsive transcription factor TraesCS1D01G369400 -3.14 -2.38 ABA-inducible protein PHV A1 TraesCS6B01G355700 -3.17 -2.41 ACC oxidase [Triticum aestivum] TraesCS3B01G612000 -3.35 -2.50 response to ethylene TraesCS4D01G005400 -5.03 -3.81 Cytokinin-O-glucosyltransferase 1 [Aegilops tauschii] TraesCS7A01G056100 -5.21 -3.96 Cytokinin-O-glucosyltransferase 2 [Aegilops tauschii] TraesCS6A01G335900 -6.26 -4.76 response to gibberellin TraesCS7A01G190600 -6.44 -4.91 auxin transporter PIN1 [Triticum aestivum] TraesCS4D01G005300 -6.50 -4.95 Cytokinin-O-glucosyltransferase 1 [Aegilops tauschii] TraesCS7D01G191600 -7.47 -6.10 auxin transporter PIN1 [Triticum aestivum] TraesCS7A01G426600 a -7.93 -6.63 response to gibberellin
TF
TraesCS2B01G517400 a 4.40 4.31 WRKY45-like transcription factor [Triticum aestivum] TraesCS2B01G517400 4.40 4.31 WRKY45-like transcription factor [Triticum aestivum] TraesCS7A01G305200 3.49 2.80 NAC transcription factor [Triticum aestivum] TraesCS1B01G374900 3.37 2.65 hypothetical protein F775_52480 [Aegilops tauschii] TraesCS2A01G489500 3.17 2.41 WRKY45-like transcription factor [Triticum aestivum] TraesCS2A01G489500 3.17 2.41 WRKY45-like transcription factor [Triticum aestivum] TraesCS7D01G345700 2.98 2.33 WRKY11 transcription factor, partial [Triticum aestivum] TraesCS7D01G345700 2.98 2.33 WRKY11 transcription factor, partial [Triticum aestivum] TraesCS2D01G274600 -3.83 -2.77 Transcription factor bHLH62 [Aegilops tauschii] TraesCSU01G075200 -4.74 -3.52 Transcription factor bHLH19 [Triticum urartu] TraesCS3D01G105100 -5.10 -3.85 Transcription factor bHLH51 [Triticum urartu] TraesCS4A01G404700 -6.24 -4.74 Transcription factor bHLH96-like [Oryza brachyantha] TraesCS3A01G293700 -6.91 -5.34 bZIP transcription factor TraesCS5A01G143300 -6.92 -5.37 bZIP transcription factor TraesCS5A01G143300 -6.92 -5.37 bZIP transcription factor TraesCS5A01G143300 -6.92 -5.37 bZIP transcription factor TraesCS4D01G302700 -7.53 -6.22 Transcription factor bHLH96-like [Oryza brachyantha] TraesCS4A01G016600 -7.75 -6.37 Transcription factor bHLH96 TraesCS2B01G329300 -7.81 -6.45 Histone-like transcription factor (CBF/NF-Y) TraesCS1D01G039900 -7.93 -6.64 Histone-like transcription factor (CBF/NF-Y) TraesCS6B01G049000 -8.17 -6.86 Histone-like transcription factor (CBF/NF-Y) TraesCS1D01G039800 -8.38 -7.15 Histone-like transcription factor (CBF/NF-Y) TraesCS4B01G287600 -8.53 -7.35 sequence-specific DNA binding transcription factor activity TraesCS3A01G102400 -8.55 -7.39 Histone-like transcription factor (CBF/NF-Y) TraesCS1A01G038200 a -9.60 -8.85 Histone-like transcription factor (CBF/NF-Y)
Metabolic pathways
TraesCS7A01G056200 a 3.77 3.48 Carbohydrate transport and metabolism TraesCS5A01G181500 3.25 2.55 Carbohydrate transport and metabolism TraesCS2A01G175400 3.17 2.41 Carbohydrate transport and metabolism TraesCS2B01G194200 2.64 1.99 Starch and sucrose metabolism TraesCS4B01G344800 2.28 1.76 Secondary metabolites biosynthesis, transport and catabolism TraesCS2B01G236200 2.01 1.64 Starch and sucrose metabolism TraesCS7D01G071200 1.94 1.61 Carbohydrate transport and metabolism TraesCS2B01G613500 -8.30 -6.98 Carbohydrate transport and metabolism TraesCS6A01G250300 -8.43 -7.17 Carbohydrate transport and metabolism TraesCS2A01G590600 -8.51 -7.28 Secondary metabolites biosynthesis, transport and catabolism TraesCS6A01G138000 -8.52 -7.29 Carbohydrate transport and metabolism TraesCS3D01G031800 -8.55 -7.36 Carbohydrate transport and metabolism TraesCSU01G036600 -8.60 -7.44 Carbohydrate transport and metabolism TraesCS6A01G185100 -8.65 -7.50 Secondary metabolites biosynthesis, transport and catabolism TraesCS6D01G232100 -9.30 -8.44 Carbohydrate transport and metabolism TraesCS2B01G599800 a -9.72 -9.03 Carbohydrate transport and metabolism
a genes validated by qRT-PCR

YA-LAN FENG ET AL., 8
Wang et al., (2018a) analyzed the castor seeds treated
with sucrose and mannose by transcriptome technology and
found that in addition to metabolic pathways, sucrose
treatment also specifically affected auxin, brassinolide,
cytokinin, etc. hormone signaling pathway. It is believed
that sucrose signaling pathway may influence the
development of castor seed through multiple hormone
signaling pathways such as auxin. Auxin has always been
regarded as the core regulator of apical dominance. The
accepted explanation is that the indole acetic acid (IAA)
synthesized by the shoot tip is transported down the stem to
the lateral bud and inhibits the latter's germination.
Artificially increasing the plant sucrose level can suppress
the expression of the TF BRANCHED1 (BRC1) that
regulates apical dominance and causes rapid bud
germination. In consequence, increasing sugar supply is
necessary for the removal of lateral bud inhibition deriving
from apical dominant. Research works have demonstrated
that the interaction of sugar with hormones depended on its
concentration. The antagonistic effect of sugar and ABA
was observed in Arabidopsis thaliana seeds treated with 30
mM sucrose. On contrary to the promotion of low
concentrations of sugar and ABA, high concentrations of
sucrose (> 200 mM) would delay germination and the
following seedling growth, but they could promote
anthocyanin accumulation. It is speculated that the low
concentration of exogenous sugar can alleviate the
metabolic obstacles caused by ABA and promote
germination by providing energy and nutrition. Exogenous
application of gibberellin (20 µM) can inhibit the sucrose-
induced anthocyanin synthesis pathway in Arabidopsis,
while ABA (5 µM) interacts with sucrose (90 mM)
synergistically, and the induction of sucrose is not only
induced by ABA, indicating that there might be cross-talk
or intersection between sucrose and phytohormone
signaling pathway. Liu et al., (2017) found that during the
maturation of soybean (Glycine max) seeds, the sucrose
content in the seeds was inversely proportional to the ABA
content. Sucrose also negatively regulates the ethylene
content or signaling pathways in plants. A large amount of
ethylene is released during the senescence of cut flowers,
and the addition of sucrose to nutrition is a common
method to delay the senescence of cut flowers (Shi et al.,
2015). These above conclusions confirm the interaction
effect between sucrose and phytohormone, and the specific
methods (antagonism, synergy, cross-talk) are related to
sucrose concentrations, hormone type, growth stage, tissues
and organs. In this study, a total of 121 common DEGs
were annotated as phytohormone response elements or
pathways, and most of which them were down-regulated,
which revealed that low concentrations of sucrose and
palatinose could promote plant growth and reduce or
alleviate ABA-induced growth disorders, as well as the
apical dominance of auxin regulation.
In addition to the aforementioned SnRK1, basic leucine zipper (bZIP) TFs are also typical representatives of low energy responses in plants. The members of bZIP family (bZIP11 has been confirmed to participate in this process) control the growth of root meristems by directly activating IAA3/SHY2 transcription, which is a key negative regulator of root growth (Weiste et al., 2017). As a result, SnRK1 and bZIP, which were activated via low-
energy, could balance the relationship between growth and cellular energy resources in plants. In our study, 28 genes annotated as bZIP were down-regulated in the similar way as SnRK1, indicating that sufficient energy supply inhibited the expression of these signaling molecules, which was conducive to plant growth. Huang et al., (2016) performed RNA and small RNA sequencing in corn endosperm treated with sucrose, and obtained 47 TFs (including WRKY, bHLH, and MYB, etc.) in response to sucrose induction and 214 differentially expressed miRNAs (24 known and 190 novel). Most target mRNAs of these miRNA are annotated as TFs. Therefore, in the process of sucrose signal transduction, there may be a mode of interaction among miRNA, TFs and sucrose. Furthermore, Sun et al., (2003) isolated the SUSIBA2 from barley, which was involved in the sugar signaling of barley and belonged to the WRKY TF family. SUSIBA2 mainly expresses in endosperm, but it can also ectopically express in sucrose-treated leaves, demonstrating that its transcription could be induced by sugar. Sucrose could likewise induce high expression of AtWRKY20 in Arabidopsis leaves, and then activate the transcriptional activity of the ApL3 gene encoding sugar-induced AGPase large subunit(Nagata et al., 2012). Previous studies have shown that WRKY family has various members, which can act as both suppressors and activators in plant growth and development, stress response and other processes. TF family basic helix-loop-helix (bHLH) presents in almost all eukaryotes, and their diverse functions vary with species. Ectopic expression of different members of the Pleurotus ostreatus bHLH in Arabidopsis thaliana leads to different results. The growth and development could be inhibited by the ectopic expression of PobHLH5 or PobHLH8, while the transgenic plants expressing PobHLH1 and PobHLH2 had almost no difference in morphology from wild type(Chen et al., 2017). Among the TFs, which responded to sucrose induction, and sequenced from the corn endosperm transcriptome mentioned above, most members of the bHLH family were highly induced by sucrose. However, the expression of ZmbHLH171 was suppressed under the combination of sucrose and ABA (Huang et al., 2016). Moreover, leaf development transcriptome sequencing results of Camellia sinensis L. showed that the majority of bHLH genes were up-regulated during leaf development, whereas only two were down-regulated (Cui et al., 2018). The seven genes annotated as bHLH in this study were all down-regulated (bHLH19, 2, 49, 51, 62, 96, 135), which could be related to the concentration of exogenous sugar treatment and the sampling location. High concentrations of sucrose could cause osmotic stress to the plant, which in turn activates the stress response (Mishra & Singh 2016). Whereas, even the expression of the same gene in the source and sink tissues may be different. Consequently, these selected TFs may participate in sucrose signal transduction in diverse modes of action.
It is not easy to study the function of sucrose as a
specific signal molecule, because sucrose is rapidly
metabolized into glucose and fructose molecules in the
organism. However, most plant tissues can easily synthesize
sucrose after feeding hexose, so the signal transduction
effect of hexose or sucrose cannot be directly clarified. The
non-metabolizable palatinose can overcome the interference
GENES RELATED TO SUCROSE SIGNAL TRANSDUCTION IN WHEAT 9
and hindrance of sugar metabolism in the process of sugar
signal transduction. Through transcriptome sequencing of
wheat treated with sucrose and palatinose, a large number of
DEGs involved in sugar signal transduction were obtained.
Among the currently known components involved in
sucrose signal transduction, SUT is a sucrose sensor, which
could receive and transmit signals (Niu et al., 2019); G
protein and RGS1 are the core of the G protein signal
component (Hackenberg et al., 2016). In the midst of the
differential genes collectively expressed in sucrose and
palatinose, we only screened the G protein and RGS related
genes, and did not find the related genes encoded or
annotated as SUT. Hence, there may be another sensor that
can sense sucrose and palatinose, and in turn initiates the
transmission of sugar signals. This is also the inference that
needs to be verified in the next stage.
Conclusion
After high-throughput sequencing and bioinformatics
analysis, 10,152 and 10,441 DEGs were obtained in
wheat leaves treated with sucrose and palatinose,
respectively. A total of 4,174 shared DEGs were obtained
from further comparison and analysis, of which 121 were
up-regulated and 4,053 were down-regulated. According
to functional annotation and pathway enrichment analysis,
four major types of these common DEGs were involved
in sucrose signal transduction pathways, which were
signaling, plant hormone regulation, TF and metabolic
pathways. These results provide a new insight and
theoretical foundation for the enrichment of sucrose
signal transduction pathway and the elucidation of its
mechanism of action, but a comprehensive research is still
needed in the future to determine the related sucrose
signal pathway and molecular regulatory network.
Acknowledgements
This research was financially supported by the
Natural Science Foundation of Henan Province (Grant
No. 202300410133), the Key Research Projects of Higher
Education in Henan Province (Grant No. 19B210002), the
Fund of Henan University of Science and Technology
(Grant No. 13480087), and Student Research Training
Program of Henan University of Science and Technology
(Grant Nos. 2021356 and 2021371).
References
Atanassova, R., M. Leterrier, C. Gaillard, A. Agasse, E. Sagot, P.
Coutos-Thévenot and S. Delrot. 2003. Sugar-regulated
expression of a putative hexose transport gene in grape.
Plant Physiol., 131(1): 326-334.
Barbier, F., T. Péron, M. Lecerf, M.D. Perez-Garcia, Q. Barrière,
J. Rolčík, S. Boutet-Mercey, S. Citerne, R. Lemoine, B.
Porcheron, H. Roman, N. Leduc, J.L. Gourrierec, J.
Bertheloot and S. Sakr. 2015. Sucrose is an early modulator
of the key hormonal mechanisms controlling bud
outgrowth in Rosa hybrida. J. Exp. Bot., 66(9): 2569-2582.
Chakravorty, D. and J.R. Botella. 2007. Over-expression of a
truncated Arabidopsis thaliana heterotrimeric G protein γ
subunit results in a phenotype similar to α and β subunit
knockouts. Gene, 393(1-2): 163-170.
Chen, S., W. Yang, Q. Jia, W. Wei and S. Wang. 2017. Pleurotus
ostreatus bHLH transcription factors regulate plant growth
and development when expressed in Arabidopsis. J. Plant
Interact., 12(1): 542-549.
Chen, Y., X. Zhu, X. Zhu, Y.U. Yi-Fan and J. Liang. 2014.
Identification of the regulator of G-protein signaling
protein responsive to plant hormones and abiotic stresses in
Brassica napus. J. Integr. Agr., 13(12): 2634-2644.
Colaneri, A.C., M. Tunc-Ozdemir, J.P. Huang and A.M. Jones. 2014.
Growth attenuation under saline stress is mediated by the
heterotrimeric G protein complex. BMC Plant Biol., 14: 129.
Cui, X., Y. Wang, Z. Liu, W. Wang, H. Li and J. Zhuang. 2018.
Transcriptome-wide identification and expression profile
analysis of the bHLH family genes in Camellia sinensis.
Fun. Integr. Genom., 18(5): 489-503.
Dümmer, M., C. Michalski, C. Forreiter and P. Galland. 2016.
Phenotypic reversal in Arabidopsis thaliana: sucrose as a
signal molecule controlling the phenotype of gravi- and
photo-tropism mutants. J. Plant Growth Regul., 35: 430-439.
Elena, B.G., F. Rolland, T. Johan M and J. Sheen. 2007. A
central integrator of transcription networks in plant stress
and energy signalling. Nature, 448(7156): 938-942.
Elena, B.G. and J. Sheen. 2008. Convergent energy and stress
signaling. Trends Plant Sci., 13(9): 474-482.
Eom, J.S., L. Chen, D. Sosso, B.T. Julius, I. Lin, X. Qu, D.M.
Braun and W.B. Frommer. 2015. SWEETs, transporters for
intracellular and intercellular sugar translocation. Curr.
Opin. Plant Biol., 25: 53-62.
Feng, Y.L., Y.Y. Zhao, C. Ma, J. Zhang, Y. Xiong and J. Yin.
2019. Identification of photoperiod responsive genes in
wheat cultivar Jing 841 by transcriptome sequencing. Int. J.
Agric. Biol., 22(5): 1093-1101.
Gao, Y., T. Li, Y. Liu, C. Ren, Y. Zhao and M. Wang. 2010. Isolation
and characterization of gene encoding G protein α subunit
protein responsive to plant hormones and abiotic stresses in
Brassica napus. Mol. Biol. Rep., 37(8): 3957-3965.
Gao, Y., T. Li, Y. Zhao, C. Ren, Y. Zhang and M. Wang. 2011.
Isolation and characterization of a G protein γ subunit gene
responsive to plant hormones and abiotic stresses
inBrassica napusL. Acta Physiol. Plant., 33(2): 391-399.
Hackenberg, D., M.R. Mckain, S.G. Lee, R.C. Swarup, M. Tyler,
S. Spencer, H. Alex, C.J. Pires, G.K.S. Wong and J.M. Jez.
2016. Gα and regulator of G-protein signaling (RGS)
protein pairs maintain functional compatibility and
conserved interaction interfaces throughout evolution
despite frequent loss of RGS proteins in plants. New
Phytol., 216: 562-575.
Huang, C., Q. Yu, X. Yuan, Z. Li, J. Wang, L. Ye, L. Xu and Z.
Yang. 2015. Rubisco accumulation is important for the
greening of the fln2-4 mutant in Arabidopsis. Plant Sci.,
236: 185-194.
Huang, H., S. Xie, Q. Xiao, B. Wei, L. Zheng, Y. Wang, Y. Cao,
X. Zhang, T. Long, Y. Li, Y. Hu, G. Yu, H. Liu, Y. Liu, Z.
Huang, J. Zhang and Y. Huang. 2016. Sucrose and ABA
regulate starch biosynthesis in maize through a novel
transcription factor, ZmEREB156. Sci. Rep., 6: 27590.
Kristen, R.F.B. and A.L.D.M. Braun. 2012. SWEET as sugar:
new sucrose effluxers in plants. Mol. Plant, 5(4): 766-768. Li, S., Y. Liu, L. Zheng, L. Chen, N. Li, F. Corke, Y. Lu, X. Fu,
Z. Zhu and M.W. Bevan. 2012. The plant-specific G protein γ subunit AGG3 influences organ size and shape in Arabidopsis thaliana. New Phytol., 194(10): 690-703.
Lia, D., X. Zhang, Y. Xua, L. Lia, M.S. Aghdamb and Z. Luo. 2019. Effect of exogenous sucrose on anthocyanin synthesis in postharvest strawberry fruit. Food Chem., 289: 112-120.
Liu, C., B. Tu, Y. Li, B. Tian, Q. Zhang, X. Liu and S.J. Herbert.
2017. Potassium application affects key enzyme activities
of sucrose metabolism during seed filling in vegetable
soybean. Crop Sci., 57(5): 2707-2717.

YA-LAN FENG ET AL., 10
Liu, J., P. Ding, T. Sun, Y. Nitta, O. Dong, X. Huang, W. Yang,
X. Li, J.R. Botella and Y. Zhang. 2013. Heterotrimeric G
proteins serve as a converging point in plant defense
signaling activated by multiple receptor-like kinases. Plant
Physiol., 161(4): 2146-2158.
Livak, K.J. and T.D. Schmittgen. 2001. Analysis of relative gene
expression data using real-time quantitative PCR and the 2(-
ΔΔCT) method. Methods, 25: 402-408.
Luo, J., Y. Zhang, Y. Zhao, X. Chen, Y. Xiao and F. Peng. 2018.
Effects of salicylic acid on the SnRK1 activity and growth
of strawberry plant. Plant Physiol. J., 54(1): 113-120.
Magdalena, D.C., C. Sánchez-Rodríguez, V. Escudero, E. Miedes,
P.V. Fernández, L. Jordá, C. Hernández-Blanco, A. Sánchez-
Vallet, P. Bednarek, P. Schulze-Lefert, S. Somerville, J.M.
Estevez, S. Persson and A. Molina. 2012. Arabidopsis
heterotrimeric G-protein regulates cell wall defense and
resistance to necrotrophic fungi. Mol. Plant, 5(1): 98-114.
Mishra, V.K. and R.M. Singh. 2016. Sorbitol and sucrose-
induced osmotic stress on growth of wheat callus and
plantlet regeneration. Curr. Trends Biotechnol. & Pharm.,
10(1): 20-28.
Nagata, T., H. Hara, K. Saitou, A. Kobashi, K. Kojima, T. Yuasa
and O. Ueno. 2012. Activation of ADP-glucose
pyrophosphorylase gene promoters by a WRKY
transcription factor, AtWRKY20, in Arabidopsis thaliana
L. and sweet potato (Ipomoea batatas Lam.). Plant Prod.
Sci., 15(1): 10-18.
Niu, J., J. Huang, T.T. Phan, Y. Pan, L. Yang and Y. Li. 2019.
Molecular cloning and expressional analysis of five sucrose
transporter (SUT) genes in sugarcane. Sugar Tech., 21(1):
47-54.
Shi, J., G.A. Shi and Z. Tian. 2015. Effect of exogenous
hydrogen peroxide or ascorbic acid on senescence in cut
flowers of tree peony (Paeonia suffruticosa Andr.). J. Hort.
Sci. Biotech., 90(6): 689-694.
Sona, P., J. Chen, A.M. Jones and S.M. Assmann. 2006. G-
protein complex mutants are hypersensitive to abscisic acid
regulation of germination and postgermination
development. Plant Physiol., 141(1): 243-256.
Steffens, B. and M. Sauter. 2010. G proteins as regulators in
ethylene-mediated hypoxia signaling. Plant Sign. & Behav.,
5(4): 375-378.
Sun, C., S. Palmqvist, H. Olsson, M. Borén, S. Ahlandsberg and
C. Jansson. 2003. A novel WRKY transcription factor,
SUSIBA2, participates in sugar signaling in barley by
binding to the sugar-responsive elements of the iso1
promoter. The Plant Cell, 15(9): 2076-2092.
Wang, B., Y. Zhang, M.E. Haque, W. Xu, F. Li and A. Liu.
2018a. Transcriptomic analyses reveal complex and
interconnected sucrose signaling cascades in developing
seeds of castor bean. J. Plant Physiol., 221: 1-10.
Wang, X.L., R.R. Qin, R.H. Sun, J.J. Wang and X.G. Hou.
2018b. No post-drought compensatory growth of corns
with root cutting based on cytokinin induced by roots.
Agric. Water Manag., 205: 9-20.
Weiste, C., L. Pedrotti, J. Selvanayagam, P. Muralidhara, C.
Fröschel, O. Novák, K. Ljung, J. Hanson and W. Dröge-
Laser. 2017. The Arabidopsis bZIP11 transcription factor
links low-energy signalling to auxin-mediated control of
primary root growth. PLoS Genet., 13 (2): e1006607.
Wind, J., S. Smeekens and J. Hanson. 2010. Sucrose: metabolite and
signaling molecule. Phytochem., 71(14-15): 1610-1614.
Wu, T., S. Krishnamoorthi, H. Goh, R. Leong, A.C. Sanson and D.
Urano. 2020. Crosstalk between heterotrimeric G protein-
coupled signaling pathways and WRKY transcription factors
modulating plant responses to suboptimal micronutrient
conditions. J. Exp. Bot., 71(10): 3227-3239.
Xu, G., D. Lu, H. Wang and Y. Li. 2018. Morphological and
physiological traits of rice roots and their relationships to yield
and nitrogen utilization as influenced by irrigation regime and
nitrogen rate. Agric. Water Manag., 203: 385-394.
Yadav, D.K., D. Shukla and N. Tuteja. 2014. Isolation, in silico
characterization, localization and expression analysis of
abiotic stress-responsive rice G-protein β subunit (RGB1).
Plant Sign. & Behav., 9(5): e28890.
Yadav, D.K., D. Shukla and N. Tuteja. 2013. Rice heterotrimeric
G-protein alpha subunit (RGA1): In silico analysis of the
gene and promoter and its upregulation under abiotic stress.
Plant Physiol. & Biochem., 63: 262-271.
Zhang, X.Y., Q.Y. Tong, W.X. Zhu and F. Ren. 2013. Pasting,
rheological properties and gelatinization kinetics of tapioca
starch with sucrose or glucose. J. Food Eng., 144(2): 255-261.
Zhao, X.P., B. Hui, L.X. Hu, Q.Z. Cheng and B.K. Via. 2017a.
Potential of near infrared spectroscopy to monitor
variations in soluble sugars in Loblolly pine seedlings after
cold acclimation. Agr. Forest Meteorol., 232: 536-542.
Zhao, Y., X. Chen, F. Peng, J. Luo and Y. Xiao. 2017b. Over
expression of a peach PpSnRK1βγ1 gene improving
oxidative stress tolerance in Arabidopsis thaliana. Plant
Physiol. J., 53(7): 1251-1258.
(Received for publication 5 August 2020)