Embed Size (px)
Citation preview
RESEARCH Open Access
Transcriptome and metabolomic analysis toreveal the browning spot formation of‘Huangguan’ pearQi Wang†, Xinyi Wu†, Li Liu†, Daozhi Yao, Jinchao Li, Jie Fang, Xiaonan Chen, Liwu Zhu, Pu Liu, Zhenfeng Ye,Bing Jia* and Wei Heng*
Abstract
Background: Browning spot (BS) disorders seriously affect the appearance quality of ‘Huangguan’ pear and causeeconomic losses. Many studies on BS have mainly focused on physiological and biochemical aspects, and themolecular mechanism remains unclear.
Results: In the present study, the structural characteristics of ‘Huangguan’ pear with BS were observed via scanningelectron microscopy (SEM), the water loss and brown spots were evaluated, and transcriptomic and metabolomicsanalyses were conducted to reveal the molecular mechanism underlying ‘Huangguan’ pear skin browning disorder.The results showed that the occurrence of BS was accompanied by a decrease in the wax layer and an increase inlignified cells. Genes related to wax biosynthesis were downregulated in BS, resulting in a decrease in the wax layerin BS. Genes related to lignin were upregulated at the transcriptional level, resulting in upregulation of metabolitesrelated to phenylpropanoid biosynthesis. Expression of calcium-related genes were upregulated in BS. Cold-inducedgenes may represent the key genes that induce the formation of BS. In addition, the results demonstrated thatexogenous NaH2PO4·2H2O and ABA treatment could inhibit the incidence of BS during harvest and storage time byincreasing wax-related genes and calcium-related genes expression and increasing plant resistance, whereas thetranscriptomics results indicated that GA3 may accelerate the incidence and index of BS.
Conclusions: The results of this study indicate a molecular mechanism that could explain BS formation andelucidate the effects of different treatments on the incidence and molecular regulation of BS.
Keywords: ‘Huangguan’ pear, Browning disorder, Transcriptome, Metabolomic, Molecular mechanism
© The Author(s). 2021 Open Access This article is licensed under a Creative Commons Attribution 4.0 International License,which permits use, sharing, adaptation, distribution and reproduction in any medium or format, as long as you giveappropriate credit to the original author(s) and the source, provide a link to the Creative Commons licence, and indicate ifchanges were made. The images or other third party material in this article are included in the article's Creative Commonslicence, unless indicated otherwise in a credit line to the material. If material is not included in the article's Creative Commonslicence and your intended use is not permitted by statutory regulation or exceeds the permitted use, you will need to obtainpermission directly from the copyright holder. To view a copy of this licence, visit http://creativecommons.org/licenses/by/4.0/.The Creative Commons Public Domain Dedication waiver (http://creativecommons.org/publicdomain/zero/1.0/) applies to thedata made available in this article, unless otherwise stated in a credit line to the data.
* Correspondence: [email protected]; [email protected]†Qi Wang, Xinyi Wu and Li Liu are joint first authors.College of Horticulture, Anhui Agricultural University, Hefei, Anhui 230036, P.R. China
Wang et al. BMC Plant Biology (2021) 21:321 https://doi.org/10.1186/s12870-021-03049-8

BackgroundPear (Pyrus spp.), belongs to the subfamily Pomoideae inthe family Rosaceae, the third most important temperatefruit species after grape and apple [1]. There are manypear varieties planted in China, and the main speciescultivated for commercial production include sand pear(P. pyrifolia Nakai), ussurian pear (P. ussuriensis Maxim),white pear (P. bretschneideri Rehd), and Xinjiang pear (P.sinkiangensis Yu), as well as interspecific hybrid types [2].‘Huangguan’ pear (Pyrus bretschneideri × Pyrus pyrifo-
lia) is an early- and medium-maturing cultivar widelyplanted in northern China that has a high-quality andexquisite appearance after bagging [3]. This fruit hasmany excellent characteristics, such as a beautiful ap-pearance, strong resistance, early fruit bearing and highyield in successive years, which are traits that are desiredby the majority of producers and consumers. However,browning spot (BS) disease often occurs at the surface of‘Huangguan’ pear fruits after bagging before harvest orduring storage [4]. The symptoms of BS include an ini-tial brown spot that spreads irregularly from the diseasespot to the surroundings and becomes darker duringfruit maturation [4, 5]. Whole fruit browning may occurin the later stages of this disease. Interestingly, this dis-order affects only the exocarp of pear fruit, and the fleshand core are not affected [6]. Multiple lesions are con-nected into a round, irregular shape or chicken claw-likeshape. Therefore, BS disorder is also known as chicken-claw disease by orchardman in China, and it causes asignificant decrease in the commercial value of fruit forfruit farmers [7].BS were first discovered in Xinji City, Hebei Province,
in 1996. This disease mainly occurs on ‘Huangguan’pears. However, a small number of green pear varieties,such as ‘Dangshansuli’ (P. bretschneideri Rehd.), ‘Lvbaoshi’(P. pyrifolia Nakai), ‘Suisho’ (P. pyrifolia Nakai), ‘Xuehua’(P. bretschneideri Rehd.) and ‘Xueqing’ (P. pyrifolia Nakai),also experience BS [8]. It was reported that BS disease of‘Huangguan’ pear is an important physiological disorder[9–11] that mainly occurs in bagged fruits at the maturestage and after low-temperature storage [12–14]. In gen-eral, BS disorder of ‘Huangguan’ pear is affected by manyfactors, such as environmental factors (continuous rainfalland low temperature weather [12], chemical fertilizersuse [15]), preharvest factors (bagging time, fruit bagtype [5, 16], and swelling agent use [17]), and postharvestfactors (cooling period duration [12–14, 18], storagetemperature and CO2 and O2 concentrations [19–21]).Some researchers believe that the thinning of the wax
layer and skin cell wall of pears caused by bagging is themain cause of BS [16]. After bagging, the adaptability offruit exocarp to severe environmental changes is reducedand the development of fruit exocarp is delayed. It hasbeen reported that BS are closely related to calcium
deficiency and phenolic dysregulation in pericarp tissue[9, 19, 22]. To date, research on BS disease has mainlyfocused on mineral nutrition (such as Ca [3, 5, 9, 11, 17,23–27], Mg [5, 9], K [5, 9] and B [23]) and physiologyand biochemistry [28, 29]. Additionally, the use of swell-ing agents may be another causes of BS [17]. Exogenoustreatment with ethylene [4, 30], methyl jasmonate(MeJA) [31], 1-methylcyclopropene (1-MCP) [18] andCaCl2 [32] has been reported to affect the browning ofpostharvest ‘Huangguan’ pear. In addition, rapid post-harvest cooling tends to increase BS formation, whileslow cooling inhibits BS formation [12]. However, fewstudies have focused on the effect of exogenous phyto-hormone treatments, and the molecular mechanismsthat regulate BS processes in ‘Huangguan’ pear.This study observed the changes at the site of BS and
analysed the molecular mechanism underlying BSformation at the transcriptomic and metabolomic levels.The incidence of BS after treatment with exogenousreagents [NaH2PO4·2H2O (P), abscisic acid (ABA),gibberellin A3 (GA3)] during harvest and storage was in-vestigated. The key genes involved in exocarp formationwere also analysed after treatment, which would pro-vided a basis for the molecular mechanism underlyingBS formation and elucidated the effect of different treat-ments on the molecular regulation of BS formation.
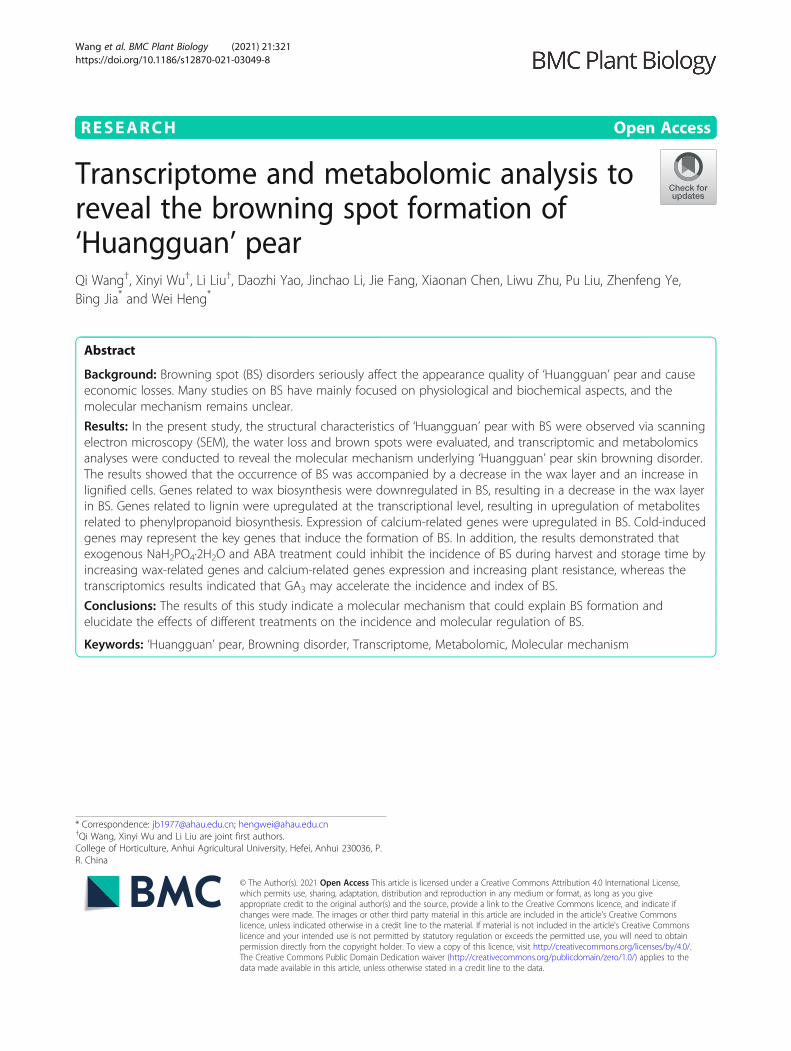
ResultsPhenotype characteristics of BS disease of ‘Huangguan’pearCompared with the normal pear skin of ‘Huangguan’pear, the BS-infected skin exhibits spots with an irregu-lar, chicken claw-like shape that are randomly distrib-uted over the surface (Fig. 1A). BS are a physiologicaldisease that causes a slight depression in the affectedarea. Paraffin section observations revealed that the de-gree of lignification of the exocarp cells of the BS partswas significantly higher than that of the normal parts(Fig. 1C, D). SEM observations revealed a thick cuticularlayer on the skin of the normal ‘Huangguan’ pear, how-ever, the BS part of ‘Huangguan’ pear skin consisted oflayers of dead cells and more densely arranged exocarpcells (Fig. 1 E, F). Those results indicated that the occur-rence of BS may be caused by necrosis of the exocarpand hypodermal cortical tissues.The SEM analysis also found that there were many
cracks on the fruit surface, although the cracks on theBS part were covered by the lesions (Additional file 1:Fig. S1). Hence, an experiment to detect the rate ofwater loss (RWL) was conducted between CK and BSgroups. After 10 d of storage at room temperature(25 °C), the RWL of the three groups of ‘Huangguan’pear and ‘Huangguan’ pear with BS disease was calcu-lated. The results showed that the RWL of groups #1
Wang et al. BMC Plant Biology (2021) 21:321 Page 2 of 18
and #3 was significantly higher than that of ‘Huangguan’pear with BS disease (Fig. 1B). The average RWL of theCK and BS groups was 3.49 and 3.19%, respectively.Therefore, BS lesions could inhibit water loss, whichmay be regulated by the layers of densely arranged deadcells at the fruit surface.
Transcriptome and metabolome differences between theCK and BS fruitsRNA-Seq generated 6.24 gigabytes (GB) of clean data foreach sample from the 5 complementary DNA (cDNA)libraries. A total of 30,596 expressed genes wereidentified, including 1212 new genes that were initiallyidentified in this study. Successfully mapped readsranged between 69.91 and 72.68%, and the average was71.29% (Additional file 2: Table S1).To compare the metabolites in the control group (CK)
and BS-infected group (BS) metabolites of ‘Huangguan’
pears, datasets obtained from a Xevo G2 XS QTOFhigh-resolution tandem mass spectrometer (Waters) inelectrospray ionization positive ion mode (ESI+) andnegative ion mode (ESI−) were subjected to a principalcomponent analysis (PCA). The results showed that me-tabolites from the CK and BS groups were clearly sepa-rated in the score plots, in which the first principalcomponent (PC1) was plotted against the second princi-pal component (PC2). (Additional file 1: Fig. S2 A, B).PLS-DA (plots from partial least squares discriminant)analyses were further performed to check the metabolitedifferences between the CK and BS groups (Additionalfile 1: Fig. S2 C, D), and the results showed significantbiochemical differences between CK and BS.Transcript analyses of the two comparison groups by
DESeq2 [33] identified 6299 DEGs, including 4854 up-regulated and 1445 downregulated DEGs in the BS pearexocarp (Fig. 2A). To classify the functions of DEGs
Fig. 1 Phenotypic characteristics of BS of ‘Huangguan’ pear. (A) Phenotypes of normal ‘Huangguan’ pear and ‘Huangguan’ pear with BS disease.Observation of the paraffin sections of the normal part (C) and BS disease part (D) of ‘Huangguan pear’. SEM analysis of the normal part (E) and BS diseasepart (F) of ‘Huangguan’ pear. (B) RWL of CK and BS of ‘Huangguan’ pear at 10 days of storage under room conditions after harvest. The vertical barindicates the standard error. The reported value is the mean ± SEM (p< 0.05). The ordinate represents three different groups, and each group has 10 fruits
Wang et al. BMC Plant Biology (2021) 21:321 Page 3 of 18

between the CK and BS groups, the assembled unigeneswere annotated by using different protein databases (GOand KEGG) for homologous alignment. In the GOcategories, DEGs were annotated with 1212 GO terms,with 1480 unigenes in biological process, 1906 unigenesin cellular component, and 1609 unigenes in molecularfunction, which included terms such as metabolicprocess, membrane and catalytic activity (Additional file1: Fig. S3). KEGG pathway annotation analyses showedthat the global and overview maps, carbohydrate metab-olism, signal transduction and environmental adaptationwere overrepresented (Additional file 1: Fig. S4). KEGGenrichment analyses were further performed to assessthe DEGs between the CK and BS groups. We foundseven significant pathways, including the MAPK signal-ling (245), flavonoid biosynthesis (72), plant-pathogeninteraction (267), carotenoid biosynthesis (38), porphyrin
and chlorophyll metabolism (37), plant hormone signaltransduction (216) and brassinosteroid biosynthesispathways (17) (Fig. 2B). To further identify the functionsof BS-related genes, we analysed the gene expression inthose significantly enriched pathways. The numbers ofup- and downregulated genes are listed in Table 1.We characterized the exocarp of ‘Huangguan’ pear
metabolomic changes in the BS disease parts. A total of8829 and 8646 ions were identified in ESI+ and ESI−modes, respectively. After filtering low-quality ions thathad RSD > 30%, 8432 and 7887 ions were retained inESI+ and ESI− modes, respectively. Then, we identifieddifferential metabolites between the CK and BS groups,and detected 1742 and 1555 differential ions in BS, in-cluding 1348 and 1173 upregulated ions and 394 and382 downregulated ions in ESI+ and ESI− modes, re-spectively (Fig. 2C). In addition, 1581 and 781
Fig. 2 Significant DEG and DEM analysis between CK and BS. (A) Column chart of DEGs; red represents upregulated DEGs, and blue representsdownregulated DEGs. (B) KEGG enrichment analysis of DEGs between CK and BS. The number of genes in each pathway is equal to the dot size.The dot color represents the q-value. The smaller the q-value, the redder the dot. (C) Numbers of upregulated (red) and downregulated (blue)metabolites. (D) KEGG enrichment analysis of differential metabolites. The number of DEMs in each pathway is equal to the dot size. The dotcolor represents the P-value. A redder point represents a smaller P-value
Wang et al. BMC Plant Biology (2021) 21:321 Page 4 of 18

differentiated metabolites were categorized into 96 and74 KEGG pathways in ESI+ and ESI− mode, respectively(Additional file 3: Table S2). The KEGG enrichmentanalysis of differentiated metabolites (removing the du-plicated ions in ESI+ and ESI− mode) showed that thebiosynthesis of secondary metabolites, porphyrin andchlorophyll metabolism, cutin suberin and wax biosyn-thesis, phenylpropanoid biosynthesis, alpha-linolenicacid metabolism and brassinosteroid biosynthesis path-ways were the most abundant (Fig. 2D). The differen-tially up- and downregulated metabolites are listed inTable 2.
Analysis of DEGs and DEMs between the CK and BSgroupsThe phenotypic characteristics and metabonomics ana-lysis of the pericarp indicated that the cutin suberin andwax biosynthesis pathway and lignin biosynthesis maybe involved in the formation of BS. The fatty acid elong-ation pathway is upstream of cutin suberin and waxbiosynthesis pathway [34]. At the transcriptome level,we found that many genes involved in wax biosynthesiswere downregulated in BS, including the CYP94A1,HHT, HTH, CYP704C1, WSD1, and FAR3 genes and 10KCS family genes, indicating that the decrease in wax
may be one of the causes of BS(Fig. 3A B). Six genes in-volved in lignin biosynthesis were upregulated, namely,4CL2, CAD1, CYP84A1, 4CL1, CYP98A2, and COMT1,and two genes were downregulated, namely, CAD6 andCCR1 (Fig. 3C), resulting in the upregulation of metabo-lites in the phenylpropanoid biosynthesis pathway (Table 2).These results suggested that the formation of BS iscaused by the decrease in epicuticular wax and theincrease in lignified cells.Transcriptome analysis revealed that plant-pathogen
interactions (PPIs) and the MAPK signalling pathway(MAPK) are also key factors associated with BS (Fig. 3D-F). PGIPs (polygalacturonase inhibiting proteins) are as-sociated with the plant cell wall and play a crucial rolein plant defence [35], and they are upregulated in BS.LSH10 was a probable transcription regulator that actsas a developmental regulator by promoting cell growthin response to light, and it is upregulated in BS. We alsodetected six calcium-related genes differentiallyexpressed in CK and BS, including CaM, CML42,CML45, CaLP7, CaLP2, and CaLP3, indicating that thecalcium content in pear exocarp may be one of the fac-tors affecting BS. In addition, we found 12 DEGs of theWRKY family in PPI and MAPK. These result indicatedthat the defence response caused by the change in
Table 2 Enriched KEGG pathways of differential metabolites between CK and BS
Pathway Count Up Down Pathway ID
Biosynthesis of secondary metabolites 228 173 55 map01110
Phenylpropanoid biosynthesis 31 22 9 map00940
Porphyrin and chlorophyll metabolism 29 21 8 map00860
Flavonoid biosynthesis 18 16 2 map00941
Brassinosteroid biosynthesis 17 15 2 map00905
Carotenoid biosynthesis 16 13 3 map00906
Linoleic acid metabolism 16 14 2 map00591
alpha-Linolenic acid metabolism 13 12 1 map00592
Cutin, suberine and wax biosynthesis 11 11 0 map00073
Table 1 The top 7 enriched pathways of DEGs in BS
Pathway name Type Down Pathway ID Q-value
MAPK signaling pathway - plant Environmental InformationProcessing
34 ko04016 4.86E-12
Flavonoid biosynthesis Metabolism 21 ko00941 1.47E-06
Plant-pathogen interaction Organismal Systems 22 ko04626 1.14E-05
Carotenoid biosynthesis Metabolism 12 ko00906 0.001625608
Porphyrin and chlorophyll metabolism Metabolism 13 ko00860 0.008369283
Plant hormone signal transduction Environmental InformationProcessing
71 ko04075 0.008369283
Brassinosteroid biosynthesis Metabolism 3 ko00905 0.02783563
These were selected with an FDR adjusted Q-value< 0.05
Wang et al. BMC Plant Biology (2021) 21:321 Page 5 of 18

calcium content in pear exocarp caused by bagging wasinvolved in the formation of BS. Detailed information onthese DEGs is listed in Additional file 4: Table S3.Through metabolomics, we found that there was no
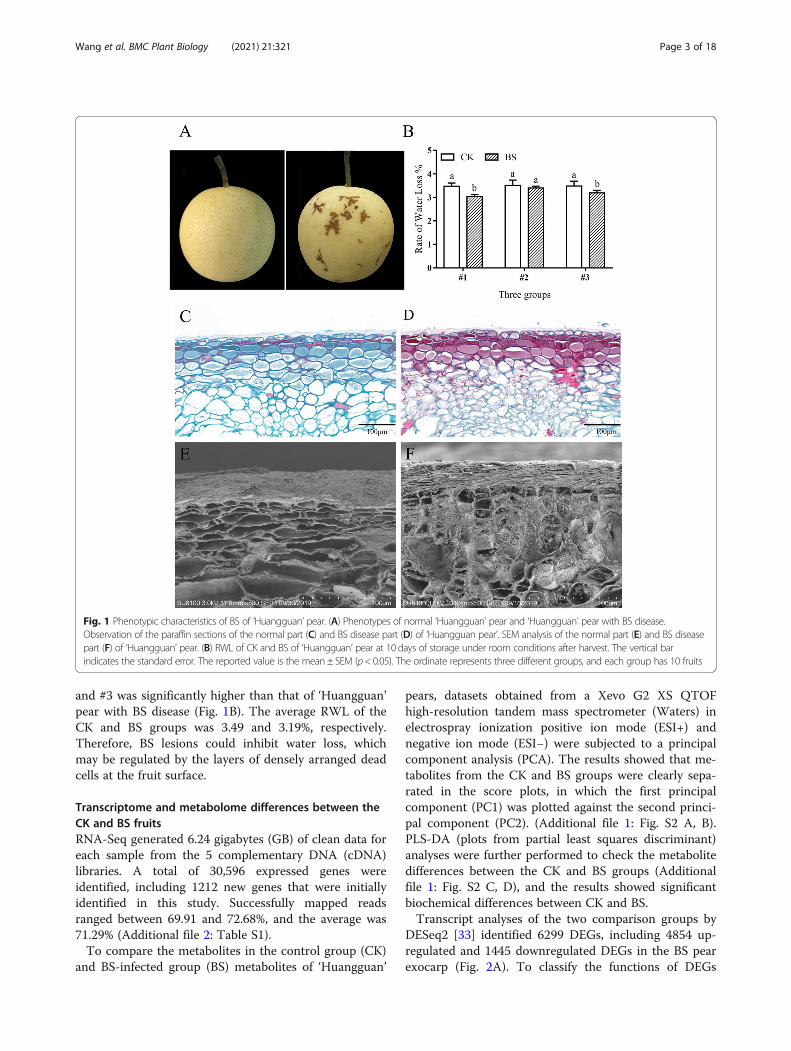
significant difference in auxin (IAA) content betweenthe CK and BS groups. Among cytokinins (CTKs), N6-dimethylallyladenine and zeatin were reduced in BS,while the content of gibberellins (GAs), abscisic acid(ABA), jasmonic acid (JA) and salicylic acid (SA) wereall upregulated in BS except gibberellin A4 (Fig. 4). Atthe transcriptional level, we identified 216 DEGs in-volved in plant hormone signal transduction, including55, 15, 37, 18, 23 and 12 DEGs in the IAA, CTK, GA,ABA, JA, and SA signalling pathways, respectively (Fig. 4).In the IAA signalling pathway, the AUX1, TIR1, andAUX/IAA genes were downregulated, which indicated that
cell enlargement and plant growth were suppressed. Inthe CTK signalling pathway, the CRE1 and B-ARR geneswere upregulated, which indicated that cell division waspromoted. In the GA signalling pathway, GID1C andCES15 were upregulated among the GID1 genes, andSCL21, SCL22, SCL4, SCL14, SCL33, SCL30, and SCL11were upregulated among the DELLA genes. Additionally,nine TFs in the bHLH family in the GA signalling pathwaywere identified, of which six were upregulated and threewere downregulated. The increase in gibberellin contentand expression of GA signalling genes in BS indicated thatGA may have a certain promotion effect on BS. GreaterABA, JA and SA content in BS was observed in the BSgroup, and the gene expression of ABA, JA and SA signal-ling pathways was also significantly increased, whichinduced the disease resistance in the plants. Detailed
Fig. 3 Significant DEGs between the CK and BS groups. Heatmap of DEGs involved in fatty acid elongation (A), cutin suberin and waxbiosynthesis (B), lignin biosynthesis (C), plant-pathogen interaction (D), both plant-pathogen interaction and MAPK signalling pathways (E), andMAPK signalling pathway (F). Red represents upregulation, and blue represents downregulation
Wang et al. BMC Plant Biology (2021) 21:321 Page 6 of 18
information on all genes involved in plant hormone signaltransduction is listed in Additional file 4: Table S4.BS has been reported to be associated with a sudden
drop in temperature. Cold exercise or slow cooling arecommonly used in production to reduce the incidenceof BS [12–14]. We identified three cold-shock proteinCS120-like (CS120) genes (gene ID:103937809, 103,937,810, 103,937,807) and one low-temperature-induced 65kDa protein-like isoform X1 (LTI65, gene ID: 103940885)that were significantly upregulated in BS (Fig. 5). Hydro-phobic protein RCI2B (RCI2B, gene ID: 103955844) hasbeen proven to be a cold-induced gene [36] that is upregu-lated in BS. Aquaporin is a membrane protein that was
originally characterized as a water channel through whichH2O could permeate biological membranes [37]. FourDEGs in aquaporin PIP (gene ID: 103946629, 103,942,423,103,937,187, 103,956,770), PIP1–4 and PIP2–8 were upreg-ulated, while PIP2–2 and PIP2–5 were downregulated inBS.
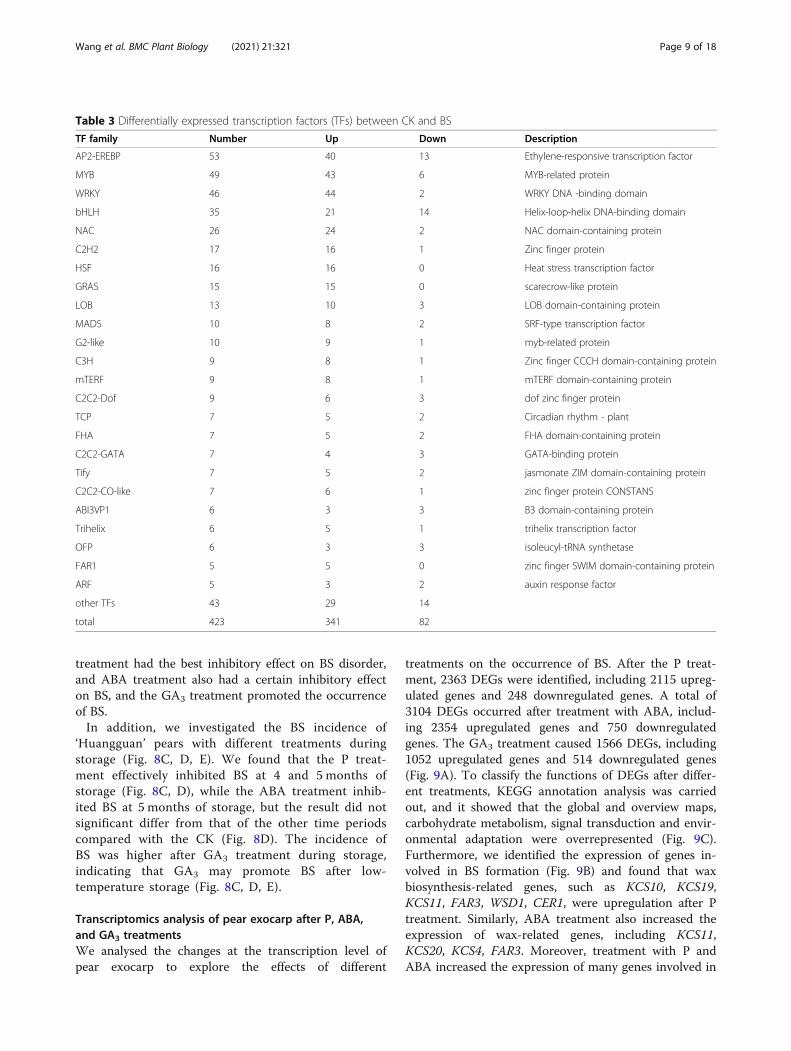
Transcription factors (TFs) involved in BS formationTFs are important regulators that activate or repress theexpression of both coding and noncoding genes to influ-ence or control many biological processes [38]. In ouranalysis of the transcriptome data, we detected 423 dif-ferentially expressed TFs between the CK and BS
Fig. 4 Significant DEGs and DEMs involved in plant hormone signal transduction between CK and BS. Red represents upregulation, and bluerepresents downregulation
Wang et al. BMC Plant Biology (2021) 21:321 Page 7 of 18

groups, including 341 upregulated and 82 downregulatedTFs. The AP2-EREBP, MYB and WRKY families werethe most abundant TF families between the CK and BSgroups, followed by the bHLH, NAC, C2H2, and HSFfamilies (Table 3).
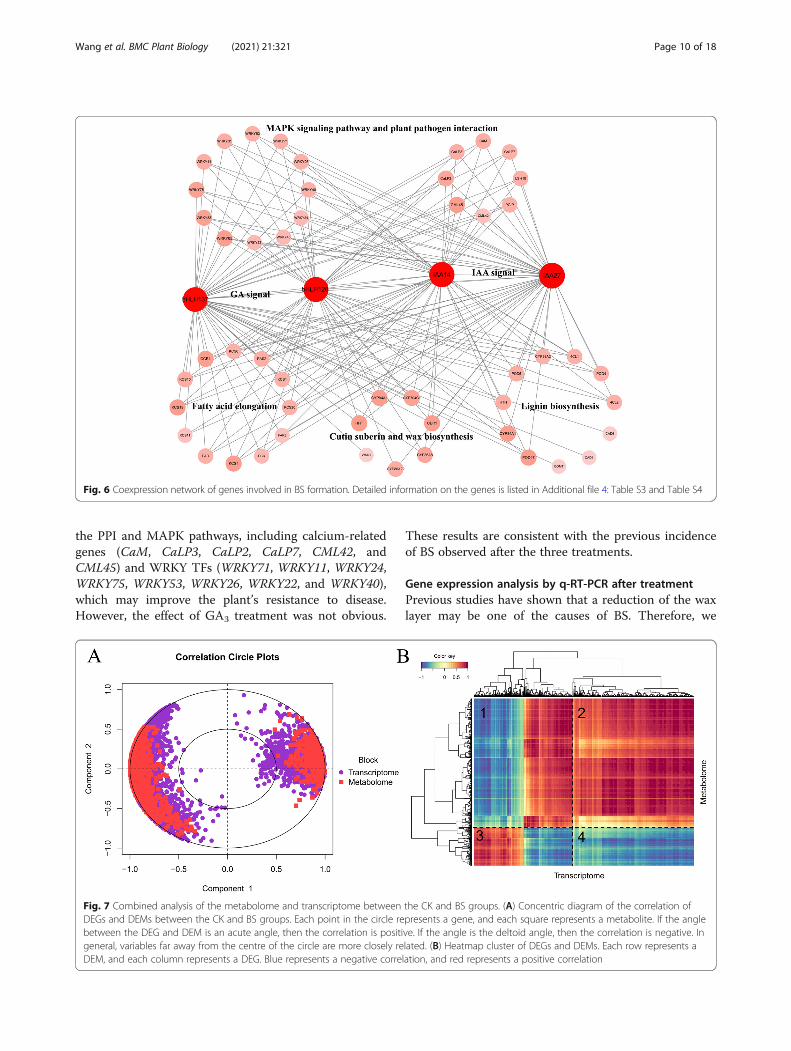
Coexpression network of BS-related genesIn our transcriptome analysis, we found that wax,lignin, calcium, plant hormone signal transduction,and cold-induced genes were the key genes for BSformation. We performed a coexpression networkanalysis to illuminate the collaboration between thosegenes, and the analyses with transcriptome datashowed that GA signal and IAA signal genes wereclassified into different coexpression clusters withwax, lignin biosynthesis and calcium-related genes(Fig. 6). We found that bHLH137, bHLH128, IAA14and IAA27 were coexpressed with multiple genes in-volved in fatty acid elongation, cutin, suberin andwax biosynthesis, lignin biosynthesis, MAPK and PPI.These findings indicate that the formation of BS maybe regulated by plant hormone signals, especiallyIAA and GA signals.
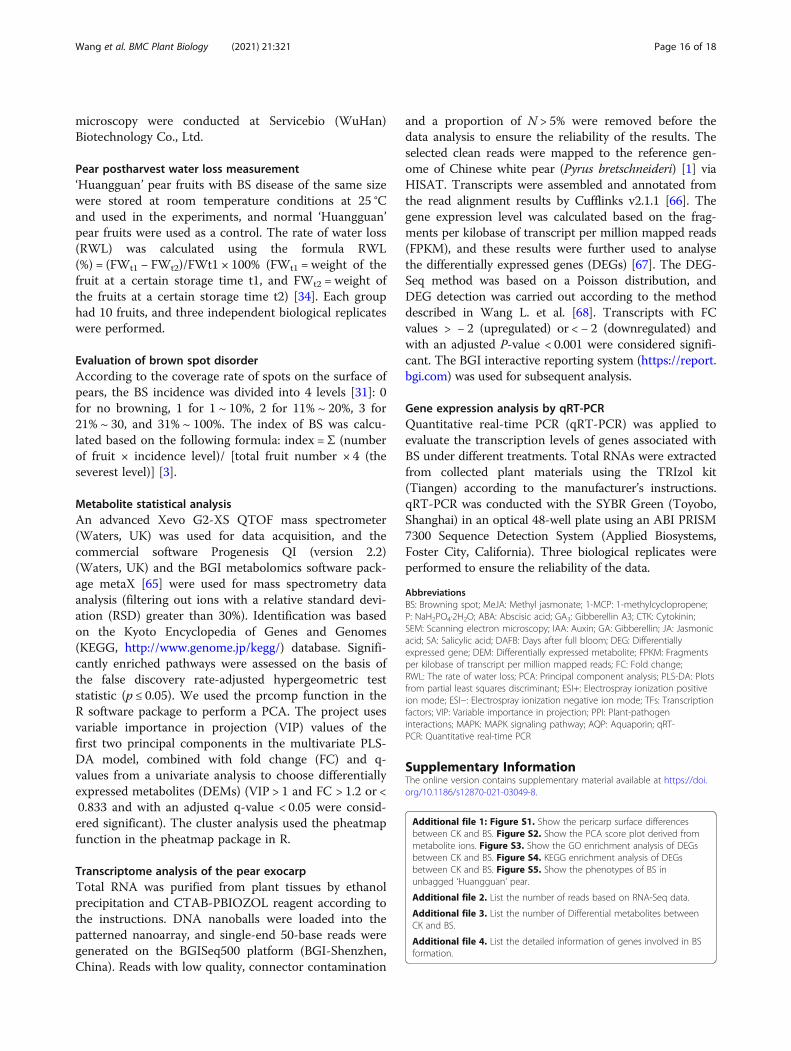
Combined analysis of the metabolome and transcriptomeMixOmics [33] multifunctions were used for multivariabledimensionality reduction to explore the relationship
between transcriptomics and metabolomics (Fig. 7A). Theblock splsda function in mixOmics was used to analyzedifferential genes and differential metabolites, and theplotVar and circosPlot functions were used to visualizethe results. We found that DEGs and DEMs were closelycorrelated. In general, most DEGs and DEMs are far fromthe center of the circle, which means a strong correlationbetween them. Alternatively, a regularized canonical cor-relation analysis (rCCA) [39] was performed to measurethe degree of correlation between genes and metabolites(Fig. 7B). In total, a correlation between 6299 DEGs and1280 DEMs was detected. We named the four quadrantswith numbers 1–4. The results showed that quadrants 1and 4 represent the opposite expression trend of DEGsand DEMs, suggesting that the expression of DEGs andDEMs had a negative correlation. In contrast, quadrants 2and 3 represent the consistent expression trend of DEGsand DEMs, indicating that those genes may be a positivelyregulated by metabolites.
Effects of P, ABA and GA3 treatments on BSTreatments with P, ABA, and GA3 were performed toinvestigate their effects on the BS of ‘Huangguan’ pear(Fig. 8A, B). The P and ABA treatments significantly re-duced the incidence and index of BS. The incidence andindex of BS treated with GA3 were higher than those ofthe other treatments. The results showed that the P
Fig. 5 Transcript abundance of significant DEGs between CK and BS. The error bars are the means ± SEM of three biological repeats
Wang et al. BMC Plant Biology (2021) 21:321 Page 8 of 18
treatment had the best inhibitory effect on BS disorder,and ABA treatment also had a certain inhibitory effecton BS, and the GA3 treatment promoted the occurrenceof BS.In addition, we investigated the BS incidence of
‘Huangguan’ pears with different treatments duringstorage (Fig. 8C, D, E). We found that the P treat-ment effectively inhibited BS at 4 and 5 months ofstorage (Fig. 8C, D), while the ABA treatment inhib-ited BS at 5 months of storage, but the result did notsignificant differ from that of the other time periodscompared with the CK (Fig. 8D). The incidence ofBS was higher after GA3 treatment during storage,indicating that GA3 may promote BS after low-temperature storage (Fig. 8C, D, E).
Transcriptomics analysis of pear exocarp after P, ABA,and GA3 treatmentsWe analysed the changes at the transcription level ofpear exocarp to explore the effects of different
treatments on the occurrence of BS. After the P treat-ment, 2363 DEGs were identified, including 2115 upreg-ulated genes and 248 downregulated genes. A total of3104 DEGs occurred after treatment with ABA, includ-ing 2354 upregulated genes and 750 downregulatedgenes. The GA3 treatment caused 1566 DEGs, including1052 upregulated genes and 514 downregulated genes(Fig. 9A). To classify the functions of DEGs after differ-ent treatments, KEGG annotation analysis was carriedout, and it showed that the global and overview maps,carbohydrate metabolism, signal transduction and envir-onmental adaptation were overrepresented (Fig. 9C).Furthermore, we identified the expression of genes in-volved in BS formation (Fig. 9B) and found that waxbiosynthesis-related genes, such as KCS10, KCS19,KCS11, FAR3, WSD1, CER1, were upregulation after Ptreatment. Similarly, ABA treatment also increased theexpression of wax-related genes, including KCS11,KCS20, KCS4, FAR3. Moreover, treatment with P andABA increased the expression of many genes involved in
Table 3 Differentially expressed transcription factors (TFs) between CK and BS
TF family Number Up Down Description
AP2-EREBP 53 40 13 Ethylene-responsive transcription factor
MYB 49 43 6 MYB-related protein
WRKY 46 44 2 WRKY DNA -binding domain
bHLH 35 21 14 Helix-loop-helix DNA-binding domain
NAC 26 24 2 NAC domain-containing protein
C2H2 17 16 1 Zinc finger protein
HSF 16 16 0 Heat stress transcription factor
GRAS 15 15 0 scarecrow-like protein
LOB 13 10 3 LOB domain-containing protein
MADS 10 8 2 SRF-type transcription factor
G2-like 10 9 1 myb-related protein
C3H 9 8 1 Zinc finger CCCH domain-containing protein
mTERF 9 8 1 mTERF domain-containing protein
C2C2-Dof 9 6 3 dof zinc finger protein
TCP 7 5 2 Circadian rhythm - plant
FHA 7 5 2 FHA domain-containing protein
C2C2-GATA 7 4 3 GATA-binding protein
Tify 7 5 2 jasmonate ZIM domain-containing protein
C2C2-CO-like 7 6 1 zinc finger protein CONSTANS
ABI3VP1 6 3 3 B3 domain-containing protein
Trihelix 6 5 1 trihelix transcription factor
OFP 6 3 3 isoleucyl-tRNA synthetase
FAR1 5 5 0 zinc finger SWIM domain-containing protein
ARF 5 3 2 auxin response factor
other TFs 43 29 14
total 423 341 82
Wang et al. BMC Plant Biology (2021) 21:321 Page 9 of 18
the PPI and MAPK pathways, including calcium-relatedgenes (CaM, CaLP3, CaLP2, CaLP7, CML42, andCML45) and WRKY TFs (WRKY71, WRKY11, WRKY24,WRKY75, WRKY53, WRKY26, WRKY22, and WRKY40),which may improve the plant’s resistance to disease.However, the effect of GA3 treatment was not obvious.
These results are consistent with the previous incidenceof BS observed after the three treatments.
Gene expression analysis by q-RT-PCR after treatmentPrevious studies have shown that a reduction of the waxlayer may be one of the causes of BS. Therefore, we
Fig. 6 Coexpression network of genes involved in BS formation. Detailed information on the genes is listed in Additional file 4: Table S3 and Table S4
Fig. 7 Combined analysis of the metabolome and transcriptome between the CK and BS groups. (A) Concentric diagram of the correlation ofDEGs and DEMs between the CK and BS groups. Each point in the circle represents a gene, and each square represents a metabolite. If the anglebetween the DEG and DEM is an acute angle, then the correlation is positive. If the angle is the deltoid angle, then the correlation is negative. Ingeneral, variables far away from the centre of the circle are more closely related. (B) Heatmap cluster of DEGs and DEMs. Each row represents aDEM, and each column represents a DEG. Blue represents a negative correlation, and red represents a positive correlation
Wang et al. BMC Plant Biology (2021) 21:321 Page 10 of 18

analysed the expression of five wax-related genes in thepericarp of ‘Huangguan’ pear after different treatments(Fig. 10). We found that KCS11, FAR3, WSD1, andCER1 were upregulated after the P treatment and KCS11and CER1 were upregulated after the ABA treatment.The expression of OCR1 was downregulated after the Pand ABA treatments but did not significantly differ afterthe GA3 treatment. BS has been reported to be relatedto calcium deficiency in the peel [3, 9, 22]. Five calcium-related genes, CaLP2, CaLP3, CaLP7, CML45, andCML42, were upregulated after the P and ABA treat-ments but did not show significant changes in expres-sion after the GA3 treatment (Fig. 10). Additionally, fivegenes involved in both PPI and MAPK can be activatedby various biological and abiotic stresses [13], includingPGIP and LSH10 and the three WRKY family TFsWRKY53, WRKY71, WRKY33. Among them, theexpression of LSH10, WRKY53, WRKY71, and WRKY33increased to different degrees after the P and ABA treat-ments. The expression of PGIP was increased after ABAtreatment. However, GA3 treatment did not affect theexpression of these genes and even had a persistenteffect (Fig. 10). These results are consistent with thetranscriptome data.Furthermore, the expression of five cold-induced genes
was detected, namely, CS120–1 (gene ID: 103937807),CS120–2 (gene ID: 103937809), CS120–3 (gene ID:103937810), LTI65 and RCI2B. The results show thatthe ABA treatment increased the expression of CS120–
1, CS120–2 and LTI65, while CS120–1 and LTI65 weredownregulated after the P treatment. The expression ofRCI2B was decreased after all tree treatments. The re-sults show that ABA treatment may improve the adapt-ability of fruit to chilling injury, while the effect of P andABA treatment on the expression of cold-related geneswas not obvious.
Regulatory network of BS formationAccording to our investigation and research, we believethat many factors result in BS, especially the low tem-peratures. The possible regulatory network is shown inFig. 11. The development of fruit exocarp is delayed, andthe concentration of Ca2+ is reduced after bagging. Thefragile peel cannot withstand swelling when the fruit en-larges. When the temperature drops, the peel isstretched, cracks appear, and low temperature-inducedgenes are upregulated, which causes a series of defensivereactions through the PPI and MAPK pathways. Inaddition, the high humidity conditions in bags cause cu-ticular thinning of the pear exocarp, which may causecracks on the fruit surface. Then, dead cells accumulatenear those cracks, which ultimately become BS.
DiscussionFactors influencing BS on ‘Huangguan’ pearBS disease is the main disease of ‘Huangguan’ pear andprimarily occurs in bagged fruits at the mature stage.However, a small proportion of BS cases has also been
Fig. 8 The incidence of BS disorder after different treatments in ‘Huangguan’ pears. (A) Incidence of BS disorder treated with exogenous P, ABA,and GA3. (B) Index of BS disorder treated with exogenous P, ABA, and GA3. Incidence of BS disorder with different treatments after 4 (C), 5 (D),and 6 (E) months of storage. The error bars are the means ± SEM of three biological repeats. (P ≤ 0.05)
Wang et al. BMC Plant Biology (2021) 21:321 Page 11 of 18

found on unbagged fruits, although the shape of the dis-ease is mostly circular and not consistent with that ofbagging (Additional file 1: Fig. S5). Therefore, baggingmay not be the only cause of BS. We observed that theonset of BS was characterized by a close arrangement oflignified dead cells accompanied by a significant reduc-tion in epidermal wax (Fig. 1). The transcriptomic ana-lysis showed that the expression of wax-related genes inBS was decreased while the expression of lignin-relatedgenes was increased (Fig. 3), which was consistent withthe observed phenotypic phenomenon. However, thecause of this phenomenon is still unclear.It has been reported that BS is associated with sudden
decreases in temperatures [12, 13, 18]. BS has beenconsidered a chilling injury symptom in cold-stored‘Huangguan’ pear [30]. Studies have shown that
‘Huangguan’ pear is susceptible to BS disorder a fewdays after low-temperature storage [4]. It has been re-ported that MeJA can improve the chilling resistance ofeggplant (Solanum melongena L.), and also can inhibitbrowning disorder [31, 40, 41]. This finding indicatedthat BS may be caused by low temperature. We detectedfour low temperature-induced genes by transcriptomicsthat were highly expressed in BS but barely expressed inthe normal pericarp, including the CS120, LTI65 andRCI2B genes (Fig. 5). Protein synthesis is generally inhib-ited when the temperature drops abruptly, and the produc-tion is significantly lower than at a normal physiologicaltemperature; however, cold-shock proteins (CSPs) increasedramatically under these conditions [42]. LTI65 and RCI2Bare induced by low temperature in Arabidopsis thaliana[36, 43]. Li. et al. [13] studied the effect of cold exercise
Fig. 9 Significant DEGs between the CK_BS, CK-P, CK-ABA, and CK-GA3 comparison groups. (A) Column chart of the number of DEGs. (B) The up-and downregulation of genes involved in BS-related pathways after different treatments. (C) KEGG annotation of DEGs. (D) Expression of genesinvolved in BS related pathway after treatments. Red represents upregulation, and blue represents downregulation
Wang et al. BMC Plant Biology (2021) 21:321 Page 12 of 18

treatment on ‘Huangguan’ pear, and the results showed thatcold exercise effectively inhibited fruit peel brown spotsand had no obvious effect on storage quality. Based onthese findings, low temperature is indeed one of the causesof BS.
Calcium deficiency in the pericarp is also responsiblefor BS [3, 5, 9, 11, 17, 23–27]. Studies have shown thatthe water-soluble and total Ca2+ contents in both theskin and flesh tissue and the total Ca2+ content only inthe skin of fruits with BS were significantly lower than
Fig. 10 q-RT-PCR verification of genes related to BS after different treatments. The error bars are the means ± SEM of three biologicalrepeats (P≤ 0.01)
Wang et al. BMC Plant Biology (2021) 21:321 Page 13 of 18

those of fruits without BS [3]. Alternatively, stress cannot only induce calcium signalling but also the expres-sion of calcium-binding proteins in plants [44]. Fergusonsuggested that an imbalance in Ca2+ contents leads tometabolic disorders that result in physiological diseases[45]. In our study, the expression of calcium-relatedgenes in infected and unaffected pericarp was analysedvia transcriptomic. We detected six calcium-relatedgenes that were upregulated in BS, namely, CaLP2,CaLP3, CML45, CML42, CaLP7, and CaM. These genesare involved in the PPI and MAPK pathways. Inaddition, studies have shown a close relationship be-tween Ca2+ and aquaporin (AQP) activity [46]. The ef-fect of Ca2+ on AQP activity is mainly achieved throughCDPK [47]. Certain environmental factors, such asdrought, low temperature, light exposure and nutritionaldeficiency, can promote the expression of the AQP gene[48, 49]. We detected four AQP genes that showed dif-ferential expression, namely, PIP1–4, PIP2–8, PIP2–2,and PIP2–5 (Fig. 5). The AQP genes may affect BS byregulating the calcium concentration.The MAPK signalling pathway was the most signifi-
cantly enriched pathway in the CK-BS comparison
group, and it is associated with various physiological, de-velopmental and hormonal responses [50]. Molecularand biochemical studies have revealed that MAPK acti-vation correlates with stimulatory treatments, such aslow temperature, drought, wounding, pathogen infec-tion, hyper and hypo-osmolarity, and reactive oxygenspecies [51–55]. Genes involved in both the PPI andMAPK pathways have been detected. PGIP was provento changes the composition of the degradation productsin the cell wall of pear fruit and increases the content ofpectin monomer to induce the disease resistance ofplants [56], which was upregulated in BS. WRKY familyTFs are involved in the plant defence response [57]. Wedetected 12 WRKY family TFs that showed differentialexpression (Fig. 3). Therefore, BS disease may be a mani-festation of fruit responses to adverse environments.Plant hormone signal transduction also plays a critical
role in the formation of BS. Hormonal cues regulatemany aspects of plant growth and development, therebyfacilitating the ability of plants to respond to environ-mental changes systemically [58]. We found that genesinvolved in the IAA signalling pathways were downregu-lated, while genes involved in the GA and CTK
Fig. 11 A proposed model of BS formation in ‘Huangguan’ pear fruits. The red color represents upregulation and green color representsdownregulation. The detailed gene information can be viewed in Additional file 4: Table S3, Table S4 and Fig. 6. IAA, Auxin; GA, gibberellic acid;CTK, cytokinin; ABA, abscisic acid; JA, jasmonic acid; SA, Salicylic acid
Wang et al. BMC Plant Biology (2021) 21:321 Page 14 of 18

signalling pathways were upregulated (Fig. 4). Coldtemperatures have been shown to inhibit plant growthby reducing auxin accumulation [59]. Alternatively, aprevious study showed that low temperature induces anincrease in GA3 sensitivity [60]. We predict that lowtemperature causes the differential expression of planthormone signalling pathway genes, which indicates thatlow temperature might be the most important cause ofBS.Furthermore, the humidity in fruit bags may be an-
other factor that affects BS. Studies have shown that waxis influenced by temperature, light intensity and humid-ity [61], and that high humidity inhibits wax synthesis[62]. In addition to wax, there are reticular or stripcracks on the fruit surface caused by the continuous ex-pansion of flesh cells during the development stage, thusleading to epidermal expansion and cracking. Somestudies have found that these cracks are easily affectedby external environmental factors [63]. These cracksmay be the cause of BS. Under the action of AQP,brown spots are formed in pear fruits. Therefore, humid-ity may be a critical impact factor on BS formation.
Effects of different treatments on BS of ‘Huangguan’ pearKey differentially expressed genes in BS were screenedby transcriptome analysis. The different treatmentsshowed that P and ABA significantly inhibited the inci-dence of BS. Then, the expression of key genes at thetranscriptional level after the treatments was analysed.The results showed that P treatment could improve theexpression of the wax-related genes WSD1 and FAR,resulting in a thicker cuticle. The expression of calcium-related genes CaLP3, CML45, CML42, CaLP7, and CaMwas upregulated, which could alleviate calcium defi-ciency in the fruit exocarp. Additionally, P treatmentimproved the expression of genes involved in both thePPI and MAPK pathways, including LSH10, WRKY53,WRKY71, WRKY33, WRKY31, WRKY26, and WRKY11,which improved the adaptability of fruit to adverse envi-ronments, thereby inhibiting the incidence of BS.ABA treatment also had a certain inhibitory effect on
BS. ABA has been reported to control the expression ofwax synthesis genes and prevent leaf water loss [64].However, it is a major hormone involved in the plant re-sponse to stress. In our results, we found that ABAtreatment can increase the expression of the calcium-related genes CaLP2, CaLP3, CML45, CML42, andCaLP7 and the adaptability of fruits might be improvedby increasing the expression of PGIP, LSH10, WRKY53,WRKY71, WRKY75, WRKY33, WRKY31, WRKY26,WRKY24, and WRKY11. In general, ABA treatment mayroughen the exocarp and improve the disease resistanceof the fruit.
ConclusionThis study shows that the occurrence of BS was accom-panied by a reduction in the wax layer and the accumu-lation of dead cells via lignification. At the transcriptionlevel, genes related to wax synthesis were greatly down-regulated, genes related to suberin and lignin biosyn-thesis were greatly upregulated, and genes related tocalcium and low temperature were upregulated. Inaddition, the endogenous hormone content between theCK and BS groups differed based on a decrease in CTKand an increase in ABA, JA, GA and SA, and these find-ings were consistent with the expression trend of theirsignal transduction-related genes except for CTK. Wealso found that the P and ABA treatments inhibited BSto varying degrees while the GA3 treatment may pro-mote BS. The expression levels of key genes involved inBS formation after the different treatments were consist-ent with the morbidity results. These results provide atheoretical basis for the molecular mechanism under-lying ‘Huangguan’ pear browning spot disease.
MethodsPlant materials and treatmentRipe ‘Huanguan’ pears (CK) and ‘Huangguan’ pears withBS disorder (BS) were harvested from an orchard in agardening field of Dangshan County, Suzhou City, AnhuiProvince, during the harvest season in 2018. Treatmentswere carried out by spraying NaH2PO4·2H2O (0.2%,Sigma 04269), ABA (100 μM, Sigma A1049), and GA3
(300 mg/L, Sigma G8040) on ‘Huangguan’ pears at 10,20, and 30 days after full bloom (DAFB). Reagent treat-ments are commonly used in fruit bags during produc-tion. Each treatment had three biological replicates, andeach tree had approximately 120 treated fruits.Pears were immediately transported to the laboratory
at Anhui Agricultural University (Hefei, China) afterharvest. The 0.5 mm thickness exocarp was dissectedfrom the fruit skin with a double-sided blade. Six bio-logical replicates for metabolic profiling were collectedrandomly from the CK and BS of ‘Huangguan’ pear exo-carp. Three biological replicates of the CK, BS and dif-ferent hormone treatments were used for RNAsequencing (RNA-Seq). The collected fruit samples werefrozen in liquid nitrogen immediately and then stored at− 80 °C.
Observation of paraffin sections and scanning electronmicroscopy of pear exocarpAfter removing the dirt on the fruit surface, a 0.6 cm ×0.7 cm piece was cut on the pear surface with a double-sided blade and immediately fixed in FAA solution. A 3mm tissue block was cut with a sharp blade and thenfixed in electron microscope fixing solution. The prepar-ation of the fruit for paraffin sections and electron
Wang et al. BMC Plant Biology (2021) 21:321 Page 15 of 18
microscopy were conducted at Servicebio (WuHan)Biotechnology Co., Ltd.
Pear postharvest water loss measurement‘Huangguan’ pear fruits with BS disease of the same sizewere stored at room temperature conditions at 25 °Cand used in the experiments, and normal ‘Huangguan’pear fruits were used as a control. The rate of water loss(RWL) was calculated using the formula RWL(%) = (FWt1 − FWt2)/FWt1 × 100% (FWt1 = weight of thefruit at a certain storage time t1, and FWt2 = weight ofthe fruits at a certain storage time t2) [34]. Each grouphad 10 fruits, and three independent biological replicateswere performed.
Evaluation of brown spot disorderAccording to the coverage rate of spots on the surface ofpears, the BS incidence was divided into 4 levels [31]: 0for no browning, 1 for 1 ~ 10%, 2 for 11% ~ 20%, 3 for21% ~ 30, and 31% ~ 100%. The index of BS was calcu-lated based on the following formula: index = Σ (numberof fruit × incidence level)/ [total fruit number × 4 (theseverest level)] [3].
Metabolite statistical analysisAn advanced Xevo G2-XS QTOF mass spectrometer(Waters, UK) was used for data acquisition, and thecommercial software Progenesis QI (version 2.2)(Waters, UK) and the BGI metabolomics software pack-age metaX [65] were used for mass spectrometry dataanalysis (filtering out ions with a relative standard devi-ation (RSD) greater than 30%). Identification was basedon the Kyoto Encyclopedia of Genes and Genomes(KEGG, http://www.genome.jp/kegg/) database. Signifi-cantly enriched pathways were assessed on the basis ofthe false discovery rate-adjusted hypergeometric teststatistic (p ≤ 0.05). We used the prcomp function in theR software package to perform a PCA. The project usesvariable importance in projection (VIP) values of thefirst two principal components in the multivariate PLS-DA model, combined with fold change (FC) and q-values from a univariate analysis to choose differentiallyexpressed metabolites (DEMs) (VIP > 1 and FC > 1.2 or <0.833 and with an adjusted q-value < 0.05 were consid-ered significant). The cluster analysis used the pheatmapfunction in the pheatmap package in R.
Transcriptome analysis of the pear exocarpTotal RNA was purified from plant tissues by ethanolprecipitation and CTAB-PBIOZOL reagent according tothe instructions. DNA nanoballs were loaded into thepatterned nanoarray, and single-end 50-base reads weregenerated on the BGISeq500 platform (BGI-Shenzhen,China). Reads with low quality, connector contamination
and a proportion of N > 5% were removed before thedata analysis to ensure the reliability of the results. Theselected clean reads were mapped to the reference gen-ome of Chinese white pear (Pyrus bretschneideri) [1] viaHISAT. Transcripts were assembled and annotated fromthe read alignment results by Cufflinks v2.1.1 [66]. Thegene expression level was calculated based on the frag-ments per kilobase of transcript per million mapped reads(FPKM), and these results were further used to analysethe differentially expressed genes (DEGs) [67]. The DEG-Seq method was based on a Poisson distribution, andDEG detection was carried out according to the methoddescribed in Wang L. et al. [68]. Transcripts with FCvalues > − 2 (upregulated) or < − 2 (downregulated) andwith an adjusted P-value < 0.001 were considered signifi-cant. The BGI interactive reporting system (https://report.bgi.com) was used for subsequent analysis.
Gene expression analysis by qRT-PCRQuantitative real-time PCR (qRT-PCR) was applied toevaluate the transcription levels of genes associated withBS under different treatments. Total RNAs were extractedfrom collected plant materials using the TRIzol kit(Tiangen) according to the manufacturer’s instructions.qRT-PCR was conducted with the SYBR Green (Toyobo,Shanghai) in an optical 48-well plate using an ABI PRISM7300 Sequence Detection System (Applied Biosystems,Foster City, California). Three biological replicates wereperformed to ensure the reliability of the data.
AbbreviationsBS: Browning spot; MeJA: Methyl jasmonate; 1-MCP: 1-methylcyclopropene;P: NaH2PO4·2H2O; ABA: Abscisic acid; GA3: Gibberellin A3; CTK: Cytokinin;SEM: Scanning electron microscopy; IAA: Auxin; GA: Gibberellin; JA: Jasmonicacid; SA: Salicylic acid; DAFB: Days after full bloom; DEG: Differentiallyexpressed gene; DEM: Differentially expressed metabolite; FPKM: Fragmentsper kilobase of transcript per million mapped reads; FC: Fold change;RWL: The rate of water loss; PCA: Principal component analysis; PLS-DA: Plotsfrom partial least squares discriminant; ESI+: Electrospray ionization positiveion mode; ESI−: Electrospray ionization negative ion mode; TFs: Transcriptionfactors; VIP: Variable importance in projection; PPI: Plant-pathogeninteractions; MAPK: MAPK signaling pathway; AQP: Aquaporin; qRT-PCR: Quantitative real-time PCR
Supplementary InformationThe online version contains supplementary material available at https://doi.org/10.1186/s12870-021-03049-8.
Additional file 1: Figure S1. Show the pericarp surface differencesbetween CK and BS. Figure S2. Show the PCA score plot derived frommetabolite ions. Figure S3. Show the GO enrichment analysis of DEGsbetween CK and BS. Figure S4. KEGG enrichment analysis of DEGsbetween CK and BS. Figure S5. Show the phenotypes of BS inunbagged ‘Huangguan’ pear.
Additional file 2. List the number of reads based on RNA-Seq data.
Additional file 3. List the number of Differential metabolites betweenCK and BS.
Additional file 4. List the detailed information of genes involved in BSformation.
Wang et al. BMC Plant Biology (2021) 21:321 Page 16 of 18

AcknowledgementsThe authors wish to thank Kang Huang (BGI) for assistance with dataanalyses.
Authors’ contributionsQW and WH conceived and designed the study. XNC and DZY conductedtreatments experiment. JF and JCL collected fruits and prepared for RNA.LWZ, PL and ZFY contributed to the data analysis. XYW, BJ and LL preparedthe figures and tables. XYW conducted the qRT-PCR verification. WQ wrotethe manuscript and HW revised the manuscript. All authors read andapproved the final manuscript.
FundingThis project was supported by the National Natural Science Foundation ofChina (31972985) and the earmarked fund for China Agriculture ResearchSystem (CARS-28-14).
Availability of data and materialsThe transcriptome datasets supporting the conclusions of this article areavailable in the National Center for Biotechnology Information (https://www.ncbi.nlm.nih.gov/sra/PRJNA682706). Metabolome datasets supporting theconclusions of this article are available in China National GeneBank DataBase(https://db.cngb.org /CNP0001613).
Declarations
Ethics approval and consent to participateOur research did not involve any human or animal subjects, material, or data.The plant materials used in this study were collected in an orchard in agardening field of Dangshan County, Suzhou City, Anhui Province andconserved by Anhui Agricultural University.
Consent for publicationNot applicable.
Competing interestsThe authors declare that they have no competing interests.
Received: 6 January 2021 Accepted: 26 April 2021
References1. Jun W, Wang ZW, Zebin S, Shu Z, Ray M, Shilin Z, et al. The genome of the
pear (Pyrus bretschneideri Rehd.). Genome Res. 2013;23(2):396–408.2. Yuanwen T. The pear industry and research in China. Acta Hortic. 2011;909:
161–70.3. Dong Y, Guan JF, Ma SJ, Liu LL, Feng YX, Cheng YD. Calcium content and
its correlated distribution with skin browning spot in bagged Huangguanpear. Protoplasma. 2015;252(1):165–71. https://doi.org/10.1007/s00709-014-0665-5.
4. Ma Y, Yang M, Wang J, Jiang CZ, Wang Q. Application of exogenousethylene inhibits postharvest peel browning of 'Huangguan' pear. FrontPlant Sci. 2016;7:2029.
5. Guan JF. Effects of fruit-bag kinds on browning spot and nutrition of ca, mgand K in Huangguan pear. J Auhui Agr Sci. 2008;36(05):1758–9.
6. Liu P, Xue C, Wu TT, Heng W, Jia B, Ye ZF, et al. Molecular analysis of theprocesses of surface brown spot (SBS) formation in pear fruit (Pyrusbretschneideri Rehd. cv. Dangshansuli) by de novo transcriptome assembly.PLoS ONE. 2013;8(9):e74217.
7. Guan JF. Influencing factors and occurrence mechanism of fruit brown spoton bagged 'Huangguan' pear fruit. Deciduous Fruits. 2008;5:15–18.
8. Zhao SB, Wang YH, Han ZT, Geng LF, Du YM. Analysis of the pathogenesisand preventive measures of ‘Jizhua’ disease of Huangguan pear. HebeiFruits. 2005;03:17–8.
9. Guan JF, Ji H, Feng YX, Li LM, Sun YL, Si JL. The correlation of peelbrowning spot with nutrition of ca, mg, K in 'Huangguan' pears. Acta AgrBoreali Sin. 2006;21(03):125–8.
10. Wang YT, Li X, Li Y, Li LL, Zhang SL. Effect of bagging on distribution ofpolysaccharide and lipid in 'Huangguan' pear fruit. J Fruit Sci. 2011;28(06):959–63.
11. Wang YT, Li X, Li Y, Li LL, Zhang SL. Effects of bagging on browning spotincidence and content of different forms of calcium in ‘Huangguan’ pearfruits. Acta Hortic Sin. 2011;38(08):1507–14.
12. Wang JJ, Wang QG. Effect of cold conditioning on postharvest fruit qualityof 'Huangguan' pear. Food Ferment Ind. 2011;37(07):235–9.
13. Li LM, Guan JF, Ji H, Feng YX, Sun YL, Gong XM. Effects of precooling onthe storage quality and peel browning of 'Huangguan' pear. Acta AgrBoreali Sin. 2008;23(06):156–60.
14. Dan L, Cheng YD, Dong Y, Shang ZL, Guan JF. Effects of low temperatureconditioning on fruit quality and peel browning spot in 'Huangguan' pearsduring cold storage. Postharvest Bio Tec. 2017;131:68–73.
15. Ma W, Fan QY, Huang LJ, Rui Ping L, Zhou ZF. Investigation on theocurrence of Jizhua disease of 'Huangguan' pear. J Heb Agr Sci. 2007;11(01):29–31.
16. Han JH, Hong KH, Jang HI, Jo IH, Lee HJ. Effect of characteristics of the bagsand microclimate in the bags on russet of ‘Whangkeumbae’ pear fruit.Korea J Hort Sci Technol. 2002;20(1):32–7.
17. Guan JF, Wenhui M, Hua JI, Yunxiao F, Limei LI, Yulong S, et al. Effects ofbagging and fruit-expander on ca, pectin content and the quality of'Huangguan' pear fruits. Sci Tec Rev. 2008;21:73–6.
18. Xu FX, Zhang KX, Liu SY. Evaluation of 1-methylcyclopropene (1-MCP) andlow temperature conditioning (LTC) to control brown of Huangguan pears.Sci Hortic. 2020;259:108738. https://doi.org/10.1016/j.scienta.2019.108738.
19. Guan JF, Hua JI, Yun-Xiao F, Li-Mei LI, Yu-Long S, Jian-Li S. The correlation ofpeel browning spot with phenolics metabolism in 'Huangguan' pears. ActaAgr Boreali Sin. 2005;20(06):80–3.
20. Galvis-Sánchez AC, Fonseca SC, Gil-Izquierdo Á, Gil MI, Malcata FX. Effect ofdifferent levels of CO2 on the antioxidant content and the polyphenoloxidase activity of ‘Rocha’ pears during cold storage. J Sci Food Agric. 2006;86(4):509–17. https://doi.org/10.1002/jsfa.2359.
21. Oh KS, Lee UY, Wang MH, Hwang YS, Chun JP. Increased carbon dioxidemay accelerate skin browning disorder in 'Chuwhangbae' pear. HorticAbstracts. 2013;10:126.
22. Chengl GW, Crisosto CH. Browning potential, phenolic composition, andpolyphenoloxidase activity of buffer extracts of peach and nectarine skintissue. J Amer Soc Hort Sci. 1995;120(5):835–8. https://doi.org/10.21273/JASHS.120.5.835.
23. Gong XM, Guan JF, Feng YX, Li LM, Sun YL. Effects of calcium and boron onquality and browning spot disease of Huangguan pear. Plant Nutrition andFertilizer ence. 2009;15(04):942–7.
24. Fernández V, Díaz A, Blanco Á, Val J. Surface application of calcium-containing gels to improve quality of late maturing peach cultivars. J SciFood Agr. 2010;89(13):2323–30.
25. Zhang SM, Wang XG, Niu GC, Cheng-Wen Z. Approach to the cause of fruitlenticel pit disease of pingguo pear ── its relationship to calciumnutrient. Northern Fruits. 2001;01:9–10.
26. Liu TZ, Li XY, Li Y, Liu GS, Wang JT, Wang YB, et al. Effect of calciumtreatment during production on quality of stored 'Huangguan' pear fruit.Agr Biotech. 2019;8(02):188–90.
27. Li JX, Zhou Q, Zhou X, Wei B, Ji S. Calcium treatment alleviates pericarpbrowning of 'Nanguo' pears by regulating the GABA shunt after cold storage.Front Plant Sci. 2020;11:580986. https://doi.org/10.3389/fpls.2020.580986.
28. Franck C, Lammertyn J, Ho QT, Verboven P, Verlinden B, Nicolaï BM.Browning disorders in pear fruit. Postharvest Biol Tec. 2007;43(1):1–13.
29. Zhang Y, Ning X, Sun L, Xu T, Pang H, Zhai Z, et al. Analysis of the contentof mineral elements in‘Huangguan’pears of Jizhua disease. J Fruit Sci. 2018;35(S1):131–4.
30. Wei CQ, Ma LH, Cheng YD, Guan YQ, Guan JF. Exogenous ethylenealleviates chilling injury of ‘Huangguan’ pear by enhancing the prolinecontent and antioxidant activity. Sci Hortic. 2019;257:108671. https://doi.org/10.1016/j.scienta.2019.108671.
31. Xing DD, Mu WL, Wang QG. Effect of methyl jasmonate on peel browningof postharvest 'Huangguan' pear. Food Ferment Technol. 2013;49(02):20–4.
32. Gong XM, Guan JF, Zhang JS. Effects of postharvest 1-MCP and calciumtreatments on the quality and skin browning spot incidence of'Huangguan' pear fruit. Acta Hortic Sin. 2010;37(03):375–82.
33. González I, Cao KAL, Davis MJ, Déjean S. Visualising associations betweenpaired ‘omics’ data sets. BioData Min. 2012;5(3):19–42. https://doi.org/10.1186/1756-0381-5-19.
34. Wang YZ, Dai MS, Cai DY, Shi ZB. Proteome and transcriptome profileanalysis reveals regulatory and stress-responsive networks in the russet fruit
Wang et al. BMC Plant Biology (2021) 21:321 Page 17 of 18
skin of sand pear. Hortic Rec. 2020;7(1):16–32. https://doi.org/10.1038/s41438-020-0242-3.
35. Hou W, Singh RK, Zhao P, Martins V, Aguilar E, Canto T, et al. Overexpressionof polygalacturonase-inhibiting protein (PGIP) gene from Hypericumperforatum alters expression of multiple defense-related genes andmodulates recalcitrance to agrobacterium tumefaciens in tobacco. J PlantPhysiol. 2020;253:153268. https://doi.org/10.1016/j.jplph.2020.153268.
36. Medina J, Catalá R, Salinas J. Developmental and stress regulation of RCI2Aand RCI2B, two cold-inducible genes of Arabidopsis encoding highlyconserved hydrophobic proteins. Plant Physiol. 2001;125(4):1655–66. https://doi.org/10.1104/pp.125.4.1655.
37. Tyerman S, Bohnert H, Maurel C, Steudle E, Smith J. Plant acuaporins: theirmolecular biology, biophysics and significance for plant water relations. JExp Bot. 1999;50:1055–71.
38. Wang YZ, Zhang SJ, Dai MS, Shi ZB. Pigmentation in sand pear (Pyruspyrifolia) fruit: biochemical characterization, gene discovery and expressionanalysis with exocarp pigmentation mutant. Plant Mol Biol. 2014;85(1):123–34.
39. Rohart F, Gautier B, Singh A, Cao K-AL. mixOmics: an R package for ‘omicsfeature selection and multiple data integration. PLoS Comput Biol. 2017;13(11):e1005752. https://doi.org/10.1371/journal.pcbi.1005752.
40. Sangprayoon P, Supapvanich S, Youryon P, Wongs-Aree C, BoonyaritthongchaiP. Efficiency of salicylic acid or methyl jasmonate immersions on internalbrowning alleviation and physicochemical quality of queen pineapple cv."Sawi" fruit during cold storage. J Food Biochem. 2019;43(12):1–11.
41. Seo J, Yi G, Lee JG, Choi JH, Lee EJ. Seed browning in pepper (Capsicumannuum L.) fruit during cold storage is inhibited by methyl jasmonate orinduced by methyl salicylate. Postharvest Biol Tec. 2020;166:111210. https://doi.org/10.1016/j.postharvbio.2020.111210.
42. Welker C, Böhm G, Schurig H, Jaenicke R. Cloning, overexpression,purification, and physicochemical characterization of a cold shock proteinhomolog from the hyperthermophilic bacterium Thermotoga maritima.Protein Sci. 1999;8(2):394–403. https://doi.org/10.1110/ps.8.2.394.
43. Nordin K, Vahala T, Palva ET. Differential expression of two related, low-temperature-induced genes in Arabidopsis thaliana. Plant Mol Biol. 1993;21(4):641–53.
44. Ller-Uri MF. Novel plant Ca-binding protein expressed in response toabscisic acid and osmotic stress. J Biol Chem. 1996;271(1):343.
45. SFEH, Ibrahim FM. Calcium: physiological function, deficiency andabsorption. Chem Tech Res. 2015;8(12):196–202.
46. Cabañero FJ, Martínez-Ballesta MC, Teruel JA, Carvajal M. New evidenceabout the relationship between water channel activity and calcium insalinity-stressed pepper plants. Plant cell physiol. 2006;47(2):224–33. https://doi.org/10.1093/pcp/pci239.
47. Maurel C, Verdoucq L, Luu D-T, Santoni V. Plant aquaporins: membranechannels with multiple integrated functions. Annu Rev Plant Biol. 2008;59(1):595–624. https://doi.org/10.1146/annurev.arplant.59.032607.092734.
48. Li HM, Wan XR, He SG. Advances in plant aquaporins. Prog BiochemBiophys. 2010;37(01):29–35. https://doi.org/10.3724/SP.J.1206.2009.00295.
49. Hanba YT, Mineo S, Yasuyuki H, Takahiko H, Kunihiro K, Ichiro T, et al.Overexpression of the barley aquaporin HvPIP2/1 increases internal CO2
conductance and CO2 assimilation in the leaves of transgenic rice plants.Plant Cell Physiol. 2004;5:521–9.
50. Al MGKIE, Ichimura K, Shinozaki K, Tena G, Walker JC. Mitogen-activatedprotein kinase cascades in plants: a new nomenclature. Trends Plant Sci.2002;7(7):301–8.
51. Jagodzik P, Zielinska MT, Ciesla A, Marczak M, Ludwikow A. Mitogen-activated protein kinase cascades in plant hormone signaling. Front PlantSci. 2018;9:1387. https://doi.org/10.3389/fpls.2018.01387.
52. Zhang S, Klessig DF. MAPK cascades in plant defense signaling. Trends PlantSci. 2001;6(11):520-7.
53. Romeis T. Protein kinases in the plant defence response. Curr Opin PlantBiol. 2001;4(5):407-14.
54. Morris PC. MAP kinase signal transduction pathways in plants. New Phytol.2001;151(1):67–89. https://doi.org/10.1046/j.1469-8137.2001.00167.x.
55. Kumar K, Raina SK, Sultan SM. Arabidopsis MAPK signaling pathways andtheir cross talks in abiotic stress response. J Plant Biochem Biot. 2020;29(4):700–14. https://doi.org/10.1007/s13562-020-00596-3.
56. Sharrock KR, Labavitch JM. Polygalacturonase inhibitors of Bartlett pearfruits: differential effects on Botrytis cinerea polygalacturonase isozymes,and influence on products of fungal hydrolysis of pear cell walls and on
ethylene induction in cell culture. Physiol Mol Plant P. 1994;45(4):305–19.https://doi.org/10.1016/S0885-5765(05)80061-X.
57. Dong JX, Chen CH, Chen ZX. Expression profiles of the Arabidopsis WRKYgene superfamily during plant defense response. Plant Mol Biol. 2003;51(1):21–37. https://doi.org/10.1023/A:1020780022549.
58. Tal L, Gil MXA, Guercio AM, Shabek N. Structural aspects of plant hormonesignal perception and regulation by ubiquitin ligases. Plant Physiol. 2020;182(4):1537–44. https://doi.org/10.1104/pp.19.01282.
59. Zhu J, Zhang KX, Wang WS, Gong W, Liu WC, Chen HG, et al. Lowtemperature inhibits root growth by reducing auxin accumulation via ARR1/12. Plant Cell Physiol. 2015;56(4):727–36. https://doi.org/10.1093/pcp/pcu217.
60. Paleg SLG. Low temperature-induced GA3 sensitivity of wheat: II. Changes inlipids associated with the low temperature-induced GA3 sensisivity ofisolated aleurone of kite. Plant Physiol. 1984;76(1):143–7.
61. Shepherd T, Griffiths DW. The effects of stress on plant cuticular waxes. NewPhytol. 2010;171(3):469–99.
62. Koch K, Hartmann KD, Schreiber L, Barthlott W, Neinhuis C. Influences of airhumidity during the cultivation of plants on wax chemical composition,morphology and leaf surface wettability. Environ Exp Bot. 2006;56(1):1–9.https://doi.org/10.1016/j.envexpbot.2004.09.013.
63. Isabel L, Burcu B, FGL. The fruit cuticle as a modulator of postharvest quality.Postharvest Bio Tec. 2014;87:103–12.
64. Cui FQ, Brosché M, Lehtonen Mikko T, Amiryousefi A, Xu E. Dissectingabscisic acid signaling pathways involved in cuticle formation. Mol Plant.2016;9(6):926–38. https://doi.org/10.1016/j.molp.2016.04.001.
65. Wen B, Mei ZL, Zeng CW, Liu SQ. metaX: a flexible and comprehensivesoftware for processing metabolomics data. BMC Bioinformatics. 2017;18(1):183–97. https://doi.org/10.1186/s12859-017-1579-y.
66. Trapnell C, Roberts A, Goff L, Pertea G, Kim D, Kelley DR, et al. Differentialgene and transcript expression analysis of RNA-seq experiments withTopHat and cufflinks. Nat Protoc. 2012;7(3):562–78. https://doi.org/10.1038/nprot.2012.016.
67. Trapnell C, Williams BA, Pertea G, Mortazavi A, Kwan G, Baren MJ, et al.Transcript assembly and quantification by RNA-Seq reveals unannotatedtranscripts and isoform switching during cell differentiation. Nat Biotechnol.2010;28(5):511–U174. https://doi.org/10.1038/nbt.1621.
68. Wang L, Feng Z, Wang X, Wang X, Zhang X. DEGseq: an R package foridentifying differentially expressed genes from RNA-seq data. Bioinformatics.2010;26(1):136–8. https://doi.org/10.1093/bioinformatics/btp612.
Publisher’s NoteSpringer Nature remains neutral with regard to jurisdictional claims inpublished maps and institutional affiliations.
Wang et al. BMC Plant Biology (2021) 21:321 Page 18 of 18


![Systems Metabolomic Lecture[1]](https://img.pdfslide.net/doc/110x75/546af5e0b4af9f486b8b45b1/systems-metabolomic-lecture1.jpg)