Embed Size (px)
Citation preview
May 2017
TransDigmNon-Deal Roadshow
Agenda
1
TransDigm Overview Nick HowleyChairman and CEO
TransDigm Organic Growth & Outlook Nick HowleyChairman and CEO
Consistent Operating Model & Customer Value Kevin SteinPresident and COO
Financial Topics Terrry ParadieExecutive Vice President and CFO
Q&A
Forward Looking Statements
This presentation contains forward-looking statements within the meaning of the Private Securities Litigation Reform Act of 1995,
including information regarding our guidance for future periods. These forward-looking statements are based on management’s
current expectations and beliefs, as well as a number of assumptions concerning future events, many of which are outside of our
control. These statements are subject to risks and uncertainties that could cause actual results to differ materially from those
expressed or implied in the forward-looking statement. These risks and uncertainties include but are not limited to: the sensitivity of
our business to the number of flight hours that our customers’ planes spend aloft and our customers’ profitability, both of which are
affected by general economic conditions; future terrorist attacks; cyber-security threats and natural disasters; our reliance on
certain customers; the U.S. defense budget and risks associated with being a government supplier; failure to maintain government
or industry approvals; failure to complete or successfully integrate acquisitions; our substantial indebtedness; potential
environmental liabilities; increases in costs that cannot be recovered in product pricing; risks associated with our international sales
and operations; and other factors. Further information regarding the important factors that could cause actual results to differ
materially from projected results can be found in TransDigm Group’s Annual Report on Form 10-K and other reports that TransDigm
Group or its subsidiaries have filed with the Securities and Exchange Commission.
You are cautioned not to place undue reliance on our forward-looking statements. TransDigm Group Incorporated assumes no
obligation to, and expressly disclaims any obligation to, update or revise any forward-looking statements, whether as a result of new
information, future events or otherwise.
2
Special Notice Regarding Pro Forma and Non-GAAP Information
This presentation sets forth certain pro forma financial information. This pro forma financial information gives effect to certain
recently completed acquisitions. Such pro forma information is based on certain assumptions and adjustments and does not
purport to present TransDigm's actual results of operations or financial condition had the transactions reflected in such pro forma
financial information occurred at the beginning of the relevant period, in the case of income statement information, or at the end of
such period, in the case of balance sheet information, nor is it necessarily indicative of the results of operations that may be
achieved in the future.
This presentation also sets forth certain non-GAAP financial measures. A presentation of the most directly comparable GAAP
measures and a reconciliation to such measures are set forth in the appendix.
3
“Private Equity-Like Growth in Value with Liquidity of a Public Market”
+ 15% - 20% / Year on Average
4
Shareholder’s Value Proposition
Unique & Consistent Business StrategyPrivate & Public
5
Proprietary Aerospace Products with Significant Aftermarket
3-Part Value-Based Operating Strategy
Decentralized, Organization / Aligned with Shareholders
Focused Disciplined Acquisition Strategy
“Private Equity-Like” Capital Structure & Culture
TransDigm’s Consistent Goal – “Private Equity-Like” Returns to Shareholders
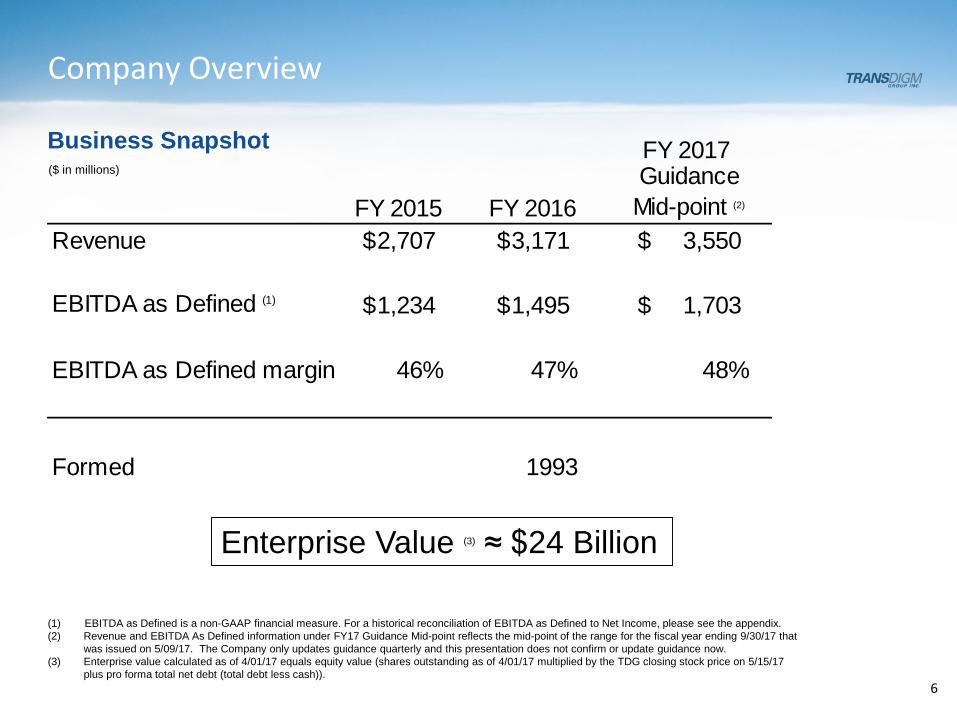
Company Overview
6
FY 2017
FY 2015 FY 2016Guidance Mid-point (2)
Revenue 2,707$ 3,171$ 3,550$
EBITDA as Defined (1) 1,234$ 1,495$ 1,703$
EBITDA as Defined margin 46% 47% 48%
Formed 1993
($ in millions)
Enterprise Value (3) ≈ $24 Billion
(1) EBITDA as Defined is a non-GAAP financial measure. For a historical reconciliation of EBITDA as Defined to Net Income, please see the appendix.(2) Revenue and EBITDA As Defined information under FY17 Guidance Mid-point reflects the mid-point of the range for the fiscal year ending 9/30/17 that
was issued on 5/09/17. The Company only updates guidance quarterly and this presentation does not confirm or update guidance now. (3) Enterprise value calculated as of 4/01/17 equals equity value (shares outstanding as of 4/01/17 multiplied by the TDG closing stock price on 5/15/17
plus pro forma total net debt (total debt less cash)).
Business Snapshot
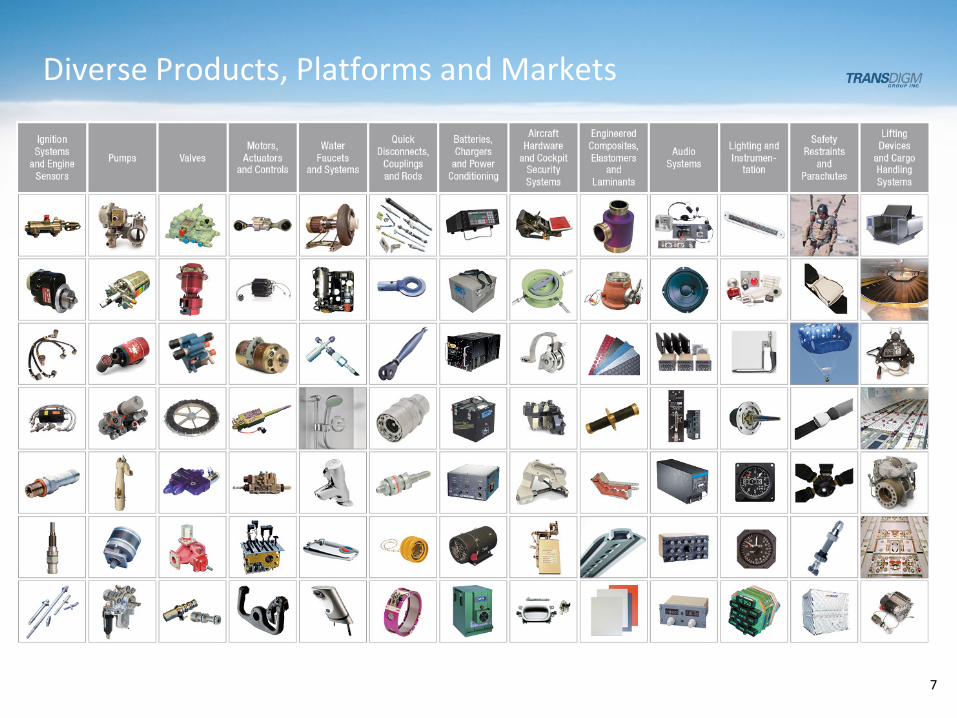
Diverse Products, Platforms and Markets
7
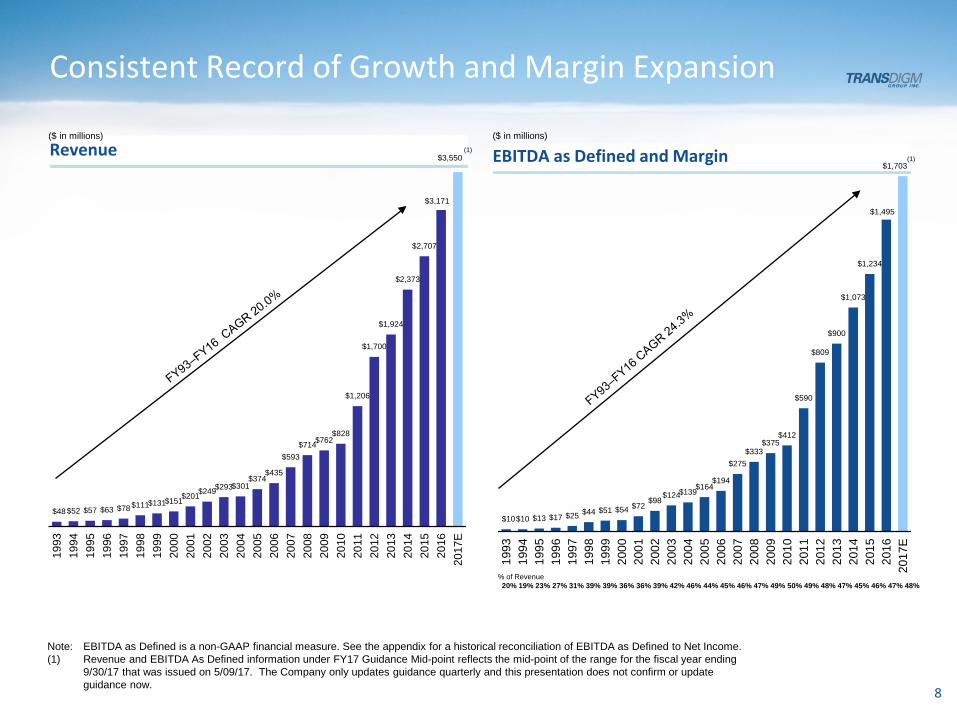
EBITDA as Defined and MarginRevenue
Consistent Record of Growth and Margin Expansion
Note: EBITDA as Defined is a non-GAAP financial measure. See the appendix for a historical reconciliation of EBITDA as Defined to Net Income.(1) Revenue and EBITDA As Defined information under FY17 Guidance Mid-point reflects the mid-point of the range for the fiscal year ending
9/30/17 that was issued on 5/09/17. The Company only updates guidance quarterly and this presentation does not confirm or update guidance now.
($ in millions)
$48$52 $57 $63 $78$111$131$151$201$249$293$301$374
$435
$593$714$762
$828
$1,206
$1,700
$1,924
$2,373
$2,707
$3,171
$3,550
1993
1994
1995
1996
1997
1998
1999
2000
2001
2002
2003
2004
2005
2006
2007
2008
2009
2010
2011
2012
2013
2014
2015
2016
2017
E
($ in millions)
$10$10 $13 $17 $25 $44 $51 $54 $72 $98$124$139$164$194
$275$333
$375$412
$590
$809
$900
$1,073
$1,234
$1,495
$1,703
1993
1994
1995
1996
1997
1998
1999
2000
2001
2002
2003
2004
2005
2006
2007
2008
2009
2010
2011
2012
2013
2014
2015
2016
2017
E
8
(1)(1)
% of Revenue20% 19% 23% 27% 31% 39% 39% 36% 36% 39% 42% 46% 44% 45% 46% 47% 49% 50% 49% 48% 47% 45% 46% 47% 48%
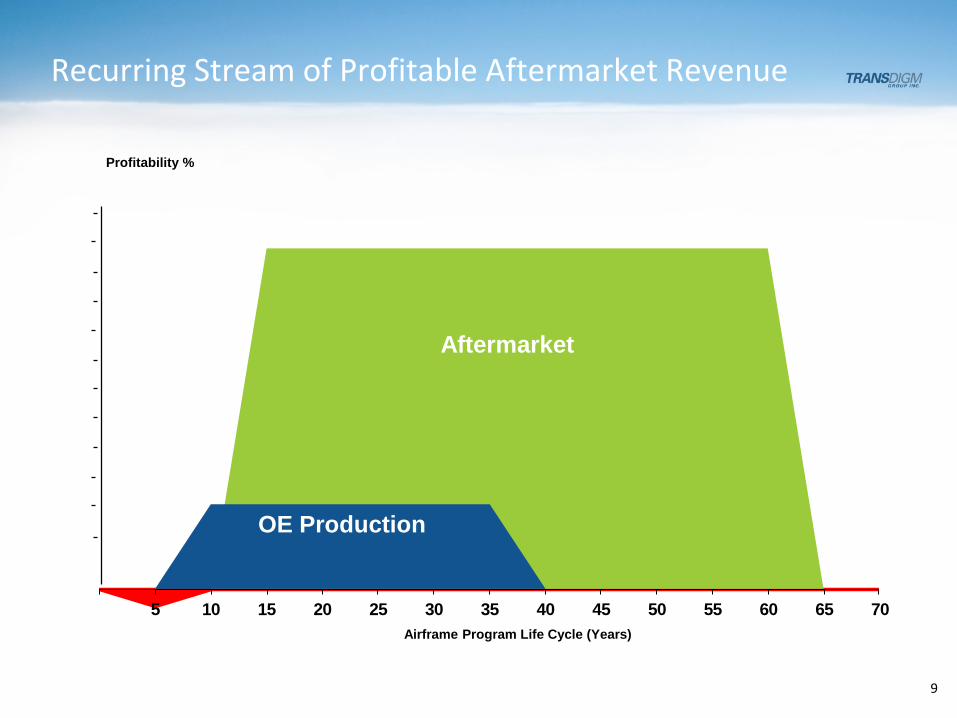
Recurring Stream of Profitable Aftermarket Revenue
9
5 10 15 20 25 30 35 40 45 50 55 60 65 70
Profitability %
Airframe Program Life Cycle (Years)
Aftermarket
OE Production
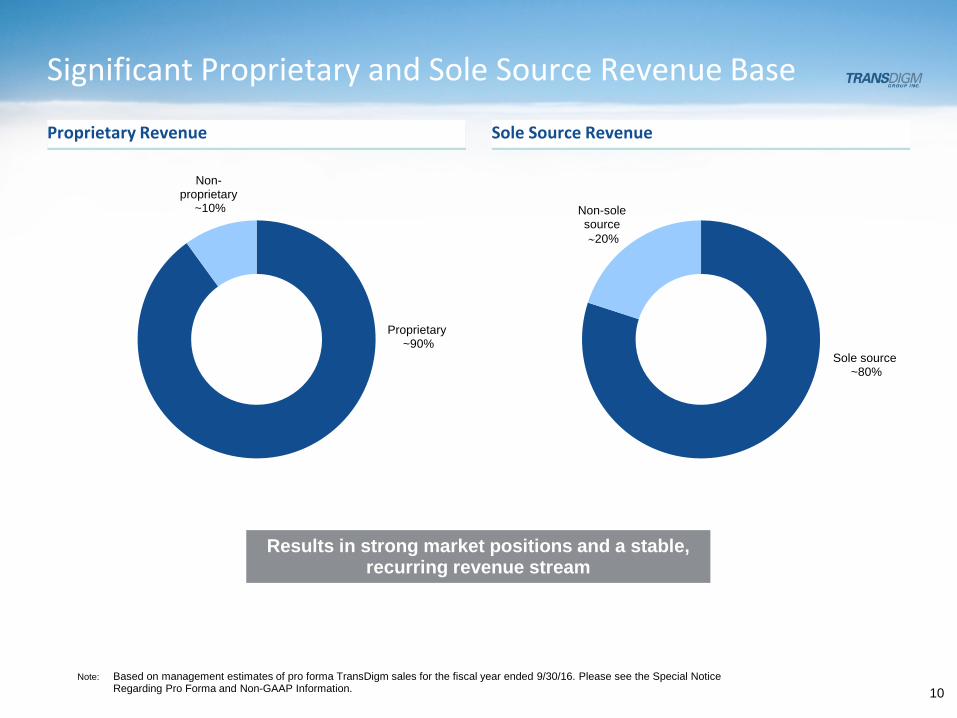
Sole Source RevenueProprietary Revenue
Significant Proprietary and Sole Source Revenue Base
Proprietary~90%
Non-proprietary
~10%
Note: Based on management estimates of pro forma TransDigm sales for the fiscal year ended 9/30/16. Please see the Special Notice Regarding Pro Forma and Non-GAAP Information.
Sole source~80%
Non-sole source∼20%
10
Results in strong market positions and a stable, recurring revenue stream
11
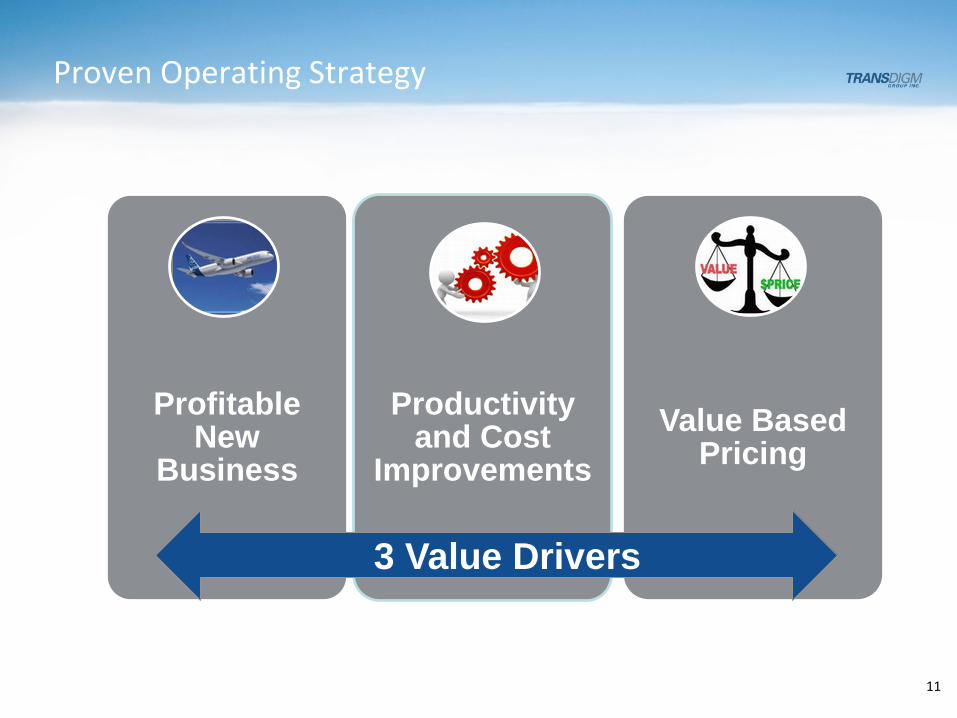
Proven Operating Strategy
Profitable New
Business
Productivity and Cost
ImprovementsValue Based
Pricing
3 Value Drivers
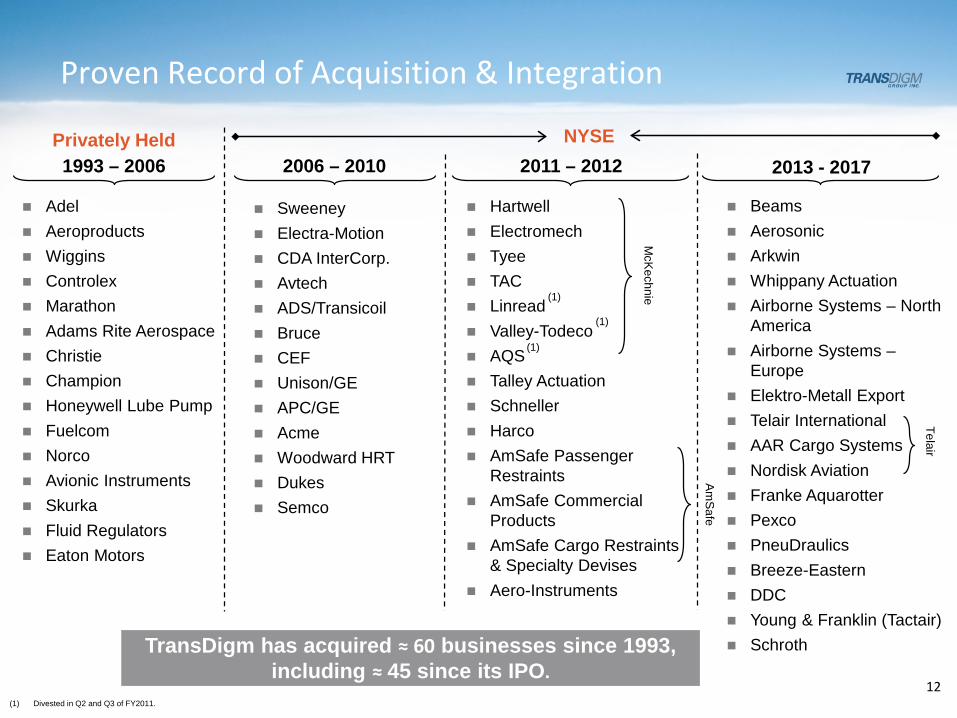
1993 – 2006 2006 – 2010 2011 – 2012
Adel Aeroproducts Wiggins Controlex Marathon Adams Rite Aerospace Christie Champion Honeywell Lube Pump Fuelcom Norco Avionic Instruments Skurka Fluid Regulators Eaton Motors
Hartwell Electromech Tyee TAC Linread Valley-Todeco AQS Talley Actuation Schneller Harco AmSafe Passenger
Restraints AmSafe Commercial
Products AmSafe Cargo Restraints
& Specialty Devises Aero-Instruments
2013 - 2017
Sweeney Electra-Motion CDA InterCorp. Avtech ADS/Transicoil Bruce CEF Unison/GE APC/GE Acme Woodward HRT Dukes Semco
Privately Held NYSE
TransDigm has acquired ≈ 60 businesses since 1993, including ≈ 45 since its IPO.
(1)
(1) Divested in Q2 and Q3 of FY2011.
(1)
(1)
Proven Record of Acquisition & Integration
Beams Aerosonic Arkwin Whippany Actuation Airborne Systems – North
America Airborne Systems –
Europe Elektro-Metall Export Telair International AAR Cargo Systems Nordisk Aviation Franke Aquarotter Pexco PneuDraulics Breeze-Eastern DDC Young & Franklin (Tactair) Schroth
McKechnie
AmSafe
Telair
12
13
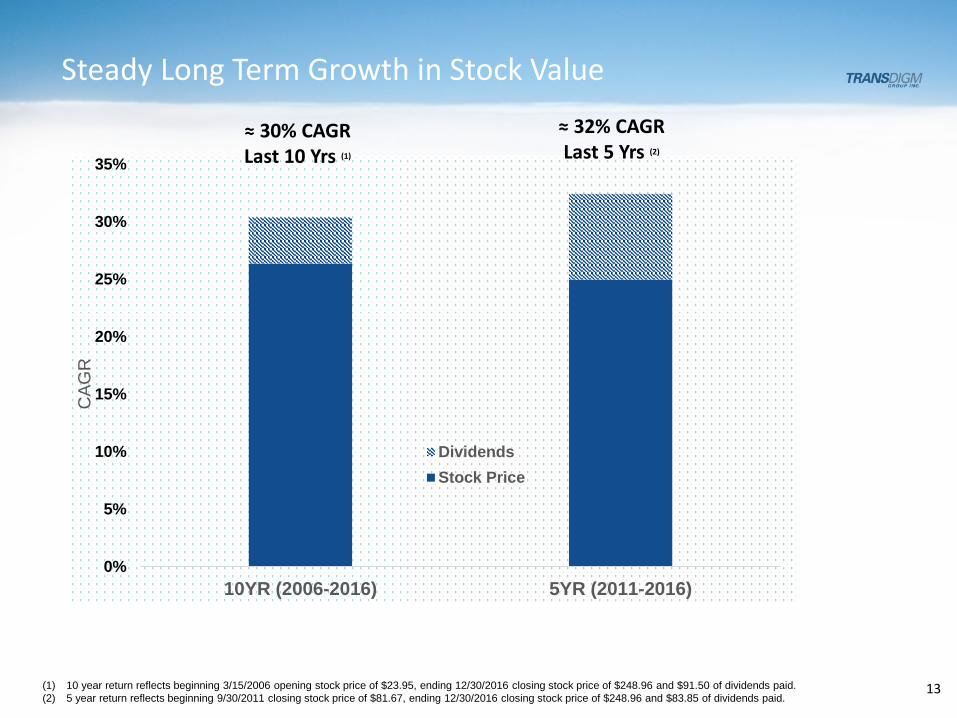
Steady Long Term Growth in Stock Value
0%
5%
10%
15%
20%
25%
30%
35%
10YR (2006-2016) 5YR (2011-2016)
CAG
R
DividendsStock Price
(1) 10 year return reflects beginning 3/15/2006 opening stock price of $23.95, ending 12/30/2016 closing stock price of $248.96 and $91.50 of dividends paid.(2) 5 year return reflects beginning 9/30/2011 closing stock price of $81.67, ending 12/30/2016 closing stock price of $248.96 and $83.85 of dividends paid.
≈ 30% CAGR Last 10 Yrs (1)
≈ 32% CAGR Last 5 Yrs (2)
TDG Organic Growth & Outlook
Definition of Acronyms:
LSD = Low Single-Digit Percent Growth
MSD = Mid Single-Digit Percent Growth
HSD = High Single-Digit Percent Growth
LDD = Low Double-Digit Percent Growth
14
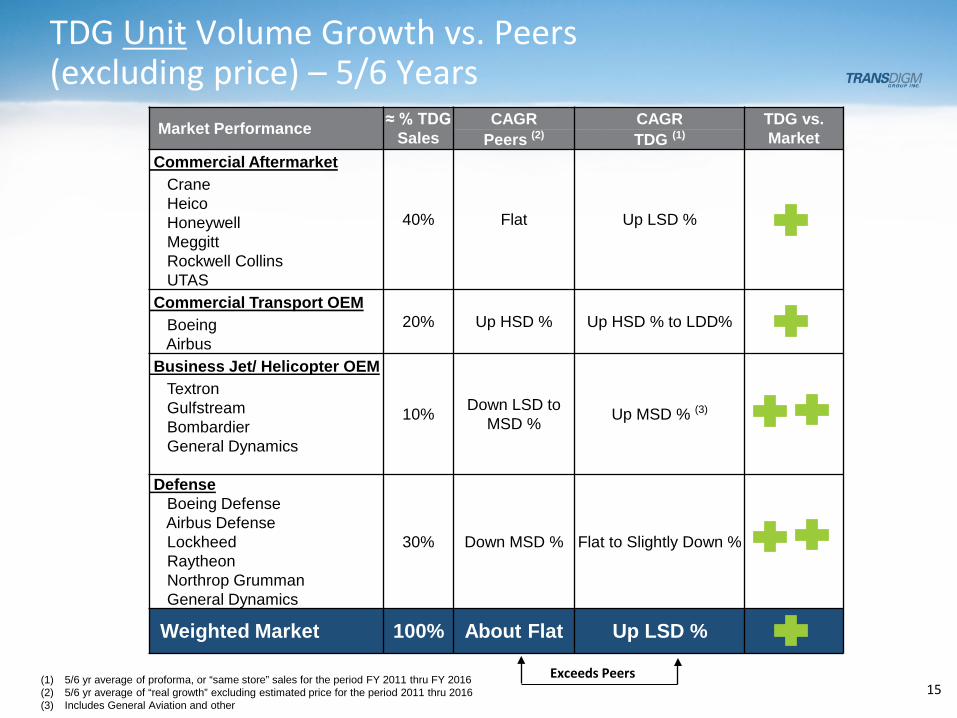
TDG Unit Volume Growth vs. Peers (excluding price) – 5/6 Years
15(1) 5/6 yr average of proforma, or “same store” sales for the period FY 2011 thru FY 2016(2) 5/6 yr average of “real growth” excluding estimated price for the period 2011 thru 2016(3) Includes General Aviation and other
Exceeds PeersAbout Flat
Market Performance ≈ % TDG Sales
CAGR CAGR TDG vs. MarketPeers (2) TDG (1)
Commercial Aftermarket
40% Flat Up LSD %
CraneHeicoHoneywellMeggittRockwell CollinsUTAS
Commercial Transport OEM20% Up HSD % Up HSD % to LDD%Boeing
AirbusBusiness Jet/ Helicopter OEM
10% Down LSD to MSD % Up MSD % (3)
TextronGulfstreamBombardierGeneral Dynamics
Defense
30% Down MSD % Flat to Slightly Down %
Boeing DefenseAirbus DefenseLockheedRaytheonNorthrop GrummanGeneral Dynamics
Weighted Market 100% About Flat Up LSD %
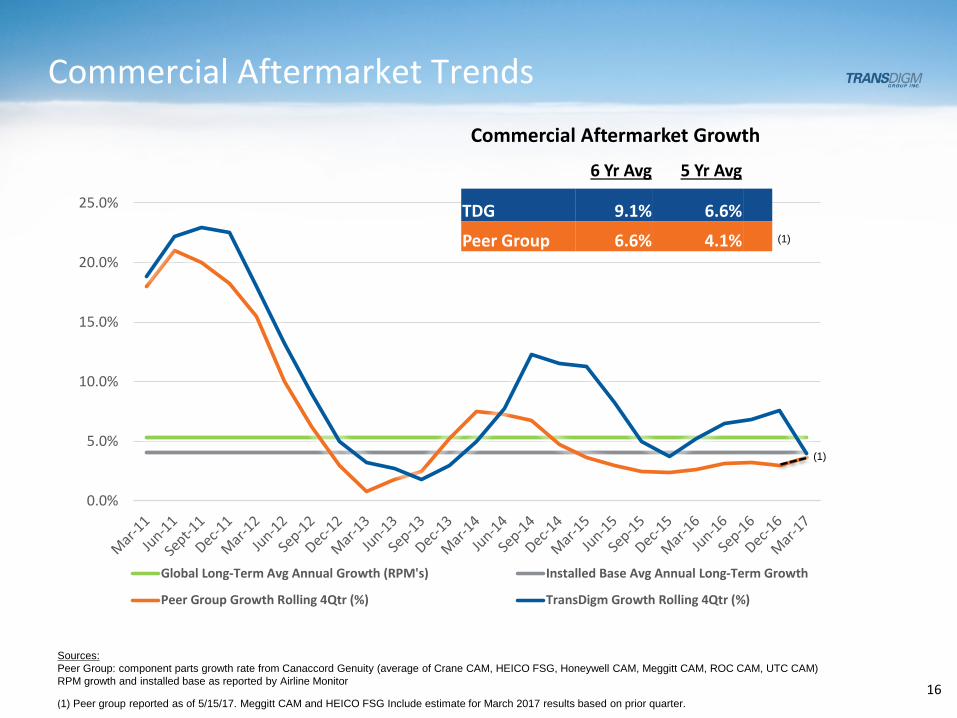
Commercial Aftermarket Trends
0.0%
5.0%
10.0%
15.0%
20.0%
25.0%
Global Long-Term Avg Annual Growth (RPM's) Installed Base Avg Annual Long-Term Growth
Peer Group Growth Rolling 4Qtr (%) TransDigm Growth Rolling 4Qtr (%)
(1)
(1)
Sources:Peer Group: component parts growth rate from Canaccord Genuity (average of Crane CAM, HEICO FSG, Honeywell CAM, Meggitt CAM, ROC CAM, UTC CAM)RPM growth and installed base as reported by Airline Monitor
6 Yr Avg 5 Yr Avg
TDG 9.1% 6.6%
Peer Group 6.6% 4.1%
Commercial Aftermarket Growth
(1) Peer group reported as of 5/15/17. Meggitt CAM and HEICO FSG Include estimate for March 2017 results based on prior quarter. 16
17
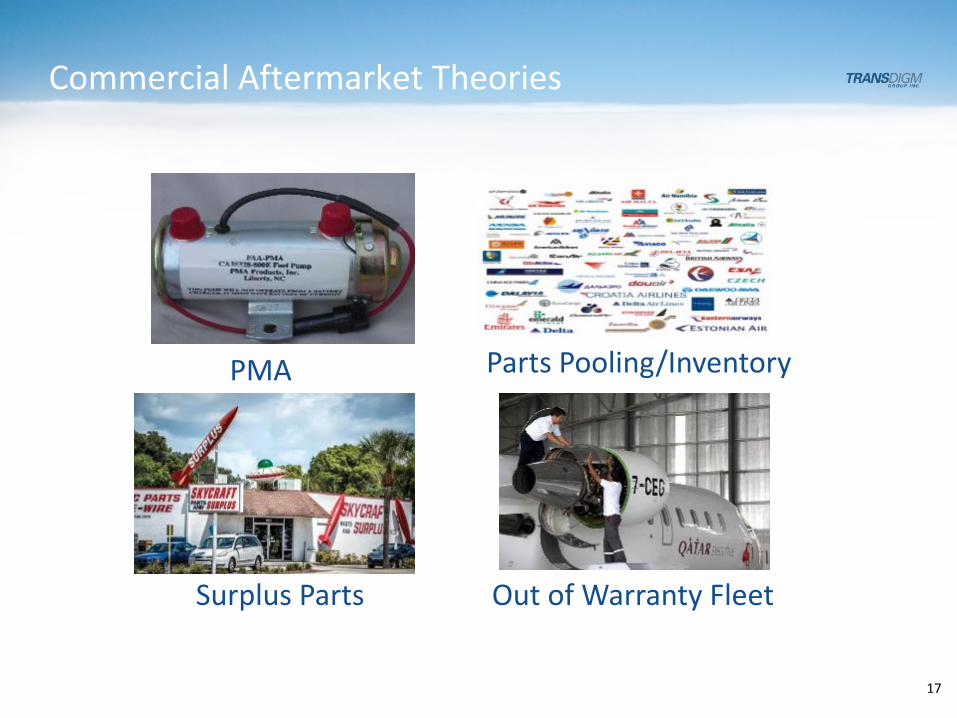
Commercial Aftermarket Theories
PMA
Out of Warranty FleetSurplus Parts
Parts Pooling/Inventory
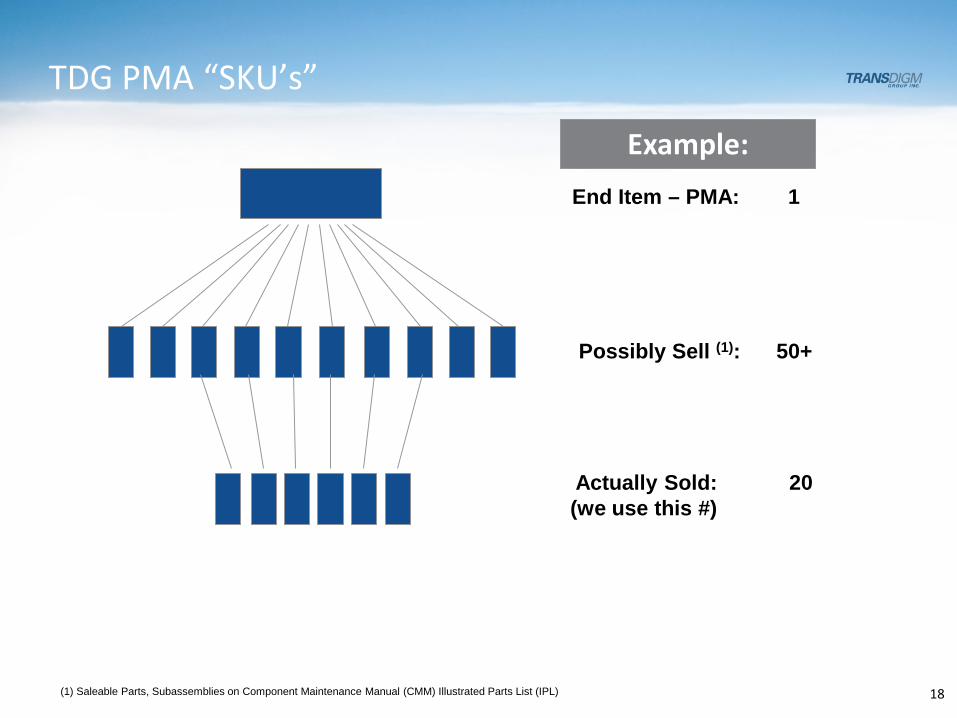
TDG PMA “SKU’s”
End Item – PMA: 1
Actually Sold: 20(we use this #)
(1) Saleable Parts, Subassemblies on Component Maintenance Manual (CMM) Illustrated Parts List (IPL)
Possibly Sell (1): 50+
18
Example:
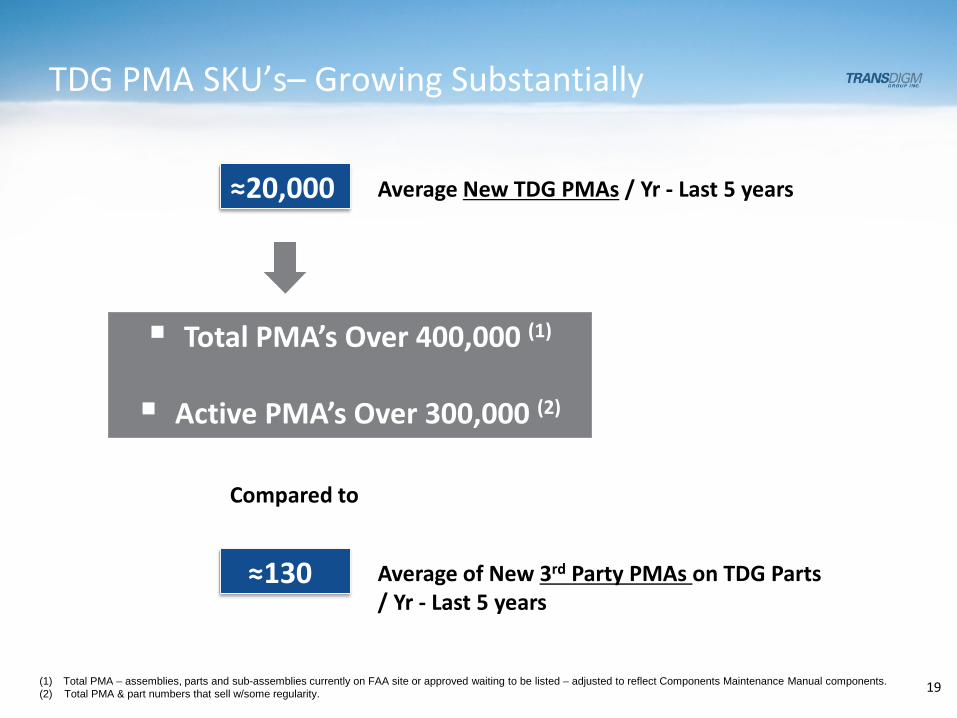
TDG PMA SKU’s– Growing Substantially
≈20,000
Total PMA’s Over 400,000 (1)
Active PMA’s Over 300,000 (2)
≈130
Compared to
(1) Total PMA – assemblies, parts and sub-assemblies currently on FAA site or approved waiting to be listed – adjusted to reflect Components Maintenance Manual components.(2) Total PMA & part numbers that sell w/some regularity.
Average New TDG PMAs / Yr - Last 5 years
Average of New 3rd Party PMAs on TDG Parts/ Yr - Last 5 years
19
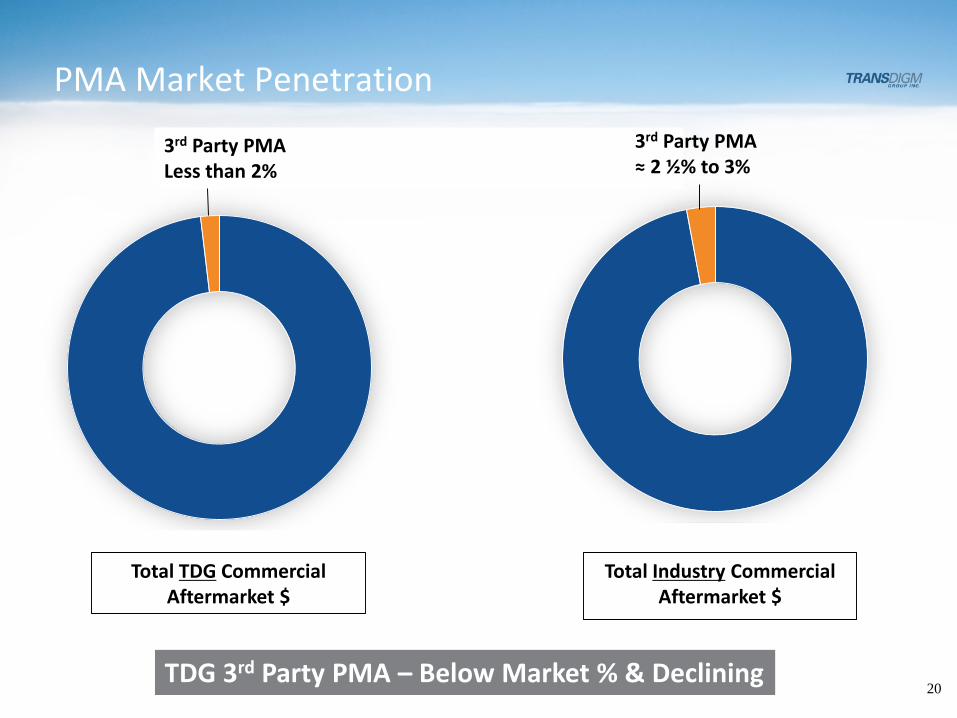
TDG 3rd Party PMA – Below Market % & Declining 20
PMA Market Penetration
3rd Party PMALess than 2%
3rd Party PMA≈ 2 ½% to 3%
Total TDG Commercial Aftermarket $
Total Industry Commercial Aftermarket $
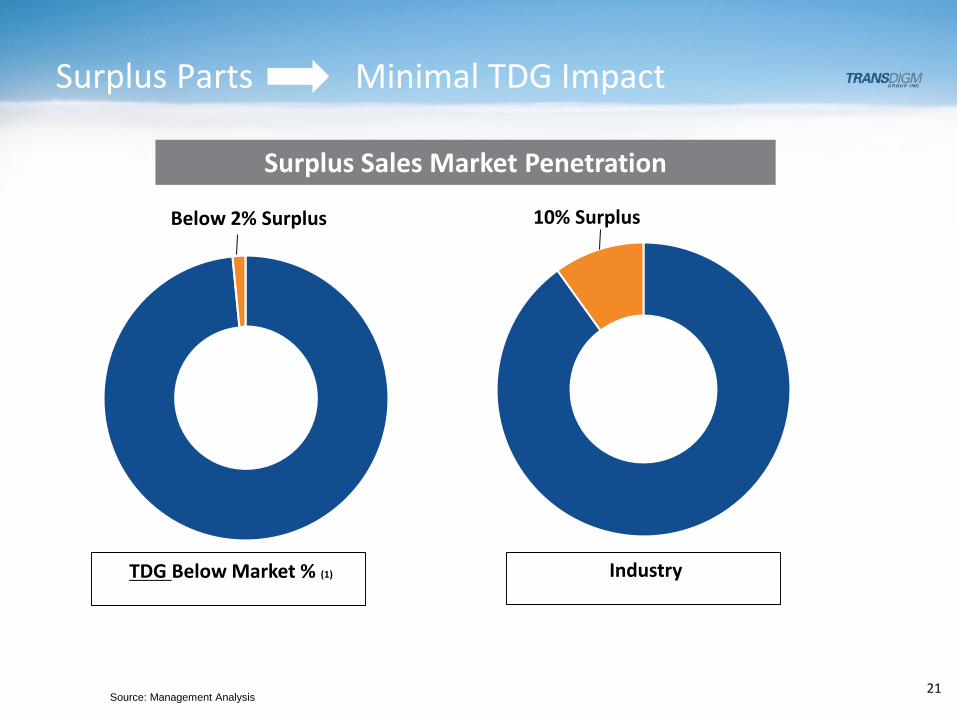
Surplus Parts Minimal TDG Impact
21Source: Management Analysis
10% SurplusBelow 2% Surplus
Surplus Sales Market Penetration
TDG Below Market % (1) Industry
22
0
200
400
600
800
1000
1200
1400
1600
1800
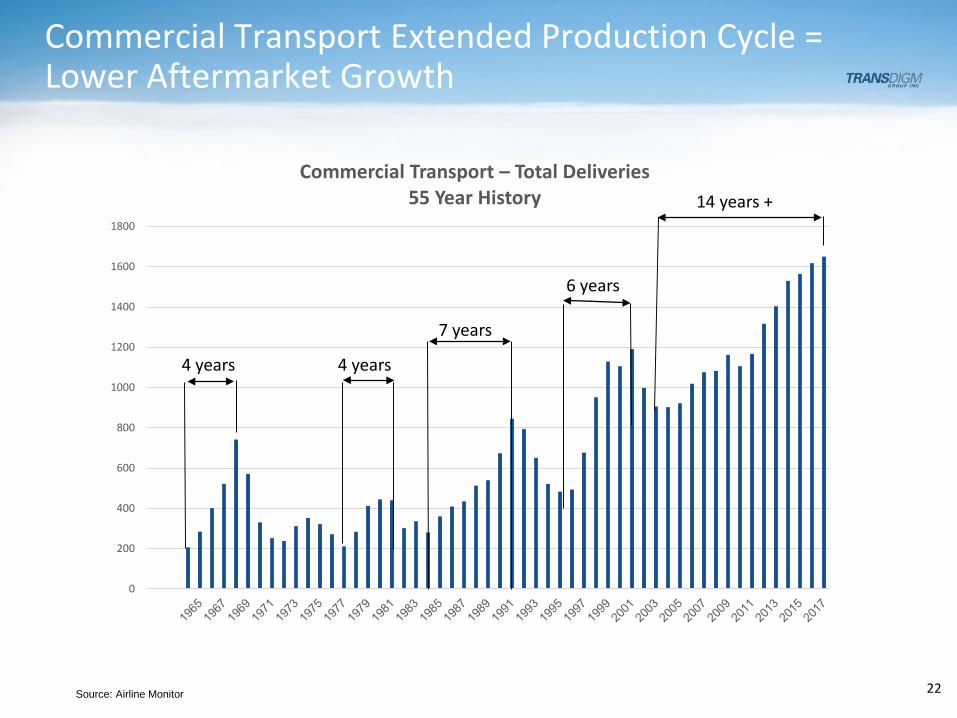
Commercial Transport – Total Deliveries55 Year History
4 years
6 years
Commercial Transport Extended Production Cycle = Lower Aftermarket Growth
4 years
7 years
14 years +
Source: Airline Monitor
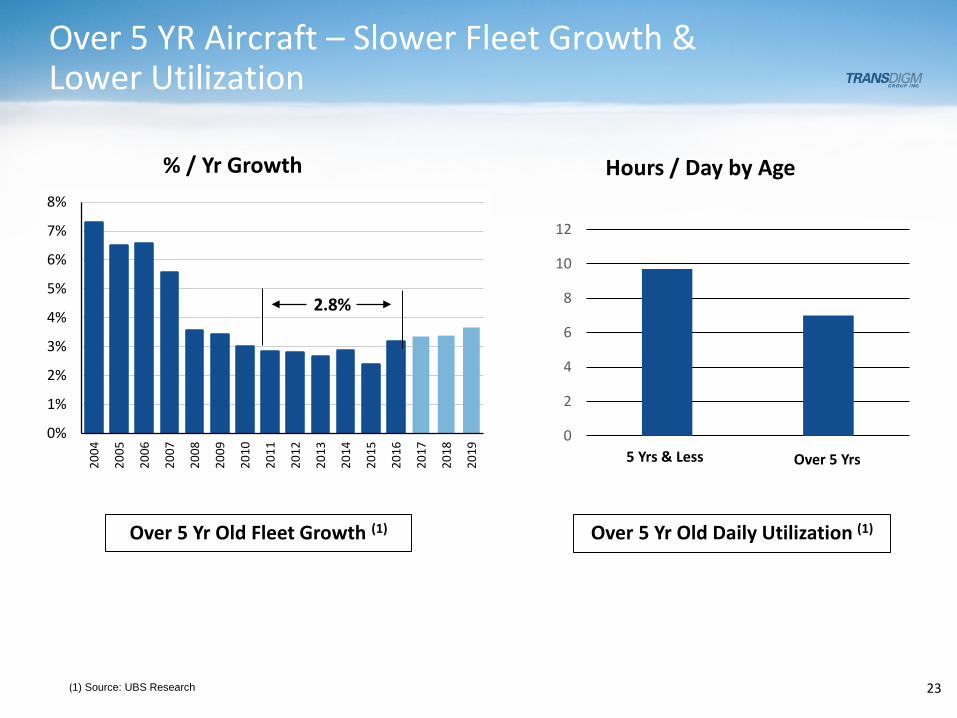
Over 5 YR Aircraft – Slower Fleet Growth & Lower Utilization
23
0
2
4
6
8
10
12
Hours / Day by Age
0%
1%
2%
3%
4%
5%
6%
7%
8%
2004
2005
2006
2007
2008
2009
2010
2011
2012
2013
2014
2015
2016
2017
2018
2019
% / Yr Growth
2.8%
(1) Source: UBS Research
Over 5 Yr Old Fleet Growth (1) Over 5 Yr Old Daily Utilization (1)
5 Yrs & Less Over 5 Yrs
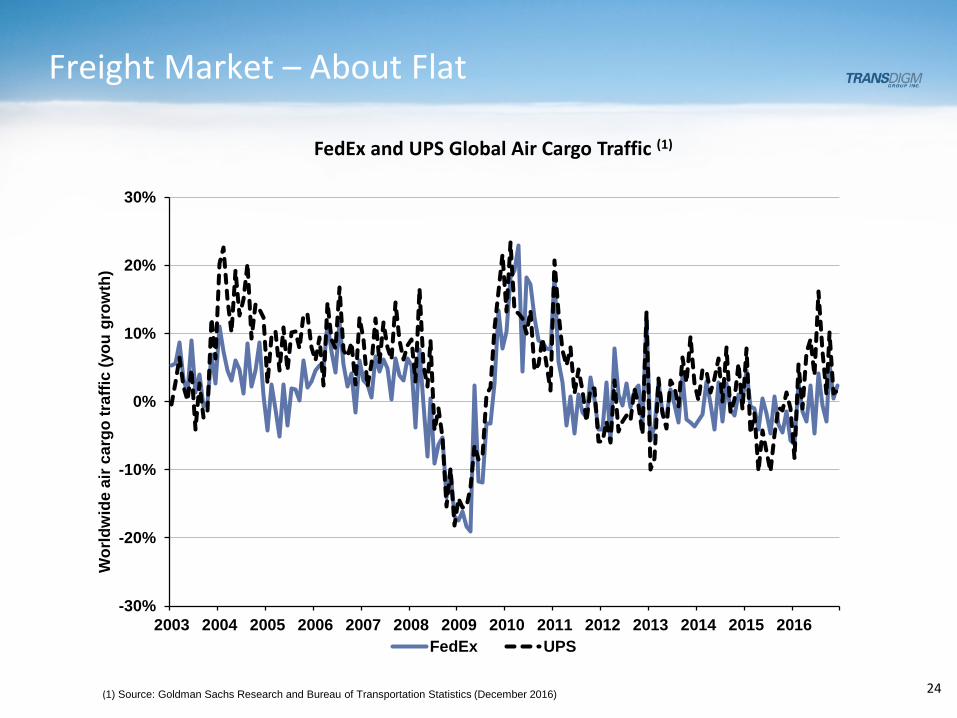
Freight Market – About Flat
24
-30%
-20%
-10%
0%
10%
20%
30%
2003 2004 2005 2006 2007 2008 2009 2010 2011 2012 2013 2014 2015 2016
Wor
ldw
ide
air c
argo
traf
fic (y
ou g
row
th)
FedEx UPS
(1) Source: Goldman Sachs Research and Bureau of Transportation Statistics (December 2016)
FedEx and UPS Global Air Cargo Traffic (1)
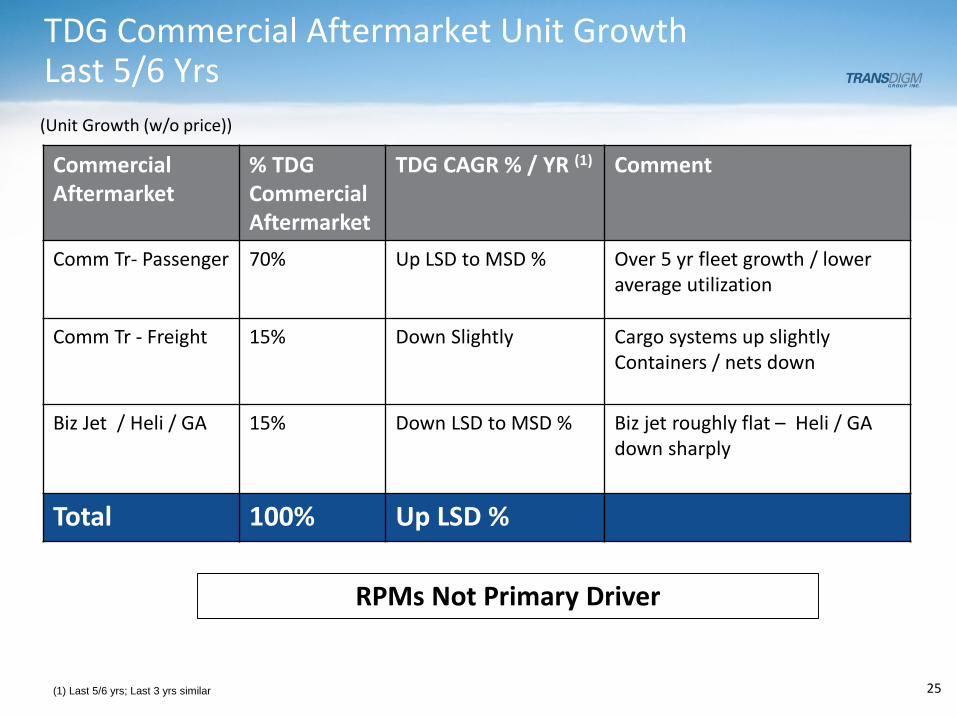
TDG Commercial Aftermarket Unit GrowthLast 5/6 Yrs
25(1) Last 5/6 yrs; Last 3 yrs similar
(Unit Growth (w/o price))
RPMs Not Primary Driver
Commercial Aftermarket
% TDGCommercial Aftermarket
TDG CAGR % / YR (1) Comment
Comm Tr- Passenger 70% Up LSD to MSD % Over 5 yr fleet growth / loweraverage utilization
Comm Tr - Freight 15% Down Slightly Cargo systems up slightlyContainers / nets down
Biz Jet / Heli / GA 15% Down LSD to MSD % Biz jet roughly flat – Heli / GA down sharply
Total 100% Up LSD %
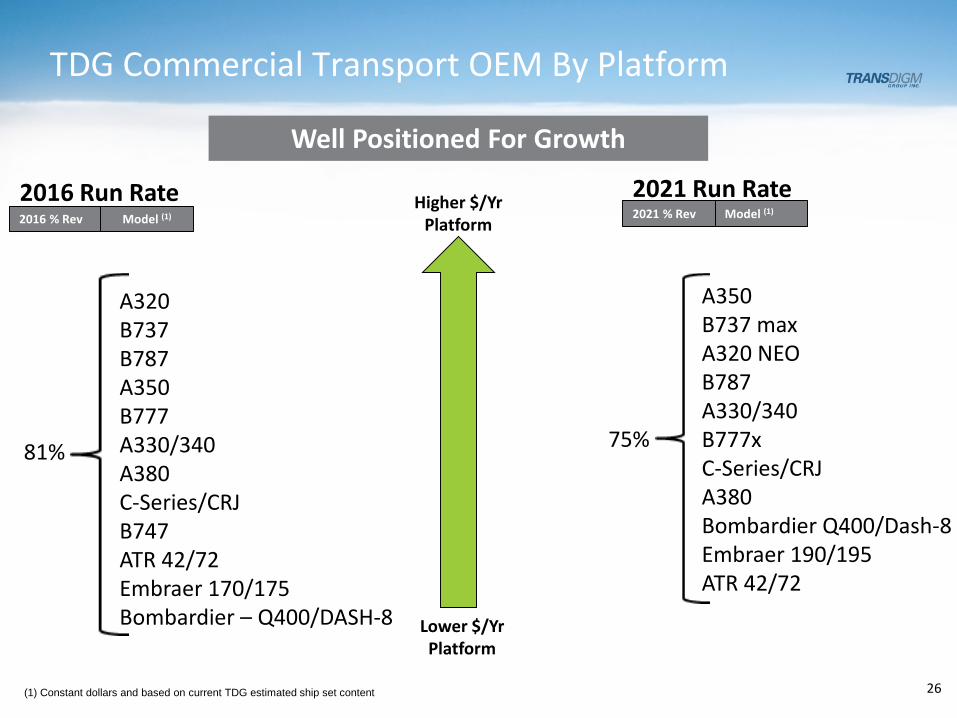
TDG Commercial Transport OEM By Platform
26
A320B737B787A350B777A330/340A380C-Series/CRJB747ATR 42/72Embraer 170/175Bombardier – Q400/DASH-8
A350B737 maxA320 NEOB787A330/340B777xC-Series/CRJA380Bombardier Q400/Dash-8Embraer 190/195ATR 42/72
Higher $/YrPlatform
Lower $/YrPlatform
81% 75%
2016 Run Rate
(1) Constant dollars and based on current TDG estimated ship set content
Well Positioned For Growth
2021 Run Rate2016 % Rev Model (1) 2021 % Rev Model (1)
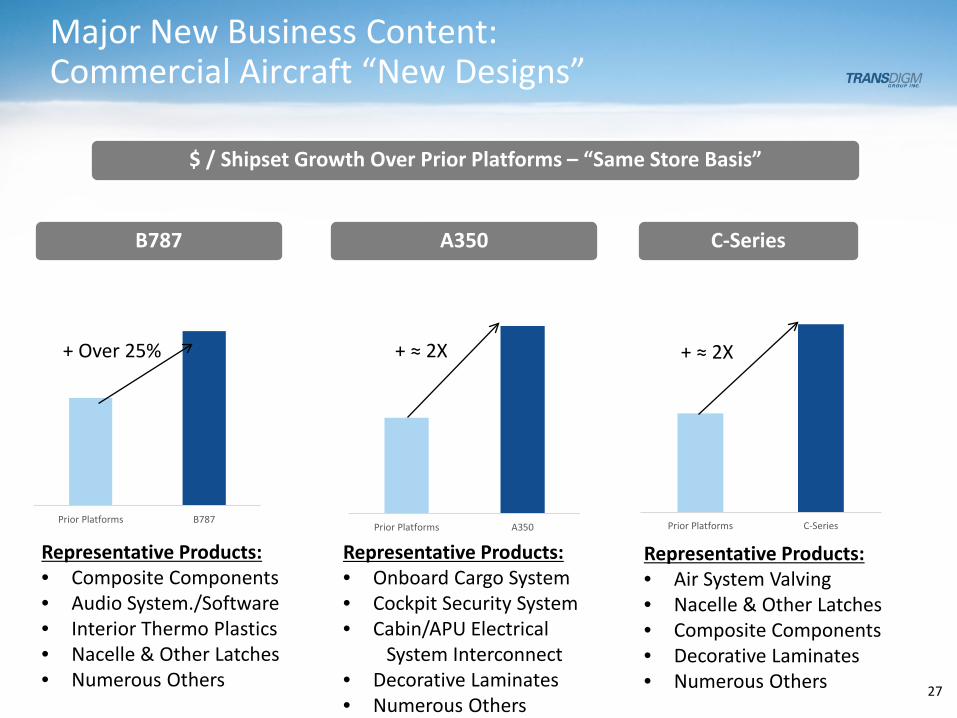
Prior Platforms C-SeriesPrior Platforms A350Prior Platforms B787
Major New Business Content:Commercial Aircraft “New Designs”
2727
B787 A350 C-Series
$ / Shipset Growth Over Prior Platforms – “Same Store Basis”
Representative Products:• Composite Components• Audio System./Software• Interior Thermo Plastics• Nacelle & Other Latches• Numerous Others
Representative Products:• Onboard Cargo System• Cockpit Security System• Cabin/APU Electrical
System Interconnect• Decorative Laminates• Numerous Others
Representative Products:• Air System Valving• Nacelle & Other Latches• Composite Components• Decorative Laminates• Numerous Others
+ Over 25% + ≈ 2X + ≈ 2X
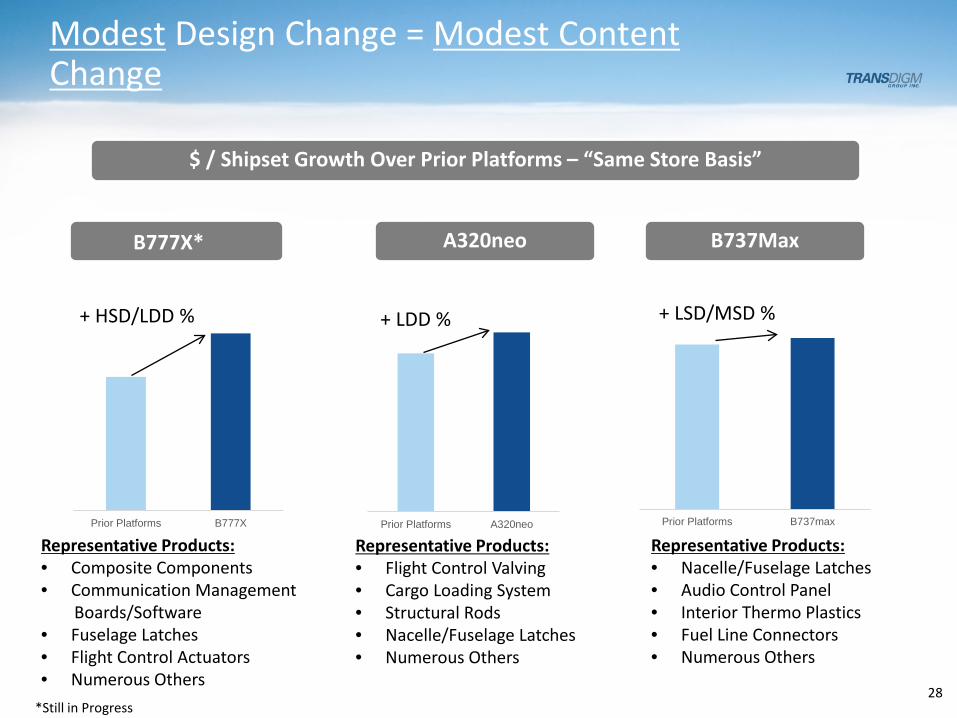
Prior Platforms A320neo
+ LDD %
Prior Platforms B737max
+ LSD/MSD %
Prior Platforms B777X
+ HSD/LDD %
Modest Design Change = Modest Content Change
28
B777X* A320neo
$ / Shipset Growth Over Prior Platforms – “Same Store Basis”
B737Max
Representative Products:• Composite Components• Communication Management
Boards/Software• Fuselage Latches• Flight Control Actuators• Numerous Others
Representative Products:• Flight Control Valving• Cargo Loading System• Structural Rods• Nacelle/Fuselage Latches• Numerous Others
Representative Products:• Nacelle/Fuselage Latches• Audio Control Panel• Interior Thermo Plastics• Fuel Line Connectors• Numerous Others
*Still in Progress
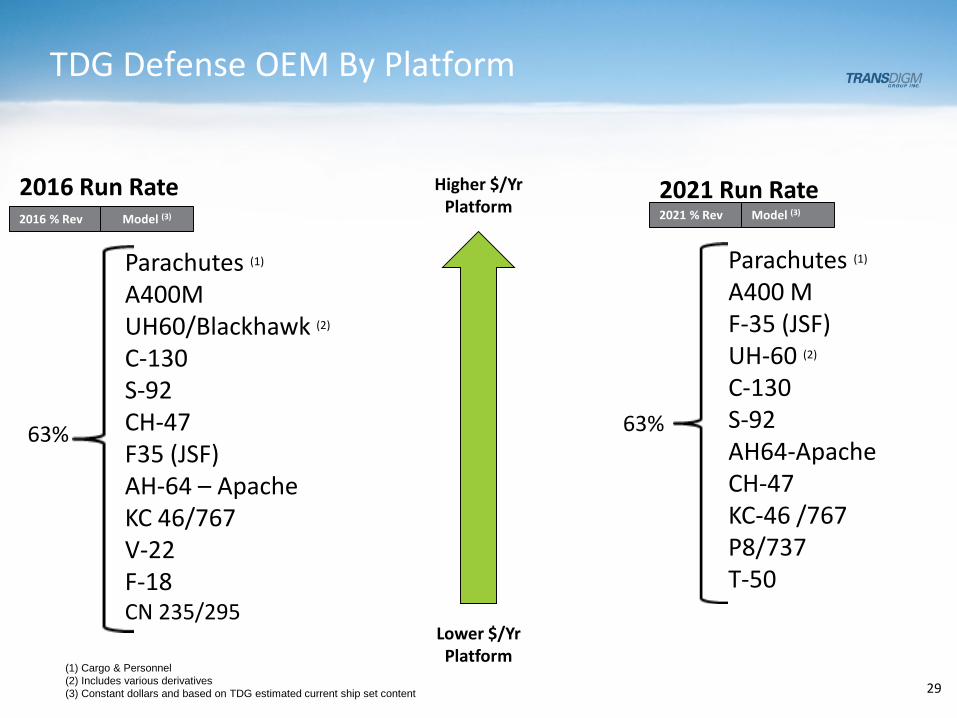
TDG Defense OEM By Platform
29
Higher $/YrPlatform
Lower $/YrPlatform
63% 63%
2016 Run Rate 2021 Run Rate2016 % Rev Model (3) 2021 % Rev Model (3)
Parachutes (1)
A400MUH60/Blackhawk (2)
C-130S-92 CH-47F35 (JSF)AH-64 – ApacheKC 46/767V-22F-18CN 235/295
Parachutes (1)
A400 MF-35 (JSF)UH-60 (2)
C-130S-92AH64-ApacheCH-47 KC-46 /767P8/737T-50
(1) Cargo & Personnel(2) Includes various derivatives(3) Constant dollars and based on TDG estimated current ship set content
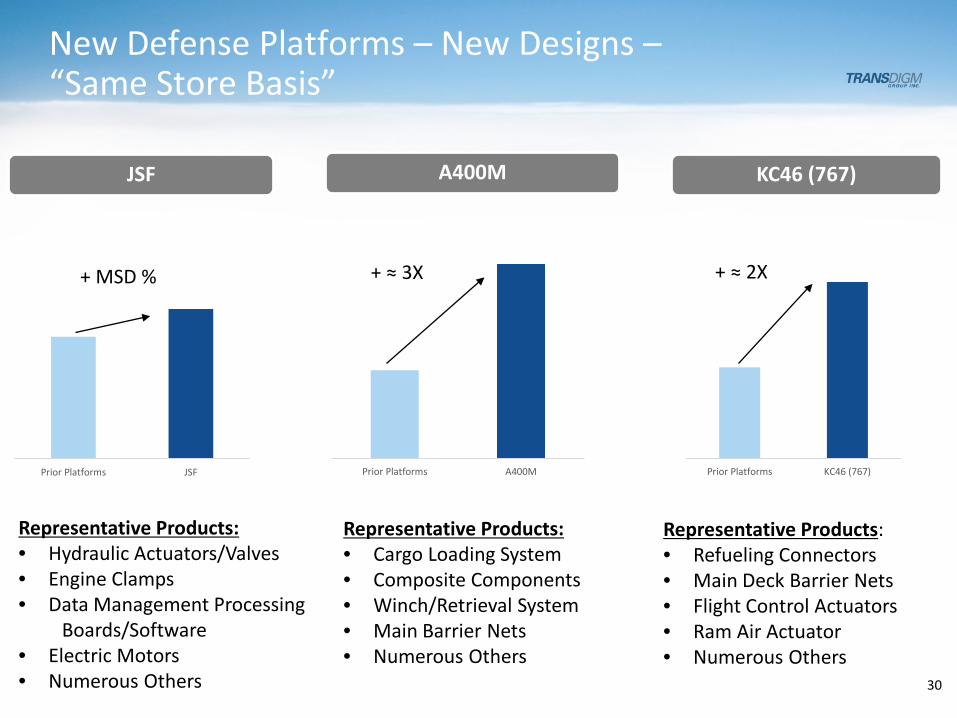
New Defense Platforms – New Designs –“Same Store Basis”
30
JSF A400M KC46 (767)
Representative Products:• Hydraulic Actuators/Valves• Engine Clamps• Data Management Processing
Boards/Software• Electric Motors• Numerous Others
Representative Products:• Refueling Connectors• Main Deck Barrier Nets• Flight Control Actuators• Ram Air Actuator• Numerous Others
Prior Platforms JSF Prior Platforms A400M Prior Platforms KC46 (767)
Representative Products:• Cargo Loading System• Composite Components• Winch/Retrieval System• Main Barrier Nets• Numerous Others
+ ≈ 3X+ MSD % + ≈ 2X
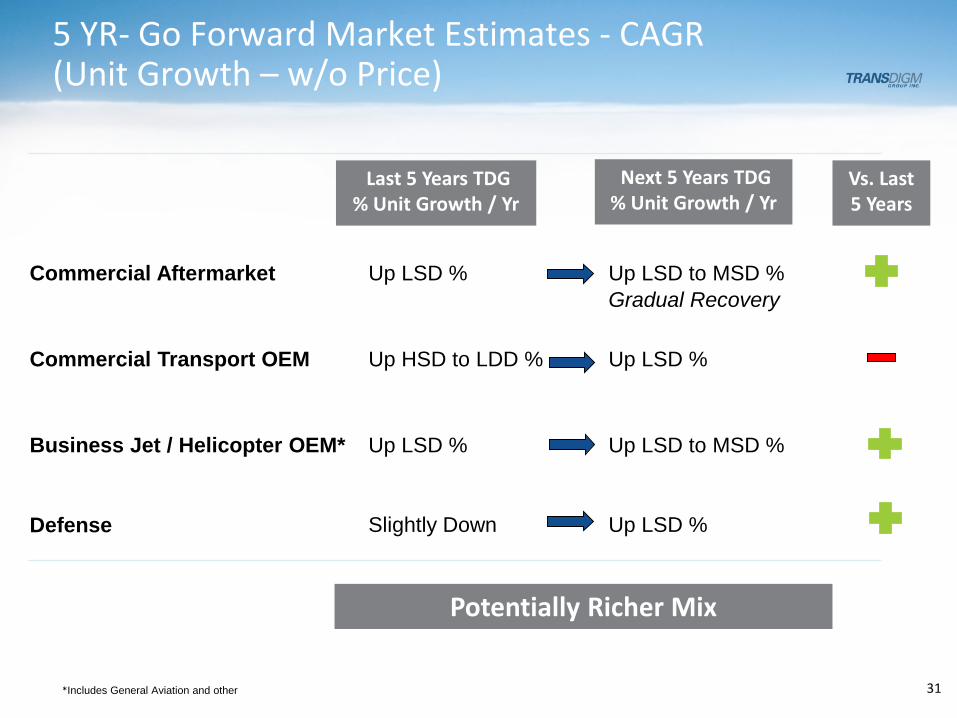
5 YR- Go Forward Market Estimates - CAGR (Unit Growth – w/o Price)
31
Commercial Aftermarket Up LSD % Up LSD to MSD %Gradual Recovery
Commercial Transport OEM Up HSD to LDD % Up LSD %
Business Jet / Helicopter OEM* Up LSD % Up LSD to MSD %
Defense Slightly Down Up LSD %
Last 5 Years TDG% Unit Growth / Yr
Next 5 Years TDG% Unit Growth / Yr
Vs. Last 5 Years
Potentially Richer Mix
*Includes General Aviation and other
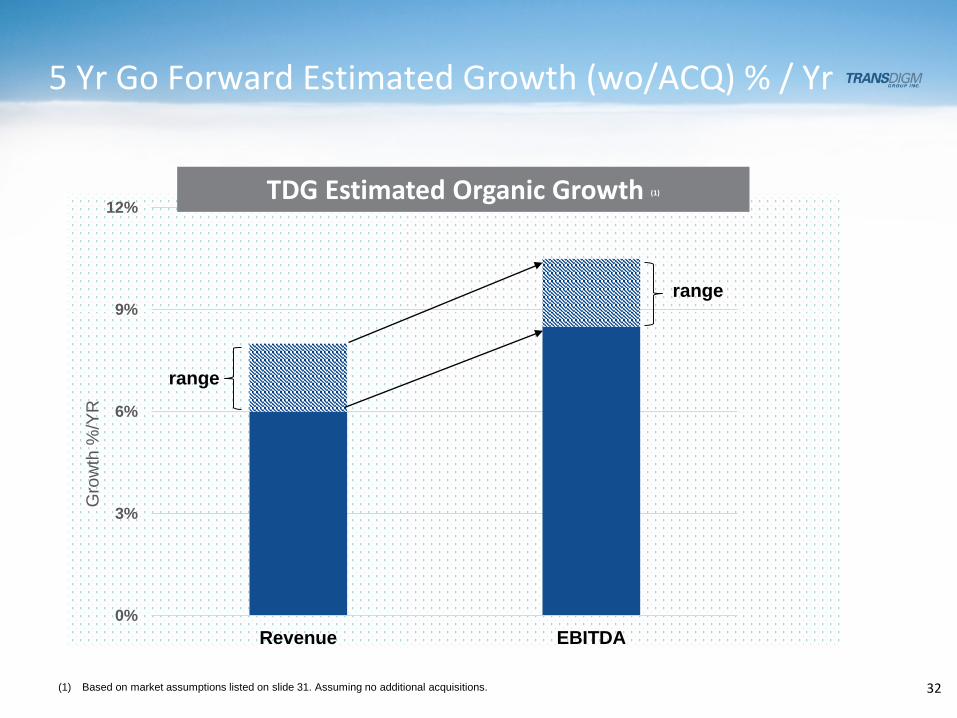
5 Yr Go Forward Estimated Growth (wo/ACQ) % / Yr
0%
3%
6%
9%
12%
Revenue EBITDA
Gro
wth
%/Y
R
range
32
range
(1) Based on market assumptions listed on slide 31. Assuming no additional acquisitions.
TDG Estimated Organic Growth (1)
Consistent Operating Model & Customer Value
33
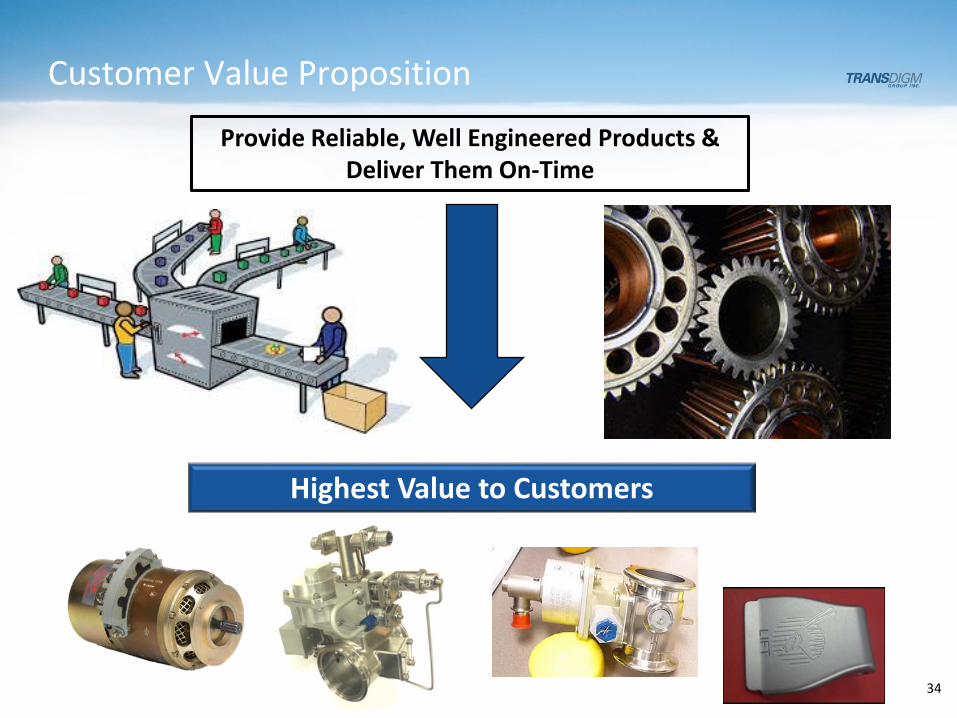
Customer Value Proposition
34
Provide Reliable, Well Engineered Products & Deliver Them On-Time
Highest Value to Customers
34
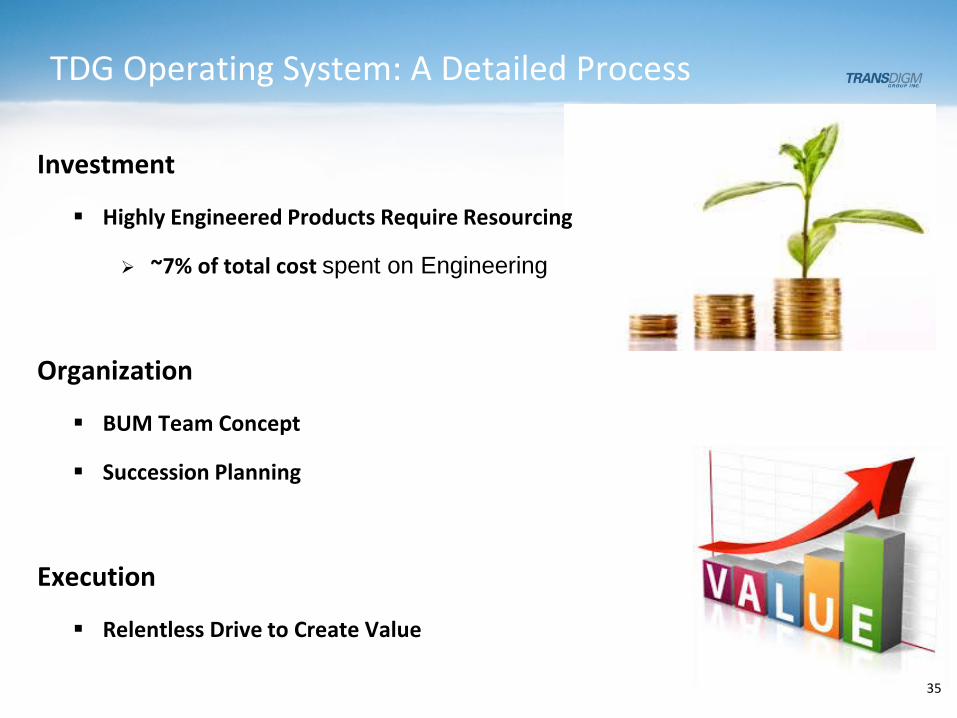
TDG Operating System: A Detailed Process
Investment
Highly Engineered Products Require Resourcing
~7% of total cost spent on Engineering
Organization
BUM Team Concept
Succession Planning
Execution
Relentless Drive to Create Value
35
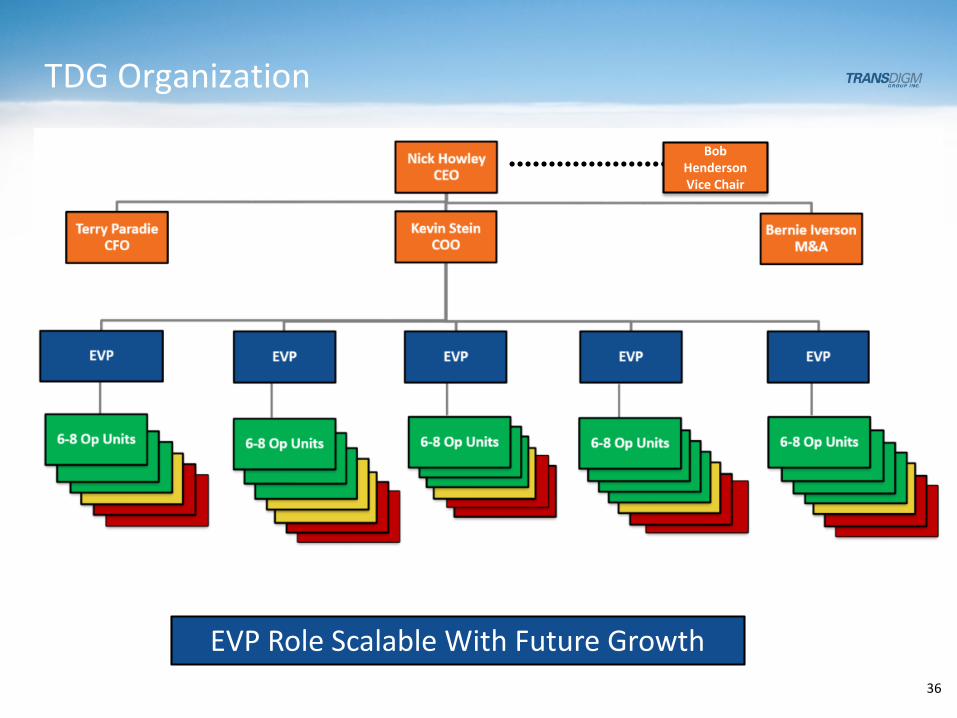
TDG Organization
EVP Role Scalable With Future Growth
.................... Bob Henderson Vice Chair
36
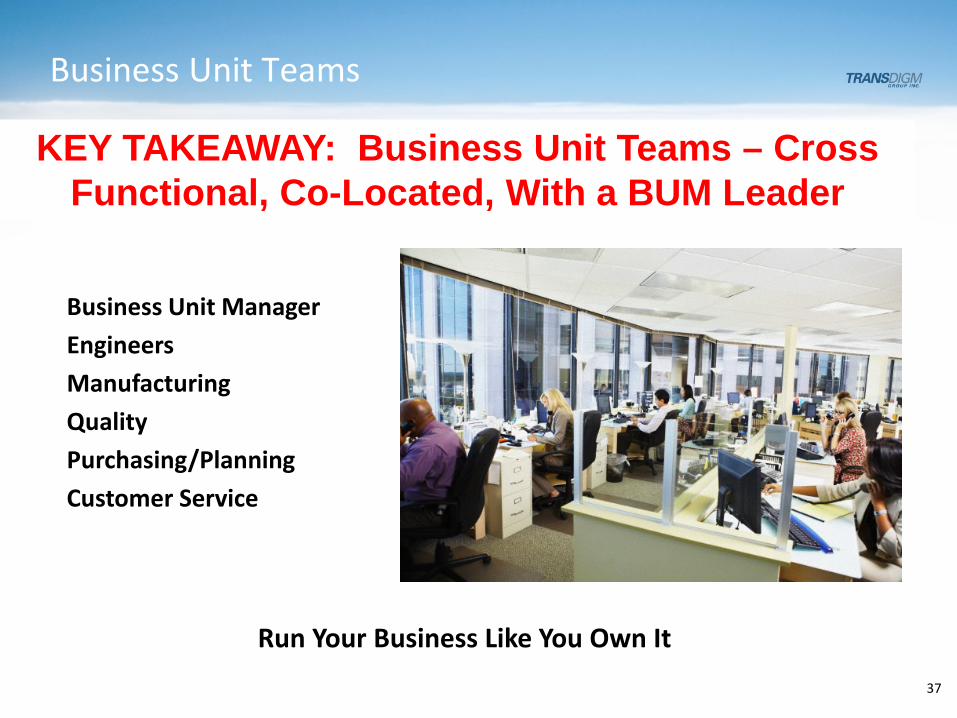
Business Unit Teams
Co-Located
Business Unit ManagerEngineersManufacturingQualityPurchasing/PlanningCustomer Service
Run Your Business Like You Own It
KEY TAKEAWAY: Business Unit Teams – Cross Functional, Co-Located, With a BUM Leader
37
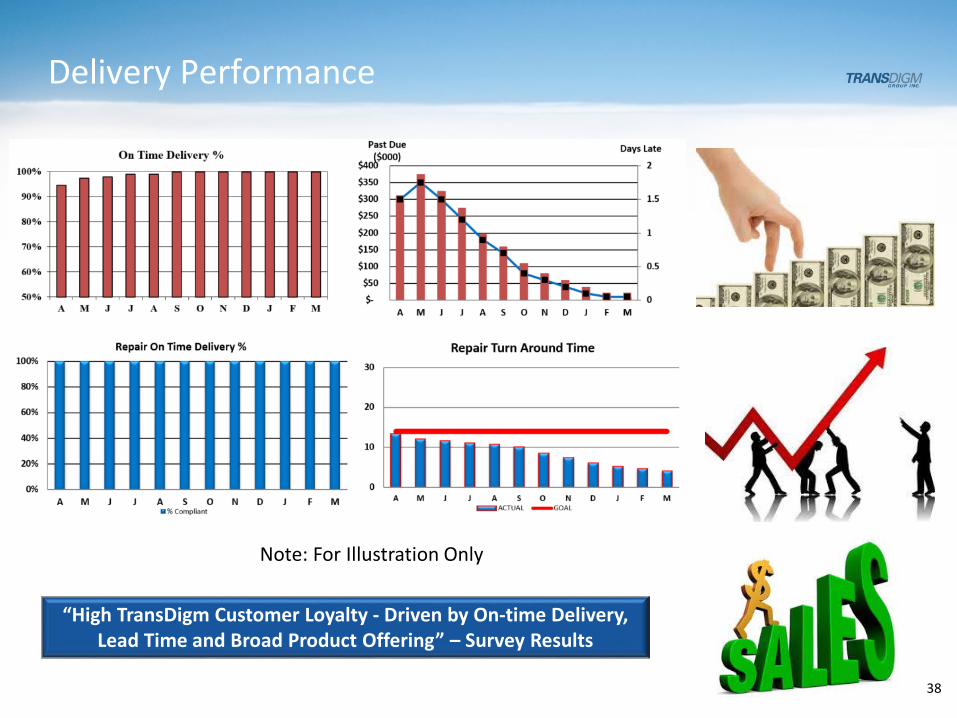
Delivery Performance
38
“High TransDigm Customer Loyalty - Driven by On-time Delivery, Lead Time and Broad Product Offering” – Survey Results
Note: For Illustration Only
38

39
Proven Operating Strategy
Profitable New
Business
Productivity and Cost
ImprovementsValue Based
Pricing
3 Value Drivers
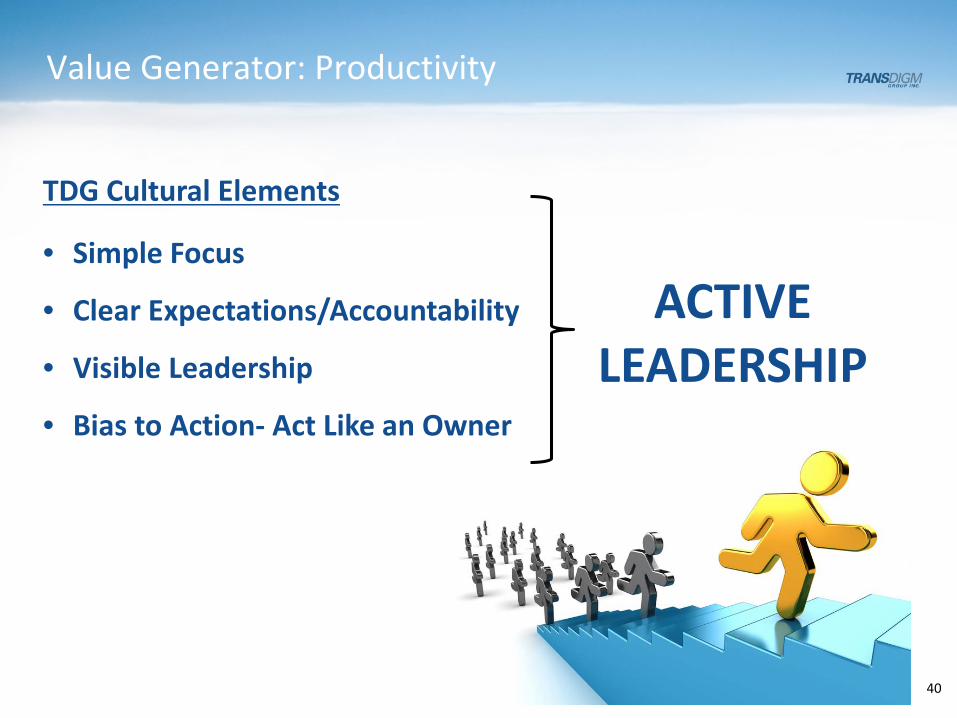
Value Generator: Productivity
TDG Cultural Elements
• Simple Focus
• Clear Expectations/Accountability
• Visible Leadership
• Bias to Action- Act Like an Owner
ACTIVE LEADERSHIP
40
Clear Goal – Detailed Execution
41
Steady Trackable Productivity Improvements
Across Total Cost Base
41
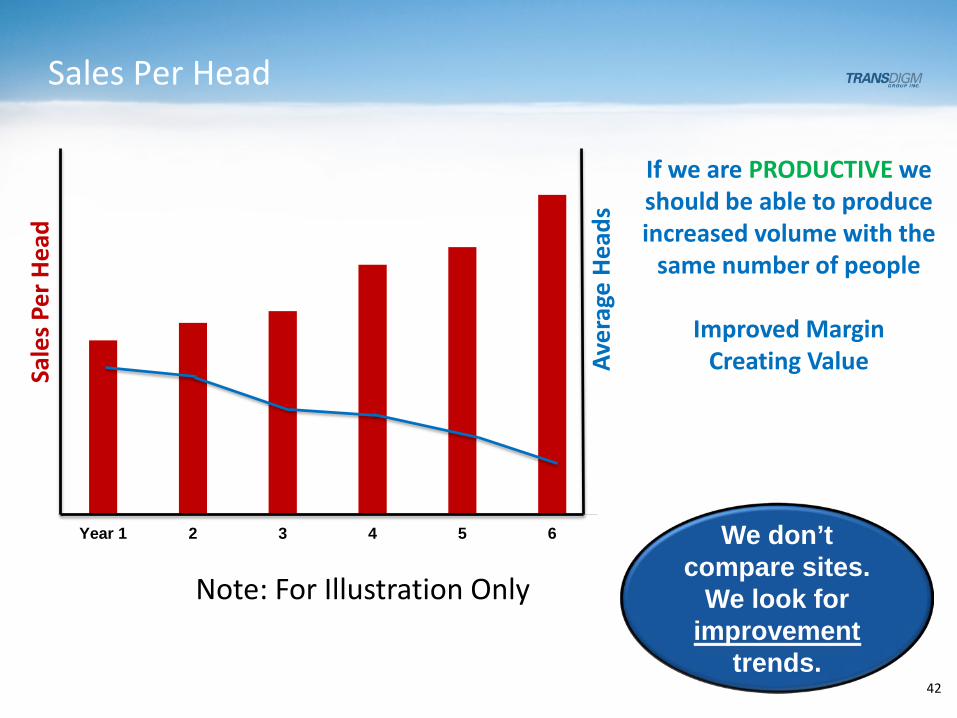
Sales Per Head
42
If we are PRODUCTIVE we should be able to produce increased volume with the
same number of people
Improved MarginCreating Value
We don’t compare sites.
We look for improvement
trends.
Year 1 2 3 4 5 6
Note: For Illustration Only
Sale
s Per
Hea
d
Aver
age
Head
s
42
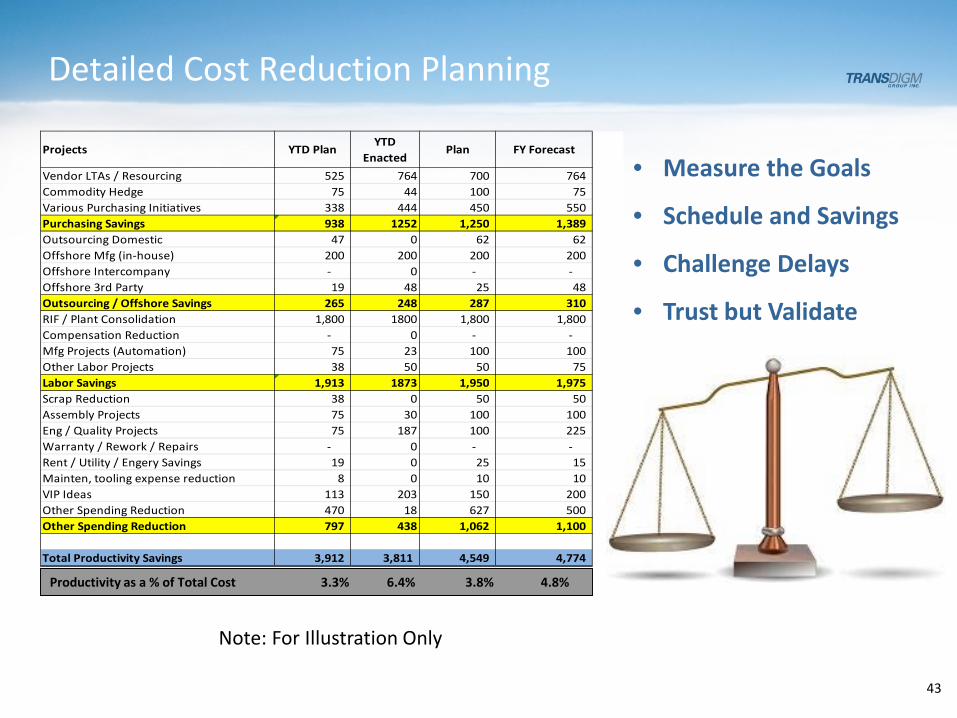
Detailed Cost Reduction Planning
43
Projects YTD PlanYTD
EnactedPlan FY Forecast
Vendor LTAs / Resourcing 525 764 700 764 Commodity Hedge 75 44 100 75 Various Purchasing Initiatives 338 444 450 550 Purchasing Savings 938 1252 1,250 1,389 Outsourcing Domestic 47 0 62 62 Offshore Mfg (in-house) 200 200 200 200 Offshore Intercompany - 0 - - Offshore 3rd Party 19 48 25 48 Outsourcing / Offshore Savings 265 248 287 310 RIF / Plant Consolidation 1,800 1800 1,800 1,800 Compensation Reduction - 0 - - Mfg Projects (Automation) 75 23 100 100 Other Labor Projects 38 50 50 75 Labor Savings 1,913 1873 1,950 1,975 Scrap Reduction 38 0 50 50 Assembly Projects 75 30 100 100 Eng / Quality Projects 75 187 100 225 Warranty / Rework / Repairs - 0 - - Rent / Utility / Engery Savings 19 0 25 15 Mainten, tooling expense reduction 8 0 10 10 VIP Ideas 113 203 150 200 Other Spending Reduction 470 18 627 500 Other Spending Reduction 797 438 1,062 1,100
Total Productivity Savings 3,912 3,811 4,549 4,774
• Measure the Goals
• Schedule and Savings
• Challenge Delays
• Trust but Validate
Productivity as a % of Total Cost 3.3% 6.4% 3.8% 4.8%
Note: For Illustration Only
43
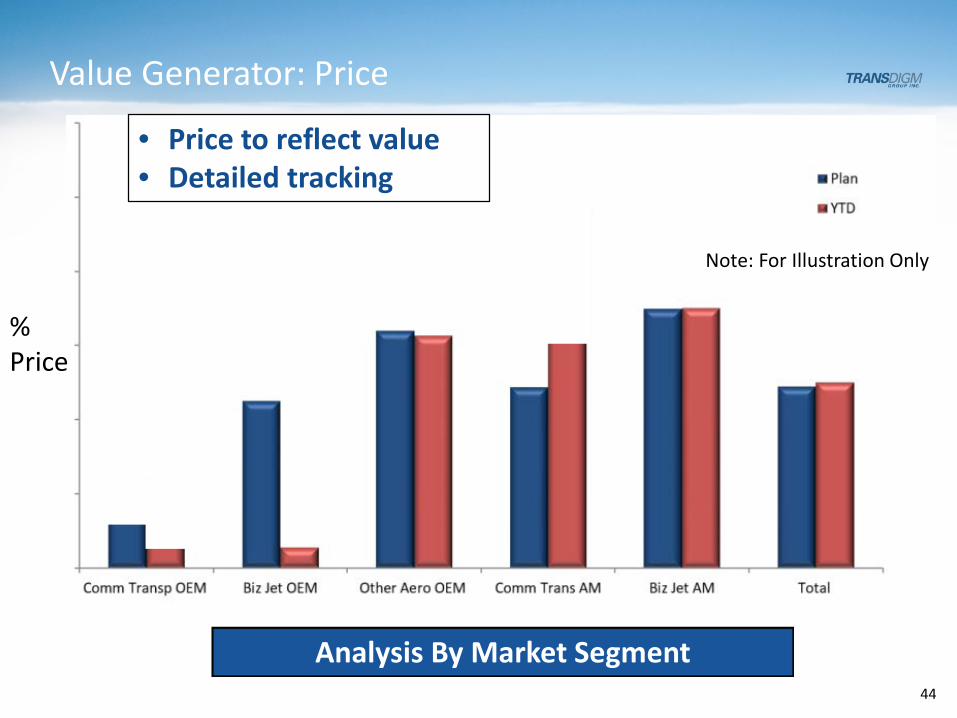
Value Generator: Price
Note: For Illustration Only
% Price
Analysis By Market Segment
• Price to reflect value• Detailed tracking
44
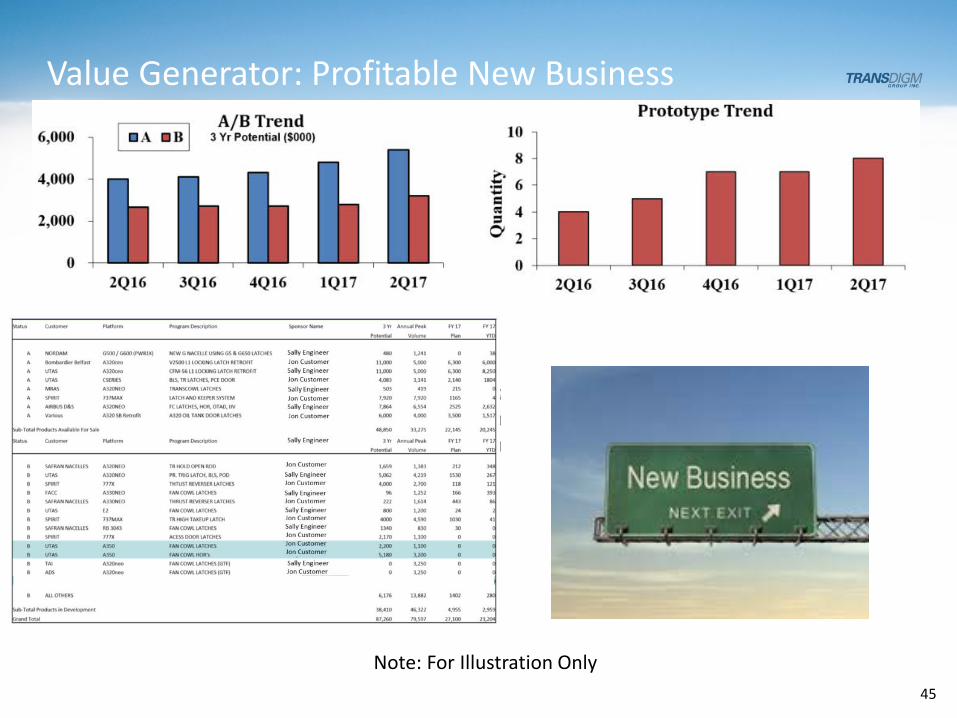
Value Generator: Profitable New Business
Note: For Illustration Only45
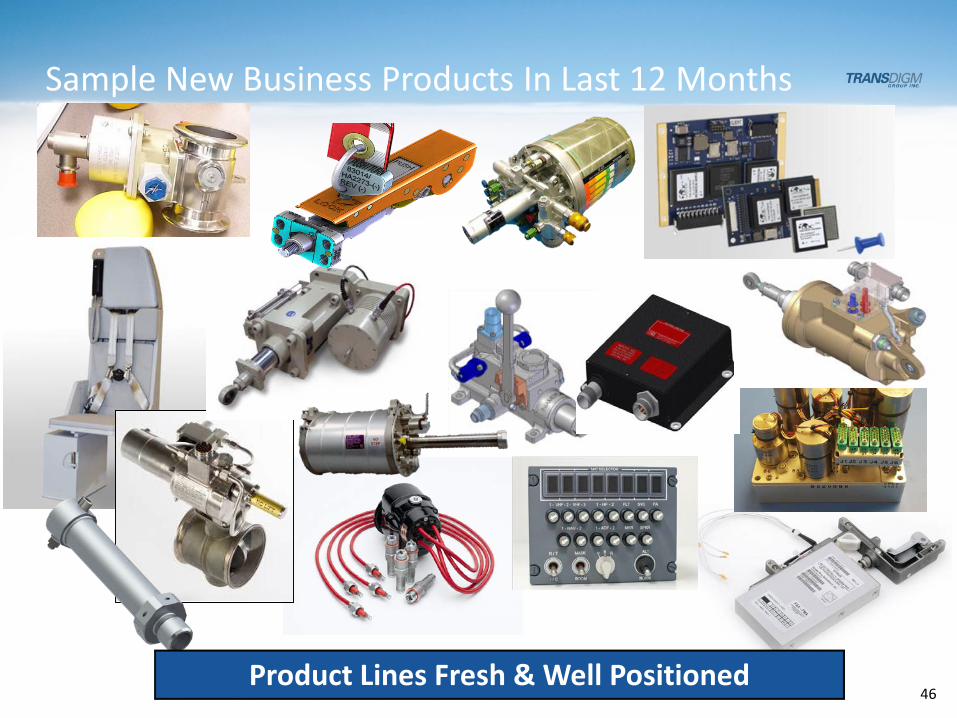
Sample New Business Products In Last 12 Months
Product Lines Fresh & Well Positioned 46
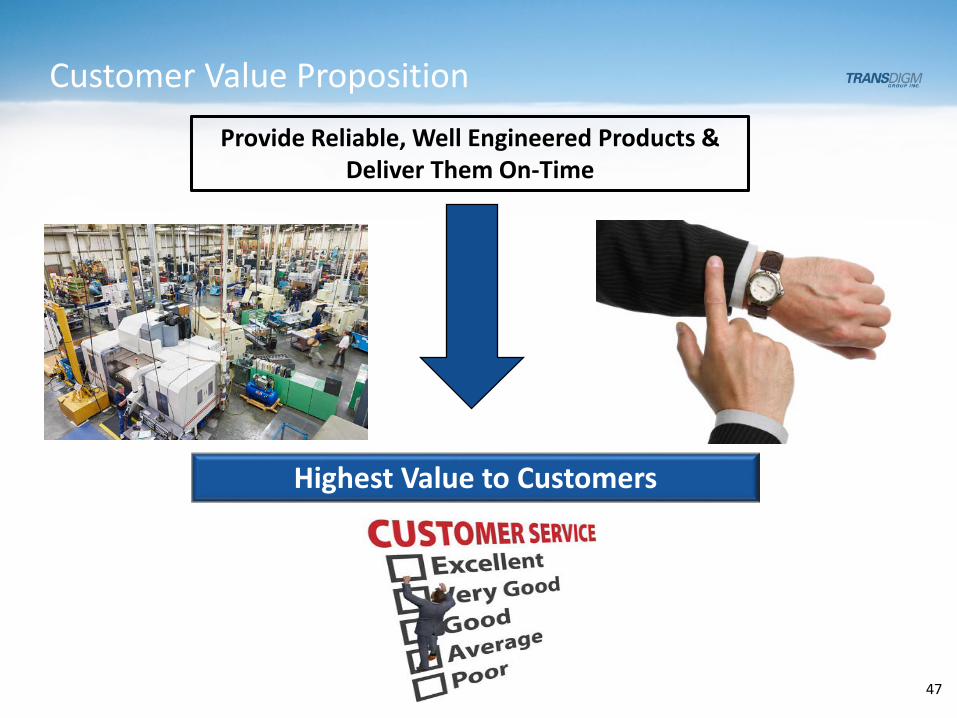
Customer Value Proposition
47
Provide Reliable, Well Engineered Products & Deliver Them On-Time
Highest Value to Customers
47

Financial Topics
48
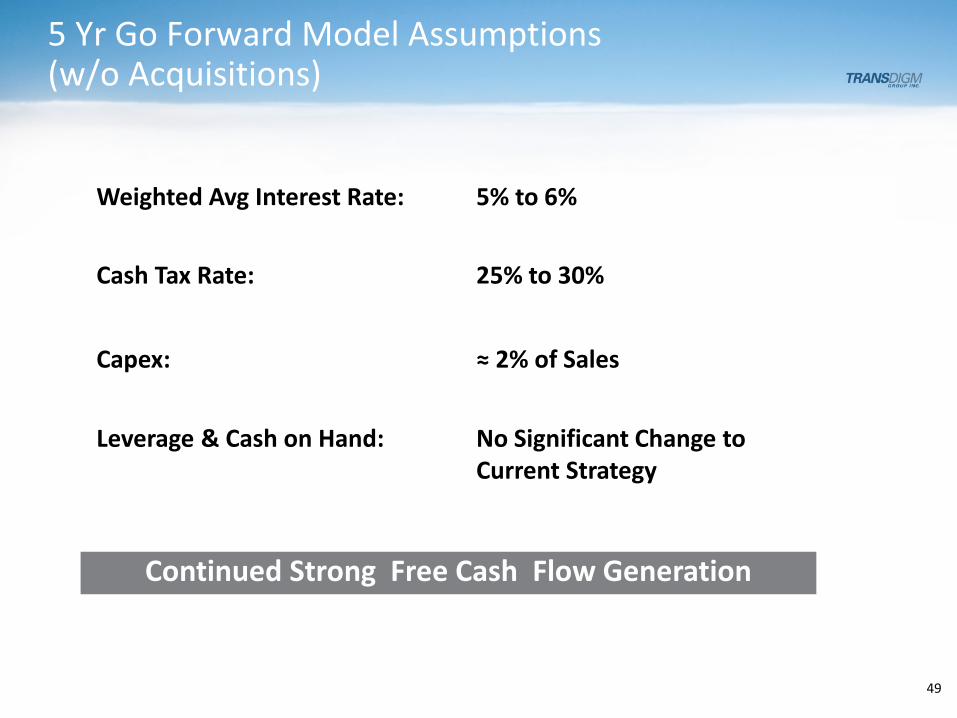
5 Yr Go Forward Model Assumptions (w/o Acquisitions)
49
Continued Strong Free Cash Flow Generation
Weighted Avg Interest Rate: 5% to 6%
Cash Tax Rate: 25% to 30%
Capex: ≈ 2% of Sales
Leverage & Cash on Hand: No Significant Change to Current Strategy
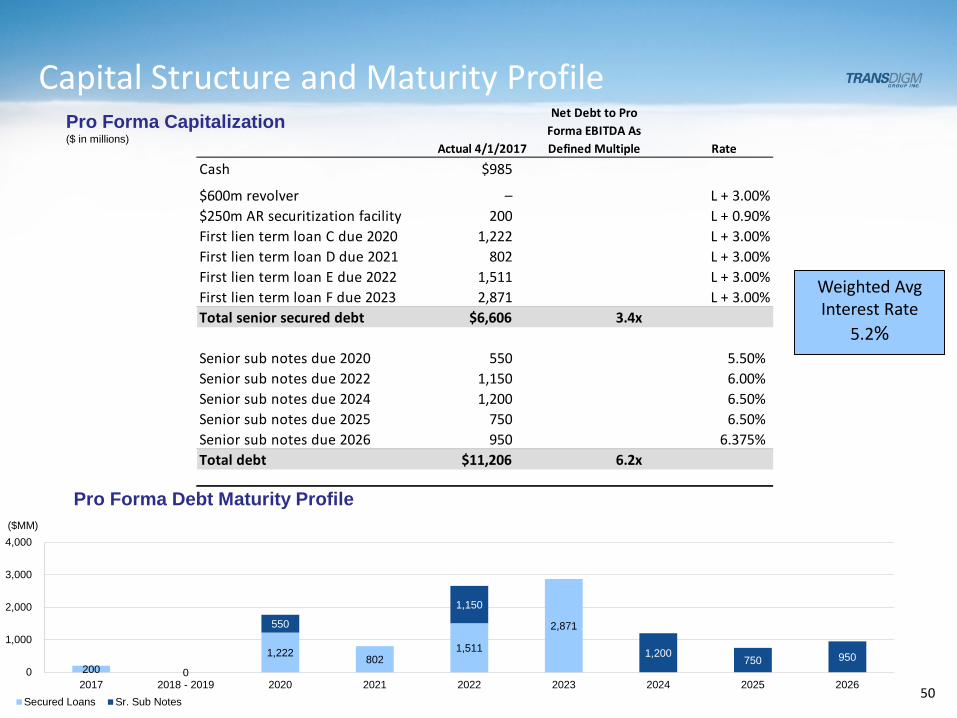
Cash $985
$600m revolver – L + 3.00%$250m AR securitization facility 200 L + 0.90%First lien term loan C due 2020 1,222 L + 3.00%First lien term loan D due 2021 802 L + 3.00%First lien term loan E due 2022 1,511 L + 3.00%First lien term loan F due 2023 2,871 L + 3.00%Total senior secured debt $6,606 3.4x
Senior sub notes due 2020 550 5.50%Senior sub notes due 2022 1,150 6.00%Senior sub notes due 2024 1,200 6.50%Senior sub notes due 2025 750 6.50%Senior sub notes due 2026 950 6.375%Total debt $11,206 6.2x
Actual 4/1/2017
Net Debt to Pro Forma EBITDA As Defined Multiple Rate
Capital Structure and Maturity ProfilePro Forma Capitalization($ in millions)
50
200 0
1,222 8021,511
2,871550
1,150
1,200750 950
0
1,000
2,000
3,000
4,000
2017 2018 - 2019 2020 2021 2022 2023 2024 2025 2026Secured Loans Sr. Sub Notes
Pro Forma Debt Maturity Profile($MM)
50
Weighted Avg Interest Rate
5.2%
Interest Rate Sensitivity Analysis
51
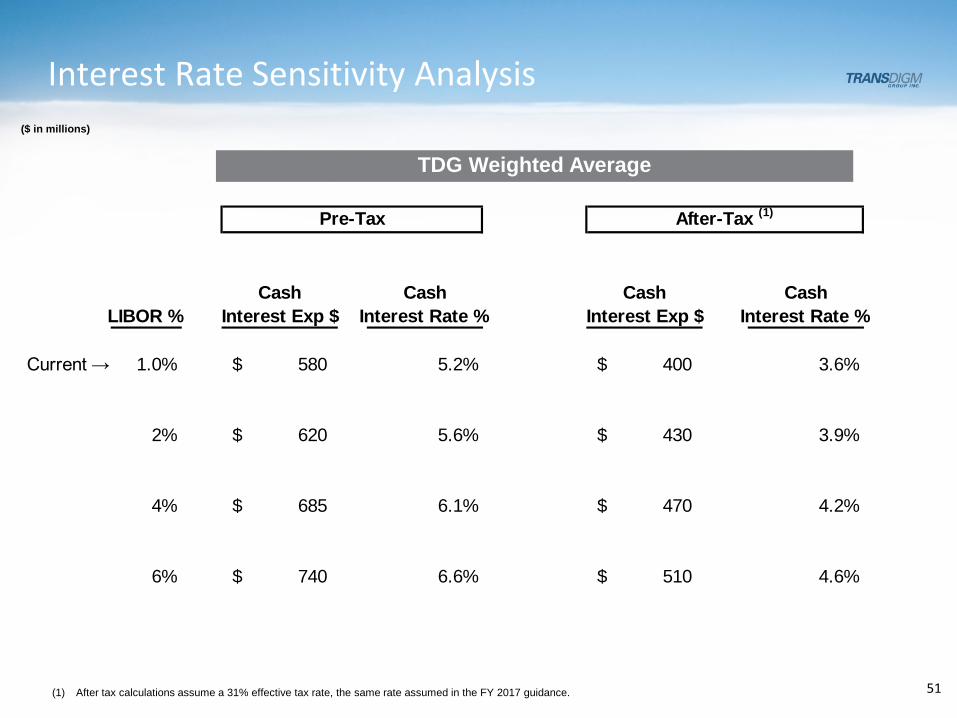
($ in millions)
Cash Cash Cash CashLIBOR % Interest Exp $ Interest Rate % Interest Exp $ Interest Rate %
Current → 1.0% 580$ 5.2% 400$ 3.6%
2% 620$ 5.6% 430$ 3.9%
4% 685$ 6.1% 470$ 4.2%
6% 740$ 6.6% 510$ 4.6%
Pre-Tax After-Tax (1)
TDG Weighted Average
(1) After tax calculations assume a 31% effective tax rate, the same rate assumed in the FY 2017 guidance.
52
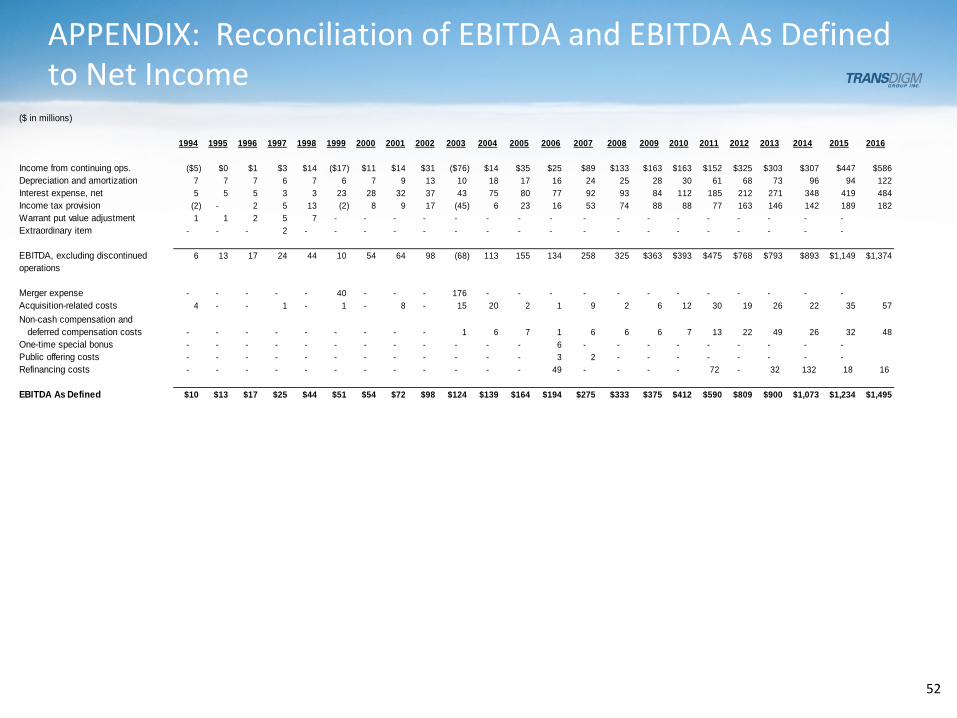
($ in millions)
1994 1995 1996 1997 1998 1999 2000 2001 2002 2003 2004 2005 2006 2007 2008 2009 2010 2011 2012 2013 2014 2015 2016
Income from continuing ops. ($5) $0 $1 $3 $14 ($17) $11 $14 $31 ($76) $14 $35 $25 $89 $133 $163 $163 $152 $325 $303 $307 $447 $586Depreciation and amortization 7 7 7 6 7 6 7 9 13 10 18 17 16 24 25 28 30 61 68 73 96 94 122Interest expense, net 5 5 5 3 3 23 28 32 37 43 75 80 77 92 93 84 112 185 212 271 348 419 484Income tax provision (2) - 2 5 13 (2) 8 9 17 (45) 6 23 16 53 74 88 88 77 163 146 142 189 182Warrant put value adjustment 1 1 2 5 7 - - - - - - - - - - - - - - - - - Extraordinary item - - - 2 - - - - - - - - - - - - - - - - - -
EBITDA, excluding discontinued 6 13 17 24 44 10 54 64 98 (68) 113 155 134 258 325 $363 $393 $475 $768 $793 $893 $1,149 $1,374operations
Merger expense - - - - - 40 - - - 176 - - - - - - - - - - - - Acquisition-related costs 4 - - 1 - 1 - 8 - 15 20 2 1 9 2 6 12 30 19 26 22 35 57Non-cash compensation and deferred compensation costs - - - - - - - - - 1 6 7 1 6 6 6 7 13 22 49 26 32 48One-time special bonus - - - - - - - - - - - - 6 - - - - - - - - - Public offering costs - - - - - - - - - - - - 3 2 - - - - - - - - Refinancing costs - - - - - - - - - - - - 49 - - - - 72 - 32 132 18 16
EBITDA As Defined $10 $13 $17 $25 $44 $51 $54 $72 $98 $124 $139 $164 $194 $275 $333 $375 $412 $590 $809 $900 $1,073 $1,234 $1,495
APPENDIX: Reconciliation of EBITDA and EBITDA As Defined to Net Income
APPENDIX: FY 2017 Guidance Mid-point GAAP to Adj EPS Reconciliation and Assumptions
53
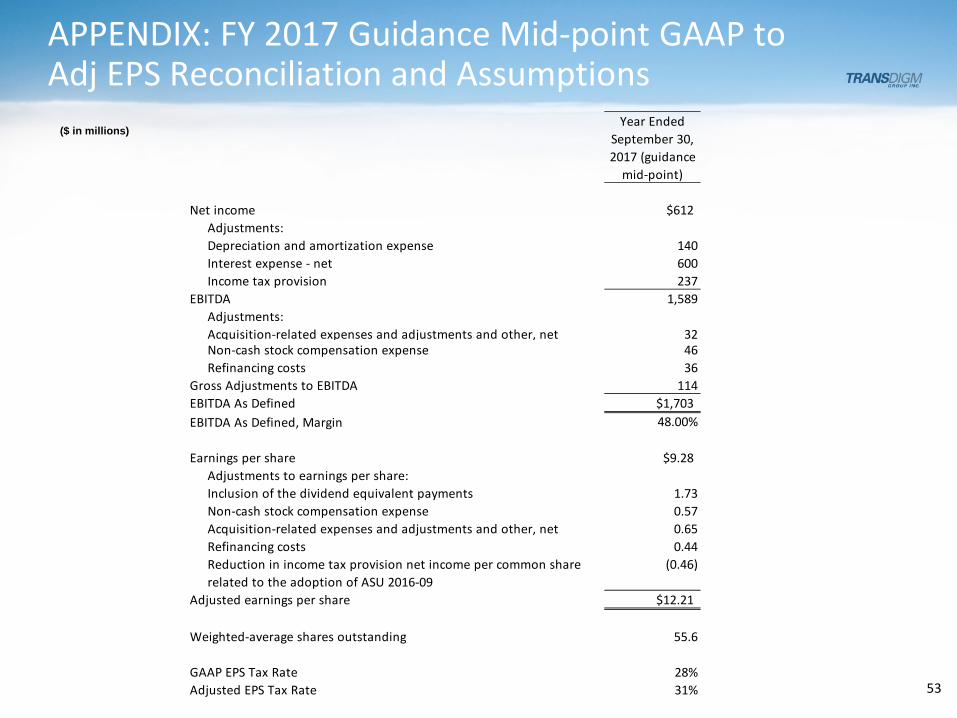
($ in millions)Year Ended
September 30,2017 (guidance
mid-point)
Net income $612Adjustments:Depreciation and amortization expense 140Interest expense - net 600Income tax provision 237
EBITDA 1,589Adjustments:Acquisition-related expenses and adjustments and other, net 32Non-cash stock compensation expense 46Refinancing costs 36
Gross Adjustments to EBITDA 114EBITDA As Defined $1,703EBITDA As Defined, Margin 48.00%
Earnings per share $9.28Adjustments to earnings per share:Inclusion of the dividend equivalent payments 1.73Non-cash stock compensation expense 0.57Acquisition-related expenses and adjustments and other, net 0.65Refinancing costs 0.44Reduction in income tax provision net income per common share related to the adoption of ASU 2016-09
(0.46)
Adjusted earnings per share $12.21
Weighted-average shares outstanding 55.6
GAAP EPS Tax Rate 28%Adjusted EPS Tax Rate 31%