Embed Size (px)
Citation preview

1 | P a g e
Transforminglives:CanSavingsandCreditGroupmembershipworkforpeople
affectedbyHIV/AIDS?ASouthAfricanCaseStudy
Photograph1‐SaveActSCGsmembers,EasternCape(Photo:CarolynCornilsScherer)
ResearchconductedbyAnnieBarber
August,2011
CommissionedbyUniversitasForumwithpartialfundingfromFinMarkTrust.SupportfromVesperSocietyandHanefBhamjeeisgratefullyacknowledged.

2 | P a g e
Photograph 2 ‐ Research participant, Xaxazana
Abstract
ThisstudyinvestigatestheroleofSavingsandCreditGroups(SCGs)inimprovingthecoping
strategiesofpoor,ruralhouseholdsaffectedbyHIV/AIDS.Today,morethan5.6millionSouth
AfricansareHIVpositive1.Everydayaround1000ofthesepeopledie,whileatthesametime,
morethan1200becomenewlyinfected(Gow,2010).Withmoststakeholderslookingtothe
healthsectorforsolutionsthereisalackofpracticallivelihoodstrategiesforpeopletoweather
thedebilitatingshockscausedbythedisease.Theseshocksforcevulnerablehouseholdsto
employirreversiblecopingstrategiesandthreatentotraptheminpoverty.
Thisstudypresentsimportantevidenceofconsumptionsmoothingandimprovedcoping
mechanismsamongpeopleaffectedbyHIV/AIDS(PABHA)whoaremembersofSCGs.Stable
levelsofconsumptionamongparticipantssuggestthattheyaremoreprotectedfrominsecure
andvolatileflowsofincomeandaremoreabletomeetbasichouseholdneeds.Resultsindicate
thatcopingstrategieshavebeenstrengthened,andoverallvulnerabilitytotheimpactof
adverseshockshasbeencushioned.Withthistargetgroupbeinglargelytypicalofrural
populationsaffectedbyHIV/AIDSinSouthAfrica,itislikelythatthesameimpactcanbe
achievedonamuchlargerscaleandthereisthusgreatscopeforprojectreplicationinother
areas.
Keywords: Microsavings, HIV/AIDS, consumption smoothing, poor rural households
1 UNAIDS South Africa: http://www.unaids.org/en/Regionscountries/Countries/SouthAfrica/

3 | P a g e
Acknowledgement
Forconstantsupport,motivationanddiscussions,IthanktheExecutiveDirectorofSaveAct,AntonKrone.HisdedicationtothecauseofimprovingthelivesofpoorpeopleinSouthAfricaisinspiringandcommendable.Throughhisworkhehasmadeenormousimpact.
Forassistance,company,guidanceanddedicationIthanktheSaveActstaffoftheEasternCapeOffice.SimbongileDubaandNolufefeNonjeke‐Dlanjwa,youaretrulyaninspiration,thankyouforyourunwaveringenthusiasmforthisstudyevenwhenyouwerestretchedtocapacity.SamellaandGladys,thisreportcouldnothavebeencompletedwithoutyou.IamalsogratefultoSaveActKZNstaff.Yourworkinspiresmeeveryday.Thankyoutoalltheprojectparticipantswhoacceptedandtrustedmeandgavetheirtimetothisstudy.Youareachievingsomethingwonderful,pleasekeepstrivingforimprovement.
Lastly,Iwouldliketothankmyparents,IanandVickyBarber,fortheirloveandsupport.Youhavesupportedmypassionfordevelopmentfromtheverybeginning,evenwhenittakesmefarfromhome.Thankyouforlisteningtomyexcitementandsupportingmeduringthedifficultandstressfultimes.Tomyfather,yourconstantproofreadingandconstructivecriticismwasinvaluable.Tomymother,thankyouforsupportingmeinmytimesofneed.
ThiswouldnothavebeenpossiblewithoutthegeneroussupportofUniversitasandFinMarkTrust.
Acronyms
AIDS AcquiredImmune‐deficiencySyndromeARVs AntiretroviralmedicationCBOs Community‐basedOrganisationsCHBC CommunityHome‐basedCareESF EmergencySocialFundFHH Female‐headedHouseholdGBV Gender‐basedViolenceHIV HumanImmune‐deficiencyvirusIGA IncomegeneratingActivityJHH Jointly‐headedHouseholdPABHA PeopleAffectedbyHIV/AIDSPLWHA PeopleLivingWithHIV/AIDSR SouthAfricanRand(R1.00=0.15USD)SSI Semi‐structuredIndividualInterviewsSCG SavingsandCreditGroupSG (HIV/AIDS)SupportGroup

4 | P a g e
Definitions
Consumptionsmoothing:
Theabilityofahouseholdtoinsulatespendinglevelsfromdipsindisposableincomeby
borrowingandsavingsothatbasicneeds,forexamplefoodandeducation,donotsufferasa
resultofafinancialshock(MurdochinZeller,1999)andlevelsofexpendituredonotclosely
trackincomepatterns.
Stokvel:
AsavingsorinvestmentsocietythatistraditionaltoruralSouthAfrica.Membersregularly
contributeanagreedamounttoagroupfundfromwhichtheyreceivealumpsumpayment2.
Mashonisas:
LocalXhosatermfor‘loansharks’chargingoftenusuriousinterestratesofupto60%.
TableofContents1PurposeofResearch....................................................................................................................................................61.1TheModel....................................................................................................................................................................61.2TheModelandHIV/AIDS.....................................................................................................................................82LocalContext................................................................................................................................................................103Methodology..................................................................................................................................................................143.1Theparticipants.......................................................................................................................................................153.2Limitations..................................................................................................................................................................174ResultsandAnalysis……………….............................................................................................................................184.1SeasonalityAnalysis...............................................................................................................................................184.2TrendAnalysis..........................................................................................................................................................234.3LoanUsage...................................................................................................................................................................274.4HomeImprovements..............................................................................................................................................284.5Health............................................................................................................................................................................284.6ProductiveActivities...............................................................................................................................................294.7GenderDynamics.....................................................................................................................................................295Conclusion......................................................................................................................................................................316References......................................................................................................................................................................327Appendices.....................................................................................................................................................................34Appendix1..............................................................................................................................................34Appendix2..............................................................................................................................................35Appendix3..............................................................................................................................................36Appendix4..............................................................................................................................................37Appendix5..............................................................................................................................................39Appendix6..............................................................................................................................................43
2 Oxford Dictionaries: http://oxforddictionaries.com/definition/stokvel

5 | P a g e
TablesandFigures
Table Page#
Table1:SaveActImplementingPartners 9
Table2:UnemploymentRates 12
Table3:SocialGrantsReceived 12
Table4:HIVInfectionRates 13
Table5:GenderProportionsinEducation 14
Table6:ParticipantCharacteristics 16
Table7:HIV/AIDSGroupMembership 16
Table8:MostCitedHomeImprovements 28
Figure Page#
Figure1:HIV/AIDSLinkages 17
Figure2:SeasonalityAnalysisofIncome 18
Figure3:SeasonalityAnalysisofExpenditure 19
Figure4:SeasonalityofSavings 20
Figure5:SeasonalityAnalysisofCredit 21
Figure6:SeasonalityAnalysis 22
Figure7:CrisisTrendAnalysis,5YearsAgo 23
Figure8:CrisisTrendAnalysis,LastYear 24
Figure9:CrisisTrendAnalysis,ThisYear 25
Figure10:LoanUsageRatings 27

6 | P a g e
1. PurposeofResearch
ThisresearchisbasedfirmlyinthecontextoftheHIV/AIDSepidemicinSouthAfrica.The
purposeistoinvestigatetheroleofSavingsandCreditGroups(SCGs)inhelpingpoor,rural
householdsaffectedbyHIV/AIDStoachieveconsumptionsmoothingandthusimprovecoping
strategies.
Untilrecently,theAIDSepidemicinSouthAfricafacedpoliticalneglectanddenial.TheSouth
Africangovernmentrefusedtomakeantiretroviralmedication(ARVs)publiclyavailableuntil
2008‐theendofformer‐PresidentMbeki’srule.Thisneglectfedanepidemicthathasreached
disastrousproportions:todaymorethan5.6millionSouthAfricansareHIVpositive3.Thisis
morethananyothercountryintheworld.Everydayaround1000ofHIV/AIDSaffectedpeople
die,whileatthesametime,morethan1200peoplebecomenewlyinfected(Gow,2010).
TheresultofthisisnotonlyepicproportionsofpeoplelivinganddyingwithHIV/AIDS.Ithas
alsoshapedanddistortedthecountry’sresponsetotheepidemic.Withtheabsenceofmedical
treatmentavailabletothepublic,thefocusofallSouthAfricanAIDSactivismoverthelast
decadehasbeenARVrollout(ibid).Withmoststakeholderslookingtothehealthsectorfor
solutions,thereissignificantneglectofotherHIV/AIDSstrategies.Despitecommonconsensus
aroundthelinksbetweenpovertyandHIV(Donahue,2000),thereisalackofpractical
livelihoodandcopingstrategiesforpeopletoweatherthelingeringanddebilitatingshocks
causedbythedisease.
TheprincipalpolicyimplicationofthispaperisthattheroleofSCGmembershipforthecoping
mechanismsofPABHAisnotwellrecognised,andisunderutilisedinthepolicyarena.Itaimsto
demonstratehowSCGsofferanimportantstrategytomitigatetheeffectsofHIV/AIDSon
heavilyaffectedcommunitiesandhouseholds.Thiscasestudydocumentstheexperiencesofa
successfulprogramme,demonstratingthatPABHAarejustassuccessfulsaversandSCG
membersasothers.
1.1TheModel
Foundedin2005inSouthAfrica,SaveActprovidessupportfortheformationofSCGstoalmost
10,000membersacrosstwoprovinces(KwaZulu‐NatalandtheEasternCape).EachSCG
3 UNAIDS South Africa: http://www.unaids.org/en/Regionscountries/Countries/SouthAfrica/

7 | P a g e
consistsofuptotwenty‐fivememberswitheverymemberreceivingbasicfinancialeducation
beforebeginningtheirfirstsavingscycle.SaveActalsoofferstheIsiqaloenterprisecoursefor
membersaimingtodevelopanincome‐generatingactivity(IGA).
ThemodelemployedbySaveActissavings‐ledandinvolvesnoexternalcredit.Embeddedin
localknowledge,itbuildsontheoldtraditionalStokvelpracticeinruralareasbutinvolvesstrict
adherencetorulesandprocedureswithtightmonitoringandmentorshipfromSaveActField
Officers.EachSCGelectsitsownManagementCommittee,includingachairperson,bookkeeper
andkey‐holders.EverySCGformalisesitsownindividualGroupConstitutionoutliningthebasic
rulesofpractice.Tosave,memberspurchasesharesinthegroup‐thepriceofashare(normally
R50–R100)isagreedintheConstitution.Byprovidingaformalsavingsmechanismforpoor
peoplethismodelchallengesthemyththat‘poorpeoplecan’tsave’.Infact,poorpeoplesave
morefrequentlythananyothergroup,preciselybecausetheymust(Collinsetal,2009).
Memberscanpurchasebetweenoneandfivesharespermeetingbutarenotobligedto
purchaseshareseverymonth.Arecordofshare‐purchasesiskeptbyboththebookkeeper,Field
Officerandisrecordedineachmember’sindividual‘ShareBook’.Eachsavingscyclelastsfor
twelvemonthswithmembersmeetingonmonthly.Thecapitalaccumulatedthroughthe
purchasingofsharesisdistributedbetweenmembersthroughsmallloansonrequestand
approvalofthegroupthroughouttheyear.ArateofinterestdecidedintheGroupConstitution
(normally10%permonth)ischargedforeachloan.Loanscanbepaidbackoverathree‐four
monthperiod.Thetotalaccumulatedcapital,includingtheprofitsmadeonloaninterestis
sharedbetweenmembersinanannuallump‐sumaccordingtotheamountofsharesheldby
eachmember.AverageannualprofitsmadeonsavingsinSaveActgroupsare40%butcanbeas
highas80%.

8 | P a g e
Photograph3:ASaveActsharebook
EachSCGalsobuildsanEmergencySocialFund(ESF)bycontributingasmallmonthlyamount
agreedintheConstitution(usuallyR10.00).TheESFisusedtoassistgroupmembersintimesof
crisisorhardship,theexacttermsofwhicharespecifiedintheGroupConstitution.TheESFis
givenasagrantandrequiresnorepayment.Attheendofasavingscycle,anyremainingmoney
fromtheESFmaybesharedoutorkeptforthenextcycledependingonthewishesofSCG
members.
1.2ThemodelandHIV/AIDS
Inrecognitionthatthelivesoftheirclientsunfoldinacomplexandmultifacetedcontextand
thatAIDSisapartofthiscontext,SaveActmadethedecisiontopartnerwithlocalHIV/AIDS‐
orientedCommunityBasedOrganisations(CBOs)tospecificallytargetPABHA.AllofSaveAct’s
EasternCapeimplementingpartnershaveHIV/AIDSexpertise,howeverallHIV/AIDS‐linked
SCGsaretreatedlikeanyotherandaregivennoHIV/AIDS‐specificsupportfromSaveAct4.
SaveAct’simplementingpartnersareoutlinedbelow:
4 Comment made by Nolufefe Nonjeke‐Dlanjwa – Programme Co‐ordinator, Eastern Cape during an interview with the researcher, June, 2011.

9 | P a g e
Table1:SaveActImplementingPartners
Implementing Partner Activities
Masangane Treatment
Programme (MTP)
Mobilising PLWHA, SCG Promotion, Support to
PLWHA, GBV
Matatiele Advice Centre
(MAC)
SCG Promotion, Life‐skills training, Para‐legal
Support, GBV
Bathehi Ba Kgotso Youth
Organisation (BBKYO)
Mobilising Youth, SCG Promotion, Life‐skills
training, Support to PLWHA, GBV
Mt Fletcher Advice Centre
(MFAC)
SCG Promotion, Life‐skills training, Para‐legal
Support, PLWHA, GBV
Siyanakekela Community
Development (SCD)
SCG Promotion, Life‐skills training, Para‐legal
Support, PLWHA, GBV
HIV/AIDS‐affectedhouseholdsaremorelikelytofacerecurringanddebilitatingfinancialshocks
thatcanpushhouseholdsdeeperintoapovertytrap.Recurringboutsofillnessanddeatherode
thefinancialresourcesofimmediateandextendedfamiliesastheypayformultiplehospital
trips,medicalexpenses,andfuneralcosts(Donahue,2000).Thedeathorsicknessofaprincipal
breadwinneraffectsthewellbeingofthewholehouseholdaswellasanyconnectedsupporting
households.
Intheeventofanadverseshocksuchasdeathorsickness,householdswithnoeffectivesafety‐
netarelikelytoemployoneormoreofthefollowingstrategies:
Reducefoodconsumption(e.g.byskippingmealsandreducingqualityoffood);
Cutbackonnon‐emergencyhealthcosts;
Removechildrenfromschoolordelaypaymentofschoolfeesorrelatedcosts;
Sellvaluableassets;
Burdenkinship,extendedfamilyandcommunitymemberswithrequestsforassistance;
BorrowfromMashonisasatusuriouslyhighinterestrates
SCGmembershipcanhelpHIV/AIDS‐affectedhouseholdstoachieveconsumptionsmoothing
andthusavoidemployinganyofthenegativeandpotentiallyirreversiblecopingstrategies
outlinedabove.Thegoalisthathouseholdsbuilduptheirassetandsavingsbasesothat

10 | P a g e
transitoryincomeshocksdonotaffectconsumptionpatterns(MurdochinZeller,1999).SCG
membershavecheapandimmediateaccesstocreditsothattheyavoidresortingtothesaleof
assetsandborrowingatexorbitantrates,astrategywhichcoulddestroyfutureproductive
capacity(Donahue,2000).
2. LocalContext
ScopeandScale
ThisstudyisbasedonSaveAct’sEasternCapeactivitiestargetingPABHA.Basedintheremote
ruraltownofMatatiele,theEasternCapeofficeservesatotalofover3,500SCGmemberswith
oneProgrammeCoordinator,twoFieldOfficersandfivesmall‐scaleimplementingpartners,
monitoredandsupportedbySaveActstaff.
SaveActtargetedPABHAthroughstrategicpartnershipwithlocalHIV/AIDSCBOs.SCGswere
formedontopofexistingHome‐basedCarer(HBC)andSupportGroups(SG).TheseSCGsthen
greworganically,allowingsomenewmemberstojoin.SaveActsupportsfourSGsandsixHBCs,
servingtengroupswithatotalof158members5.Threegroupswereformedin2008,five
formedin2009twoin20106.Averagegroupmembershipisfifteenpeople,withagenderratio
of88%female:12%male.SCGsareinsixlocalsub‐villagelevelareasintheAlfredNzoand
UkhahlambaDistrictsoftheEasternCapeincluding,Matatiele,Xaxazana,Khoapa,Mpharane,
KhubetsoanaandDikamoreng.TheseareasfallundertheMatatieleandElundiniLocal
Municipalities.
5 While these nine groups are openly affected by HIV/AIDS, SaveAct staff members are aware of large numbers of other SCG members in non‐HIV/AIDS‐specific groups who are affected by the disease5. This study however, focuses on the nine HIV/AIDS‐specific SCGs. 6 A full list of groups can be found in the annex.

11 | P a g e
PovertyLevels
With74%ofitspopulationlivingbelowthepovertyline,theEasternCapehasthehighestrate
ofextremepovertyinSouthAfrica7.IntheAlfredNzodistrict,82.3%8ofthepopulationlivein
poverty.ThisismuchhigherthaneventheProvincialnorm.Povertylevelsarefoundtoberising
intheEasternCape,fromaprovincialaverageof71%in2004(HumanSciencesResearch
Council)to74%in20119.
TherootcausesofhighpovertyratesintheEasternCape,aformerdesignated‘Homeland’10,are
linkedtothepoliciesandpracticesoftheapartheidregime.Eveninthepost‐liberationera,rural
areasintheEasternCapeshowtheeffectsofapartheidplanningandarecharacterisedby
economicmarginalisationandadistinctlackofservicesandinfrastructure.Thisisalsoinlarge
partduetothesheerisolationandgenerallylowereconomicpotentialofthearea.
7 Alfred Nzo District Municipality Annual Report, 2011 8 Ibid 9 Ibid 10The Eastern Cape wasone of ten tribally basedself‐governinghomelands called bantustans, provided with massively inferior services and resources compared to those of ‘White South Africa’.

12 | P a g e
Unemployment
Table2:UnemploymentRates
South Africa %
General unemployment rate 24
Alfred Nzo and Ukhahlamba
Unemployment 75
Not generating any income 69.8
Earn more than R1600/mth 6.7
Depend on govt. social grants 33.5
Source:AlfredNzoDistrictMunicipalityAnnualReport,2011,StatisticsS.Africa,LatestKeyIndicators,2010
Entrepreneuriallevelsarelowandmosthouseholdsrelyonseasonalmigrantworkand
remittances11.
WithSouthAfrica’shighgeneralunemploymentrate,theonlyviablelivelihoodoptionforthe
poorinAlfredNzoandUkhahlambaisself‐employment.Thisincludesmainlyseasonalpetty
IGAsandsmall‐scaleagriculture.InSouthAfrica’sdominantformaleconomywithmarkets
monopolisedbylargewholesaleandretailfoodandcommoditysectors,eventhemost
successfulsmall‐scaleproducersexperiencesignificantobstaclestoparticipatinginthese
markets.ManyhouseholdsinAlfredNzoandUkhahlambaexperiencesevereeconomic
instability,withperiodicshocksthatleadtodebilitatingspiralsofdebtandhunger.Financial
literacylevelsarelowandmanyfallpreytotheeconomicallycripplinginterestratesofloan
sharks.
SocialConditions
Table3:SocialGrantsReceived
Social Grants Received
Child Support Grant (including foster grant)
Old Age Pension
People with HIV/Aids with low CD4 counts. Source:AlfredNzoDistrictMunicipalityAnnualReport,2011
11Alfred Nzo District Municipality Annual Report, 2011

13 | P a g e
Table4:HIVInfectionRates
HIV infection Rates
% of total population
Alfred Nzo 26
Ukhahlamba 19 Source:Ibid
TheareaexperienceshighlevelsofHIV/AIDSandassociatedopportunisticinfectionssuchas
Tuberculosis,resultinginlowlifeexpectancylevels.Accesstoqualityhealthcareisscarceandis
madedifficultbythevastnessofterrain,pooraccessroadsandlackofpublictransport.
HIV/AIDSsupporthasbeenparticularlypoor.Therearenowstepsinplacetotrytoredressthe
situation,howeveralargeportionofthosewhoshouldbeonARVsarenotcurrentlyon
treatment.
GenderRelations
The2011WorldHealthSurveyrevealedfallinglifeexpectancyforSouthAfricanwomento55
yearsfrom59in2000and68in199012.Whereaslifeexpectancyisconsistentlyrising
throughouttherestoftheworld,ithasbeenfallingforSouthAfricanwomenfortwodecades.
ThisislargelyattributedtohighHIVinfectionrates.
TheHIV/AIDSinfectionriskisexacerbatedforwomenbyhighlevelsofgenderinequalityand
gender‐basedviolence(GBV).ArecentsurveyconductedbytheDepartmentofSocial
DevelopmentforAlfredNzorevealeddisturbinglyhighlevelsofacceptanceofGBVasthenorm
incomparisonwithattitudesinotherareas13.ThissuggeststhatGBVisaseriousproblem.GBV
andgenderinequalitymakeswomenlargelypowerlesstoensuresafesexandcondomusage,
potentiallyacceleratingthespreadofHIV.Therearealsohighlevelsoffemale‐headed
households(FHHs)(58%14),withwomenandchildrencarryingasignificantburdenofthe
effectsoftheepidemicandothersocialills.
GenderinequalityisfurtherhighlightedinAlfredNzoandUkhahlambabyslightbut
consistentlyhigherratesofmalesineducationthanfemales.Thesignificanceofthisbecomes
apparentwhenitishighlightedthatfemalesconstituteahigherproportionofthelocal
population.Seebelow:
12WHO, World Health Survey, 201113Alfred Nzo Department of Social Development Nodal Baseline Survey, 200814Ibid

14 | P a g e
Table5:GenderProportionsinEducation
District Proportion of the population %
Alfred Nzo Male 45 Female 55
Ukhahlamba Male 45 Female 55 Proportion in Secondary Education
Alfred Nzo Male 52 Female 48
Proportion in Tertiary Education Alfred Nzo Male 53
Female 47 Source:AlfredNzoDepartmentofSocialDevelopmentNodalBaselineSurvey,2008
ServiceDelivery
The2007AlfredNzoSocialDevelopmentbaselinerevealedthat:97%ofhousingisinformal;
93%ofhouseholdsdonothavestandardsanitation;93%ofhouseholdshavenorefuse
collection;90%donotreceivestandardwaterservices;35%donothaveelectricityforlighting;
and,housesare9%morelikelythaninanyotherareatobeheadedbyafemale.
3. Methodology
Ofthe158membersserved,aone‐thirdsamplesizeoffifty‐threeSCGmemberswasselected.
Whileresearchisconductedwithindividuals,theeffectsofHIV/AIDSspanwholehouseholds
andfamilynetworksandthereforequestionsareconcernedwithhouseholdaswellas
individuallevelanalysis.ResearchwasconductedinthefieldfromMarch–June,2011insix
initialsessions,twoofwhichconsistedofmorethanoneSCG,followedupbyrepeatedsitevisits
andSemi‐structuredIndividualInterview(SSI)sessions.
Researchtechniquesfollowamainlyqualitativeapproach.Thelivesofthetargetpopulationare
embeddedinthecomplex,messyandunpredictablerealitiesoftheeveryday.Theresearcher
recognisesthatthetargetgroupof‘PABHA’isnotasinglehomogenoussectorofsocietywitha
prefabricatedsetofcommonneeds.Whileasagroup,PABHAmayfacesomecommon
challengesandshocks,memberswillmeetadiverserangeofchallengeswithadiverserangeof
responses.Theaimofthisstudyisthereforetoaskboth‘what?’and‘why?’Thus,while

15 | P a g e
quantitativestudyhasspecificadvantages,inthiscaseitwouldfailtocapturethediversityof
experiencesandthecomplexunderlyingreasonsbehindthedata.
Fourprincipalresearchtoolswereemployedwithallfifty‐threeparticipants:seasonality
analysis,crisistrendanalysis,loanusagerankingandgeneralquestionnaires.Afurthertwenty‐
oneoftheseparticipantswererandomlyselectedforsemi‐structuredindividualinterviews
(SSIs).EachtoolusesParticipatoryRuralAppraisal(PRA)methodstouncoverthecomplexity
andmessinessbehindthecopingstrategiesofPABHA.Thetwocomplementarytools,
seasonalityanalysisandcrisistrendanalysis,wereusedbasedonastudyofconsumption
smoothingbyHögman(2009)15andformedthebasisaroundwhichtheothermethodswere
chosen.Thesetoolswerecombinedwithfieldobservationsbytheresearcherandin‐depth
discussionsandinterviewswithkeystaffmembersandFieldOfficers.
Whileseasonalityanalysisisusefulfortrackingmonthlyflowsofincome,expenditure,credit
andsavings(ibid)(SeeAppendix1),crisistrendanalysisprovidesatimereference,allowingthe
researchertotrackchangesintheuse/availabilityofcertainfinancialinstrumentsoverfive‐
years(Appendix2).Theseexercisesarebasedonthepremisethatifexpenditurepatterns(used
hereasaproxyforconsumption)nolongercloselyfollowincomelevelsandSCGservicesare
becomingmoreandmoredominantinrelationtootheroptions,itcanbeconcludedthatSCG
membershiphascontributedtoconsumptionsmoothing(Högman,2009).Theloanusage
exerciseoffersanindicationofthedifferentneedsandprioritiesofparticipants(Appendix3)
andthegeneralquestionnaireextractsmoredetailfrommembersregardingtheeffectsofSCG
membership(Appendix4).SSIswereopen‐endedtoallowparticipantstospeakfreelyofthe
aspectsofSCGmembershipmostimportanttothem(Appendix5).
Allresearchactivitieswereconductedinlocallanguages,mainlyXhosaandSotho,withtheaid
ofalocaltranslator.SessionswerecarriedoutincommunitymeetingplacesandSSIswere
carriedoutonacasebycasebasisinlocationsconvenientforparticipants.
3.1TheParticipants
CompleteSample:
ResearchtookplaceinfourofthesixprojectareaswithsevenofthetenrelevantSCGs.Selection
reliedontimingofgroupmeetings,attendanceandpracticalityissues.Oftheparticipants,88%
15 This analysis is based on the model of consumption smoothing developed by Aghion and Murdoch (2005).

16 | P a g e
werefemaleand12%weremale,reflectingtheoverallgenderdimensionsofallrelevant
groups.Allhouseholdsinthisstudyarepoororverypoorandarereliantonacombinationof
socialgrants,remittances,sporadicpiecejobsandsmallIGAs.AllareaffectedbyHIV/AIDSand
arevulnerabletoshocksrelatedbutnotlimitedtotheepidemic.
Semi‐structuredIndividualInterviews(SSIs):
Effortwasmadetoincludeparticipantsfromasmanyprojectareasaspracticallypossibleand
consistedofmembersfromthreeofthesixareas.Participantcharacteristicscanbeoutlinedas
follows:
Table6:ParticipantCharacteristics
Participant Characteristics Total %
Female 86%
Male 14%
In 2nd savings cycle 52%
In 3rd savings cycle 48%
From FHH 48%
From JHH 52%
Averagehouseholdsizeis6members,thelowestbeingonememberandthehighestbeing
eleven.
Table7:HIV/AIDSGroupMembership
HIV/AIDS Group Membership Total
Home‐based Carer 48% Support Group Member 4%
Ex‐support Group Member 34%
No HIV‐related Group 14%

17 | P a g e
HIV/AIDSLinkages:
33%wereopenlyHIV‐positive16themselves.14%weresupportingsomebodywithHIV
internally,and52%weresupportingoneormultiplepeopleinexternalhouseholds.47%of
householdswereeitherfullyorpartiallysupportingchildrenorphanedbyAIDS.Thespecific
breakdownofHIV/AIDSlinkagesisoutlinedbelow:
Figure1–HIV/AIDSLinkages
Source:Author’sowndata–valuesrepresentnumbersofpeopleaffected.
3.2Limitations
Amajorobstaclewasthatoflanguageandwhileatranslatorwasused,theauthormustbe
sensitivetoissuesofmisinterpretation.Anadditionalchallengewastheisolationandpractical
conditionsinthearea.Withlimitedresourcesandtime,thisresearchwascarriedoutoverthe
harshwintermonthsturningsimpleissuessuchastraveltoremoteareasandattendance
levels17intosignificantobstacles.Whilemakingresearchconditionsdifficult,thistimingoffered
valuableinsightintothelivesofPABHAattheirmostdifficulttimeoftheyear–atimethatis
rarelydocumentedfirst‐handbyoutsiders.Anadditionalconcernwasthatgroupmembers
wouldbereluctanttodiscusssensitiveissuesofHIV/AIDS,moneyanddeath.Thisissuewas
overcomebyattemptstogainthetrustofparticipantsthroughaseriesofmeetingsand
16 The actual number could be higher as two participants declined to state their HIV‐status and three declined
to identify exactly who was affected. 17 Considering the target group of PABHA, the winter months proved difficult as some participants were suffering from illness and unable to attend meetings. To overcome this, a small series of home visits were made.
79
7 64 3 2
12
0
5
10
15
20
Self Sister Brother Cousin / Aunt
Child Other / Extended Family
Unknown HHs Fully / Partially
Supporting Orphan

18 | P a g e
introductionsfromtrustedSaveActFieldOfficers.Contrarytoexpectations,theresearcher
foundthatthemajorityofparticipantswereopenandwillingtodiscusssensitiveissuesand
wereeagertoshareexperiences,bothpositiveandnegative.
Eachoftheselimitationshasinevitablyimpactedthisstudy,howevereveryeffortwasmadeto
minimisethisimpact.
4Results
ResultsfromthegeneralquestionnairesandSSIswillbereferredtoforbackgroundand
additionaldetailthroughoutallfollowingresultssections.
4.1SeasonalityAnalysis‐ConsumptionSmoothing
Figure2‐SeasonalityAnalysisofIncome
Source:Author’sowndata–includesallgroupincometotals.ForfulltableofallresultsseeAppendix1.
Incomeflowsvaryquitesubstantiallythroughouttheyear.ThroughSSIsanddiscussions,most
participantsidentifiedmonthlysocialgrantpaymentsasincomesources,toppedupbyirregular
moneyfromremittances,localpiecejobsand(seasonalandsporadic)IGAs.Somemembers
reliedonasmallsalaryfromworkasahome‐basedcarer,whichispaidirregularlyand
erraticallybytheDepartmentofSocialDevelopment.IncomeishighestinMarch,June,
September/OctoberandDecember.BetweenMarchandMaysomevegetableandhome‐grown
0
20
40
60
80
100
120
140
160
Jan Feb March April May June July Aug Sept Oct Nov Dec
Month of the Year
19 | P a g e
cropharvestsoccurcontributingtoaslightriseinincome.Manyinformalstokvelgroupshave
anannualpay‐outbetweenOctoberandDecember.ManySCGshare‐outsalsooccuraroundthis
time.
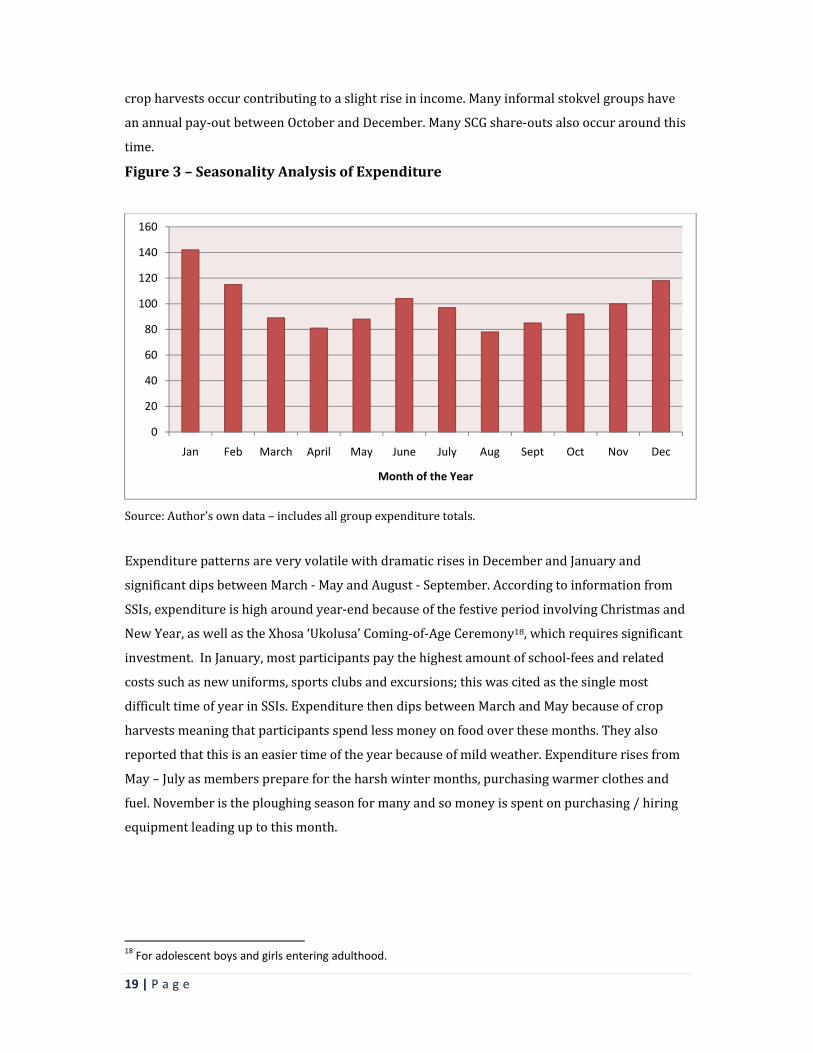
Figure3–SeasonalityAnalysisofExpenditure
Source:Author’sowndata–includesallgroupexpendituretotals.
ExpenditurepatternsareveryvolatilewithdramaticrisesinDecemberandJanuaryand
significantdipsbetweenMarch‐MayandAugust‐September.Accordingtoinformationfrom
SSIs,expenditureishigharoundyear‐endbecauseofthefestiveperiodinvolvingChristmasand
NewYear,aswellastheXhosa‘Ukolusa’Coming‐of‐AgeCeremony18,whichrequiressignificant
investment.InJanuary,mostparticipantspaythehighestamountofschool‐feesandrelated
costssuchasnewuniforms,sportsclubsandexcursions;thiswascitedasthesinglemost
difficulttimeofyearinSSIs.ExpenditurethendipsbetweenMarchandMaybecauseofcrop
harvestsmeaningthatparticipantsspendlessmoneyonfoodoverthesemonths.Theyalso
reportedthatthisisaneasiertimeoftheyearbecauseofmildweather.Expenditurerisesfrom
May–Julyasmemberspreparefortheharshwintermonths,purchasingwarmerclothesand
fuel.Novemberistheploughingseasonformanyandsomoneyisspentonpurchasing/hiring
equipmentleadinguptothismonth.
18 For adolescent boys and girls entering adulthood.
0
20
40
60
80
100
120
140
160
Jan Feb March April May June July Aug Sept Oct Nov Dec
Month of the Year

20 | P a g e
Figure4–SeasonalityAnalysisofSavings
Source:Author’sowndataincludingallgroupsavingstotals.
Itisinterestingtonotethatwhilesavingslevelscouldbeexpectedtocloselytrackincome,the
datalineistheleastvolatileofall,followingarelativelystablepatternthroughouttheyear.This
givesanindicationofthecommitmentofthetargetgrouptotheirsavingsactivities.Itisnot
clearfromthisresearchwhetherthisisinanywayconnectedtoHIV/AIDSlinkagesandthusthe
potentiallyincreasedneedtodevelopaneffectivesafety‐net.Savingslevelscanbeseentorise
graduallytowardstheyear‐end.Manyparticipantsexplainedthattheybeginsavingatthistime
inanticipationofhighexpenditureinJanuaryandasexpected,thisisthemonthwiththelowest
levelsofsavings.
Photograph 4 ‐ Research participant, Mpharane
0
20
40
60
80
100
120
140
Jan Feb March April May June July Aug Sept Oct Nov Dec
Month of the Year

21 | P a g e
Figure5–SeasonalityAnalysisofCredit
Source:Author’sowndataincludingallgroupcredittotals.
Creditlevelsarehighlyvolatile,risingsubstantiallyinJanuaryandthendippingtorelatively
lowerlevelsthroughoutmostofthefollowingmonths.Creditlevelscouldbeanticipatedtobe
higharoundyear‐endhoweverthisisnotthecase.Levelsactuallydroparoundthistime.In
SSIs,manymembersexplainedadesirenottotakeloansduringthefestiveperiodin
anticipationofhighlevelsofexpenditureinJanuary.Manypredictdifficultyinrepaymentatthis
timeandsorefrainfromtakinglargeloansaroundDecember,savingmoneyfromshare‐outs
andloansearlierintheyearinstead.ThisisadvicethatisreiteratedinSaveAct’sfinancial
educationtohelpmembersavoidrepaymentdifficulties.Asexpected,creditlevelsrise
dramaticallyinJanuarytocoverschoolfeesandrelatedcosts.Theyalsoriseslightlyjustbefore
andduringthewintermonthswhenSSIrespondentsreportspendingextraonmedicalcosts,
warmclothes,fuelandfood.
0
20
40
60
80
100
120
140
160
Jan Feb March April May June July Aug Sept Oct Nov Dec
Month of the Year

22 | P a g e
Figure6–SeasonalityAnalysisofIncome,Expenditure,Savings,andCredit
Source:Author’sowndataincludingalltotals.
Flowsofeconomicactivityvarygreatlyovertheyear.Creditis,perhapssurprisingly,themost
volatileofalldatalines.Thisvolatilitycouldbeattributedtothefactthatmanyparticipantstake
credittodealwithafinancialcrisis,thenatureofwhicharead‐hocandunpredictable.Asnoted
above,themoststabledatalineisthatofsavings,thisissurprisinglyunrelatedtoincomelevels.
Anexplanationforthisisthepossibilitythat,asreportedinsomeSSIs,memberssaveasmall
proportionofloansincaseofanemergencyordifficultyinrepayingthustoppingupsavings
levelsevenwhenincomelevelsarelow.Asignificantresultisthatexpenditurelevelsdonot
closelyfollowincomeflows.Infactduringlowincomeperiods,expenditureisatitshighest
(January)andspendinglevelsdipwhenincomelevelsarerelativelyhighfromMarch–May.
Thisishighlyindicativeofconsumptionsmoothing,suggestingthatparticipantsareinsome
wayprotectedfromthevolatilityofincomelevelsandstrongfinancialpressures.
ThisevidenceissupplementedbytherecurringthemeinSSIsof‘control’.Theabilitytoplanand
savewascitedasoneofthethreemostimportantbenefitsofSCGmembershipby29%of
participants.AsNomsaDidi(SCGmember,Xaxazana)states;“Icannowplanandbudgetforthe
futuresohavemorecontrolovermylife”.Whiletheutilityofcreditwasfrequentlyunderlined,
theadvantagesofsavingappearedtobeequallyappreciated.Membersdescribedthecoping
strategiestheyareabletoemploytoprepareforroutinelydifficulttimes.AsZandileMalgas
0
20
40
60
80
100
120
140
160
Seasonality Analysis
Sum of Income
Sum of Expenditure
Sum of Savings
Sum of Credit

23 | P a g e
commented,“thereisnomoreuncertaintyattheendofeachmonthbecauseIknowIwillhave
enoughmoney”.Whenaskedaboutfrequencyofloanuse,anaveragefigureof5.2loansper
memberwasgiven.14%ofparticipantsreportedhavingdifficultyrepayingcredit.Thesefigures
suggestthatloansarebeingtakenonaregular,butnotoverwhelmingbasis.
4.2TrendAnalysisofCreditUse–CrisisMitigation
Figure7–Crisistrendanalysis:FiveYearsAgo
Source:Author’sowndata,totalofallgroupsforfiveyearsago.Seeappendix2forfullresultstable.
Fiveyearsagofamilywasthemostfrequentlyusedsourceoffundsintimesofcrisis.Thisis
followedbyuseofinformalgroupssuchasstokvelsandburialsocieties.Whenaskedabout
interestratesonmoneyborrowedfromstokvels,responsesrangedfrom30%–40%‐afigure
ashighassomeloansharksor‘Mashonisas’.Mashonisaswerethethirdmostfrequentlyused
financialinstrumentindealingwithadverseshocks,withinterestratescitedasaround50%‐
60%permonth.Fourthmostfrequentlyusedwasownsavings,thisbacksupthetheorythat
poorpeoplecananddofrequentlysave.Formalbankloanservicesarefifthat13%.When
discussed,itbecameclearthatparticipantsincludedlocal‘microcredit’companiesinthissector,
manyofwhichchargeinterestratesofupto40%.SaveActserviceswerenotusedasthisis
beforeitsexistenceinthearea.
Family39%
Loan Shark17%
SAVEACT Loan0%
SAVEACT Social Fund0%
Formal Bank Loan
11%
Informal Savings Group (high interest)21%
Sale of Assets0%Own Savings
12%

24 | P a g e
Figure8–CrisisTrendAnalysis:LastYear
Source:Author’sowndata–totalofallgroupsforlastyear
Inresultsregardinglastyear,themostfrequentlyusedfinancialserviceintimesofcrisisis
SaveActCredit.Thisisfollowed
bytheSaveActEmergency
SocialFundat17%,thenfamily
at16%.Usageofinformal
savingsgroupssuchasstokvels
remainsrelativelyhigh,falling
from21%to12%betweenthis
yearandfiveyearsago.Theuse
ofMashonisashasdropped
dramaticallytojust1%,ashas
useofformalbankloans(2%).
Uselevelsofownsavings
Family16%
Loan Shark1%
SAVEACT Loan39%
SAVEACT Social Fund17%
Formal Bank Loan2%
Informal Savings Group12%
Sale of Assets2%
Own Savings11%
Last Year
Photograph 5 ‐ Research Participant, Xaxazana

25 | P a g e
remainsimilarandsaleofassetshascreptupfrom0%to2%.
Figure9–CrisisTrendAnalysis:ThisYear
Source:Author’sowndata–totalofallgroupsforthisyear.
Resultsfrom‘thisyear’and‘lastyear’areverysimilar.At38%,SaveActloansarethemost
frequentlyusedfinancialinstrumentintimesoffinancialcrisis,thistimetheyare,however,
followedbyfamilyat15%.TheSaveActSocialFundusageappearstodropto13%.When
discussedinSSIsitbecameclearthatthisisbecausetheFundisonlypaidoutforcertaincrises
stipulatedintheGroupConstitutionandwithinterviewstakingplaceinthemiddleofasavings
cycle,circumstancesqualifyingmembersasfundrecipientsmaynothaveoccurred.Useof
Mashonisasremainslowat1%,asdoesthatofformalbankloans‐2%.Usageofotherinformal
savingsgroupsandownsavingsremainsstable.
Theaboveresultsindicatethatcrisiscopingstrategieshavechangedsignificantlyamong
participantsoverfiveyears,withSaveActSCGservicesbecomingthemostdominant.A
significantresultisthesubstantialdecreaseinuseofMashonisasfrom17%tojust1%.Another
significanttrendisthedecreaseoffrequencyatwhichSCGmembersborrowfromfamily,which
Family15%
Loan Shark1%
SAVEACT Loan38%
SAVEACT Social Fund
13%
Formal Bank Loan2%
Informal Savings Group
15%
Sale of Assets4%
Own Savings12%
This Year

26 | P a g e
fellfrom39%to15%.Nowat38%,usagelevelsofSaveActcreditseemtohavedirectlyreplaced
thoseofborrowingfromthefamily.Itisnoteworthythatuselevelsofownsavingshave
remainedrelativelyconstant,suggestingthatthesehouseholdsmaysavebothwithinand
outsideoftheirSCGs.
SSIsrevealedthevalueandsomeofthereasonsbehindthesechanges.Arecurrentthemewas
thediminishingneedforMashonisas.Whenaskedtoidentifythethreemostbeneficialeffectsof
SCGmembership,theoverallmostfrequentlycitedbenefitwas‘freedomfromdebts’.Thiswas
identifiedby43%ofparticipants,with24%citing‘lowinterestrates’,19%‘self‐reliance’and
14%‘accesstomoneyinacrisis’.52%claimedthattheynolongeruseMashonisasand33%
reportednolongerhavingtoborrowfromfamilyorneighbours.28%reportnowbeingableto
assistfamilyandcommunitymembersfinanciallywhereasbeforetheywerestronglydependent
onthem.83%oftheseparticipantswereopenlyHIV‐positiveandattributedthischangedirectly
toSCGmembership.Anadditional52%explicitlycommentedthattheyfeelself‐sufficientand
contributemoretotheirhousehold,againdirectlyattributingthistoSCGactivities.
AnothersignificanttrendwasamoreintelligentuseofMashonisas.MembersuseMashonisas
orotherhigh‐interestmoneylendersintheeventofacrisisoccurringinbetweenSCGmeetings.
TheythenimmediatelyrepaywithaSaveActloanfromtheirnextmeeting.Inthiswaytheyare
takingadvantageofloansharkconveniencebutavoidingpaymentofusuriousinterestrates.
ThisdatasuggeststhatSCGmembershipisallowingPLWHAtoemploystrongercoping
mechanismsintimesofcrisisandavoidstrongrelianceonfamily,neighboursorhigh‐interest
debts.SSIdiscussionsrevealthatitisalsoeasingtheburdenonhouseholdssupportingoneor
morepeoplelivingwithHIV/AIDS,ordealingwiththedeathofarelativefromanAIDS‐related
illness.AsSaveActserviceshavebecomedominantandrepresenttheonlyapparentmajor
changeinthetargetgroup’saccesstofinancialservices,itcanbedeductedthatthesechangesin
behaviourcanbelargelyattributedtoSCGmembership.

27 | P a g e
4.3LoanUsage19
Figure10–LoanUsageRatings
Source:Author’sowndata–totalofallloanusageratings
Themostfrequentuseofcreditisforinvestmentsinhomeimprovements.Thisfindingis
supportedbyquestionnaireresultsshowingthat94.2%ofallparticipantshavespentmorethan
R1000onhomeimprovementsinthepasttwelvemonths.Thenextmostfrequentpurposeisto
coverschool‐feesandrelatedcosts.Thisisfollowedcloselybyexpenditureonhealth‐related
costsandisespeciallysignificantforPLWHAwhoarelikelytohavehighoutgoingsrelatedto
health.Alsoimportanttonoteisthatrepaymentofpreviousdebtsconstitutesthefourthmost
frequentuseofcredit.Transportalsoconstitutesasignificantproportionofcreditusage.When
discussedinSSIs,participantsexplainedthatthislargelycoveredtransporttohospitalsinan
emergency,monthlytransporttocollectARVmedicationandtransporttoschools.Thetotalof
creditspentonIGAs,bothnewandexisting,isjointfifth.Livestockandfoodaretheleast
frequentcategoriesofcreditusage.
19 This tool was changed after the first research session took place meaning that this tool represents a sample size of 44 rather than the full 53.
Food9%
Repayment of Previous Debts
12%
Livestock3%
New IGA3%
Existing IGA7%
School Fees14%
Home Improvements
19%
Medicines / Doctor /
Hospital fees13%
Transport10%
Other e.g Blankets, Fuel, Airtime,
10%

28 | P a g e
Thisdatashowsthatcreditisusedtocoverbasicneedssuchasfood,transport,schoolingand
healthcosts.Theneedforcredittomeetthesebasicneedsindicatesthehighvulnerabilitylevels
ofclients.Italsoindicatesthattheconsumptionsmoothingevidentintheaboveseasonality
analysisresultsissignificantlyrelatedtotheaccesstocheapandimmediateSCGcredit.Results
doshowsignsofmoreproductiveactivitiestakingplace,suchasinvestmentsinhome
improvements,newandexistingIGAs,livestockandrepaymentofpreviousdebts.Thissuggests
increasesineconomicstability.
4.4HomeImprovements
AccordingtoKHANA(2011),homeimprovementwillnotnormallytakepriorityforapoor
householdunlesstherearebothincreasedfundsflowingintothehouseandconfidencethat
theywillbemaintained.Thislevelofinvestmentindicatesasubstantialincreaseinhousehold
economicstability.InSSIs,participantsnotedthathomeimprovementsleadtoanincreased
feelingofwellbeing.ThosewhoareHIV‐positivethemselvesorsupportingPLWHAcommented
thatabetter,saferandwarmerhomeenvironmentwasaffectingtheirhealthinapositiveway.
Table8:MostCitedHomeImprovements
Plastering work to protect against cold
Purchase of water tanks
Repairing leaks and ceilings
Purchase of appliances e.g. cooking stove and fridge
Purchase of household furniture e.g. beds, wardrobes, cupboards
4.5Health
WhenaskedabouttheextracostsassociatedwithHIV/AIDS,SSIparticipantscitedfoodas
primary.Extraexpenditureonheatingandwarmclothesduringwintertopreventexposureto
coldwasalsomentioned,aswellasincreaseddoctor/medicalfees.Thesecostsareallrelatedto
adviceon‘livingpositively’withHIV/AIDS20.Resultsfromthegeneralquestionnaireshowthat
88%ofparticipantsfeelmoreableto‘livepositively’withHIVorsupportHIV‐positive
20 SG and HBC group members receive advice from an HIV/AIDS CBO on how to ‘live positively’ with HIV – this
centres mainly around diet, home environment, avoiding exposure to cold and being open about status.

29 | P a g e
dependentstodoso.38%ofSSIparticipantscited‘improvedhealth’asthemostimportant
benefitofSCGmembership,with90%reportingimproveddietandnutritionsincejoiningthe
SCGandtwoparticipantsdirectlynotingthattheyhadexperiencedariseinCD4‐cellcount
levels.
4.6ProductiveActivity
Thisstudyconsidersrepaymentofpreviousdebts‘productiveactivity’asitallowsparticipants
toescapepotentialpovertytraps.Throughdebtrepayment,householdscanregainfinancial
controlandbegintoemploymoreproductivecopingstrategies.With10%ofallcreditbeing
usedtoinvestinIGAs,itisclearthatthistargetgroupareusingSCGmembershipforproductive
activity.GeneralquestionnaireresultsrevealedthathalfofallparticipantshaveusedSCG
membershiptoeitherinitiateorexpandanIGA.Thisevidenceissupportedbyinformationfrom
SSIs,with52.3%ofparticipantsreportinginvolvementinanIGAandmanyrelyingdirectlyon
theirmicro‐businessactivitiesforsurvival.AsZodwaDodo,singleHIV‐positivemotheroffour,
states;“mybusinessismyfamilybecausewithoutitwewouldnotsurvive”.91%ofSSI
participantsclaimedtohavesignificantlyexpandedexistingIGAssincejoiningtheirSCG,
although9%reportednochangeandonewomanvoicedconcernsregardingmarketsaturation.
With3%ofallloansbeingusedtostartanewIGA,itappearsthatSCGmembershiphasbrought
aboutsomepositivechangesinlevelsofproductiveactivity,althoughthisislimited.
4.7GenderDynamics
Questionsfiveandeightofthegeneralquestionnaireregardingself‐confidenceandhousehold
statusweredesignedtocaptureasenseofthegenderdynamicsamongparticipants,aswellas
potentiallyreflectingonissuesofHIV/AIDSstigma(seeappendix4).100%ofparticipants
respondedpositivelytobothquestions.Theseweretheonlytwoquestionstoreceivesuch
overwhelminglypositiveresponsessuggestinglargeimpactinthesedomains.Recurrentthemes
inSSIswithbothmenandwomencentredonincreasesinself‐confidenceandself‐esteem,with
manyattributingthesechangestoincreasingself‐sufficiency.
Inter‐householdRelationships
Themajorityofparticipantsreportedincreasedlevelsofrespect.Justunderhalfofthewomen
intheSSIsamplewereunmarriedandreportedbeingprincipalhouseholddecision‐makers.All
marriedwomenreportedeithersharingthisrolewithhusbandsorplayingalimitedpartinthe

30 | P a g e
process.Somefemaleparticipantsrelayedstoriesofincreasedparticipationinhousehold
decisionmaking.Theyattributedthischangetothefactthathusbandsnoticedconcretechanges
inhouseholdlivingstandardsstemmingfromSCGactivities.Othersreportedhavingalways
sharedthisresponsibilityequallywiththeirhusbands,whileasmallpercentagereportedno
significantchanges.Overall,theexperiencesofdifferentparticipants,bothmaleandfemale,are
diverseandhighlydynamic.OnecommonimpactofSCGmembershiponallparticipants
however,isasenseofincreasedself‐worthandself‐confidence.Forsomeparticipantsthishas
thepotentialtotranslateintoconcretechangesinrelationshipswhileforothersthisisamore
difficultprocess.
Extra‐householdRelationships
DuringSSIs,participantswereaskedaboutstatusinthecommunity.95%ofparticipants
reportedanimprovedstatusasaresultofSCGactivities.Formanyparticipants,thiscentred
aroundnolongerbeingdependentonothersandbeingabletomakevisibleimprovementsto
housingwithoutincurringlargedebts.
Photograph 6 ‐ Noamen Nongenzi with her 6 children and sister in their new kitchen, Khoapa

31 | P a g e
5. Conclusions:
ThesituationsofpoorruralhouseholdsaffectedbyHIV/AIDSareextremelycomplexand
difficulttograspatasinglepointintime.Inspiteofthis,thisstudypresentsimportantevidence
ofconsumptionsmoothingandimprovedcopingmechanismsamongPABHA.Withresultsfrom
thetrendanalysiscoupledwiththeseasonalityanalysisandotherdata,itisreasonableto
assumethatthechangesweredueinasignificantmeasuretoSCGactivities.
Resultsclearlyshowthatlevelsofexpendituredonotcloselytrackincomeflows.Thereisalsoa
stabledemandforsavingandcheapcreditamongstparticipants.Usageofloanssharksand
otherhighinterest‐chargingmoneylendershasdecreaseddramatically,ashastheincidenceof
borrowingfromfamilymembers.Inturn,useofSCGloansintimesofcrisishasincreased
substantially,becomingthedominantfinancialinstrumentforparticipants.Theseresults
suggestthatriskreductionactivitiesamongPABHAhavebeenstrengthened.Thetargetgroup
areavoidingirreversiblecopingstrategiesandaregraduallyengaginginmoreproductive
activities.Stablelevelsofconsumptionsuggestthattheyaremoreprotectedfrominsecureand
volatileflowsofincomeandarethusmoreabletomeetbasicneeds.Resultsindicatethatthe
impactofadverseshockshasbeencushionedandcopingstrategiesstrengthened,thusoverall
vulnerabilitytopovertyhasdecreasedamongparticipants.
Consumptionsmoothingandstrengthenedriskreductionactivitieshaveresultedinpositive
effectsonthehealthofparticipantsaswellastangibleimprovementsinlivingconditions.In
addition,improvementsinwellbeingareevident,withqualitativeevidencethatPABHAofboth
gendershavebeenempoweredthroughthisexperience.Thereisalsofurtherqualitative
evidencethatgenderrelationsareshiftingslightlyasaresultofSCGmembership,withwomen
experiencingmorerespectandmorefrequentlytakingpartinhouseholddecision‐making
processes.
Asignificantindicationofprojectsuccessisthelargeandconstantlyincreasingdemandfor
SaveActservicesamongparticipantsandthefactthat98%ofallPABHAhaverecommendedthe
programmetoarelative,friendorneighbour.Demandinthetargetareaiscurrentlytoohighfor
SaveActtomeetandplanstoexpandandspreadtheprojecttonewareasareunderway.With
thistargetgroupbeinglargelytypicalofruralpopulationsaffectedbyHIV/AIDSinSouthAfrica,
itislikelythatthesameimpactcanbeachievedonamuchlargerscaleandthereisthusgreat
scopeforprojectreplicationinotherareas.

32 | P a g e
6. References
AlfredNzoDepartmentofSocialDevelopmentNodalBaselineSurvey,StrategyandTactics(2008)http://www.sarpn.org.za/documents/d0003004/Alfred_Nzo_DSD_nodal_baseline.pps[Accessed18/05/2011]
AlfredNzoDistrictMunicipalityAnnualReport,2011,derivedfromStatisticsSouthAfrica:CommunitySurvey2007:http://www.andm.gov.za/site/index.php/2011/05/annual‐report/[Accessed18/05/2011]
Cameron,Edwin,(2005)WitnesstoAIDS,Tafelberg.ISBN:0624041999
Collins,DandLeibbrand,M,(2007)TheFinancialImpactofHIV/AIDSonPoorHouseholdsinSouthAfrica,AIDS2007,21(suppl7):S75–S81Availableonlineat:http://www.financialdiaries.com/files/CollinsLeibbrandtAIDS217.pdf[Accessed:24/05/2011]
Collins,Morduch,RutherfordandRuthven,(2009)PortfoliosofthePoor:HowtheWorld'sPoor
Liveon$2aDay,PrincetonUniversityPress
deAghion,ArmendárizandMorduch,Jonathan,(2005),TheEconomicsofMicrofinance,
Cambridge,TheMITPress,pp.1‐346
Donahue(Thompson),Jill,(2000)MicrofinanceandHIV/AIDS:…It’sTimetoTalk,USAIDhttp://www.microfinancegateway.org/gm/document‐1.9.29149/2740_file_02740.pdf
Fourie,PercheandSchoeman,(2010),DonorAssistanceforAIDSinSouthAfrica:ManyActors,MultipleAgendas,StrategicreviewforSouthernAfrica,vol.32,no.2,pp.93‐120
Gow,Jeff,(2010)TheHIV/AIDSEpidemicinAfrica:ImplicationsforU.SPolicy,HealthAffairs,http://content.healthaffairs.org/content/21/3/57.full

33 | P a g e
Högman,Alve,(2009)MicrosavingsEffectsonConsumptionSmoothing:ACaseStudyofSouthAfrica,ThesisWorkD,UppsalaUniversity,DepartmentofEconomics,Sweden
Hosegoodetal,(2007),Revealingthefullextentofhouseholds’experiencesofHIVandAIDSinruralSouthAfrica,SocSciMed,Vol65(6):1249–1259
Eriksen,Kayse,(2009)AnAssessmentoftheRoleofSocialInsuranceFundsinMicro‐Savings:TheCaseofSAVEAct,UniversityofKwaZuluNatal,Durban,SouthAfrica
KHANA,(2011)EvaluationofMicrofinancePilotProjectforHIV‐affectedFamilies,USAID,http://www.aidsalliance.org/includes/Publication/Microfinance_Pilot_Project.pdf[Accessed03/06/2011]
MCNEILL,(2009),‘CONDOMSCAUSEAIDS’:POISON,PREVENTIONANDDENIALINVENDA,SOUTHAFRICA,AfricanAffairs,108/432,353–370
StatisticsSouthAfrica,LatestKeyIndicators,2010http://www.statssa.gov.za/keyindicators/keyindicators.asp[Accessed18/05/2011]
WHO,WorldHealthSurvey,(2011),http://www.who.int/gho/mortality_burden_disease/life_tables/life_tables/en/index.html[Accessed18/05/2011]
Zeller,Manfred,(1999)TheRoleofMicro‐FinanceforIncomeandConsumptionSmoothing,InternationalFoodPolicyResearchInstitute,Availableonlineat:http://www.microfinancegateway.org/gm/document‐1.9.25376/20683_20683.pdf[Accessed:12/07/2011]

34 | P a g e
7. Appendices:
Appendix1:
Seasonality
Analysis
Thistoolgrounds
thecasestudyina
seasonal
understandingof
someofthe
patterns,risksand
financialpressures
facedbyPABHA
andhowmembers
usetheirSCGsand
otherservicestorespondtothese.Itallowstheresearchertomonitortherelationshipbetween
income,expenditure,savingsandcreditandtotrackthestabilityofconsumption(expenditure)
levelsovertheperiodofayear.Itisasimplediagrammingexercisecompletedbyparticipants
themselves.Astraightforwardchartisdrawnonalargepieceofpapershowingallthemonths
oftheyearandthefoursections:income,expenditure,savingsandcredit.Theparticipantsare
thenaskedtoindicatescoresforeachmonthforthefourfactorswithaminimumofzeroanda
maximumofthree.Thisprovidesasimplerankingofeachsectionforeachmonthoftheyear.
Appendix1 SeasonalityAnalysisandresults
Appendix4 GeneralQuestionnaireandresults
Appendix2 CrisisTrendAnalysisandresults
Appendix5 Semi‐structuredIndividualInterviews
Appendix3 LoanUsageExerciseandresults
Appendix6 IndicatorTree
Photograph 6 Example of a seasonality analysis chart (in Xhosa) before use.

35 | P a g e
SeasonalityAnalysisresults,allgrouptotals:
Month SumofIncome SumofExpenditure SumofSavings SumofCredit
Jan 84 142 97 121
Feb 82 115 103 77
March 105 89 105 70
April 99 81 108 88
May 98 88 106 81
June 103 104 104 83
July 96 97 104 60
Aug 100 78 108 66
Sept 112 85 110 73
Oct 111 92 115 76
Nov 107 100 121 65
Dec 133 118 120 65
Appendix2:
CrisisTrendAnalysis
Thecrisistrendanalysisprovidesadetailedinsightintotheoptionsandservicesavailableto
PABHAintimesoffinancialcrisis.Italsoprovidesatimereference,allowingtheresearcherto
trackchangesintheuse/availabilityofcertainfinancialinstrumentsoverafive‐yearperiod.
Togetherwithapilotgroup,theresearcherdevelopedalistofthefinancialservicesavailable
andusedbythetargetgroup.Participantsareaskedtoscoretheoptionsusingthesamesimple
rankingsystememployedintheseasonalityanalysistoindicatetheusagelevelsofdifferent
services.Thematrixincludesatimeaxisdividedintothreesections:thisyear,lastyear,andfive
yearsago.Thisexerciseisbasedonthepremisethatif:a)SCGservicesarebecomingmoreand
moredominantinrelationtootheroptions,and:b)Expenditurelevelsdonotcloselytrack
incomepatterns,itcanbeconcludedthatSCGmembershiphascontributedtowards
consumptionsmoothing(Högman,2009).

36 | P a g e
CrisisTrendAnalysisresults,allgrouptotals:
SourceofMoney GroupOne GroupTwo
Timeline BeforeSaveAct
LastYear
ThisYear
BeforeSaveAct
LastYear
ThisYear
Family 14 3 3 15 7 6
LoanShark 0 0 0 3 0 0
SAVEACTLoan 0 18 6 0 21 23
SAVEACTSocialFund 0 6 0 0 7 4
FormalBankLoan 3 0 0 2 0 0
InformalSavingsGroup(highinterest)
15 0 0 0 2 1
SaleofAssets 0 0 0 0 1 1
OwnSavings 0 0 0 9 6 8
SourceofMoney GroupThree GroupFourTimeline Before
SaveActLastYear
ThisYear
BeforeSaveAct
LastYear
ThisYear
Family 13 6 6 6 6 3
LoanShark 3 0 3 10 0 0
SAVEACTLoan 0 11 14 0 20 18
SAVEACTSocialFund 0 6 7 0 8 0
FormalBankLoan 3 0 0 5 4 5
InformalSavingsGroup(highinterest)
0 7 2 6 6 16
SaleofAssets 0 3 8 0 0 3
OwnSavings 0 9 0 0 0 1
SourceofMoney GroupFive GroupSixTimeline Before
SaveActLastYear
ThisYear
BeforeSaveAct
LastYear
ThisYear
Family 0 3 0 37 25 26
LoanShark 9 0 0 11 3 0
SAVEACTLoan 0 12 9 0 42 42
SAVEACTSocialFund 0 9 9 0 18 18
FormalBankLoan 3 3 0 8 0 0
InformalSavingsGroup(highinterest)
3 9 6 22 15 18
SaleofAssets 0 3 0 0 0 0
OwnSavings 0 0 0 16 22 25
Appendix3:
LoanUsageExercise
Thisdiagrammingexerciseagainfollowsthesamerankingsystemoutlinedabove.Together
withthepilotgroup,theresearcheroutlinedalistofpossibleloanusages,forexample,food,
homeimprovements,schoolfees.Participantswerethenaskedtorankeachoptiontoindicate

37 | P a g e
howtheyspendloanstakenfromtheirSCG.Basedonthepremisethatloansaretakento
supplementexistingdisposableincome,thisexercisegivesaninsightintothedifferentneeds
andprioritiesofparticipantsandhowSCGmembershipisaffectingtheirabilitiestomeet
certainneeds.
LoanUsageRankingresults,allgrouptotals:
LoanUse Food RepaymentofPreviousDebts
Livestock NewIGA ExistingIGA
GroupOne
n/a n/a n/a n/a n/a
GroupTwo
5 7 3 0 15
GroupThree
6 13 3 8 6
GroupFour
17 16 9 4 9
GroupFive
7 11 0 2 2
GroupSix
7 11 0 2 2
LoanUse SchoolFees
HomeImprovements
Medicines/Doctor/Hospitalfees
Transport Other
GroupOne
n/a n/a n/a n/a n/a
GroupTwo
16 21 14 18 6
GroupThree
17 19 6 8 10
GroupFour
14 18 16 13 6
GroupFive
10 15 12 5 12
GroupSix
10 15 12 5 12
Appendix4:GeneralquestionnairesAsimplequestionnairewasadministeredtoallparticipantsinordertoextractmoredetailfrom
membersregardingtheeffectsofSCGmembership.Forthis,indicatorswereselectedto
measurekeyeffectsofSCGmembershipforPABHA,questionsdirectlyrelatingtothese
indicatorswerethendeveloped.Pleaseseebelowforacopyofthequestionnairesusedandsee
Appendix6foracopyoftheindicatortree.

38 | P a g e
39 | P a g e
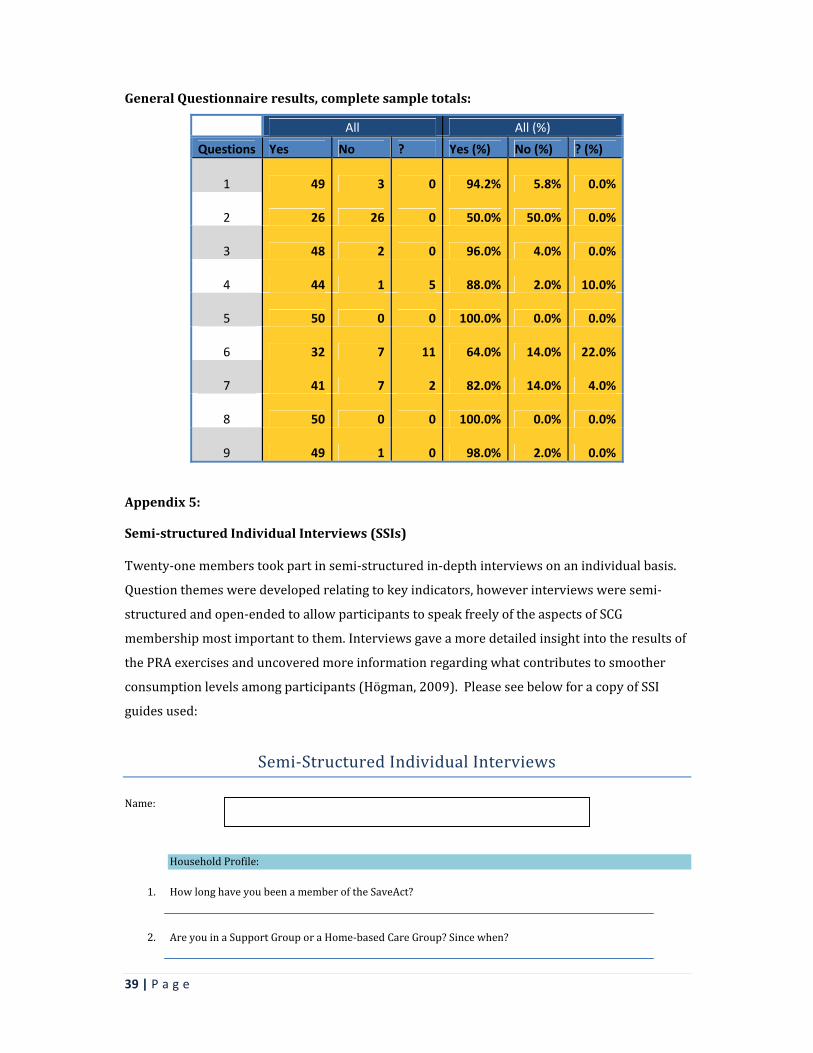
GeneralQuestionnaireresults,completesampletotals:
All All (%)
Questions Yes No ? Yes (%) No (%) ? (%)
1 49 3 0 94.2% 5.8% 0.0%
2 26 26 0 50.0% 50.0% 0.0%
3 48 2 0 96.0% 4.0% 0.0%
4 44 1 5 88.0% 2.0% 10.0%
5 50 0 0 100.0% 0.0% 0.0%
6 32 7 11 64.0% 14.0% 22.0%
7 41 7 2 82.0% 14.0% 4.0%
8 50 0 0 100.0% 0.0% 0.0%
9 49 1 0 98.0% 2.0% 0.0%
Appendix5:
Semi‐structuredIndividualInterviews(SSIs)Twenty‐onememberstookpartinsemi‐structuredin‐depthinterviewsonanindividualbasis.
Questionthemesweredevelopedrelatingtokeyindicators,howeverinterviewsweresemi‐
structuredandopen‐endedtoallowparticipantstospeakfreelyoftheaspectsofSCG
membershipmostimportanttothem.Interviewsgaveamoredetailedinsightintotheresultsof
thePRAexercisesanduncoveredmoreinformationregardingwhatcontributestosmoother
consumptionlevelsamongparticipants(Högman,2009).PleaseseebelowforacopyofSSI
guidesused:
Semi‐StructuredIndividualInterviews
Name:
HouseholdProfile:
1. HowlonghaveyoubeenamemberoftheSaveAct?
2. AreyouinaSupportGrouporaHome‐basedCareGroup?Sincewhen?

40 | P a g e
3. Whatactivitiesdoyoudointhegroup?
4. Howmanypeopleareinyourhousehold?
5. Howmanychildrendoyouhave?Whatages?Doyoucareforanychildrenthatarenotyourown?
6. IfSINGLE,butwithchildren,isthefatheralive?Doesheprovideanyfinancialsupport?
7. Isanyoneelseinthehousehold?Example,sister/mother/mother‐in‐law/grandchildren/cousins/aunts?
8. Doyoufinanciallysupportanyotherfamilymembersorfamilymember’schildren?
9. Dothechildrengotoschool?
10. DoyoufeelmoreabletopayschoolexpensessincejoiningSaveAct?
11. Whoistheheadofthehousehold?
12. Whoisthemainearnerinthehousehold?Whatdotheydotoearnmoney?HIV/AIDSProfile:
13. Areyouyourself,oranyoneinyourextendedfamilyaffectedbyHIV/AIDS?Thisinformationwillbekeptconfidential
14. Areyou/personaffectedbyHIVtakingARVmedication?((Whynot?))
15. HowdoyougettothehospitaltocollectARVs?Whopaysforthetransport?Howmuchdoesitcost?
16. CanyouthinkofanyextraexpensesthataredirectlyrelatedtoHIV/AIDS?
17. DoesHIV/AIDSstopyou/yourfamilymemberwithHIVfromworking/takingpartinsmallincome‐generatingactivities?
18. HaveyouoranyoneinyourfamilyhadanAIDS‐relatedillnessinthelast12months?
19. Haveyoulostafamilymember(includingextendedfamilymembers)toAIDSoranothersickness?
20. Haveyoureceivedanyemotionalsupportinthelast12months?Fromwho?
21. Haveyouhadanynegativeexperienceswhenpeoplefindoutthatyou/someoneinyourfamilyhave/hasHIV/AIDS?Examples?

41 | P a g e
22. Doyouspendalotofmoneyeachmonthonmedicalexpenses?LoanUsageprofile:
23. Howmanytimesdoyouborrowmoney(onaverage)fromyourgroupin1year?
24. Whendidyoulasttakealoanfromthegroup?
Did you use that loan to? Please tick
Invest in an income generating activity?
Lend to a family member / friend?
Make home improvements?
Buy furniture?
Pay school costs?
Save for an emergency?
Pay funeral costs?
Buy medication / doctor fees?
Pay for transport?
To repay another loan / debt?
OTHER? Please state
25. Haveyoueverhadanydifficultyrepayingyourlastloan?Whatwasthereasonforthis?
26. Doesbeingsick/badhealtheverpreventyoufromparticipatinginthesavingsgroup?EconomicProductivityProfile:
27. Overthelast12monthshaveyouusedaloantoinvestinanincome‐generatingactivity?Ifyes,whatdidyoudo?Ifno,whatstopsyoufromstartingasmallbusiness/whatarethemainobstacles?
28. Doyouevergetsickandhavetotakeabreakfromanincomegeneratingactivity?
29. Wasthereeveratimewhenyoudidn’thaveenoughmoneytocarryoutthesmallbusinessactivity?
30. Ifyes,howlongdidthislastfor?Whatcausedthis?
31. HasyourbusinessgotbiggersincejoiningtheSCG?Wellbeing/EmpowermentProfile
32. DoyoufeelthatbeingamemberofSaveActhelpsyou/personaffectedbyHIVtofollowadvicefromMasanganeto‘livepositivelywithHIV/AIDS’? Ifyes,inwhatway?Pleasegiveexamples?

42 | P a g e
33. Duringthepast12months,hasyourhousehold’sdietworsened,gotbetterorstayedthesame?
34. Whatisthemostdifficulttimeoftheyear?Whyisitthemostdifficult?
35. Howdoyoucopeduringthedifficulttimeoftheyear?
36. Howmanymealsdoyoueatperday?
37. Isthismorethanbeforeyoustartedparticipatinginthesavingsgroup?
38. Doyoufeelthatyourhouseholdstatushasimprovedsinceyoujoinedthesavingsgroup?Canyougiveanexample?
39. Ifmarried,howhastherelationshipwiththehusbandchangedsincejoiningtheSCG?How?
40. Doyoumakemoredecisionsinthehousenow?
41. Doyoufeelmorerespectedinthecommunity–byyourneighbours,friendsandextendedfamily?
42. DoyouhavemorehopeforthefuturesincejoiningtheSCG?
43. DoyoufeelthatyoursupportnetworkhasgrownstrongersinceyoujoinedtheSCG?Doyoufeelclosertothepeopleinthegroupforexample?
44. Whatdoyouplantodowiththeshare‐outmoneyfromthisyear?
45. DoyouplantojoinanSCGagainnextyear?Crisisprofile
46. Haveyouhadafinancialcrisisinthepast12months?Examples:funeral,sickness…
47. Didyoueatlesswell/lessregularlyasaresultofthiscrisis?
48. Didyouhaveanoutstandingloanatthetimethatyouexperiencedthelastcrisis?
49. Ifyes,wereyouabletokeepupwithrepaymentsordidyouhavetodefault?Whathappened?

43 | P a g e
50. Haveyouorsomeoneelseinyourgroupeverusedthesocialfund?Howdidithelp/whatwasitusedfor?
51. Whatarethebest3thingsaboutSaveAct?
52. Isthereanythingwecanchangetomakethingsbetter?
Appendix6:
Indicators
AnamountofmorethanR1000spentonhome‐improvementswasselectedasonekeyindicator
ofincreasedfinancialwellbeing.Thisisasignificantindicatorbecausethislevelofinvestmentis
notusuallypossibleunlessthereisasubstantialincreaseinhouseholdeconomicstability.
AccordingtoKHANA(2011),homeimprovementwillnotnormallytakepriorityforapoor
householdunlesstherearebothincreasedfundsflowingintothehouseandconfidencethat
theywillbemaintained.
PleaseseebelowforacopyoftheIndicatorTreedevelopedforthisstudy:
Didyouuse….? PleaseTickMashonisa?
SaveActLoan
SaveActSocialFund
OtherhighinterestloanfromStokvel?
BurialSociety?
Sellproperty/householdpossessions?
Usesavingsinthehome?
Leavetheareatofindemployment?
Sendchildrentostaywithrelatives?
Usemoneythatwasmeantforthesmallbusinessactivity?
ReducespendingonFood?
Reducespendingonschoolfees?
Reducespendingonotherthings?OTHER?Pleaseexplain

44 | P a g e