Embed Size (px)
Citation preview

Translation of a report and consolidated financial statements originally
issued in Spanish - See Note 30 to the consolidated financial
statements
Banco de Crédito del Perú and Subsidiaries
Consolidated financial statements as of December 31, 2012 and 2011 together with the independent auditor’s report

Translation of a report and consolidated financial statements originally
issued in Spanish - See Note 30 to the consolidated financial
statements
Banco de Crédito del Perú and Subsidiaries
Consolidated financial statements as of December 31, 2012 and 2011
together with the independent auditor’s report
Content
Independent auditors’ report
Consolidated financial statements
Consolidated balance sheets
Consolidated statements of income
Consolidated statements of changes in shareholders’ equity
Consolidated statements of cash flows
Notes to the consolidated financial statements

Translation of a report originally issued in Spanish - See Note 30
to the consolidated financial statements
Independent auditor’s report
Miembro de Ernst & Young Global Inscrita en la partida 11396556 del Registro
de Personas Jurídicas de Lima y Callao
To the shareholders of Banco de Crédito del Perú
We have audited the accompanying consolidated financial statements of Banco de Crédito del Perú
(a subsidiary of Credicorp Ltd., a holding incorporated in Bermuda) and Subsidiaries, which
comprise the consolidated balance sheets as of December 31, 2012 and 2011, and the consolidated
statements of income, changes in shareholders’ equity and cash flows for each of the three years
ended December 31, 2012, 2011 and 2010, and the summary of significant accounting policies and
other explanatory notes.
Management’s responsibility for the financial statements
Management is responsible for the preparation and fair presentation of these consolidated financial
statements in accordance with accounting principles prescribed by the Superintendencia de Banca,
Seguros y AFP (SBS) for Peruvian financial entities, and for such internal control as Management
determines is necessary to enable the preparation of consolidated financial statements that are free
from material misstatement, whether due to fraud or error.
Auditor’s responsibility
Our responsibility is to express an opinion on these consolidated financial statements based on our
audit. We conducted our audit in accordance with generally accepted auditing standards in Peru.
Those standards require that we comply with ethical requirements and plan and perform the audits
to obtain reasonable assurance about whether the consolidated financial statements are free from
material misstatement.
An audit involves performing procedures to obtain audit evidence about the amounts and
disclosures in the consolidated financial statements. The procedures selected depend on the
auditor’s judgment, including the assessment of the risks of material misstatement of the
consolidated financial statements, whether due to fraud or error. In making those risk assessments,
the auditor considers internal control relevant to the entity’s preparation and fair presentation of
the consolidated financial statements in order to design audit procedures that are appropriate in the
circumstances, but not for the purpose of expressing an opinion on the effectiveness of the entity’s
internal control. An audit also includes evaluating the appropriateness of accounting policies used
and the reasonableness of accounting estimates made by Management, as well as evaluating the
overall presentation of the consolidated financial statements.

Translation of a report originally issued in Spanish - See Note 30
to the consolidated financial statements
Independent auditor’s report (continued)
We believe that the audit evidence we have obtained is sufficient and appropriate to provide a basis
for our audit opinion.
Opinion
In our opinion, the accompanying consolidated financial statements present fairly, in all material
respects, the consolidated financial position of Banco de Crédito del Perú and Subsidiaries as of
December 31, 2012 and 2011, and the consolidated results of its operations and its consolidated
cash flows for each of the three years ended December 31, 2012, 2011 and 2010; in accordance
with accounting principles prescribed by the Superintendencia de Banca, Seguros y AFP (SBS) for
Peruvian financial entities.
Lima, Peru,
February 26, 2013
Countersigned by:
Cristian Emmerich
C.P.C.C. Register No.19-289

Translation of consolidated financial statements originally issued in
Spanish - See Note 30
The accompanying notes are an integral part of these consolidated balance sheets.
Banco de Crédito del Perú and Subsidiaries
Consolidated balance sheets As of December 31, 2012 and 2011
Note 2012 2011 S/.(000) S/.(000)
Assets
Cash and due from banks: 5
Cash and clearing 2,427,381 2,491,154
Deposits in Peruvian Central Bank 16,106,647 10,203,051
Deposits in local and foreign banks 1,102,234 1,822,500
Restricted funds 179,400 246,360
Accrued interest on cash 10,005 5,514 ____________ ____________
19,825,667 14,768,579
Interbank funds 44,486 15,605
Investments:
Investments at fair value through profit or loss and
available-for-sale investments, net 6 (a) 11,536,831 9,568,570
Investments held-to-maturity 6 (l) 662,142 - ____________ ____________
12,198,973 9,568,570
Loans, net 7 51,104,503 44,234,085
Investments in associates 39,270 42,517
Property, furniture and equipment, net 8 1,236,604 1,136,660
Other assets, net:
Financial instruments at fair value 9 477,322 330,978
Other, net 9 2,271,757 1,939,522
Assets classified as held for sale 10 3,198,607 - ____________ ____________
Total assets 90,397,199 72,036,516 ____________ ____________
Off-balance sheet accounts - 19
Contingent operations 42,944,137 34,447,219
Other 270,110,870 185,502,484 _____________ _____________
Total 313,055,007 219,949,703 _____________ _____________
Note 2012 2011 S/.(000) S/.(000)
Liabilities and Equity
Deposits and obligations 11 58,178,314 47,299,455
Interbank funds 299,974 373,894
Payables from repurchase agreements 6(m) 1,667,637 674,000
Due to banks, correspondents and other entities 12 9,179,333 7,597,258
Bonds and subordinated notes issued 13 9,325,433 8,416,312
Other liabilities, net 9 1,581,066 1,367,574
Liabilities directly associated with the assets classified as
held for sale 10 2,899,389 - _____________ _____________
Total liabilities 83,131,146 65,728,493 _____________ _____________
Equity 15
Capital and reserves attributable to Banco de Crédito del
Perú equity holders:
Capital stock 3,102,897 2,557,738
Legal reserve 1,086,014 895,208
Special reserve 1,108,814 1,108,814
Unrealized results 389,751 309,574
Translation results (43,893) (14,675)
Retained earnings 1,497,701 1,438,994 _____________ _____________
7,141,284 6,295,653
Non-controlling interests 14,066 12,370
Non-controlling Interests from discontinued operations 110,703 - _____________ _____________
124,769 12,370 _____________ _____________
Total equity 7,266,053 6,308,023 _____________ _____________
Total liabilities and equity 90,397,199 72,036,516 _____________ _____________
Off-balance sheet accounts - 19
Contigent operations 42,944,137 34,447,219
Other 270,110,870 185,502,484 _____________ _____________
Total 313,055,007 219,949,703 _____________ _____________

Translation of consolidated financial statements originally issued in
Spanish - See Note 30
Banco de Crédito del Perú and Subsidiaries
Consolidated statements of income For the years ended December 31, 2012, 2011 and 2010
Note 2012 2011 2010
S/.(000) S/.(000) S/.(000)
Financial income and expenses
Financial income 20 5,620,189 4,687,284 3,840,975
Financial expenses 20 (1,699,332) (1,429,260) (1,192,974) __________ ___________ ___________
Gross financial margin 3,920,857 3,258,024 2,648,001
Allowance from loan losses 7(g) (1,111,244) (708,484) (594,831) __________ ___________ ___________
2,809,613 2,549,540 2,053,170
Gain (loss) for exchange difference 14,163 (36,853) 24,404 __________ ___________ ___________
Net financial margin 2,823,776 2,512,687 2,077,574 __________ __________ __________
Non - financial income
Banking services commissions, net 21 1,623,399 1,446,191 1,298,332
Net gain on securities 22 104,636 61,682 176,780
Net gain on foreign exchange transactions 379,615 382,220 243,978
Other non - financial income 23 218,881 177,200 319,261 ___________ ___________ ___________
2,326,531 2,067,293 2,038,351 __________ __________ __________
Operating expenses
Salaries and employees’ benefits 24 (1,626,763) (1,357,854) (1,369,059)
General and administrative (1,035,326) (831,257) (709,029)
Depreciation and amortization 8(a) and 9(d) (274,083) (249,242) (219,026)
Provision for seized assets (3,143) (4,281) (4,136)
Taxes and contributions (98,566) (88,677) (79,889)
Other operating expenses 23 (65,070) (98,581) (75,873) __________ __________ __________
(3,102,951) (2,629,892) (2,457,012) __________ __________ __________

Translation of the consolidated financial statements originally issued in Spanish -
See Note 30
The accompanying notes are an integral part of these consolidated statements.
Consolidated statements of income (continued)
Note 2012 2011 2010
S/.(000) S/.(000) S/.(000)
Income before income tax from
continuing operations 2,047,356 1,950,088 1,658,913
Income tax 14(b) (551,145) (508,674) (447,668) __________ __________ __________
Net income from continuing operations 1,496,211 1,441,414 1,211,245
Net income from discontinued operations 10 9,701 - - __________ __________ __________
Net Income 1,505,912 1,441,414 1,211,245 __________ __________ __________
Attributable to:
Equity holders of Banco de Crédito del
Perú 1,497,701 1,438,994 1,209,341
Non-controlling Interests 8,211 2,420 1,904 __________ __________ __________
1,505,912 1,441,414 1,211,245 __________ __________ __________
Basic and diluted earnings per share (in
Nuevos Soles) from continuing
operations
0.4689 0.4514 0.3794
Basic and diluted earnings per share (in
Nuevos Soles) from discontinued
operations 0.0031 - - __________ __________ __________
Weighted average number of ordinary
shares for basic earnings 25 3,173,692 3,187,897 3,187,897 __________ __________ __________

Translation of consolidated financial statements originally issued in Spanish - See Note 30
The accompanying notes are an integral part of these consolidated statements.
Banco de Crédito del Perú and Subsidiaries
Consolidated statements of changes in shareholders’ equity For the years ended December 31, 2012, 2011 and 2010
Number of
outstanding
shares Capital stock
Legal
reserve
Special
reserve
Unrealized
gains (losses)
Translation
results
Retained
earnings Total
Non-
controlling
interests Total (in thousands) S/.(000) S/.(000) S/.(000) S/.(000) S/.(000) S/.(000) S/.(000) S/.(000) S/.(000)
Balances as January 1, 2010 2,228,288 2,228,288 546,519 782,538 347,430 924,501 4,829,276 12,631 4,841,907
Capitalization of income, Note 15(a) 329,450 329,450 - - - - (329,450) - - -
Transfer to legal reserve, Note 15(c) - - 348,689 (348,689) - - - - - -
Transfer to special reserve, Note 15(c) - - - 98 - - (98) - - -
Cash dividends, Note 15(e) - - - - - - (594,953) (594,953) (3,053) (598,006)
Net unrealized gain from available-for-sale investments - - - - 254,256 - - 254,256 (391) 253,865
Net transfer of realized gain from available-for-sale investments to consolidated
income statements - - - - (144,229) - - (144,229) - (144,229)
Transfer of net realized loss from cash flow hedges to the consolidated income
statements - - - - (14,641) - - (14,641) - (14,641)
Net income - - - - - - 1,209,341 1,209,341 1,904 1,211,245 __________ __________ __________ __________ __________ __________ __________ __________ __________ __________
Balances as of December 31, 2010 2,557,738 2,557,738 895,208 433,947 442,816 - 1,209,341 5,539,050 11,091 5,550,141
Transfer to special reserve, Note 15(c) - - - 674,867 - - (674,867) - - -
Cash dividends, Note 15(e) - - - - - - (514,105) (514,105) (717) (514,822)
Adjustment of deferred workers’ profit sharing, Note 3(a)(ii) - - - - - - (20,369) (20,369) - (20,369)
Net unrealized loss from available-for-sale investments, Note 15(d) - - - - (76,857) - - (76,857) (17) (76,874)
Net transfer of realized gain from available-for-sale investments to consolidated
income statements, Note 15(d) - - - - (39,206)
- - (39,206) - (39,206)
Transfer of net realized loss from cash flow hedges to the consolidated income
statements, Note 15(d) - - - - (17,179)
- - (17,179) - (17,179)
Exchange differences on translation of foreign operations - - - - - (14,675) - (14,675) (407) (15,082)
Net income - - - - - - 1,438,994 1,438,994 2,420 1,441,414 __________ __________ __________ __________ __________ __________ __________ __________ __________ __________
Balances as of December 31, 2011 2,557,738 2,557,738 895,208 1,108,814 309,574 (14,675) 1,438,994 6,295,653 12,370 6,308,023
Capitalization of income, Note 15(a) 630,159 630,159 - - - - (630,159) - - -
Transfer to legal reserve, Note 15(b) - - 220,556 - - - (220,556) - - -
Cash dividends, Note 15(e) - - - - - - (588,279) (588,279) (9,228) (597,507)
Acquisition of subsidiary – Correval, Note 2(a) - - - - - - - - 118,292 118,292
Acquisition of subsidiary – IM Trust S.A., Note 2(a) - - - - - - - - 155,077 155,077
Transfer of subsidiary – IM Trust S.A., Note 2(a) - - - - - - - - (155,077) (155,077)
Split of a equity block, Note 2(b) (85,000) (85,000) (29,750) - (23,257) - - (138,007) (17) (138,024)
Net unrealized gain from available-for-sale investments, Note 15(d) - - - - 170,504 - - 170,504 (4,217) 166,287
Net transfer of realized gain from available-for-sale investments to consolidated
income statements, Note 15(d) - - - - (60,982) - - (60,982) - (60,982)
Transfer of net realized loss from cash flow hedges to the consolidated income
statements, Note 15(d) - - - - (6,088) - - (6,088) - (6,088)
Exchange differences on translation of foreign operations - - - - - (29,218) - (29,218) (642) (29,860)
Net income - - - - - - 1,497,701 1,497,701 8,211 1,505,912 __________ __________ __________ __________ __________ __________ __________ __________ __________ __________
Balances as of December 31, 2012 3,102,897 3,102,897 1,086,014 1,108,814 389,751 (43,893) 1,497,701 7,141,284 124,769 7,266,053 __________ __________ __________ __________ __________ __________ __________ __________ __________ __________

Translation of consolidated financial statements originally issued in
Spanish - See Note 30
The accompanying notes are an integral part of these consolidated statements.
Banco de Crédito del Perú and Subsidiaries
Consolidated cash flows statements For the years ended December 31, 2012, 2011 and 2010
2012 2011 2010 S/.(000) S/.(000) S/.(000)
Cash flows from operating activities
Net income 1,505,912 1,441,414 1,211,245
Adjustments to reconcile net income to net cash
provided by operating activities:
Allowance for loan losses 1,111,244 708,484 594,831
Depreciation and amortization 274,083 249,242 219,026
Deferred income tax (71,804) (42,017) 3,971
Provision for seized assets 3,143 4,281 4,136
(Gain) loss from valuation of indexed certificates (30,236) 50,318 (156,625)
Loss from share-based compensation plan 48,191 7,938 192,260
Net gain from sale of securities (104,636) (61,682) (176,780)
Net gain from sale of seized assets (8,243) (12,950) (16,396)
Changes in asset and liability accounts:
Other assets (404,431) 23,555 209,585
Other liabilities 27,320 (230,261) (20,559) __________ __________ __________
Net cash provided by operating activities 2,350,543 2,138,322 2,064,694 __________ __________ __________
Cash flows from investing activities
Sales of property, furniture and equipment 35,063 1,365 1,074
Sales of seized assets 17,000 20,926 24,973
Purchase of intangible assets (117,654) (129,175) (182,169)
Purchase of property, furniture and equipment (292,733) (285,580) (236,148) ___________ ___________ ___________
Net cash used in investing activities (358,324) (392,464) (392,270) ___________ ___________ ___________

Translation of consolidated financial statements originally issued in Spanish - See Note 30
The accompanying notes are an integral part of these consolidated statements.
Consolidated cash flows statements (continued)
2012 2011 2010 S/.(000) S/.(000) S/.(000)
Cash flows from financing activities
Net increase in deposits and obligations 10,878,859 129,360 5,538,335
Net increase (decrease) in payables from
repurchase agreements 993,637 (28,250) 601,100
Net (increase) decrease in investments at fair value
through profit or loss and available-for-sale
investment (2,595,229) (5,183,748) 4,698,361
Net decrease (increase) in investments in associates
and received dividends 3,247 7,474 (2,914)
Net increase (decrease) in due to banks,
correspondents and other entities, and interbank
funds 1,554,811 (2,258,518) 6,535,541
Net increase in bonds and subordinated notes issued 909,121 2,912,814 1,931,656
Net increase in loan portfolio (7,991,152) (5,865,383) (7,267,255)
Cash dividends (588,279) (514,105) (594,953) ___________ ___________ ___________
Net cash provided (used in) by financing activities 3,165,015 (10,800,356) 11,439,871 ___________ ___________ ___________
Net increase (decrease) in cash and cash
equivalents 5,157,234 (9,054,498) 13,112,295
Cash and cash equivalents split, Note 2(b) (33,186) - -
Cash and cash equivalents at the beginning of year 14,552,219 23,576,717 10,464,422 ___________ ___________ ___________
Cash and cash equivalents at the end of year 19,646,267 14,522,219 23,576,717 ___________ ___________ ___________
Supplementary cash flow information
Cash paid during the year for:
Interests 1,588,049 1,376,087 1,115,817
Income tax 1,064,727 540,529 469,012
Non-cash flows transactions
Related parties liabilities - - 4,130,812

Translation of consolidated financial statements originally issued in
Spanish - See Note 30
Banco de Crédito del Perú and Subsidiaries
Notes to the consolidated financial statements As of December 31, 2012 and 2011
1. Operations
Banco de Crédito del Perú (hereinafter “the Bank” or “BCP”) was incorporated in 1889 and is a
subsidiary of Credicorp Ltd. (a holding incorporated in Bermuda in 1995), which as of December 31,
2012 owns directly and indirectly 97.66 percent of its capital stock (97.65 percent as of December 31,
2011).
The Bank’s registered office is at Calle Centenario N°156, La Molina, Lima, Peru. As of December 31,
2012, the Bank and its Subsidiaries had 365 branches and agencies in Peru and 2 branches abroad (343
branches and agencies in Peru and 2 branches abroad as of December 31, 2011).
The Bank, whose operations are governed by the “Ley General del Sistema Financiero y de Seguros y
Orgánica de la Superintendencia de Banca, Seguros y AFP” (General Law of the Financial and Insurance
Systems and Organic of the SBS – Law 26702), hereinafter the “Banking Law”, is authorized by the
Superintendencia de Banca, Seguros y AFP - SBS (Peruvian Banking and Insurance Authority,
hereinafter “SBS” for is Spanish acronym) to operate as a universal bank, in accordance with prevailing
Peruvian legislation.
The consolidated financial statements as of December 31, 2011 and for the year then ended were
approved by the General Shareholders Meeting dated March 30, 2012 without modifications. The
consolidated financial statements as of December 31, 2012 and for the year then ended were approved
by the Audit Committee and Management on February 26, 2013, and will be submitted for their final
approval by the Board of Directors and the General Shareholders’ Meeting within the period established
by law. In Management’s opinion, the consolidated financial statements will be approved by the Board
of Directors and the General Shareholders’ Meeting without modifications.
2. Acquisition and sale of subsidiaries and split of an equity block
During the years 2011 and 2012, Credicorp Group started a strategy aimed to the creation and
operation of an independent entity to the Bank engaged in financial advisory activities, asset
management and investment banking at a global scale and focused on the Mercado Integrado
Latinoamericano – Latin American Integrated Market (MILA, for its Spanish acronym), a market that
comprises the main stock exchanges of Peru, Chile and Colombia.

Translation of consolidated financial statements originally issued in
Spanish - See Note 30
Notes to the consolidated financial statements (continued)
2
For this purpose, during 2012: (a) it acquired majority interest in Correval S.A. Sociedad Comisionista
de Bolsa (hereinafter “Correval”) and Inversiones IM Trust S.A. (hereinafter “IM Trust”), which then
were transferred to a new holding entity, subsidiary of Credicorp; and (b) it split of an equity block
comprised by assets belonging to the Bank used to provide the aforementioned services. Both
operations are explained in detail below:
(a) Acquisition and sale of Correval and IM Trust S.A.
On April 27, 2012, the Bank acquired 51 percent of Correval, an investment banking entity
established in Bogota, Colombia, for approximately US$72.3 million paid in cash consideration
(equivalent to S/.190.9 million). In addition, on July 31, 2012, the Bank acquired 60.6 percent of
IM Trust, an investment banking entity established in Santiago, Chile, for approximately
US$131.5 million (equivalent to approximately S/.351.2 million), of which US$ 110.9 million
were paid in cash consideration at the acquisition date and US$20.6 million will be paid in cash
consideration on August 2013.
Subsequently, the Bank’s Director’s Meeting held on September 26, 2012, approved the
transfer, through the sale of the shares held in Correval and IM Trust, to Credicorp Investments
Ltd., a subsidiary of Credicorp incorporated in 2012 and domiciled in Bermuda.
The transfer of IM Trust took place on November 30, 2012, was made for the same amount paid
at its acquisition date and comprised all assets and liabilities acquired, including intangible assets
not recorded in the financial statements of IM Trust as of the acquisition date and the resulting
goodwill. Therefore, the accompanying consolidated financial statements as of December 31,
2012, do not contain balances related to IM Trust.
However, because the authorizations from the Colombian Authorities have not been granted as
of December 31, 2012, the transfer of Correval was not completed. Consequently, in order to
comply with IFRS 5 "Non-current assets held for sale and discontinued operations", Correval
assets and liabilities are presented as "Assets classified as held for sale" and "Liabilities directly
associated with such assets classified as held for sale", respectively, in the consolidated balance
sheets and the results of operations are presented as "Discontinued operations" in the
consolidated statements of income, see Note 10(a).
Management considers that the transfer, which will be done for the same amount paid at the
acquisition date, will culminate in the first half of 2013, after receiving the required
authorizations.
On the other hand, Correval and IM Trust purchase agreements include put options in favor of
the non-controlling interests and call options in favor of the Bank, over all non-controlling
interests.

Translation of consolidated financial statements originally issued in
Spanish - See Note 30
Notes to the consolidated financial statements (continued)
3
Said options are part of the rights and obligations transferred in the case of IM Trust and, to be
transferred, in the case of Correval, to Credicorp Investments Ltd. The characteristics of the put
options, over the remaining non-controlling interests in Correval are presented in Note 10(b).
(b) Split of an equity block
The Bank’s General Shareholders Meeting held on August 21, 2012, approved the split of an
equity block in favor of BCP Capital S.A.A., an entity incorporated on April 23, 2012 and an
indirect Credicorp subsidiary.
The split was approved by the SBS through Resolution No. 7782-2012 dated October 12, 2012
and took effect on November 1, 2012. As a consequence, the Bank reduced its "capital stock" by
S/.85.0 million, its "legal reserve" by S/.29.8 million and its "unrealized gains" by S/.23.3
million.
The assets transferred included the following Bank’s subsidiaries: Credibolsa – Sociedad Agente
de Bolsa S.A., Creditítulos Sociedad Titulizadora S.A. and Credifondo S.A. – Sociedad
Administradora de Fondos- SAF, as well as the Bank’s assets and liabilities related to investment
banking. The detail of all assets and liabilities transferred is as follows:
2012 S/.(000)
Assets -
Cash 33,186
Accounts receivable 13,322
Other accounts receivable 15,000
Investments at fair value though profit or loss 96,252
Investments available-for-sale 37,703
Other assets 3,387 _________
Total assets 198,850 _________
Liabilities -
Loans payable 46,656
Accounts payable 6,375
Other liabilities 7,795 _________
Total liabilities 60,826 _________
Equity 138,024 ________
Revenue and net income generated by the split subsidiaries during the period between January
1, 2012 and the date of split, was approximately S/.86.4 million and S/.40.9 million,
respectively.

Translation of consolidated financial statements originally issued in
Spanish - See Note 30
Notes to the consolidated financial statements (continued)
4
As of December 31, 2011, total assets, liabilities and equity of the split subsidiaries, after
elimination adjustments for consolidation purposes were S/.152.1 million, S/.6.4 million and
S/.145.7 million respectively. Also, its revenue and net income for the year ended December 31,
2011, amounted to S/.126.7 million and S/.68.1 million, respectively.
Entities that are included in the consolidated financial statements as of December 31, 2012,
considering the transactions described in paragraphs (a) and (b) and as of December 31, 2011,
are presented in Note 3 (b).
3. Significant accounting policies
In the preparation and presentation of the accompanying consolidated financial statements, the Bank
and its Subsidiaries’ Management has complied with the regulations established by the SBS in force in
Peru as of December 31, 2012 and 2011. Significant accounting principles and practices used in the
preparation of the Bank and its Subsidiaries’ consolidated financial statements are the following:
(a) Basis for presentation, use of estimates, accounting changes and discontinued operations -
(i) Basis for presentation and use of estimates -
The accompanying consolidated financial statements have been prepared from the Bank
and its Subsidiaries’ accounting records, which are maintained in nominal Peruvian
currency (Nuevos Soles), in accordance with SBS regulations and, supplementary, with
International Financial Reporting Standards - IFRS approved by the Consejo Normativo de
Contabilidad (Peruvian Accounting Council, hereinafter “CNC” for its Spanish acronym) in
force in Peru as of December 31, 2012 and 2011, see paragraph (y.i).
These accounting principles are consistent with those used in 2011 and 2010, except as
explained in paragraph (ii) below.
The preparation of consolidated financial statements requires Management to make
estimates that affect the reported amounts of assets, liabilities, income and expenses and
the disclosure of material events in the notes to the consolidated financial statements.
Actual results could differ from those estimates. Estimates are continually evaluated and
are based on historical experience and other factors. The most significant estimates used
in relation with the accompanying consolidated financial statements are the computation
of the allowance for loan losses, the valuation of investments, the estimated useful live
and recoverable amount of property, furniture and equipment and intangible assets, the
provision for seized assets, the valuation of brand name, goodwill and client relationships,
the valuation of the derivative financial instruments and the share based payments.
The accounting criteria used for each of these items is described in this note and the
consolidated financial statements of Subsidiaries and branch offices have been
standardized to the accounting standards of the SBS.

Translation of consolidated financial statements originally issued in
Spanish - See Note 30
Notes to the consolidated financial statements (continued)
5
(ii) Accounting changes –
Applicable since 2012 –
(ii.a) Through letter SBS No. 38179-2011 dated August 23, 2011, the SBS indicated
that the program that grants Credicorp shares to employees should be recorded
under IFRS 2 "Share-based payments", starting January 1, 2012, but requiring a
prospective treatment. See more detail in paragraph (p).
Applicable since 2011 –
(ii.b) On November 2010, the International Financial Reporting Interpretations
Committee (IFRIC) agreed that workers’ profit sharing must be recorded following
IAS19 “Employees’ benefits” and not IAS 12 “Income tax”. Consequently, a
deferred asset or liability should not be calculated due to temporary differences.
On January 21, 2011, the SBS issued Multiple Official Letter N°4049-2011;
adopting the Committee’s interpretation starting January 2011. The changes
required by the SBS and the accounting treatment followed by the Bank and its
Subsidiaries are the following:
- Workers’ profit sharing for services provided must be recorded as
employees’ expenses in the caption “Salaries and employees’ benefits” of
the consolidated income statements.
- The related assets and liabilities for deferred workers’ profit sharing were
eliminated and; assets and liabilities for deferred income tax considering an
income tax rate of 30 percent were recalculated. The net effect of the
elimination and recalculation amounted to S/.20.4 million which are
presented in the caption “Retained earnings” of the consolidated statements
of changes in shareholders’ equity.
(iii) Assets classified as held for sale and liabilities directly associated with those assets -
Assets classified as held for sale are assets whose carrying amount will be recovered
principally through a sale transaction rather than continuing use. To qualify as assets
available for sale, the sale must be highly probable.
Those assets and liabilities are presented in the consolidated balance sheet as "Assets
classified as held for sale" and "Liabilities directly associated with those assets" at their
book values, which, in this case, corresponds to the value at which they are going to be
transferred. Furthermore, in the consolidated statement of income, gains or losses are
presented as "Discontinued operations". Similarly, cash flows from operating, investing
and financing activities generated by the discontinued operation have been excluded from
the consolidated statements of cash flows. See Notes 2(a) and 10.

Translation of consolidated financial statements originally issued in
Spanish - See Note 30
Notes to the consolidated financial statements (continued)
6
(b) Consolidation -
Subsidiaries are all entities over which the Bank has control, meaning the power to govern their
financial and operating policies. This is generally evidenced by a shareholding of more than one
half of the voting rights.
Subsidiaries are consolidated from the date on which effective control is transferred to the Bank
and are no longer consolidated from the date that control ceases.
Business acquisitions in which control is acquired are recorded in accordance with IFRS 3. This
involves recognizing the identifiable assets (including intangible assets not previously
recognized) and liabilities (including contingent liabilities and excluding future restructuration) of
the acquired entity at fair value.
Any excess of acquisition cost over the fair value of the identifiable net assets, including tangible
and intangible assets and the recognized amount for the non-controlling interest; is recorded as
goodwill, see paragraph (m). If the acquisition cost is less than the fair value of the net
identifiable assets, the difference is recorded directly in the consolidated income statement in the
acquisition year.
All transactions, balances, gains and losses between the Bank and its Subsidiaries have been
eliminated in the consolidation process. The equity attributable to the non-controlling interests is
presented separately from the consolidated balance sheets. The income attributable to the non-
controlling interests is presented separately in the consolidated statements of income.
The accounting records of foreign subsidiaries are kept in the original currency of each country.
For consolidation purposes its balances were translated to Peruvian Nuevos Soles as follows:
- Assets and liabilities are translated at the exchange rate on the free market as of the
consolidated balance sheet date.
- Revenues and expenses are translated at the monthly average exchange rate.
All differences arising from the translation were included in the caption "Translation result" of
the consolidated statements of changes in shareholder´s equity.

Translation of consolidated financial statements originally issued in
Spanish - See Note 30
Notes to the consolidated financial statements (continued)
7
The consolidated financial statements include the financial statements of the Bank and its subsidiaries in which it holds more than 50 percent, directly and indirectly. Below is the main data of the Bank and its Subsidiaries engaged in the process
of consolidation at 31 December 2012 and 2011, before eliminations made in such process:
Entity Activity and Country Percentage of participation Assets Liabilities Equity Net Income _______________________ _______________________ _________________________ __________________________ ____________________________
2012 2011 2012 2011 2012 2011 2012 2011 2012 2011
% % S/.(000) S/.(000) S/.(000) S/.(000) S/.(000) S/.(000) S/.(000) S/.(000)
Banco de Crédito del Perú, Note 2(b) Banking, Peru - - 81,979,379 68,082,253 74,838,095 61,786,600 7,141,284 6,295,653 1,497,701 1,438,994
Banco de Crédito de Bolivia and Subsidiaries Banking, Bolivia 95.92 95.92 3,588,931 3,214,454 3,256,313 2,922,255 332,618 292,199 53,835 55,946
Empresa Financiera Edyficar S.A. Microcredits, Peru 99.79 99.79 2,715,002 1,561,539 2,454,606 1,351,727 260,396 209,812 87,715 63,438
Inversiones BCP S.A. Holding, Chile 99.99 99.99 672,597 559,072 106,411 85,562 566,186 473,510 15,676 14,012
Solución Empresa Administradora Hipotecaria S.A. Mortgage loans, Peru 100.00 100.00 252,100 198,729 213,537 162,870 38,563 35,859 2,709 5,258
Inmobiliaria BCP S.A. Real estate, Peru 100.00 100.00 3,868 3,382 294 182 3,574 3,200 378 497
Correval S.A. – Sociedad Comisionista de Bolsa,
Notes 2(a) and 10 Investment banking, Colombia
51 - 3,198,607 - 2,899,389 - 299,218 - 3,832 -
Credifondo S.A. - Sociedad Administradora de
Fondos, Note 2(b) Mutual funds managment, Peru
- 100.00 - 100,126 - 4,866 - 95,260 34,610 49,047
Credibolsa - Sociedad Agente de Bolsa S.A. Note 2(b) Brokerage, Peru - 100.00 - 61,296 - 4,953 - 56,343 6,232 17,834
Creditítulos Sociedad Titulizadora S.A. Note 2(b) Assets securitization management, Peru - 100.00 - 14,447 - 2,376 - 12,071 32 1,193

Translation of consolidated financial statements originally issued in
Spanish - See Note 30
Notes to the consolidated financial statements (continued)
8
(c) Financial instruments –
Financial instruments are classified as assets, liabilities or equity according to the substance of
the contractual agreement that originated them. Interests, dividends, gains and losses
generated by financial instruments classified as assets or liabilities are recorded as income or
expense. Financial instruments are offset when the Bank and its Subsidiaries have a legal
enforceable right to offset them and Management has the intention to settle them on a net basis
or to realize the asset and settle the liability simultaneously.
Financial assets and liabilities presented in the consolidated balance sheet correspond to cash
and due from banks, interbank funds, investments (at fair value through profit or loss, available-
for-sale, held-to-maturity and in associates), derivative financial instruments at fair value, loans,
accounts receivable (presented in the caption “Other assets, net”) and liabilities in general,
except for the liability for deferred income tax. In addition, all indirect loans are considered to be
financial instruments. The specific accounting policies on recognition and measurement of these
items are disclosed in the accounting policies described in this note.
(d) Recognition of revenue and expenses -
Financial revenue and expense for interests are recognized on an accrual basis over the related
contract period and considering the interest rates agreed with clients, except for interest
generated from past due, refinanced, restructured or under legal collection loans, and loans
classified in the categories of doubtful and loss, which interest is recognized as revenue on a cash
basis. When Management determines that the debtor’s financial condition has improved and the
loan is reclassified as current and/or in the categories of normal, with potential problems or
substandard, interest is again recorded on an accrual basis.
Revenue includes interest on fixed income investments classified as held for trading, available for
sale and held-to-maturity, including recognition of any discount or premium.
Dividends are recognized as income when they are declared.
Commissions on financial services are recognized as income when collected, except for
commissions related to the renewal of credit cards, which are recorded on an accrual basis
during the term or renewal of the contract.
Other revenues and expenses are recorded on an accrual basis.
Translation of consolidated financial statements originally issued in
Spanish - See Note 30
Notes to the consolidated financial statements (continued)
9
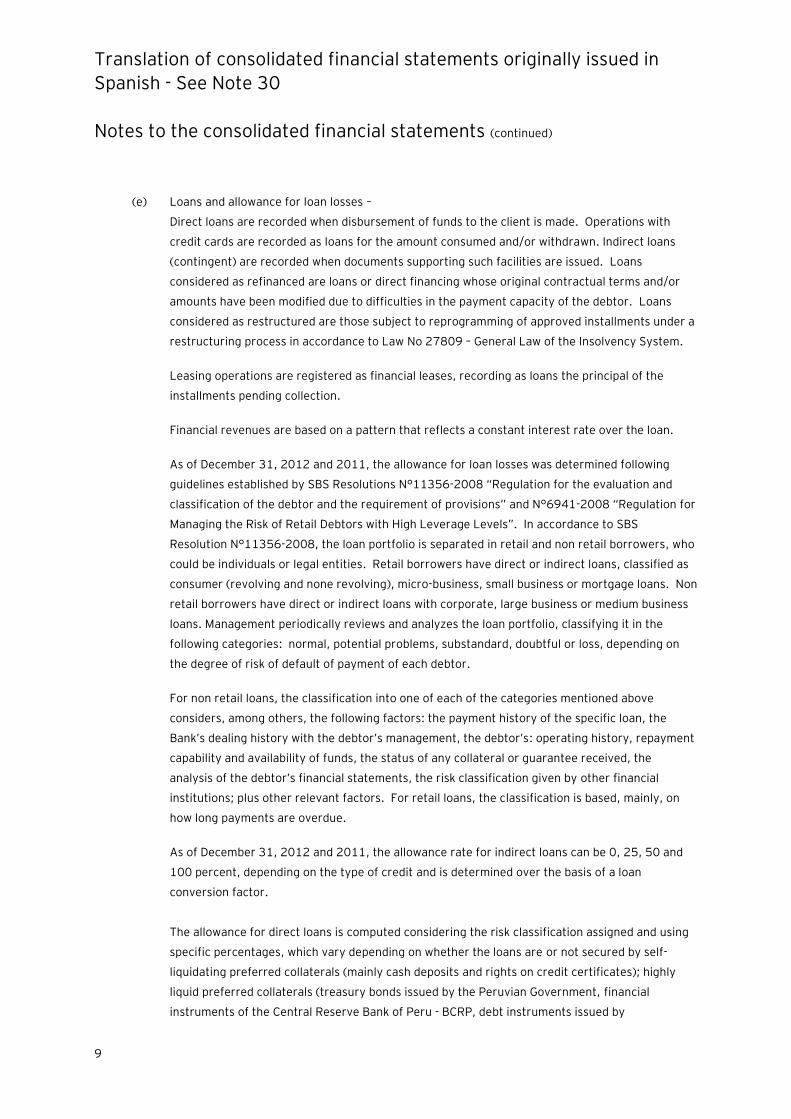
(e) Loans and allowance for loan losses –
Direct loans are recorded when disbursement of funds to the client is made. Operations with
credit cards are recorded as loans for the amount consumed and/or withdrawn. Indirect loans
(contingent) are recorded when documents supporting such facilities are issued. Loans
considered as refinanced are loans or direct financing whose original contractual terms and/or
amounts have been modified due to difficulties in the payment capacity of the debtor. Loans
considered as restructured are those subject to reprogramming of approved installments under a
restructuring process in accordance to Law No 27809 – General Law of the Insolvency System.
Leasing operations are registered as financial leases, recording as loans the principal of the
installments pending collection.
Financial revenues are based on a pattern that reflects a constant interest rate over the loan.
As of December 31, 2012 and 2011, the allowance for loan losses was determined following
guidelines established by SBS Resolutions N°11356-2008 “Regulation for the evaluation and
classification of the debtor and the requirement of provisions” and N°6941-2008 “Regulation for
Managing the Risk of Retail Debtors with High Leverage Levels”. In accordance to SBS
Resolution N°11356-2008, the loan portfolio is separated in retail and non retail borrowers, who
could be individuals or legal entities. Retail borrowers have direct or indirect loans, classified as
consumer (revolving and none revolving), micro-business, small business or mortgage loans. Non
retail borrowers have direct or indirect loans with corporate, large business or medium business
loans. Management periodically reviews and analyzes the loan portfolio, classifying it in the
following categories: normal, potential problems, substandard, doubtful or loss, depending on
the degree of risk of default of payment of each debtor.
For non retail loans, the classification into one of each of the categories mentioned above
considers, among others, the following factors: the payment history of the specific loan, the
Bank’s dealing history with the debtor’s management, the debtor’s: operating history, repayment
capability and availability of funds, the status of any collateral or guarantee received, the
analysis of the debtor’s financial statements, the risk classification given by other financial
institutions; plus other relevant factors. For retail loans, the classification is based, mainly, on
how long payments are overdue.
As of December 31, 2012 and 2011, the allowance rate for indirect loans can be 0, 25, 50 and
100 percent, depending on the type of credit and is determined over the basis of a loan
conversion factor.
The allowance for direct loans is computed considering the risk classification assigned and using
specific percentages, which vary depending on whether the loans are or not secured by self-
liquidating preferred collaterals (mainly cash deposits and rights on credit certificates); highly
liquid preferred collaterals (treasury bonds issued by the Peruvian Government, financial
instruments of the Central Reserve Bank of Peru - BCRP, debt instruments issued by
Translation of consolidated financial statements originally issued in
Spanish - See Note 30
Notes to the consolidated financial statements (continued)
10
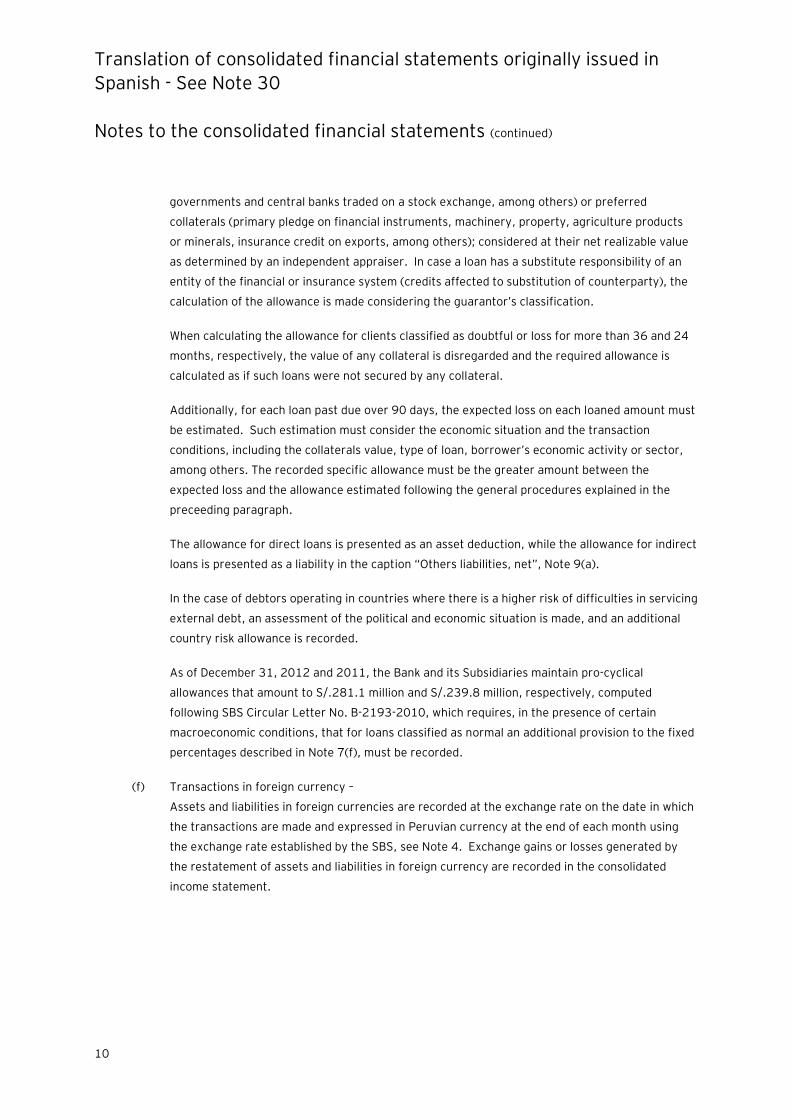
governments and central banks traded on a stock exchange, among others) or preferred
collaterals (primary pledge on financial instruments, machinery, property, agriculture products
or minerals, insurance credit on exports, among others); considered at their net realizable value
as determined by an independent appraiser. In case a loan has a substitute responsibility of an
entity of the financial or insurance system (credits affected to substitution of counterparty), the
calculation of the allowance is made considering the guarantor’s classification.
When calculating the allowance for clients classified as doubtful or loss for more than 36 and 24
months, respectively, the value of any collateral is disregarded and the required allowance is
calculated as if such loans were not secured by any collateral.
Additionally, for each loan past due over 90 days, the expected loss on each loaned amount must
be estimated. Such estimation must consider the economic situation and the transaction
conditions, including the collaterals value, type of loan, borrower’s economic activity or sector,
among others. The recorded specific allowance must be the greater amount between the
expected loss and the allowance estimated following the general procedures explained in the
preceeding paragraph.
The allowance for direct loans is presented as an asset deduction, while the allowance for indirect
loans is presented as a liability in the caption “Others liabilities, net”, Note 9(a).
In the case of debtors operating in countries where there is a higher risk of difficulties in servicing
external debt, an assessment of the political and economic situation is made, and an additional
country risk allowance is recorded.
As of December 31, 2012 and 2011, the Bank and its Subsidiaries maintain pro-cyclical
allowances that amount to S/.281.1 million and S/.239.8 million, respectively, computed
following SBS Circular Letter No. B-2193-2010, which requires, in the presence of certain
macroeconomic conditions, that for loans classified as normal an additional provision to the fixed
percentages described in Note 7(f), must be recorded.
(f) Transactions in foreign currency –
Assets and liabilities in foreign currencies are recorded at the exchange rate on the date in which
the transactions are made and expressed in Peruvian currency at the end of each month using
the exchange rate established by the SBS, see Note 4. Exchange gains or losses generated by
the restatement of assets and liabilities in foreign currency are recorded in the consolidated
income statement.

Translation of consolidated financial statements originally issued in
Spanish - See Note 30
Notes to the consolidated financial statements (continued)
11
(g) Derivative financial instruments -
Derivate financial instruments are recorded in accordance with accounting criteria established by
SBS Resolution N° 1737-2006 “Regulation for Trading and Accounting of Derivatives for
Financial Entities” and amendments, as explained below:
Trading -
Trading derivate financial instruments are initially recognized in the consolidated balance sheet
at cost, and thereafter, they are recognized at fair value. Fair values are obtained based on
exchange rates and interest rates prevailing in the market. Gains and losses arising from
changes in fair values are recorded in the consolidated income statement, recognizing an asset
or liability in the consolidated balance sheet as appropriate. In addition, they are recorded as off-
balance sheet accounts at their notional amount, Note 19(a).
Hedging -
A derivative financial instrument that seeks to achieve a financial hedge for a given risk is
designated as for hedge purposes if, at its negotiation, it is foreseen that changes in fair value or
cash flows are expected to be highly effective in offsetting the fair value or cash flow changes of
the hedged item attributable to the hedged risk at inception, which must be documented when
the financial derivative is negotiated and during the period that the hedge relation exists. A
hedge is considered as highly effective if changes in fair value or cash flows attributable to the
hedged risk during the period for which the hedge is designated are expected to offset in a range
of 80 to 125 percent.
If the SBS considers the documentation to be unsatisfactory or finds weaknesses in the
methodologies applied, it may require the immediate termination of the hedge relationship and
the recording of the derivative financial instrument as trading.
For cash flow hedges, the effective portion of gain or loss over the hedge instrument is
recognized directly in equity, in the caption “Unrealized gains (losses)”. The ineffective portion of
gain or loss of the hedged instrument is recognized in the consolidated income statement. When
the cash flow hedge affects the consolidated income statement, the gain or loss in the hedge
instrument is recorded in the corresponding caption of the consolidated income statement.
For fair value hedges, changes in fair value of the derivative are recognized in the consolidated
income statement. Changes in fair value of the hedged item attributed to the hedged risk are
recorded as part of the balance of the hedged item and recognized in the consolidated income
statement.
If the hedge instrument expires, is sold, terminated or exercised, or when the hedge does not
fulfill the hedging accounting criteria, the hedge relationship is prospectively terminated and the
balance recorded in the consolidated balance sheet is transferred to the consolidated income
statement during the term the hedged item is kept.
Translation of consolidated financial statements originally issued in
Spanish - See Note 30
Notes to the consolidated financial statements (continued)
12
As of December 31, 2012 and 2011, following the SBS permission, certain derivative financial
instruments maintained by the Bank and its Subsidiaries have been designated as hedging
operations considering the functional currency of Credicorp, the U.S. Dollar, see Note 9(c).
Embedded derivatives -
Certain derivatives embedded in other financial instruments (host contract) are treated as
separate derivatives when their economic characteristics and risks are not closely related to
those of the host contract and the host contract is not carried at fair value through profit or loss.
These embedded derivatives are separated from the host instrument and recognized at fair value
in the consolidated income statement, unless the Bank and its Subsidiaries choose to designate
the hybrid contracts (host and embedded derivative) at fair value through profit and loss.
As of December 31, 2012 and 2011, in accordance with SBS Resolution N°1737-2006, the Bank
has Indexed Certificates to Credicorp stock price that will be settled in cash, which are hybrid
instruments with embedded derivatives that are not closely related to the risk of the host
contract. In this regard, the Bank has decided to classify these instruments at inception at fair
value through profit and loss. Therefore, the separation of the embedded derivative is not
required, Note 9(b).
(h) Investments at fair value through profit or loss, available-for-sale and held-to-maturity -
As of December 31, 2012 and 2011, the initial recognition and the subsequent measurement of
investments at fair value through profit or loss, available-for-sale and held to maturity, are
carried out following SBS Resolution N°10639-2008, “Regulations for the classification and
valuation of investments” and amendment. The guidelines for valuation of investments,
according to their classification are as follows:
- Investments at fair value through profit or loss – Initial recognition is at fair value,
considering the transaction costs associated with such investments as expenses.
Subsequent measurement is at fair value and any gain or loss arising from changes in the
initial cost and subsequent fair value is recognized directly in the consolidated income
statement.
- Investments available-for-sale - Initial recognition is at fair value, including the transaction
costs that are directly associated to their acquisition. Gains or losses originated by
changes between the initial cost and fair value are recognized directly in equity, unless a
permanent impairment in its value exists. When an instrument is realized or sold, the
unrealized gains or losses previously recognized as part of equity are recognized in the
consolidated income statement.
Translation of consolidated financial statements originally issued in
Spanish - See Note 30
Notes to the consolidated financial statements (continued)
13
In the case of debt securities, before their subsequent measurement at fair value, the
amortized cost is updated applying the effective interest rate; considering this amortized
cost, unrealized gains or losses due to changes in fair value are recognized.
- Investments held-to-maturity - Initial recognition is at fair value, including the transaction
costs that are directly associated to their acquisition; subsequent measurement is at
amortized cost, using the effective interest rate method.
Transactions are recorded at the date of negotiation, that is, the date of the assumption of the
reciprocal obligations that must be complied with, within terms established by regulations and
practices of the market on which the transaction is performed.
Interests are recognized using the effective interest rate, which includes both interest
receivables and premium or discount amortization.
Gains or losses on exchange differences regarded to amortized cost of debt instruments affect
the consolidated income statement; gain or losses on exchange differences regarded to fair value
valuation are recorded as part of the unrealized gains or losses in the consolidated equity.
Equity instruments are considered non-monetary items, therefore, the original cost in local
currency is not modified, the exchange difference is part of the valuation and is recognized as
unrealized results in the consolidated equity.
The Bank and its Subsidiaries evaluate, at each date of the consolidated financial statements, if
there is evidence that any instrument classified as available-for-sale and held-to-maturity is
impaired; if that is the case, an impairment is recognized in the consolidated income statement,
even though the investment has not been retired or sold.
SBS Resolution N°10639-2008, considers that if the SBS deems necessary to require the
constitution of an additional provision for any class of investment, such provision must be
determined by the SBS, based on each individual investment, and recorded in the consolidated
income statement.
The difference between the proceeds received from the sale of an investment and its book value
is recognized in the consolidated income statement.

Translation of consolidated financial statements originally issued in
Spanish - See Note 30
Notes to the consolidated financial statements (continued)
14
(i) Investments in associates -
According to SBS Resolution N°10639-2008, this category includes only equity securities
acquired with the purpose of having equity participation and/or significant influence in other
entities or institutions.
Investments in associates are initially recognized at their fair value including the transaction
costs directly attributable to their acquisition; subsequently they are recorded using the equity
participation method. In the case of investments quoted on a stock exchange, when their market
value shows a decreasing trend due to non-temporary circumstances, the Bank and its
Subsidiaries must record a provision for impairment; nevertheless, the SBS at its own criteria,
can require the recognition of an additional provision for impairment.
(j) Property, furniture and equipment and depreciation -
Property, furniture and equipment are recorded at acquisition cost, less accumulated
depreciation and accumulated amount of impairment, if applicable, see paragraph (q) below.
Maintenance and repair costs are charged to the consolidated income statement and significant
renewals and improvements are capitalized when: i) it is probable that future economic benefits
will flow from the renewal or improvement; and ii) cost can be measured reliably. The cost and
its corresponding accumulated depreciation and any impairment loss of an asset sold or retired
are eliminated from the corresponding accounts and the related gain or loss is included in the
consolidated income statement.
Work in progress and in transit units are accounted at their acquisition cost. These goods are not
depreciated until they are received or finished and placed into service.
Land is not depreciated. Depreciation is computed on a straight-line basis over the following
estimated useful lives:
Years
Buildings and other constructions 33
Installations 10
Furniture and fixtures 10
Computer hardware 4
Equipment and vehicles 5
The residual value, the useful live assigned and the selected depreciation method is periodically
reviewed to ensure that they are consistent with the economic benefit and useful live
expectations of property, furniture and equipment items.

Translation of consolidated financial statements originally issued in
Spanish - See Note 30
Notes to the consolidated financial statements (continued)
15
(k) Seized assets, assets received as payment and realizable assets –
Realizable assets include assets purchased specifically for granting them as part of financial
leasing operations and are recorded initially at their acquisition cost; realizable assets not
granted in leasing operations are recorded at cost or market value, the lower.
Received as payment and seized assets (which include assets from terminated financial leasing
contracts) are initially recorded at the value assigned to them, through a legal proceeding, out-
of-court settlement, market value or at the unpaid value of the debt, the lower. At the time of
initial recognition, a provision equivalent to 20 percent of the above determined value must be
recorded; for this purpose it is permitted to reclassify the allowance for loan losses that was
originally provided for the related loan.
Thereafter, additional provisions should be recorded using the following guideline:
- Assets that are not real state – a uniform monthly provision in a term of twelve months,
until providing for one hundred percent of the net seized or recovered value.
- Real estate - uniform monthly provisions over the net book value obtained at the twelfth
month. In addition, SBS Resolution N°1535-2005 allows a term extension of six months,
in such case; a uniform monthly provision must be made over the net book value obtained
in the eighteenth month. On both situations, provisions must be made until providing for
one hundred percent of the net book value in a term of three years and a half, starting the
date monthly provisions began to be provided.
The annual update of the seized assets’ fair value, determined by an independent appraiser,
involves, if necessary, the recording of an impairment provision.
(l) Finite useful live intangible assets -
SBS Resolution N°1967-2010, establishes the accounting procedures for intangible assets with
finite useful live. These assets are included in the caption “Other assets, net” of the consolidated
balance sheets and are stated at historical acquisition cost less accumulated amortization and
accumulated impairment losses, if applicable; see following paragraph (q). These assets are
composed principally by acquisition and development of software used by the Bank and its
Subsidiaries in their operations, which are recorded at cost; brand rights of use, which are
recorded considering the related contract; as well as finite useful live intangible assets identified
in the acquisition of Edyficar in 2009, which were recognized on the consolidated balance sheets
at their fair values determined at their acquisition date, corresponding to the brand name and
costumer relationship, see Note 9(d)
According to SBS Resolution N°1967-2010, finite useful live intangible assets are amortized in
no more than 5 years.

Translation of consolidated financial statements originally issued in
Spanish - See Note 30
Notes to the consolidated financial statements (continued)
16
The Bank and its Subsidiaries’ finite useful lives intangible assets are amortized using the
straight-line method, based in their estimated useful lives (five years), see Note 9 (d).
However, in consideration of the future transfer of Correval to Credicorp Investments (Note 2
(a)), amortization of finite useful live intangibles assets arising from the acquisition of Correval
was calculated considering the following useful lives:
Years
Brand 25
Customer relationship 8 and 10
Fund management contracts 28
(m) Indefinite useful live intangible assets - Goodwill -
According to SBS Resolutions N°1967-2010, indefinite useful live assets, such as goodwill,
registered before January 1, 2010, are amortized following regulations in force on the date of
initial recognition, considering a period of no more than 5 years. Goodwill generated after
January 1, 2010, is recognized at cost; and then, it is measured its cost less any impairment
loss, which is tested annually or more frequently when any event or change in circumstances
indicates that the fair value may be impaired, see following paragraph (q). However, according to
an authorization from the SBS, goodwill generated in the acquisition of Edyficar in 2009 is
measured at cost less any accumulated impairment loss.
(n) Bonds and subordinated notes issued -
Includes the liabilities from the issuance of different types of bonds and subordinated notes,
which are initially recorded at their fair value plus the incremental costs related to the
transaction that are directly attributable to the instrument’s issuance. Upon initial recognition,
they are measured at their amortized cost applying the effective interest rate method. The
amortized cost is calculated taking into account any issuance discount or premium, as well as the
costs that are an integral part of the effective interest rate. Likewise, accrued interests are
recognized in the consolidated statements of income in the “Interest on bonds and subordinated
notes issued” caption of the “Financial expenses” account, according to the contractual terms.
(o) Income tax -
Current Income tax is calculated on the basis of taxable income determined for tax purposes,
which is determined using principles that differ from accounting principles used by the Bank and
its Subsidiaries.
Therefore, the Bank and its Subsidiaries record deferred income taxes, considering the guidelines
of IAS12 – Income Tax. The deferred income tax reflects the effects of temporary differences
between the carrying amounts of assets and liabilities for accounting purposes and the amounts
determined for tax purposes. Deferred assets and liabilities are measured using the tax rates
expected to be applied to taxable income in the years in which temporary differences are

Translation of consolidated financial statements originally issued in
Spanish - See Note 30
Notes to the consolidated financial statements (continued)
17
expected to be recovered or settled. The measurement of deferred tax assets and deferred tax
liabilities reflects the tax consequences which arise from the way in which the Bank and its
Subsidiaries expect to recover or eliminate the carrying amount of its assets and liabilities at the
consolidated balance sheets dates.
Deferred tax assets and liabilities are recognized without taking into consideration the time in
which it is estimated that temporary differences will be written off. Deferred assets are
recognized when sufficient future tax benefits are probable to exist for applying the deferred
assets. As at the date of the consolidated balance sheets, Management evaluates the non-
recognized deferred assets and the balance of the recognized assets, recording deferred assets
not previously recognized to the extent that probable future tax benefits will allow their recovery,
or reducing the deferred assets to the extent that it is not likely that sufficient future tax benefits
will be available to use part or all of the deferred assets previously recognized.
In accordance with IAS 12, the Bank and its Subsidiaries determines its deferred tax considering
the tax rate applicable to its non-distributed earnings; any additional tax on dividends distribution
is recorded on the date a liability is recognized.
(p) Share-based payment transactions -
The Bank and its Subsidiaries have two share-based payment plans.
The first share-based payment plan was granted until 2008 and consisted of rights/options
granted in the form of stock appreciation rights (SARs) over a number of Credicorp shares to
certain executives who had at least one year of service. According to the conditions of the plan,
a fixed settlement price of the rights/options was established at the grant date, allowing the
executive to obtain as benefit the difference between the market price at the moment in which
the rights/options are exercised and the agreed settlement price, Note 17. The related expense
is recorded considering the accrued services at the date of the consolidated balance sheet,
multiplied by the difference between the estimated market price of the rights/options at the date
of the consolidated balance sheet and the agreed settlement price.
The second share-based payment plan was implemented in 2009 to replace the plan explained
above and consists on the granting of a number of Credicorp shares. For that purpose, the Bank
and its Subsidiaries purchase each year Credicorp shares, which are legally given to the
executives, although they vest in 3 years from the date of grant (March or April of each year).
Until December 31, 2011, shares of Credicorp legally delivered to the executive, as authorized
by Official Letter SBS N°9771-2009, were recorded as personnel expenses, for all the amount
disbursed in their acquisition and in the year they were legally delivered to the executive.

Translation of consolidated financial statements originally issued in
Spanish - See Note 30
Notes to the consolidated financial statements (continued)
18
In August 2011, the SBS issued Official Letter N°38179-2011, by which it indicated that all
share-based payments plan must be recorded following IFRS 2 – Share-based payments, starting
January 1, 2012, but requiring prospective treatment.
Consequently, in accordance with IFRS 2, because the Bank is responsible of settling the plan and
it is not settled in equity instruments of the Bank, but of Credicorp, the second share-based
payment plan granted in the year 2012 is also recorded as cash settled.
The fair value of the shares and rights / options is estimated using a binomial method. The fair
value is expensed over the period until the vesting date with recognition of a corresponding
liability. The liability is remeasured at each reporting date up to and including the settlement
date, recognizing changes in fair value under "Compensation and benefits" in the consolidated
statement of income.
When the price or terms of the plans change, the effect of the change is recognized in the
consolidated statements of income.
(q) Impairment -
When changes or certain events indicate that the value of an asset may not be recovered, the
Bank and its Subsidiaries review the value of property, furniture and equipment, goodwill and
intangible assets (including brand name and client relationship) in order to verify if there is no
permanent impairment in their values. When the book value of the asset exceeds its recoverable
value, a loss for impairment is recognized in the consolidated income statement for each caption
mentioned above. The recoverable value is the highest between the net sale price and its value in
use. The net sale price is the amount that can be obtained from the sale of an asset in a free
market, while the value in use is the present value of the estimated future cash flows provided by
the continuous use of an asset and its disposal at the end of its useful live. The recoverable
amounts are estimated for each asset or, if not possible, for each cash generating unit.
(r) Fiduciary activities -
Assets and cash flows from fiduciary operations in which there is a commitment to return such
assets and cash flows to a client and in which the Bank and its Subsidiaries participate as a
fiduciary, have been excluded from these consolidated financial statements, because the Bank
and its Subsidiaries are not owners of such assets and cash flows and they do not assume the
risks and rewards that arise from their ownership.
The Bank and its Subsidiaries for fiduciary control purposes record these operations in the
caption “Off-balance sheet accounts”, Note 19, of the consolidated balance sheets and the
commissions received for these activities are included in the caption “Other income”, Note 23, of
the consolidated income statement.

Translation of consolidated financial statements originally issued in
Spanish - See Note 30
Notes to the consolidated financial statements (continued)
19
(s) Provisions -
Provisions are only recognized when the Bank and its Subsidiaries have a present (implicit or
legal) obligation as a result of past events, it is probable that an outflow of resources will be
required to settle such obligation, and the amount has been reliably estimated. Provisions are
reviewed in each period and are adjusted to reflect their best estimate as of the consolidated
balance sheet date. When the effect of the time value of money is significant, the amount
recorded as a provision is the present value of future payments required to settle the obligation.
(t) Contingencies -
Contingent liabilities are not recognized in the consolidated financial statements. They are
disclosed in notes to the consolidated financial statements, unless the possibility of an outflow of
economic resources is remote.
Contingent assets are not recognized in the consolidated financial statements; however, they are
disclosed when their contingency degree is probable.
(u) Earnings per share -
Basic and diluted earnings per share are calculated by dividing the net income by the weighted
average number of shares outstanding at the consolidated balance sheets dates. Shares that are
issued due to the capitalization of retained earnings are deemed to be stock splits; thus, for the
computation of the weighted average number of shares; they are considered as if they had
always been issued.
As of December 31, 2012, 2011 and 2010, the Bank and its Subsidiaries do not have financial
instruments with dilutive effects; therefore, basic and diluted earnings per share are the same.
(v) Repurchase agreements and security lending and borrowing transaction –
Securities sold under agreements to repurchase at a specified future date are not derecognized
from the consolidated balance sheet as the Bank and its Subsidiaries retains substantially all of
the risks and rewards of ownership. The corresponding cash received is recognized in the
consolidated balance sheet as an asset with a corresponding obligation to return it, including
accrued interest as a liability within “Payables from repurchase agreements and security
lending”, reflecting the transaction’s economic substance as a loan to the Bank and its
Subsidiaries. The difference between the sale and repurchase prices is treated as interest
expense and is accrued over the life of agreement using the effective interest rate.

Translation of consolidated financial statements originally issued in
Spanish - See Note 30
Notes to the consolidated financial statements (continued)
20
Conversely, securities purchased under agreements to resell at a specified future date are not
recognized in the consolidated balance sheet. The consideration paid, including accrued interest,
is recorded in the consolidated balance sheet, within “Receivables from reverse repurchase
agreements and security borrowing”, reflecting the transaction’s economic substance as a loan by
the Bank and its Subsidiaries. The difference between the purchase and resale prices is recorded
in the caption “Financial income” of the consolidated income statement and is accrued over the
life of the agreement using the effective interest rate.
If securities purchased under agreement to resell are subsequently sold to third parties, the
obligation to return the securities is recorded as a short sale in the caption “Financial liabilities
designated at fair value through profit or loss” of the consolidated balance sheet, and measured
at fair value with any gains or losses included in “Other non-financial income”.
Securities lending and borrowing transactions are usually collateralized by securities. The transfer
of the securities to counterparties is only reflected on the consolidated balance sheet if the risks
and rewards of ownership are also transferred.
As of December 31, 2011, the Bank and its Subsidiaries had not purchased securities under
agreements to resell at a future date, or sale of securities purchased under resale agreements.
As of December 31, 2012, such operations had been performed exclusively by Correval, see Note
10.
(w) Cash and cash equivalents -
Cash and cash equivalents presented in the consolidated statements of cash flows correspond to
“Cash and due from banks” of the consolidated balance sheets, which includes deposits with less
than a three-month maturity as of the acquisition date, BCRP time deposits, funds deposited in
central banks and overnight deposits, excluding restricted funds.
(x) Reclassifications –
The comparative amounts have been reclassified, if necessary, to make them comparable with
the current year presentation. Management considers that reclassifications made in the
consolidated financial statements as of December 31, 2011 and 2010, are not significant
considering the consolidated financial statements as a whole.
(y) International Financial Reporting Standards (IFRS) –
(y.i) IFRS Issued and in effect in Peru as of December 31, 2012.
The CNC through Resolutions N°051-2012-EF/30 issued on August 29, 2012 and N°048-
2011-EF/30 issued on January 6, 2012, formalized the implementation of the current
versions of the years 2012 and 2011, respectively, of IFRS 1 to 13, IAS 1 to 41, the
pronouncements 7 to 32 of the Standing Interpretations Committee (SIC) and
Interpretations of the International Financial Reporting Standards (IFRIC) 1 to 19 and

Translation of consolidated financial statements originally issued in
Spanish - See Note 30
Notes to the consolidated financial statements (continued)
21
amendments up to October 2011, to IAS, IFRS and IFRIC issued internationally. Their
application is from the day after the issuance of the Resolution or after the effective date
as stipulated in each specific standard.
In addition, on March 14, 2012, through Resolution N°050-2012-EF/30, the CNC agreed
to maintain in Peru the application of the equity method to record in the consolidated
financial statements investments in associates and joint ventures.
Through Resolution N°914-2010, the SBS postponed the effective date, for financial
institutions of IFRS 7 "Financial Instruments: Disclosures" and IFRS 8 "Operating
Segments". No effective date has been defined by the SBS.
(y.ii) IFRS issued and effective in Peru as of December 31, 2011 -
The current versions of year 2009 of IFRS 1 to 8, IAS 1 to 41, the pronouncements 7 to
32 of the Standing Interpretations Committee (SIC), interpretations of International
Financial Reporting Standards (IFRIC) 1 to 19 and amendments up to May 2010 to IAS 1
and 34, IFRS 1, 3 and 7, IFRIC 13 and the transition requirements for amendments arising
as a result of IAS 27, were in force as of December 31, 2011.
Because standards explained in paragraphs (y.i) and (y.ii) are only complementary to the SBS
accounting rules, they will not have any significant effect in the preparation of the accompanying
consolidated financial statements, unless the SBS adopts them in the future through the
modification of the Accounting Manual for Financial Entities or the issuance of specific rules. The
Bank and its Subsidiaries have not estimated the effect in its consolidated financial statements,
of the adoption of the above mentioned standards, if adopted by the SBS.
(z) Harmonization process of accounting standards –
As part of the harmonization process of accounting standards issued by the SBS with IFRS, on
September 19, 2012, the SBS issued Resolution N°7036-2012, establishing amendments to the
Accounting Manual for financial entities.
Also, on November 30, 2012, the SBS issued Official Letter N°45311-2012, requiring financial
entities to prepare an implementation plan for compliance with the deadlines included in SBS
Resolution N°7036-2012 and amendments; the plan must include a schedule of activities for
adapting accounting processes and computer systems. On December 14, 2012, the Bank
presented to the SBS the implementation plan.
SBS Resolution N° 7036-2012 is effective since January 2013 and is to be applied prospectively.
Also, the SBS, through the Official Letter mentioned above, extended the deadline of certain
amendments until May 31, 2013 for financial entities that could not adapt their systems to the
changes requested as of January 1, 2013. The Bank filed for this extension.

Translation of consolidated financial statements originally issued in
Spanish - See Note 30
Notes to the consolidated financial statements (continued)
22
In Management opinion, the requirements included in SBS Resolution N°7036-2012, do not
significantly affect its operations or consolidated balances.
On the other hand, on September 19, 2012, SBS issued Resolution N°7033-2012, effective
January 2013. Consequently, the Regulation on Classification and Valuation of Investments
approved by SBS Resolution N°10639-2008 was repealed.
The main amendment in said Resolution is the inclusion of a standard methodology for
identification of impairment on financial instruments classified as investments available for sale
and investments held-to-maturity.
Such methodology includes two filters analysis. The first filter refers to a significant decrease in
fair value (50 percent of cost) and a consecutive decrease during the last 12 months, of at least
20 percent. The second filter refers to qualitative aspects of the issuer. In Management opinion,
the adoption of SBS Resolution N°7033-2012, will not have a significant effect on the Bank and
its Subsidiaries consolidated financial statements.
4. Foreign currency transactions and exposure to exchange risk
(a) Transactions in foreign currency are completed using exchange rates prevailing in the market.
As of December 31, 2012, the weighted average market exchange rate published by the SBS for
transactions in U.S. Dollars was S/. 2.549 for buying and S/.2.551 for selling (S/.2.695 and
S/.2.697 as of December 31, 2011, respectively). As of December 31, 2012, the exchange rate
established by the SBS to record assets and liabilities in foreign currencies was S/.2.55 for each
U.S. Dollar, S/. 0.366379 for each Boliviano and S/.0.001443 for each Colombian Peso
(S/.2.696, S/.0.393004 and S/.0.001391, as of December 31, 2011, respectively). A detail of
the Bank and its Subsidiaries’ foreign currency assets and liabilities is shown below (presented in
thousands of U.S. Dollars):

Translation of consolidated financial statements originally issued in
Spanish - See Note 30
Notes to the consolidated financial statements (continued)
23
2012 2011 _____________________________ _____________________________
U.S.
Dollars
Other
Currencies
U.S.
Dollars
Other
Currencies
US$(000) US$(000) US$(000) US$(000)
Assets
Cash and due from banks and
interbank funds 4,837,784 160,540 3,836,388 125,885
Investments at fair value trough
profit or loss and available-for-
sale investments, net 1,112,515 259,646 780,615 351,850
Investments held-to-maturity 150,099 - - -
Loans, net 10,632,720 684,030 9,111,246 531,043
Other assets 38,333 981,767 115,063 128,008
Assets classified as held for sale - 1,254,355 - - ____________ __________ ____________ __________
16,771,451 3,340,338 13,843,312 1,136,786 ____________ __________ ____________ __________
Liabilities
Deposits and obligations (9,550,941) (898,485) (8,087,598) (702,359)
Payable from repurchase
agreements (525,418) (10,910) (250,000) -
Due to banks, correspondents and
other entities and interbank
funds (3,068,397) (129,714) (2,542,199) (116,179)
Bonds and subordinated notes
issued (2,806,750) - (2,641,162) -
Other liabilities (248,981) (26,364) (101,803) (52,912)
Liabilities directly associated with
assets classified as held for sale - (1,137,015) - - ____________ __________ ____________ __________
(16,200,487) (2,202,488) (13,622,762) (871,450) ____________ __________ ____________ __________
Net forward position (oversold) (319,576) (5,258) 323,525 8,509
Net currency swap position,
Note 19(a) (65,782) - (155,579) -
Net cross currency and interest
rate swap position, Note 19(a) (60,418) 89,289 (197,659) 115,433
Options (5,954) - 3,269 - ____________ __________ ____________ __________
Net asset position 119,234 1,221,881 194,106 389,278 ____________ __________ ____________ __________

Translation of consolidated financial statements originally issued in
Spanish - See Note 30
Notes to the consolidated financial statements (continued)
24
As of December 31, 2012, the Bank and its Subsidiaries have contingent operations (indirect
loans) in foreign currency for approximately US$ 3,204.2 million, equivalent to approximately
S/.8,170.7 million (approximately US$2,739.2 million, equivalent to approximately S/.7,384.9
million, as of December 31, 2011), Note 19.
In prior years, the devaluation (revaluation) of the Nuevo Sol with respect to the U.S. Dollar and
inflation, in accordance with the National Wholesale Price Index published by the Instituto
Nacional de Estadística e Informática (National Institute of Statistics and Informatics), are as
follows:
Year
Devaluation
(revaluation)
Inflation
% %
2008 4.8 6.7
2009 (8.0) 0.3
2010 (2.8) 2.1
2011 (4.0) 4.7
2012 (5.4) 2.7
5. Cash and due from banks
As of December 31, 2012, cash and due from banks includes approximately US$4,064.1 million and
S/.5,947.4 million (US$3,202.6 million and S/.3,816.0 million, as of December 31, 2011) of mandatory
reserve that the Bank and its Subsidiaries must maintain for their obligations with the public. These
reserves are deposited in the vaults of the Bank and its Subsidiaries and in the Central Reserve Bank of
Peru – BCRP, and are within the limits established by prevailing legislation.
As of December 31, 2012, cash and due from banks subject to mandatory reserve in Peruvian currency
and foreign currency are affected at an implicit rate of 18.74 percent and 39.97 percent, respectively,
of the total obligations subject to reserve, as required by the BCRP (13.52 percent and 37.03 percent,
respectively, as of December 31, 2011).
The reserve funds which represents the minimum mandatory do not earn interest; however, the
mandatory reserve deposited in BCRP in excess of minimum mandatory, earns interests at a nominal
rate established by BCRP. As of December 31, 2012, the excess in foreign currency amounts to
approximately US$3,257.4 million, equivalent to approximately S/.8,306.4 million, and earns interest in
U.S. Dollars at an average rate of 0.10 percent (US$2,257.2 million, equivalent to approximately
S/.6,085.4 million, at an average rate of 0.18 percent as of December 31, 2011), while the excess in
Nuevos Soles amounts to approximately S/.2.953.7 million and earns interests at an average rate of
1.75 percent (S/.1,007.2 million, at an average rate of 2.45 percent as of December 31, 2011).

Translation of consolidated financial statements originally issued in
Spanish - See Note 30
Notes to the consolidated financial statements (continued)
25
Deposits in local and foreign banks correspond principally to balances in Nuevos Soles and U.S. Dollars.
All deposits are unrestricted and earn interest at market rates. As of December 31, 2012 and 2011,
the Bank and its Subsidiaries do not have significant deposits in any specific financial institution.
As of December 31, 2012, the Bank and its Subsidiaries maintain restricted funds related to repurchase
agreements and other funds that amount to US$ 68.7 million, equivalent to S/.175.1 million and S/.4.3
million, respectively (restricted funds related to repurchase agreements, derivative financial
instruments and other funds that amount to US$90.1, equivalent to S/.223.2 million, S/.19.6 million
and S/.3.6 million, respectively, as of December 31, 2011).

Translation of consolidated financial statements originally issued in Spanish - See Note 30
Notes to the consolidated financial statements (continued)
26
6. Investments at fair value through profit or loss, available-for-sale and held-to-maturity, net
(a) This item is made up as follows:
2012 2011 ________________________________________________________________________________ ________________________________________________________________________________
Unrealized gross amount Unrealized gross amount _______________________________________ _______________________________________
Amortized cost Gains Losses
Estimated fair
value Amortized cost Gains Losses
Estimated fair
value
S/.(000) S/.(000) S/.(000) S/.(000) S/.(000) S/.(000) S/.(000) S/.(000)
Investments at fair value through profit or loss (trading) - - - - 182,138 - - - 203,182 _________ _________ _________ _________ _________ _________ _________ _________
Investments available-for-sale
BCR Certificate of deposits (b) 7,557,344 2,585 (467) 7,559,462 5,556,512 174 (3,521) 5,553,165
Corporate and leasing bonds (c) 1,086,616 28,635 (865) 1,114,386 961,056 12,569 (7,718) 965,907
Listed equity security – Banco de Crédito e Inversiones -
BCI Chile (d) 136,851 531,988 - 668,839 131,736 426,851 - 558,587
Treasury notes from the Central Bank of Bolivia (e) 434,029 1,998 - 436,027 298,511 607 (21) 299,097
Peruvian sovereign bonds (f) 354,448 13,481 - 367,929 717,664 8,056 (207) 725,513
Assets back securities 294,009 13,163 (157) 307,015 290,333 5,956 (712) 295,577
Foreign governments bonds (g) 239,251 818 (748) 239,321 364,293 102 (1,590) 362,805
Participation in RAL funds (h) 200,815 - - 200,815 132,812 - - 132,812
Peruvian treasury bonds (f) 181,257 9,749 - 191,006 166,495 6,817 - 173,312
Bonds of multilateral financial institutions 115,453 7,976 - 123,429 96,920 5,975 (185) 102,710
Mutual funds participations 51,525 672 - 52,197 108,273 588 - 108,861
Listed equity securities – Credicorp 36,192 - - 36,192 - - - -
Trading certificates of deposit 29,262 6 - 29,268 36,113 - (11) 36,102
Non-listed equity securities 3,571 69 (547) 3,093 3,164 79 (585) 2,658
Listed equity securities (BVL) - - - - 170 27,130 - 27,300 ___________ _________ _________ ____________ _________ _________ _________ __________
10,720,623 611,140 (2,784) 11,328,979 8,864,052 494,904 (14,550) 9,344,406 ___________ _________ _________ ____________ _________ _________ _________ __________
Balance of fair value through profit or loss (trading) and
available-for-sale investments, net
11,511,117
9,547,588 ____________ __________
Accrued interest 25,714 20,982 ____________ __________
Total 11,536,831 9,568,570 ____________ __________

Translation of consolidated financial statements originally issued in
Spanish - See Note 30
Notes to the consolidated financial statements (continued)
27
(b) BCRP certificates of deposit are issued at discount, acquired in public auctions, negotiated in the
Peruvian secondary market and settled in Nuevos Soles.
(c) As of December 31, 2012, the balance includes mainly bonds issued by entities from Peru, The
United States of America, Colombia and Chile, which represents 34.3 percent, 20.0 percent,
13.7 percent and 11.8 percent of the total balance, respectively (44.2 percent, 32.1 percent,
3.9 percent and 5.8 percent of the total balance, respectively as of December 31, 2011). As of
December 31, 2012 and 2011, 98.8 percent and 97.2 percent, respectively, of these bonds
were "investment grade".
(d) As of December 31, 2012 and 2011, corresponds to 3,821,057 and 3,752,890 shares, which
represents 3.66 percent and 3.60 percent of BCI-Chile capital stock, respectively.
(e) As of December 31, 2012, it includes mainly treasury notes from the Central Bank of Bolivia,
issued at discount in Bolivianos for an amount of Bolivianos 1,172 million, equivalent to S/.436.0
million (mainly Bolivianos 758.6 million, equivalent to S/. 297.4 million as of December 31,
2011)
(f) Sovereign bonds are issued in Nuevos Soles and Peruvian treasury bonds correspond to global
bonds issued in U.S. Dollars and Euros.
As of December, 31, 2012, the Bank maintained cross currency swaps (“CCS”) which, as
indicated in Note 3(g), were designated as cash flow hedges of certain bonds issued at fixed rate
and in Nuevos Soles and Euros by the Peruvian Government for a notional amount of S/.318.3
million, see Note 9(c); through the CCS these bonds were economically converted to U.S. Dollars
at fixed rate.
(g) As of December 31, 2012, foreign governments bonds corresponds to US$79.5 million,
equivalent to S/.202.7 million, issued by the Colombian Government; US$10.7 million, equivalent
to S/.27.3 million, issued by the Bolivian Government; US$2.6 million, equivalent to S/.6.6
million, issued by the Brazilian Government and US$1.0 million, equivalent to S/.2.6 million ,
issued by the Chilean Government (US$130.7 million, equivalent to S/.352.4 million, issued by
the Colombian Government; US$2.9 million, equivalent to S/.7.7 million, issued by the Brazilian
Government and US$1.0 million, equivalent to S/.2.7 million, issued by the Chilean Government
as of December 31, 2011).

Translation of consolidated financial statements originally issued in
Spanish - See Note 30
Notes to the consolidated financial statements (continued)
28
(h) As of December 31, 2012, the participation quotas in the fund “Requirement of Cash Assets”
(RAL for its Spanish acronym), are denominated in Bolivianos and U.S. Dollars, and amounts
approximately to Bolivianos 243.9 million, equivalent to S/.90.7 million and US$43.2 million,
equivalent to S/.110.1million, respectively (approximately Bolivianos 188.6 million, equivalent to
S/.73.9 million and US$21.8 million, equivalent to S/.58.9 million, respectively, as of December
31, 2011). They comprise investments made by Banco de Crédito de Bolivia in the Central Bank
of Bolivia as collateral for the deposits maintained with the public. RAL Fund has restrictions for
its use and it is required for all banks operating in Bolivia.
(i) As of December 31, 2012, the Bank maintained interest rate swaps (IRS), which as indicated in
Note 3(g), were designated as fair value hedges of certain bonds issued at fixed rate in U.S.
Dollars by the Peruvian Government, corporate entities and multilateral financial entities, for a
notional amount of S/.136.5 million (S/.145.7 million, as of December 31, 2011), see Note 9(c);
through the IRS, these bonds were economically converted to variable interest rate.

Translation of consolidated financial statements originally issued in Spanish - See Note 30
Notes to the consolidated financial statements (continued)
29
(j) As of December 31, 2012 and 2011, the maturities and the annual effective interest rates of the investments available-for-sale are as follows:
Investments available-for-sale Maturity Annual effective interest rates _________________________________ _____________________________________________________________________________________________________________________________________________
2012 2011 2012 2011 _____________________________________________________________________ _____________________________________________________________________
S/. US$ Other currencies S/. US$ Other currencies _____________________ _____________________ _____________________ _____________________ _____________________ _____________________
Min Max Min Max Min Max Min Max Min Max Min Max
% % % % % % % % % % % %
BCRP certificates of deposit Jan-13 / May-14 Jan-12 / Dec-12 3.76 4.00 - - - - 4.10 4.26 - - - -
Corporate and leasing bonds Jan-13 / May-30 Feb-12 / May-30 3.20 5.83 0.27 5.37 - - 2.19 6.21 1.15 6.44 - -
Peruvian sovereign bonds Dec-13 / Aug-20 Jan-12 / Feb-42 2.67 3.80 - - - - 1.34 6.61 - - - -
Foreign governments bonds Jan-13 / Oct-22 Jan-12 / Nov-15 - - 1.12 5.82 - - - - 1.12 6.78 - -
Assets back securitites Jun-14 / Nov-29 Jun-14 / Jun-25 - - 1.90 5.42 6.94 8.44 - - 4.41 4.83 6.94 8.44
Treasury notes from the Central Bank of Bolivia Jan-13 / Mar-14 Jan-12 / Nov-13 - - - - 0.00 2.80 - - - - 0.00 2.80
Peruvian treasury bonds Oct-14 / Dic-15 Feb-12 / Dec-15 - - 2.36 2.48 0.57 0.57 - - 0.12 3.50 - -
Bonds of multilateral financial institutions May-13 / Jun-19 Mar-12 /Jun-19 - - 1.52 3.18 - - - - 1.24 4.45 - -
Trading certificates of deposit Jan-13 / Aug-16 Jan-12 / Aug-16 - - 3.08 3.08 1.10 1.20 - - 0.97 3.00
(k) As of December 31, 2012 and 2011, Management has estimated the fair value of investments at fair value through profit or loss (trading) and available-for-sale using market price quotations available in the market or, if the price
was not available, by discounting the expected future cash flows at an interest rate that reflects the risk classification of the financial instrument.
Management has determined that the unrealized losses as of December 31, 2012 and 2011 are of temporary nature. The Bank and its Subsidiaries have decided and have the ability to maintain these investments for a period of
time sufficient to allow for an anticipated recovery in fair value, which can occur at their maturity.

Translation of consolidated financial statements originally issued in
Spanish - See Note 30
Notes to the consolidated financial statements (continued)
30
(l) Investments held-to-maturity
This item is made up as follows:
2012
S/.(000)
Peruvian sovereign bonds 272,734
Foreign governments bonds 267,442
Peruvian treasury bonds 110,384 ___________
650,560
Accrued interest 11,582 ___________
Total 662,142 ___________
As of December 31, 2012, the fair value of held-to-maturity investments amounts to S/.657.9
million and has maturities between March 2019 and August 2020. These investments bear
interest at an annual effective interest rate of 3.80 percent for bonds issued in Nuevos Soles and
between 1.55 and 1.96 percent for bonds issued in U.S. Dollars.
(m) As of December 31, 2012, the Bank maintained repurchase agreements for approximately
S/.1,667.6 million guaranteed with cash for approximately S/175.1 million, see Note 5, and
securities (corporate bonds, bonds of multilateral financial institutions, sovereign bonds and
global bonds) classified as investments available for sale and held to maturity investments for an
estimated fair value of US$471.1 million, equivalent to S/.1,201.3 million and US$259.7 million,
equivalent to S/.662.2 million, with maturities fewer than one year for approximately 17
percent, between one and three years for approximately 52 percent and more than five years for
approximately 31 percent (repurchase agreements for approximately S/.674.0 million,
guaranteed with cash for approximately S/.223.2, and securities (corporate bonds, bonds of
multilateral financial institutions and global bonds) classified as investments available for sale,
amounting to US$223.2 million, equivalent to S/.601.8 million, with maturity on June 2012, as
of December 31, 2011). These operations accrued an interest at fixed rate between 1.10 percent
and 4.30 percent, and a variable rate between Libor 3M+0.35 percent and Libor 6M+1.38
percent as of December 31, 2012 (Libor 6M+0.72 percent as of December 31, 2011).
As of December 31, 2012, the cash flows of certain repurchase agreements amounting to
S/.510.0 million were hedged through an interest rate swap (“IRS”) for the same notional
amount and the same maturities; through IRS, these repurchase agreements were economically
converted to fixed rate, see Note 9 (c).

Translation of consolidated financial statements originally issued in
Spanish - See Note 30
Notes to the consolidated financial statements (continued)
31
(n) The balance of investments at fair value through profit or loss (trading), available for
sale and held to maturity as of December 31, 2012 and 2011, classified by
contractual maturity, are made up as follow:
2012 2011
S/.(000) S/.(000)
Up to 3 months 2,945,431 2,518,803
From 3 months to 1 year 4,162,537 3,813,518
From 1 to 3 years 1,923,211 584,726
From 3 to 5 years 365,861 446,801
More than 5 years 1,749,674 1,299,836
Without maturity 1,014,963 883,904 ___________ __________
Total 12,161,677 9,547,588 ___________ __________
7. Loans, net
(a) This item is made up as follows:
2012 2011
S/.(000) S/.(000)
Direct loans
Loans 20,007,239 18,484,430
Leasing receivables 8,856,955 7,519,494
Mortgage loans 8,779,880 6,977,444
Credit cards 5,893,861 4,873,648
Consumer loans 4,221,427 3,435,889
Foreign trade loans 2,457,472 2,068,218
Discounted notes 1,421,181 1,488,820
Factoring receivables 832,564 686,175
Advances and overdrafts 118,190 63,355
Refinanced loans 362,626 258,899
Past due and under legal collection loans 944,532 696,472 ___________ ___________
53,895,927 46,552,844
Add (less)
Accrued interest from performing loans 376,617 305,639
Deferred interest on discounted notes and leasing
receivables (1,368,913) (1,203,786)
Allowance for loan losses (g) (1,799,128) (1,420,612) ___________ ___________
Total direct loans 51,104,503 44,234,085 ___________ ___________
Indirect loans, (e) and Note 19(a) 11,727,386 10,174,585 ___________ ___________

Translation of consolidated financial statements originally issued in
Spanish - See Note 30
Notes to the consolidated financial statements (continued)
32
(b) As of December 31, 2012 and 2011, 51 percent of the non retail direct and indirect loan
portfolio corresponded to 408 and 386 clients, respectively.
(c) As of December 31, 2012 and 2011, the distribution of the loan portfolio by segments,
according to Resolutions SBS N°11356-2008, Note 3(d), is as follows:
2012 2011
S/.(000) S/.(000)
Corporate 12,115,881 11,796,237
Large business 10,037,434 8,866,315
Mortgage 8,887,991 7,343,447
Medium-business 8,033,014 6,533,738
Revolving and non-revolving consumer loans 7,561,448 6,145,301
Small-business 5,321,431 4,117,560
Micro-business 1,938,728 1,750,246 ____________ ____________
Total 53,895,927 46,552,844 ____________ ____________

Translation of consolidated financial statements originally issued in
Spanish - See Note 30
Notes to the consolidated financial statements (continued)
33
(d) As of December 31, 2012 and 2011, the distribution of the loan portfolio by economic sector is
as follows:
2012 2011 _____________________________ ____________________________
S/.(000) % S/.(000) %
Manufacturing 9,323,390 17.3 9,149,604 19.7
Mortgage loans 8,887,991 16.5 7,343,447 15.8
Commerce 8,169,957 15.2 7,010,464 15.1
Consumer loans 7,561,448 14.0 6,145,301 13.2
Business real estate and leasing
services 3,840,640 7.1 3,036,482 6.5
Electricity, gas and water 3,736,881 6.9 3,199,021 6.9
Mining 1,953,727 3.6 2,328,521 5.0
Communications, storage and
transportation 1,991,993 3.7 2,013,948 4.3
Community services 2,444,244 4.5 1,872,814 4.0
Agriculture 1,125,408 2.1 892,784 1.9
Financial services 1,082,812 2.0 848,752 1.8
Hotels and restaurants 950,802 1.8 760,351 1.6
Construction 1,301,264 2.4 703,208 1.5
Education, health and other
services 863,210 1.6 644,396 1.4
Fishing 365,999 0.7 348,697 0.7
Other 296,161 0.6 255,054 0.6 ___________ _______ ___________ _______
Total 53,895,927 100.0 46,552,844 100.0 ___________ _______ ___________ _______

Translation of consolidated financial statements originally issued in Spanish - See Note 30
Notes to the consolidated financial statements (continued)
34
(e) According to SBS regulations, as of December 31, 2012 and 2011, the Bank and its Subsidiaries’ loan portfolio credit risk classification is as follows:
2012 2011 ____________________________________________________________________________________________ ____________________________________________________________________________________________
Risk category Direct loans Indirect loans Total Direct loans Indirect loans Total _____________________________ _____________________________ _____________________________ _____________________________ _____________________________ _____________________________
S/.(000) % S/.(000) % S/.(000) % S/.(000) % S/.(000) % S/.(000) %
Normal 51,134,987 95.0 11,575,149 98.7 62,710,136 95.6 44,121,613 94.8 9,775,083 96.0 53,896,696 95.0
Potential problems 1,152,935 2.1 137,337 1.2 1,290,272 2.0 1,176,645 2.5 371,866 3.7 1,548,511 2.7
Substandard 486,941 0.9 9,983 0.1 496,924 0.8 376,957 0.8 7,853 0.1 384,810 0.7
Doubtful 592,029 1.1 2,319 0.0 594,348 0.9 426,421 0.9 9,540 0.1 435,961 0.8
Loss 529,035 0.9 2,598 0.0 531,633 0.7 451,208 1.0 10,243 0.1 461,451 0.8 ___________ ________ __________ ________ ___________ ________ ___________ ________ __________ ________ ___________ ________
53,895,927 100.0 11,727,386 100.0 65,623,313 100.0 46,552,844 100.0 10,174,585 100.0 56,727,429 100.0 ___________ ________ __________ ________ ___________ ________ ___________ ________ ___________ ________ ___________ ________

Translation of consolidated financial statements originally issued in
Spanish - See Note 30
Notes to the consolidated financial statements (continued)
35
(f) As of December 31, 2012 and 2011, financial entities in Peru must constitute their allowance for
loan losses based on the risk classification indicated in paragraph (e) and using the percentages
indicated on Resolution SBS N°11356-2008, as follows:
(i) For loans classified as “Normal”:
Loan type Fixed-rate
Pro-cyclical
component (*)
% %
Corporate 0.70 0.40
Large-business 0.70 0.45
Mortgage 0.70 0.40
Medium-business 1.00 0.30
Small-business 1.00 0.50
Revolving consumer loan 1.00 1.50
Non-revolving consumer loan 1.00 1.00
Micro-business 1.00 0.50
(*) In case the loan has highly liquid preferred guarantees (LWHLPG), the pro-cyclical component
will be 0%, 0.25% or 0.30%, depending on the loan type.
(ii) For loans classified as “Potential problems”, “Substandard”, “Doubtful” and “Loss”;
depending if the loans are: Loans Without Guarantees (LWG), Loans With Preferred
Guarantees (LWPG) or Loans With Readily Preferred Guarantees (LWRPG) or Loans with
Highly Liquid Preferred Guarantees (LWHLPG):
Risk category LWG LWPG LWRPG LWHLPG
% % % %
Potential problems 5.00 2.50 1.25 1.00
Substandard 25.00 12.50 6.25 1.00
Doubtful 60.00 30.00 15.00 1.00
Loss 100.00 60.00 30.00 1.00
For loans subject to substitution of credit counterparty, Note 3(e), the allowance
requirement depends on the classification of the respective counterparty, for the amount
covered, regardless of the debtor credit risk classification, using the percentages indicated
above.

Translation of consolidated financial statements originally issued in
Spanish - See Note 30
Notes to the consolidated financial statements (continued)
36
(g) The movement of the allowance for loan losses (direct and indirect loans) is shown below:
2012 2011
S/.(000) S/.(000)
Balance as of January 1 1,524,348 1,273,789
Provision recognized as an expense during the period 1,111,244 708,484
Loan portfolio written-off (677,883) (432,614)
Translation result and other (42,592) (25,311) ___________ ___________
Balance as of December 31(*) 1,915,117 1,524,348 ___________ ___________
(*) As of December 31, 2012, the movement of the allowance for loan losses includes direct and indirect
loans allowance for approximately S/.1,799.1 million and S/.116.0 million, respectively
(approximately S/.1,420.6 million and S/.103.7 million, respectively, as of December 31, 2011). The
allowance for indirect loan losses is presented in the “Other liabilities, net” caption of the
consolidated balance sheets, Note 9(a).
In Management’s opinion, the allowance for loan losses recorded as of December 31, 2012 and
2011, has been established in accordance with SBS regulations in force as of those dates,
Note 3(e).
(h) As of December 31, 2012, the Bank maintained a cross currency swap (“CCS”), which, as
indicated in Note 3(g), has been designated as cash flow hedge of a fixed rate and Nuevos Soles
loan portfolio, for a notional amount of S/.9.8 million, see Note 9(c); through CCS, these assets
were economically converted to U.S. Dollars at fixed rate.
(i) A portion of the loan portfolio is secured by guarantees received from clients, which are
principally conformed by mortgages, stand-by letters, financial instruments, and industrial and
commercial pledges.
(j) Interests accrued on the loan portfolio are determined considering the current interest rates
prevailing in the markets where the Bank and its Subsidiaries operate.

Translation of consolidated financial statements originally issued in
Spanish - See Note 30
Notes to the consolidated financial statements (continued)
37
(k) As of December 31, 2012 and 2011, the direct gross loan portfolio classified by maturity, based
on the remaining period to repayment date is as follows:
2012 2011
S/.(000) S/.(000)
Outstanding loans -
Up to 1 month 5,819,557 5,319,121
From 1 to 3 months 5,509,335 5,305,649
From 3 months to 1 year 11,127,028 9,088,017
From 1 to 3 years 11,964,198 10,352,437
From 3 to 5 years 7,084,186 6,008,961
More than 5 years 11,447,091 9,782,187
Past due loans -
Up to 4 months 375,742 247,097
More than 4 months 254,161 256,268
Loans under legal collection 314,629 193,107 ____________ ____________
Total 53,895,927 46,552,844 ____________ ____________

Translation of consolidated financial statements originally issued in Spanish - See Note 30
Notes to the consolidated financial statements (continued)
38
8. Property, furniture and equipment, net
(a) The movement of property, furniture and equipment and accumulated depreciation for the years ended December 31, 2012 and 2011, is as follows:
Land
Buildings
and other
constructions Installations
Furniture
and fixtures
Computer
hardware
Equipment and
vehicles
Work in
progress and in
transit units 2012 2011
S/.(000) S/.(000) S/.(000) S/.(000) S/.(000) S/.(000) S/.(000) S/.(000) S/.(000)
Cost -
Balance as of January 1 105,834 831,855 521,422 292,655 414,915 138,024 50,225 2,354,930 2,451,681
Additions 47,604 5,580 3,198 27,575 35,979 2,755 170,042 292,733 285,580
Sales (28) (371) (75) (21) (64,554) (1,847) - (66,896) (3,704)
Transfers 172 9,175 81,333 14,536 17,040 5,569 (127,825) - -
Write-downs and other - (248) (1,730) (6,520) (28,834) - - (37,332) (378,627) ________ ________ ________ ________ ________ ________ ________ __________ __________
Balance as of December 31 153,582 845,991 604,148 328,225 374,546 144,501 92,442 2,543,435 2,354,930 ________ ________ ________ ________ ________ ________ ________ __________ __________
Accumulated depreciation -
Balance as of January 1 - 386,571 304,092 194,047 272,321 61,239 - 1,218,270 1,454,524
Depreciation of the year - 25,171 44,028 15,305 57,445 13,264 - 155,213 143,383
Sales - (334) (75) (21) (30,524) (1,784) - (32,738) (2,788)
Write-downs and transfers - (94) 1,094 (5,586) (27,140) - - (33,914) (376,849) ________ ________ ________ ________ ________ ________ ________ __________ __________
Balance as of December 31 - 411,314 346,951 203,745 272,102 72,719 - 1,306,831 1,218,270 ________ ________ ________ ________ ________ ________ ________ __________ __________
Net book value 153,582 434,677 257,197 124,480 102,444 71,782 92,442 1,236,604 1,136,660 ________ ________ ________ ________ ________ ________ ________ __________ __________
(b) Banks in Peru are not allowed to pledge their fixed assets.
(c) During 2012, the Bank capitalized disbursements related mainly to the purchase and implementation of new agencies and the construction and implementation of additional administrative infrastructure.
During 2011, the disbursements capitalized were related mainly to the construction and implementation of the projects: “ECO – Chorrillos” (new data center) and “ECO – Trujillo” (decentralized call
center).
(d) As of December 31, 2012 and 2011, the Bank and its Subsidiaries maintain fully depreciated assets, for an amount of approximately S/.755.6 million and S/.727.4 million, respectively.
(e) The Bank and its Subsidiaries maintain insurance over their main assets, according to policies established by Management.
(f) Management periodically reviews the fixed assets’ residual value, their useful live and the selected depreciation method to ensure that they are consistent with their economic benefits and live
expectations. In Management’s opinion, there is no evidence of impairment of property, furniture and equipment as of December 31, 2012 and 2011.

Translation of consolidated financial statements originally issued in
Spanish - See Note 30
Notes to the consolidated financial statements (continued)
39
9. Other assets and other liabilities
(a) These items are made up as follows:
2012 2011
S/.(000) S/.(000)
Other assets, net
Financial instruments at fair value -
Indexed certificates (b) 83,678 108,614
Derivatives receivable (c) 393,654 222,364 __________ __________
477,332 330,978 __________ __________
Other, net-
Value added tax credit 697,770 622,531
Finite live intangible assets, net (d) 438,280 440,555
Accounts receivable 306,510 251,564
Deferred income tax, Note 14(a) 311,854 243,843
Income tax prepayments, net 202,877 94,861
Goodwill – Edyficar, Note 3(m) 144,841 144,841
Deferred expenses 68,038 39,960
Operations in process (e) 53,200 55,133
Realizable, received in payment and seized assets, net (f) 34,173 31,990
Other 14,214 14,244 __________ __________
2,271,757 1,939,522 __________ __________
Total 2,749,089 2,270,500 __________ __________
Other liabilities, net
Payroll taxes, salaries and other personnel expenses
payable 331,426 286,440
Accounts payable 366,661 297,375
Derivatives payable (c) 295,370 238,106
Deferred income tax, Note 14(a) 186,198 148,023
Allowance for indirect loan losses, Note 7(g) 115,989 103,736
Provision for sundry risks (g) 95,794 114,246
Operations in process (e) 72,311 39,264
Share based payments, Note 17(a) and (b) 52,968 51,498
Deposit Insurance Fund 20,071 17,528
Tax payable 44,039 67,354
Other 239 4,004 ___________ ___________
Total 1,581,066 1,367,574 ___________ ___________

Translation of consolidated financial statements originally issued in
Spanish - See Note 30
Notes to the consolidated financial statements (continued)
40
(b) In connection with the liabilities that result from Credicorp’s stock appreciation rights (SARs),
Note 17(a), the Bank signed several contracts with Citigroup Global Markets Holdings Inc.,
Citigroup Capital Limited, Citigroup Capital Market Inc (hereinafter “Citigroup”) and Credit
Agricole Corporate and Investment Bank (hereinafter “Calyon”).
These contracts consist of the purchase of certificates indexed to the performance of Credicorp
(BAP) shares, in the form of “warrants” issued by Citigroup and Calyon, with the same number of
Credicorp shares. These certificates will be settled totally or partially at any moment exclusively
in cash with maturity until 2014.
As of December 31, 2012 and 2011, the Bank and its Subsidiaries have acquired 214,914 and
355,914 certificates, respectively, at a total cost of US$13.5 million and US$22.4 million,
respectively (US$63.0 and US$62.9 per certificate on average, respectively). During 2012 and
2011, the Bank and its Subsidiaries settled 141,000 and 796,500 certificates, respectively.
According to SBS standards, the difference between cost and estimated market value; as well as
the result obtained from the liquidation of the indexed certificates, are recorded in the
consolidated income statement in the caption “Other non-financial income and operating
expenses”, see Note 23.

Translation of consolidated financial statements originally issued in
Spanish - See Note 30
Notes to the consolidated financial statements (continued)
41
(c) The risk in derivatives contracts arises from the possibility that the counterparty does not fulfill the terms and conditions agreed, and that the reference rates, in which the transaction was made, changes.
The table below presents the fair value of the derivative financial instruments, recorded as an asset or a liability, together with their notional amounts. The gross notional amount is the amount of a derivative’s underlying asset and is the basis
upon which changes in fair value of derivatives are measured, Note 19(a).
2012 2011 2012 and 2011 __________________________________________________________________________ _________________________________________________________________________ _______________________
Note Assets Liabilities
Notional
amount Maturity Assets Liabilities
Notional
amount Maturity
Hedged
Instrument S/.(000) S/.(000) S/.(000) S/.(000) S/.(000) S/.(000)
Derivatives held for trading (i) -
Forward exchange contracts 179,228 130,165 13,384,519 Between January 2013 and October 2014 56,251 75,962 9,315,557 Between January 2012 and January 2014
Interest rate swaps 76,264 73,855 2,991,020 Between March 2013 and December 2022 85,045 84,114 1,860,494 Between March 2012 and December 2022
Currency swaps 68,167 43,169 1,429,061 Between March 2013 and September 2022 48,526 24,423 794,022 Between January 2012 and September 2022
Options 1,103 1,078 242,985 Between January and July 2013 554 2,159 173,040 Between January and November 2012 ________ ________ ___________ ________ _________ ___________
324,762 248,267 18,047,585 190,376 186,658 12,143,113 ________ ________ ___________ ________ _________ ___________
Derivatives held as hedges -
Cash flow hedge (ii) -
Interest rate swaps (IRS) 12(b)(i) - 7,073 977,500 Between April 2013 and March 2014 1,439 8,627 1,348,000 Between October 2012 and March 2014 Due to banks
Interest rate swaps (IRS) 6(m) - 1,688 510,000 Between March 2019 and August 2020 - - - - Repurchase agreements
Interest rate swaps (IRS) 12(c) - 12,408 390,000 Between January 2013 and March 2016 - 18,025 591,175 Between January 2012 and March 2016 Debts to related parties
Cross currency swaps (CCS) 12(c) 40,582 - 328,580 October 2014 6,500 - 311,208 October 2014 Debts to related parties
Cross currency swaps (CCS) 6(f) - 7,652 318,308 Between October 2014 and August 2020 - - - - Investments available for sale
Cross currency swaps (CCS) 7(h) - 535 9,752 Between January 2013 and November 2020 - - - - Loan portfolio
Cross currency swaps and interest
rate swaps (CCS e IRS) 13(a) 28,310 5,172 153,301 Between March 2013 and March 2015 24,049 9,843 221,680 Between June 2012 and March 2015 Bonds issued
Fair value hedge -
Interest rate swaps (IRS) 6(i) - 12,575 136,463 Between May 2013 and June 2019 - 14,593 145,717 Between May 2012 and June 2019 Investments available for sale ________ ________ ___________ ________ _________ ___________
68,892 47,103 2,823,904 31,988 51,448 2,617,780 ________ ________ ___________ ________ _________ ___________
393,654 295,370 20,871,489 222,364 238,106 14,760,893 ________ ________ ___________ ________ ________ __________

Translation of consolidated financial statements originally issued in
Spanish - See Note 30
Notes to the consolidated financial statements (continued)
42
(i) Derivatives held for trading are mainly negotiated to satisfy clients’ needs. The Bank and its Subsidiaries may also take positions with the expectation of profiting from favorable movements in prices and rates. Also, this caption
includes any derivatives which do not comply SBS hedging requirements. The fair value of the derivates held for trading, classified by for maturity is as follows:
As of December 31, 2012 As of December 31, 2011 ________________________________________________________________________________________________ ________________________________________________________________________________________________
Up to 3
months
From 3 months
to 1 year
From 1 to 3
years
From 3 to 5
years
Over 5
years Total
Up to 3
months
From 3 months to
1 year
From 1 to 3
years
From 3 to 5
years
Over 5
years Total
S/.(000) S/.(000) S/.(000) S/.(000) S/.(000) S/.(000) S/.(000) S/.(000) S/.(000) S/.(000) S/.(000) S/.(000)
Forward exchange contracts 126,202 46,504 6,522 - - 179,228 31,523 22,006 2,722 - - 56,251
Interest rate swaps - 231 5,021 41,223 29,789 76,264 8 366 5,739 3,479 75,453 85,045
Currency swaps 4,682 2,841 50,327 2,067 8,250 68,167 14,525 4,271 18,561 6,428 4,741 48,526
Options 854 249 - - - 1,103 243 311 - - - 554 _________ _________ __________ __________ __________ __________ _________ __________ _________ _________ _________ ___________
Total assets 131,738 49,825 61,870 43,290 38,039 324,762 46,299 26,954 27,022 9,907 80,194 190,376 _________ _________ __________ __________ __________ __________ _________ __________ _________ _________ _________ ___________
As of December 31, 2012 As of December 31, 2011 ________________________________________________________________________________________________ _______________________________________________________________________________________________
Up to 3
months
From 3 months
to 1 year
From 1 to 3
years
From 3 to 5
years
Over 5
years Total
Up to 3
months
From 3 months
to 1 year
From 1 to 3
years
From 3 to 5
years
Over 5
years Total
S/.(000) S/.(000) S/.(000) S/.(000) S/.(000) S/.(000) S/.(000) S/.(000) S/.(000) S/.(000) S/.(000) S/.(000)
Forward exchange contracts 50,646 78,347 1,172 - - 130,165 31,291 43,920 751 - - 75,962
Interest rate swaps 48 238 7,314 40,362 25,893 73,855 8 360 9,164 3,300 71,282 84,114
Currency swaps - 46 31,361 2,220 9,542 43,169 8 2,467 11,729 5,834 4,385 24,423
Options 762 316 - - - 1,078 1,874 285 - - - 2,159 _________ _________ __________ __________ __________ __________ _________ __________ _________ _________ _________ ___________
Total liabilities 51,456 78,947 39,847 42,582 35,435 248,267 33,181 47,032 21,644 9,134 75,667 186,658 _________ _________ __________ __________ __________ __________ _________ __________ _________ _________ _________ ___________

Translation of consolidated financial statements originally issued in
Spanish - See Note 30
Notes to the consolidated financial statements (continued)
43
(ii) The Bank and its Subsidiaries are exposed to movements in future interest cash flows on non-
trading assets and liabilities which bear interest at variable rates. The Bank and its
Subsidiaries use derivate financial instruments as cash flow hedges of said risk, according to
Note 3(g). As of December 31, 2012, a summary indicating the periods when the hedged
cash flows are expected to occur and when they are expected to affect the consolidated
income statement, net from income tax is as follows:
Up to 1 year
From 1 to 3
years
From 3 to 5
years
More than 5
years
S/.(000) S/.(000) S/.(000) S/.(000)
Cash outflows (liabilities) (931,236) (1,254,763) (62,079) (62,079) ________ ________ ________ ________
Consolidated income statement (14,627) (27,597) (3,796) 15,079 ________ ________ ________ ________
As of December 31, 2012, the net unrealized loss from the cash flow hedges is included in
the caption “Unrealized gains (losses)” of the consolidated statements of changes in
shareholders’ equity and results from the current hedges (unrealized loss for
approximately S/.30.9 million) and from the unwind made in 2009 (unrealized gain for
approximately S/.23.2 million), which is being realized in the consolidated income
statements during term of the underlying financial instrument (October 2022), see Note
13(a)(iv). Likewise, the transfer of the net unrealized gain and/or loss on cash flow
hedges to the consolidated income statement is presented in Note 15(d).

Translation of consolidated financial statements originally issued in Spanish - See Note 30
Notes to the consolidated financial statements (continued)
44
(d) The movement of intangible assets for the years ended December 31, 2012 and 2011 is as follows:
Description Brand name
Rights
of use (ii)
Client
Relationship
Software and other
developments
Intangibles in
process 2012 2011
S/.(000) S/.(000) S/.(000) S/.(000) S/.(000) S/.(000) S/.(000)
Cost -
Balance as of January 1 37,504 55,740 18,735 609,261 92,363 813,603 687,279
Additions (i) - - - 31,577 86,077 117,654 129,175
Transfers - - - 70,409 (70,409) - -
Split, Note 2(b) - - - (2,621) - (2,621) -
Withdrawals and others - - - (2,342) - (2,342) (2,851) _________ _________ _________ _________ ________ _________ _________
Balance as of December 31 37,504 55,740 18,735 706,284 108,031 926,294 813,603 _________ _________ _________ _________ ________ _________ _________
Accumulated amortization -
Balance as of January 1 16,252 3,716 8,119 344,961 - 373,048 270,032
Amortization of the year 7,501 11,148 3,747 96,474 - 118,870 105,859
Split, Note 2(b) - - - (1,568) - (1,568) -
Withdrawals and others - - - (2,336) - (2,336) (2,843) _________ _________ _________ _________ ________ _________ _________
Balance as of December 31 23,753 14,864 11,866 437,531 - 488,014 373,048 _________ _________ _________ _________ ________ _________ _________
Net book value 13,751 40,876 6,869 268,753 108,031 438,280 440,555 ________ ________ ________ ________ _______ ________ ________
(i) During the year 2012, the Bank capitalized disbursements related to the implementation and development of several projects (Implementation of treasury solutions, windows system, CRM for wholesale banking, basic
information of clients, among others). During the year 2011, the Bank capitalized disbursements related to the implementation and development of sundry IT Projects, mainly “AIO” related to the increase in
infrastructure, mainframe and licenses to support operations.
(ii) In July 2010, the Bank signed a contract with Telefónica Móviles S.A. by which both parties agreed that the Bank is the exclusive financial institution for the issuance of the co-branded “Movistar BCP” card, which is a
payment instrument issued by the Bank and bears certain benefits established by both parties and stipulated in the contract, whose term is for five years starting at the launching of the card, August 2011.
(iii) As of December 31, 2012 and 2011, the Bank and its Subsidiaries have fully amortized intangible assets that are still in use for approximately S/. 201.3 million and S/.129.7 million, respectively.
(iv) Management periodically reviews the intangibles’ residual value, their useful live and the selected amortization method to ensure that they are consistent with their economic benefits and live expectations. In
Management’s opinion, there is no evidence of impairment of intangibles as of December 31, 2012 and 2011.

Translation of consolidated financial statements originally issued in
Spanish - See Note 30
Notes to the consolidated financial statements (continued)
45
(e) Operations in process include deposits received, loans disbursed and/or collected, funds
transferred and other similar types of transactions, which are made at the end of the month and
not reclassified to their final consolidated balance sheet account until the first days of the
following month. The regularization of these transactions do not affect the Bank and its
Subsidiaries’ consolidated net income.
(f) As of December 31, 2012 and 2011, the balance includes S/.28.6 million and S/.24.4 million,
respectively, corresponding to assets acquired with the specific purpose of granting leasing loans.
In Management’s opinion, the allowance of realizable assets, received in payment and seized
assets recorded as of December 31, 2012 and 2011, complies with SBS regulations in force on
those dates.
(g) As of December 31, 2012 and 2011, the provision for sundry risks comprises the estimated
losses due to legal procedures against the Bank and its Subsidiaries, estimated losses due to
operational risk and other similar obligations that were recorded based on Management and its
internal legal advisors’ best estimates.
10. Assets classified as held for sale and liabilities directly associated
(a) As of December 31, 2012, these items include balances of Correval’s operation, as follows:
2012
S/.(000)
Assets classified as held for sale
Receivables from reverse repurchase agreements and security borrowing, Note 3(v) 2,788,432
Investments at fair value through profit or loss and available for sale, net 166,899
Brand name, net 35,902
Client relationships, net 28,055
Fund manager contracts, net 69,276
Goodwill 104,133
Other assets 5,910 __________
Total 3,198,607 _________
Liabilities directly associated with assets classified as held for sale
Payables from repurchase agreements and security lending, Note 3(v) 2,580,548
Financial liabilities designated at fair value trough profit or loss,
Note 3(v) 204,214
Deferred income tax 44,887
Other liabilities 69,740 __________
Total 2,899,389 _________

Translation of consolidated financial statements originally issued in
Spanish - See Note 30
Notes to the consolidated financial statements (continued)
46
The results of Correval’s operations for the period between April 27, 2012 (acquisition date) and
December 31, 2012, are as follow:
2012
S/.(000)
Income and expenses
Revenue 61,869
Expenses (48,709) ___________
Income before income tax 13,160 ___________
Income tax (3,459) ___________
Net income 9,701 __________
The net cash flows of Correval for the period between April 27, 2012 (acquisition date) and
December 31, 2012, are as follow:
2012
S/(000)
Operating activities (29,529)
Investing activities (10,144)
Financing activities 39,440 ___________
Net decrease in cash (233) ___________
(b) On the other hand, as indicated in Note 2(a), the acquisition agreement of Correval includes put
options and call options on the non-controlling interests in that entity. These options have not
been recorded in the consolidated financial statements of the Bank and its Subsidiaries as of
December 31, 2012, considering that they are also part of the rights and obligations to be
transferred to Credicorp Investments Ltd. Also, it is important to mention, that BCP and
Credicorp Investment Ltd. signed on December 2012 an agreement for the transfer of
contractual position; through this agreement BCP transferred its joint liability on the obligations
related to the put and call options on the non controlling interests, “written non controlling
interests puts and calls” to Credicorp Investments Ltd. The transfer of the joint liability and the
accounting treatment of the calls and puts options were informed to the SBS. As of December
31, 2012, the present value of the put options amounts to approximately US$59.2 million.

Translation of consolidated financial statements originally issued in
Spanish - See Note 30
Notes to the consolidated financial statements (continued)
47
The put options on non-controlling interests may be exercised by the minority shareholders of
Correval for a period of three months after the second and fourth year of acquisition. The call
option on non-controlling interests may be exercised by BCP for a period of three months after
the end of the second period established for the exercise of the put options. The put and call
options on non-controlling interest are to be exercised at a price resulting from a formula fixed
contractually; the formula considers the average income and average net worth of Correval
obtained over a period of time, multiplied by fixed factors.
(c) The acquisition of Correval was recorded using the acquisition method, as required by IFRS 3
"Business Combinations". Assets and liabilities were recorded at their estimated fair values at the
acquisition date, including the identified intangible assets unrecorded in Correval balance sheet.
The book values and fair values of assets and liabilities identified in Correval as of the acquisition
date were as follow:
Book value Recognition of
fair value Fair value of
acquired entity
S/.(000) S/.(000) S/.(000)
Assets -
Receivables from reverse repurchase
agreements and security borrowing
1,074,150
-
1,074,150
Investments at fair value trough profit or loss
and available-for-sale investments, net
122,715
-
122,715
Brand name - 40,152 40,152
Client relationships - 31,490 31,490
Fund manager contract - 71,863 71,863
Other assets 54,793 - 54,793
Liabilites -
Payables from repurchase agreements and
security lending
904,477
-
904,477
Financial liabilities designated at fair value
through profit or loss
164,979
-
164,979
Other liabilities 73,271 - 73,271
Liabilities for deferred income tax - 47,356 47,356 ________ ________ ________
Total identifiable net assets at fair value 108,931 96,149 205,080
Non-controlling interests - (118,292) (118,292)
Goodwill from acquisitions - 104,133 104,133 ________ ________ ________
Net acquired assets 108,931 81,990 190,921 ________ ________ ________

Translation of consolidated financial statements originally issued in
Spanish - See Note 30
Notes to the consolidated financial statements (continued)
48
The fair values of the identifiable intangible assets as of the acquisition date were determined
using the income approach and based on the present value of the profits attributable to the asset
or costs avoided as a result of owning the asset. Under this approach, the asset's fair value is
determined by discounting cash flows at the rate that considers the relative risk of achieving the
cash flows and the time value of money.
The following methods were used by Management to estimate fair values of identifiable
intangible assets at the date of acquisition:
- For the valuation of brand name, the "Relief from Royalty" method was applied, which
estimates the cash flows that the entity saves for royalty payments by owning a brand.
- For the valuation of client relationship and fund manager contract, the "Multi-Period-
Excess-Earnings" method was applied, which calculates the residual cash flow after
deducting intangible asset returns for all assets that contribute to the cash flow. These
assets are called contribution charges.
In Management’s opinion, said methods are generally accepted for the measurement of
identifiable intangible assets in a business combination process.
The non-controlling interest as of the acquisition date was measured at fair value; which has been
estimated considering the consideration paid and a discount for lack of control.
11. Deposits and obligations
(a) This item is made up as follow:
2012 2011
S/.(000) S/.(000)
Non-interest bearing deposits and obligations -
In Peru 17,195,713 15,015,375
In other countries 1,994,341 1,825,901 ___________ ___________
19,190,054 16,841,276 ___________ ___________
Interest bearing deposits and obligations -
In Peru 35,931,036 27,845,181
In other countries 2,895,642 2,474,200 ___________ ___________
38,826,678 30,319,381 ___________ ___________
58,016,732 47,160,657
Interest payable for deposits and obligations 161,582 138,798 ___________ ___________
Total 58,178,314 47,299,455 ___________ ___________

Translation of consolidated financial statements originally issued in
Spanish - See Note 30
Notes to the consolidated financial statements (continued)
49
The Bank and its Subsidiaries have established a policy to pay interests on demand deposits and
savings deposits according to a sliding interest rate scale, based on the average balance
maintained in those accounts. Additionally, according to such policy, it was established that
accounts having balances lower than a determined amount for each type of account, do not bear
interest.
Interest rates applied to the different deposits and obligations accounts are determined by the
Bank and its Subsidiaries considering current interest rates in the markets where they develop
their operations.
(b) As of December 31, 2012 and 2011, the balance of deposits and obligations by product is as
follows:
2012 2011
S/.(000) S/.(000)
Demand deposits 19,289,681 16,924,036
Saving deposits 15,515,531 13,740,419
Time deposits (d) 17,096,859 11,391,297
Severance indemnity deposits 5,687,427 4,737,333
Negotiable certificates 427,234 367,572 ___________ ___________
Total 58,016,732 47,160,657 ___________ ___________
(c) As of December 31, 2012 and 2011, approximately S/.19,278.1 million and S/.16,805.3 million,
respectively of the deposits and obligations balances, are covered by the “Fondo de Seguro de
Depósitos” (Deposit Insurance Fund). At those dates, the “Fondo de Seguro de Depósitos”
covered up to S/.91,216.0 and S/.91,621.0, respectively.
(d) The balance of time deposits classified by maturity is as follows:
2012 2011
S/.(000) S/.(000)
Up to 3 months 12,791,172 7,878,840
From 3 months to 1 year 3,332,551 2,906,650
From 1 to 3 years 544,770 605,807
From 3 to 5 years 428,345 -
More than 5 years 21 - ___________ ___________
Total 17,096,859 11,391,297 ___________ ___________

Translation of consolidated financial statements originally issued in
Spanish - See Note 30
Notes to the consolidated financial statements (continued)
50
12. Due to banks, correspondents and other entities
(a) This item is made up as follows:
2012 2011
S/.(000) S/.(000)
By type -
Due to banks and correspondents with foreign financial
institutions (b) 5,255,330 4,376,088
Due to related parties (c) 3,062,010 2,537,733
Promotional credit lines (d) 819,504 651,991 __________ __________
9,136,844 7,565,812
Interest payable 42,489 31,446 __________ __________
Total 9,179,333 7,597,258 __________ __________
(b) As of December 31, 2012 and 2011, it includes loans to finance foreign trade operation and for
working capital. This item is made up as follow:
2012 2011
Entities S/.(000) S/.(000)
Syndicated loan (i) 971,808 1,337,412
Deutsche Bank AG 393,110 328,047
China Development Bank 380,261 401,367
JP Morgan Chase Bank 331,673 -
Standard Chartered Bank 331,582 -
Cobank 296,662 129,147
Bank of America N.A. 280,500 257,860
Citibank N.A. 268,745 256,034
Bank of New York Mellon 252,450 134,800
Toronto Dominion Bank 249,900 229,160
Sumitomo Mitsui Banking Corporation 229,500 53,920
Corporación Andina de Fomento – CAF 216,750 539,200
Banco Latinoamericano de Comercio Exterior 153,000 -
Wells Fargo Bank N.A. 153,000 390,914
Banco de la Nación del Perú 120,000 -
Others 626,389 318,227 __________ __________
Total 5,255,330 4,376,088 __________ __________
(i) As of December 31, 2012, the balance includes two syndicated loans obtained from foreign financial
entities in March 2011 and October 2010, amounting to US$150.0 million, equivalent to S/.382.5
million and US$233.3 million, equivalent to S/.595.0 million, respectively (Two syndicated loans

Translation of consolidated financial statements originally issued in
Spanish - See Note 30
Notes to the consolidated financial statements (continued)
51
obtained from foreign financial entities amounting to US$150 million, equivalent to S/.404.4 million
and US$350.0 million, equivalent to S/.943.6 million, as of December 31, 2011) with maturity in
March 2014 and October 2013, respectively, with interest payments every semester at Libor
6M+1.75 percent. In addition, as of December 31, 2012, both syndicated loans amounting to
S/.977.5 million, which are subject to variable interest rate risk, were hedged through IRS for the
same notional amounts and maturities (S/.1,348.0 million as of December 31,2011); see Note 9(c);
through IRS, the loans were economically converted to fixed rate.
As of December 31, 2012, the loans have maturities between January 2013 and February 2019
(Between January 2012 and December 2016 as of December 31, 2011) and accrued annual
interests at rates that ranged between 0.68 and 10.00 percent (between 0.69 and 10.50
percent as of December 31, 2011).
(c) As of December 31, 2012, due to related parties included: (i) loans at variable interest rates
received from CCR Inc. and Atlantic Security Bank (ASB), amounting to US$1,016.4 million,
equivalent to S/.2,591.9 million and US$55.5 million, equivalent to S/.141.5 million,
respectively; and ii) a promissory note in favour of BCP Emisiones Latam 1 S.A. amounting to 2.7
million Unidades de Fomento Chilenas – UF, equivalent to S/.328.6 million (US$753.5 million,
equivalent to S/.2,031.3 million and US$72.4 million, equivalent to S/.195.2 million and 2.7
million Unidades de Fomento Chilenas-UF, equivalent to S/.311.2 million, respectively, as of
December 31, 2011). The debts with CCR Inc. generate interest at a rate of Libor 1M.
As of December 31, 2012, part of the cash flows of the loans at variable interest rates have been
hedged through interest rate swaps (IRS), for a notional amount of S/.390.0 million (S/.591.2
million as of December 31, 2011); see Note 9(c); through said IRS, the loans were economically
converted to fixed rate.
In addition, as of December 31, 2012 and 2011, the promissory note in favour of BCP Emisiones
Latam 1 S.A., subject to exchange rate risk, has been hedged, as mentioned in Note 3(g),
through cross currency swaps (CCS) for the same notional amounts and the same maturities, see
Note 9(c); through CCS, this liability was economically converted to U.S. Dollars.
(d) Promotional credit lines represent loans received mainly from Corporación Financiera de
Desarrollo (COFIDE) and from Fondo de Cooperación para el Desarrollo Social (FONCODES) to
promote the development of Peru. As of December 31, 2012 and 2011, their annual interest
rates ranged between 6.00 and 7.75 percent. These liabilities are secured by a loan portfolio for
up to the amount of credit line used.

Translation of consolidated financial statements originally issued in
Spanish - See Note 30
Notes to the consolidated financial statements (continued)
52
(e) As of December 31, 2012 and 2011, the balance of this caption, classified by maturity, is as
follows:
2012 2011
S/.(000) S/.(000)
Up to 3 months 1,796,610 1,299,311
From 3 months to 1 year 2,003,493 1,305,950
From 1 to 3 years 2,419,821 2,366,668
From 3 to 5 years 1,487,876 1,276,590
More than 5 years 1,429,044 1,317,293 __________ __________
Total 9,136,844 7,565,812 __________ __________
(f) Some due to banks, correspondents and foreign financial institutions include standard covenants
concerning the fulfillment of financial ratios, specific agreements on how to use the funds
received, the financial conditions that the Bank and its Subsidiaries must maintain, as well as
other administrative matters. In Management’s opinion, these specific agreements have been
complied with by the Bank and its Subsidiaries as of December 31, 2012 and 2011.

Translation of consolidated financial statements originally issued in Spanish - See Note 30
Notes to the consolidated financial statements (continued)
53
13. Bonds and notes issued
(a) This item is made up as follow:
Weighted annual interest rate Interest payment Maturity Issued amount 2012 2011
(000) S/.(000) S/.(000)
Local issuances %
Corporate bonds
First program
Tenth issuance Series A 7.06 Quarterly November 2012 S/.15,000 - 15,000
Tenth issuance Series B 8.00 Quarterly March 2013 S/.10,000 10,000 10,000
Second program
First issuance (Series A and B) 6.83 Semi-annual Between December 2014 and March 2015 S/.275,000 204,167 273,898
First issuance (Series A) – Edyficar 5.47 Semi-annual April 2015 S/.60,000 60,000 -
Second issuance (Series A) - Edyficar 5.50 Semi-annual January 2016 S/.70,000 70,000 -
Third issuance (Series A and B) 7.73 Quarterly Between June and July 2018 S/.200,000 200,000 200,000
Fourth program
Fourth issuance (Series A, B, C and D) 6.41 Semi-annual Between July and December 2014 S/.183,414 183,414 183,414
Fifth issuance (Series A) 5.31 Semi-annual September 2013 S/.50,000 50,000 50,000
Eighth issuance (Series A) 3.75 Semi-annual January 2014 US$91,000 232,050 245,336
Nineth issuance (Series A) 6.22 Semi-annual November 2016 S/.128,000 127,880 128,000
Tenth issuance (Series A) 7.25 Semi-annual December 2021 S/.150,000 149,837 150,000
Tenth issuance (Series B and C) 5.41 Semi-annual Between October and November 2022 S/.400,000 399,299 - ___________ ___________
1,686,647 1,255,648 ___________ ___________
Subordinated bonds
First program
First issuance (Series A) 6.22 Semi-annual May 2027 S/.15,000 15,000 15,000
First issuance (Series A) – Edyficar 8.16 Semi-annual October 2021 S/.40,000 40,000 40,000
Second issuance (Series A) - Edyficar 8.13 Semi-annual December 2021 S/.30,000 30,000 30,000
Third issuance (Series A) - Edyficar 6.19 Semi-annual December 2022 S/.40,000 40,000 -
Fifth issuance (Series A) 8.25 Semi-annual October 2012 S/.50,000 - 12,950
Fourth issuance (Series A, B, C and D) 7.65 Quarterly Between February and May 2016 US$113,822 290,246 306,864
Second program
First issuance (Series A and B) 5.75 Semi-annual Between September and October 2013 US$25,000 21,250 44,933 ___________ ___________
436,496 449,747 ___________ ___________
Leasing bonds - First program
Sixth issuance (Series A) 8.72 Quarterly August 2018 S/.100,000 100,000 98,433
Negotiable certificates of deposit – First program
Fourth issuance (Series A, B and C) - Edyficar 5.30 At maturity Between July and August 2012 S/.94,906 - 94,906
Bonds and mortgage certificates 7.44 Semi-annual April 2012 US$5,000 - 1,364 ___________ ___________
Total local issuances 2,223,143 1,900,098 ___________ ___________

Translation of consolidated financial statements originally issued in
Spanish - See Note 30
Notes to the consolidated financial statements (continued)
54
Weighted annual interest rate Interest payment Maturity Issued amount 2012 2011
(000) S/.(000) S/.(000)
International issuances, trough BCP Panama branch -
Senior bonds – (i) 4.75 Semi-annual March 2016 US$700,000 1,777,434 1,876,793
Senior bonds – (i) 5.38 Semi-annual September 2020 US$800,000 2,025,713 2,140,123
Subordinated bonds – (ii) 6.13 Semi-annual April 2027 US$350,000 887,439 -
Subordinated bonds – (iii) 6.88 Semi-annual September 2026 US$350,000 886,669 936,984
Negotiable certificate of deposit – (iv) 7.45 Semi-annual October 2022 S/.483,280 462,274 459,303
Junior subordinated bonds – (v) 9.75 Semi-annual November 2069 US$250,000 627,006 661,208
Subordinated negotiable certificates of deposit - (vi) 6.88 Semi-annual Between November 2021 and September 2026 US$129,080 304,059 319,678 ___________ ___________
Total international issuances 6,970,594 6,394,089 ___________ ___________
Total local and international issuances 9,193,737 8,294,187
Interest payable 131,696 122,125 ___________ ___________
Total 9,325,433 8,416,312 ___________ ___________
Leasing and mortgage bonds are collateralized by the assets financed by the Bank.
As of December 31, 2012 and 2011, the Bank and its Subsidiaries, considering Note 3(g), hedged corporate bonds issued in Nuevos Soles and fix interest rate for a notional amount of S/.153.3 million and S/.221.7 million, respectively, subject to
exchange rate and variable interest rate risk. Corporate bonds were hedged trough CCS and IRS, and were economically converted to U.S. Dollars with fixed rate, see Note 9(c).
International issuances are listed in the Luxembourg Stock Exchange. Likewise, local and international issuances maintain certain financial and operative covenants, which, in Management’s opinion, the Bank and its Subsidiaries have complied with
as of the dates of the consolidated balance sheets.
(i) BCP can redeem in whole or in a part these notes at any time, with the penalty of the payment of an interest rate equivalent to the American Treasury plus 40 basis points. Payment of principal will take place at the date of maturity or redemption.
(ii) Starting April 24, 2022, the interest rate becomes a variable rate of Libor 3 months plus 704.3 basis points. Between April 24, 2017 and until April 24, 2022, BCP may redeem all or part of the subordinated notes with the penalty of the payment of an interest
equivalent to the American Treasury plus 50 basis points. Additionally, from April 25, 2022 or at any later date of coupon payment, BCP can redeem all or part of the notes without penalty. Payment of principal will take place at the date of maturity or redemption.
(iii) Starting September 16, 2021, the interest rate becomes a variable rate of Libor 3 months plus 770.8 basis points. Between September 16, 2016 and until September 15, 2021, BCP may redeem all or part of the notes, with the penalty of the payment of an
interest equivalent to the American Treasury plus 50 basis points. Additionally, from September 16, 2021 or at any later date of coupon payment, BCP can redeem all or part of the notes without penalty. Payment of principal will take place at the date of maturity
or redemption.
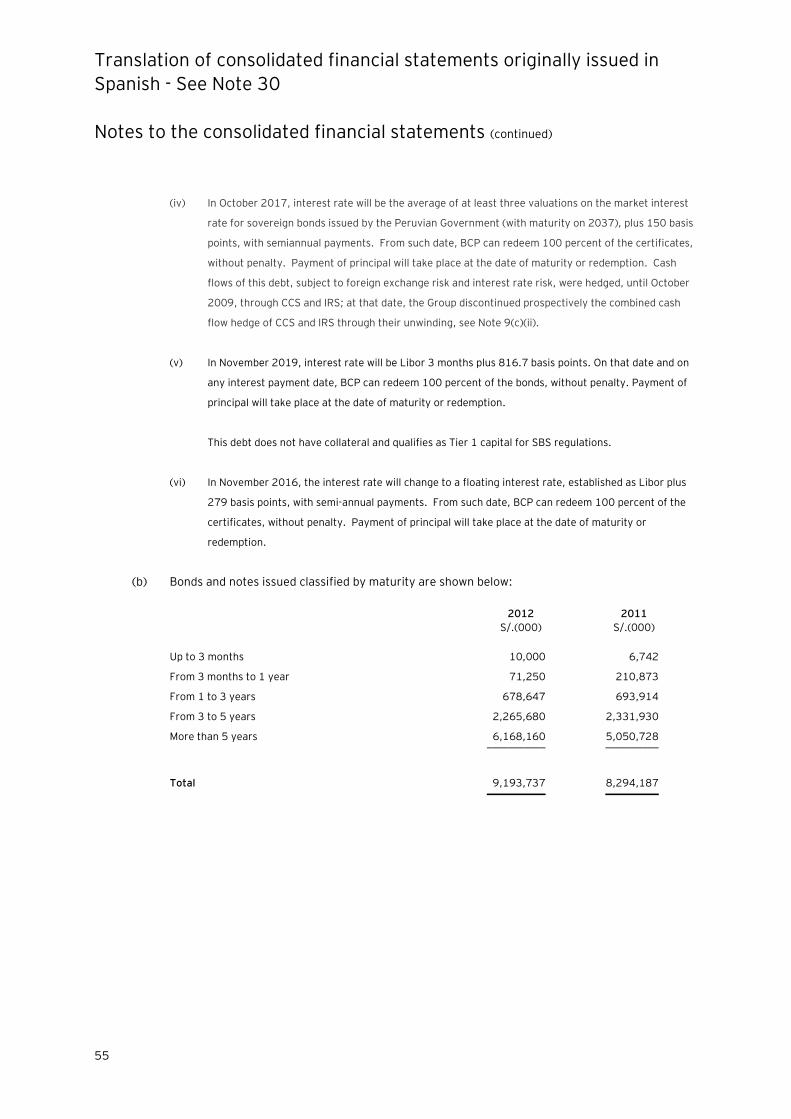
Translation of consolidated financial statements originally issued in
Spanish - See Note 30
Notes to the consolidated financial statements (continued)
55
(iv) In October 2017, interest rate will be the average of at least three valuations on the market interest
rate for sovereign bonds issued by the Peruvian Government (with maturity on 2037), plus 150 basis
points, with semiannual payments. From such date, BCP can redeem 100 percent of the certificates,
without penalty. Payment of principal will take place at the date of maturity or redemption. Cash
flows of this debt, subject to foreign exchange risk and interest rate risk, were hedged, until October
2009, through CCS and IRS; at that date, the Group discontinued prospectively the combined cash
flow hedge of CCS and IRS through their unwinding, see Note 9(c)(ii).
(v) In November 2019, interest rate will be Libor 3 months plus 816.7 basis points. On that date and on
any interest payment date, BCP can redeem 100 percent of the bonds, without penalty. Payment of
principal will take place at the date of maturity or redemption.
This debt does not have collateral and qualifies as Tier 1 capital for SBS regulations.
(vi) In November 2016, the interest rate will change to a floating interest rate, established as Libor plus
279 basis points, with semi-annual payments. From such date, BCP can redeem 100 percent of the
certificates, without penalty. Payment of principal will take place at the date of maturity or
redemption.
(b) Bonds and notes issued classified by maturity are shown below:
2012 2011
S/.(000) S/.(000)
Up to 3 months 10,000 6,742
From 3 months to 1 year 71,250 210,873
From 1 to 3 years 678,647 693,914
From 3 to 5 years 2,265,680 2,331,930
More than 5 years 6,168,160 5,050,728 ___________ __________
Total 9,193,737 8,294,187 ___________ __________

Translation of consolidated financial statements originally issued in
Spanish - See Note 30
Notes to the consolidated financial statements (continued)
56
14. Deferred income tax
(a) These items are made up as follows:
2012 2011
S/.(000) S/.(000)
Net deferred income tax asset
Deferred assets -
Allowance for loan losses 257,298 202,705
Leasing operations, net 31,417 -
Provision for sundry expenses 28,401 28,752
Share-based payments 10,400 15,449
Unrealized loss on hedge derivatives valuation 11,758 15,028
Provision for sundry risks 14,060 13,596
Allowance for seized assets 6,775 6,520
Past due interests 1,805 2,124
Unrealized loss on investments 1,172 -
Unrealized loss on available-for-sale investments valuation 301 2,120
Others 8,840 9,092
Deferred liabilities -
Unrealized gain on available-for-sale investments valuation (12,139) (5,113)
Indexed certificates valuation (14,739) (14,443)
Acquired intangibles (6,186) (9,561)
Buildings depreciation (20,890) (9,184)
Exchange difference (4,687) (4,687)
Unrealized gain on hedge derivatives valuation (603) (2,789)
Leasing operations, net - (2,490)
Others (1,129) (3,276) __________ __________
Total 311,854 243,843 __________ __________
Net deferred income tax liabilities
Deferred liabilities -
Unrealized gain on available-for-sale investments valuation
in BCI Chile
(186,198)
(148,023) __________ __________
Total (186,198) (148,023) __________ __________

Translation of consolidated financial statements originally issued in
Spanish - See Note 30
Notes to the consolidated financial statements (continued)
57
(b) Amounts presented in the consolidated balance sheets as of December 31, 2012 and 2011, and
in the consolidated income statements for the years then ended, are shown below:
2012 2011
S/.(000) S/.(000)
Current 622,949 550,691
Deferred (71,804) (42,017) _________ _________
551,145 508,674 _________ _________
(c) Reconciliation of the effective tax rate to the statutory tax rate for the years 2012 and 2011 is
as follows:
2012 2011
% %
Income before income tax 100.00 100.00 _______ _______
Theoretical expense 30.00 30.00
Effect on taxable income
Non-taxable financial revenue (6.78) (6.67) _______ _______
Effect of non-deductible expenses
Non-deductible financial expenses 1.13 1.38
Other non-deductible expenses 1.87 1.40 _______ _______
Income tax, current and deferred 26.22 26.11 _______ _______
15. Equity
(a) Capital stock –
As of December 31, 2012, the Bank’s capital stock comprises 3,102.9 million of fully subscribed
and paid common shares (2,557.7 million shares, as of December 31, 2011 and 2010) with a
nominal value of one Peruvian Nuevo Sol.
As of December 31, 2012, Credicorp and Grupo Crédito S.A. (a subsidiary of Credicorp)
maintained 12.73 percent and 84.93 percent, respectively of the Bank’s capital stock (12.73
percent and 84.92 percent, respectively as of December 31, 2011).
The General Shareholders Meeting held on August 21, 2012, approved the split of an equity
block in favor of BCP Capital S.A.A. and a reduction of capital stock by approximately S/.85.0
million, decreasing an equivalent number of shares, Note 2(b). The split and reduction took place
on November 1, 2012.

Translation of consolidated financial statements originally issued in
Spanish - See Note 30
Notes to the consolidated financial statements (continued)
58
The General Shareholders Meetings held on March 30, 2012 and March 26, 2010, approved the
capitalization of 2011 and 2009 retained income for an amount of S/.630.2 million and S/.329.5
million, respectively.
(b) Legal reserve –
Pursuant to legislation in force, the Bank must reach a legal reserve of at least 35 percent of its
paid-in capital. This reserve is to be funded through an annual appropiation of at least 10
percent of its net income. As of December 31, 2012, the Bank has covered such legal request.
The General Shareholders Meeting held on August 21, 2012, approved the split of an equity
block in favor of BCP Capital S.A.A. and a reduction of legal reserves by S/.29.8 million, see Note
2(b). The split and reduction took place on November 1, 2012.
The General Shareholders Meeting, held on March 30, 2012, approved the increase of the legal
reserve by S/.220.6 million, through the appropiation of 2011 net income.
The Bank’ Subsidiaries established in Peru and Bolivia must also record legal reserves in their
individual financial statements, which percentages varies depending on applicable laws and
economic activity. As of December 31, 2012, 2011 and 2010, the Subsidiaries’ reported legal
reserves amounted to approximately S/.80.4, S/.78.5 million and S/.67.9 million, respectively.
(c) Special reserve –
The special reserve has been funded through the appropriation of accumulated results.
The General Shareholders Meetings held on March 31, 2011 and March 26, 2010, approved an
increase of the special reserve for approximately S/.674.9 and S/.0.1 million, respectively,
through the appropiation of 2010 and 2009 net income, respectively.
The General Shareholders Meeting held on March 26, 2010, approved the transfer of S/.348.7
million from the special reserve to the legal reserve.

Translation of consolidated financial statements originally issued in
Spanish - See Note 30
Notes to the consolidated financial statements (continued)
59
(d) Unrealized gains (losses) –
The caption “Unrealized gains (losses)” includes the net unrealized gain (loss) from available-for-
sale investments and from derivatives instruments used as cash flow hedge. The movement of
the unrealized gain (loss) during 2012 and 2011, presented net of deferred income tax is as
follows:
Unrealized gain (loss) of: ________________________________
Investment
available-for-
sale
Derivative
instruments
used as cash
flow hedge Total
S/.(000) S/.(000) S/.(000)
Balances as of December 31, 2011 427,217 15,599 442,816
Net unrealized loss from investments available-
for-sale (144,556) - (144,556)
Transfer of realized gain from investments
available-for-sale to the income statement,
net of realized loss (39,206) - (39,206)
Net unrealized loss on cash flow hedge - (25,555) (25,555)
Transfer of realized loss from cash flow hedge
to the income statement, net of realized gain - 4,924 4,924
Deferred income tax 66,629 4,764 71,393
Adjustment of deferred workers’ profit sharing
Note 3(a)(ii)(ii.b) 1,070 (1,312) (242) _________ _________ _________
Balances as of December 31, 2011 311,154 (1,580) 309,574
Net unrealized gain from investments available-
for-sale 216,352 - 216,352
Transfer of realized gain from investments
available-for-sale to the income statement,
net of realized loss (60,982) - (60,982)
Net unrealized gain on cash flow hedge - 11,084 11,084
Transfer of realized gain from cash flow hedge
to the income statement, net of realized gain - (16,087) (16,087)
Split of an equity block, Note 2(b) (23,257) - (23,257)
Deferred income tax (45,848) (1,085) (46,933) _________ _________ _________
Balances as of December 31, 2012 397,419 (7,668) 389,751 _________ _________ _________
As of December 31, 2012, the Bank and its Subsidiaries maintain a net deferred income tax
liability for S/.185.7 million, related to the unrealized gains and losses of investments available-
for-sale and cash flow hedges (S/.138.8 million, as of December 31, 2011).

Translation of consolidated financial statements originally issued in
Spanish - See Note 30
Notes to the consolidated financial statements (continued)
60
(e) Dividend distribution –
The General Shareholders Meetings held on March 30, 2012, March 21, 2011 and March 26,
2010, agreed to distribute dividends for approximately S/.588.3 million, S/.514.1 million and
S/.595.0 million, respectively.
Under current legislation, there is no restriction for overseas remittance of dividends or
repatriation of foreign investment. Individual persons and corporations not domiciled in Peru
must pay an additional tax of 4.1 percent on dividends received, which must be retained and paid
by the entity that distributes the dividends.
(f) Equity for legal purposes (Regulatory capital) –
According to Legislative Decree N°1028, regulatory capital must be equal to or more than 10
percent of total risk weighted assets and contingent operations, represented by the sum of: the
regulatory capital requirement for market risk multiplied by 10, the regulatory capital
requirement for operational risk multiplied by 10 and assets and contingent credits weighted by
credit risk. As of December 31, 2012 and 2011, the Bank maintains the following amounts
related to weighted assets and contingent credits by total risk and regulatory capital (basic and
supplementary), in millions of Nuevos Soles:
2012 2011
Total risk weighted assets and credits 60,662.81 49,557.35
Regulatory capital 8,929.25 7,201.55
Regulatory capital – basic 6,132.27 5,139.95
Regulatory capital – supplementary 2,796.97 2,061.60
Global regulatory capital ratio 14.72% 14.53%
As of December 31, 2012 and 2011, the Bank and its Subsidiaries have fulfilled the requirements
of Resolutions N°2115-2009, N°6328-2009 and N°14354-2009, Regulations for the
Requirement of Regulatory Capital by Operational Risk, Market Risk and Credit Risk Regulations,
respectively, and amendments. Those resolutions establish, mainly, the methodology to be
applied by financial entities in order to calculate assets and credits weighted for each type of risk.
On July 20, 2011, the SBS issued Resolution N°8425–2011 requiring an additional regulatory
capital, which is the summatory of each of the following components: economic cycle risk,
concentration risk, market concentration risk, interest rates risk and others. As of December 31,
2012 and 2011, in Management’s opinion, the Bank has complied with the requirements of
Resolution N°8425-2011.
Resolution SBS N°11823-2010, “Regulations on consolidated supervision of financial and mixed
conglomerates” establishes that the economic group subject to consolidation must have a
regulatory equity destined to cover the risks arising from the operations and activities of the

Translation of consolidated financial statements originally issued in
Spanish - See Note 30
Notes to the consolidated financial statements (continued)
61
bank, which shall not be lower than the minimum equity required the group subject to
consolidation. As of December 31, 2012 and 2011, the minimum requirement amounted to
US$3,367.7 million, equivalent to S/.8,587.6 million and US$2,270.3 million, equivalent to
S/.6,120.7 million, respectively. As of December 31, 2012 and 2011, the regulatory equity of
the financial group subject to consolidation amounted to US$3,660.7 million, equivalent to
S/.9,334.5 million and US$2,741.8 million, equivalent to S/.7,391.8 million, respectively.
16. Tax situation
(a) The Bank and its Subsidiaries are subject to corporate taxation on income of the country where
they are established. As of December 31, 2012 and 2011, the statutory income tax rate was 30,
25 and 33 percent on taxable income for the Subsidiaries established in Peru, Bolivia and
Colombia, respectively.
Enterprises and individuals not domiciled in Peru must pay a tax of 4.1 percent on dividends
received from enterprises domiciled in Peru.
(b) Since 2011, the Income Tax Law was amended by Law No29645, stating that interest and other
income generated by foreign loans granted to the Peruvian National Public Sector, must also be
included as an item exempted from the Income Tax.
Moreover, Law No29663, subsequently amended by Law No29757, established that are to be
considered Peruvian source income those obtained through the indirect sale of capital stock of
companies domiciled in Peru.
For that purpose, it must be considered that there is an indirect sale when capital stock or
representatives shares of capital stock of a legal entity not domiciled in Peru is sold and; at the
same time, said entity is owner, directly or through one or more entities, of capital stock or
representatives shares of capital stock of an entity domiciled in Peru, provided that certain
conditions are met. In this regard, it also defines the circumstances in which the issuer is jointly
liable.
Finally, through Law No29966, the exemption of the VAT over the interest resulting from
securities issued trough public offer by legal entities established in Peru, as long as the issuance
is made in accordance to the Securities Market Law, approved by Legislative Decree N°861, or
by the Investment Fund Law, approved N°862, was extended until December 31, 2015.

Translation of consolidated financial statements originally issued in
Spanish - See Note 30
Notes to the consolidated financial statements (continued)
62
(c) For income tax and value added tax purposes, the transfer prices agreed in transactions between
related parties and with entities located in tax havens, require the presentation of supporting
documentation and information on the valuation methods and criteria applied for the agreed
price. Based on the analysis of the Bank and its Subsidiaries operations, Management and its
internal legal advisors consider that no significant contingencies will result for the Bank and its
Subsidiaries as a consequence of the application of such provisions for fiscal year 2012 and
2011.
(d) The Peruvian Tax Authority is entitled to review and, if applicable, amend the annual income tax
returns of the Bank and its subsidiaries established in Peru up to four years after their
submission. The Bolivian and Colombian Tax Authorities are entitled to review and, if applicable,
amend the annual income tax returns of the subsidiaries located on these countries up to four
and two years, respectively, after their submission.
The income tax returns which are pending to be reviewed by the Tax Authority are the following:
Banco de Crédito del Perú 2009-2012
Banco de Crédito de Bolivia 2008-2012
Correval S.A. 2010-2012
Edyficar 2008-2012
The Peruvian Tax Authority is conducting a review of the 2008 income tax return of the Bank.
The Bolivian Tax Authority is conducting a review of the 2007 and 2008 income tax returns of
Banco de Credito de Bolivia.
Since tax regulations are subject to interpretation by the Tax Authorities it is not possible to
determine up to date whether the reviews will generate additional liabilities for the Bank and its
Subsidiaries. Therefore, any unpaid tax, penalties or interests that might result from said
reviews will be expensed in the year in which they are determined. Nevertheless, Management of
the Bank and its Subsidiaries and their legal advisors consider that any additional tax
assessments would not have a significant impact on the 2012 and 2011 consolidated financial
statements.

Translation of consolidated financial statements originally issued in
Spanish - See Note 30
Notes to the consolidated financial statements (continued)
63
17. Share-based payments
(a) Stock appreciation rights of Credicorp Ltd. -
As indicated in Note 3(p), the Bank and its Subsidiaries granted appreciation rights in the form of
options over Credicorp’s stock (SARs) to certain executives who had at least one year serving the
Group. The SARs expire up to 2014.
As of December 31, 2012 and 2011, the number of SARs issued and not exercised and their
prices are as follows:
Year of
issuance
Number
of outstanding
SARs issued as of
December 31,
2012
Number of vested SARs
as of December 31
Exercise
price _____________________________ ____________________________
2012 2011 2012 2011
US$ US$
2004 - - 40,000 7.09 8.39
2005 5,000 5,000 40,000 12.10 13.40
2006 40,000 40,000 45,000 21.42 22.72
2007 30,450 30,450 37,118 21.42 22.72
2008 32,618 32,618 49,362 21.42 22.72 _________ _________ _________
108,068 108,068 211,480
__________ __________ __________
Management has estimated the SARs’ fair value as of December 31, 2012 and 2011, using a
binomial option pricing model, with assumptions obtained from the relevant available market
information. The key assumptions used are as follows:
Key assumptions 2012 2011
Expected volatility 37.23% 39.05%
Risk free interest rate 3.08% 2.46%
Expected lifetime 1.20 years 1.68 years
Quoted price of Credicorp shares US$146.56 US$109.47

Translation of consolidated financial statements originally issued in
Spanish - See Note 30
Notes to the consolidated financial statements (continued)
64
The movements of the SAR’s for the years ended December 31, 2012 and 2011, are as follows:
2012 2011 _______________________________________ ______________________________________
Outstanding
SARs Vested SARs
Outstanding
SARs Vested SARs ___________ _______________________ ___________ _______________________
Number Number Amount Number Number Amount
S/.(000) S/.(000)
Balances as of January 1 211,480 211,480 51,498 730,719 716,662 200,332
Granted and vested - - - - 12,228 2,860
Exercised (103,412) (103,412) (33,586) (517,410) (517,410) (115,038)
Write-downs - - - (1,829) - -
Increase (decrease) in fair
value - - 16,756 - - (36,656) __________ _________ _________ __________ __________ ________
Balance as of December 31 108,068 108,068 34,668 211,480 211,480 51,498 __________ _________ _________ __________ __________ ________
As of December 31, 2012, the liability recorded for this plan and the income tax assumed by the Bank
and its Subsidiaries (equivalent to 30 percent of the amount paid) amounts to S/.34.7 million and
S/.10.4 million, respectively (S/.51.5 million and S/.15.4 million, respectively, as of December 31,
2011) which are included in “Share-base payments” and “Tax payable”, respectively, in the caption
“Other liabilities, net” of the consolidated balance sheets, see Note 9(a).
Additionally, the valuation of the plan at said date resulted in a loss, net of income tax assumed by the
Bank and its Subsidiaries amounting to S/.23.3 million (gain net of income tax for S/.34.5 million as of
December 31, 2011), which has been recorded in the caption “Salaries and employee’s benefits” of the
consolidated statements of income; Note 24.
The Bank has signed several contracts with Citigroup and Calyon by which it has acquired certificates
linked to the yield of Credicorp’s shares, Note 9(b).
(b) Payments through Credicorp shares
As indicated in Note 3(p), on March or April of each year, the Bank and its Subsidiaries grant
Credicorp shares (“stock awards”) to certain executives, which are settled through delivery of
Credicorp shares (“share-based payment plan settled in equity instruments”). Shares granted
vest 33.3 percent in each one of the subsequent three years. In order to execute the plan, at the
date the plan is communicated, all shares needed to settle the plan are purchased and legally
delivered to the beneficiaries. However, they are maintained as restricted until their vesting.

Translation of consolidated financial statements originally issued in
Spanish - See Note 30
Notes to the consolidated financial statements (continued)
65
As indicated in Note 3(p), until 2011 the expense recognized for this plan was the amount
disbursed to purchase the shares that were legally delivered to the beneficiaries, plus the related
income tax assumed by the Bank and its Subsidiaries. The expense was recorded at the moment
the shares were purchased.
For the year ended December 31, 2011, the Bank and its Subsidiaries purchased and legally
delivered 134,338 shares; the expense recorded amounted to S/.42.5 million, which is presented
in the caption “Salaries and employee benefits” of the consolidated income statement, Note 24.
In the year 2012, 108,859 shares were legally delivered, of which 55,437 vested as of
December 31, 2012. Due to the change in accounting treatment, described in Note 3(p), this
resulted in an expense of S/.24.9 million (including taxes for S/.6.0 million), which is presented in
“Salaries and employee benefits” of the consolidated income statement, Note 24.
As of December 31, 2012, the liability recorded for this plan amounts to S/.18.3 million, which is
included as "Share-based payments" in the caption "Other liabilities, net" of the consolidated
balance sheet, Note 9 (a).
Although shares were legally delivered to the beneficiaries, they remain as “restricted
investment” in the caption “Off-balance sheet accounts” of the consolidated balance sheet until
they vest and are also presented as investments available-for-sale.
18. Commitments and contingencies
(a) Commitments –
- The Bank’s Panamanian Branch maintains several agreements with a foreign related
party, CCR Inc., by which it guarantees the collection of future inflows from electronic
messages sent through the Society for Worldwide Interbank Financial Telecommunications
(“SWIFT”) to the Bank and utilized within the network to instruct correspondent banks to
make a payment of a certain amount to a beneficiary that is not a financial institution. For
these transactions the related party obtained several loans, which are secured by the
above mentioned future inflows; the amounts of the loans received are the following:
Year of issuance
Loan amount
US$ (million) Maturity
2006 – Series A 22.4 2016
2008 – Series A and B 153.3 2015
2010 – Series B 41.4 2016
2010 – Series C 279.2 2017
2010 – Series D 66.9 2014
2012 – Series A and B 149.0 2017
2012 – Series C 312.8 2022 __________
1,025.0 __________

Translation of consolidated financial statements originally issued in
Spanish - See Note 30
Notes to the consolidated financial statements (continued)
66
As of December 31, 2012 and 2011, the funds obtained by CCR Inc. were transferred to
the Panamanian branch trough loans, see Note 12(c).
- On November 2009 a contract with a foreign related party was entered into, by which it is
guaranteed, through a promissory note signed by the Bank, the payment of principal to
the holders of bonds issued in Unidades de Fomento Chilenas – UF through the Santiago de
Chile Stock Exchange, by the foreign related party. The bonds issued, named “Bonos
Desmaterializados al Portador – Serie A”, amounted to 2.7 million Unidades de Fomento
Chilenas – UF, equivalent to S/.328.6 million and S/.311.2 million as of December 31,
2012 and 2011, respectively, with maturity on October 2014, see Note 12(c).
The loans obtained and the bonds issued by the related parties include covenants which, in
Management’s opinion, have been fulfilled as of December 31, 2012 and 2011.
(b) Contingencies –
As of December 31, 2012 and 2011, the Bank and its Subsidiaries have several pending legal
claims, related to their normal course of business. According to Management and its internal
legal advisors no additional liabilities will result from these legal claims; therefore, Management
has not considered necessary to record an additional allowance for these contingencies,
Note 9(g).

Translation of consolidated financial statements originally issued in
Spanish - See Note 30
Notes to the consolidated financial statements (continued)
67
19. Off-balance sheet accounts
(a) This item is made up as follows:
2012 2011
S/.(000) S/.(000)
Contingent operations (indirect loans) (b) -
Guarantees and stand-by letters of credit 9,982,046 8,387,916
Import and export letters of credit 1,488,381 1,620,338
Due from bank acceptances 256,959 166,331 ____________ ____________
11,727,386 10,174,585
Derivative instruments, Note 9(c) -
Derivatives held for trading -
Foreign currency forward contracts on Nuevo Sol, see
Note 4:
Foreign currency purchases 6,036,249 4,840,599
Foreign currency sales 6,864,577 3,945,435
Foreign currency forward contracts on currencies, other
than Nuevo Sol 483,693 529,523
Interest rate swap contracts 2,991,020 1,860,494
Currency swap contracts, see Note 4:
Foreign currency delivery/ Nuevo Sol reception 677,753 606,732
Nuevo Sol delivery/ Foreign currency reception 510,009 187,290
Foreign currency delivery/ Foreign currency reception 241,299 -
Foreign currency options 242,985 173,040
Derivatives held as hedge -
Interest rate swap contracts 2,013,963 2,084,892
Cross currency swap contracts on Nuevo Sol, see Note 4:
Foreign currency delivery/ Nuevo Sol reception 226,923 -
Cross currency and interest rate swap contracts in respect
with Nuevo Sol, see Note 4 153,301 221,680
Cross currency swap contracts on currencies other than
Nuevo Sol 429,717 311,208 ____________ ____________
20,871,489 14,760,893
Responsibilities under credit line agreements (c) 10,210,169 9,504,383
Other contingent operations 135,093 7,358 ____________ ____________
Total contingent operations 42,944,137 34,447,219 ____________ ____________

Translation of consolidated financial statements originally issued in
Spanish - See Note 30
Notes to the consolidated financial statements (continued)
68
2012 2011
S/.(000) S/.(000)
Other Off-balance sheet accounts
Securities in custody 54,425,570 49,845,259
Guarantees received (d) 88,680,884 72,579,557
Debt instruments under collection 7,837,155 7,950,969
Securities granted as guarantees 4,414,094 3,941,592
Written-off loans 4,513,647 3,890,295
Trusts (e) 4,155,945 3,024,900
Advised letters of credit 2,879,669 2,327,657
Insurance coverage 902,359 954,024
Other 102,301,547 40,988,231 _____________ _____________
Total other off-balance sheet accounts 270,110,870 185,502,484 _____________ _____________
Total 313,055,007 219,949,703 _____________ _____________
(b) In the normal course of its business, the Bank and its Subsidiaries perform contingent operations.
These operations expose them to credit risk in addition to the amounts recognized in the
consolidated balance sheets. The Bank’s exposure to losses under commitments to extend
credit, provide export and import letters of credit and guarantees (indirect loans) is represented
by the contractual amounts specified in the related contracts.
The Bank and its Subsidiaries apply the same credit policies in making commitments and
conditional obligations as they do for on-balance sheet instruments, including the requirement to
obtain collateral to support off-balance sheet financial instruments when it is deemed necessary.
Collateral held varies, but it may include deposits held in financial institutions, securities or other
assets.
Because most of the contingent transactions are expected to expire without any performance
being required, the total committed amounts do not necessarily represent future cash
requirements.
Export and import letters of credit are mainly issued as credit enhancements for overseas trade
transactions. The related credit risk is reduced by the participation of third parties.
Due from bank on acceptances represent collection rights for the Bank and it’s Subsidiaries that
arise at the time of negotiation of the letters of credit; a collection right from the local importer
(in the case of imports) or a collection right from the correspondent bank (in the case of exports).

Translation of consolidated financial statements originally issued in
Spanish - See Note 30
Notes to the consolidated financial statements (continued)
69
(c) Responsibilities under credit lines agreements do not correspond to commitments to grant
credits and include lines of credit of consumer credit, micro-business, small business, medium
business and corporate, that are cancellable upon notification to the client.
(d) The balance of the caption “Guarantees received” is stated at the amounts of the guarantee
agreed as of the date of the loan contract. This balance does not necessarily represent the
market value of guarantees received by the Bank and its Subsidiaries.
(e) The Bank and its Subsidiaries provide custody, trust, corporate administration, investment
management (asset management) and consulting services to third parties and, mutual funds and
asset securitization‘s management, which imply that the Bank and its Subsidiaries are involved in
decisions over consignation (distribution), and the purchase and sale of these products. Assets
kept as trust are not included in the accompanying consolidated financial statements.
20. Financial income and expenses
These items are made up as follows:
2012 2011
S/.(000) S/.(000)
Financial income
Interest from loan portfolio 4,998,967 4,109,775
Interest from trading, available-for-sale and held-to-maturity
investments, net 431,980 345,793
Interest from cash and due from banks and inter-bank funds 103,298 115,700
Net fluctuation from derivative financial instruments position –
swaps 56,040 45,355
Commissions on loan portfolio and other transactions 23,998 41,389
Other 5,906 29,272 __________ __________
5,620,189 4,687,284 __________ __________
Financial expenses
Interest and commissions on deposits and obligations (622,448) (511,006)
Interest on bonds and subordinated notes issued (572,929) (468,956)
Interest on due to banks and correspondents and other entities (350,653) (321,510)
Deposit Insurance Fund fee (79,831) (67,891)
Net result from hedging derivatives instruments (16,087) (21,080)
Net fluctuation from derivative financial instruments position –
forwards and options (24,166) (499)
Other (33,218) (38,318) __________ __________
(1,699,332) (1,429,260) __________ __________
Gross financial margin 3,920,857 3,258,024 __________ __________
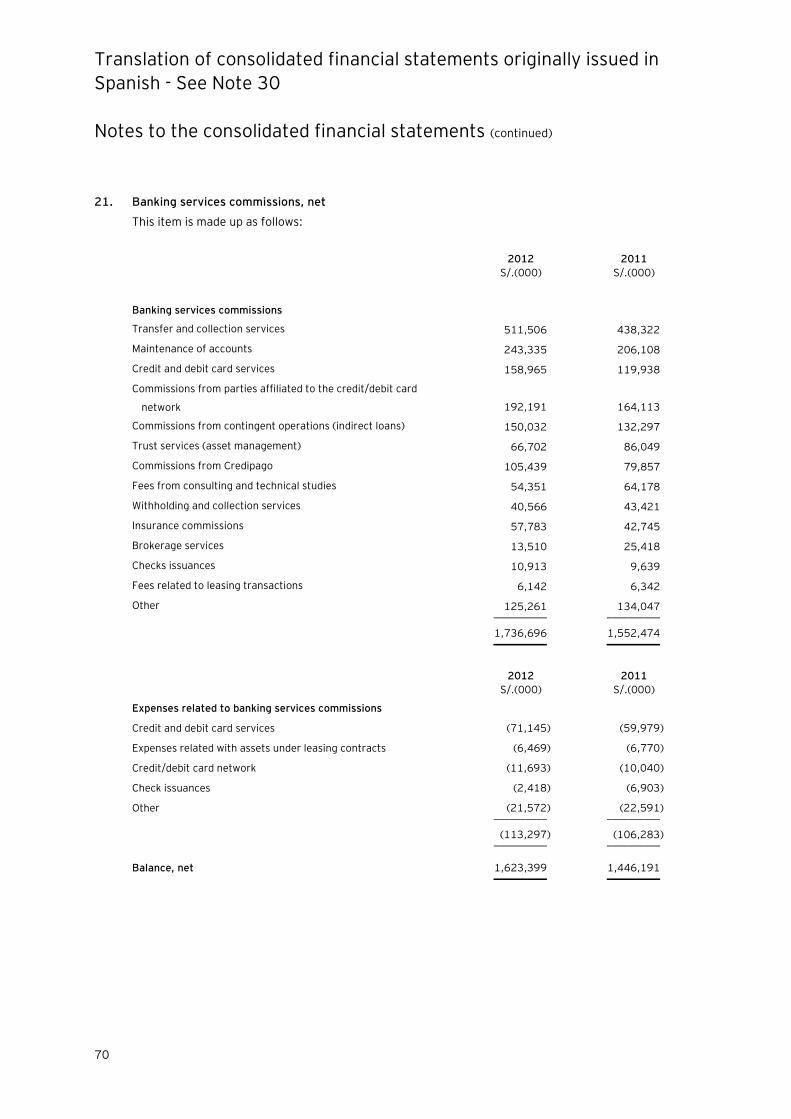
Translation of consolidated financial statements originally issued in
Spanish - See Note 30
Notes to the consolidated financial statements (continued)
70
21. Banking services commissions, net
This item is made up as follows:
2012 2011
S/.(000) S/.(000)
Banking services commissions
Transfer and collection services 511,506 438,322
Maintenance of accounts 243,335 206,108
Credit and debit card services 158,965 119,938
Commissions from parties affiliated to the credit/debit card
network 192,191 164,113
Commissions from contingent operations (indirect loans) 150,032 132,297
Trust services (asset management) 66,702 86,049
Commissions from Credipago 105,439 79,857
Fees from consulting and technical studies 54,351 64,178
Withholding and collection services 40,566 43,421
Insurance commissions 57,783 42,745
Brokerage services 13,510 25,418
Checks issuances 10,913 9,639
Fees related to leasing transactions 6,142 6,342
Other 125,261 134,047 __________ __________
1,736,696 1,552,474 __________ __________
2012 2011
S/.(000) S/.(000)
Expenses related to banking services commissions
Credit and debit card services (71,145) (59,979)
Expenses related with assets under leasing contracts (6,469) (6,770)
Credit/debit card network (11,693) (10,040)
Check issuances (2,418) (6,903)
Other (21,572) (22,591) __________ __________
(113,297) (106,283) __________ __________
Balance, net 1,623,399 1,446,191 __________ __________

Translation of consolidated financial statements originally issued in
Spanish - See Note 30
Notes to the consolidated financial statements (continued)
71
22. Net gain on securities
This item is made up as follows:
2012 2011
S/.(000) S/.(000)
Net gain from purchase and sale of securities 60,982 40,761
Participation in income of investments in associates 11,084 14,142
Net gain from valuation of investments at fair value through
profit or loss (trading) 29,887 7,723
Other, net 1,963 (944) ________ ________
Total 104,636 61,682 ________ ________
23. Other non-financial income and other operating expenses
These items are made up as follows:
2012 2011
S/.(000) S/.(000)
Other non-financial income
Recoveries of loans previously written-off 108,211 96,958
Net gain from sales of seized assets 8,243 12,950
Recovery of previous years interest and allowances 6,940 7,559
Gain from indexed certificates, Note 9(b) 30,236 -
Other 65,251 59,733 _________ _________
Total 218,881 177,200 _________ _________
Other operating expenses
Loss from indexed certificates, Note 9(b) - (50,318)
Provision for legal claims (24,801) (21,804)
Provision for uncollectable receivables (14,489) (14,703)
Maintenance of seized assets (1,514) (1,276)
Provision for sundry risks (362) (314)
Other (23,904) (10,166) _________ _________
Total (65,070) (98,581) _________ _________

Translation of consolidated financial statements originally issued in
Spanish - See Note 30
Notes to the consolidated financial statements (continued)
72
24. Salaries and employees’ benefits
This item is made up as follows:
2012 2011
S/.(000) S/.(000)
Salaries 747,455 651,610
Vacations, medical assistance and others 310,245 231,452
Employees’ bonds 125,668 118,204
Legal gratifications 135,571 117,667
Workers’ profit sharing 93,944 88,105
Social security 93,564 80,734
Severance indemnities 72,125 62,144
Share-based payment plans
Shares (second plan), Note 17(b) 24,855 42,455
SARs (first plan), Note 17(b) 23,336 (34,517) __________ __________
Total 1,626,763 1,357,854 __________ __________
Number of employees 22,330 18,616 __________ __________

Translation of consolidated financial statements originally issued in
Spanish - See Note 30
Notes to the consolidated financial statements (continued)
73
25. Earnings per share
As of December 31, 2012, 2011 and 2010, the weighted average of outstanding shares was calculated
as follows:
Outstanding
shares
Shares for the
calculation
Effective days
before year
end
Weighted
outstanding
average of
shares
(in thousands) (in thousands) (in thousands)
2010
Balances as of January 1, 2010 2,228,288 2,228,288 365 2,228,288
Capitalization of income in 2010 329,450 329,450 365 329,450
Capitalization of income in 2012 - 630,159 365 630,159 __________ __________ __________
Balances as of December 31, 2010 2,557,738 3,187,897 3,187,897 __________ __________ __________
2011
Balances as of January 1, 2011 2,557,738 2,557,738 365 2,557,738
Capitalization of income in 2012 - 630,159 365 630,159 __________ __________ __________
Balances as of December 31, 2011 2,557,738 3,187,897 3,187,897 __________ __________ __________
2012
Balances as of January 1, 2012 2,557,738 2,557,738 365 2,557,738
Capitalization of income in 2012 630,159 630,159 365 630,159
Reduction due to split of an equity block,
Note 2(b) (85,000) (85,000) 61 (14,205) __________ __________ __________
Balances as of December 31, 2012 3,102,897 3,102,897 3,173,692 __________ __________ __________
26. Risk Assessment
The Bank and its Subsidiaries’ activities are mainly related to the use of financial instruments including
derivatives. The Bank and its Subsidiaries accept deposits from their customers at both fixed and
floating rates and with different terms, with the intention of obtaining profit from interest margins by
investing those funds in high-quality assets.
The Bank and its Subsidiaries seek to increase these margins by consolidating its short-term funds and
lending at longer periods at higher rates, while maintaining sufficient liquidity to comply with any
withdrawals that may be made.

Translation of consolidated financial statements originally issued in
Spanish - See Note 30
Notes to the consolidated financial statements (continued)
74
The Bank and its Subsidiaries seek to raise its interest margins by obtaining above average margins, net
of provisions, through lending to commercial and retail borrowers with a range of credit standings. The
exposure not only includes loans and non-contingent advances but also any other indirect loans, such as
credit letters and stand-by letters of credit.
The Bank and its Subsidiaries also trade financial instruments in the stock and over-the-counter
markets, including derivative financial instruments, for benefiting from the short term movements in
market values of financial instruments, and the fluctuations of exchange and interest rates.
Management establishes limits to the Group’s exposure to market positions for daily and overnight
operations. The exposure to exchange and interest rates related to these operations is normally offset
and controlled through the fluctuations in the net cash amounts required to settle market positions.
Market risks -
The Bank and its Subsidiaries are exposed to market risk, which is the risk that the fair value or future
cash flow of a financial instrument will fluctuate because of changes in market prices. Market risks arise
from open positions in interest rates, currency, commodities and equity products; all of which are
exposed to general and specific market movements and changes in the level of volatility of prices such
as interest rates, exchange rates and equity prices. Due to the nature of the Bank and its Subsidiaries
current activities, commodity price risk is not applicable.
The Bank and its Subsidiaries separate exposures to market risk into two groups: (i) those that arise
from value fluctuation of trading portfolios due to movements of market rates or prices (Trading Book)
and (ii) those that arise from changes in the structural positions of non-trading portfolios due to
movements of the interest rates, prices and exchange ratios (ALM Book).
Trading portfolios includes those liquid positions arising from market-making transactions where the
Bank and its Subsidiaries act as principal with clients or with the market. Non-trading portfolios include:
(a) relatively illiquid positions, mainly banking assets and liabilities (deposits and loans) and; (b) non-
trading investments (available-for-sale).
The risks that trading portfolios face is managed through Value at Risk (VaR) historical simulation
techniques; while non-trading portfolios are managed using Asset Liability Management (ALM)
techniques.
The daily market Value at Risk (VaR) is an estimate of the maximum potential loss that might arise if
current positions were to be held unchanged for one trading session, taking into account a specific
confidence level. The measurement is structured so that daily losses exceeding the VaR occur, on
average, not more than one trading sessions out of one hundred. Actual outcomes are monitored
regularly to test the validity of the assumptions and parameters used in the VaR calculation.

Translation of consolidated financial statements originally issued in
Spanish - See Note 30
Notes to the consolidated financial statements (continued)
75
Management of the risks associated with long-term and structural positions is called Asset and Liability
Management (ALM). Non-trading portfolios are exposed to different sensitivities that can generate a
deterioration in the value of the assets compared to its liabilities and hence to a reduction of its net
worth. The sensitivities to which the portfolio is exposed are of interest rate and exchange rate type, and
management of re-pricing gaps.
In addition, the subsidiary Correval has made short sales with debt instruments which have maturities of
up to 1 month. Minimal fluctuations are expected to affect the prices of short sales, independently of
those derived from interest rate risk or credit risk. Consequently, the Bank and its Subsidiaries are not
subject to significant risk in the price of these transactions.
Liquidity risk -
The Bank and its Subsidiaries are exposed to daily calls on its available cash resources from overnight
deposits, current account, maturing deposits, loans drawdown, guarantees and other. The Bank and its
Subsidiaries do not maintain cash resources to meet all of these needs, because experience shows that a
minimum level of reinvestment of maturity funds can be predicted with high level of certainty. The Bank
and its Subsidiaries’ Management sets limits on the minimum proportion of funds available to meet such
calls and the minimum level of interbank and other borrowing facilities that should be in place to cover
withdrawals at unexpected levels of demands.
The matching and controlled mismatching of the maturities and interest rates of assets and liabilities is
fundamental to the Bank and its Subsidiaries Management. It is unusual for banks to be completely
matched, as transacted business if often based on uncertain terms and of different types. An
unmatched position potentially enhances profitability, but also increases the risk of losses.
The maturities of assets and liabilities and the ability to replace, at an acceptable cost, interest-bearing
liabilities as they mature are important factors in assessing the Group’s liquidity and its exposure to
changes in interest and exchange rates.
Liquidity requirements to support calls under guarantees and standby letters of credit are considerably
lower than the committed amount, because the Bank and its Subsidiaries do not expect the third party
do not comply with their agreement. The total outstanding contractual amount of commitments to
extend credit not necessarily represents future cash requirements, as many of these commitments will
expire without being funded.
The notes to the consolidated financial statements include an analysis of the Bank and its Subsidiaries’
main assets and liabilities by maturity, based on contractual maturity dates.
Translation of consolidated financial statements originally issued in
Spanish - See Note 30
Notes to the consolidated financial statements (continued)
76
Interest rate risk -
The Bank and its Subsidiaries are exposed to the effect of fluctuations in the prevailing levels of market
interest rates on both its fair value and cash flow risks. Interests margins may increase as a result of
such changes, but may reduce or create losses in case of unexpected movements. Management of the
Bank and its Subsidiaries sets limits on the level of mismatch of interest rate repricing that may be
undertaken, which is monitored periodically.
Loans, investments, customer deposits and other financing instruments are subject to risk derived from
interest rate fluctuations. The relevant contract maturity characteristics and interest rates of such
financial instruments are disclosed in Notes 6, 7, 11, 12 and 13. The Bank and its Subsidiaries use
derivative financial instruments to hedge the risk of fluctuations in interest rates, see Note 9(c).
Currency risk -
The Bank and its Subsidiaries are exposed to effects of fluctuations in the prevailing foreign currency
exchange rates on its financial position and cash flows. Management sets limits on the level of exposure
by currency and in total for both overnight and intra-day positions, which are monitored daily.
Most assets and liabilities are maintained in Nuevos Soles and U.S. Dollars. Foreign currency
transactions are made at the free market exchange rates of the countries where the Bank and its
Subsidiaries are established. As of December 31, 2012 and 2011, the Bank and its Subsidiaries’ assets
and liabilities by currencies are shown in Note 4. Likewise, as indicated in Note 9(c), the Bank and its
Subsidiaries have used derivative financial instruments to partially hedge this risk, considering
Credicorp Ltd. functional currency.
Credit risk -
The Bank and its Subsidiaries are exposed to credit risk, which is the risk that the counterparty is unable
to pay amounts in full when due. The Bank and its Subsidiaries provide impairment provisions for losses
that have been incurred at the consolidated balance sheet date. Significant changes in the economy or
in a particular industry segment, that represents a concentration in the Bank and its Subsidiaries’
portfolio, could result in losses that are different from those provided for at the consolidated balance
sheet date. Therefore, Management manages its exposure to credit risk carefully.

Translation of consolidated financial statements originally issued in
Spanish - See Note 30
Notes to the consolidated financial statements (continued)
77
The Bank and its Subsidiaries structure the levels of credit risk that they undertake by placing limits on
the amount of risk accepted in relation to one borrower or one group of borrowers, and to geographical
and industry segments. Such risks are monitored on a revolving basis and subject to an annual or more
frequent review. Limits in the level of credit risk by product, industry sector and by country are
approved by the Board of Directors.
Exposure to credit risk is managed through regular analyses of the ability of borrowers and potential
borrowers to meet interest and capital repayment obligations and by changing these lending limits when
appropriate.
Exposure to credit risk is also managed, in part, by corporate and personal guarantees, which is a
common practice. The Bank and its Subsidiaries implement policies on the acceptability of specific
classes of collateral or credit risk mitigation. For loans and advances, collaterals include, among other,
mortgages over residential properties, liens over business assets such as premises, inventory and
accounts receivable, as well as charges for financial instruments as securities for debt and equity
securities. Also, loans and long-term financing to corporate entities are generally secured.
Moreover, personal credit lines and loans to microbusiness generally are not guaranteed.
In the case of repurchase agreements and securities lending, they are secured by debt instruments and
equity instruments.
Furthermore, in order to minimize credit losses, the Bank requires additional guarantees, as soon as
counterparty impairment indicators are observed.
For credit risk management in repurchase agreements and securities lending, which are made primarily
by Correval, credit limits for each counterparty have been placed; also, most transactions are secured
with investment grade financial instruments issued by the Colombian Government and by Colombian
entities.
As of December 2012 and 2011, Management of the Bank and its Subsidiaries have estimated that their
maximum exposure to credit risk is represented by the book value of the financial assets that presents
credit risk, which comprise, mainly, deposits in banks, trading securities, investments available-for-sale,
investments at fair value through profit or loss, investments held-to-maturity, payables from repurchase
agreements and security lending, financial instruments at fair value, loans and indirect loans, without
considering the fair value of the guarantees and collaterals received. The exposure to each borrower,
including banks, is further restructured by sub-limits covering on and off balance sheet exposures, and
daily delivery risk limits to trading items such as forward foreign exchange contracts. Real exposures
compared against established limits are monitored daily.

Translation of consolidated financial statements originally issued in
Spanish - See Note 30
Notes to the consolidated financial statements (continued)
78
27. Fair value
Fair value is defined as the amount for which an asset could be exchanged or a liability settled, between
knowledgeable, willing parties in an arm’s length transaction, on an on-going basis.
When a financial instrument is traded in an active and liquid market, its quoted market price in an actual
transaction provides the best evidence of its fair value. When a quoted market price is not available, or
may not be indicative of the fair value of the instrument, to determine such fair value, the current
market value of another instrument that is substantially similar, discounted cash flow analysis or other
estimation techniques may be used, all of which are significantly affected by assumptions used.
Although Management uses its best judgment in estimating the fair value of these financial instruments,
there are inherent weaknesses in any estimation technique. As a result, the estimated fair value may
not be indicative of the net realizable or liquidation value.
The methodologies and assumptions used to determine fair value depend on the terms and risk
characteristics of the various financial instruments and include the following:
- Cash and due from banks represent cash and short-term deposits that do not represent
significant credit or interest risks; in consequence, their book value is equivalent to their fair
value.
- Available for sale and fair value through profit or loss investments are recorded at their
estimated fair value; in consequence, their book and fair values are the same.
- The fair value of investments held-to-maturity, which are recorded in the Bank's consolidated
financial statements at amortized cost, was determined by comparing the market interest rates
at the time of initial recognition with current market rates for similar financial instruments, and is
presented in Note 6(l).
- Loans fair value is similar to its book value because loans are mainly short-termed and/or accrue
interest rates that can be readjusted when market conditions change; and are presented net of
their respective allowance for loan losses. The net amounts are considered by Management as
the approximate recoverable amounts at the dates of the consolidated financial statements.
- Management considers that the book values of investments in associates approximates to their
fair value, because most of them are not listed securities and are recorded at their equity value.
- The repurchase agreements correspond to financial assets and liabilities which most of them
generate interests at variable rates, so it is considered that book values do not differ significantly
to their respective fair values.
Translation of consolidated financial statements originally issued in
Spanish - See Note 30
Notes to the consolidated financial statements (continued)
79
- Financial instruments at fair value and derivative financial instruments, included in the caption
“Other assets, net” and “Other liabilities, net” are recorded at their estimated fair value.
- The fair value of deposits and obligations is similar to its book value due, mainly, to their current
maturities and interest rates, which are comparable to other similar liabilities in the market at the
dates of the consolidated balance sheets.
- Due to banks and correspondents generate interest contracted at variable interest rates and/or
preferred rates similar to the ones prevailing in the market. As a result, it is considered that their
book value does not differ significantly from their fair value.
- Bonds and subordinated notes accrue interest at fixed or variable rates. Their fair value has been
estimated using discounted cash flows at rates prevailing in the market for liabilities with similar
characteristics; the estimated fair value approximates the book value as of the consolidated
balance sheets dates.
- As disclosed in Note 19, the Bank and its Subsidiaries have several commitments to extend loans,
open documentary credits and outstanding guarantees and it has received guarantees as
endorsement of the granted loans. Based on the level of fees currently charged for granting
such commitments and open documentary credits; taking into account maturity and interest
rates, together with the present creditworthiness of the counterparties, the Bank and its
Subsidiaries have estimated that the difference between the book value and the fair value is not
significant.
Following the considerations detailed above, as of December 31, 2012 and 2011, Management
considers that the estimated fair values of the Bank and its Subsidiaries financial instruments do not
differ significantly from their book value.

Translation of consolidated financial statements originally issued in
Spanish - See Note 30
Notes to the consolidated financial statements (continued)
80
28. Financial information by geographical area
As of December 31, 2012 and 2011, segment information by geographical area is as follows (amounts expressed in millions of Nuevos Soles):
2012 2011 _________________________________________________________________________________ ____________________________________________________________________________________
Total
income (*)
Gross financial
margin
Depreciation
and
amortization
Property,
furniture and
equipment, net Total assets
Total
income (*)
Gross financial
margin
Depreciation
and
amortization
Property,
furniture and
equipment, net Total assets
Peru 7,018 3,714 264 1,202 73,904 5,841 3,061 237 1,098 56,717
Panama 649 71 - - 11,730 645 80 - - 11,233
Bolivia 268 131 10 35 3,589 245 98 12 38 3,208
United States of America 24 13 - - 1,174 21 19 - - 930 ______ ______ ______ ______ _______ ______ ______ ______ ______ _______
7,959 3,929 274 1,237 90,397 6,752 3,258 249 1,136 72,088 ______ ______ ______ ______ _______ ______ ______ ______ ______ ____-__
(*) Includes the total financial and non-financial income.
Due to the transfer process explained in Note 2(a), the financial information of the Colombian geographical segment is presented in Note 10.

Translation of consolidated financial statements originally issued in
Spanish - See Note 30
Notes to the consolidated financial statements (continued)
81
29. Transactions with related parties
(a) During the years 2012 and 2011, the Bank and its Subsidiaries have acquired bonds, granted
loans, supplied and received several services, correspondent relationships and other operations
with Credicorp’ Subsidiaries, which balances are shown below:
2012 2011
S/.(000) S/.(000)
Assets -
Cash and due from banks 28,475 25,851
Loans, net 100,932 84,374
Investments available-for-sale (Credicorp’ shares) Note 6(a)
and 17(b) 36,192 -
Other assets 32,376 55,897
Liabilities -
Deposits and obligations 477,118 436,030
Due to banks, correspondents and other entities 3,079,127 2,550,869
Bonds and subordinated notes issued 210,853 240,050
Other liabilities 22,843 13,317
Off-balance sheet
Contingent operations 143,130 82,194
Other off-balance sheet accounts 880,489 1,010,005
Income -
Financial income 5,584 9,125
Financial expenses 149,332 185,249
Other income 167,477 109,143
Other expenses 50,756 44,657
Loans and other contingent credits (indirect loans) with related entities, not Credicorp’s
Subsidiaries, are as follows:
2012 2011
S/.(000) S/.(000)
Direct loans 1,143,299 695,806
Indirect loans 134,018 104,947
Derivatives, market value 4,673 4,020
Deposits 605,906 194,824

Translation of consolidated financial statements originally issued in
Spanish - See Note 30
Notes to the consolidated financial statements (continued)
82
Likewise, as of December 31, 2012 and 2011, the Bank and its Subsidiaries hold debt or equity
instruments, presented as investments available-for-sale and investments at fair value through
profit or loss, issued by related entities for an amount of S/.4.5 million and S/.7.7 million,
respectively.
The Bank has contracted insurance coverage with El Pacífico-Peruano Suiza Compañia de
Seguros y Reaseguros (PPS), a Credicorp subsidiary; the related premiums amounted to S/.52.2
million in 2012 (S/.60.3 million in 2011); the accrued part is recorded in the caption
“Administrative expenses” of the consolidated statements of income.
The Bank receives fees from Pacífico Vida S.A, a Credicorp subsidiary, for selling life insurance
coverage through its offices to customers who have saving accounts; fees received amounted to
approximately S/.8.2 million and S/.7.8 million in 2012 and 2011, respectively.
According to Peruvian legislation, loans to related parties cannot be granted on terms more
favorable than those that would have been offered to the general public. Management considers
that the Group has complied with all legal requirements for transactions with related parties.
Loans granted to related parties are secured by guarantees and collaterals. Loans granted to
related parties as of December 31, 2012, have maturities between January 2013 and August
2022 and accrued interest at interest rates that ranged between 1.3 and 35.7 percent
(maturities between January 2012 and October 2019 and interest rates between 1.3 and 39.7
percent, as of December 31, 2011). As of December 31, 2012 and 2011, the Bank and its
Subsidiaries have an allowance for loans granted to related parties for S/.1.8 million and S/.4.0
million, respectively.
(b) As of December 31, 2012 and 2011, the Group has participations quotas in several mutual funds
managed by Credifondos, the detail is the following:
2012 2011
S/.(000) S/.(000)
Trading and available-for-sale investments -
- Mutual funds - Credifondo U.S. Dollars 39,942 130,072
- Mutual funds - Credifondo Bolivianos 10,840 15,613
- Mutual funds - Credifondo Nuevos Soles - 15,125 _________ _________
Total 50,782 160,810 _________ _________

Translation of consolidated financial statements originally issued in
Spanish - See Note 30
Notes to the consolidated financial statements (continued)
83
(c) Loans to employees and their families -
The Bank and its Subsidiaries grant loans to their employees and families in terms that depend on
the different types of loans granted to third parties. Loans granted to employees and their
families are mainly mortgage loans and are included under the caption “Loans, net” of the
consolidated balance sheets. Generally, interest rates applied are lower than market interests
rates; however, others terms are similar to those prevailing in the market. As of December 31,
2012 and 2011, the balance of loans and other facilities granted to employees, family members,
directors and key executives of the Bank and its Subsidiaries amounted to S/.628.5 million and
S/.475.3 million, respectively.
(d) The Bank’s key executive’s compensation for the years 2012 and 2011, considering all payments
made, is as follows:
2012 2011
S/.(000) S/.(000)
Salaries 15,068 18,364
Directors compensation 4,171 4,338 ________ ________
Total 19,239 22,702 ________ ________
Also, key executives compensation includes share based payments as explained in more detail in
Note 17. SARs valuation for the years 2012 and 2011 resulted in a loss of S/.14.1 million and a
gain of S/.16.1 million, respectively. During said years approximately S/.23.3 million and S/.69.6
million SARs were executed, corresponding to SARs vested in previous years and up to April
2011. Additionally, S/.11.7 million and S/. 12.1 million, stock awards vested in the years 2012
and 2011, respectively. The related income tax is assumed by the Bank and its Subsidiaries.
30. Explanation added for translation into English
The accompanying translated consolidated financial statements were originally issued in Spanish and
are presented on the basis of accounting principles generally accepted in Peru for financial entities, as
described in Note 3. Certain accounting practices applied by the Bank and its Subsidiaries that conform
to generally accepted accounting principles in Peru for financial entities may not conform in a significant
manner with generally accepted accounting principles applied in other countries. In the event of a
discrepancy, the Spanish language version prevails.

Ernst & Young
Assurance | Tax | Transactions | Advisory
Acerca de Ernst & Young Ernst & Young es líder global en auditoría, impuestos, transacciones y servicios de asesoría. Cuenta con aproximadamente 800 profesionales en el Perú como parte de sus 167,000 profesionales alrededor del mundo, quienes comparten los mismos valores y un firme compromiso con la calidad. Marcamos la diferencia ayudando a nuestra gente, clientes y comunidades a alcanzar su potencial. Puede encontrar información adicional sobre Ernst & Young en www.ey.com
© 2012 Ernst & Young.
All Rights Reserved. Ernst & Young is a registered trademark.