Embed Size (px)
Citation preview

Chapter 13
Improvement of Yield per se in SugarcaneM. Gouy, S. Nibouche, J.Y. Hoarau, and L. Costet
Abstract
Sugarcane is the main source of sucrose in the world and has also become one of the main sourcesof renewable energy, thanks to ethanol and electricity production. The main objectives of breedingprograms are improving cane biomass and qualities. The genetics of current sugarcane cultivars(Saccharum spp.) are extremely complex, owing to a high polyploid genome of 10 to 12 homeologouschromosome sets, resulting from the interspecific origin of two polyploid ancestral genomes. A centuryof breeding efforts based on elite domesticated progenitors improved by wild introgressions has helpedbuild one of the most productive biomass crops. However, in recent decades the percentage increasein annual sugarcane yield has been lower than in other crops. Until now, cultivar improvement hasrelied on traditional breeding programs that require 12 to 15 years of expensive field evaluations. Thisarticle discusses the most recent advances in genomics applications to support traditional breeding.In the past two decades, efforts have been made to construct genetic maps, study quantitative traitloci (QTL), and start association mapping studies. Today, genomic selection (GS) approaches toselect individuals for advancement in the breeding process is believed to be appropriate for complextraits such as yield, thanks to improved estimates of marker effects combined with a better graspof small-effect QTLs. GS is particularly attractive in the highly polyploid context of sugarcane,where the nature of yield genetic determinism is presumably highly quantitative. Frequent genotype xenvironment interactions add to the challenges associated with QTL detection. The focus in thisarticle is on research areas that are likely to result in concrete improvements through advancing theincorporation of association genetics-based approaches. A strategy to design a breeder-friendly markersystem is also presented. Plant growth modeling could provide sounder ecophysiological parametersfor describing the complex biological process underlying yield and sucrose elaboration. Such modelscould overcome traditional problems caused by G x E interactions and consequently improve bothQTL detection and GS approaches.
Introduction
Sugarcane is a giant perennial grass two to fourmeters in height that is propagated clonally
using stem cuttings. Sugarcane is cultivatedwith one plant crop and several ratoon crops,each about 12 months in length after an annual
Translational Genomics for Crop Breeding, Volume II: Abiotic Stress, Yield and Quality.Edited by Rajeev K. Varshney and Roberto Tuberosa.C© 2013 John Wiley & Sons, Inc. Published 2013 by John Wiley & Sons, Inc.
211

212 TRANSLATIONAL GENOMICS FOR CROP BREEDING
harvest. Sugarcane combines a high polyploidy,a heterozygous genome, and C4 photosyntheticmetabolism, making it one of the most efficientconverters of light into chemical energy. Sug-arcane is an important cash crop in tropical andsubtropical areas and is grown in about 100countries (FAOSTAT 2012). It is mainly grownfor the production of sucrose, which accumulatesat high concentrations in the stem, and the veryhigh productivity of this crop makes it one of themost economically attractive crops for the pro-duction of energy from biomass (Waclawovskyet al. 2010). Apart from sucrose, many by- or co-products (bagasse, molasses, bioethanol, mud)used for a wide range of industrial applications(livestock feed, energy or paper production,bio-fertilization, bio-refinery, particleboard,etc.) can also be obtained from sugarcane. In2010, more than 23 million hectares of sugar-cane were harvested worldwide, ranking only12th in crop harvested area, far behind wheat(217 million hectares), maize (161 millionhectares), and rice (153 million hectares).However sugarcane was by far the most har-vested and processed product in the world,with 1.7 billion tons of cane harvested andmore than 133.6 million tons of sucrose and54 million tons of molasses produced (FAO-STAT 2012). Sugarcane is the main sourceof sucrose worldwide, representing more than75% of world production. After maize, it is thesecond largest source of sugar-based bioethanol(first generation bioethanol), with more than26 billion liters produced. Bioethanol is mainlyproduced in Brazil where more than half thearea under cane is dedicated to it (Dal-Biancoet al. 2011). In Brazil, sugar-based ethanoland bagasse-based electricity produced fromsugarcane together represent 17% of nationalenergy consumption, which makes sugarcaneone of the main sources of renewable energyand one of the main alternatives to fossilfuel (Brazilian Ministerio de Minas e Energia2011; Matsuoka et al. 2009). Leaving aside thecontroversy about the social and environmentalcosts of converting land to grow biofuel crops
(De Araujo and Moura 2011; Duailibe 2010;Walker 2009), sugarcane is arguably one of thebest crops for biofuel production in terms ofnet energy value (NEV), when considering allresource inputs (Garoma et al. 2011). Moreover,NEV is expected to increase with the develop-ment of cellulosic ethanol (second-generationbioethanol) (Dias et al. 2011a; Dias et al.2011b), since the lignocellulosic fraction ofsugarcane is estimated to represent 50% of itsenergy potential (Botha 2009; Manners 2011).In favorable agro-climatic zones, sugarcanefresh biomass frequently exceeds 100 tons ofcane/ha/year using ordinary fertilization inputlevels. This outstanding biomass production,combined with the development of cellulosicethanol and genetic transformation technolo-gies, means sugarcane will play a major roleamong industrial plants in meeting the demandfor sugar, renewable energy, and bio-products(Figure 13.1) (Arruda 2011).
Currently increased yield is the main objec-tive of sugarcane genetic improvement. Untilnow, sucrose yield per unit area was the maingoal of sugarcane breeders since this parameteris the most closely correlated with both farmers’and industrial incomes (Jackson 2005). Howeverbreeding either for both sucrose and biomassor for only biomass, as already suggested byAlexander (1985), is clearly one of the new rea-sons for cultivating sugarcane, given the urgentneed to reduce the consumption of fossil fuels.Depending on industrial applications, breedingobjectives can be summarized in three sugar-cane ideotypes: the traditional “sugar” ideotypebred for sugar (∼13% sugar, ∼12% fiber); the“energy cane type I,” bred for both sugar (∼13%)and fiber (∼17%); and the “energy cane type II,”bred only for fiber (∼5% sugar, ∼30% fiber) pro-duction (Tew and Cobill 2008). Sugarcane yielddepends on two key components: the quantity ofbiomass and the quality of the dry matter (DM).The quantity of cane biomass depends on agro-morphological traits related to plant architec-ture (tillering, stalk height, and diameter), whichare usually significantly genetically correlated

IMPROVEMENT OF YIELD PER SE IN SUGARCANE 213
Fig. 13.1. Current and future prospects for the sugarcane industry in Brazil (according to Arruda2011; with kind permission from Springer Science and Business Media). For a color version ofthis figure, please refer to the color plate.
(Gravois and Milligan 1992; Jackson 1994; Kanget al. 1989). Cane DM quality can be assessedbased on its soluble and insoluble fractions. Inthe soluble fraction (cane juice), DM is esti-mated by measuring pol (sucrose content) andbrix (total soluble DM) content. The brix:polratio determines the purity of industrial juice.Combined with fiber content (insoluble DM),this information allows for estimation of the per-centage of sucrose content per fresh cane weightand finally the sugar yield per unit area.
Significant increases in yield have beenobtained by classical breeding. The averageworldwide yield of fresh cane increased by 41%over the last 50 years, from 50 tons per hectare in1961 to 71 tons per hectare in 2010 (Figure 13.2)(FAOSTAT 2012). This increase is the combinedresult of genetic progress and improved agro-nomic practices (irrigation, fertilization, etc.). Interms of relative value (+41%), the gain in sug-arcane yield over the same period was half that ofsugar beet and silage maize and about a quarter of
that of grain crops such as maize, rice, and wheat.However the gain in terms of absolute value(+ 0.43 tons/ha/year) reveals a parallel evolu-tion between sugarcane and sugar beet or silagemaize. In the sugar industry of Barbados (Sim-monds 1979) and Louisiana (Edme et al. 2005),in recent decades, an average of 1% annualincrease in yield can be attributed to geneticprogress. Genetic gain for sugarcane yield is gen-erally explained by an increase in biomass yieldrather than an increase in sugar content (Jackson2005; Kang et al. 1983), although some improve-ments in sucrose content may have been made insome areas such as Louisiana (Lingle et al. 2010;Lingle et al. 2009). Although significant regularincreases in yield have been obtained throughconventional breeding, sugarcane still appears tobe far from achieving its theoretical agronomicpotential (Waclawovsky et al. 2010).
The demand for sugarcane for the produc-tion of sucrose and ethanol along with all itsvaluable co-products will increase with the

214 TRANSLATIONAL GENOMICS FOR CROP BREEDING
Fig. 13.2. Changes in sugarcane yield between 1961 and 2010. Comparison with other grass crops(FAOSTAT 2012). For a color version of this figure, please refer to the color plate.
growing world population (Anonymous 2012).These increasing demands will stimulate newscientific research investments to improve theefficiency of varietal development programs.Using conventional experimental approaches,breeding new sugarcane cultivars requires atleast 10 to 15 years of selection. In the past twodecades, much research has been dedicated todeveloping genomic tools that have improvedour understanding of the genetic and genomicorganization of sugarcane with the aim of facili-tating varietal development. However, today thedirect use of these tools in breeding remainschallenging. Few applications derived from thesegenomic data have been implemented in sugar-cane breeding programs and improved yields.The main reasons for these few applicationscould be the polygenic nature of yield controlassociated with the high complexity of the sug-arcane genome.
In this chapter, after a review of the sugarcaneevolution and breeding history that led to the
present-day cultivar genomes (Saccharum spp.)and a summary of yield improvement, we dis-cuss the genomic tools developed for sugarcanegenome analyses, their potential applications,and the challenges involved in their use for yieldimprovements in “real life” breeding programs.
History of Sugarcane YieldImprovement
Evolution and Domestication
Sugarcane (Saccharum spp.) belongs to thePoaceae family and the Andropogoneae tribe,along with maize and sorghum. The former ‘Sac-charum complex’ concept encompasses the fiveclosely related genera Saccharum, Erianthus,Sclerostachya, Narenga, and Miscanthus, whichare characterized by cross-fertility (Daniels andRoach 1987). These genera are a potential sourceof diversity for sugarcane breeding. Speciesin the ‘Saccharum complex’ are all highly

IMPROVEMENT OF YIELD PER SE IN SUGARCANE 215
polyploid and frequently aneuploid. Domestica-tion of sugarcane began several thousand yearsago in Southeast Asia and the Pacific Islands,where inhabitants chewed its soft stem. Grivetand colleagues (2004; 2006) recently proposeda convincing scenario for sugarcane evolutionand domestication in a review compiling his-torical, botanical, and molecular data, based onnuclear and mitochondrial probes as well asmolecular cytogenetic evidence. Data generallydo not support any evolutionary path through dis-tant crosses involving representatives of differentgenera. These authors showed that the sugarcanelineage arose directly from the genus Saccharumindependent of the closely related genera Mis-canthus and Erianthus. The Saccharum genus isdivided into six interfertile so-called ‘species’ (S.spontaneum L., S. robustum Brandes ex Jeswietex Grassl, S. officinarum L., S. barberi Jeswiet, S.sinense Roxburgh and S. edule Hasskarl.). Basi-cally sugarcane emerged from an initial diver-gence between the two ancestral wild species S.robustum (2n=6x-8x=60-80) and S. spontaneum(2n=5x-16x=40-128) that have high fiber butvery low sugar content. S. spontaneum compriseshighly polymorphic phenotypes with many ane-uploid forms and is considered to be autopoly-ploid. S. officinarum (2n=8x=80), with its juicy,sugar-rich, thick stalk called ‘noble cane,’ wasdomesticated by ancestral Melanesian popula-tions in New Guinea from a particular cytotypeof S. robustum. The two other sugar-producingdomesticated ‘species,’ S. barberi (2n=104 to128) and S. sinense (2n=81 to 124), formerlycultivated in Asia, have been shown to be naturalhybrids between S. officinarum and S. sponta-neum (D’Hont et al. 2002). Sugarcane domesti-cation was the first stage of yield increase, whichprovided cultivated forms with high productivepotential owing to their thick stalk that accu-mulated large amounts of sucrose. Two of thethree sweet domesticated species, S. barberi andS. officinarum, spread throughout intertropicalareas, thanks to human migration and Europeancolonization. S. officinarum was the main culti-vated species until the end of the 19th century.
Yield Increase Brought by WildIntrogressions
The second step of yield improvement relied onthe 100 years of breeding that began at the endof the 19th century with the exploitation of sug-arcane fertility (Figure 13.3). The first breedingstations were established in Barbados and Java atthe end of the 1880s (Daniels and Roach 1987).After making efforts aimed at intraspecificbreeding within S. officinarum, breeders rapidlyobserved that interspecific crosses between S.officinarum and S. spontaneum were better ableto overcome the diseases that threatened sugarindustries. Adding S. spontaneum in the crossesprovided resistance to mosaic and Sereh, bothserious diseases that occurred in the 1920s.Agronomic performance was also improvedbecause of S. spontaneum’s good ratooning
Fig. 13.3. Schematic breeding history of sugarcane, show-ing a second significant step in yield improvement in the 20th
century. Modern cultivars (Saccharum spp.) rely on a fewcrosses undertaken 100 years ago between S. officinarum(the high-sucrose domesticated species) and S. spontaneum(a wild species without sucrose), involving a limited num-ber of founders. These first interspecific hybrids were back-crossed with the high-sucrose species, and subsequently com-plex recurrent intercrossing of the best products gave rise tomodern cultivars. For a color version of this figure, pleaserefer to the color plate.

216 TRANSLATIONAL GENOMICS FOR CROP BREEDING
Bandjarmasin
Hitan (S. officinarum)
2n=80,
n=40
Loethers
(S. officinarum)
2n=99
n=99/2
POJ100
2n=89, n=89/2
POJ2364
2n=148=2×89/2+136/2
n=148/2
POJ2714
POJ2722
POJ2725
2n=114
2n=108
2n=107
POJ2875
POJ2878
POJ2883
2n=110
2n=119
2n=115
EK28 (Clon: S. officinarum)
2n=80
n=40
Kassoer
2n=136=(2×40+56), n=68 *(GI) 2n+n
(GII) 2n+n
(GIII) n+n
*G = Generation
Black Cheribon
(S. officinarum)
2n=80
n=40
Glagah
(S. spontaneum)
2n=112
n=56
××
×
×
Fig. 13.4. ‘Nobilization’ breeding scheme that led to the few typical Javanese POJ interspecific foundercultivars obtained after three generations following ancestral species and used in most breeding programsworldwide in the 20th century. After a first interspecific (F1) hybridization (Kassoer) and a backross (BC)with a ‘noble’ cane (POJ 100) in which the somatic number (2n) of the two female genitors is transmitted, asecond BC with a ‘noble cane’ (EK28) gave rise to outstanding ‘nobilized’ products (from Campo Zabala,2010, with kind permission from the International Society of Sugar Cane Technologists).
ability and high tillering. Hybrids were producedfrom these two complementary species throughan introgression process called “nobilization”(Figure 13.4). ‘Nobilization’ consists of aninitial interspecific (F1) cross (♀ S. officinarum x♂ S. spontaneum) followed by a few backcrosses(BC) with different ‘noble’ clones (S. offici-narum). In F1 and BC1 crosses, S. officinarumused as female genitor has the particularityof transmitting its somatic (2n) chromosomenumber (Bremer 1922; Piperidis et al. 2010).The resulting products of introgression (BC2,BC3, etc.) thus rapidly recovered the highsugar-content phenotype characteristic of the‘noble’ species (S. officinarum) along withsustainable yield due to newly acquired diseaseresistance. ‘Nobilization’ was first exploited atthe Proefstation Ost Java (Java). In 1921, this
breeding station created the famous ‘nobilized’cane, POJ 2878. Its yield was 35% higher thanthe other varieties used at that time (Jeswiet1930). The Sugarcane Breeding Institute atCoimbatore (India) used S. sinense and S.barberi as the male parent in their nobilizationschemes and created famous cultivars such as Co213, Co 281 and Co 290. Most of the superior‘nobilized’ canes that were created between1920 and 1930 spread throughout the worldduring the course of the 20th century. Sincethen, in all countries, improvement of sugarcanehas been based on the recurrent intercrossingof elite cultivars derived from these few initialinterspecific ‘nobilized’ founders, followed bymass selection among progenies. One of themain consequences of these breeding schemesis a relatively narrow genetic basis of modern

IMPROVEMENT OF YIELD PER SE IN SUGARCANE 217
sugarcane germplasm (Saccharum spp.). Thenumber of ancestral accessions that gave rise tothe interspecific founders used as progenitors inbreeding programs worldwide does not exceed20 accessions originating from S. officinarumspecies and even fewer from S. spontaneumspecies (Arceneaux 1967; Roach 1989).
Modern Sugarcanes and Yield Progress
Modern cultivars have a large, complex aneu-ploid and polyploid genome consisting of 100-130 chromosomes of about 10 Gbp (D’Hont2005). Seventy to eighty percent of the chro-mosomes are inherited from S. officinarum, 10to 20% are inherited from S. spontaneum, and10 to 20% are derived from recombination of thetwo species (Figure 13.5) (Cuadrado et al. 2004;D’Hont et al. 1996; Piperidis and D’Hont 2001;Piperidis et al. 2010). Modern sugarcane culti-vars are highly heterozygous genotypes result-ing from the well-known relative intolerance ofthe plant to inbreeding. As shown in Figure13.5b, the genome of modern interspecific andaneuploid sugarcanes comprises 10 homeologygroups (HG), each containing between 11 and 14chromosomes. Chromosomes mainly form biva-lents at meiosis, but, depending on the genotypeand the HG, pairing may vary from preferential(0 to 40%) to complete (100%) affinities, lead-ing to complex chromosome segregation patternsassociating disomic with more or less polysomicbehavior (Jannoo et al. 2004). This complexchromosome segregation pattern may invali-date several assumptions underlying the theoryof quantitative genetics developed for conven-tional diploid (Hogarth 1977) or autopolyploidspecies. Using these models, estimates of geneticvariance components derived from experimen-tal mating designs are believed to be frequentlybiased. The development of specific populationgenetics or quantitative genetic models adaptedto sugarcane is highly unlikely. This makesclassical sugarcane breeding somewhat more
Fig. 13.5. Double structure of the genome of modern sug-arcane cultivars. About 80% of the chromosome is inheritedfrom S. officinarum, 10% from S. spontaneum and 10% arerecombinant.(a) Genomic in situ hybridization (GISH) using labeled totalDNA of S. officinarum (yellow fluorescence) and of S. spon-taneum (red fluorescence) on chromosome preparations ofthe cultivar R570 (from D’Hont et al. 1996, with kind per-mission from Springer Science and Business Media).(b) Schematic representation of the genome of modern inter-specific cultivars deduced from molecular cytogenetic dataand mapping works. Modern cultivars are highly polyploidand aneuploid with about 120 chromosomes. Colored barscorrespond to chromosomes. Chromosome colors are func-tions of their origins: yellow for S. officinarum and red for S.spontaneum. Chromosomes from the same row are homolo-gous (or homeologous). Chromosomes of the S. officinarumand S. spontaneum part of the genome of the modern cultivarsare distributed in 10 (X=10) and 8 (X=8) homology groupsrespectively. (Modified from Grivet and Arruda 2002). For acolor version of this figure, please refer to the color plate.
218 TRANSLATIONAL GENOMICS FOR CROP BREEDING
empirical than for other crops. However, despitethis tricky context, many breeders succeeded inobtaining new local cultivars (Machado 2001)that contributed to the steady increase in yield asevidenced by world statistics (Figure 13.2). Onone hand, in the high polyploid and heterozygotesugarcane, a lot of crosses between elite lines fre-quently lead to large agronomic segregation ofmany traits, providing opportunities for geneticprogress. On the other hand, conventional breed-ing programs have to be rather large (and expen-sive) to be efficient because of (1) the markeddisjunction of the target traits of the breeders(yield components, disease resistance, etc.) inthe currently ‘unfixed’ breeding germplasm, and(2) the absence of any information on the geneticbasis of agronomic traits likely to be usefulto rationalize experimental costs. Another rea-son for the relatively high cost of conventionalbreeding programs is the frequent genotype xenvironment interaction observed in sugarcane(Jackson and Hogarth 1992; Kang and Miller1984), which requires investments in large exper-imental networks. Moreover the ratooning abil-ity of selection candidates needs to be moni-tored over several crop cycles before the bestsustainable elites suitable for semi-perennial cul-tivation can be identified. All these particulari-ties explain why sugarcane breeding programsstill rely on massive screening of millions ofprogenies. Programs call for tremendous exper-imental resources. Between 7 and 10 years areneeded to select breeding parents and between12 and 15 years to identify a commercial cul-tivar after initial crossing (Cheavegatti-Gianottoet al. 2011).
Further improvements in sugarcane yield areexpected to come from a better understanding ofthe genetic bases of yield components that couldfacilitate the development of marker-assistedbreeding approaches. However, the polygenicnature of the factors controlling the expressionof yield traits, enhanced by the high ploıdy levelof sugarcane, might hinder the use of molecular-assisted breeding approaches in sugarcane breed-ing programs.
Marker-Assisted Selection Related toYield Component Traits
Marker-assisted selection (MAS) is based onthe exploitation of linkage disequilibrium (LD)between markers and quantitative trait loci(QTLs). LD is the non-random association ofalleles at distinct loci. If markers are tightlylinked to many and/or prominent QTLs under-lying the variation of any trait of interest, directselection is possible using markers instead ofphenotypic data, which can be time consumingto acquire. In this case, the advantages of MASover phenotypic selection should enable a gainboth in time and in cost, which could be evengreater because MAS could be efficiently appliedat a relatively early stage in the breeding program(depending on the unit cost of genotyping). Theadvantages and efficiency of MAS are based onthe fact that QTL effects need to be accuratelyestimated and stable across genetic backgroundsand environments and over time. The prohibitivecost of sugarcane breeding programs providedmotivation for testing the use of MAS breedingapproaches for yield traits in sugarcane in orderto identify elite genotypes as early as possible.
In sugarcane, detection of QTLs for MASexperiments relies on two strategies involvingthe study of highly heterozygous clones: QTLmapping of bi-parental crosses or associationmapping using a panel of clones.
QTL Studies
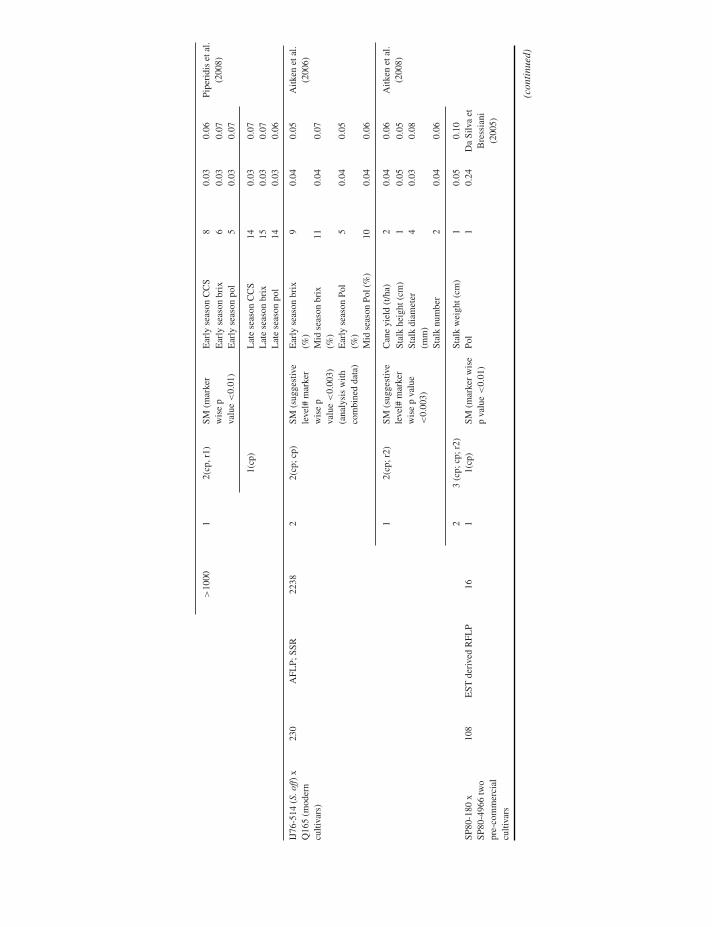
QTLs genetic studies have been carried out onsugar yield, on cane yield, and on their agro-nomic components (tillering, stalk length anddiameter, and brix). A total of 14 QTL stud-ies based on ten different bi-parental progeniesare reported in the literature (Sills et al. 1995;Ming et al. 2001; Hoarau et al. 2002; Minget al. 2002a; Ming et al. 2002b; Jordan et al.2004; Da Silva and Bressiani 2005; Reffay et al.2005; Aitken et al. 2006; Aitken et al. 2008;Piperidis et al. 2008; Alwala et al. 2009; Pintoet al. 2010; Pastina et al. 2012). Table 13.1

Tab
le13
.1.
Rev
iew
ofal
lele
tagg
ing
expe
rim
ents
rela
ted
tosu
garc
ane
yiel
dco
mpo
nent
trai
ts,b
ased
onQ
TL
stud
ies
oras
soci
atio
nm
appi
ngst
udie
s.E
xper
imen
talc
onte
xt,Q
TL
dete
ctio
nm
etho
dsan
dre
sults
.
R2
indi
vidu
al
Popu
latio
nPo
pula
tion
size
Mar
ker
type
No.
ofm
arke
rsN
o.of
loca
tions
No.
ofye
ars
(cro
pcy
cle)
a
Stat
istic
alan
alys
isan
dth
resh
oldb
Tra
itsc
QT
Ls
dete
cted
acro
ssex
peri
men
tsM
inM
axR
efer
ence
s
Inte
rspe
cific
cros
ses
La
Purp
le(S
.off)
xM
ol58
29(S
.rob
)
44R
APD
831
1(cp
)SM
(mar
ker
wis
ep
valu
e<
0.1)
Stal
knu
mbe
r2
––
Sills
etal
.(1
995)
Stal
kdi
amet
er3
––
Pol
4–
–Fi
ber
4–
–Pl
otbi
omas
sw
eigh
t2
––
Gre
enG
erm
an(S
.off)
xIN
D81
-146
(S.
spon
t)
264
RFL
P47
51
1(cp
)SM
(sug
gest
ive
leve
l#m
arke
rw
ise
pva
lue
<0.
003)
IM(L
OD
scor
e>
2.5)
Suga
rco
nten
t14
0.04
0.13
Min
get
al.
2001
Fibe
r19
0.06
0.13
Min
get
al.
2002
bSt
alk
num
ber
20.
050.
15Su
gar
yiel
d3
0.05
0.11
Pol
20.
050.
09St
alk
wei
ght
100.
050.
13
Stal
khe
ight
30.
050.
08M
ing
etal
.20
02a
PIN
84-1
(S.s
pont
)x
Mun
tok
Java
(S.o
ff)
239
RFL
P26
01
1(cp
)SM
(sug
gest
ive
leve
l#,m
arke
rw
ise
pva
lue
<0.
003)
IM(L
OD
scor
e>
2.5)
Suga
rco
nten
t22
0.05
0.21
Min
get
al.
2001
Fibe
r1
0.07
0.07
Min
get
al.
2002
bSt
alk
num
ber
10.
060.
06Su
gar
yiel
d7
0.05
0.15
Pol
120.
040.
15St
alk
wei
ght
250.
050.
16
Stal
khe
ight
530.
050.
23M
ing
etal
.20
02a
(con
tinu
ed)

Tab
le13
.1.
(Con
tinu
ed)
R2
indi
vidu
al
Popu
latio
nPo
pula
tion
size
Mar
ker
type
No.
ofm
arke
rsN
o.of
loca
tions
No.
ofye
ars
(cro
pcy
cle)
a
Stat
istic
alan
alys
isan
dth
resh
oldb
Tra
itsc
QT
Ls
dete
cted
acro
ssex
peri
men
tsM
inM
axR
efer
ence
s
‘Lou
isia
naSt
ripe
d’(S
.off)
x‘S
ES
147B
’(S
.sp
ont)
100
AFL
P,SR
AP
and
TR
AP
650
12(
cp,r
1)IM
and
CIM
(LO
D>
3.01
);no
npar
amet
ric
disc
rim
inan
tan
alys
is
Ear
lybr
ix8
0.03
0.34
Alw
ala
etal
.(2
009)
1(cp
)L
ate
brix
60.
040.
27
1(r1
)E
arly
pol
80.
080.
15
1(cp
)L
ate
pol
30.
090.
10
Cro
sses
invo
lvin
gm
oder
ncu
ltiv
ars
selfi
ngof
R57
029
5A
FLP
1180
12(
cp,r
1)SM
(mar
ker
wis
ep
valu
e<
0.00
5)
Bri
x2
0.03
0.04
Hoa
rau
etal
.(2
002)
Stal
khe
ight
10.
030.
03St
alk
diam
eter
20.
030.
05St
alk
num
ber
10.
070.
07
Q11
7x
74C
4210
8R
FLP
and
RA
Fs(r
adio
-lab
elle
dam
plifi
edfr
agm
ents
)
258
22(
cp;r
1)SM
(mar
ker
wis
ep
valu
e<
0.01
)
Stal
knu
mbe
r16
––
Jord
anet
al.
(200
4)Su
cker
num
ber
14–
–
Q11
7x
MQ
77–3
40tw
om
oder
nscu
ltiva
rs
232
AFL
Pan
dSS
R40
0(o
nly
for
MQ
77-3
40)
12(
cp,r
1)SM
(mar
ker
wis
ep
valu
e<
0.01
)
Ear
lyse
ason
CC
S‘
20.
030.
04R
effa
yet
al.
(200
5)E
arly
seas
onbr
ix1
0.03
0.03
Ear
lyse
ason
pol
10.
030.
03
1(cp
)SM
(mar
ker
wis
ep
valu
e<
0.01
)
Lat
ese
ason
CC
S5
0.03
0.07
Lat
ese
ason
brix
50.
030.
06L
ate
seas
onpo
l5
0.03
0.07
Fibe
r2
0.02
0.03
Stal
kw
eigh
t8
0.02
0.07
Can
eyi
eld
30.
020.
03Su
gar
yiel
d3
0.02
0.03
>10
001
2(cp
,r1)
SM(m
arke
rw
ise
pva
lue
<0.
01)
Ear
lyse
ason
CC
S8
0.03
0.06
Pipe
ridi
set
al.
(200
8)E
arly
seas
onbr
ix6
0.03
0.07
Ear
lyse
ason
pol
50.
030.
07
1(cp
)L
ate
seas
onC
CS
140.
030.
07L
ate
seas
onbr
ix15
0.03
0.07
Lat
ese
ason
pol
140.
030.
06
IJ76
-514
(S.o
ff)x
Q16
5(m
oder
ncu
ltiva
rs)
230
AFL
P;SS
R22
382
2(cp
;cp)
SM(s
ugge
stiv
ele
vel#
mar
ker
wis
ep
valu
e<
0.00
3)(a
naly
sis
with
com
bine
dda
ta)
Ear
lyse
ason
brix
(%)
90.
040.
05A
itken
etal
.(2
006)
Mid
seas
onbr
ix(%
)11
0.04
0.07
Ear
lyse
ason
Pol
(%)
50.
040.
05
Mid
seas
onPo
l(%
)10
0.04
0.06
12(
cp;r
2)SM
(sug
gest
ive
leve
l#m
arke
rw
ise
pva
lue
<0.
003)
Can
eyi
eld
(t/h
a)2
0.04
0.06
Aitk
enet
al.
(200
8)St
alk
heig
ht(c
m)
10.
050.
05St
alk
diam
eter
(mm
)4
0.03
0.08
Stal
knu
mbe
r2
0.04
0.06
23
(cp;
cp;r
2)St
alk
wei
ght(
cm)
10.
050.
10SP
80-1
80x
SP80
-496
6tw
opr
e-co
mm
erci
alcu
ltiva
rs
108
EST
deri
ved
RFL
P16
11(
cp)
SM(m
arke
rw
ise
pva
lue
<0.
01)
Pol
10.
24D
aSi
lva
etB
ress
iani
(200
5)
(con
tinu
ed)

Tab
le13
.1.
(Con
tinu
ed)
R2
indi
vidu
al
Popu
latio
nPo
pula
tion
size
Mar
ker
type
No.
ofm
arke
rsN
o.of
loca
tions
No.
ofye
ars
(cro
pcy
cle)
a
Stat
istic
alan
alys
isan
dth
resh
oldb
Tra
itsc
QT
Ls
dete
cted
acro
ssex
peri
men
tsM
inM
axR
efer
ence
s
100
RFL
Pam
ong
them
35ar
eE
ST-d
eriv
ed22
21
2(cp
,r1)
SM(m
arke
rw
ise
pva
lue
<0.
05)
Pol
70.
040.
13Pi
nto
etal
.(2
010)
Fibe
r7
0.04
0.11
Can
eyi
eld
70.
040.
18Su
gar
yiel
d5
0.04
0.20
RFL
P,E
ST-R
FLP,
EST
-SSR
741
23(
cp,r
1,r2
)In
terv
alm
appi
ngan
dSM
mar
ker
wis
ep
valu
e<
0.01
),m
ixed
mod
els
Can
eyi
eld
13–
–Pa
stin
aet
al.
(201
2)Su
gar
yiel
d14
––
Fibe
r11
––
Sucr
ose
cont
ent
8–
–
Pan
elof
mod
ern
cult
ivar
s
Pane
lof
mod
ern
clon
es.H
alf
Div
ersi
typa
nel
and
half
prog
enie
sfr
om31
bipa
rent
alcr
osse
s
480
DA
rTs
1531
(dis
cret
e)15
360
(con
tinou
s)
31(
cp)
SM(m
arke
rw
ise
pva
lue
<0.
01)
Seve
ral
mix
edm
odel
s
CC
S42
(dis
cret
em
arke
rs)
377(
cont
inu-
ous)
––
Wei
etal
.(2
010)
Can
eyi
eld
47(d
iscr
ete
mar
kers
)35
2(c
ontin
uous
)
––
acp
:pla
ntcr
op;r
1:fir
stra
toon
;r2:
seco
ndra
toon
.bSM
:sin
gle
mar
ker
anal
ysis
;IM
:int
erva
lmap
ping
;CIM
:com
posi
tein
terv
alm
appi
ng.
c CC
S:co
mm
erci
alca
nesu
gar.
#:su
gges
tive
leve
lacc
ordi
ngto
Lan
der
and
Kru
glya
k(1
995)
.

IMPROVEMENT OF YIELD PER SE IN SUGARCANE 223
summarizes QTL detection methods and results.All these QTL studies relied on pseudo ‘F2’populations derived from selfed or bi-parentalcrosses of highly heterozygous sugarcane clones.Depending on the study concerned, popula-tions were genotyped with different types ofmolecular markers (RAPD, RFLP, AFLP, SSR,TRAP, SRAP, and DArTs). Linkage maps (basedon associations of markers in the couplingphase), were constructed mainly using single-dose (SD) markers but occasionally double-dose (DD) markers (Alwala and Kimbeng 2010;Wu et al. 1992). Detection of associations ofmarker/traits was most often based on marker-by-marker analysis of variance, or more rarelyon interval mapping. Among genetic maps, thetwo most advanced ones for cultivar R570 (Hoa-rau et al. 2001) and cultivar Q165 (Aitken et al.2005), which contain around 1,000 markers, stillcover less than 50% of the sugarcane genome(Piperidis et al. 2008). Two reasons related to thehigh polyploidy context may explain this incom-plete coverage of current interspecific cultivars:(1) the size of their genome, which is estimatedto be around 17,000 cM (Hoarau et al. 2001), and(2) the high chromosome redundancy within thefraction of the genome inherited from S. offici-narum (about 80%), which implies a lower fre-quency of single-dose (SD) markers compared tothe frequency of SD markers within the genomefraction inherited from S. spontaneum (Grivetet al. 1996; Hoarau et al. 2001; Rossi et al. 2003).
Interspecific Crosses
The first category of QTL studies for yieldcomponents was carried out on interspecificcrosses, with the aim of maximizing segrega-tion of the phenotypic variation in yield. Thesestudies involved S. officinarum, the domesticatedspecies, with either the wild species S. robus-tum in one cross (Sills et al. 1995) or the wildspecies S. spontaneum in three crosses (Alwalaet al. 2009; Ming et al. 2002a; Ming et al. 2001;Ming et al. 2002b). The first research was con-ducted by Sills and coworkers (1995) on Purple
(S. officinarum) x Mol 5829 (S. robustum). Theyidentified 12 markers linked to five traits asso-ciated with yield, but the size of the progenywas small (44) and the P value threshold washigh (0.1). Ming and co-workers (2001) studiedsugar content by measuring sucrose-related traits(brix and pol) in two interspecific populations −Green German (S. officinarum) x IND81-146(S. spontaneum), and PIN 84-1 (S. spontaneum)x Muntok Java (S. officinarum) − of similar size(264 and 239 individuals respectively). Despitedifferences in genotyping efforts between thetwo studies, a similarly high percentage of thetotal phenotypic variation of sucrose contentwas explained in both studies by the markersdetected, which were R2=65% (14 SD markers)and 68% (22 SD markers), respectively. In thesetwo populations, Ming and colleagues (2002a,2002b) also detected a total of 82 QTLs asso-ciated with traits related to cane yield compo-nents (stalk weight and height, tillering, and fibercontent). Considering all traits together (sugarcontent and cane yield components), individ-ual R2 markers frequently ranged from 4% toabout 16% and up to 23% for one particular trait(Ming et al. 2001; Ming et al. 2002a; Ming et al.2002b). These relatively high upper values inindividual R2 ranges can obviously be ascribedto the interspecific nature of the mapping pop-ulations that offered large segregations for mostof the traits, possibly due to a few rare alleles ofmajor effects. Congruently, a second team, alsostudying an interspecific cross (S. officinarum xS. spontaneum) (Alwala et al. 2009) reportedmarkers of high individual effect size (up to34% for brix content) in a smaller population(only 100 individuals). In addition, research bythe teams of Alwala and Ming (Ming et al. 2001;Ming et al. 2002a; Ming et al. 2002b; Alwalaet al. 2009) revealed the existence of unfavor-able alleles for sucrose content in the favorableancestor (S. officinarum) and the reverse (favor-able alleles in S. spontaneum), even if the direc-tion of the majority of the QTLs contributing totrait variation remains congruent with agronomicpredictions. These results suggest the existence
224 TRANSLATIONAL GENOMICS FOR CROP BREEDING
of potential additional gains for sucrose contentwithin ‘noble’ species and illustrate the potentialadvantage of using MAS approaches to purgethe domesticated species of alleles that reducesucrose content.
Modern Cultivar Crosses
The second category of QTL studies was basedon five crosses involving modern cultivars (Table13.1): selfing of R570 (Hoarau et al. 2002),SP80-180 × SP80-4966 (Da Silva and Bressiani2005; Pinto et al. 2010; Pastina et al. 2012),Q117 × 74C42 (Jordan et al. 2004), Q117 ×MQ77-340 (Reffay et al. 2005; Piperidis et al.2008), and a cross between the S. officinarumclone IJ76-514 and the modern cultivar Q165(Aitken et al. 2006; Aitken et al. 2008). All thesestudies used classical measurements of yieldcomponents such as height, diameter, weight ornumber of stalks, and measurements of the qual-ity of sugarcane juice (brix and pol). Three ofthese studies based on the largest populationsize (230 to 295 individuals) revealed numer-ous QTLs for each trait with small individualR2 values usually ranging between 3% and 8%(Hoarau et al. 2002; Reffay et al. 2005; Aitkenet al. 2006; Aitken et al. 2008; Piperidis et al.2008). These R2 values are lower than valuesfound in previous works by Ming and colleagues(Ming et al. 2001; Ming et al. 2002a; Ming et al.2002b) for F1 interspecific populations of similarsize (239 and 264 individuals, respectively) withR2 that were up to 23%. These findings showthat the frequency of alleles for major effects foryield-related traits is lower in modern varieties.This could be due to the fact that: (1) the mostunfavorable alleles in the S. spontaneum part ofthe modern sugarcane genome are likely to havebeen eliminated by ‘nobilization,’ and (2) someof the most favorable alleles have already been‘fixed’ in several copies by recurrent selection,which makes their detection less likely (absenceof visible segregation). As a consequence of theirrelatively modest effect size, the number of QTLsdetected in modern cultivars mainly depended
on the thresholds used to qualify an associationas statistically significant. Like QTL studies ofinterspecific crosses (Sills et al. 1995; Ming et al.2002b; Alwala et al. 2009), some modern QTLstudies revealed ‘significant’ digenic interactions(Hoarau et al. 2002; Aitken et al. 2006; Aitkenet al. 2008; Pinto et al. 2010). These digenic inter-actions are responsible for a substantial portionof phenotypic variance, illustrating the poten-tial importance of epistasis in the genetic controlof yield components. In several QTL studies,populations were phenotyped in successive cropcycles (Hoarau et al. 2002; Reffay et al. 2005;Piperidis et al. 2008; Pinto et al. 2010) and some-times in several locations (Jordan et al. 2004;Aitken et al. 2006; Aitken et al. 2008; Pastinaet al. 2012). Although Aitken and colleagues(2006) combined data across locations for sta-tistical analysis, in most of these studies, detec-tion of marker-trait associations was carried outseparately for each crop cycle and environment.They usually revealed a small number of overlap-ping sets of QTLs, however the direction of themarker effect on the trait value (either positiveor negative) may always be conserved (Hoarauet al. 2002). These findings illustrate the fact thatdetecting QTLs in modern cultivars is highly sen-sitive to the effects of statistical thresholds. Onlyone work, recently published by Pastina and col-leagues (2012), describes the use of mixed mod-els for detection of yield QTLs, revealing sig-nificant interactions for all traits for QTL x cropcycle, QTL x environment, and QTL x crop cyclex environment. Piperidis and colleagues (2008)compared the location of QTLs for brix acrossfour modern cultivar maps (R570, MQ77-340,Q117, and Q165), based on the use of a few neu-tral SSR primers scattered throughout the eighthomo(eo)logy groups (HG). Two of the eightHGs were seen to contain marker-trait associa-tions for brix, in two or three out of the four maps,suggesting common loci of interest in theseHGs among cultivars. These results illustrate thevalue of conducting meta-QTL analyses to revealkey alleles that could be targeted using MASapproaches in genetic improvement program.

IMPROVEMENT OF YIELD PER SE IN SUGARCANE 225
Fig. 13.6. Alignment of a chromosome region of sorghum bearing QTLs relatedto the regrowth (rectangle) in the linkage group A (LG A) (Paterson et al. 1995) withthe orthologous region in sugarcane chromosome II (SC II) of sugarcane containingmarkers (SSCIR 110 and CDSC052 in bold) associated with QTLs for suckering(from Jordan et al. 2004, C© 2008 Canadian Science Publishing or its licensors.Reproduced with permission).
Another strategy for tracking down allelesrelated to yield components in the very largesugarcane genome would be to take advan-tage of the relatively good synteny relation-ships between sugarcane and diploid grass mod-els (Glaszmann et al. 1997; Ming et al. 1998;Jannoo et al. 2007; Le Cunff et al. 2008; Wanget al. 2010). Ming and colleagues (2002a; 2001)found syntenic regions between sugarcane andmaize or sorghum that contain QTLs controllingsugar content, plant height, number of stalks, andflowering in sugarcane. Like what is shown inFigure 13.6 using heterologous Restriction Frag-ment Length Polymorphism (RFLP) probes, Jor-dan and colleagues (2004) found seven QTLcolocalizations between sugarcane and sorghumrelated to tillering and rhizomatousness traits.These results clearly demonstrate the potentialof allele-tagging strategies based on the exploita-tion of synteny.
Several studies have used the large ExpressedSequence Tag (EST) database available for sug-arcane (Vettore et al. 2003) to develop molec-ular markers (RFLP, Simple Sequence Repeats
[SSR], and Target Region Amplification Poly-morphism [TRAP]) showing homology withcandidate genes involved in yield elaboration(Da Silva and Bressiani 2005; Alwala et al. 2009;Pinto et al. 2010). This strategy allowed directmapping of the genes of interest, as demon-strated by Da Silva and Bressiani (2005) andPinto and colleagues (2010), who described thedevelopment of EST-RFLP markers and founda sucrose synthase EST-RFLP marker associ-ated with sugar content in an SP80-180 x SP80-4966 cross. The sugarcane EST resourceswere also the source of the discovery of sin-gle nucleotide polymorphisms (SNPs) (Grivetet al. 2003; Cordeiro et al. 2006; McIntyre et al.2006). The ecotilling strategy that enabled thediscovery of SNP in a target EST was testedby McIntyre and colleagues (2006) and Aitkenand colleagues (2008) for detecting and mappingassociations with yield components. The wholegenome sequence already available for sorghum,maize, and rice should improve these strategiesand facilitate the development of accurate candi-date markers associated with yield.
226 TRANSLATIONAL GENOMICS FOR CROP BREEDING
Association Mapping
Association studies based on linkage disequilib-rium (LD) can also be used to tag QTLs withoutnecessarily calling for detailed linkage informa-tion. Unlike linkage analysis based on controlledprogenies, LD-based studies do not requiresegregating populations of known parentage.Linkage, but also selection, or drift, in a popula-tion are the main causes for allelic associationsto occur at a different frequency from whatwould be expected if the associations were dueto random mating (Flint-Garcia et al. 2003).LD-based studies, or association-mappingstudies, are based on existing populations orgermplasm collections, which may have majoradvantages: (1) individuals in such collectionsmay be more or less distantly related and mayhave accumulated recombination events overmany generations and consequently allow forhigh-resolution mapping, (2) such collectionsmay already be well characterized for a range ofinteresting traits, and (3) such collections mayinclude a large number of alleles of agronomicvalue (Morgante and Salamini 2003; Rafalskiand Morgante 2004). However, association-mapping studies suffer from certain limitations.There is a higher probability of type I and typeII errors compared to classic bi-parental QTLanalysis (Breseghello and Sorrells 2006). Type Ierrors, or detection of false marker-trait associ-ations, may be the result of the genetic structurewithin the population studied. Type II errors,that is, the probability of missing genuine causalassociations, may result from (1) lower associa-tions between markers and genes resulting fromthe rapid decay of LD, (2) unbalanced designresulting from the presence of alleles at distortedfrequencies, and (3) very strict genome-wisesignificance thresholds resulting from therelative independence of the many markerstested (Carlson et al. 2004). The extent of LDdetermines whether genome scans or candidategene association approaches can be used (Nord-borg and Tavare 2002; Flint-Garcia et al. 2003).The potential of LD approaches in sugarcane
breeding was highlighted early on (Jannoo et al.1999). Only a few generations separate moderncultivars from their interspecific founders, lim-iting the number of meioses and consequentlythe opportunity for chromosome recombination.Moreover breeding history is characterized bybottlenecks arising from the very limited numberof founders (Arceneaux 1967). As a result,despite the relatively large size of the sugarcanegenome (about 10 Gb), modern germplasm isthought to encompass a rather modest numberof LD blocks. None of the classic measures ofLD (D’, r2, d2) exploiting allele frequency orhaplotype frequency can be calculated becauseof the high polyploidy of sugarcane. Howeverthe Fisher exact test probability can be used totest for associations between markers. Usinginformation from a reference map (Hoarau et al.2001) combined with the study of a small panelof sugarcane cultivars, Raboin and colleagues(2008) assessed LD in modern sugarcanes. Aspredicted, LD appeared to be more extensivethan in numerous other plants, since LD dropssharply only over a distance of 5 cM andinstances of LD blocks of 10 to 20 cM arerelatively frequent. But many LD blocks maybe missed, as the confounding effects of markerdosage due to polyploidy are assumed to maskmany instances of linked markers (Costet et al.2012).
Several authors have applied association map-ping in sugarcane relative to disease and insectresistance such as smut, African stalk borer,pachymetra root rot, leaf scald, and Fiji leafgall (Raboin 2005; Wei et al. 2006; Butterfield2007), or to yield component traits (Wei et al.2010). These studies have led to the detection ofnumerous marker-trait associations, despite theuse of a modest number of markers, far from thenumber required for a “meta” genome of a culti-var panel to be densely scanned. Sugarcane hap-loid genome size is about 1500 cM. Therefore,considering average LD values in sugarcane,a minimum of 300 to 600 multi-allelic locus-specific markers would be required to achieve aminimum density of one or two markers every

IMPROVEMENT OF YIELD PER SE IN SUGARCANE 227
five cM, corresponding to 3,000-7,000 markersto cover the entire polyploid genome (Raboinet al. 2008).
Wei and colleagues (2010) recently publishedthe only association-mapping study related tocane and sucrose yields using a large panel of 480clones representative of the modern germplasmof current breeding programs. The panel wastested in three different locations using areplicated design. This panel was genotyped witha Diverse Arrays Technology (DArT) microar-ray (Heller-Uszynska et al. 2010). The authorsgenerated 15,360 DArT score markers and usedthem as continuous markers, assuming that thisquantitative scoring was related to the num-ber of copies of each marker per genotype,which would be a major advantage in the highlypolyploid sugarcane. Nevertheless these 15,360markers corresponded to 1,531 discrete polymor-phic markers within a 0.05-0.95 frequency range.Several methods can be used to account forstructuration in the panels. A Bayesian cluster-ing model implemented in STRUCTURE soft-ware (Pritchard et al. 2000) or kinship analy-sis inferred from molecular data implemented inSPAGEDI software (Hardy and Vekemans 2002;Yu et al. 2006) are currently used in association-mapping studies in plants but are not suitablefor high autopolyploid species. Principal compo-nent analysis (Price et al. 2006), genomic control(Devlin and Roeder 1999), or pedigree matrixare suitable alternative methods to account forthe structure of the panel in the genomic con-text of sugarcane. Wei and colleagues (2010)analyzed marker/trait associations with differ-ent mixed linear models they adapted from theconventional basic model of Yu and colleagues(2006) to minimize the risk of type I and typeII errors. These models combined cofactors rep-resenting levels of relatedness between individ-uals, genotype by environment interactions, andspatial variation within trials. The cofactor usedfor levels of relatedness between individuals wasa pedigree matrix that is very efficient, as it dra-matically reduces the number of significant asso-ciations. Finally, using the most elaborate model,
with P<0.01, the authors detected 47 discreteand 352 continuous markers associated with caneyield, and 42 discrete and 377 continuous mark-ers associated with sugar content. Depending onthe traits surveyed, these numbers of associationswere 3 to 6-fold lower when considering a thresh-old P value of 10−3. Six associations for sucrosecontent were still perceptible at P<10−4, whileat this threshold no significant markers wouldbe expected by random chance. The results ofthis first association study of sugarcane yieldcomponents are encouraging, thanks to the largepanel surveyed and the phenotypic data thatwere acquired on a multi-loci experimental basis.However, the repeatability of these marker traitassociations and validation of these markers atthe scale of a breeding program remain the majorconcern.
Perspectives
In highly polyploid sugarcane, tagging usefulQTLs related to complex traits such as cane orsucrose yield will always be a challenge, irre-spective of the strategy used, whether bi-parentalQTL or panel association studies. Regardingploidy levels, one would expect a reduction inthe mean size of allele effects within the lociof interest. Analyses show medium to large pro-portions of trait variation explained by a swarmof barely significant QTLs with small individ-ual effect size (R2). Moreover QTLs are oftenspecific to a single environment and crop cycle.Validating QTLs across different genetic back-grounds for breeding purposes is a difficult task(Piperidis et al. 2008). In sugarcane, as in othercrops, the use of MAS appears to be useful fortraits with simple inheritance, such as diseaseresistance (Daugrois et al. 1996; Raboin et al.2006; Aljanabi et al. 2007). The advantage ofusing of MAS for quantitative traits such asyield is more questionable. Up until now, theonly known example of using markers for selec-tion in sugarcane is for rust resistance (Costetet al. 2012). Numerous QTL mapping experi-ments in many species have been published in
228 TRANSLATIONAL GENOMICS FOR CROP BREEDING
the last 20 years. Results of such studies havedemonstrated the limited use of QTL mappingfor breeding (Xu and Crouch 2008; Jannink et al.2010). According to the recent review by Brum-lop and Flinckh (2011), a total of 83 papers werepublished between 1995 and 2009 concerningthe main areas of applicability for MAS in plantbreeding programs or in research projects. Thissurvey included very few studies (only 8 out of83) that reported successful application of MASrelated to yield improvement. The main prob-lems involved in using MAS for quantitativetraits are the difficulty of accurately determin-ing the effects of the QTL, and of extrapolatingQTL expression from one genetic backgroundto another and from one environment to another.This may explain why molecular markers arenot currently used in breeding schemes for theimprovement of sugarcane yield. New modelsneed to be developed that take the high com-plexity of the sugarcane genome into account.Effective incorporation of molecular genetics inbreeding programs will also depend on the avail-ability of innovative genotyping technologiesyielding higher throughput markers to enablemore dense coverage of the large sugarcanegenome (10 Gb).
Towards Increasing ThroughputMarker Systems
Efforts have to be invested in developing “uni-versal” markers that would enable comparisonof the location of QTLs across sugarcane studiesand also between sugarcane and related species(sorghum, miscanthus, maize). The achievementof this objective should be supported by thelarge scale development of markers based onDNA sequences via high throughput genotyp-ing facilities, such as microarray and sequenc-ing technologies. The recent release of the refer-ence sequence of the sorghum genome (Pater-son et al. 2009) which has a large degree ofsynteny with the sugarcane genome (Glaszmannet al. 1997; Ming et al. 1998; Jannoo et al.2007; Le Cunff et al. 2008; Wang et al. 2010)
should also provide a valuable guide for prob-able gene arrangements in sugarcane, both atthe global and local scales. This new resourceshould facilitate strategies aimed at defining areference sequence of the sugarcane genomebased on bacterial artificial chromosome (BAC)sequencing approaches. Regarding the complex-ity and the size of the genome, Souza et al.(2011) suggest focusing sequencing on ‘euchro-matin’ BAC regions identified using the sorghumsequence template. Euchromatin regions arebelieved to be rich in genes and might includemost of the recombination scattered across thegenome. Conversely ‘heterochromatin’ is gene-poor, repeat-rich, and recalcitrant to recombi-nation. Therefore, sequencing at least the gene-rich portions of the sugarcane genome shouldprovide a valuable resource for the develop-ment of high throughput marker systems intight linkage disequilibrium with many QTLsof agronomic interest. Souza and colleagues(2011) predict that sequencing about 4,000-5,000 sugarcane BACs could capture much of theeuchromatin.
To further develop high-throughput markersystems from this draft sequence of euchromatin,advantage should be taken of next-generationsequencing (NGS) technologies. One of the firstinvestigations of the potential of NGS in sugar-cane was conducted by Bundock and colleaguesin 2009, using 454 Genome Sequencer FLX.These authors demonstrated that the discovery ofreliable single nucleotide polymorphism (SNP)in sugarcane is feasible and would enable thedosage of each allele to be measured. To envi-sion a global NGS-based strategy for SNP detec-tion, we need to improve our understanding ofgenome organization and evolution linked topolyploidization in order to assess the extent ofpolymorphism existing among homo(eo)logousloci. Two recent studies (Jannoo et al. 2007;Le Cunff et al. 2008) based on the structuralanalysis of two series of homo(eo)logous BACsprovided a first insight into genome dynamicsby revealing perfect colinearity as well as highgene-structure conservation between sugarcane

IMPROVEMENT OF YIELD PER SE IN SUGARCANE 229
homo(eo)logous haplotypes. Sugarcane does notappear to have undergone a major reshaping ofits genome as a consequence of polyploidization.Additional series of homo(eo)logous BACs areneeded to refine these first results.
A recent NGS-based strategy calledgenotyping-by-sequence (GBS), associated withone step aimed at reducing genome complexity(generating a limited amount of sequence datato be analyzed), is another new way to discoverSNP (Baird et al. 2008; Elshire et al. 2011).The concept is based on acquiring the sequenceadjacent to a set of particular restriction enzymerecognition sites, rather than randomly sequenc-ing the whole genome. Large amounts ofpolymorphism data can be generated by massiveparallel sequencing. This approach increases thecoverage for a given sequenced site, increasingboth the confidence in base identity and thelikelihood that the same sites will be sequencedin multiple samples. This promising approach,which could allow simultaneous SNP discoveryand genotyping, is currently under investigationin sugarcane (Glynn et al. 2011; D’Hont pers.com.).
Model-Assisted Phenotyping
For overcoming the problems caused by geno-type by environment interactions in yield traitspossible solutions include model-assisted phe-notyping. The “gene-to-phenotype” approachconnects ecophysiological models to statisticalmethods for detecting complex traits (Hammeret al. 2004; Chenu et al. 2009; Prudent et al.2011). This approach should improve the detec-tion of QTLs and our understanding of thegenetic architecture of complex biological pro-cesses. Phenotypic traits for production poten-tial interact strongly with the environment, andare the result of multiple processes that are dif-ficult to measure and tag at the genetic level.Plant growth modeling can advance our under-standing of complex biological systems by for-malizing dynamic interactions among severalbiological processes, such as those related to
phenology, morphogenesis, carbon acquisition,and allocation among sinks. Yield formationcan thus be described dynamically as a set ofinteractive equations using only a small num-ber of genotypic parameters. These parameterscontrol plant reaction norms that are at the basisof plant growth response to the environment(Dingkuhn et al. 2005). The different param-eters involved in phenotype expression can beconsidered as synthetic component traits, pre-sumably controlled by fewer genes than theintegrative, complex agronomic trait. In thissense, if the models represent relevant biolog-ical processes, the model parameters measuredcan be expected to be closer to gene or QTLeffects, in the sense that Genotype x Environ-ment ‘noise’ is reduced (Hammer et al. 2002;Reymond et al. 2003; Yin et al. 2003; Dingkuhnet al. 2005). In such a heuristic approach, vari-ation in parameters among genotypes can beinterpreted as the expression of allelic diversityand analyzed accordingly in QTL or associa-tion studies. Model parameter values can be esti-mated by optimizing a relevant criterion basedon deviations of predictions from observations,using target files containing observations on theplant (classical phenotyping) and on the envi-ronment (e.g., weather, soil). Traits resultingfrom ecophysiological models can be used formore detailed investigation of the biological pro-cesses involved in the development of yield.Model-assisted phenotyping has already beenused for peach (Quilot et al. 2004; Quilot et al.2005), barley (Yin et al. 1999), maize (Reymondet al. 2003), and rice (Dingkuhn et al. 2006;Luquet et al. 2006; Luquet et al. 2007). Sev-eral studies allowed ecophysiological model-ing of sugarcane yield elaboration with mod-els like Mosicas (Martine et al. 2000; Martineet al. 2001; Martine 2003; Martine 2007), Apsim(Keating et al. 1999; Keating et al. 2003), andCanegro (O’Leary 2000). Some authors arebeginning to evaluate the feasibility of model-assisted phenotyping in sugarcane (Luquet et al.2010; Martine et al. 2010; Nibouche et al.2010).

230 TRANSLATIONAL GENOMICS FOR CROP BREEDING
Genomic Selection
Recently a new MAS strategy, Genomic Selec-tion (GS), became popular in animal breed-ing, after the seminal paper of Meuvissenand colleagues (2001). This strategy simulta-neously estimates all marker effects across theentire genome. In this case, instead of manyconventional marker-assisted selection (MAS)approaches, there is no defined subset of signifi-cant markers. Marker effects are estimated froma training panel using phenotypic and genotypicpanel data and pedigree or kinship information.The accuracy of phenotype prediction is testedon a validation panel. The concept and applica-tion of GS need to be investigated in plant breed-ing (Heffner et al. 2009). To date, a few studieshave been published on plants, most of whichexplore the potential benefits of GS from a the-oretical viewpoint, based on simulations that arenot tailored to any particular biological breedingcontext, except for a few studies (Bernardo andYu 2007; Wong and Bernardo 2008). GS’s poten-tial resides in the use of all markers as predictorsof complex trait performance, thereby capturingmore of the variation due to QTLs that are hardlysignificant. The training population used in GSis generally representative of the genetic diver-sity used in breeding programs (wide range ofallelic diversity and genetic background). There-fore potential applications at the scale of a wholebreeding program are expected to be more effi-cient than any MAS approach derived from QTLstudies (Heffner et al. 2009; Heffner et al. 2010;Jannink et al. 2010). GS approaches, which havenot yet been tested in sugarcane, appear to bevery attractive for breeders, given the high com-plexity of the sugarcane genome and the complexquantitative nature of the majority of agronomictraits they need to tackle.
Conclusion
Sugarcane is one the most efficient plants forbiomass production. However in recent decades,the increase in yield has been slower than in other
major crops. The importance of the genotypex environment interaction in yield and sucrose-related traits may explain the slower progressobserved in sugarcane breeding as well as thehighly quantitative nature of trait determinism.Cultivar improvement has relied largely on tradi-tional breeding methods. These methods involvea lengthy (12–15 years) and expensive processof selection of plants with the desired agronomictraits. Molecular genomics should help improveprograms by generating molecular markers thatcan assist the breeding process or the introgres-sion of new genes into breeding germplasm.However, the development of genomic applica-tions in sugarcane breeding programs has laggedbehind many of the diploid plant models. Adapt-ing genomic approaches developed for modelplants to sugarcane is rarely straightforwardowing to the complication of its high ploidy level.In the last two decades many QTL studies basedon bi-parental crosses revealed many QTLs withsmall effects, while validation of the stability ofa QTL’s effect across genetic backgrounds, time,and environments remains a challenging task.Conventional MAS approaches are useful onlyfor tagging alleles of major effects related to dis-ease resistance (Al Janabi et al. 2007; Costet et al.2012), but not for complex traits such as caneyield or quality characters. Moreover traditionalmarker systems are not powerful or convenientenough to densely scan the sugarcane genomeand to develop efficient routine applications.
Given the prohibitive cost of conventionalprograms, the entire sugarcane research com-munity has a major interest in multidisciplinarystudies aimed at unraveling the determinismof complex traits in order to design molecularbreeding approaches tailored to ‘real life’ breed-ing. The main expectation is more advancedincorporation of association genetics-basedapproaches in sugarcane improvement. Inthe context of sugarcane polyploidy, specificscientific creativity will be needed to design abreeder-friendly marker system as well as appro-priate bioinformatics pipes adapted to routinegenotyping. A major innovation in sugarcane

IMPROVEMENT OF YIELD PER SE IN SUGARCANE 231
genetic analyses would be the availability of SNPcodominant markers along with the develop-ment of statistical tools tailored to infer markerdosage in highly polyploid sugarcane. Suchinnovative technologies and models would helpovercome the poor informative conventional(low-throughput) dominant marker systemsthat prevent sugarcane breeders from applyingdeep genetic analysis. Comparative genomicsamong grasses, based on the dramatic increasein sequencing and bioinformatics capabilities,also presents a powerful opportunity to denselyscan regions harboring candidate genes. Finally,research should be inspired by concepts devel-oped for model plants and animal systems, suchas genomic selection and model-assisted eco-physiological phenotyping. Genomic selectionapproaches should improve estimation of theeffects of markers, including the swarm of small-effect markers. Plant growth modeling couldprovide sounder ecophysiological traits andparameters to describe the complex biologicalprocess underlying yield and sucrose elabora-tion. Such models could circumvent traditionalproblems caused by genotype by environmentinteraction.
References
Aitken K, Hermann S, Karno K, Bonnett G, McIntyre L,Jackson P, 2008. Genetic control of yield related stalktraits in sugarcane. Theoretical and Applied Genetics117, 1191–1203. http://dx.doi.org/10.1007/s00122-008-0856-6.
Aitken K, Jackson P, McIntyre C, 2005. A combination ofAFLP and SSR markers provides extensive map cover-age and identification of homo (eo)logous linkage groupsin a sugarcane cultivar. Theoretical and Applied Genet-ics 110, 789–801. http://dx.doi.org/10.1007/s00122-004-1813-7
Aitken K, Jackson P, McIntyre C, 2006. Quantitative traitloci identified for sugar related traits in a sugarcane (Sac-charum spp.) cultivar × Saccharum officinarum popula-tion. Theoretical and Applied Genetics 112, 1306–1317.http://dx.doi.org/10.1007/s00122-006-0233-2
Alexander AG, 1985. The energy cane alternative. Amster-dam: Elsevier Science Publishers BV, 509pp.
Aljanabi S, Parmessur Y, Kross H, Dhayan S, Saum-tally S, Ramdoyal K, Autrey L, Dookun-Saumtally A,2007. Identification of a major quantitative trait locus
(QTL) for yellow spot (Mycovellosiella koepkei) diseaseresistance in sugarcane. Molecular Breeding 19, 1–14.http://dx.doi.org/10.1007/s11032-006-9008-3
Alwala S, Kimbeng C, 2010. Molecular genetic linkage map-ping in Saccharum: Strategies, resources and achieve-ments. In: Henry R, Chittaranjan K (eds), Genetics,genomics, and breeding of sugarcane. Enfield NH: CRCPress, Science Publishers, pp. 70–96.
Alwala S, Kimbeng C, Veremis J, Gravois K, 2009. Identifi-cation of molecular markers associated with sugar-relatedtraits in a Saccharum interspecific cross. Euphytica 167,127–142. http://dx.doi.org/10.1007/s10681-008-9869-0
Anonymous, 2012. REVIEW: 2011 International SugarOrganisation Seminar, London, UK. International SugarJournal 114, 41–43.
Arceneaux G, 1967. Cultivated sugarcanes of the world andtheir botanical derivation. Proceeding of the InternationalSociety of Sugar Cane Technologists 12, 844–854.
Arruda P, 2011. Perspective of the sugarcane industry inBrazil. Tropical Plant Biology 4, 3–8. http://dx.doi.org/10.1007/s12042-011-9074-5
Baird NA, Etter PD, Atwood TS, Currey MC, ShiverAL, Lewis ZA, Selker EU, Cresko WA, Johnson EA,2008. Rapid SNP discovery and genetic mapping usingsequenced RAD markers. PLoS ONE 3(10): e3376.http://dx.doi.org/10.1371/journal.pone.0003376
Bernardo R, Yu J, 2007. Prospects for genomewide selectionfor quantitative traits in maize. Crop Science 47, 1082–1090. http://dx.doi.org/10.2135/cropsci2006.11.0690
Botha F, 2009. Energy yield and cost in a sugarcane biomasssystem. Proceeding of the Australian Society of SugarCane Technologists 31, 1–10.
Brazilian Ministerio de Minas e Energia, 2011.Balanco Energetico Nacional 2011, Resultados Prelim-inares, ano base 2010, p. 49. https://ben.epe.gov.br/downloads/Resultados_Pre_BEN_2011.pdf
Bremer G, 1922. Een cytologisch onderzoek van eenigesoorten en soortsbastaarden van het geslacht Saccha-rum. Arch Suikerindust Nederl Indic Meded ProefstaJava Suikerindust 1-t 12, (English translation in Genetica5:97–148; 273–326).
Breseghello F, Sorrells ME, 2006. Association map-ping of kernel size and milling quality in wheat(Triticum aestivum L.) cultivars. Genetics 172, 1165–1177. http://dx.doi.org/10.1534/genetics.105.044586
Brumlop S, Finckh MR, 2011. Applications and potentialsof marker assisted selection (MAS) in plant breeding,Final report of the F+E project “Applications and poten-tials of smart breeding.” Federal Agency for NatureConservation, Bonn, Germany. www.bfn.de/fileadmin/MDB/documents/service/Skript_298.pdf
Bundock P, Eliott F, Ablett G, Benson A, Casu R, AitkenK, Henry R, 2009. Targeted single nucleotide poly-morphism (SNP) discovery in a highly polyploid plantspecies using 454 sequencing. Plant Biotechnology Jour-nal 7, 347–354. http://dx.doi.org/10.1111/j.1467-7652.2009.00401.x

232 TRANSLATIONAL GENOMICS FOR CROP BREEDING
Butterfield M, 2007. Marker assisted breeding in sugarcane:A complex polyploid. PhD diss., University of Stellen-bosch, 164 pp.
Campo Zabala RR, Perez Orama SG, 2010. A new nobili-sation system in sugarcane (Saccharum spp.). Proc. Int.Soc. Sugar Cane Technol. 27, 1–4.
Carlson CS, Eberle MA, Kruglyak L, Nickerson DA, 2004.Mapping complex disease loci in whole-genome asso-ciation studies. Nature 429, 446–452. http://dx.doi.org/10.1038/nature02623
Cheavegatti-Gianotto A, de Abreu H, Arruda P, BespalhokFilho J, Burnquist W, Creste S, di Ciero L, Ferro J, deOliveira Figueira A, de Sousa Filgueiras T, Grossi-de-Sa M, Guzzo E, Hoffmann H, de Andrade Landell M,Macedo N, Matsuoka S, de Castro Reinach F, RomanoE, da Silva W, de Castro Silva Filho M, Cesar UlianE, 2011. Sugarcane (Saccharum X officinarum): A ref-erence study for the regulation of genetically modifiedcultivars in Brazil. Tropical Plant Biology 4, 62–89.http://dx.doi.org/10.1007/s12042-011-9068-3
Chenu K, Chapman SC, Tardieu F, McLean G, WelckerC, Hammer GL, 2009. Simulating the yield impacts oforgan-level quantitative trait loci associated with droughtresponse in maize: A ‘gene-to-phenotype’ modelingapproach. Genetics 183, 1507–1523.
Cordeiro GM, Eliott F, McIntyre CL, Casu RE, HenryRJ, 2006. Characterisation of single nucleotide poly-morphisms in sugarcane ESTs. Theoretical and AppliedGenetics 113, 331–343. http://dx.doi.org/10.1007/s00122-006-0300-8
Costet L, Le Cunff L, Royeart S, Raboin L-M, Hervouet C,Toubi L, Telismart H, Garsmeur O, Rousselle Y, PauquetJ, Nibouche S, Glaszmann J-C, Hoarau J-Y, D’Hont A,2012. Haplotype structure around Bru1 reveals a nar-row genetic basis for brown rust resistance in mod-ern sugarcane cultivars. Theoretical and Applied Genet-ics 125, 825–836. http://dx.doi.org/10.1007/s00122-012-1875-x
Cuadrado A, Acevedo R, De la Espina SMD, Jouve N,De La Torre C, 2004. Genome remodelling in threemodern S. officinarum— S. spontaneum sugarcane cul-tivars. Journal of experimental botany 55, 847–854.http://dx.doi.org/10.1093/jxb/erh093
Da Silva JA, Bressiani JA, 2005. Sucrose synthase molecularmarker associated with sugar content in elite sugarcaneprogeny. Genetics and Molecular Biology 28, 294–298.http://dx.doi.org/10.1590/S1415-47572005000200020
Dal-Bianco M, Carneiro MS, Hotta CT, Chapola RG,Hoffmann HP, Garcia AAF, Souza GM, 2011. Sugar-cane improvement: How far can we go? Current Opin-ion in Biotechnology 23, 265–270. http://dx.doi.org/10.1016/j.copbio.2011.09.002
Daniels J, Roach B, 1987. Taxonomy and evolution. Chapter2, in: Heintz D (ed), Sugarcane improvement throughbreeding. Amsterdam: Elsevier, pp. 7–84.
Daugrois J, Grivet L, Roques D, Hoarau J, Lombard H,Glaszmann J, D’Hont A, 1996. A putative major gene
for rust resistance linked with a RFLP marker in sugar-cane cultivar ‘R570’. Theoretical and Applied Genetics92, 1059–1064. http://dx.doi.org/10.1007/BF00224049
De Araujo LM, Moura FBP, 2011. Bioethanol’s dirty foot-print in Brazil. Nature 469, 299–299. http://dx.doi.org/10.1038/469299d
Devlin B, Roeder K, 1999. Genomic control for associa-tion studies. Biometrics 55, 997–1004. http://dx.doi.org/10.1111/j.0006-341X.1999.00997.x
D’Hont A (2005) Unraveling the genome structure of poly-ploids using FISH and GISH; examples of sugarcane andbanana. Cytogenetic and Genome Research 109:27–33.http://dx.doi.org/10.1159/000082378
D’Hont A, Grivet L, Feldmann P, Glaszmann J, Rao S, Berd-ing N, 1996. Characterisation of the double genome struc-ture of modern sugarcane cultivars (Saccharum spp.) bymolecular cytogenetics. Molecular and General Genetics250:405–413. http://dx.doi.org/10.1007/BF02174028
D’Hont A, Paulet F, Glaszmann JC, 2002. Oligoclonalinterspecific origin of ‘North Indian’ and ‘Chinese’sugarcanes. Chromosome Research 10:253–262. http://dx.doi.org/10.1023/A:1015204424287
D’Hont A, Souza GM, Menossi M, Vincentz M, Van-SluysMA, Glaszmann JC, Ulian E, 2008. Sugarcane: A majorsource of sweetness, alcohol, and bio-energy, In: MoorePH, Ming R (eds) Genomics of Tropical Crop Plants.New York: Springer, pp. 483–513.
Dias M, da Cunha M, Maciel Filho R, Bonomi A, Jesus C,Rossell C, 2011a. Simulation of integrated first and sec-ond generation bioethanol production from sugarcane:Comparison between different biomass pretreatmentmethods. Journal of Industrial Microbiology & Biotech-nology 38, 955–966. http://dx.doi.org/10.1007/s10295-010-0867-6
Dias MOS, Junqueira TL, Cavalett Ov, Cunha MP, JesusCDF, Rossell CEV, Maciel Filho R, Bonomi A, 2011b.Integrated versus stand-alone second generation ethanolproduction from sugarcane bagasse and trash. Biore-source technology 103, 152–161. http://www.sciencedirect.com/science/article/pii/S0960852411014088
Dingkuhn M, Luquet D, Kim HK, Tambour L, Clement-VidalA, 2006. EcoMeristem, a model of morphogenesis andcompetition among sinks in rice. 2. Simulating genotyperesponses to phosphorus deficiency. Functional PlantBiology 33, 325–337. http://dx.doi.org/10.1071/FP05267
Dingkuhn M, Luquet D, Quilot B, de Reffye P, 2005. Envi-ronmental and genetic control of morphogenesis in crops:Towards models simulating phenotypic plasticity. Aus-tralian Journal of Agricultural Research 56, 1289–1302.http://dx.doi.org/10.1071/AR05063
Duailibe AK, 2010. Brazil’s renewable energy suc-cess. Nature 468, 1041–1041. http://dx.doi.org/10.1038/4681041b
Edme SJ, Miller JD, Glaz B, Tai PYP, Comstock JC, 2005.Genetic contribution to yield gains in the Florida sugar-cane industry across 33 years. Crop Science 45, 92–97.http://dx.doi.org/10.2135/cropsci2005.0092

IMPROVEMENT OF YIELD PER SE IN SUGARCANE 233
Elshire RJ, Glaubitz JC, Sun Q, Poland JA, KawamotoK, Buckler ES, Mitchell SE (2011) A robust, sim-ple genotyping-by-sequencing (GBS) approach for highdiversity species. PLoS ONE. 6(5): e19379 http://dx.doi.org/10.1371/journal.pone.0019379
FAOSTAT, 2012. http://faostat.fao.org/default.aspxFlint-Garcia SA, Thornsberry JM, Buckler IV ES, 2003.
Structure of linkage disequilibrium in plant. AnnualReview of Plant Biology 54, 357–374. http://dx.doi.org/10.1146/annurev.arplant.54.031902.134907
Garoma T, Ben-Khaled M, Beyene A, 2011. Comparativeresource analyses for ethanol produced from corn andsugarcane in different climatic zones. International Jour-nal of Energy Research 36, 1065–1076. http://dx.doi.org/10.1002/er.1853
Glaszmann J, Dufour P, Grivet L, D’Hont A, Deu M,Paulet F, Hamon P, 1997. Comparative genome analysisbetween several tropical grasses. Euphytica 96, 13–21.http://dx.doi.org/10.1023/A:1002987620250
Glynn NC, Nipper RW, Comstock JC, 2011 Application ofRAD LongRead sequencing for SNP discovery in sugar-cane, Plant Genome Conference Proceedings, San Diego,p. 184.
Gravois K, Milligan S, 1992. Genetic relationships betweenfiber and sugarcane yield components. Crop Sci-ence 32, 62–67. http://dx.doi.org/10.2135/cropsci1992.0011183×003200010014x
Grivet, L, Arruda P. 2002. Sugarcane genomics: Depict-ing the complex genome of an important tropical crop.Current Opinion in Plant Biology 5(2):122–127.
Grivet L, d’Hont A, Roques D, Feldmann P, Lanaud C, Glasz-mann JC, 1996. RFLP mapping in cultivated sugarcane(Saccharum spp.): Genome organization in a highly poly-ploid and aneuploid interspecific hybrid. Genetics 142,987–1000.
Grivet L, Daniels C, Glaszmann JC, D’Hont A, 2004. Areview of recent molecular genetics evidence for sugar-cane evolution and domestication. Ethnobotany Research& Applications 2, 9–17. www.ethnobotanyjournal.org/vol2/i1547–3465-02-009.pdf
Grivet L, Glaszmann J, D’Hont A, 2006. Molecular evi-dence of sugarcane evolution and domestication, in:Motley T, Zerega N, Cross H (eds), Darwin’s harvest:New approaches to the origins, evolution, and conser-vation of crops. New York: Columbia University Press,pp. 49–66.
Grivet L, Glaszmann JC, Vincentz M, Da Silva F, Arruda P,2003. ESTs as a source for sequence polymorphism dis-covery in sugarcane: example of the Adh genes. Theoreti-cal and Applied Genetics 106, 190–197. http://dx.doi.org/10.1007/s00122-002-1075-1
Hammer G, Chapman S, Van Oosterom E, Podlich D, 2004.Trait physiology and crop modelling to link phenotypiccomplexity to underlying genetic systems. Proceedingsof the 4th International Crop Science Congress “Newdirections for a diverse planet” 26 Sep – 1 Oct 2004,Brisbane, Australia, pp. 1–15.
Hammer GL, Kropff MJ, Sinclair TR, Porter JR, 2002. Futurecontributions of crop modelling—from heuristics andsupporting decision making to understanding genetic reg-ulation and aiding crop improvement. European Jour-nal of Agronomy 18, 15–31. http://dx.doi.org/10.1016/S1161-0301(02)00093-X
Hardy O, Vekemans X, 2002. SPAGEDi: A versatile com-puter program to analyse spatial genetic structure atthe individual or population levels. Molecular Ecol-ogy Notes 2, 618–620. http://dx.doi.org/10.1046/j.1471-8286.2002.00305.x
Heffner EL, Lorenz AJ, Jannink JL, Sorrells ME, 2010.Plant breeding with genomic selection: Gain per unit timeand cost. Crop Science 50, 1681–1690. http://dx.doi.org/10.2135/cropsci2009.11.0662
Heffner EL, Sorrells ME, Jannink JL, 2009. Genomic selec-tion for crop improvement. Crop Science 49, 1–12. http://dx.doi.org/10.2135/cropsci2008.08.0512
Heller-Uszynska K, Uszynski G, Huttner E, Evers M, CarligJ, Caig V, Aitken K, Jackson P, Piperidis G, CoxM, Gilmour R, D’Hont A, Butterfield M, GlaszmannJ-C, Kilian A, 2010. Diversity Arrays Technology effec-tively reveals DNA polymorphism in a large and com-plex genome of sugarcane. Molecular Breeding 1, 37–55.http://dx.doi.org/10.1007/s11032-010-9460-y
Hoarau JY, Offmann B, D’Hont A, Risterucci AM, RoquesD, Glaszmann JC, Grivet L, 2001. Genetic dissec-tion of a modern sugarcane cultivar (Saccharum spp.).I. Genome mapping with AFLP markers. Theoreti-cal and Applied Genetics 103, 84–97. http://dx.doi.org/10.1007/s001220000390
Hoarau JY, Grivet L, Offmann B, Raboin LM, DiorflarJP, Payet J, Hellmann M, D’Hont AD, GlaszmannJC, 2002. Genetic dissection of a modern sugarcanecultivar (Saccharum spp.).II. Detection of QTLs foryield components. Theoretical and Applied Genetics105, 1027–1037. http://dx.doi.org/10.1007/s00122-002-1047-5
Hogarth DM, 1977. Quantitative inheritance studies in sug-arcane. III. The effect of competition and violation ofgenetic assumptions on estimation of genetic variancecomponents. Australian Journal of Agriculture Research28, 257–268.
Jackson P, 1994. Genetic relationships between attributesin sugarcane clones closely related to Saccharumspontaneum. Euphytica 79, 101–108. http://dx.doi.org/10.1007/BF00023581
Jackson P, Hogarth D, 1992. Genotype x environmentinteractions in sugarcane, 1. Patterns of responseacross sites and crop-years in north Queensland. Aus-tralian Journal of Agricultural Research 43, 1447–1459.http://dx.doi.org/10.1071/AR9921447
Jackson PA, 2005. Breeding for improved sugar con-tent in sugarcane. Field Crops Research 92, 277–290.http://dx.doi.org/10.1016/j.fcr.2005.01.024
Jannink JL, Lorenz AJ, Iwata H, 2010. Genomic selec-tion in plant breeding: From theory to practice.

234 TRANSLATIONAL GENOMICS FOR CROP BREEDING
Briefings in Functional Genomics 9, 166–177. http://dx.doi.org/10.1093/bfgp/elq001
Jannoo N, Grivet L, Chantret N, Garsmeur O, GlaszmannJC, Arruda P, D’Hont A, 2007. Orthologous comparisonin a gene rich region among grasses reveals stability inthe sugarcane polyploid genome. The Plant Journal 50,574–585.
Jannoo N, Grivet L, David J, D’Hont A, GlaszmannJ, 2004. Differential chromosome pairing affinities atmeiosis in polyploid sugarcane revealed by molecu-lar markers. Heredity 93, 460–467. http://dx.doi.org/10.1038/sj.hdy.6800524
Jannoo N, Grivet L, Dookun A, D’Hont A, Glaszmann JC,1999. Linkage disequilibrium among modern sugarcanecultivars. Theoretical and Applied Genetics 99, 1053–1060. http://dx.doi.org/10.1007/s001220051414
Jeswiet J, 1930. The development of selection and breedingof the sugar cane in Java, Proc. Int. Soc. of SugarcaneTechnol, pp. 44–57.
Jordan DR, Casu RE, Besse P, Carroll BC, Berding N, McIn-tyre CL, 2004. Markers associated with stalk number andsuckering in sugarcane colocate with tillering and rhi-zomatousness QTLs in sorghum. Genome 47, 988–993.http://dx.doi.org/10.1139/g04-040
Kang M, Miller J, 1984. Genotype X Environment inter-actions for cane and sugar yield and their implica-tions in sugarcane breeding. Crop Science 24, 435–440. http://dx.doi.org/10.2135/cropsci1984.0011183×002400030002x.
Kang M, Sosa O, Miller J, 1989. Path analysis for per-cent fiber and cane and sugar yield in sugarcane.Crop Science 29, 1481–1483. http://dx.doi.org/10.2135/cropsci1989.0011183×002900060032x.
Kang M, Tai P, Miller J, 1983. Genetic and phenotypic pathanalyses and heritability in sugarcane. Crop Science 23,643–647.
Keating B, Robertson M, Muchow R, Huth N, 1999. Mod-elling sugarcane production systems I. Developmentand performance of the sugarcane module. Field CropsResearch 61, 253-271. http://dx.doi.org/10.1016/S0378-4290(98)00167-1
Keating BA, Carberry P, Hammer G, Probert ME, Robert-son M, Holzworth D, Huth N, Hargreaves J, MeinkeH, Hochman Z, 2003. An overview of APSIM,a model designed for farming systems simulation.European Journal of Agronomy 18, 267–288. http://dx.doi.org/10.1016/S1161-0301(02)00108-9
Lander E, Kruglyak L, 1995. Genetic dissection of complextraits: Guidelines for interpreting and reporting linkageresults. Nature Genetics 11, 241–247. http://dx.doi.org/10.1038/ng1195-241
Le Cunff L, Garsmeur O, Raboin LM, Pauquet J, Telis-mart H, Selvi A, Grivet L, Philippe R, Begum D,Deu M, Costet L, Wing R, Glaszmann JC, D’HontA, 2008. Diploid/polyploid syntenic shuttle mappingand haplotype-specific chromosome walking toward arust resistance gene (Bru1) in highly polyploid sug-
arcane (2n ∼ 12x ∼ 115). Genetics 180, 649–660.http://www.genetics.org/cgi/content/abstract/180/1/649
Lingle SE, Johnson RM, Tew TL, Viator RP, 2010. Changesin juice quality and sugarcane yield with recurrent selec-tion for sucrose. Field Crops Research 118, 152–157.http://dx.doi.org/10.1016/j.fcr.2010.05.002
Lingle SE, Viator RP, Johnson RM, Tew TL, BoykinDL, 2009. Recurrent selection for sucrose content hasaltered growth and sugar accumulation in sugarcane.Field Crops Research 113, 306–311. http://dx.doi.org/10.1016/j.fcr.2009.06.015
Luquet D, Dingkuhn M, Kim HK, Tambour L, Clement-VidalA, 2006. EcoMeristem, a model of morphogenesis andcompetition among sinks in rice. 1. Concept, validationand sensitivity analysis. Functional Plant Biology 33,309–323. http://dx.doi.org/10.1071/FP05266
Luquet D, Song YH, Elbelt S, This D, Clement-VidalA, Perin C, Fabre D, Dingkuhn M, 2007. Model-assisted physiological analysis of Phyllo, a rice archi-tectural mutant. Functional Plant Biology 34, 11–23.http://dx.doi.org/10.1071/FP06180
Luquet D, Soulie JC, Huet C, Martine JF, 2010. Mod-elling plant morphogenesis and source-sink processes tosupport crop performance phenotyping: Application ofEcomeristem model to sugar cane. In: Wery, J., Shili-Touzi, I., Perrin, A. (eds), Agro 2010: The XIth ESACongress, Montpellier, France. Montpellier: AgropolisInternational, pp. 579–580.
Machado G, 2001. Sugarcane variety notes, An internationaldirectory, 7th. Revision, Piracicaba (Brazil), p. 132.
Manners JM, 2011. Chapter 3, Functional genomics of sug-arcane. In: Kader J-C, Delseny M (eds), Advances inBotanical Research. New York: Academic Press, pp.89–168. http://dx.doi.org/10.1016/B978-0-12-385851-1.00003-2
Martine JF, 2003. Modelisation de la production potentiellede la canne a sucre en zone tropicale, sous conditions ther-miques et hydriques contrastees. Applications du modele.PhD diss., Institut national agronomique, Paris, 131.
Martine JF, 2007. Analysis and forecasting of the sucrosecontent of sugarcane crops during the harvest period inReunion Island. Proceeding of the International SocietySugar Cane Technologists 27, 607–612.
Martine JF, Goze E, Luquet D, Thong-Chane A, Houles X,Soulie JC, Rouan L, Nibouche S, 2010. Exploring the fea-sibility of sugarcane phenotyping using crop models withcontrasted climatic conditions in Reunion island: [PosterAbstract], Agro2010 the XI ESA Congress, Montpellier,29-09-2010, Montpellier, France, pp. 577–578.
Martine J, Lebret P, Bonhomme R, 2001. Effect of soil watercontent, intercepted radiation and temperature on sugarcane sucrose balance and partition. Proceeding of theAustralian Society of Sugar Cane Technologists, XXIVCongress, Brisbane, Australia, 17–21 September 2001 2,58–64.
Martine JF, Siband P, Bonhomme R, 2000. Simulation ofthe maximum yield of sugar cane at different altitudes:
IMPROVEMENT OF YIELD PER SE IN SUGARCANE 235
Effect of temperature on the conversion of radiation intobiomass. Agronomie 19, 3–12.
Matsuoka S, Ferro J, Arruda P, 2009. The Brazilian expe-rience of sugarcane ethanol industry. In Vitro Cellu-lar & Developmental Biology – Plant 45, 372–381.http://dx.doi.org/10.1007/s11627-009-9220-z
McIntyre CL, Jackson M, Cordeiro GM, Amouyal O, Her-mann S, Aitken K, Eliott F, Henry R, Casu R, Bon-nett G, 2006. The identification and characterisationof alleles of sucrose phosphate synthase gene fam-ily III in sugarcane. Molecular Breeding 18, 39–50.http://dx.doi.org/10.1007/s11032-006-9012-7
Meuwissen T, Hayes B, Goddard M, 2001. Prediction of totalgenetic value using genome-wide dense marker maps.Genetics 157, 1819–1829.
Ming R, Del Monte TA, Hernandez E, Moore PH, IrvineJE, Paterson AH, 2002a. Comparative analysis of QTLsaffecting plant height and flowering among closely-related diploid and polyploid genomes. Genome 45, 794–803. http://dx.doi.org/10.1139/g02-042
Ming R, Liu S-C, Lin Y-R, da Silva J, Wilson W, Braga D, vanDeynze A, Wenslaff TF, Wu KK, Moore PH, BurnquistW, Sorrells ME, Irvine JE, Paterson AH, 1998. DetailedAlignment of Saccharum and Sorghum Chromosomes:Comparative Organization of Closely Related Diploidand Polyploid Genomes. Genetics 150, 1663–1682.http://www.genetics.org/content/150/4/1663.abstract
Ming R, Liu S-C, Moore PH, Irvine JE, Paterson AH, 2001.QTL analysis in a complex autopolyploid: Genetic con-trol of sugar content in sugarcane. Genome Research 11,2075–2084. http://dx.doi.org/10.1101/gr.198801
Ming R, Wang Y, Draye X, Moore P, Irvine J, Pater-son A, 2002b. Molecular dissection of complex traitsin autopolyploids: Mapping QTLs affecting sugaryield and related traits in sugarcane. Theoreticaland Applied Genetics 105, 332–345. http://dx.doi.org/10.1007/s00122-001-0861-5
Morgante M, Salamini F, 2003. From plant genomicsto breeding practice. Current Opinion in Biotech-nology 14, 214–219. http://dx.doi.org/10.1016/S0958-1669(03)00028-4
Nibouche S, Martine JF, Luquet D, Goze E, Rouan L, CostetL, D’Hont A, Soulie JC, Thong-Chane A, 2010. TheDELICAS projet: Model assisted phenotyping in sugar-cane for the identification of marker-trait associations. In:Wery, J., Shili-Touzi, I., Perrin, A. (eds), Agro 2010:The XIth ESA Congress, Montpellier, France. Montpel-lier: Agropolis International, pp. 541–542.
Nordborg M, Tavare S, 2002. Linkage disequilibrium: Whathistory has to tell us. Trends in Genetics 18, 83–90.http://dx.doi.org/10.1016/S0168-9525(02)02557-X
O’Leary GJ, 2000. A review of three sugarcane sim-ulation models with respect to their prediction ofsucrose yield. Field Crops Research 68, 97–111.http://dx.doi.org/10.1016/S0378-4290(00)00112-X
Pastina M, Malosetti M, Gazaffi R, Mollinari M, Mar-garido GRA, Oliveira K, Pinto L, Souza A, van
Eeuwijk F, Garcia AAF, 2012. A mixed model QTLanalysis for sugarcane multiple-harvest-location trialdata. Theoretical and Applied Genetics 124, 835–849.http://dx.doi.org/10.1007/s00122-011-1748-8
Paterson AH, Bowers JE, Bruggmann R, Dubchak I, Grim-wood J, Gundlach H, Haberer G, Hellsten U, MitrosT, Poliakov A, 2009. The Sorghum bicolor genomeand the diversification of grasses. Nature 457, 551–556.http://dx.doi.org/10.1038/nature07723
Paterson AH, Schertz KF, Lin YR, Liu SC, Chang YL,1995. The weediness of wild plants: Molecular anal-ysis of genes influencing dispersal and persistenceof johnsongrass, Sorghum halepense (L.) Pers. Pro-ceedings of the National Academy of Sciences 92,6127.
Pinto L, Garcia AAF, Pastina M, Teixeira LHM, Bres-siani J, Ulian E, Bidoia MAP, Souza A, 2010.Analysis of genomic and functional RFLP derivedmarkers associated with sucrose content, fiber andyield QTLs in a sugarcane (Saccharum spp.) commer-cial cross. Euphytica 172, 313–327. http://dx.doi.org/10.1007/s10681-009-9988-2
Piperidis G, D’Hont A, 2001. Chromosome compositionanalysis of various Saccharum interspecific hybrids bygenomic in situ hybridisation (GISH). Australian Societyof Sugar Cane Technologists 24, 565–566.
Piperidis G, Piperidis N, D’Hont A, 2010. Molecular cyto-genetic investigation of chromosome composition andtransmission in sugarcane. Molecular Genetics andGenomics 284, 65–73. http://dx.doi.org/10.1007/s00438-010-0546-3
Piperidis N, Jackson P, D’Hont A, Besse P, Hoarau J-Y, Courtois B, Aitken K, McIntyre C, 2008. Com-parative genetics in sugarcane enables structured mapenhancement and validation of marker-trait associations.Molecular Breeding 21, 233–247. http://dx.doi.org/10.1007/s11032-007-9124-8
Price AL, Patterson NJ, Plenge RM, Weinblatt ME,Shadick NA, Reich D, 2006. Principal components anal-ysis corrects for stratification in genome-wide asso-ciation studies. Nature Genetics 38, 904–909. http://dx.doi.org/10.1038/ng1847
Pritchard JK, Stephens M, Donnelly P, 2000. Infer-ence of population structure using multilocus genotypedata. Genetics 155, 945–959. http://www.genetics.org/cgi/content/abstract/155/2/945
Prudent M, Lecomte A, Bouchet JP, Bertin N, Causse M,Genard M, 2011. Combining ecophysiological modellingand quantitative trait locus analysis to identify key ele-mentary processes underlying tomato fruit sugar concen-tration. Journal of Experimental Botany 62, 907–919.http://dx.doi.org/10.1093/jxb/erq318
Quilot B, Genard M, Kervella J, Lescourret F, 2004.Analysis of genotypic variation in fruit flesh totalsugar content via an ecophysiological model applied topeach. Theoretical and Applied Genetics 109, 440–449.http://dx.doi.org/10.1007/s00122-004-1651-7

236 TRANSLATIONAL GENOMICS FOR CROP BREEDING
Quilot B, Kervella J, Genard M, Lescourret F, 2005.Analysing the genetic control of peach fruit qualitythrough an ecophysiological model combined with aQTL approach. Journal of experimental botany 56, 3083–3092. http://dx.doi.org/10.1093/jxb/eri305
Raboin L-M, Pauquet J, Butterfield M, D’Hont A, Glasz-mann J-C, 2008. Analysis of genome-wide linkage dise-quilibrium in the highly polyploid sugarcane. Theoreticaland Applied Genetics 116, 701–714. http://dx.doi.org/10.1007/s00122-007-0703-1
Raboin L, Oliveira K, Lecunff L, Telismart H, Roques D, But-terfield M, Hoarau J, D’Hont A, 2006. Genetic mappingin sugarcane, a high polyploid, using bi-parental progeny:Identification of a gene controlling stalk colour and a newrust resistance gene. Theoretical and Applied Genetics112, 1382–1391. http://dx.doi.org/10.1007/s00122-006-0240-3
Raboin LM, 2005. Genetique de la resistance au charbonde la canne a sucre cause par Ustilago scitaminea: Car-acterisation de la diversite genetique du pathogene, car-tographie de QTL dans un croisement bi-parental et etuded’associations dans une population de cultivars mod-ernes. ENSAM, Montpellier, France, p. 119.
Rafalski A, Morgante M, 2004. Corn and humans: Recom-bination and linkage disequilibrium in two genomesof similar size. Trends in Genetics 20, 103–111.http://dx.doi.org/10.1016/j.tig.2003.12.002
Reffay N, Jackson PA, Aitken KS, Hoarau JY, D’HontA, Besse P, McIntyre CL, 2005. Characterisation ofgenome regions incorporated from an important wildrelative into Australian sugarcane. Molecular Breed-ing 15, 367–381. http://dx.doi.org/10.1007/s11032-004-7981-y
Reymond M, Muller B, Leonardi A, Charcosset A, TardieuF, 2003. Combining quantitative trait loci analysis andan ecophysiological model to analyze the genetic vari-ability of the responses of maize leaf growth to temper-ature and water deficit. Plant Physiology 131, 664–675.http://dx.doi.org/10.1104/pp.013839
Roach B, 1989. Origin and improvement of the genetic baseof sugarcane. Proceeding of Australian Society of SugarCane Technologists 11, 34–47.
Rossi M, Araujo PG, Paulet F, Garsmeur O, Dias VM,Chen H, Van Sluys MA, D’Hont A, 2003. Genomicdistribution and characterization of EST-derived resis-tance gene analogs (RGAs) in sugarcane. MolecularGenetics and Genomics 269, 406–419. http://dx.doi.org/10.1007/s00438-003-0849-8
Sills GR, Bridges W, Al-Janabi SM, Sobral BWS, 1995.Genetic analysis of agronomic traits in a cross betweensugarcane (Saccharum officinarum L.) and its presumedprogenitor (S. robustum Brandes & Jesw. ex Grassl).Molecular Breeding 1, 355–363. http://dx.doi.org/10.1007/BF01248413
Simmonds NW, 1979. The impact of plant breeding on sug-arcane yields in Barbados. Tropical Agriculture, Trinidad56, 289–300.
Souza GM, Berges H, Bocs S, Casu R, D’Hont A, FerreiraJE, Henry R, Ming R, Potier B, Van Sluys MA, 2011. Thesugarcane genome challenge: Strategies for sequencing ahighly complex genome. Tropical Plant Biology 4, 145–156. http://dx.doi.org/10.1007/s12042-011-9079-0
Tew TL, Cobill RM, 2008. Genetic Improvement of Sugar-cane (Saccharum spp.) as an energy crop. In: Vermerris W(ed) Genetic improvement of bioenergy crops. New York:Springer, pp. 273–294. http://dx.doi.org/10.1007/978-0-387-70805-8_9
Vettore AL, Da Silva FR, Kemper EL, Souza GM, Da SilvaAM, Ferro MIT, Henrique-Silva F, Giglioti AA, LemosMVF, Coutinho LL, 2003. Analysis and functional anno-tation of an expressed sequence tag collection for trop-ical crop sugarcane. Genome Research 13, 2725–2735.http://dx.doi.org/10.1101/gr.1532103
Waclawovsky AJ, Sato PM, Lembke CG, Moore PH,Souza GM, 2010. Sugarcane for bioenergy produc-tion: An assessment of yield and regulation of sucrosecontent. Plant Biotechnology Journal 8, 263–276.http://dx.doi.org/10.1111/j.1467-7652.2009.00491.x
Walker DA, 2009. Biofuels, facts, fantasy, and feasi-bility. Journal of Applied Phycology 21, 509–517.http://dx.doi.org/10.1007/s10811-009-9446-5
Wang J, Roe B, Macmil S, Yu Q, Murray J, Tang H,Chen C, Najar F, Wiley G, Bowers J, Van Sluys M-A, Rokhsar D, Hudson M, Moose S, Paterson A, MingR, 2010. Microcollinearity between autopolyploid sugar-cane and diploid sorghum genomes. BMC Genomics 11,261. http://www.biomedcentral.com/1471–2164/11/261
Wei X, Jackson P, McIntyre C, Aitken K, Croft B, 2006.Associations between DNA markers and resistance todiseases in sugarcane and effects of population substruc-ture. Theoretical and Applied Genetics 114, 155–164.http://dx.doi.org/10.1007/s00122-006-0418-8
Wei X, Jackson PA, Hermann S, Kilian A, Heller-UszynskaK, Deomano E, 2010. Simultaneously accounting forpopulation structure, genotype by environment inter-action, and spatial variation in marker-trait associ-ations in sugarcane. Genome 53, 973–981. http://dx.doi.org/10.1139/G10-050
Wong C, Bernardo R, 2008. Genomewide selection inoil palm: Increasing selection gain per unit time andcost with small populations. Theoretical and AppliedGenetics 116, 815–824. http://dx.doi.org/10.1007/s00122-008-0715-5
Wu K, Burnquist W, Sorrells M, Tew T, Moore P,Tanksley S, 1992. The detection and estimation of link-age in polyploids using single-dose restriction frag-ments. Theoretical and Applied Genetics 83, 294–300.http://dx.doi.org/10.1007/BF00224274
Xu Y, Crouch JH, 2008. Marker-assisted selection in plantbreeding: From publications to practice. Crop Sci-ence 48, 391–407. http://dx.doi.org/10.2135/cropsci2007.04.0191.
Yin X, Kropff MJ, Stam P, 1999. The role of ecophys-iological models in QTL analysis: The example of

IMPROVEMENT OF YIELD PER SE IN SUGARCANE 237
specific leaf area in barley. Heredity 82, 415–421.http://dx.doi.org/10.1038/sj.hdy.6885030
Yin X, Stam P, Kropff MJ, Schapendonk AHCM, 2003.Crop Mmdeling, QTL mapping, and their complemen-tary role in plant breeding. Agronomy Journal 95, 90–98.http://dx.doi.org/10.2134/agronj2003.9000
Yu J, Pressoir G, Briggs WH, Vroh Bi I, Yamasaki M, Doe-bley JF, McMullen MD, Gaut BS, Nielsen DM, HollandJB, Kresovich S, Buckler ES, 2006. A unified mixed-model method for association mapping that accounts formultiple levels of relatedness. Nature Genetics 38, 203–208. http://dx.doi.org/10.1038/ng1702