Embed Size (px)
Citation preview

TransmissionTen-YearDevelopmentPlan2013-2022

Transmission Ten-Year Plan 2013 – 2022
© Eskom 2013 i© Eskom 2013
A reliable electricity supply of acceptable quality is essential for the economic development of South Africa. It is also a prerequisite for socio-economic development, as it paves the way to access to education, improved nutrition and health care, and jobs, amongst others. The transmission system plays a vital role in the delivery of a reliable, high quality electricity supply throughout South Africa and the region, by delivering electricity in bulk to load centres and very large end-users. From there, the distribution networks owned by Eskom and municipalities deliver electricity to end-users. The transmission system needs to be well-maintained to deliver a reliable supply of electricity, and it also needs to be strengthened to meet changing customer needs.
The National Energy Regulator of South Africa (NERSA) is the custodian of the South African Grid Code, which contains the rules governing investment in the transmission network. Eskom, as the licensed Transmission Network Service Provider, plans the network according to this Code, and subject to funding and other resource constraints, builds the network according to these plans. Where insufficient funds are available to develop the network, a consistent set of rules is applied to prioritise projects and allocate funding in such a way that the maximum benefit is gained for Eskom and South Africa, whilst ensuring alignment of this plan to the IRP 2010 country plan and fair and equitable access to the grid for Independent Power Producers (IPPs), as well as Eskom Generation.
The plans are firstly focused on ensuring that the network complies with the minimum reliability criteria specified in the Grid Code for both loads and power stations. Secondly, the new power stations
developed by Eskom and IPPs must be connected to the network. The first two phases of preferred bidders for the Department of Energy’s REFIT renewable energy programme (wind, solar photovoltaic, solar thermal, etc.) have been announced to help meet South Africa’s commitment to reduce carbon emissions. Thirdly, new loads need to be connected to the network.
The provision of a reliable electricity supply, which will enable South Africa to meet its economic growth targets, requires significant capital investment, which is ultimately funded by electricity consumers through the tariff. There is a need for stakeholders to understand what is required to ensure a reliable and secure supply. Improved reliability and quality of electricity supply needs to be balanced against the cost of providing it, to create maximum value for South Africa. I hope that this document will assist in this dialogue, and I welcome comments and queries on the content and format.
I would also like to take this opportunity to thank the team that has worked and continues to work on the development of these plans. It is a difficult and complex process, requiring extensive consultation and multiple iterations.
Mongezi Ntsokolo
GROUP EXECUTIVE (TRANSMISSION)
The purpose of publishing the Transmission Ten-Year Plan is to inform stakeholders about the proposed developments in the Eskom transmission network. These plans are subject to change as and when better technical solutions are identified or when more accurate developmental information becomes available. The information contained in Transmission’s Ten-Year Plan should therefore not be used for any other purpose other than for sharing this information.
The contents of this document do not constitute advice and Eskom makes no representations regarding the suitability of using for any purpose the information contained in this document. All such information is provided “as is” without warranty of any kind and is subject to change without notice. The entire risk arising from its use remains with the recipient. In no event shall Eskom
be liable for any direct, consequential, incidental, special, punitive or any other damages whatsoever, including but not limited to damages for loss of business profits, business interruption or loss of business information.
Although the Transmission Ten-Year Plan is updated periodically, Eskom makes no representation or warranty as to the accuracy, reliability, validity or completeness of the information contained in this document. Eskom does, however, endeavour to release plans based on the best available information at its disposal at all times to ensure that stakeholders are kept informed about developments in the transmission network. Therefore the information contained in this document represents the most up-to-date information that was available at the time it was released.
> FOREWORD BY GROUP EXECUTIVE
> DISCLAIMER
“I would also like to take this opportunity to thank the team that has worked and continues to work
on the development of these plans.”
Transmission Ten-Year Plan 2013 – 2022ii Transmission Ten-Year Plan 2013 – 2022
Eskom Holdings is a vertically integrated company licensed to generate, transmit and distribute electricity in South Africa. The Transmission Division of Eskom Holdings has the responsibility of developing the transmission network. The publication of the Transmission Ten-Year Plan is to inform stakeholders about Eskom’s plans for the development of the transmission network. This publication fulfils the requirements of the South African Grid Code, which requires the Transmission Network Service Provider (TNSP) to publish plans annually on how the network will develop. This is the fourth publication of the Transmission Ten-Year Plan.
A public forum will be held with identified stakeholders to disseminate further and get feedback on the contents of this plan. These comments will be taken into account when the plan is revised. This publication contains information about projects intended to extend or reinforce the transmission system, which have been completed in the past year, as well as about projects which are planned for the next ten years.
The transmission network is the primary network of interest covered in this publication. This covers electrical networks with voltages ranging from 220kV to 765kV and the transmission substations where these networks terminate. A few 88kV and 132kV electrical networks are included due to their strategic nature.
The projects covered in this document include the generation integration projects required to ensure that the network is adequate to evacuate and dispatch power from the source to the load centres. The publication also includes the plans for strengthening the transmission network that is required to carry the power from the new power stations, and the reliability projects required to ensure that the reliability and adequacy of the transmission network are sustained as load demand increases on the network.
The estimated rand value of the planned projects is approximately R149 billion (excluding IDC) in the next ten years, of which approximately R3 billion is for customer related projects; R25 billion for generation integration projects, and approximately R121 billion is related to reliability projects. The costs given in the document are, in general, high-level estimates and can change as global economic conditions change; that is, costs are sensitive to fluctuations in foreign exchange and commodity prices and to global demand.
In general, the impact of reliability projects on the customers is to improve availability of supply under normal and contingency operating conditions, whereas customer and generation integration projects allow generating plant and the load to be optimally connected to the network.
Eskom Transmission also undertakes capital expenditure in respect of the refurbishment of ageing infrastructure, facilities, production equipment and strategic capital spares. Facilities consist of buildings located at sites other than substations, which Transmission uses for offices, the operation and control of the system, or as maintenance depots and workshops. Production equipment consists of vehicles, office furniture and equipment, computer hardware and software, tools and other equipment used by maintenance staff. Strategic capital spares are items not available from suppliers ex stock, for example: large power transformers, circuit breakers, etc., that are kept as a strategic stock to allow units which fail in service and cannot be repaired on site, to be replaced as soon as practicable, thereby minimising the risk that customers may experience a lengthy outage.
Projects dealing with the refurbishment of ageing infrastructure, facilities, production equipment and strategic capital spares are not explained in greater detail in this document, but a summary of their costs appears in the chapter dealing with capital expenditure.
> EXECUTIVE SUMMARY
“The publication of the Transmission Ten-Year Plan is to inform
stakeholders about Eskom’s plans for the development of the
transmission network.”

© Eskom 2013 iii© Eskom 2013
FOREWORD BY GROUP EXECUTIVE (TRANSMISSION) i
DISCLAIMER i
EXECUTIVE SUMMARY ii
CONTENTS iii
TABLE OF FIGURES iv
ABBREVIATIONS v
1. INTRODUCTION 1 1.1 CONTEXT OF THE TRANSMISSION TEN-YEAR PLAN 1 1.2 STRUCTURE OF THE DOCUMENT 1
2. LOAD DEMAND FORECAST AND GENERATION ASSUMPTIONS 2 2.1 LOAD FORECAST 2 2.2 GENERATION ASSUMPTIONS 3
3. MAJOR FACTOR CHANGES FROM PREVIOUS TDP 8
4. UPDATE ON PROJECTS AND CONNECTION APPLICATIONS 9 4.1 UPDATE ON TRANSMISSION RELIABILITY 9 4.2 GRID CONNECTIONS APPLICATIONS 10
5 NATIONAL OVERVIEW 11
6 BREAKDOWN OF THE TDP PROJECTS BY GRID 13 6.1 GAUTENG PROVINCE (GP) 13 6.2 KWAZULU NATAL (KZN) PROVINCE 18 6.3 LIMPOPO (LIM) PROVINCE 22 6.4 MPUMALANGA PROVINCE (MP) 26 6.5 NORTH WEST (NW) PROVINCE 31 6.6 FREE STATE (FS) PROVINCE 35 6.7 NORTHERN CAPE (NC) PROVINCE 38 6.8 EASTERN CAPE (EC) PROVINCE 42 6.9 WESTERN CAPE (WC) PROVINCE 46 6.10 A PLAN FOR WIND AND SOLAR 50 6.11 STRATEGIC SERVITUDES UNDER INVESTIGATION 51
7 CAPITAL EXPENDITURE PLAN 52
8 CONCLUDING REMARKS 53
APPENDIX A: GENERATION ASSUMPTIONS 54
APPENDIX B: COSTING DETAILS 55 APPENDIX B1: COSTING PER PROJECT TYPE 55 APPENDIX B2A: COSTING FOR GAUTENG PROVINCE PROJECTS 56 APPENDIX B2B: COSTING FOR KZN PROVINCE PROJECTS 57 APPENDIX B2C: COSTING FOR LIMPOPO PROVINCE PROJECTS 57 APPENDIX B2D: COSTING FOR NORTH WESTERN PROVINCE PROJECTS 58 APPENDIX B2E: COSTING FOR MPUMALANGA PROVINCE PROJECTS 58 APPENDIX B2F: COSTING FOR FREE STATE PROVINCE PROJECTS 59 APPENDIX B2G: COSTING FOR NORTHERN CAPE PROVINCE PROJECTS 59 APPENDIX B2H: COSTING FOR EASTERN CAPE PROVINCE PROJECTS 60 APPENDIX B2I: COSTING FOR WESTERN CAPE PROVINCE PROJECTS 61
APPENDIX C: PUBLICATION TEAM 62
APPENDIX D: CONTACT DETAILS 63
> CONTENTS

Transmission Ten-Year Plan 2013 – 2022iv Transmission Ten-Year Plan 2013 – 2022
Figure 2.1: The Eskom Transmission System demand Forecast 3Figure 2.2: Power station capacity introduction by year 7Figure 2.3: Planned Power Station Capacity by 2022 7Figure 5.1: Map showing relative location of the major TDP scheme projects 11Figure 6.1: Current Gauteng Province network and CLNs 13Figure 6.2: Gauteng Province network diagram 17Figure 6.3: Current KZN Province network and CLNs 18Figure 6.4: KZN Province geographical network diagram 21Figure 6.5: Current Limpopo Province network and CLNs 22Figure 6.6: Limpopo Province geographical network diagram 25Figure 6.7: Current Mpumalanga network and CLNs 26Figure 6.8a: Mpumalanga Province network diagram 30Figure 6.8b: Mpumalanga Province (Inset Map) network diagram 30Figure 6.9: Current North West Province network and CLNs 31Figure 6.10: North West Province geographical network diagram 34Figure 6.11: Current Free State Province network and CLNs 35Figure 6.12: Free State Province geographical network diagram 37Figure 6.13: Current Northern Cape Province network and CLNs 38Figure 6.14: Northern Cape Province geographical network diagram 41Figure 6.15: Current Eastern Cape Province network and CLNs 42Figure 6.16: The Eastern Cape Province network diagram 45Figure 6.17: Current Western Province network and CLNs 46Figure 6.18: Western Cape Province geographical network diagram 49Figure 6.19: Round 1 and 2 of DOE Renewable Energy Preferred Bidders – Transmission Connections 50
Table 4.1: Connection applications quoted and accepted 10Table 5.1: Major TDP transmission assets expected to be installed 11Table 6.1: Gauteng Province CLN load forecast and percentage load increases 13Table 6.2: New transmission assets for the Gauteng Province 14Table 6.3: KZN Province CLN load forecast and percentage load increase 18Table 6.4: KZN Province new transmission assets 19Table 6.5: Limpopo Province CLN load forecast and percentage load increases 22Table 6.6: Limpopo Province new transmission assets 23Table 6.7: Mpumalanga Province CLN load forecast and percentage load increases 26Table 6.8: Cumulative TDP transmission assets for the Mpumalanga Province 27Table 6.9: North West Grid CLN load forecast and percentage load increases 31Table 6.10: Cumulative assets for North West Province 32Table 6.11: Free State Province CLN load forecast and percentage load increases 35Table 6.12: Cumulative assets for Free State Province 36Table 6.13: Northern Cape Province CLN load forecast and percentage load increases 38Table 6.14: Cumulative assets for Northern Cape Province 39Table 6.15a: Eastern Cape Province CLN load forecast and percentage load increases 42Table 6.15b: Cumulative TDP transmission assets for the Eastern Cape Province 43Table 6.16: Western Cape Province CLN loads and percentage load increases 46Table 6.17: Cumulative TDP transmission assets for the Western Cape Province 47Table 7.1: Capital Expenditure (10 Year Plan) for different categories of projects 52Table 7.2: Capital expenditure per project type 52
> TABLE OF FIGURES
> LIST OF TABLES

© Eskom 2013 v© Eskom 2013
CLN (Customer Load Network) The network within a specific geographical area, which in turn is a subdivision of a Grid, e.g. Johannesburg CLN falls within the Central Grid
DOE – Department of Energy
TNSP (Transmission Network Service Provider) A legal entity that is licensed to own, operate, and maintain a transmission network
MW (Megawatt) A million watts – a watt is a unit of electrical power production or demand
MVAr (Megavolt-ampere reactive) A million volt-amperes reactive – a volt-ampere reactive is a unit of the electrical power required to maintain electromagnetic fields
MVA (Megavolt-ampere) A million volt-amperes of apparent power, being the vector sum of real power (MW) and reactive power (MVAr)
NERSA (National Energy Regulator of South Africa) The body established by an Act of Parliament to regulate the production, sale, and pricing of electricity, liquid fuels, and fuel gas in South Africa
MTS – Main Transmission Substation These are substations owned and operated by a TNSP
RTS – Return to Service A previously mothballed Power Station undergoing re-commissioning
REFIT – Renewable Energy Feed in Tariff The NERSA promulgated tariffs payable to producers of renewable energy
RE – Renewable Energy
IPP – Independent Power Producer These are power stations owned by independent parties other than Eskom
TDP – Transmission Development Plan A development plan produced annually by Grid Planning detailing how the network will develop in the next ten years. This comprises the proposed new projects listed in this document as well as the customer projects omitted from this document owing to their commercial sensitivity.
OCGT – Open Cycle Gas Turbine Combustion turbine fuelled by liquid fuel or gas, used to drive a generator
CCGT – Combined Cycle Gas Turbine OCGT fitted with a waste heat recovery boiler and steam turbines to increase electricity output by using the combustion turbine’s exhaust gases to raise steam
HVDC – High Voltage Direct Current
IQ – Indicative Quote Quotation giving a non-binding indication of the order of magnitude costs
FQ – Feasibility Quote Quotation giving customers costs and scope at a 65% accuracy level
BQ – Budget Quote Quotation giving customers costs and scope at an 85% accuracy level
TOSP – Time of System Peak
> ABBREVIATIONS

1 Transmission Ten-Year Plan 2013 – 2022
1.1 CONTEXT OF THE TRANSMISSION TEN-YEAR PLAN
Eskom Holdings is the biggest producer of electricity in South Africa; it also transmits electricity via a transmission network which supplies electricity at high voltages to a number of key customers and distributors. Eskom is a vertically integrated company licensed to generate, transmit and distribute electricity. The transmission licence is held by Eskom Transmission, the transmission network service provider (TNSP). Planning the transmission network is the responsibility of the Grid Planning Department in the Transmission Division.
The TNSP is required to abide by the regulatory requirements to publish a document annually, detailing the plans for the way that the transmission network will develop in the next five years. This plan covers a 10 year window. The requirements furthermore stipulate that the published document should include –
• the acquisition of servitudes for strategic purposes;
• a list of planned investments, including costs;
• diagrams displaying the planned changes to the transmission system (TS);
• an indication of the impact on customers in terms of service quality and cost; and
• any other information as specified by NERSA from time to time.
A further requirement is that the TNSP should hold public forums to share such plans with stakeholders in order to facilitate a joint planning process with them. The fourth Ten-Year Plan was published early in October 2011; this is the fifth publication based on the TDP for 2013 to 2022 (also called the 2012 TDP internally to Eskom) which was finalised internally during September 2012.
1.2 STRUCTURE OF THE DOCUMENT
The document is structured in the following manner:
Chapter 2 deals with the electricity demand forecast and generation assumptions. The demand forecast determines how the network is planned and it contextualises the planning activity whereas the generation assumptions outline the generation build that informs some of the planned transmission network, as a significant transmission network is required to evacuate power from the power stations to the load.
Chapter 3 focuses on the major changes that have occurred since the completion of the previous published Yen-Year plan. The changes that occurred include the enhancement of geospatial forecasting, which improves the forecasting of load at a spatial level, and the changes from the previous generation assumptions to the ones informing this plan.
Chapter 4 focuses on projects that have been completed in the past year and the impact they have had on network reliability. This is partly to demonstrate the value of the projects as they are completed and to also inform stakeholders about the progress made with projects so far.
Chapter 5 deals with the national overview, which gives a high-level explanation of the planned transmission infrastructure. This is intended to give a snapshot of the major projects that are planned for the entire period of the Ten-Year Plan and a high-level summary of the installed transmission infrastructure.
Chapter 6 focuses in detail on the planned projects and the impact they will have on the network. Generation integration and reliability projects are discussed per Grid. In both instances, sites and servitudes are required to accommodate substations and lines respectively. In either case, the National Environmental Management Act requires Eskom to conduct an Environmental Impact Assessment (EIA) and obtain environmental approval, which includes consultation with affected stakeholders, prior to construction.
Chapter 7 deals with the capital expenditure of the Ten-Year Plan.
Chapter 8 deals with various conclusions based on the content of this document.
1. INTRODUCTION

2© Eskom 2013
The 10 Year Transmission Development Plan (TDP) seeks to meet the long-term requirements of the electricity consumers in South Africa by maintaining the legislated adequacy and reliability of the transmission grid.
The objective is to produce a plan containing the expected development projects for the transmission system for this 10 year period. These expected projects will consist of the approved projects, the projects that are to be prepared for approval and the projects likely to be taken for approval over the defined period.
In order to undertake the system adequacy studies to determine the weakness in the system, a number of assumptions need to be made. These assumptions are required in order to assure consistency in the network studies and analysis, as well as to inform the organisation of the basis of Transmission Development Plan (TDP) for the defined period.
2.1 LOAD FORECAST
Load forecasting is a fundamental requirement for a Transmission planning cycle. The availability of sufficient transmission network capacity in any country is important for economic growth. Grid Planning, in consultation with the relevant Distribution Regions, compiles a forecast per point of supply for the network computer model. A number of improvements have been made to the forecast for this TDP. The most notable improvement is the enhanced spatial format of the forecast as well as a link to the economic forecast for the country in terms of Gross Value Added (GVA) estimates.
At the Combined Forecasting Forum, forecasts were discussed with all parties and it was agreed that the Balanced Base Line System Demand at the time of System Peak (illustrated by the 2012 TDP forecast in Figure 2.1 below) and its associated point of supply and area forecasts would be used for transmission planning purposes by the Grid Planning Department for the Transmission Development Plan (TDP) network studies for the period 2013 to 2022. The expected peak demand for 2022 is 57,8 GW.
2. LOAD DEMAND FORECAST AND GENERATION ASSUMPTIONS

3 Transmission Ten-Year Plan 2013 – 2022
Figure 2.1: The Eskom Transmission System demand Forecast
The 2012 TDP forecast is marginally lower than the 2011 TDP forecast between the years 2012 to 2016. This is attributed to more accurate forecasting linked to spatial forecasting techniques and economic sector growth. This forecast also assumes maximum load usage by existing customers. For the purposes of the TDP, loads are allocated to a CLN according to the location of the transmission substation supplying them, even if they are physically located in a different CLN.
2.2 GENERATION ASSUMPTIONS
The TDP Generation Plan for the period 2013 to 2022 is based on the IRP 2010 report. There is only one Generation Plan to be considered for this TDP update and associated network studies.
In order to achieve the proposed IRP 2010 Plan, a number of assumptions regarding size and location of the future planned generation plant had to be made. These assumptions are discussed below.
Return to Services stations
Komati will be completed in time for the 2013 system peak.
DoE OCGT power stations
The IRP indicates that the Department of Energy (DoE) will implement the two OCGT power stations by 2013 and it is assumed that they will be completed in time for the 2013 system peak. These are assumed to be located as previously proposed by the DoE with one close to the Dedisa MTS and one at close to the Avon MTS. They will be based on 147MW units and will be modelled as follows:
• 2 x 147MW units at Dedisa • 5 x 147MW units at Avon
These will be treated as peaking plant and in the TDP studies where they will only be used under contingency conditions, or, if required, during system peak. However for integration studies they will be studied at full output under the local Grid peak conditions to ensure that all the power can be evacuated.
70000
65000
60000
55000
50000
45000
40000
35000
30000
7.00%6.50%6.00%5.50%5.00%4.50%4.00%3.50%3.00%2.50%2.00%1.50%1.00%0.50%0.00%
2011 2012 2013 2014 2015 2016 2017 2018 2019 2020 2021 20222012 TDP Growth (%) 2.7% 3.8% 4.1% 3.5% 3.0% 4.8% 3.0% 1.7% 2.1% 4.6% 1.9%2012 TDP Demand (MW) 40900 42000 43600 45400 47000 48400 50700 52200 53100 54200 56700 578002011 TDP Demand (MW) 40700 43400 44800 46600 47800 49200 50700 52100 52600 54700 55700 56600
Dem
and
(MW
)
Dem
and
Gro
wth
(%
)

4© Eskom 2013
Ingula Pumped Storage
The Ingula pumped storage power station is an approved project. The project has been rescheduled and it is now assumed to have unit 1 completed in time for the 2013 system peak and units 2, 3 and 4 completed in 2014, but unit 4 will only be completed time for the 2015 system peak.
Base Load Coal (Medupi and Kusile)
The Base Load Coal power stations at Medupi and Kusile are approved projects. However both projects have been delayed, particularly Kusile, and the new units are now assumed to be completed between 2013 and 2020 in line with the 2010 IRP.
The first unit for Medupi will come on line in time for the 2013 peak and the last in time for the 2017 peak. The first two units of Kusile will come on line in time for the 2017 peak and the last unit in time for the 2020 peak.
No further large Eskom built base load coal fired power stations are expected for the TDP period of 2013 to 2022.
Co-generation Projects and MTPPP
A total of 390MW of co-generation plant is included in the 2010 IRP by 2013. There is no indication of what size plant and where they will be located. Based on the studies for the proposed SASOL co-generation plant two 200MW units will be assumed to be located at Sol B as per the project studies. The third 200MW unit as assumed for the previous TDP study will not be included until there is clarity on the program. The MTPPP program which offered PPA contracts to any generators that fall below a certain price level was not considered at Transmission level as most will be less than 20MW in size.
New Coal options
The 2010 IRP has provision for new coal fired power stations under the New Build options. These are smaller than the traditional Eskom base load coal power stations and it has been assumed that these will be IPP coal stations with smaller units to match the 2010 IRP requirements.
A total of three new IPPs have been assumed, referred to as Coal IPP 1, Coal IPP 2 and Coal IPP 3. The first two, Coal IPP 1 and Coal IPP 2, have been allocated as two 600MW stations for 2014 and 2015 based on current IPP projects under investigation. This is slightly in excess of the two 500MW stations in the 2010 IRP. Coal IPP 1 will be in the Mpumalanga Province in the Witbank area and Coal IPP 2 will be in the Limpopo Province in the Lephalale area.
The final 2010 IRP allocation of 1000MW from 2019 to 2022 was allocated to the Mpumalanga and Limpopo Provinces.

5 Transmission Ten-Year Plan 2013 – 2022
Wind Generation
The Government RE IPP program (previously known as REFIT) has gone out for procurement for the following:
• Wind • Small hydro • Landfill gas • Concentrated Solar • Photovoltaic (PV)
The majority of the RE IPP is expected to be wind generation. This is reflected in the 2010 IRP with 4400MW of wind allocated by 2022, including the Eskom 100MW Sere project. A total of 400MW has been added each year from 2012 (which has been assumed to be available for the 2013 system peak) until 2022.
Based on the response and knowledge of status of some of the IPP developers in terms of connection application, cost estimate letter and EIA status a number of proxy IPP wind farms have been allocated with unit sizes varying from 30MW to 140MW for the 2012/2013 allocation (i.e. available for the 2013 system peak). These have been placed at the following substations to be connected to their 132kV busbars:
• Aurora • Delphi • Droerivier • Grassridge • Juno • Palmiet • Poseidon
From 2014 onwards to 2022 the wind generation has been allocated as 100MW units to various transmission substations (four per year) to determine the overall impact on the transmission power flows. The locations are aligned overall by 2022 to the expected “Wind Area” allocation assumed in the “Assumptions Paper for the 2040 Transmission Network Study”, report GP_11/102 dated August 2011. The units are connected to the 66kV, 132kV or 220kv busbars of the Transmission Substations as appropriate.
Without the actual location and size of the wind farms it is difficult to determine the exact transmission requirements for the TDP. Taking into account that the normal average load factor of wind farms is of the order of 25% to 35%, this means that they will not have a significant impact on the capacity design of the network. The impact is very localised and it is proposed that all wind farm applications will be handled on a case by case basis.

6© Eskom 2013
Concentrated Solar Power (CSP) Generation
The Concentrated Solar Power (CSP) generation has been set at 900MW in the 2010 IRP document. This is expected to increase again in later versions of the IRP. For the purposes of this TDP update the 900MW is assumed to be nine 100MW plants connected in the Upington and Paulputs areas.
Based on the assessment of the potential bidders in the RE IPP program the first units to come on line are expected in the Paulputs and Upington area and according to the 2010 IRP will be in by 2014. It will be modelled as a 100MW unit connected directly to the existing 220kV busbar of Paulputs substation and another 100MW unit connected to a Distribution substation (Gordonia) which is linked to the Garona Transmission substation.
The rest of the CSP plants are expected to be connected in the Upington area in line with proposed 1000MW Solar Park proposal that was studied in 2011. For the purposes of the studies the 100MW units will be modelled at a new 400kV busbar at Upington, initially connected to the new Nieuwehoop substation by a single 400kV line. The integration of the Upington 400kV substation will be in accordance with the proposed 1000MW Solar Park scheme. One 100MW unit will be added each year starting from 2015 up until 2022.
These units will be run at maximum output during the both the System peak and the Local peak. They will not be run during the low load conditions at night.
Open and Combined Cycle Gas Generation (OCGT & CCGT)
There are a number of Open Cycle Gas Turbine (OCGT) and Combined Cycle Gas Turbine (CCGT) generation plants proposed as New Build options in the 2010 IRP, giving a total of 711MW OCGT and 805MW CCGT. Based on the assumption that the CCGT would require a LNG plant and that a minimum of 2000MW would be required to make this economically viable, Dedisa has been selected as the site. This will result in more than 2000MW of gas generation in the COEGA area to allow for a LNG plant.
The unit sizes at Dedisa to match the 2010 IRP have been assumed as follows:
• OCGT (2 x 237MW) from 2019 to 2021 • CCGT (3 x 269MW) in 2022
In the previous TDP it was assumed that a number of 237MW units were installed at the existing OCGT sites of Gourikwa, Avon and Dedisa based on the then draft IRP expectations. The new assumptions are in line with the official 2010 IRP.
The OCGT units are to be run only as peaking units and only to be despatched as the last resort due to their operating costs. The CCGT units can be run at Time-of-System Peak and local Time-of-Grid peak if required as they are more efficient than OCGT units. However they should not be run during Low Load conditions.
Imported Hydro power
In the 2010 IRP there is an assumption of 1143MW of imported hydro power in 2022. The most likely location is from Northern Mozambique. This will be transported down to the Maputo area via the proposed Mozambique Transmission Backbone project (referred to as CESUL). This will in effect relocate the power to Maputo. For the purposes of the TDP studies this will relieve the MOZAL load in Maputo which Eskom are required to supply. Therefore the hydro import can be modelled as two 570MW generators placed at the Maputo 400kV substation to relieve this load. This import option will be studied in detail as a separate study and only serves to hold the place for the potential generation.
PV and the other RE IPP Renewable Generation
A significant amount of PV has been allocated under New Build options in the 2010 IRP with over 3300MW by 2022. However, there is no indication of location or size per location. PV can only operate when there is sunlight and will therefore not be available for the system peak which occurs in the evening during winter. Effectively PV does not contribute to meeting the peak system demand and can be ignored.
While it is acknowledged that the cumulative effect of PV during the daylight hours will have an impact, particular at peak output during low daytime loading or connected to other generation injection points on the transmission grid, PV will not be modelled for the TDP studies for this TDP update. The initial PV installations will be absorbed in the Distribution networks and any large PV installations will be studied on a case by case basis. When more detailed information on the location and sizing of PV installations is available this will be included in the assumptions for the next TDP update.

7 Transmission Ten-Year Plan 2013 – 2022
Decommissioning of Coal Units
The 2010 IRP indicates that the first decommission of large coal units will start in 2022. This will be an equivalent of five 380MW units at Camden in 2022. This will be assumed for these TDP update studies.
New generation summary
A summary of the new plant and the year that the last unit at the power station will become commercially available appear in Appendix A. These generation units were assumed to be in service at the expected dates. This is graphically illustrated in Figure 2.2 and Figure 2.3 below.
Grootvlei
Ingula
Hydro Import Maputo
Komati
Kusile
New Coal
OCGT 1 (Dedisa)
Wind
Co-Gen
OCGT 2 (Avon)
Solar
Medupi
CCGT Dedisa
Figure 2.2: Power station capacity introduction by year
Assumed New Generation Capacity 2012 TDP-Plan
Solar
Kusile
Medupi
Figure 2.3: Planned Power Station Capacity by 2022
25000
20000
15000
10000
5000
02013 2014 2015 2016 2017 2018 2019 2020 2021 2022

8© Eskom 2013
There have been some changes in the factors influencing the selection and timing of projects for this TDP from the previous TDP. The main factor was related to an even better understanding of the geospatial load centres and forecast, and the potential generation scenarios. These two factors are briefly discussed in this section as background to the motivation of the projects and their timing in the TDP.
3.1 Geospatial Load Forecast
The 2012 TDP forecast is marginally lower than the 2011 TDP forecast between the years 2012 to 2016. This is attributed to more accurate forecasting linked to spatial forecasting techniques and economic sector growth. This forecast also assumes maximum load usage by existing customers. For the purposes of the TDP, loads are allocated to a CLN according to the location of the transmission substation supplying them, even if they are physically located in a different CLN.
3.2 Generation Assumptions
A number of generation projects that were assumed to be in place for the TDP studies for the period 2011 to 2020 have been changed in the generation assumptions for this TDP update period. These are discussed below.
Medupi and Kusile schedules
The Medupi and Kusile projects have both had their rollout periods extended with Medupi only completed in 2017 instead of 2015 and the first unit of Kusile delayed from 2015 to 2017. Kusile will only be completed in 2020 instead of 2019.
Co-Generation SASOL
This has been reduced from three 200MW to two 200MW units, but will be completed by 2013 instead of 2015.
Wind Generation
The wind generation was assumed to be 200MW units at various locations for the previous TDP which has now been changed to 100MW units at various locations in line with the 2010 IRP schedule.
CSP locations
In the previous TDP it was assumed that 100MW units would be placed at Upington, Ferrum and Gordonia. This has been changed to one 100MW unit at Paulputs, one 100MW unit in the Upington area connected at Gordonia and seven 100MW units at a new Upington 400kV transmission substation (100MW per year in line with the 1000MW Solar Park proposal).
Gas Generation
New CCGT gas generation was allocated at three sites in the previous TDP, namely Gourikwa, Avon and Dedisa. For this TDP update all new gas generation (OCGT & CCGT) have been placed at Dedisa based on the minimum generation of 2000MW to economically justify the required LNG plant.
Hydro import
The previous TDP had hydro power imported from Mozambique in 2020 and 2021. This has been changed to a single import value in 2022.
3. MAJOR FACTOR CHANGES FROM PREVIOUS TDP

9 Transmission Ten-Year Plan 2013 – 2022
4.1 UPDATE ON TRANSMISSION RELIABILITY
This section discusses all the projects completed since the year 2010 and projects projected to be completed by the end of the 2012/13 Financial Year. The project list excludes Feeder Bay projects resulting from Connection Applications received.
Completed Projects:
SUB-PROJECT NAME Province
Gamma Ext 765kV busbar establishment WC
Beta - Perseus 1st 765kV line FS
Gamma - Perseus 1st 765kV line FS
Mercury - Perseus 1st 765kV (Operate @ 400kV) FS
Perseus Ext 765/400kV transformation FS
Relocate Beta - Hydra 765kV line to form Perseus - Hydra 1st 765kV line FS
Zeus - Mercury 1st 765kV line (to form Zeus - Perseus 1st 765kV) (By-pass Mercury) FS
Hydra - Gamma 1st 765kV line WC
Series Compensation on Mercury - Perseus 1st 765kV line FS
Series Compensation on Zeus - Mercury 1st 765kV line FS
Zeus 400kV By-pass (create new Camden - Sol 1st & 2nd 400kV lines) MP
Khanyazwe (Malelane) 275kV loop-in (Marathon - Komatipoort 1st 275kV line) MP
Khanyazwe (Malelane) 275/132kV Substation (1st 250MVA 275/132kV transformer) MP
Medupi - Spitskop 1st 400kV line Lim
Medupi - Spitskop 2nd 400kV Line Lim
Bighorn 2nd 800MVA 400/275kV transformer NW
Phase 1: Sishen - Saldanha Spoornet new traction stations (1x275/50kV substation with 2x40MVA transformers) NC
Hera - Bernina 275kV Link closed (uprate of breakers) GP
Projects planned to be completed by FY 2012/13:
SUB-PROJECT NAME Province
Series Compensation on Alpha-Beta 1st and 2nd 765kV lines FS
Nevis 275kV Turn-in 1 (Matla-Esselen 1st 275kV) (disconnect the two Nevis-Matla section 275kV lines) GP
Snowdown Upgrade 3x 160MVA 275/88kV transformers GP
Glockner Ext 3rd 800MVA 400/275kV transformer GP
Croydon Ext 3rd 250MVA 275/132kV transformer GP
Eiger Ext 3rd 80MVA 88/33kV transformer GP
Esselen Ext 2nd 315MVA 275/88kV transformer GP
Kookfontein Ext 2x 88kV 48MVAr capacitors GP
Majuba-Umfolozi 1st 765kV line (operate @ 400kV) KZN
Eros Ext 2nd 500MVA 400/132kV transformer KZN
Hector Ext 3rd 800MVA 400/275kV transformer KZN
Spitskop Ext 1st 500MVA 400/132kV transformer Lim
Spencer Ext 2nd 250MVA 275/132kV transformer Lim
Spencer-Tabor 1st 275kV line Lim
Gumeni 132kV line loop-ins (Prairie-Sappi 1st and 2nd 132kV lines) (includes 132kV switchyard) MP
Duvha-Leseding 1st 400kV line MP
Ferrum Ext 132kV 1x 72MVAr shunt capacitors NC
Olien Ext 132kV 2x 36MVAr shunt capacitors NC
4. UPDATE ON PROJECTS AND CONNECTION APPLICATIONS

10© Eskom 2013
4.2 GRID CONNECTIONS APPLICATIONS
Table 4.1 outlines the number of Indicative Quotations (IQs), Feasibility Quotations (FQs) and Budget Quotations (BQs) that have been processed during the period August 2011 to August 2012. These are as a result of applications for grid connections, as per the Grid Code.
Table 4.1: Connection applications quoted and accepted
As shown in Table 4.1 above, the number of customer applications for grid connections that were processed is fairly high, indicating high connection requirements due to increasing load and generation activity. The acceptance rates for budget quotations are fairly low. Further analysis and consultation with customers are required to understand the opportunities that would improve this acceptance rate. A large number of Indicative Quote applications (most of the 134 applications above) were received to connect Renewable Energy Generation onto the Transmission Grid.
Indicative Quotations Feasibility Quotations Budget Quotations
Issued Issued Accepted Issued Accepted
Total 134 32 12 29 12
% Acceptance 38% 41%

11 Transmission Ten-Year Plan 2013 – 2022
The map in Figure 5.1 below shows a high-level view of the major TDP scheme projects. The relative location of the new transmission lines and the associated MTS substations are indicated schematically in the figure. Please note that Transmission is currently in the process of moving toward managing the Transmission Grid according to the nine provincial boundaries compared to the seven internal grid boundaries that existed previously. This TDP (and future TDP’s) will report according to the nine provincial boundaries as indicated in Figure 5.1 as well.
Figure 5.1: Map showing relative location of the major TDP scheme projects
The major new assets that have either been approved or it is proposed should be added to the transmission system over the next ten years are summarised in Table 5.1 below.
Table 5.1: Major TDP transmission assets expected to be installed
5. NATIONAL OVERVIEW
TDP New Asset Total
HVDC Lines (km) 0
765kV Lines (km) 3,700
400kV Lines (km) 8,631
275kV Lines (km) 402
Transformers 250MVA+ 135
Transformers <250MVA 29
Total installed MVA 83,725
Capacitors 26
Total installed MVAr 2,634
Reactors 51
Total installed MVAr 9,203

12© Eskom 2013
Significant lengths of new transmission lines are being added to the system: 3 700 km of 765kV and over 8 600 km of 400kV lines have either been approved or proposed over the 10-year TDP period. This addition is mainly due to the major network reinforcements required for the supply to the Cape and KwaZulu-Natal. The integration of the new Medupi Power Station in the developing Limpopo West Power Pool also requires significant lengths of transmission line as it is a long distance from the main load centres. Additional 765kV lines that were not required in the previous TDP have been brought back into this TDP (based on recent studies) to export this power to load centres. Lines that were required for local and backbone strengthening for Nuclear 1 (at Thyspunt) are not included in Table 5.1. The DC lines/system required for further generation developments in the Limpopo province are not included in the above table until further studies(currently in progress) are concluded. They are however included in the diagrams for illustration.
The large length of 400kV transmission line is also the result of the development of a more meshed transmission 400kV network to provide greater reliability and thus improve the levels of network security.
These new transmission lines form part of the long-term strategy to develop a main transmission backbone from which regional power corridors can be supported. These power corridors will connect generation pools to one another and to the major load centres in the country. This backbone and regional power corridor network structure will allow the increasing system demand to be supplied and the power from new power stations to be integrated more efficiently into the Transmission network and distributed where required, both under system-healthy and system-contingency conditions.
The development of the transmission backbone and the associated regional power corridors were reviewed as part of the Strategic Grid Study which considered the potential development scenarios beyond the 10-year horizon of the TDP. The objective of this strategic study was to align the transmission network with the requirements of the generation future options and those of
the growing and future load centres. This Strategic Grid Study has enabled the 10-Year TDP to be aligned with the future long-term development of the whole Eskom system. The new Strategic Grid Study (covering the period up to 2040) has not been concluded as yet, however, the work done internally has influenced this latest TDP.
The addition of over 83 500 MVA of transformer capacity to the transmission system is an indication of the increase in load demand and in the firm capacity requirements of the customers. This figure also includes the transformation capacity required to integrate an assumed Renewable Energy Generation plan.
Approximately 2 600 MVars of capacitive support are required to support areas of the network under contingency conditions to ensure that the required voltage levels are maintained. They also improve system efficiency by reducing network losses. A number of series compensation projects are also required on the 765kV and 400kV lines in order to improve the power transfer capability of the Cape power corridors.
Approximately 9 200 MVars of reactors are a direct result of the long lengths of the 765kV and the 400kV transmission lines that will be constructed over this period.
Two new SVCs are proposed for supporting the Northern Cape and the proposed Sishen-Saldanha Spoornet expansion, namely a +200/-100 MVAr SVC at Aries and a smaller one of +45/-100 MVars at Garona. Two additional SVCs have been added, owing to Wind and Solar generation Integration requirements. SVCs are required to manage the voltage variation on the Transmission Grid.
Some projects have associated distribution projects to enable customers to benefit from them. For example, a new MTS substation may require distribution infrastructure to link it to the existing distribution network or to connect new bulk loads. Distribution infrastructure and individual feeder bays to connect distribution infrastructure or bulk loads are not individually included in this report.

13 Transmission Ten-Year Plan 2013 – 2022
6.1 GAUTENG PROVINCE (GP)
The current transmission network and CLNs are shown in Figure 6.1 below.
Figure 6.1: Current Gauteng Province network and CLNs
The expected peak CLN demands (apportioned for certain CLN’s were overlap with other provinces occur) by 2022 at TOSP and the average percentage load increase for the period for each CLN are given in Table 6.1 below.
Table 6.1: Gauteng Province CLN load forecast and percentage load increases
6 BREAKDOWN OF THE TDP PROJECTS BY GRID
CLN Forecast load (MW) Ave. annual % load increase
2013 2018 2022
Johannesburg 4 974 5 887 6 480 2.9%
West Rand 2 100 2 435 2 672 2.2%
Nigel 1 709 1 791 1 868 1.7%
Vaal Triangle 1 860 1 977 2 139 1.4%
Pretoria 2 237 2 543 2 985 3.0%
Warmbad 330 424 456 4.2%

14© Eskom 2013
The TDP schemes for the Gauteng Province consist of extending the 275kV network (built at 400kV insulation level to allow for future upgrading to 400kV) and the installation of additional transformers at existing substations, as well as the construction of new substations. The increase in transmission assets by the end of 2017 and end of 2022 and the cumulative total are shown in Table 6.2.
Table 6 2: New transmission assets for the Gauteng Province.
The following projects are planned for the 2013 to 2022 period:
Transmission Assets for Gauteng Province New Assets expected in 2013-2017
New Assets expected in 2018-2022
Total New Assets expected
Total kms of line 813 91 904
765kV Lines (km) 0 0 0
400kV Lines (km) 763 59 822
275kV Lines (km) 50 32 82
Total installed Transformer MVA 5,390 5,215 10,605
Transformers (no. of) 16 13 29
Capacitors (no. of) 6 0 6
Reactors (no. of) 0 0 0
SUB-PROJECT NAME TDP SCHEME PROJECT Province New Expected Year
Benburg Ext 3rd 250MVA 275/132kV Benburg Ext 3rd 250MVA 275/132kV GP 2014
Demeter Ext 400/88kV transformation (1st, 2nd and 3rd 315MVA transformers and 400kV busbar)
Demeter 400kV Integration GP 2017
Loopin Pluto- Verwoerdburg 400kV into Demeter
Demeter 400kV Integration GP 2017
Benburg 132kV 72MVAr shunt capacitor JHB Reactive Power Project GP 2014
Croydon 132kV 72MVAr shunt capacitor JHB Reactive Power Project GP 2014
Eiger 88kV 48MVAr shunt capacitor bank JHB Reactive Power Project GP 2014
Jupiter 88kV 48MVAr shunt capacitor bank JHB Reactive Power Project GP 2014
Johannesburg CLN Fault Level Management Johannesburg CLN Fault Level Management GP 2014
Esselen-North Rand 1st 275kV line upgrade (existing 132kV)
Johannesburg East Strengthening - Phase 1B GP 2015
North Rand Ext 1st 500MVA 275/132kV transformer (line banked) and Esselen 275kV busbar rearrangement
Johannesburg East Strengthening - Phase 1B GP 2015
North Rand Ext 2nd 500MVA 275/132kV transformer and 275kV busbar establishment
Johannesburg East Strengthening - Phase 2 GP 2015
Esselen-North Rand 2nd 275kV line upgrade (existing 132kV)
Johannesburg East Strengthening - Phase 2 GP 2016
North Rand-Chloorkop 1st and 2nd 132kV lines
Johannesburg East Strengthening - Phase 2 GP 2016
Apollo-Esselen 1st 400kV (energised @ 275kV)
Johannesburg East Strengthening - Phase 3 A-D
GP 2014
Jupiter B 275kV Loop-ins (Prospect-Sebenza 1 & 2, Jupiter-Prospect 1, Jupiter-Fordsburg 1)
Johannesburg East Strengthening - Phase 3 A-D
GP 2015
Prospect-Sebenza 1st 275kV line (energise existing 88kV line)
Johannesburg East Strengthening - Phase 3 A-D
GP 2015
Prospect-Sebenza 2nd 275kV line (energise existing 88kV line at 275kV)
Johannesburg East Strengthening - Phase 3 A-D
GP 2015
Jupiter B 275kV Switching station Johannesburg East Strengthening - Phase 3 A-D
GP 2017

15 Transmission Ten-Year Plan 2013 – 2022
Matla-Jupiter B 1st 400kV line (operated @ 275kV)
Johannesburg East Strengthening - Phase 3 A-D
GP 2017
Matla-Jupiter B 2nd 400kV line (operated @ 275kV)
Johannesburg East Strengthening - Phase 3 A-D
GP 2017
North Rand-Sebenza 1st 275kV line Johannesburg East Strengthening - Phase 3 E-F
GP 2015
North Rand-Sebenza 2nd 275kV line Johannesburg East Strengthening - Phase 3 E-F
GP 2015
Sebenza Substation (400kV busbar operated @ 275kV )
Johannesburg East Strengthening - Phase 3 E-F
GP 2018
Lepini Ext 275kV 2x 150Mvar capacitors Johannesburg North - Phase 2a GP 2014
Apollo-Lepini 1st 275kV line Johannesburg North - Phase 2b GP 2014
Kookfontein Ext 3rd 315MVA 275/88kV transformer and 3rd Glockner - Kookfontein 275kV Line establishment
Kookfontein Phase 2 GP 2016
Kyalami 400kV Loop-in (Bravo-Lulamisa 1st 400kV) (Kyalami bays are GIS)
Kyalami Integration GP 2017
Kyalami 400/132kV substation (1st & 2nd 500MVA transformers) (All bays are GIS)
Kyalami Integration GP 2017
Pelly 1st 20MVA 132/22kV transformer Pelly 132/22kV transformation upgrade GP 2014
Decommissioning of the Apollo 400kV Fault limiting reactors
Reactive Power support for JHB GP 2016
Simmerpan Extension 275/132kV transformation (2x 250MVA)
Simmerpan 275/132kV substation GP 2021
Jupiter B-Simmerpan 1st & 2nd 275kV lines (uprate of 88kV lines)
Simmerpan 275/88kV substation GP 2016
Simmerpan 275/88kV substation (expand existing Distribution station)
Simmerpan 275/88kV substation GP 2016
Quattro 275/88kV substation (1st and 2nd 315MVA transformers) (400/88kV construction)
Soweto Strengthening Phase 1 - 275kV GP 2015
Etna-Quattro 1st and 2nd 400kV Lines (energised @ 275kV)
Soweto Strengthening Phase 1 - 275kV GP 2016
Quattro 275/132kV substation (1st and 2nd 500MVA transformers) (400/132kV construction)
Soweto Strengthening Phase 2 - 275/132kV GP 2016
Anderson 400/132kV substation (1st & 2nd 250MVA transformers)
Tshwane Reinforcement - Anderson Phase 1 GP 2018
Pelly-Phoebus 1st 275kV line (energise Hangklip-Pelly 132kV line)
Tshwane Reinforcement - Phoebus Phase 1 GP 2019
Pheobus 400/275/132kV Substation (1st & 2nd 400MVA 400/275kV transformer)
Tshwane Reinforcement - Phoebus Phase 1 GP 2019
Pheobus 400kV loop-in (Apollo-Dinaledi 1st 400kV line)
Tshwane Reinforcement - Phoebus Phase 1 GP 2019
Pheobus Ext 400/132kV transformation (1st 250MVA 400/132kV transformer)
Tshwane Reinforcement - Phoebus Phase 1 GP 2019
Phoebus-Kwagga 1st 275kV line Tshwane Reinforcement - Phoebus Phase 2 GP 2018
Apollo-Pluto 400kV loop in-out Verwoerdburg Tshwane Reinforcement - Verwoerdburg Phase 1
GP 2014
Verwoerdburg 400/132kV substation (1st & 2nd 250MVA transformers)
Tshwane Reinforcement - Verwoerdburg Phase 1
GP 2014
16© Eskom 2013
Verwoerdburg 400/132kV substation (3rd 250MVA transformer)
Tshwane Reinforcement - Verwoerdburg Phase 2
GP 2018
Wildebees 400/132kV substation (Customer 250MVA Trfrs)
Tshwane Reinforcement - Wildebees Phase 1
GP 2015
Wildebees 400kV Loop in-out (Apollo - Dinaledi 1st 400kV)
Tshwane Reinforcement - Wildebees Phase 1
GP 2015
Glockner-Etna 1st 400kV line (operate @ 275kV)
Vaal Strengthening Phase 2 GP 2015
Glockner-Etna 2nd 400kV line (operate @ 275kV)
Vaal Strengthening Phase 2 GP 2015
Etna Ext 400/275kV transformation (2x 800MVA)
West Rand Strengthening - Phase: Etna 400kV
GP 2022
Etna Ext 400/88kV 315MVA transformation West Rand Strengthening - Phase: Etna 400kV
GP 2022
Etna-Glockner 1st & 2nd 400kV lines upgrade West Rand Strengthening - Phase: Etna 400kV
GP 2022
Hera-Westgate 1st 400kV line West Rand Strengthening - Phase: Westgate and Taunus 400kV
GP 2018
Westgate 400/132kV substation (1st 500MVA transformer)
West Rand Strengthening - Phase: Westgate and Taunus 400kV
GP 2018
Etna-Taunus 1st 400kV line (energised @ 275kV)
West Rand Strengthening - Phase: Westgate and Taunus 400kV
GP 2022
Taunus Ext 400/132kV transformation (1 x 500MVA)
West Rand Strengthening - Phase: Westgate and Taunus 400kV
GP 2022
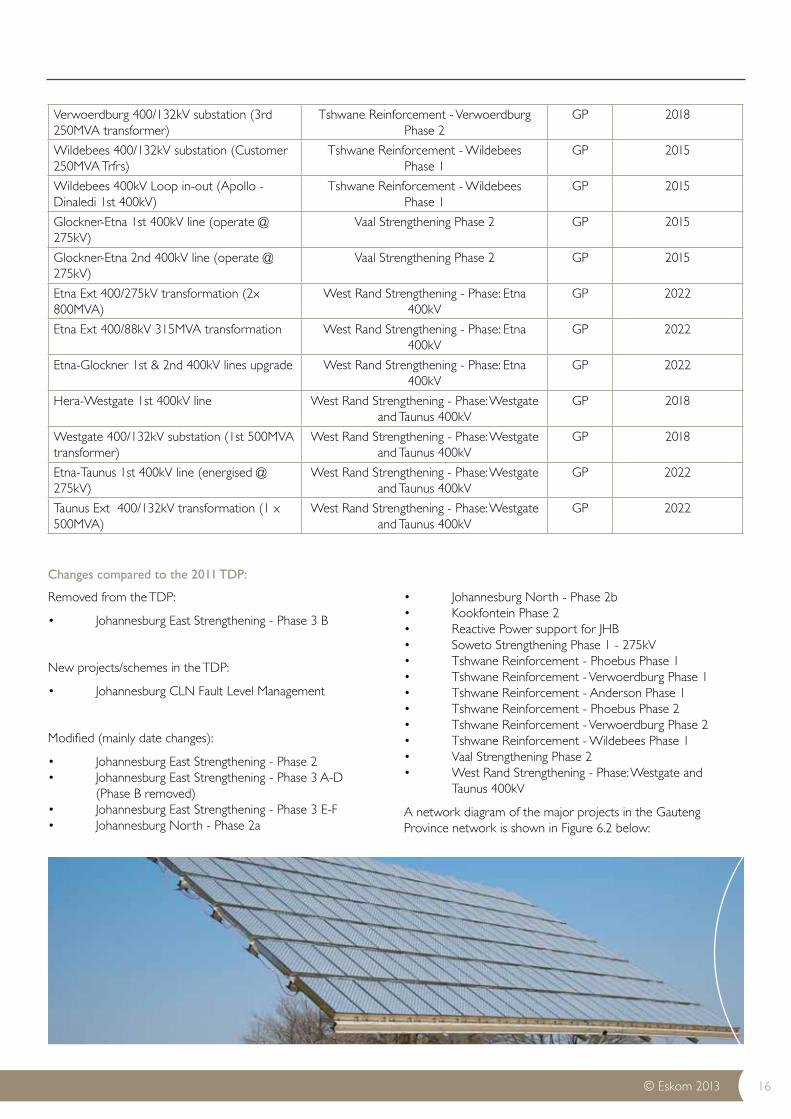
Removed from the TDP:
• Johannesburg East Strengthening - Phase 3 B
New projects/schemes in the TDP:
• Johannesburg CLN Fault Level Management
Modified (mainly date changes):
• Johannesburg East Strengthening - Phase 2 • Johannesburg East Strengthening - Phase 3 A-D (Phase B removed) • Johannesburg East Strengthening - Phase 3 E-F • Johannesburg North - Phase 2a
• Johannesburg North - Phase 2b • Kookfontein Phase 2 • Reactive Power support for JHB • Soweto Strengthening Phase 1 - 275kV • Tshwane Reinforcement - Phoebus Phase 1 • Tshwane Reinforcement - Verwoerdburg Phase 1 • Tshwane Reinforcement - Anderson Phase 1 • Tshwane Reinforcement - Phoebus Phase 2 • Tshwane Reinforcement - Verwoerdburg Phase 2 • Tshwane Reinforcement - Wildebees Phase 1 • Vaal Strengthening Phase 2 • West Rand Strengthening - Phase: Westgate and Taunus 400kV
A network diagram of the major projects in the Gauteng Province network is shown in Figure 6.2 below:
Changes compared to the 2011 TDP:

17 Transmission Ten-Year Plan 2013 – 2022
Figure 6.2: Gauteng Province network diagram

18© Eskom 2013
6.2 KWAZULU-NATAL (KZN) PROVINCE
The current transmission network and CLNs are shown in Figure 6.3 below.
Figure 6.3: Current KZN Province network and CLNs
The expected peak CLN demands by 2022 at TOSP and the average percentage load increase for the period for each CLN are given in Table 6.3 below.
Table 6.3: KZN Province CLN load forecast and percentage load increase
The TDP scheme projects for the KZN Province consist primarily of strengthening the 400kV networks that transmit power to the Empangeni and Pinetown CLNs and the introduction of 765kV. In addition to the above TDP scheme projects, other projects are listed in the project summary, which are required to strengthen the network.
CLN Forecast load (MW) Ave. annual % load increase
2013 2018 2022
Ladysmith and Newcastle 1 351 1 568 1 750 2.9%
Empangeni 2091 2 439 2 594 2.2%
Pinetown 3 604 4 148 5 068 3.6%

19 Transmission Ten-Year Plan 2013 – 2022
Table 6.4: KZN Province new transmission assets
Transmission Assets for KwaZulu Natal Province
New Assets expected in 2013-2017
New Assets expected in 2018-2022
Total New Assets expected
Total kms of line 585 818 1,403
765kV Lines (km) 80 300 380
400kV Lines (km) 505 450 955
275kV Lines (km) 0 68 68
Total installed Transformer MVA 5,545 4,000 9,545
Transformers (no. of) 9 5 14
Capacitors (no. of) 0 0 0
Reactors (no. of) 5 2 7
The following projects are planned for the 2013 to 2022 period:
SUB-PROJECT NAME TDP SCHEME PROJECT Province New Expected Year
Ariadne-Venus 2nd 400kV Line Ariadne-Venus 2nd 400kV Line KZN 2016
Avon Ext 3rd 250MVA 275/132kV transformer
Avon Ext 3rd 250MVA 275/132kV transformer
KZN 2014
Avon Ext 2x 275kV feeders bays (DME OCGT IPP Pinetown )
DME OCGT Integration at Avon 275kV (Pinetown)
KZN 2014
Hector - Umgeni 1st and 2nd 275kV lines eThekwini Electricity Network Strengthening KZN 2018
Klaarwater - Umgeni 1st 275kV line (recycle Klaarwater - Umgeni 132kV double circuit line)
eThekwini Electricity Network Strengthening KZN 2018
Mersey - Ottawa 1st and 2nd 400kV line (Operated @ 275kV)
eThekwini Electricity Network Strengthening KZN 2018
Umgeni Ext 1st and 2nd 500MVA 275/132kV transformers
eThekwini Electricity Network Strengthening KZN 2018
Incandu Ext 3rd 500MVA 400/132kV transformer
Incandu Ext 3rd 500MVA 400/132kV transformer
KZN 2014
Ingula 400kV busbar establishment (integration of P/S gens)
Ingula Pumped Storage P/S Integration KZN 2013
Ingula-Venus 2nd 400kV line Ingula Pumped Storage P/S Integration KZN 2013
Loop in Majuba - Venus 2 400kV line into Ingula
Ingula Pumped Storage P/S Integration KZN 2013
Invubu-Theta (Mbewu) 2nd 400kV line KZN 765kV Strengthening - Empangeni Integration
KZN 2017
Loop-in Athene-Umfolozi 1 400kV & Invubu-Umfolozi 1 400kV line into Mbewu
KZN 765kV Strengthening - Empangeni Integration
KZN 2017
Umfolozi-Theta (Mbewu) 765kV line (ext. of the Majuba - Umfolozi 765kV line)
KZN 765kV Strengthening - Empangeni Integration
KZN 2017
Theta (Mbewu) 1 x 765/400kV 2000MVA Substation
KZN 765kV Strengthening - Empangeni Integration
KZN 2017
Lambda 400/765kV Substation and transformation
KZN 765kV Strengthening - Lambda Substation
KZN 2017
Majuba - Lambda 1st & 2nd 400kV lines KZN 765kV Strengthening - Lambda Substation
KZN 2017
Lambda - Sigma (Isundu) 1st 765kV line KZN 765kV Strengthening - Pinetown Integration
KZN 2018
Loop in Ariadne - Hector 400kV line into Isundu
KZN 765kV Strengthening - Pinetown Integration
KZN 2018

20© Eskom 2013
Sigma (Isundu) 1 x 765/400kV 2000MVA Substation
KZN 765kV Strengthening - Pinetown Integration
KZN 2018
Sigma (Isundu)-Theta (Mbewu) 1st and 2nd 400kV Line
KZN 765kV Strengthening Isundu - Mbewu 1st & 2nd 400kV lines
KZN 2018
Mersey Ext 3rd 250MVA 275/132kV transformer
Mersey Ext 3rd 250MVA 275/132kV transformer
KZN 2015
Normandie Ext 2nd 250MVA 400/132kV transformer
Normandie Ext 2nd 250MVA 400/132kV transformer
KZN 2014
Ariadne-Eros 2nd 400kV line South Coast Strengthening KZN 2017
St Faiths (Previously Oribi) Loop - in Ariadne - Eros 2nd 400kV line
South Coast Strengthening KZN 2020
St. Faiths (Previously Oribi) 2 x 500MVA 400/132kV Substation
South Coast Strengthening KZN 2020
Transnet 3 of 1 x 160MVA 400/88kV substations
Transnet Coal - Line Upgrade KZN 2016
Removed from the TDP:
• Hector Ext 4th 800MVA 400/275kV transformer • Hector – Klaarwater lines/development.
New projects/schemes in the TDP:
• Umgeni Ext 1st and 2nd 500MVA 275/132kV transformers • Hector - Umgeni 1st and 2nd 275kV lines • Klaarwater - Umgeni 1st 275kV line (recycle Klaarwater - Umgeni 132kV double circuit line)
The above projects have been added as a result of eThekwini Electricity Network Strengthening requirements.
Modified (mainly due to date changes):
• Avon Ext 2x 275kV feeder bays (DME OCGT IPP Pinetown ) • Ariadne-Eros 2nd 400kV line • Majuba - Lambda 1st & 2nd 400kV lines • Lambda 400/765kV substation and transformation • Lambda - Sigma (Isundu) 1st 765kV line • Sigma (Isundu) 1 x 765/400kV 2000MVA Substation • Mersey Ext 3rd 250MVA 275/132kV transformer • Normandie Ext 2nd 250MVA 400/132kV transformer • Sigma (Isundu)-Theta (Mbewu) 1st and 2nd 400kV Line • Loop in Ariadne - Hector 2 400kV (de-energised) Circuit into Isundu (was previously the Hector-Sigma (Isundu) 1st 400kV Line & Hector-Sigma (Isundu) 2nd 400kV Line)
A geographical network diagram indicating the major projects in the KZN Province for the ten-year period is shown in Figure 6.4.
Changes compared to the 2011 TDP:

21 Transmission Ten-Year Plan 2013 – 2022
Figure 6.4: KZN Province geographical network diagram

22© Eskom 2013
6.3 LIMPOPO (LIM) PROVINCE
The current transmission network and CLNs are shown in Figure 6.5 below.
Figure 6.5: Current Limpopo Province network and CLNs
The expected peak CLN demands (apportioned for certain CLN’s were overlap with other provinces occur) by 2022 at TOSP and the average percentage load increase for the period for each CLN are given in Table 6.5 below.
Table 6.5: Limpopo Province CLN load forecast and percentage load increases
The Limpopo Province load growth is mainly due to the platinum group metals (PGM) and ferrochrome mining and processing activities.
The TDP Scheme Projects for the province consist of extending the 400kV and 275kV networks as well as establishing the 765kV network, integrating the Medupi Power Station and installing additional transformers at existing and new substations.
The increase in transmission assets by the end of 2017 and the end of 2022 and the cumulative total are shown in Table 6.6.
CLN Forecast load (MW) Ave. annual % load increase
2013 2018 2022
Waterberg 534 704 865 4.9%
Lowveld 1 113 1 528 1 713 6.3%
Warmbad 330 424 456 4.2%
Polokwane 1 329 1 582 1 842 4.8%

23 Transmission Ten-Year Plan 2013 – 2022
Table 6.6: Limpopo Province new transmission assets
Transmission Assets for Limpopo Province New Assets expected in 2013-2017
New Assets expected in 2018-2022
Total New Assets expected
Total kms of line 2,260 730 2,990
765kV Lines (km) 900 0 900
400kV Lines (km) 1,360 580 1,940
275kV Lines (km) 0 150 150
Total installed Transformer MVA 7,770 500 8,270
Transformers (no. of) 13 2 15
Capacitors (no. of) 0 0 0
Reactors (no. of) 4 2 6
The following projects are planned for the 2013 to 2022 period:
SUB-PROJECT NAME TDP SCHEME PROJECT Province New Expected Year
Foskor 3rd 250MVA 275/132kV transformer Foskor & Acornhoek 275/132kV transformation upgrades
Lim 2015
Foskor-Merensky 2nd 275kV line Foskor & Acornhoek 275/132kV transformation upgrades
Lim 2018
Medupi-Marang 1st 400kV Medupi Integration (Alpha) Phase 1B: Marang
Lim 2013
Medupi-Ngwedi (Mogwase) 1st 400kV line Medupi Integration (Charlie) Phase 2A: Mogwase
Lim 2014
Medupi-Ngwedi (Mogwase) 1st 765kV line(Energised at 400kV)
Medupi Integration (Charlie) Phase 2A: Mogwase
Lim 2014
Medupi-Burotho(Mokopane) 1st 400kV line Medupi Integration (Charlie) Phase 2B: Mokopane
Lim 2015
Burotho(Mokopane) 400/132kV Substation (2x 500MVA transformers)
Medupi Integration (Charlie) Phase 2B: Mokopane
Lim 2015
Burotho(Mokopane) 400kV Loop-in (Matimba-Witkop 1st 400kV line)
Medupi Integration (Charlie) Phase 2B: Mokopane
Lim 2015
Medupi-Masa 1st 400kV line (link to Masa-Ngwedi 1st 400kV line)
Medupi Integration (Charlie) Phase 2C: Epsilon
Lim 2014
Burotho(Mokopane)-Witkop 2nd 400kV line Medupi Phase 3 Lim 2015
Masa Ext 765/400kV transformation (1st and 2nd 2000MVA transfromers)
Medupi Phase 3 Lim 2017
Masa-Selemo 1st 765kV line (energised @ 765kV)
Medupi Phase 3 Lim 2017
Masa-Selemo 2nd 765kV line (utilise old Medupi-Nqwedi 765kV line)
Medupi Phase 3 Lim 2017
Masa-Witkop 1st 400kV line Medupi Phase 3 Lim 2017
Medupi-Masa 2nd 400kV line Medupi Phase 3 Lim 2017
Medupi 400/132kV 2 x 250MVA Substation Medupi Substation Integration Lim 2013
Burotho(Mokopane)-Nzhelele 1st 400kV line Nzhelele 400kV reinforcement Lim 2020
Tabor - Nzhelele 400kV line Nzhelele 400kV reinforcement Lim 2020
Witkop Solar Park - 30MW PV Integration REBID 1 preferred bidders Lim 2014
Spitskop 2 x 500MVA 400/132kV Transformer Upgrade (Replace old 2 x 250MVA transformers)
Spitskop Transformation Upgrade Lim 2016

24© Eskom 2013
Tabor Ext 1st 500MVA 400/132kV transformer
Tabor and Spencer Reinforcement - Phase 2 Lim 2013
Tabor-Witkop 1st 400kV line Tabor and Spencer Reinforcement - Phase 2 Lim 2013
Witkop - Senakangwedi B 400kV line (160km) Tubatse Strengthening Scheme Phase 3 Lim 2020
Removed from the TDP:
• None
New projects/schemes in the TDP:
• Masa Ext 765/400kV transformation (1st and 2nd 2000MVA transformers) • Masa-Selemo 1st 765kV line (energised @ 765kV) • Masa-Selemo 2nd 765kV line (energised @ 765kV) • Witkop - Senakangwedi B 400kV line (160km) • Medupi 400/132kV 2 x 250MVA Substation • Spitskop 2 x 500MVA 400/132kV transformer Upgrade • Foskor 2nd 20MVA 132/22kV transformer • Witkop Solar Park - 30MW PV Integration
Modified (mainly due to date changes):
• Foskor 3rd 250MVA 275/132kV transformer • Foskor-Merensky 2nd 275kV line
• Medupi-Marang 1st 400kV • Burotho(Mokopane) 400kV Loop-in (Matimba-Witkop 1st 400kV line) • Burotho(Mokopane) 400/132kV Substation (2x 500MVA transformers) • Medupi-Burotho(Mokopane) 1st 400kV line • Medupi-Masa 1st 400kV line (link to Masa-Selemo 1st 400kV line) • Medupi-Masa 2nd 400kV line • Masa-Witkop 1st 400kV line Burotho(Mokopane)- Witkop 2nd 400kV line • Tabor - Nzhelele 400kV line • Nzhelele 400/132kV substation (1st & 2nd 250MVA) • Burotho(Mokopane)-Nzhelele 1st 400kV line • Spencer Ext 132kV feeder bay (Bolubedu) • Tabor-Witkop 1st 400kV line • Tabor Ext 1st 500MVA 400/132kV transformer
A network diagram of the major projects in the Limpopo Province is shown in Figure 6.6 below.
Changes compared to the 2011 TDP:

25 Transmission Ten-Year Plan 2013 – 2022
Figure 6.6: Limpopo Province geographical network diagram
26© Eskom 2013
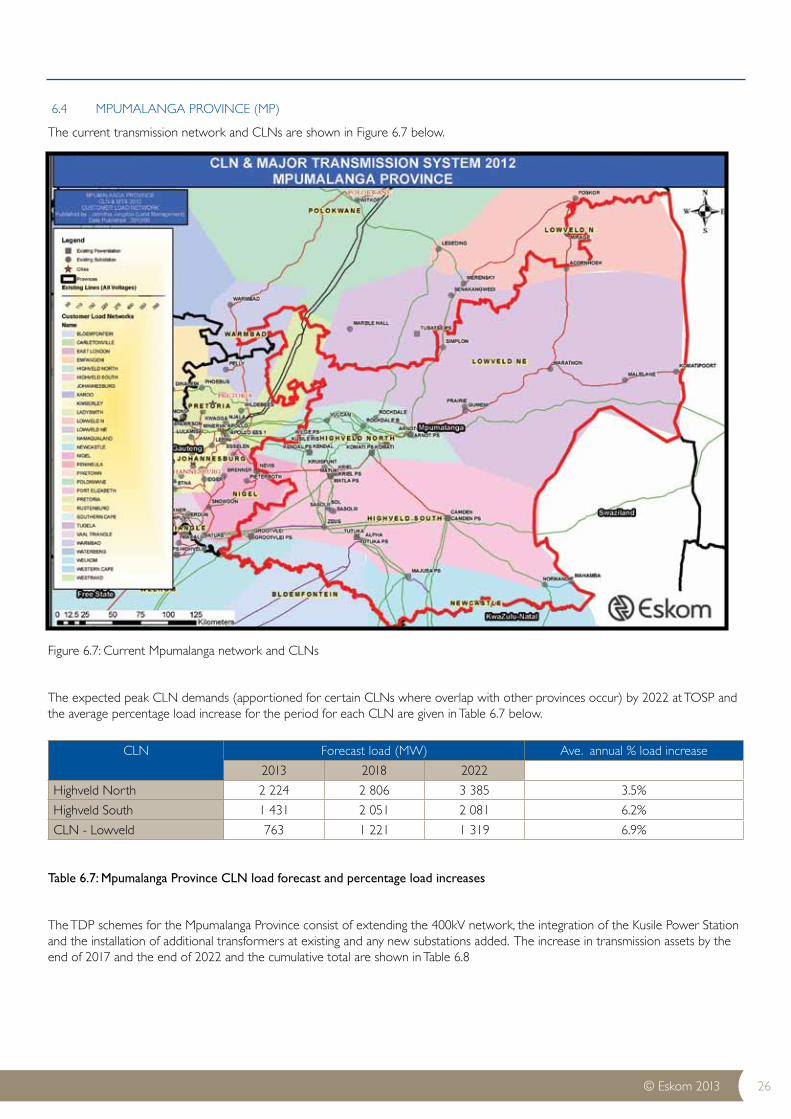
6.4 MPUMALANGA PROVINCE (MP)
The current transmission network and CLNs are shown in Figure 6.7 below.
Figure 6.7: Current Mpumalanga network and CLNs
The expected peak CLN demands (apportioned for certain CLNs where overlap with other provinces occur) by 2022 at TOSP and the average percentage load increase for the period for each CLN are given in Table 6.7 below.
Table 6.7: Mpumalanga Province CLN load forecast and percentage load increases
The TDP schemes for the Mpumalanga Province consist of extending the 400kV network, the integration of the Kusile Power Station and the installation of additional transformers at existing and any new substations added. The increase in transmission assets by the end of 2017 and the end of 2022 and the cumulative total are shown in Table 6.8
CLN Forecast load (MW) Ave. annual % load increase
2013 2018 2022
Highveld North 2 224 2 806 3 385 3.5%
Highveld South 1 431 2 051 2 081 6.2%
CLN - Lowveld 763 1 221 1 319 6.9%

27 Transmission Ten-Year Plan 2013 – 2022
Table 6.8: Cumulative TDP transmission assets for the Mpumalanga Province
Transmission Assets for Mpumalanga Province New Assets expected in 2013-2017
New Assets expected in 2018-2022
Total New Assets expected
Total kms of line 711 92 803
765kV Lines (km) 0 0 0
400kV Lines (km) 709 92 801
275kV Lines (km) 2 0 2
Total installed Transformer MVA 6,975 2,300 9,275
Transformers (no. of) 15 4 19
Capacitors (no. of) 3 0 3
Reactors (no. of) 0 0 0
The following projects are planned for the 2013 to 2022 period:
SUB-PROJECT NAME TDP SCHEME PROJECT Province New Expected Year
Arnot-Kendal 400kV line loop in-out Rockdale B
Highveld North-West and Lowveld North Reinforcement - Phase 1
MP 2015
Rockdale 132kV breakers upgrading Highveld North-West and Lowveld North Reinforcement - Phase 1
MP 2015
Rockdale B 400/132kV Substation (1st & 2nd 500MVA 400/132kV transformers)
Highveld North-West and Lowveld North Reinforcement - Phase 1
MP 2015
Marble Hall 400/132kV Substation (1st & 2nd 500MVA 400/132kV transformers)
Highveld North-West and Lowveld North Reinforcement - Phase 2
Lim 2017
Marble Hall-Rockdale B 1st 400kV line Highveld North-West and Lowveld North Reinforcement - Phase 2
MP 2017
Marble Hall-Tubatse ( Steelpoort ) 1st 400kV line
Highveld North-West and Lowveld North Reinforcement - Phase 2
LP 2017
Tubatse 400kV Loop in (Duvha-Leseding 1st 400kV line)
Highveld North-West and Lowveld North Reinforcement - Phase 2
Lim 2017
Tubatse 400kV switching station Highveld North-West and Lowveld North Reinforcement - Phase 2
Lim 2017
Rockdale B 400/132kV Substation extension (3rd 500MVA 400/132kV transformers)
Highveld North-West and Lowveld North Reinforcement - Phase 3
MP 2017
New Sol B 400/132kV Substation (1st, 2nd, 3rd and 4th 500MVA transformers)
Highveld South Reinforcement MP 2017
Sol B 400kV Loop in (Kriel-Tutuka 1st 400kV line)
Highveld South Reinforcement MP 2017
Sol B Ext Equip 8x132kV feeder bays Highveld South Reinforcement MP 2017
Sol B Turn in (Kriel-Zeus 1st 400kV to form new Kriel-Sol B 2nd 400kV line)
Highveld South Reinforcement MP 2017
Khanyisa PS integration Khanyisa PS Integration MP 2014
Kruispunt 275kV loop-in (Komati-Matla 1st 275kV line)
Kruispunt Reinforcement MP 2013
Kusile 400kV busbar HV yard establishment (integration of P/S gens)
Kusile Integration Phase 1: 400kV Loop-ins MP 2014
Kusile 400kV Loop-in (Duhva-Minerva 1st 400kV line)
Kusile Integration Phase 1: 400kV Loop-ins MP 2014

28© Eskom 2013
Vulcan 400kV Bypass and Reconfiguration (Loop in Duvha-Kendal 1st 400kV line and loop out Arnot-Vulcan 1st 400kV lines to form Duvha-Vulcan 2nd 400kV and Arnot-Kendal 1st 400kV)
Kusile Integration Phase 1: 400kV Loop-ins MP 2014
Kusile-Lulamisa 1st 400kV line Kusile Integration Phase 2: Lulamisa MP 2017
Kusile 400kV by-pass Duvha (To form Kusile - Vulcan 400kV line)
Kusile Integration Phase 3A: 400kV Duvha by-pass
MP 2016
Kusile 400kV Loop-in (Apollo-Kendal 1st 400kV line)
Kusile Integration Phase 3B: 400kV Loop-in MP 2016
Kendal-Zeus 1st 400kV line Kusile Integration Phase 4A MP 2017
Kendal - Zeus 2nd 400kV line Kusile Integration Phase 4B MP 2017
Kusile 400kV by-pass Kendal (Kendal by-pass required to form the Kusile-Zeus 400kV line from Kusile-Kendal and Kendal-Zeus lines)
Kusile Integration Phase 4B MP 2017
Hendrina-Gumeni 1st 400kV line Lowveld 400kV Strengthening - Phase 1: Gumeni
MP 2014
Gumeni 400/132kV substation (1st 500MVA 400/132kV transformer)
Lowveld 400kV Strengthening - Phase 1: Gumeni
MP 2014
Gumeni-Marathon 1st 400kV line Lowveld 400kV Strengthening - Phase 2: Marathon B
MP 2015
Marathon 400/275kV substation (1st 800MVA 400/275kV transformer)
Lowveld 400kV Strengthening - Phase 2: Marathon B
MP 2015
Arnot - Gumeni 400kV line Lowveld 400kV strengthening - Phase 3a MP 2019
Gumeni Ext 2nd 500MVA 400/132kV transformer
Lowveld 400kV strengthening - Phase 3a MP 2019
Gumeni-Marathon 2nd 400kV line Lowveld 400kV strengthening - Phase 3b MP 2019
Marathon B Ext 2nd 800MVA 400/275kV transformer
Lowveld 400kV Strengthening - Phase 3b MP 2019
Khanyazwe (Malelane) 132kV, 72MVar Capacitor bank
Malelane 275kV Reinforcement - Phase 2 MP 2017
Arnot - Merensky 400kV loop-in into Senakangwedi B
Tubatse Strengthening Scheme Phase 1 MP 2017
Senakangwedi B 400/275kV Substation (1st 800MVA 400/275kV transformers)
Tubatse Strengthening Scheme Phase 1 MP 2017
Tubatse-Senakangwedi B 1st 400kV line Tubatse Strengthening Scheme Phase 1 Lim 2017
Senakangwedi B 400/132kV Substation (1st and 2nd 500MVA 400/132kV)
Tubatse Strengthening Scheme Phase 2 Lim 2020
Senakangwedi Ext 275kV Shunt Cap Xstrata Phase 2 customer project - Transmission Reinforcement
Lim 2013

29 Transmission Ten-Year Plan 2013 – 2022
Removed from the TDP:
• Alpha Ext 4th 2000MVA 765/400kV Transformer • Rockdale B 400/132kV Substation (the 4th 500MVA Transformer) • Rockdale B 400/88kV Substation (2 x 250MVA Transformers)
New projects/schemes in the TDP:
• Acornhoek Strengthening Phase 2 - Acornhoek 3rd 1x 125MVA 275/132kV transformers
Modified (mainly due to date changes):
• Acornhoek Upgrade Phase 1 - 2x 125MVA 275/132kV transformers • Rockdale 132kV breakers upgrading • Arnot-Kendal 400kV line loop in-out Rockdale B • Rockdale B 400/132kV Substation (1st & 2nd 500MVA 400/132kV transformers) • Marble Hall-Rockdale B 1st 400kV line • Marble Hall-Tubatse ( Steelpoort ) 1st 400kV line • Marble Hall 400/132kV Substation (1st & 2nd 500MVA 400/132kV transformers) • Tubatse 400kV Loop in (Duvha-Leseding 400kV line) • Tubatse 400kV switching station • Sol B 400kV Loop in (Kriel-Tutuka 1st 400kV line) • New Sol B 400/132kV Substation (1st, 2nd, 3rd and 4th 500MVA transformers) • Sol B Turn in (Kriel-Zeus 1st 400kV to form new Kriel- Sol B 2nd 400kV line)
• Sol B Ext Equip 8x132kV feeder bays • Kusile 400kV Loop-in (Duvha-Minerva 1st 400kV line) • Kusile 400kV busbar HV yard establishment (integration of P/S gens) • Vulcan 400kV Bypass and Reconfiguration (Loop in Duvha-Kendal 1st 400kV line and loop out Arnot-Vulcan 1st 400kV lines to form Duvha-Vulcan 2nd 400kV and Arnot-Kendal 1st 400kV) • Kusile 400kV by-pass Duvha (to form Kusile - Vulcan 400kV line) • Kusile 400kV Loop-in (Apollo-Kendal 1st 400kV line) • Kusile 400kV by-pass Kendal (Kendal by-pass required to form the Kusile-Zeus 400kV line from Kusile-Kendal and Kendal-Zeus lines) • Kendal-Zeus 1st 400kV line • Kendal - Zeus 2nd 400kV line • Hendrina-Gumeni 1st 400kV line • Gumeni 400/132kV Substation (1st 500MVA 400/132kV transformer) • Gumeni-Marathon 1st 400kV line • Marathon 400/275kV Substation (1st 800MVA 400/275kV transformer) • Gumeni Ext 2nd 500MVA 400/132kV transformer • Tubatse-Senakangwedi B 1st 400kV line • Senakangwedi B 400/275kV Substation (1st 800MVA 400/275kV transformers) • Senakangwedi Ext 275kV Shunt Cap
The network diagrams of the major projects in the Mpumalanga Province are shown in Figure 6.8 a-b below.
Changes compared to the 2011 TDP:

30© Eskom 2013
Figure 6.8a: Mpumalanga Province network diagram
Figure 6.8b: Mpumalanga Province (Inset Map) network diagram

31 Transmission Ten-Year Plan 2013 – 2022
6.5 NORTH WEST (NW) PROVINCE
The current transmission network and CLNs are shown in Figure 6.9 below.
Figure 6.9: Current North West Province network and CLNs
The 765kV network is primarily used for the transportation of power through the grid to the Cape. The projects for the North West Province are mainly the introduction of 400kV lines and transformation to support or relieve the 275kV networks. The load growth in the grid is shown in Table 6.9 below.
Table 6.9: North West Grid CLN load forecast and percentage load increases
The North West Province includes the 765kV integration required for the power transfer of generation from the Limpopo Province and 400kV integration to enable load growth in the local areas.
The increase in transmission assets by the end of 2017 and the end of 2022 and the cumulative total are shown in Table 6.10.
CLN Forecast load (MW) Ave. annual % load increase
2013 2018 2022
Rustenburg 471 519 554 2.9%
Carletonville 1 580 1 558 1 574 0.7%

32© Eskom 2013
Table 6.10: Cumulative assets for North West Province
Transmission Assets for North West Province New Assets expected in 2013-2017
New Assets expected in 2018-2022
Total New Assets expected
Total kms of line 566 225 791
765kV Lines (km) 0 0 0
400kV Lines (km) 566 225 791
275kV Lines (km) 0 0 0
Total installed Transformer MVA 12,250 315 12,565
Transformers (no. of) 14 1 15
Capacitors (no. of) 4 0 4
Reactors (no. of) 2 1 3
The following projects are planned for the 2013 to 2022 period:
SUB-PROJECT NAME TDP SCHEME PROJECT Province New Expected Year
Dinaledi 3rd 500MVA 400/132kV Transformer Dinaledi 3rd 500MVA 400/132kV Transformer
NW 2015
Dinaledi Ext 2x 132kV feeder bays (Brits Industries)
Dinaledi Ext 2x 132kV feeder bays (Brits Industries)
NW 2015
Dwaalboom 132kV switching station Dwaalboom 132kV switching station NW 2016
Mercury-Mookodi (Vryburg) 1st 400kV line Kimberley 400kV Strengthening Phase 2 NW 2014
Mookodi (Vryburg) 400/132kV Substation (1st and 2nd 250MVA 400/132kV transformers)
Kimberley 400kV Strengthening Phase 2 NW 2014
Hermes-Mookodi (Vryburg) 1st 400kV line Kimberley Strengthening Phase 3 NW 2018
Lomond 3rd 275/88kV transformer (1X315MVA)
Lomond MTS transformation upgrade NW 2018
Marang Ext 88V feeder bay (Turk) Marang Ext 88V feeder bay (Turk) NW 2014
Dinaledi-Spitskop 1st 400kV line Medupi Integration (Alpha) Phase 1A: Spitskop and Dinaledi
NW 2017
Dinaledi-Spitskop 2nd 400kV line Medupi Integration (Alpha) Phase 1A: Spitskop and Dinaledi
NW 2017
Ngwedi (Mogwase) 400/132kV Substation (2x 500MVA transformers)
Medupi Integration (Charlie) Phase 2A: Mogwase
NW 2016
Ngwedi (Mogwase) 400kV loop in (Matimba-Midas 1st 400kV)
Medupi Integration (Charlie) Phase 2A: Mogwase
NW 2016
Selemo 400kV loop-in (Hermes-Pluto 2nd 400kV line to form 1st 400kV lines from Selemo to s/s)
Medupi Integration (Charlie) Phase 2C: Epsilon
NW 2017
Selemo Ext 765/400kV transformation (1st and 2nd 2000MVA transformers)
Medupi Integration (Charlie) Phase 2C: Epsilon
NW 2017
Selemo-Midas 1st 400kV line (Pluto 400kV by-pass of Selemo-Pluto and extension to Midas)
Medupi Integration (Charlie) Phase 2C: Epsilon
NW 2017
Nzhelele 400/132kV substation (1st & 2nd 250MVA)
Nzhelele 400kV reinforcement NW 2020
Bighorn 400/132kV 2 x 500MVA Substation Extension
Rustenburg Strengthening Phase 1 NW 2016
Rustenburg Strengthening Phase 2 (Marang B) Rustenburg Strengthening Phase 2 NW 2017
Dinaledi-Anderson 1st 400kV line Tshwane Reinforcement - Anderson Phase 1 NW 2018

33 Transmission Ten-Year Plan 2013 – 2022
Watershed MTS 132kV Reactive power compensation
Watershed Strengthening NW 2015
Watershed MTS 88kV Reactive power compensation
Watershed Strengthening NW 2015
Watershed 275/132kV substation 250MVA 275/132kV transformer
Watershed Strengthening NW 2016
Removed from the TDP:• None
New projects/schemes in the TDP:• Selemo Ext 765/400kV transformation (1st and 2nd
2000MVA transformers)• Selemo 400kV loop-in (Hermes-Pluto 2nd 400kV line
to form 1st 400kV lines from Selemo to s/s)• Selemo-Midas 1st 400kV line (Pluto 400kV by-pass of
Selemo-Pluto and extension to Midas)• Bighorn 400/132kV 2 x 500MVA Substation Extension• Selemo Ext 765/400kV transformation (1st and 2nd
2000MVA transformers)
Modified (mainly due to date changes):• Mercury-Mookodi (Vryburg) 1st 400kV line• Mookodi (Vryburg) 400/132kV Substation (1st and 2nd
250MVA 400/132kV transformers)
• Hermes-Mookodi (Vryburg) 1st 400kV line• Dinaledi-Spitskop 1st 400kV line• Dinaledi-Spitskop 2nd 400kV line• Ngwedi (Mogwase) 400kV loop in (Matimba-Midas
1st 400kV)• Ngwedi (Mogwase) 400/132kV Substation (2x
500MVA transformers)• Rustenburg Strengthening Phase 2 (Marang B)• Dinaledi-Anderson 1st 400kV line• Watershed MTS 132kV Reactive power compensation• Watershed MTS 88kV Reactive power compensation• Watershed 275/132kV Substation 250MVA 275/132kV
transformer
A network diagram of the major projects in the North West Province is shown in Figure 6.10 below.
Changes compared to the 2011 TDP:

34© Eskom 2013
Figure 6.10: North West Province geographical network diagram

35 Transmission Ten-Year Plan 2013 – 2022
6.6 FREE STATE (FS) PROVINCE
The current transmission network and CLNs are shown in Figure 6.11 below.
Figure 6.11: Current Free State Province network and CLNs
The 765kV network is primarily used for the transportation of power through the grid to the Cape. The projects for the Free State Province are mainly the introduction of 400kV lines and transformation to support or relieve the 275kV networks. The load growth in the grid is shown in Table 6.11 below.
Table 6.11: Free State Province CLN load forecast and percentage load increases
The increase in transmission assets by the end of 2017 and the end of 2022 and the cumulative total are shown in Table 6.12.
CLN Forecast load (MW) Ave. annual % load increase
2013 2018 2022
Bloemfontein 486 615 649 3.1%
Welkom 848 874 893 0.6%
Kimberley 181 191 198 -1.7%
Carltonville 290 293 295 -0.2%

36© Eskom 2013
Table 6.12: Cumulative assets for Free State Province
Transmission Assets for Free State Province New Assets expected in 2013-2017
New Assets expected in 2018-2022
Total New Assets expected
Total kms of line 110 663 773
765kV Lines (km) 0 430 430
400kV Lines (km) 110 233 343
275kV Lines (km) 0 0 0
Total installed Transformer MVA 250 1,000 1,250
Transformers (no. of) 1 3 4
Capacitors (no. of) 0 2 2
Reactors (no. of) 0 7 7
The following projects are planned for the 2013 to 2022 period:
SUB-PROJECT NAME TDP SCHEME PROJECT Province New Expected Year
Everest - Merapi 275kV (built at 400kV standards)
Bloemfontein Strengthening FS 2016
Merapi Ext 3rd 250MVA 275/132kV transformer
Bloemfontein Strengthening FS 2016
Beta - Harvard 400kV Bloemfontein Strengthening Phase 2 FS 2022
Harvard 400/132kV S/S Bloemfontein Strengthening Phase 2 FS 2022
Harvard-Merapi 400kV Bloemfontein Strengthening Phase 2 FS 2022
Merapi 400/132kV S/S Bloemfontein Strengthening Phase 2 FS 2022
Series Compensation on Zeus-Perseus 1st 765kV line
Cape Corridor Phase 4: 2nd Zeus-Per-Gam-Ome 765kV Line
FS 2022
Zeus-Perseus 2nd 765kV line (most direct line)
Cape Corridor Phase 4: 2nd Zeus-Per-Gam-Omega 765kV Line
FS 2022
Sorata 275/132kV S/S Harrismith Strengthening Phase 1 FS 2022
Tugela-Sorata 275kV (energise existing line) Harrismith Strengthening Phase 1 FS 2022
Theseus Ext 400kV 1st 100MVAr reactor Kimberley Strengthening Phase 3 FS 2018
Merapi Ext 2X132kV feeder bay (Wind) Merapi Wind Phase 1 FS 2019
Selemo 400kV loop-in (Hermes-Pluto 2nd 400kV line to form 1st 400kV lines from Selemo to s/s)
Medupi Integration (Charlie) Phase 2C: Epsilon
NW 2017
Selemo Ext 765/400kV transformation (1st and 2nd 2000MVA transformers)
Medupi Integration (Charlie) Phase 2C: Epsilon
NW 2017
Selemo-Midas 1st 400kV line (Pluto 400kV by-pass of Selemo-Pluto and extension to Midas)
Medupi Integration (Charlie) Phase 2C: Epsilon
NW 2017
Nzhelele 400/132kV substation (1st & 2nd 250MVA)
Nzhelele 400kV reinforcement NW 2020
Bighorn 400/132kV 2 x 500MVA Substation Extension
Rustenburg Strengthening Phase 1 NW 2016
Rustenburg Strengthening Phase 2 (Marang B) Rustenburg Strengthening Phase 2 NW 2017

37 Transmission Ten-Year Plan 2013 – 2022
Removed from the TDP:• None
New projects/schemes in the TDP:• Beta - Harvard 400kV • Harvard 400/132kV S/S• Harvard-Merapi 400kV • Merapi 400/132kV S/S• Tugela-Sorata 275kV (energise existing line)• Sorata 275/132kV S/S
Modified (mainly due to date changes):• Everest - Merapi 275kV (built at 400kV standards). This
was previously specified to be built at 275kV standards. • Series Compensation on Zeus-Perseus 1st 765kV line• Zeus-Perseus 2nd 765kV line (most direct line)
A network diagram of the major projects in the Free State Province is shown in Figure 6.12 below.
Changes compared to the 2011 TDP:
Figure 6.12: Free State Province geographical network diagram

38© Eskom 2013
6.7 NORTHERN CAPE (NC) PROVINCE
The current transmission network and CLNs are shown in Figure 6.13 below.
Figure 6.13: Current Northern Cape Province network and CLNs
The projects for the Northern Cape Province are mainly the introduction of 400kV lines and transformation to support or relieve the 400kV and 275kV networks. The load growth in the grid is shown in Table 6.13 below.
Table 6.13: Northern Cape Province CLN load forecast and percentage load increases
Included in the TDP studies is the forecast export to Namibia via the 400kV and 220kV interconnections. The export amount has been assumed to remain constant over the TDP period. There is also a plan to integrate 1 100 MW of solar generation in the Upington area (as indicated in last year’s TDP).
The increase in transmission assets by the end of 2017 and the end of 2022 and the cumulative total are shown in Table 6.14.
CLN Forecast load (MW) Ave. annual % load increase
2013 2018 2022
Namaqualand 136.3 263 266 7.5%
West Coast 12 13 13 1%
Kimberley 406 981 1 247 16.3%
Karoo 297 309 325 1.3%

39 Transmission Ten-Year Plan 2013 – 2022
Table 6.14: Cumulative assets for Northern Cape Province
Transmission Assets for North Cape Province New Assets expected in 2013-2017
New Assets expected in 2018-2022
Total New Assets expected
Total kms of line 1,089 1,290 2,379
765kV Lines (km) 0 440 440
400kV Lines (km) 1,089 750 1,839
275kV Lines (km) 0 100 100
Total installed Transformer MVA 5,445 1,815 7,260
Transformers (no. of) 20 4 24
Capacitors (no. of) 3 1 4
Reactors (no. of) 6 4 10
The following projects are planned for the 2013 to 2022 period:
SUB-PROJECT NAME TDP SCHEME PROJECT Province New Expected Year
Gamma-Perseus 2nd 765kV line Cape Corridor Phase 4: 2nd Zeus-Per-Gam-Omega 765kV Line
NC 2022
Ferrum Ext 132kV feeder bay (Kalahari) Ferrum 132kV Feeder extension NC 2013
Ruigtevallei - Hydra de-rate 220kV line to 132kV
Gariep Network Strengthening NC 2013
Ruigtevallei 132kV Feeder bay to Dreunberg Gariep Network Strengthening NC 2013
Kronos 400/132kV transformation Garona Strengthening NC 2016
Kronos-Cuprum 1st & 2nd 132kV Garona Strengthening NC 2016
Gromis Ext 400/132kV(1X500MVA) Substation(dedicated 132kV Supply for New Wind Integration)
Gromis Wind Phase 1 NC 2018
Hydra 400 & 132kV equipment upgrade (Fault level requirements) and Hydra Ext 3rd 400/132kV transformer (250 or 500MVA)
Hydra 400 & 132kV equipment upgrade NC 2017
Hydra – Aries 1st 400kV line Hydra - Aries 1st 400kV line NC 2021
Juno Ext 400/132kV(1X500MVA) substation(Dedicated 132kV Supply for New Wind Integration)
Juno Wind Phase 2 NC 2017
Kappa Ext 400/132kV(1X500MVA) substation(New Dedicated 132kV Supply for New Wind Integration)
Kappa Wind Phase 1 NC 2016
Ferrum Ext 1st & 2nd 500MVA 400/132kV transformers
Kimberley 400kV Strengthening Phase 2 NC 2014
Ferrum-Mookodi (Vryburg) 1st 400kV line Kimberley 400kV Strengthening Phase 2 NC 2014
Ferrum-Mookodi (Vryburg) 2nd 400kV line (via Hotazel)
Kimberley Strengthening Phase 3 NC 2018
Hortazel Ext 132kV 1st 36MVAr capacitor Kimberley Strengthening Phase 3 NC 2020
Hotazel 400/132kV Substation (1st and 2nd 500MVA 400/132kV transformers)
Kimberley Strengthening Phase 3 NC 2021
Hotazel 400kV loop-in (Ferrum-Mookodi(Vryburg) 2nd 400kV line)
Kimberley Strengthening Phase 3 NC 2021
Aggeneis-Paulputs 2nd 220kV line N Cape reinforcement: Aggeneis-Paulputs 2nd 220kV
NC 2019
Nama MTS Transformers Upgrade Nama MTS Transformers Upgrade WC 2016
Gromis Ext 220kV SVC Nama Wind Phase 1 WC 2018

40© Eskom 2013
Nama Ext 220kV feeder bay (Wind) Nama Wind Phase 1 WC 2018
Aries Ext 400kV 1st SVC N Cape reinforcement: Aries SVC NC 2017
Aries - Nieuwehoop 400kV line N Cape reinforcement: Ferrum - Nieuwehoop - Aries 400kV
NC 2015
Ferrum - Nieuwehoop 400kV line N Cape reinforcement: Ferrum - Nieuwehoop - Aries 400kV
NC 2017
Juno - Gromis 400kV and 2nd Gromis - Oranjemond 220kV lines
Namaqualand Strengthening NC 2021
Paulputs Ext 2nd 125MVA 220/132kV transformer
Paulputs Ext 2nd 125MVA 220/132kV transformer
NC 2017
Kaxu Solar 1 - 100MW CSP Plant REBID 1 preferred bidders NC 2014
Bokpoort 50MW CSP Project REBID 2 preferred bidders NC 2015
Solar Capital De Aar REBID 2 preferred bidders NC 2015
Garona Ext 275kV STATCOM Sishen-Saldanha Full Solution (Supply for New Spoornet Traction)
NC 2017
Series Compensation of 400kV lines (Reconfiguration of Northern Cape capacitors)
Sishen-Saldanha Full Solution (Supply for New Spoornet Traction)
NC 2017
Sishen-Saldanha Spoornet new traction stations (4 sites with 8 transformers stepping down to 50kV)
Sishen-Saldanha Full Solution (Supply for New Spoornet Traction)
NC 2017
Aries-Upington 1st 400kV lines Upington Strengthening Phase 1 NC 2016
Aries-Upington 2nd 400kV lines Upington Strengthening Phase 1 NC 2016
Ferrum-Upington 1st 400kV line Upington Strengthening Phase 1 NC 2016
Nieuwehoop -Upington 1st 400kV line Upington Strengthening Phase 1 NC 2016
Upington 5x 500MVA 400/132kV Transformation
Upington Strengthening Phase 1 NC 2016
Removed from the TDP:• Helio – Aggeneis 1st 400kV line ( replaced by Juno –
Gromis 1st 400kV line)
New projects/schemes in the TDP:• Juno - Gromis 1st 400kV and 2nd Gromis -
Orangemond 220kV lines• Hydra – Aries 1st 400kV line• Kaxu Solar 1 - 100MW CSP Plant - Paulputs• Bokpoort 50MW CSP Project - Garona• Solar Capital De Aar - Hydra
Modified (mainly due to date changes):• Gamma-Perseus 2nd 765kV line• Ferrrum Ext 132kV feeder bay (Kalahari)• Kronos 400/132kV transformation• Kronos-Cuprum 1st & 2nd 132kV• Ferrum Ext 1st & 2nd 500MVA 400/132kV
transformers
• Ferrum-Mookodi (Vryburg) 1st 400kV line• Ferrum-Mookodi (Vryburg) 2nd 400kV line (via
Hotazel)• Hotazel 400kV loop-in Ferrum-Mookodi (Vryburg) 2nd
400kV line• Hotazel 400/132kV Substation (1st and 2nd 500MVA
400/132kV transformers) • Nama MTS Transformers Upgrade• Aries Ext 400kV 1st SVC• Garona Ext 275kV STATCOM• Series Compensation of 400kV lines (reconfiguration of
Northern Cape capacitors)• Sishen-Saldanha Spoornet new traction stations (4 sites
with 8 transformers stepping down to 50kV)• Ferrum - Nieuwehoop 400kV line• Aries - Nieuwehoop 400kV line
A network diagram of the major projects in the Northern Cape Province is shown in Figure 6.14 below.
Changes compared to the 2011 TDP:

41 Transmission Ten-Year Plan 2013 – 2022
Figure 6.14: Northern Cape Province geographical network diagram

42© Eskom 2013
6.8 EASTERN CAPE (EC) PROVINCE
The current transmission network and primary CLNs are shown in Figure 6.15 below.
Figure 6.15: Current Eastern Cape Province network and CLNs
The expected peak demands by 2022 as well as the average percentage load increase for the period, for each CLN, are given in Table 6.15a below.
Table 6.15a: Eastern Cape Province CLN load forecast and percentage load increases
The TDP schemes for the Eastern Cape Province consist of the integration of the DME OCGT power station at Dedisa, the reinforcement of the greater Port Elizabeth metro area including the Coega IDZ, and the Greater East London strengthening scheme, which includes the integration of the Vuyani 400/132kV substation at Mthatha to supply the central and southern Transkei area. If the first Nuclear 1 unit materialises at Thyspunt , three additional 400kV lines would be required to link it to Grassridge and Dedisa via the new Port Elizabeth 400/132kV substation. The integration of Thyspunt has been excluded from this TDP as it falls outside the planning period. The increase in transmission assets by the end of 2017 and the end of 2022 as well as the cumulative total are shown in Table 6.15b.
CLN Forecast load (MW) Ave. annual % load increase
2013 2018 2022
East London 685 791 877 4.2%
Port Elizabeth 1 042 1 556 1 967 7.7%

43 Transmission Ten-Year Plan 2013 – 2022
Table 6.15b: Cumulative TDP transmission assets for the Eastern Cape Province
Transmission Assets for Eastern Cape Province
New Assets expected in 2013-2017
New Assets expected in 2018-2022
Total New Assets expected
Total kms of line 886 541 1,427
765kV Lines (km) 350 350 700
400kV Lines (km) 536 191 727
275kV Lines (km) 0 0 0
Total installed Transformer MVA 6,080 2,215 8,295
Transformers (no. of) 11 7 18
Capacitors (no. of) 4 3 7
Reactors (no. of) 3 1 4
The following projects are planned for the 2013 to 2022 period:
SUB-PROJECT NAME TDP SCHEME PROJECT Province New Expected Year
Delphi 3rd 120MVA 400/132kV transformer Delphi 3rd 120MVA 400/132kV transformer EC 2020
Delphi Ext 132kV feeder bay (Wind) Delphi Wind Phase 1 EC 2013
Delphi Ext 1st 400kV SVC Delphi Wind Phase 2 EC 2019
Delphi Ext 400/132kV(1X500MVA) substation(dedicated 132kV Supply for New Wind Integration)
Delphi Wind Phase 2 EC 2019
Dedisa Ext 3x 400kV feeder bays (DME OCGT Integration)
DME OCGT Integration at Dedisa 400kV EC 2013
Grassridge 132kV equipment upgrade (Fault level requirements)
Grassridge 132kV equipment upgrade (Fault level requirements)
EC 2017
Grassridge Ext 132kV feeder bay (Wind) Grassridge Wind Phase 1 EC 2013
Grassridge Ext 2X132kV feeder bay (Wind) Grassridge Wind Phase 2 EC 2016
Grassridge Ext 2X132kV feeder bay (Wind) Grassridge Wind Phase 3 EC 2019
Grassridge Ext 3rd 400/132kV 500MVA transformer and busbar upgrade
Grassridge-Dedisa Strengthening EC 2017
Dedisa Ext 3nd 500MVA 400/132kV transformer
Grassridge-Dedisa Strengthening EC 2018
Grassridge-Dedisa 1st 132kV line Grassridge-Dedisa Strengthening EC 2014
Eros-Vuyani (Mthatha) 1st 400kV line Greater East London Strengthening - Phase 1: Eros-Mthatha & SS
EC 2013
Vuyani (Mthatha) 400/132kV Substation (1st and 2nd 250MVA)
Greater East London Strengthening - Phase 1: Eros-Mthatha & SS
EC 2013
Neptune-Vuyani 1st 400kV line Greater East London Strengthening - Phase 2: Neptune-Mthatha & SS
EC 2013
Poseidon-Neptune 1st 400kV Line Greater East London Strengthening - Phase 3
EC 2019
Pembroke B 400/132kV substation Greater East London Strengthening - Phase 3
EC 2019
Pembroke B loop-in and out Poseidon-Neptune 1st 400kV line
Greater East London Strengthening - Phase 3
EC 2019
Hydra Ext 132kV feeder bay (Wind) Hydra Wind Phase 1 EC 2017
Dedisa Ext 400kV 1st 100MVAr capacitor PE Phase 3: Poseidon, Delphi, Grassridge and Dedisa Shunt compensation
EC 2015
Delphi Ext 400kV 1st 100MVAr capacitor PE Phase 3: Poseidon, Delphi, Grassridge and Dedisa Shunt compensation
EC 2015

44© Eskom 2013
Removed from the TDP:• None
New projects/schemes in the TDP:• Cookhouse - 140MW wind integration• Grassridge - Innowind - 60MW Wind Farm• Amakhala Emoyeni wind integration
Modified (mainly due to date changes):• Delphi 3rd 120MVA 400/132kV transformer• Dedisa Ext 3x 400kV feeder bays
(DME OCGT Integration)
• Vuyani (Mthatha) 400/132kV Substation (1st and 2nd 250MVA)
• Neptune-Vuyani 1st 400kV line• Pembroke B loop-in and out Poseidon-Neptune
1st 400kV line• Poseidon-Neptune 1st 400kV Line• Pembroke B 400/132kV Substation• Pembroke 2 x 160MVA 132/66kV transformer
The geographical network of the Eastern Cape Province is shown in Figure 6.16 below.
Changes compared to the 2011 TDP:
Grassridge Ext 400kV 1st 100MVAr capacitor PE Phase 3: Poseidon, Delphi, Grassridge and Dedisa Shunt compensation
EC 2015
Poseidon Ext 400kV 1st 100MVAr capacitor PE Phase 3: Poseidon, Delphi, Grassridge and Dedisa Shunt compensation
EC 2015
Dedisa Ext 400kV 2nd 100MVAr capacitor PE Phase 4: Poseidon, Delphi, Grassridge and Dedisa Shunt compensation
EC 2022
Grassridge Ext 400kV 2nd 100MVAr capacitor PE Phase 4: Poseidon, Delphi, Grassridge and Dedisa Shunt compensation
EC 2022
Poseidon Ext 400kV 2nd 100MVAr capacitor PE Phase 4: Poseidon, Delphi, Grassridge and Dedisa Shunt compensation
EC 2022
Pembroke 2 x 160MVA 132/66kV transformer
Pembroke Transformer Upgrade EC 2019
Cookhouse - 140MW wind Integration REBID 1 preferred bidders EC 2014
Amakhala Emoyeni REBID 2 preferred bidders EC 2015
Grasssridge Innowind - 60MW Wind Farm REBID 2 preferred bidders EC 2015
Gamma Ext 765kV busbar extension Southern Grid - Phase 3 : 1st Gamma Grassridge 765kV Line
EC 2017
Gamma-Grassridge 1st 765kV line Southern Grid - Phase 3 : 1st Gamma Grassridge 765kV Line
EC 2017
Grassridge Ext 765/400kV transformation Southern Grid - Phase 3 : 1st Gamma Grassridge 765kV Line
EC 2017
Gamma-Grassridge 2nd 765kV line 350km Southern Grid - Phase 4: 2nd Gamma Grassridge 765kV Line
EC 2022
Buffalo, Pembroke Transformer LV Supply Normalisation
Southern Grid - Transmission Transformer Normalisation
EC 2014

45 Transmission Ten-Year Plan 2013 – 2022
Figure 6.16: The Eastern Cape Province network diagram

46© Eskom 2013
6.9 WESTERN CAPE (WC) PROVINCE
The current transmission network and CLNs are shown in Figure 6.17 below.
Figure 6.17: Current Western Province network and CLNs
The Western Cape Province development plan consists of 765kV and 400kV network integration. The expected peak demands by 2022 and the average percentage load increase for the period for each CLN are given in Table 6.16 below.
Table 6.16: Western Cape Province CLN loads and percentage load increases
The TDP schemes for the Western Cape Province consist of extending the 400kV network and introducing 765kV injection. There is also the installation of additional transformers at existing and new substations.
The increase in transmission assets by the end of 2017 and the end of 2022 and the cumulative total are shown in Table 6.17.
CLN Forecast load (MW) Ave. annual % load increase
2013 2018 2022
West Coast 474 519 543 1.6%
Southern Cape 945 1052 1157 2.7%
Peninsula 3 218 3 717 4 018 3.6%

47 Transmission Ten-Year Plan 2013 – 2022
Table 6.17: Cumulative TDP transmission assets for the Western Cape Province
Transmission Assets for Western Cape Province
New Assets expected in 2013-2017
New Assets expected in 2018-2022
Total New Assets expected
Total kms of line 590 943 1,533
765kV Lines (km) 560 560 1,120
400kV Lines (km) 30 383 413
275kV Lines (km) 0 0 0
Total installed Transformer MVA 9,660 7,000 16,660
Transformers (no. of) 16 11 27
Capacitors (no. of) 0 0 0
Reactors (no. of) 15 4 19
The following projects are planned for the 2013 to 2022 period:
SUB-PROJECT NAME TDP SCHEME PROJECT Province New Expected Year
Aurora Ext 132kV feeder bay (Wind) Aurora Wind Phase 1 WC 2014
Aurora Ext 2X132kV feeder bay (Wind) Aurora Wind Phase 2 WC 2017
Bacchus Ext 2X132kV feeder bay (Wind) Bacchus Wind Phase 1 WC 2016
Bacchus Ext 2X132kV feeder bay (Wind) Bacchus Wind Phase 2 WC 2019
Blanco 400/132kV Substation (1st and 2nd 500MVA transformers)
Blanco Substation Establishment (2x 500MVA 400/132kV TRFR's)
WC 2018
Blanco 400kV line loop-in (Proteus-Droerivier 1st 400kV line)
Blanco Substation Establishment (2x 500MVA 400/132kV TRFR's)
WC 2018
Blouwater 400/132kV Substation (1st and 2nd 500MVA transformers)
Blouwater Substation Establishment (2x 500MVA 400/132kV TRFR's)
WC 2021
Aurora – Blouwater 1st and 2nd 400kV line Blouwater Substation Establishment (2x 500MVA 400/132kV TRFR's)
WC 2021
Gamma-Kappa 1st 765kV line Cape Corridor Phase 2: Gamma-Omega 765kV Integration
WC 2013
Kappa-Sterrekus (Omega) 1st 765kV line Cape Corridor Phase 2: Gamma-Omega 765kV Integration
WC 2015
Sterrekus (Omega) 400kV Loop-in (Koeberg-Muldersvlei 400kV line)
Cape Corridor Phase 2: Gamma-Omega 765kV Integration
WC 2015
Sterrekus (Omega) 765/400kV Substation Cape Corridor Phase 2: Gamma-Omega 765kV Integration
WC 2015
Gamma Ext 2nd 400MVar 765kV busbar reactor
Cape Corridor Phase 2: Kappa 765kV Integration
WC 2013
Kappa 765/400kV Substation Cape Corridor Phase 2: Kappa 765kV Integration
WC 2013
Kappa Ext 400kV 100MVAr shunt reactor Cape Corridor Phase 2: Kappa 765kV Integration
WC 2013
Kappa 400kV Loop-ins (Droerivier-Bacchus & Droerivier-Muldersvlei 400kV lines)
Cape Corridor Phase 2: Kappa 765kV Integration
WC 2015
Gamma-Kappa 2nd 765kV line Cape Corridor Phase 4: 2nd Zeus-Per-Gam-Omega 765kV Line
WC 2022
Droerivier Ext 132kV feeder bay (Wind) Droerivier Wind Phase 1 WC 2017
Droerivier Ext 400/132kV(1X500MVA) substation (Dedicated 132kV Supply for New Wind Integration)
Droerivier Wind Phase 2 WC 2017
Droerivier Ext 2X132kV feeder bay (Wind) Droerivier Wind Phase 3 WC 2019

48© Eskom 2013
Droerivier-Proteus 2nd 400kV line Droerivier-Proteus 2nd 400kV line WC 2021
Firgrove 400/132kV Substation (1st and 2nd 500MVA transformers)
Firgrove Substation Establishment (2x 500MVA 400/132kV TRFR's)
WC 2016
Firgrove 400kV line loop-in (Palmiet-Stikland 1st 400kV line)
Firgrove Substation Establishment (2x 500MVA 400/132kV TRFR's)
WC 2016
Ankerlig 132kV Loop-in Koeberg-Dussenberg 132kV line
Gas 1 off-site relocation to Ankerlig WC 2015
Ankerlig Ext Gas 1 generators 3x 57MW Gas 1 off-site relocation to Ankerlig WC 2015
Houhoek 400/132kV Substation (1st and 2nd 500MVA transformers)
Houhoek Substation Establishment (2x 500MVA 400/132kV TRFR's)
WC 2018
Houhoek 400kV line loop-in (Palmiet-Bacchus 1st 400kV line)
Houhoek Substation Establishment (2x 500MVA 400/132kV TRFR's)
WC 2018
Juno MTS Transformers upgrade project Juno MTS transformers upgrade project WC 2016
Koeberg 400kV busbar reconfiguration Koeberg 400kV busbar reconfiguration and transformers upgrade project
WC 2018
Koeberg Transformers upgrade project Koeberg 400kV busbar reconfiguration and transformers upgrade project
WC 2016
Mitchells Plain 400/132kV Substation (1st and 2nd 500MVA transformers)
Mitchells Plain 400kV Substation WC 2018
Mitchells Plain Switching Station Mitchells Plain 400kV Substation WC 2018
Mitchells Plain Switching Station-Mitchells Plain 1st 400kV line
Mitchells Plain 400kV Substation WC 2018
Mitchells Plain Switching Station-Mitchells Plain 2nd 400kV line
Mitchells Plain 400kV Substation WC 2018
Philippi-Mitchells Plain 1st 400kV line Mitchells Plain 400kV Substation WC 2018
Muldersvlei Ext 3rd 500MVA 400/132kV transformer & 132kV Series Reactors
Muldersvlei Ext 3rd 500MVA 400/132kV transformer & 132kV Series Reactors
WC 2015
Philippi Ext 3rd 500MVA 400/132kV transformer
Philippi Ext 3rd 500MVA 400/132kV transformer
WC 2016
West Coast 1 (Aurora MTS) REBID 2 preferred bidders WC 2015
Stikland Ext 3rd 500MVA 400/132kV transformer
Stikland Ext 3rd 500MVA 400/132kV transformer
WC 2021
Vryheid 400/132kV Substation (1st and 2nd 250MVA transformers)
Vryheid Substation Establishment (2x 250MVA 400/132kV TRFR's)
WC 2020
Vryheid 400kV line loop-in (Bacchus - Proteus 400kV line)
Vryheid Substation Establishment (2x 250MVA 400/132kV TRFR's)
WC 2020
Windmill 400kV line loop-in (Bacchus - Muldersvlei 400kV line)
Windmill Substation Establishment (2x 500MVA 400/132kV TRFR's)
WC 2022
Windmill 400/132kV Substation (1st and 2nd 500MVA transformers)
Windmill Substation Establishment (2x 500MVA 400/132kV TRFR's)
WC 2022

49 Transmission Ten-Year Plan 2013 – 2022
Figure 6.18: Western Cape Province geographical network diagram
Removed from the TDP:• None
New projects/schemes in the TDP:• Aurora - Blouwater 1st 400kV line• Blouwater 400/132kV Substation (1st and 2nd 500MVA
transformers)• Aurora - Blouwater 2nd 400kV line• Vryheid 400kV line loop-in (Bacchus - Proteus 400kV line)• Vryheid 400/132kV Substation (1st and 2nd 250MVA
transformers)• Windmill 400kV line loop-in (Bacchus - Muldersvlei
400kV line)• Windmill 400/132kV Substation (1st and 2nd 500MVA
transformers)• Stikland Ext 3rd 500MVA 400/132kV transformer• Ankerlig - Sterrekus 400kV lines• Koeberg 400kV busbar reconfiguration• Koeberg Transformers upgrade project• Juno MTS Transformers upgrade project• West Coast 1 wind integration (Aurora MTS)
Modified (mainly due to date changes):• Sterrekus (Omega) 400kV Loop-in (Koeberg-
Muldersvlei 400kV line)
• Kappa-Sterrekus (Omega) 1st 765kV line• Sterrekus (Omega) 765/400kV Substation• Kappa 400kV Loop-ins (Droerivier-Bacchus &
Droerivier-Muldersvlei 400kV lines)• Gamma-Kappa 2nd 765kV line • Sterrekus Ext 2nd 2000MVA 765/400kV transformer• Droerivier-Proteus 2nd 400kV line• Firgrove 400kV line loop-in (Palmiet-Stikland 1st 400kV line)• Firgrove 400/132kV Substation (1st and 2nd 500MVA
transformers)• Ankerlig Ext Gas 1 generators 3x 57MW • Ankerlig 132kV Loop-in Koeberg-Dassenberg 132kV line• Mitchells Plain Switching Station-Mitchells Plain 1st
400kV line• Mitchells Plain Switching Station-Mitchells Plain 2nd
400kV line• Philippi Ext 3rd 500MVA 400/132kV transformer• MP Switching Station• Philippi-Mitchells Plain 400kV line
A diagram of the major projects in the West Grid is shown in Figure 6.18 below.
Changes compared to the 2011 TDP:

50© Eskom 2013
6.10 A PLAN FOR WIND AND SOLAR
The preferred bidders connecting to Transmission substations that were selected as part of the DOE IPP Renewable Energy Programme round 1 and round 2 have been added to the plan. This is illustrated in Figure 6.19 below. The rest of the preferred bidders are scheduled to be connected to the Eskom Distribution/Municipality networks.
Figure 6.19: Round 1 and 2 of DOE Renewable Energy Preferred Bidders – Transmission Connections
A plan is also contained in this TDP update (similar to last year’s TDP) to include the integration of wind and solar generation based on the assumptions of the location and size made in Section 2.2 above of the generation assumptions. The plan is included in the provincial network sections above. It should be noted that this is merely an assumption at this stage, especially as regards the locations selected for the wind farms which are next to existing Transmission substations. The Upington Solar Park can be assumed to be more accurate, considering that the area represents some of the highest sources of solar radiation in the country. The main reason for producing this plan was to compile a financial budget for this type of generation integration for the Transmission Ten-Year Supply Plan.
This plan resulted in a lot of simple feeder-bay requirements at most of the selected Transmission stations initially, as there is spare capacity. As this capacity runs out, new transformers will have to be added to ensure that Grid Code Criteria are met. Two SVCs have been placed on the system in order to ensure the voltage requirements are met. One was placed at the Gromis substation and the other at the Delphi substation.
The TDP will be updated annually with more accurate information on the location and size of new wind and solar generation facilities, based on the Connection Quotation applications received.
51 Transmission Ten-Year Plan 2013 – 2022
6.11 STRATEGIC SERVITUDES UNDER INVESTIGATION
All the line projects and new substation projects that are proposed in the document need to go through a full environmental impact assessment (EIA) process before implementation. This process includes public participation meetings, which are advertised in the media. The concerns of the public and affected parties are addressed at the public participation meetings. Eskom Holdings will not commence the construction of any line or substation unless the EIA process (Record of Decision signed and servitudes acquired) has been concluded.
The proposed lines shown in various schematics in this document give an estimation of where the various proposed lines will run. The outcome of the EIA process will determine the exact position of the lines. The projects in this document are at various stages of the EIA and Land Acquisition processes.

52© Eskom 2013
The total capital expenditure for Transmission including expansion, refurbishment, spares, production equipment, and land acquisition project costs amount to R174 billion (excluding IDC). This summary is shown in Table 7.1. It is clear that the majority of the cost will be related to expansion because this relates directly to the strengthening of the network to accommodate new customers as well as new generation.
Table 7.1: Capital Expenditure (10 Year Plan) for different categories of projects
Refurbishment and land acquisition projects are the second and third-most expensive items in the capital expenditure, respectively. Refurbishment is required to prolong the life of assets and land acquisition projects are required to purchase the land in which to build the expansion assets.
The summary of expansion capital expenditure per project type required to realise this ten-year plan is shown in Table 7.2. The total expenditure is expected to be approximately of R149 billion.
Table 7.2: Capital expenditure per project type
Please note that the amounts in the tables represents cash flows in the Ten-year plan periods, any cash flows not falling within this period have not been added, consequently the total cost of the plan may be higher than reflected here.
The details of costing per Province and Project type are shown in Appendix B. For purposes of confidentiality the planned or exact costs per project of Customer Projects have been excluded from the table, however the total sum of all customer projects are indicated in Table 7.2 above.
7. CAPITAL EXPENDITURE PLAN
Capital expenditure (R’mil) FY 13-22
Capacity expansion 149,259
Refurbishment 12,194
Strategic 1,729
EIA and servitudes 4,696
Capital spares 2,349
Production equipment 4,537
Total 174,763
Type Total (R’mil)
Customer Connections (Load) 2,752
Generation 25,665
Reliability 120,842
Grand Total 149,259

53 Transmission Ten-Year Plan 2013 – 2022
The most visible difference between this TDP and the previous year’s TDP is the increase in the amount of transformation (MVA) by approx. 11000MVA. This is mainly due to new substations being added in the latter part of the planning period.
There is a marginal change in the net amount of lines (km) required. More kilometres of line have however been added in the new planning period.
There has been re-phasing of the existing projects using more realistic completion dates. The acquisition of servitudes for lines and new substations continues to be a challenge for Eskom Transmission resulting in the re-phasing in most cases.
Projects required for the DOE Renewable Energy (RE) IPP program that are in Budget quote phase have been added. There still remains an assumed plan for Renewable Energy integration.
The result is an improved and more realistic or achievable spread of the transmission line projects and transformer installations. New substations have been included, mainly owing to a better positioning of loads resulting from the spatial load-forecasting techniques applied.
Slower rates of completion of the transmission lines and new transformers has resulted in an increase of the overall risk to the network. However this risk can be managed as the N-1 un-firm refers to the strict deterministic level which assumes that the N-1 event will happen at the time of the loading peak. In reality there is a limited chance of this happening and operational mitigation plans will cater for most of the events until the required projects have been completed. Some of the risk mitigation measures under consideration include higher reliance on the following: utilisation of strategic spares, the use of capacitors in the short term for voltage support, as well as Emergency Preparedness Plans.
The economic slowdown as well as efforts to promote demand side management through the use of solar geysers and compact fluorescent lamps and by encouraging the saving of electricity has greatly assisted in reducing major supply constraints.
The economy is, however, showing signs of a recovery, and there should be a return to pre-recession demand levels and forecasts soon. Hence we believe it will be necessary to proceed with the planned infrastructure development.
This Ten-Year Plan has many similarities with the previous one as far as projects are concerned. At the end of the period of this Ten-Year Plan, it is expected that the transmission network will be fully compliant to the reliability requirements of the Grid Code that were amended in 2008.
Robust and efficient planning requires the timely exchange of credible information between stakeholders. In particular, stakeholders are requested to note that spatial data and information are critical for the effective planning and development of the transmission network.
Transmission infrastructure could easily become the critical path in connecting and integrating large new loads and generation, due to the long lead times for securing corridors. We recommend that for planning purposes, developers should allow for at least 7 years’ lead time for new corridors. It should also be noted that in the EIA process, there are increasing objections from landowners and other stakeholders to proposed power line routes, which may further prolong the time required to implement projects.
The conclusion is that the transmission projects in this TDP will result in the overall network becoming Grid Code compliant while catering for increased load growth and the integration of new generation. The system will be running at risk in some areas, and careful operational mitigation planning will have to be undertaken until the transmission projects and new generation are in place.
The estimated rand value of the planned projects is approximately R149 billion (excluding IDC) over the next ten years, of which approximately R3 billion is for customer related projects; R25 billion for generation integration projects, and approximately R121 billion is related to reliability projects.
8. CONCLUDING REMARKS

54© Eskom 2013
> APPENDIX A: GENERATION ASSUMPTIONS
Gen
erat
ion
Plan
t us
ed fo
r th
e T
DP
stud
ies

55 Transmission Ten-Year Plan 2013 – 2022
> APPENDIX B: COSTING DETAILS
APPENDIX B1: COSTING PER PROJECT TYPE
Type Total (R’mil)
Customer Connections (Load) 2,752
Generation 25,665
Reliability 120,842
Grand Total 149,259
Please note that the amounts in the tables represents cash flows in the Ten-year plan periods, any cash flows not falling within this period have not been added, consequently the total cost of the plan may be higher than reflected here.

56© Eskom 2013
APPENDIX B2A: COSTING FOR GAUTENG PROVINCE PROJECTS
Please note that the amounts in the tables represent cash flows as a total scheme cost that may fall outside of the Ten-year plan periods.
Province Project Cost (R) Grand Total
GP Benburg Ext 3rd 250MVA 275/132kV 91,280,731
13,499,147,238
GP JHB Reactive Power Project 17,301,301
GP Johannesburg CLN Fault Level Management 40,000,000
GP Johannesburg East Strengthening - Phase 3 A-D - Apollo-Esselen 1st 400kV (energised @ 275kV)
125,695,806
GP Johannesburg North - Phase 2a (Lepini Ext 275kV 2x 150Mvar capacitors)
125,695,806
GP Johannesburg North - Phase 2b (Apollo-Lepini 1st 275kV line)
297,467,850
GP Pelly 132/22kV transformation upgrade 30,148,222
GP Tshwane Reinforcement - Phoebus Phase 1 - 3 & Verwoerdburg Phase 1 - 2
1,834,000,000
GP Johannesburg East Strengthening - Phase 1B 437,669,700
GP Johannesburg East Strengthening - Phase 2 328,366,954
GP Johannesburg East Strengthening - Phase 3 A-D - Prospect-Sebenza 1st 275kV line
244,065,056
GP Johannesburg East Strengthening - Phase 3 A-D - Matla-Jupiter B 1st 400kV line (operated @ 275kV)
1,954,972,921
GP Johannesburg East Strengthening - Phase 3 A-D - Jupiter B 275kV Loop-ins
15,760,075
GP Johannesburg East Strengthening - Phase 3 E-F 577,379,766
GP Soweto Strengthening Phase 1 - 275kV 496,999,919
GP Tshwane Reinforcement - Wildebees Phase 1 125,000,000
GP Vaal Strengthening Phase 2 393,338,988
GP Johannesburg East Strengthening - Phase 2 328,366,954
GP Kookfontein Phase 2 211,083,468
GP Simmerpan 275/88kV substation 524,033,470
GP Soweto Strengthening Phase 1 - 275kV 496,999,919
GP Soweto Strengthening Phase 2 - 275/132kV 424,435,512
GP Demeter 400kV Integration 911,473,670
GP Kyalami Integration 1,365,153,157
GP Tshwane Reinforcement - Anderson Phase 1 107,728,184
GP West Rand Strengthening - Phase: Westgate and Taunus 400kV - Westgate 400/132kV substation
928,529,774
GP West Rand Strengthening - Phase: Westgate and Taunus 400kV
903,299,265
GP West Rand Strengthening - Phase: Etna 400kV 162,900,769

57 Transmission Ten-Year Plan 2013 – 2022
APPENDIX B2C: COSTING FOR LIMPOPO PROVINCE PROJECTS
APPENDIX B2B: COSTING FOR KZN PROVINCE PROJECTS
Please note that the amounts in the tables represent cash flows as a total scheme cost that may fall outside of the Ten-year plan periods.
Please note that the amounts in the tables represent cash flows as a total scheme cost that may fall outside of the Ten-year plan periods.
Province Project Cost (R) Grand Total
Lim Medupi Integration (Charlie) Phase 2B: Mokopane 647,000,000
30,189,125,936
Lim Medupi Phase 3 (Masa - Selemo 765kV lines; Masa & Selemo Substations). Selemo falls in the NW
Province, however costs are included in this scheme
12,897,146,491
Lim Nzhelele 400kV reinforcement 1,970,518,927
Lim Spitskop Transformation Upgrade 81,129,122
Lim Tabor and Spencer Reinforcement - Phase 2 622,000,000
Lim Medupi Integration (Alpha) Phase 1A & Phase 1B: Marang, Spitskop and Dinaledi
11,100,000,000
Lim Tubatse Strengthening Scheme Phase 3 900,812,469
Lim Nzhelele 400kV reinforcement 1,970,518,927
Province Project Cost (R) Grand Total
KZN Ariadne-Venus 2nd 400kV Line 897,853,599
22,086,284,606
KZN Avon Ext 3rd 250MVA 275/132kV transformer 71,623,313
KZN DME OCGT Integration at Avon 275kV (Pinetown) 55,727,089
KZN eThekwini Electricity Network Strengthening 2,111,600,262
KZN Incandu Ext 3rd 500MVA 400/132kV transformer 91,925,010
KZN Ingula Pumped Storage P/S Integration 1,271,000
KZN KZN 765kV Strengthening - Empangeni Integration - Theta (Mbewu) Substation
2,839,737,090
KZN KZN 765kV Strengthening - Empangeni Integration - Umfolozi-Theta (Mbewu) 765kV line
1,130,567,008
KZN KZN 765kV Strengthening - Empangeni Integration - Theta (Mbewu) 400kV loop-ins
155,819,955
KZN KZN 765kV Strengthening - Empangeni Integration - Invubu-Theta (Mbewu) 2nd 400kV line
851,933,734
KZN KZN 765kV Strengthening - Lambda Substation and Majuba - Lambda 1st & 2nd 400kV lines
3,255,430,546
KZN KZN 765kV Strengthening - Pinetown Integration - Sigma (Isundu) Substation
3,381,256,423
KZN KZN 765kV Strengthening - Pinetown Integration - Lambda - Sigma (Isundu) 1st 765kV line
2,845,987,673
KZN KZN 765kV Strengthening - Pinetown Integration - Loop in Ariadne - Hector 2 400kV line
843,554,683
KZN KZN 765kV Strengthening Isundu - Mbewu 1st & 2nd 400kV lines
1,603,835,612
KZN Mersey Ext 3rd 250MVA 275/132kV transformer 93,224,469
KZN Normandie Ext 2nd 250MVA 400/132kV transformer
60,000,000
KZN South Coast Strengthening 925,791,713
KZN Transnet Coal - Line Upgrade 869,145,429

58© Eskom 2013
APPENDIX B2D: COSTING FOR NORTH WESTERN PROVINCE PROJECTS
APPENDIX B2E: COSTING FOR MPUMALANGA PROVINCE PROJECTS
Please note that the amounts in the tables represent cash flows as a total scheme cost that may fall outside of the Ten-year plan periods.
Province Project Cost (R) Grand Total
NW Dinaledi 3rd 500MVA 400/132kV Transformer 82,697,462
6,722,413,531
NW Medupi Integration (Charlie) Phase 2A: Mogwase 647,000,000
NW Kimberley 400kV Strengthening Phase 2 1,900,000,000
NW Watershed Strenghtening 152,134,281
NW Dwaalboom 132kV switching station 142,209,852
NW Rustenburg Strengthening Phase 1 292,047,670
NW Lomond MTS transformation upgrade 81,434,444
NW Rustenburg Strengthening Phase 2 910,469,461
NW Kimberley Strengthening Phase 3 (Hermes-Mookodi (Vryburg) 1st 400kV line)
2,514,420,362
Province Project Cost (R) Grand Total
MP Foskor & Acornhoek 275/132kV transformation upgrades
343,202,392
11,221,012,602
MP Highveld North-West and Lowveld North Reinforcement - Phase 1
681,613,169
MP Highveld North-West and Lowveld North Reinforcement - Phase 2
2,163,004,034
MP Highveld North-West and Lowveld North Reinforcement - Phase 3
127,260,665
MP Highveld South Reinforcement 699,975,197
MP Khanyisa PS integration 378,920,203
MP Kruispunt Reinforcement 19,418,665
MP Kusile Integration Phase 1 - 4 2,438,000,000
MP Lowveld 400kV Strengthening - Phase 1: Gumeni 400,000,000
MP Lowveld 400kV Strengthening - Phase 2: Marathon B 898,579,656
MP Lowveld 400kV Strengthening - Phase 3a 413,085,122
MP Lowveld 400kV Strengthening - Phase 3b 859,382,430
MP Malelane 275kV Reinforcement - Phase 2 8,457,433
Lim Tubatse Strengthening Scheme Phase 1. This project falls in the Limpopo Province
900,812,469
Lim Tubatse Strengthening Scheme Phase 2. This project falls in the Limpopo Province
877,026,015
MP Xstrata Phase 2 customer project - Transmission Reinforcement
12,275,153
Please note that the amounts in the tables represent cash flows as a total scheme cost that may fall outside of the Ten-year plan periods.

59 Transmission Ten-Year Plan 2013 – 2022
APPENDIX B2G: COSTING FOR NORTHERN CAPE PROVINCE PROJECTS
APPENDIX B2F: COSTING FOR FREE STATE PROVINCE PROJECTS
Please note that the amounts in the tables represent cash flows as a total scheme cost that may fall outside of the Ten-year plan periods.
Please note that the amounts in the tables represent cash flows as a total scheme cost that may fall outside of the Ten-year plan periods.
Province Project Cost (R) Grand Total
NC Gariep Network Strengthening 35,328,849
9,784,456,801
NC Garona Strengthening 213,052,514
NC Gromis Wind Phase 1 93,445,075
NC Hydra 400 & 132kV equipment upgrade (Fault level requirements)
32,200,000
NC Juno Wind Phase 2 84,012,507
NC Kappa Wind Phase 1 131,833,137
NC Kimberley Strengthening Phase 3 - Hotazel 400kV loop-in (Ferrum-Mookodi(Vryburg) 2nd 400kV
line)
683,295,591
NC Kimberley Strengthening Phase 3C 152,353,545
NC N Cape reinforcement: Aggenuis-Paulputs 2nd 220kV
508,000,000
NC N Cape reinforcement: Aries SVC 417,417,335
NC N Cape reinforcement: Ferrum -Nieuwehoop - Aries 400kV (Aries - Nuwehoop)
730,834,703
NC N Cape reinforcement: Ferrum -Nieuwehoop - Aries 400kV (Ferrum - Nuwehoop)
1,217,320,234
NC Paulputs Ext 2nd 125MVA 220/132kV transformer 74,000,000
NC Sishen-Saldanha Full Solution (Supply for New Spoornet Traction)
1,583,178,235
NC Upington Strengthening Phase 1 3,819,185,077
NC Ferrum 132kV Feeder extention 9,000,000
Province Project Cost (R) Grand Total
FS Bloemfontien Strengthening - Everest - Merapi 275kV (built at 400kV standards)
545,421,176
1,643,929,562
FS Bloemfontien Strengthening - Merapi Ext 3rd 250MVA 275/132kV transformer
75,126,259
FS Bloemfontien Strengthening Phase 2 633,879,863
FS Harrismith Strengthening Phase 1 218,277,073
FS Kimberley Strengthening Phase 3 152,353,545
FS Merapi Wind Phase 1 18,871,647

60© Eskom 2013
APPENDIX B2H: COSTING FOR EASTERN CAPE PROVICE PROJECTS
Please note that the amounts in the tables represent cash flows as a total scheme cost that may fall outside of the Ten-year plan periods.
Province Project Cost (R) Grand Total
EC Delphi 3rd 120MVA 400/132kV transformer 64,100,942
11,944,945,117
EC Delphi Wind Phase 1 13,066,214
EC Delphi Wind Phase 2 - Delphi Ext 1st 400kV SVC 307,065,614
EC Delphi Wind Phase 2 - Delphi Ext 400/132kV substation
86,962,661
EC DME OCGT Integration at Dedisa 400kV 24,432,543
EC Grassridge 132kV equipment upgrade (Fault level requirements)
32,200,000
EC Grassridge-Dedisa Strengthening 117,489,051
EC Greater East London Strengthening - Phase 1 & Phase 2: Eros-Mthatha, Neptune-Mthata & SS
1,550,000,000
EC Greater East London Strengthening - Phase 3 - Pembroke B loop-in and out Poseidon-Neptune 1st
400kV line
366,914,869
EC Greater East London Strengthening - Phase 3 - Poseidon-Neptune 1st 400kV Line
889,522,887
EC Hydra Wind Phase 1 12,738,589
EC PE Phase 3: Poseidon, Delphi, Grassridge and Dedisa Shunt compensation
146,752,920
EC Pembroke Transformer Upgrade 83,279,029
EC Southern Grid - Phase 3 : 1st Gamma Grassridge 765kV Line
4,419,831,881
EC Southern Grid - Phase 4: 2nd Gamma Grassridge 765kV Line
3,779,875,472
EC Southern Grid - Transmission Transformer Normalisation
50,712,446

61 Transmission Ten-Year Plan 2013 – 2022
APPENDIX B2I: COSTING FOR WESTERN CAPE PROVICE PROJECTS
Please note that the amounts in the tables represent cash flows as a total scheme cost that may fall outside of the Ten-year plan periods.
Province Project Cost (R) Grand Total
WC Aurora Wind Phase 1 9,785,980
32,040,088,437
WC Aurora Wind Phase 2 35,671,909
WC Bacchus Wind Phase 1 21,503,516
WC Bacchus Wind Phase 2 38,783,807
WC Blanco Substation Establishment (2x 500MVA 400/132kV TRFR's)
684,109,719
WC Cape Corridor Phase 2: Gamma-Omega 765kV Integration
5,525,000,000
WC Cape Corridor Phase 2: Kappa 765kV Integration 1,077,192,198
WC Cape Corridor Phase 4: 2nd Zeus-Per-Gam-Ome 765kV Line
17,653,048,675
WC Droerivier Wind Phase 1 11,871,184
WC Droerivier Wind Phase 2 79,570,640
WC Droerivier Wind Phase 3 39,511,645
WC Droerivier-Proteus 2nd 400kV line 1,349,445,856
WC Firgrove Substation Establishment (2x 500MVA 400/132kV TRFR's)
432,842,774
WC Gas 1 off-site relocation to Ankerlig 471,000,000
WC Howhoek Substation Establishment (2x 500MVA 400/132kV TRFR's)
498,004,701
WC Juno MTS transformers upgrade project 81,128,422
WC Koeberg 400kV busbar reconfiguration and transformers upgrade project Transformation
upgrade)
128,640,905
WC Koeberg 400kV busbar reconfiguration and transformers upgrade project (Busbar reconfig)
598,544,154
WC Mitchells Plain 400kV Substation 1,439,706,858
WC Muldersvlei Ext 3rd 500MVA 400/132kV transformer & 132kV Series Reactors
117,587,765
WC Nama MTS Transformers Upgrade 31,343,731
WC Nama Wind Phase 1 (Nama Ext 220kV feeder bay (Wind))
18,396,353
WC Nama Wind Phase 1 (Gromis Ext 220kV SVC) 304,894,130
WC Philippi Ext 3rd 500MVA 400/132kV transformer 119,225,968
WC Stikland Ext 3rd 500MVA 400/132kV transformer 119,225,968
WC Vryheid Substation Establishment (2x 250MVA 400/132kV TRFR's) - Vryheid 400kV line loop-in
(Bacchus - Proteus 400kV line)
203,875,273
WC Vryheid Substation Establishment (2x 250MVA 400/132kV TRFR's) - Vryheid 400/132kV Substation
(1st and 2nd 250MVA transformers)
422,391,045
WC Windmill Substation Establishment (2x 500MVA 400/132kV TRFR's) - Windmill 400kV line loop-in
(Bacchus - Muldersvlei 400kV line)
69,216,313
WC Windmill Substation Establishment (2x 500MVA 400/132kV TRFR's) - Windmill 400/132kV Substation
(1st and 2nd 500MVA transformers)
458,568,950

62© Eskom 2013
Although the publication of the document was not undertaken by a formal team, the following people were instrumental in bringing the document to life. Credit is also given to all the Grid Planning staff, who are responsible for formulating the Strategic Grid Plan as well as the Provincial Grid Plans. The formulation of the plan also includes work from the Eskom Group Capital Division, the Eskom Finance Division as well as the Transmission Project Development Department.
Team Members Role
Nishan Rathanlall Compiler 1
Ziyaad Jina Compiler 2
Roy Estment Compiler 3
Camille Shah and Nomfi Nomjana Printing and Communication
Juan La Grange Legal/Regulations
> APPENDIX C: PUBLICATION TEAM

63 Transmission Ten-Year Plan 2013 – 2022
This document will be available via the Eskom website (www.eskom.co.za), but should you have any queries please contact the following people.
Transmission Communication
Camille Shah Tel: + 27 11 800 4742 Email: [email protected] Fax: +27 11 800 2336
Grid Planning
Nishan Rathanlall Tel: + 27 11 800 6879 Email: [email protected] Fax: +27 11 800 2175
> APPENDIX D: CONTACT DETAILS

64© Eskom 2013
> NOTES

65 Transmission Ten-Year Plan 2013 – 2022
> NOTES

66© Eskom 2013
> NOTES

67 Transmission Ten-Year Plan 2013 – 2022
> NOTES

2 Transmission Ten-Year Plan 2013 – 2022 © Eskom 2013
> NOTES

TransmissionTen-YearDevelopmentPlan2013-2022
Eskom Transmission Division
Megawatt Park Maxwell Drive Sunninghill Sandton PO Box 1091 Johannesburg 2000 SA
www.eskom.co.za


![Ten-Year Plan - Reducing the Energy Burden in Oregon ... · Ten-Year Plan - Reducing the Energy Burden in Oregon ... ... x ] } x](https://img.pdfslide.net/doc/110x75/601b574aa7320e3abd4bfc1b/ten-year-plan-reducing-the-energy-burden-in-oregon-ten-year-plan-reducing.jpg)