Embed Size (px)
Citation preview

Policy Research Working Paper 7132
Transparent Government and Business Regulation
“Open for Business?”
Carolin Geginat Valentina Saltane
Development Economics Global Indicators GroupDecember 2014
WPS7132P
ublic
Dis
clos
ure
Aut
horiz
edP
ublic
Dis
clos
ure
Aut
horiz
edP
ublic
Dis
clos
ure
Aut
horiz
edP
ublic
Dis
clos
ure
Aut
horiz
edP
ublic
Dis
clos
ure
Aut
horiz
edP
ublic
Dis
clos
ure
Aut
horiz
edP
ublic
Dis
clos
ure
Aut
horiz
edP
ublic
Dis
clos
ure
Aut
horiz
ed

Produced by the Research Support Team
Abstract
The Policy Research Working Paper Series disseminates the findings of work in progress to encourage the exchange of ideas about development issues. An objective of the series is to get the findings out quickly, even if the presentations are less than fully polished. The papers carry the names of the authors and should be cited accordingly. The findings, interpretations, and conclusions expressed in this paper are entirely those of the authors. They do not necessarily represent the views of the International Bank for Reconstruction and Development/World Bank and its affiliated organizations, or those of the Executive Directors of the World Bank or the governments they represent.
Policy Research Working Paper 7132
This paper is a product of the Global Indicators Group, Development Economics. It is part of a larger effort by the World Bank to provide open access to its research and make a contribution to development policy discussions around the world. Policy Research Working Papers are also posted on the Web at http://econ.worldbank.org. The authors may be contacted at [email protected] and [email protected].
This paper presents new indicators for 185 economies mea-suring the accessibility of business regulatory information. The paper shows that the new data can serve as meaningful proxies for the overall transparency of governments and the new data have explanatory power for the quality of business regulation. The paper finds the regulatory environment to be most opaque in Sub-Saharan Africa and the Middle East and North Africa, where businesses can often only access basic regulatory information by meeting a govern-ment official. By contrast, in countries in the Organisation for Economic Co-operation and Development and Eastern Europe and Central Asia, access is more direct via websites,
public billboards, and brochures. Moreover, Organisation for Economic Co-operation and Development economies are more consistent in their transparency efforts across government agencies. The paper also finds that while resources as proxied by income levels play some role in explaining why some economies make more information easily accessible than others, those resources are not the only determining factor; regardless of income, more democratic governments tend to make greater transparency efforts. Finally, easier access to basic regulatory information is asso-ciated with greater regulatory quality and less corruption.

Transparent Government and Business Regulation: “Open for Business?”
Carolin Geginat and Valentina Saltane 1
JEL: O Economic Development, Technological Change, and Growth
Keywords: Transparency, Governance, Access to Information, Regulatory Transparency Index
1 2121 Pennsylvania Avenue NW, Washington, DC 20433, [email protected] and [email protected]. This paper would not have been possible without the extensive research of the team who collects the annual Doing Business data at the World Bank Group and the 9,600 private contributors who answered to the surveys of the Doing Business Project in 2012. We would like to thank Sarmad Shaikh for his excellent research assistance. The full data set for each country can be found at www.doingbusiness.org. We would also like to thank -- without implication – Adrian Gonzalez, Aart Kraay, Alejandro Ponce, Rita Ramalho, Sylvia Solf and Hulya Ulku for helpful discussions in the preparation of this paper. The authors thank the United States Agency for International Development for its financing contribution to the data collection efforts.

I. Introduction Access to information can empower citizens to monitor the quality of government services and the use of public resources. Because government markets are usually monopolistic, the consumers of public services have no “exit” option — they cannot “vote with their feet” by going to a competitor for better services. Access to information is therefore critical if citizens are to exercise their “voice” in demanding greater accountability from public servants (Hirschman (1970), Paul (1992)). A growing body of literature attests to the important role that information can play in improving the delivery and quality of services provided by governments in areas such as public health, sanitation and education (World Bank (2004), Reinikka and Svensson (2005), Deininger and Mpuga (2005), Besley and Burgess (2002)). For example, the government of Uganda demonstrated this by having newspapers publish data on monthly transfers of school grants to local governments. By improving the ability of schools and parents to monitor how local officials handled the grants, the program reduced the share of grant funding lost to corruption from 80% to 20% (Reinikka and Svensson (2005)). With more information, people can better evaluate different options and manage risks more effectively (Ackerlof (1970), Stiglitz and Weiss (1981), Hirshleifer (1980), Stigler (1971), Posner (1981)). Little attention has been paid so far to the role of information for those branches of government that are in charge of business regulatory requirements. This gap needs to be closed because there is compelling evidence that badly implemented business regulations affect firm creation and productivity negatively. Entry rates of new businesses and business density are lower and more businesses stay in the informal sector, where rules and requirements are cumbersome (Dabla-Norris et al. (2008), Klapper et al. (2006), Antunes and Calvacanti (2009)). Excessive regulation also goes hand in hand with lower firm productivity (Barseghyan (2008)), Alesina and others (2005), Fisman and Sarria-Allende (2004), Klapper and Richmond (2009)). The World Bank Enterprise Surveys suggest that there is much room for improvement in service quality and accountability in business regulation. The companies surveyed report that in a typical week their senior managers spend on average 11% of their time dealing with government regulations. More than 50% of them disagree with the notion that regulations are implemented consistently and predictably. And what is worse, companies often have to pay a bribe to get things done. Worldwide, 19% of firms report having had to pay bribes in connection with their application for an operating license or electricity connection. To shed light on the role that information can play in improving the quality of business regulation, we present and analyze a unique new data set that captures the information practices of public agencies in charge of business regulation. Specifically, the new data capture in which of the sampled 185 economies fee schedules for procedures such as company or property registration, building permitting and electricity connections could be accessed by businesses
2

without meeting with a public official in the period from July 2011 to June 2012. The new data could be particularly valuable for development practitioners because they capture not only transparency efforts made through online solutions, but also other, less capital intensive ways of making information available, for instance, by means of brochures and billboards. This approach allows us to include many developing economies in the sample, which do not necessarily have the resources to invest in capital- and resource-intensive E-Government solutions. The paper is structured as follows: first, we present descriptive statistics on how the practice of making fee schedules available varies across different government agencies, regions and income groups. We find that meeting an official is still the most common means of acquiring regulatory information in Sub-Saharan Africa and the Middle East and North Africa. And, while richer countries generally tend to make more information available through websites and other information material, there are also some poor countries that achieve transparency levels comparable to those of richer countries in the sample. Of the four different regulatory agencies considered in this paper, company registries are by far the most transparent, a result that may be related to the significant number of reforms that have taken place in this particular area of business regulation in the past ten years.2
Second, we examine commonalities among those economies that are more transparent in their business regulatory practices other than that they tend to be richer. Like other authors before us, we find that greater access to information is associated with greater control of corruption and better overall governance. We also find that countries that make it easy to access information tend to be more democratic.
Third, using various data sets on the quality and efficiency of regulatory systems, we find that easier access to information is associated with greater regulatory quality and efficiency.
The next section of the paper describes the data methodology. Section III presents descriptive statistics of the data by region and income groups. Section IV includes the main analysis and Section V concludes the findings. II. Methodology The new indicators presented here have been collected in the context of the annual data update of the Doing Business indicators published jointly by the World Bank Group (WBG) and the International Finance Corporation (IFC).3 The Doing Business indicators of the WBG/IFC have been tracking business regulatory requirements and practices since 2003. In its current format, the Doing Business data set comprises 11 indicators that measure the regulations affecting domestic small and medium-size enterprises in the largest business city of 185 economies. The
2 In its 10-year addition of the Doing Business Report (Doing Business 2013) the authors of the report show that a total of 368 reforms were undertaken in 149 economies in the area of business startup since 2005. 3 www.doingbusiness.org
3

11 indicators provide quantitative measures of regulations for starting a business, dealing with construction permits, getting electricity, registering property, employing workers, getting credit, protecting investors, paying taxes, trading across borders, enforcing contracts and resolving insolvency. The Doing Business data are collected through annual surveys that are administered to more than 9,000 experts in 185 economies. Expert respondents are lawyers, architects, government officials or other professionals who deal directly with business regulatory processes for their clients on a daily basis.4 The questionnaires that these experts receive are all based on a standardized case study that ensures the comparability of data across economies.5 With this paper we are proposing new data that complement the existing Doing Business indicators. The new data were collected between January and June 2012 by adding questions to the questionnaires for 4 of the 11 indicators: starting a business, dealing with construction permits, getting electricity and registering property. Respondents were asked to assess the ease with which information on incorporation fees, building permit fees, electricity connection tariffs and property registration fees can be accessed in their country. 6 The four regulatory areas were selected because of the monopolistic positions of the government agencies involved. The clients of company and property registries, building departments and distribution utilities cannot “vote with their feet,” when they are provided with poor service as there is no competitor to turn to. Hence, they are left with only one option, which is to exercise their “voice.” Our hypothesis is that the “voice” option can be exercised more effectively, if clients can point to easily accessible information on binding regulatory standards. We are especially interested in the accessibility of fee schedules because fees are usually set and disseminated by implementing agencies and are not part of a national legislation. Accessibility of this type of regulatory information therefore speaks directly to the openness and transparency efforts of specific government agencies. In the questionnaires for all four regulatory areas, respondents had to choose between the following options:
4 Doing Business samples experts rather than firms for two main reasons. The first pertains to the frequency with which firms engage in the transactions captured in the indicators, which is generally low. For instance, a firm goes through the process of starting a business once in its existence while an incorporation lawyer may do several dozen such transactions in a year. Therefore, the experts providing information to Doing Business are better suited for assessing the process of starting a business than individual firms. Second, most of the information gathered through the Doing Business questionnaires is of a legal nature which firms are unlikely to be fully familiar with. For instance, very few firms will know about all the many legal procedures involved in resolving a commercial dispute through the courts, even if they may actually have gone through the process themselves. In contrast, a litigation lawyer would have no difficulty accurately identifying all the necessary steps. 5 For more details on the Doing Business methodology please refer to http://www.doingbusiness.org/methodology. 6 The data including the relevant websites is published at http://www.doingbusiness.org/data/transparency.
4

i) Information on fee schedules is only accessible by meeting with a public official, ii) Information on fee schedules can be accessed via the website of the relevant or a related agency and iii) Information is available through a public notice or through brochures that can be easily consulted or picked up without prior appointment at the relevant agency. The last option was specifically added to capture the transparency efforts made by agencies that might not be able to rely on online solutions for connectivity or capital reasons as is the case in many developing economies. The answers to these questions were scored as follows: in cases where a majority of respondents chose option ii) or iii) in their response, a value of one was assigned, indicating that information is accessible without the need for an appointment with a government official. In addition, where respondents reported that the information could be obtained online, a fact check of the website was undertaken by the team. On the other hand, if more than half of the respondents chose option i) and an Internet search brought up no website, a value of zero was assigned, indicating that the particular type of regulatory information can only be accessed by meeting with an official. Table 1a in Annex 1 provides detailed descriptions of all four new variables as well as the scoring methodology applied. III. Description of the Data Tables 5, 6 and 7 summarize the information that we have collected for the four new variables from 185 economies. The sample includes 50 high income, 49 upper-middle income, 53 lower-middle income, and 33 low-income economies. Following the World Bank regional classifications, the data cover 46 of the economies in Sub-Saharan Africa, 18 in the Middle East and North Africa region, 24 in East Asia and the Pacific, 8 in South Asia, 33 in Latin America and the Caribbean, 26 in Europe and Central Asia and 30 in OECD high income economies.7
According to the data, worldwide company registries are the public agencies that are most likely to make information easily accessible without the need for meeting a government official. Table 5a presents results by region and income revealing that businesses can access fee schedules for incorporating a new company via a website or through brochures or billboards available at company registries in 79% of all economies in the selected sample. Company registries are least transparent in Sub-Saharan Africa where only 47% of economies make incorporation fees available through brochures and 41% also publish the fees on the web. By contrast, in more than 90% of OECD high-income economies incorporation fees can be accessed electronically.
The greater relative transparency of company registries can most likely be explained by the great number of reforms that have happened around the world in this particular area of business
7 The regional classification is of June 2013.
5

regulation. Because of the promises that easy start up procedures hold for boosting job creating entrepreneurship many governments around the world have dedicated resources and political capital in the last decade to upgrading their incorporation services. Out of a total of 2,000 business regulatory reforms that were recorded by the Doing Business reports in the past 10 years in 10 business regulatory areas, 58% of all reforms were undertaken in the area of streamlining company registration procedures alone. Consequently, business incorporation is also the area that has seen the greatest convergence to international best practice in the past 10 years (World Bank, 2012).
Access to information on property transfer fees ranks second after incorporation fees in terms of global ease of access, with 64% of all economies in the sample making property transfer fees available via the web, billboards or brochures. But accessibility to information in this particular regulatory area differs greatly across regions. For example, 90% of economies in the OECD high income and Eastern Europe and Central Asia make such information publicly available compared to only 38% of countries in the Middle East and North Africa. Building permitting fees is clearly the category of regulatory information that businesses find most difficult to access, with only 52% of economies in the sample providing such information without the need to make an appointment with an official in the local building department. Easy access to information on electricity connection tariffs is slightly more widespread worldwide with 55% of economies providing access to such information via websites or other materials. However, in some regions, such as Latin America and the Caribbean, South Asia and the Middle East and North Africa, it is easier to obtain information on building permitting fees than on electricity tariffs.
The cross-correlation matrix in Table 6a reveals another important insight. All four cost variables (cost to start a business (as % of GNI per capita), obtain a construction permit (as % of GNI per capita), obtain an electricity connection (as % of GNI per capita) and register property (as % of GNI per capita)) are negatively correlated with the GNI per capita variable; a result that might be explained by the significant fixed costs associated with setting up administrative processes and the relatively lower number of users of these services in poorer countries.
Finally, we proceed to construct an aggregate index that is a simple average of the scores received for a particular country on all four new variables. We refer to the new index as the Regulatory Transparency Index (RTI) and interpret it as a measure of the consistency of governments’ efforts at making business regulatory costs transparent. Before aggregating our four variables, we examine how they are correlated with each other to determine whether the new index might suffer from multicollinearity. We find the four new variables to be positively correlated with each other, but not perfectly. The cross-correlation matrix presented in Table 6a shows that the coefficients for the three variables range between 0.05 and 0.83.
Table 2a in the Annex presents our data on the aggregate index for economies from the highest to the lowest levels of accessibility and availability of business regulatory fee information on country level. Forty-eight economies in the sample make fee schedules in all four regulatory
6

areas easily accessible and receive the highest RTI value of one. Among the 185 economies for which we have data on all four indicators, 35 economies (representing approximately 18% of our data set) allow convenient access to information within all four areas of business regulation. On the other hand, there are 13 economies where not one fee schedule is can be accessed without meeting an official. These 13 economies receive the lowest aggregate RTI value of zero.
After constructing the aggregate RTI, we submit our new variables to a robustness test by examining how the four new indicators and the RTI behave in relation to other transparency and governance measures. The external transparency indicators used in our analysis include the Voice and Accountability index (Kauffman et al., 2010), the Open Budget index (International Budget Partnership, 2010), the Transparent Policy Making index (Word Economic Forum, 2011), the E-Government Development index and the Open Government index (World Justice Project, 2010) (see also Table 1a in Annex 1 for a detailed description of the variables).
The results in Table 6a show that our four new indicators and alternative benchmarks of transparency and information accessibility are moderately correlated and with the right sign. However, the cross correlations for our new indicators with established indicators are less pronounced than correlations across those established transparency variables. For example, correlation coefficients between the GNI per capita variable and E-Government Development index and the Open Government index are greater than 73% compared to correlations coefficients below 30% for our new variables and GNI per capita.8
IV. Data Analysis
IV. 1. How does regulatory transparency compare across the world?
In this section we provide analysis for the RTI across regions and income groups. The regional distribution for our new index presented in Figure 1 below shows that government efforts to provide easy and transparent access to information to citizens are least consistent in Sub-Saharan Africa and the Middle East and North Africa. In both cases a regional RTI score of less than 0.5 suggests that the average country in the region makes no more than 1 out of 4 fee schedules easy to access. In Sub-Saharan Africa, only four out of 46 economies (Burkina Faso, Mauritius, South Africa and Tanzania) provide accessibility in all four regulatory areas captured by our new data.
8 The correlation for all variables is positive except for the correlation with the transparency in policy making variable. The association here is negative as countries are ranked inversely to other variables, with 1 rather than 0 being the best performance on the transparency in policymaking variable.
7

Figure 1: Regulatory Transparency Index (RTI) by Region
Source: Doing Business 2013 surveys
The relatively rich Middle East and North Africa (MENA) region (the average country in the region has a GNI per capita of over 13,000 USD) is the most opaque region in terms of providing access to regulatory information. None of the economies in the region scores positively on all four fee accessibility indicators. This finding is consistent with the findings of other studies that have highlighted lack of transparency as one of the biggest constraints to private sector growth in the region (Williams (2009), World Bank (2009)). For example, Rocha et al. (2011) show that lack of corporate information and poor credit information systems are among the main reasons why small and medium-size firms receive little lending in the region.
Aside from interregional variation, accessibility to regulatory information also varies positively and significantly by income groups (Figure 2 below): low-income economies have the worst degree of regulatory transparency while high income economies score the best.
Figure 2: Regulatory Transparency Index (RTI) by Income Group
Source: Doing Business 2013 surveys
0.63
0.47 0.46
0.630.59
0.65
0.770.88
0.00 0.00 0.000.25
0
0.25
0.25
0.50
1.00 1.00 1.00 1.00 1.00 1.00 1.00 1.00
0.0
0.2
0.4
0.6
0.8
1.0
Entire Sample Sub-SaharanAfrica
Middle East &North Africa
South Asia Latin America &Caribbean
East Asia &Pacific
Europe &Central Asia
High income:OECD
Aver
age
Aggr
egat
e In
dex
Mean Minimum Maximum
0.62 0.50
0.56 0.62
0.79
0.00 0.00 0.00 0.00 0.00
1.00
0.75
1.00 1.00 1.00
0.0
0.2
0.4
0.6
0.8
1.0
Entire Sample Low Income Lower middleincome
Upper middleincome
High income
Aver
age
Aggr
egat
e In
dex
Mean Minimum Maximum
8

It seems little surprising that we find our RTI not only to be highly correlated with income per capita but also with Internet penetration rates (Figure 3). Richer economies have more resources to spend allowing them to invest in costly online solutions or other information material to make information more accessible to citizens. Online solutions also depend greatly on the degree of connectivity in an economy, which is strongly correlated with income per capita. Bridging the digital divide is costly and poorer countries are, hence, at a disadvantage when they want to engage more actively with citizens via the Internet. However, Figure 3 also illustrates that poorer countries make relatively greater efforts to invest in non-online solutions. In low-income countries, 50% of the fee schedules that can easily accessed cannot be found online but come in the form of brochures and similar material.
Figure 3: Accessibility of regulatory information varies with income level and Internet penetration
Note: The relationship between the RTI and internet connectivity is significant at the 5% level after controlling for income per capita. Source: Doing Business database; World Bank, World Development Indicators database (2008 data). Despite the clear income trend in our data, there is also some noticeable variation within income groups, suggesting resources and internet connectivity seem to explain only some of the variation in how easily information can be accessed. Table 1 below highlights how economies with similar income levels and internet penetration rates show varying degrees of information accessibility: The three high income, high Internet penetration economies Greece, Portugal and Bahrain show as much variability in how much information is made accessible as the three low income, low Internet penetration economies: namely Sierra Leone, Niger and Tanzania. Both Mozambique and Tanzania with an income per capita of roughly 500 USD manage to make as much information easily accessible as Greece and Portugal, which are two economies with an income per capita nearly 70 times higher.
0
10
20
30
40
50
60
0
0.1
0.2
0.3
0.4
0.5
0.6
0.7
0.8
0.9
Low income Lower middle income Upper middle income High income
Website Brochures
Regulatory Transparency index
High
Low
Internet users (% of population)
9
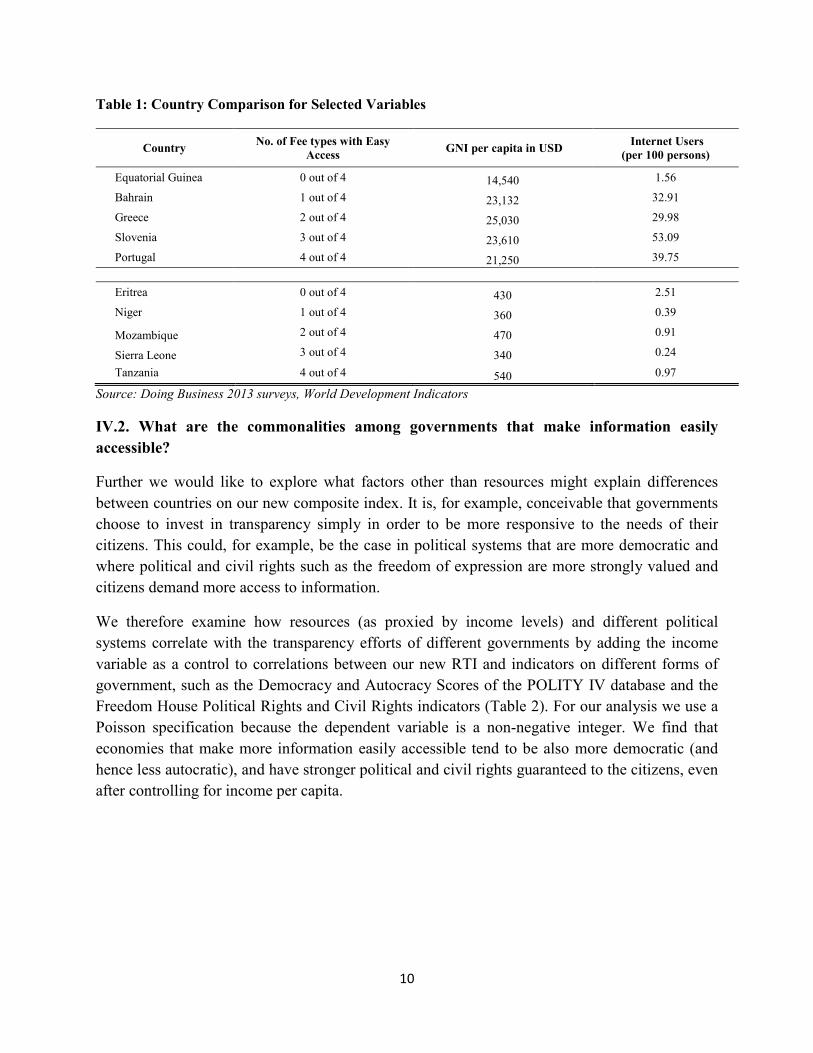
Table 1: Country Comparison for Selected Variables
Country No. of Fee types with Easy Access GNI per capita in USD Internet Users
(per 100 persons)
Equatorial Guinea 0 out of 4 14,540 1.56
Bahrain 1 out of 4 23,132 32.91
Greece 2 out of 4 25,030 29.98
Slovenia 3 out of 4 23,610 53.09
Portugal 4 out of 4 21,250 39.75 Eritrea 0 out of 4 430 2.51
Niger 1 out of 4 360 0.39
Mozambique 2 out of 4 470 0.91
Sierra Leone 3 out of 4 340 0.24
Tanzania 4 out of 4 540 0.97
Source: Doing Business 2013 surveys, World Development Indicators
IV.2. What are the commonalities among governments that make information easily accessible?
Further we would like to explore what factors other than resources might explain differences between countries on our new composite index. It is, for example, conceivable that governments choose to invest in transparency simply in order to be more responsive to the needs of their citizens. This could, for example, be the case in political systems that are more democratic and where political and civil rights such as the freedom of expression are more strongly valued and citizens demand more access to information.
We therefore examine how resources (as proxied by income levels) and different political systems correlate with the transparency efforts of different governments by adding the income variable as a control to correlations between our new RTI and indicators on different forms of government, such as the Democracy and Autocracy Scores of the POLITY IV database and the Freedom House Political Rights and Civil Rights indicators (Table 2). For our analysis we use a Poisson specification because the dependent variable is a non-negative integer. We find that economies that make more information easily accessible tend to be also more democratic (and hence less autocratic), and have stronger political and civil rights guaranteed to the citizens, even after controlling for income per capita.
10

Table 2: Regulatory Transparency Index (RTI) and External Variables (Poisson method)
We also correlate our new index with the Control of Corruption indicator of the Worldwide Governance Indicators (Kaufman et al. (2010)) and find that our new index is positively correlated with the Control of Corruption variable. However, we also find that our income control variable loses its statistical significance suggesting that the Control of Corruption variable might simply be mirroring an overall income effect. Our findings are consistent with those of other authors who have presented evidence that more access to information is associated with greater control of corruption and better overall governance. For example, Islam (2006) finds that governments that are timelier in the release of important political and macroeconomic data are also governments that rank better on various measures of good governance. Djankov et al. (2009) find that corruption is lower in countries where politicians face more stringent disclosure requirements of their assets and business interests. And, Williams (2009) by means of granger-causality regressions shows that the release of information by governments has a positive short-term effect on the quality of bureaucracy. IV. 3. Is greater access to regulatory information associated with better regulation?
After investigating which factors make it more likely that regulatory information is easily accessible we also would like to know if more access to regulatory information goes hand in hand with greater regulatory quality. We would expect that greater regulatory quality is associated with greater accessibility of regulatory information. Our hypothesis is that where information is easily accessible it should also be easier for citizens to demand better regulatory
y-variable: Regulatory Transparency Index (RTI) (0-1)VARIABLES (I) (I I) (I I I) (IV) (V) (VI) (XII)Democracy (Pol i ty IV) (0-10) 0.060***
[0.015]Autocracy (Pol i ty IV) (0-10) -0.059***
[0.023]Pol i ty (Pol i ty IV) (0-10) 0.033***
[0.010]Freedom house pol i ti ca l rights index (1-7) -0.103***
[0.025]Freedom house civi l rights index (1-7) -0.133***
[0.030]Control of corruption (0-100) 0.254***
[0.066]Internet Usage 0.013***
[0.002]GNI pc 0.001*** 0.001*** 0.001*** 0.001*** 0.001*** 0 0
[0.000] [0.000] [0.000] [0.000] [0.000] [0.000] [0.000]
Constant 0.044 0.470*** 0.245*** 0.740*** 0.832*** 0.488*** 0.205***[0.111] [0.067] [0.078] [0.097] [0.111] [0.060] [0.070]
Observations 126 126 126 149 149 149 148Robust s tandard errors in brackets*** p<0.01, ** p<0.05, * p<0.1
11

quality. This in turn could lead to improvements in the quality of regulatory services. However, it is also possible that greater regulatory quality leads to greater regulatory transparency because better regulations can only be achieved by clarifying the rules.
We correlate the new indicators and the RTI, with both: a) a measure of business regulatory quality and efficiency (as measured by the Ease of Doing Business Ranking) (Tables 9 a and b) and b) another measure of general regulatory quality (the Regulatory Quality Variable of the Worldwide Governance Indicators by Kaufmann and Kraay, 2010) (Tables 10 a and b).
We run each regression with and without the log of per capita GNI to make sure that we are not picking up the general effects of good governance associated with higher income. We find that greater access to regulatory information is associated with a better ranking on the Ease of Doing Business (both for the individual information accessibility indicators and the aggregate RTI) (Table 7). As a robustness test we run a number of regressions on our new data that also control for other external variables of government openness and transparency (Table 7). We exclude the Open Government Index from this analysis because of the small number of observations available for this indicator.
The results suggest that most of the transparency indicators in the analysis complement rather than substitute each other. The three variables that have the greatest predictive power for the Ease of Doing Business Ranking and whose predictive power is most robust to the inclusion of other control variables are the Transparent Policy Making Ranking, the E-Government Development Index and our new Regulatory Transparency Index. The income variable loses its statistical significance when the E-Government Index is included as a control, which is not surprising given the high correlation between this variable and the GNI per capita as presented in table 6a. The Voice and Accountability Index has no predictive power for the Ease of Doing Business in our specifications.
We repeat the same analysis using the Regulatory Quality Index of the Worldwide Governance Indicators as dependent variable and find results that are very similar to those using the Ease of Doing Business ranking as dependent variable (Table 7a) with the exception that the sign of the correlations is reversed because the Regulatory Quality Index is inversely scaled to the Ease of Doing Business.9 Similar to the analysis of the Ease of Doing Business, the results are robust to the inclusion of other proxies of transparency and information availability (Table 8a). Also, in this set of regressions the Voice and Accountability Index has predictive power for the Regulatory Quality index. Where the Voice and Accountability Index is included the Open Budget Index has no significant predictive power.
9 Lower ratings indicate a better performance on the Ease of Doing Business but a worse performance on the Regulatory Quality Index.
12

V. Conclusion
An analysis of the information practices of 185 economies shows that countries that fare well on a wide range of transparency and governance measures are also countries where firms do not have to contact an official to obtain basic regulatory information such as fee schedules. Instead, such information can be found either online or on billboards or through brochures that are readily available at the relevant agencies. While differences in income can explain in part why some countries make information easily accessible and others do not, the political system of each country also seems to play a role. Greater access to information is associated with more democracy and less corruption. Finally, the data also show that business regulation tends to be of greater quality in those countries where regulatory information can be easily accessed. The correlations presented here cannot answer the question whether greater access to information leads to better governance or whether better governance leads to greater access to information. They do, however, make the case that transparency and good governance tend to come together. The paper also shows that improving transparency does not always have to be resource-intensive and technology based. Sometimes printing a simple brochure can be enough.
13

VI. Annex 1: Tables
Table 1a: Description of indicators and variables used
Variable Source Sample Description/Methodology
Accessibility of information on company incorporation fees
Doing Business 2013 data, the World Bank Group
185 economies
Fee schedules are considered "easily accessible" if information related to the incorporation of a new company can be obtained either via the website of the company registry, or through public notices (notice boards and brochures) available at the registry or another related agency, without the need to schedule appointments with officials. Incorporation fee schedules are considered "not easily accessible" if they can only be obtained by meeting with an official. Economies where information is "accessible" are assigned the value of "1", economies where information is "not easily accessible" are assigned the value of "0".
Accessibility of information on electricity connection tariffs
Doing Business 2013 data, the World Bank Group
185 economies
Electricity connection (not consumption) tariffs are considered "easily accessible" if tariff details can be obtained either via the website of the distribution utility or the electricity regulator, or through laws, regulations and public notices, without the need for appointments with officials/utility employees. Connection tariff schedules are considered "not easily accessible" if they can only be obtained by meeting with an official. Economies where information is "accessible" are assigned the value of "1", economies where information is "not easily accessible" are assigned the value of "0".
Accessibility of information on building permitting fees
Doing Business 2013 data, the World Bank Group
185 economies
The fees associated with obtaining a building permit are considered "easily accessible" if they can be obtained either via the website of the building department or another relevant agency, or are available through public notices, without the need to schedule appointments with officials. Building permitting fee schedules are considered "not easily accessible" if they can only be obtained by appointment with officials. Economies where fee information is "accessible" are assigned the value of "1", economies where fee information is "not easily accessible" are assigned the value of "0".
Accessibility of information on registering property fees
Doing Business 2013 data, the World Bank Group
185 economies
Fee schedules are considered "easily accessible" if they can be obtained through the website of the relevant agency or through public notices (e.g., brochures, notice boards) available at the agency or a related one, without a need to meet with an official. They are considered not easily accessible if they can only be obtained by meeting with an official. Economies where information is easily accessible are assigned a score of 1; those where information is not easily accessible are assigned a score of 0.
Regulatory Transparency Index
Doing Business 2013 data, the World Bank Group
185 economies
This is the aggregate measure of access to basic regulatory information such as information on the fees required to register a new company, obtain a building permit, register property or connect a business to electricity in the main business capital city of a country. Based on the 4 variables above, we construct an aggregate index for a restricted sample of 185 economies for which the data is available for all the 4 variables. The index serves as a representation of a measure of how consistent governments are in their transparency efforts across different agencies and branches of government. The index is computed as a simple average of the variables.
Doing Business rank
Doing Business 2013 data, the World Bank Group
185 economies
The overall rank of the ease of doing business in economies world-wide. The ease of Doing Business indicator provides quantitative measures of regulations for starting a business, dealing with construction permits, getting electricity, registering property, getting credit, protecting investors, paying taxes, trading across borders, enforcing contracts and resolving insolvency. The ease of doing business index ranks economies from 1 to 185, with 1
14

indicating the best performance. For each economy the ranking is calculated as the simple average of the percentile rankings on each of the 10 topics included in the index.
Regulatory quality
Worldwide Governance Indicators, Kaufmann et al, 2010
213 economies
This variable captures perceptions of the ability of the government to formulate and implement sound policies and regulations that permit and promote private sector development. The aggregate indicators are reported in two ways: (1) in their standard normal units, ranging from approximately -2.5 to 2.5, and (2) in percentile rank terms from 0 to 100, with higher values corresponding to better outcomes.
Voice and accountability
Worldwide Governance Indicators, Kaufmann et al, 2010
213 economies
This variable captures perceptions of the extent to which a country's citizens are able to participate in selecting their government, as well as freedom of expression, freedom of association, and a free media. The aggregate indicators are reported in two ways: (1) in their standard normal units, ranging from approximately -2.5 to 2.5, and (2) in percentile rank terms from 0 to 100, with higher values corresponding to better outcomes.
Open budget index
Open Budget Survey 2010, International Budget Partnership
94 economies
The Open Budget Index assigns countries covered by the Survey a transparency score on a 100-point scale (with 100 being the best possible score) using 95 questions from the 125 questions on the Survey.
Transparent policy making
World Economic Forum
123 economies
This variable measures how easy is for the businesses to obtain information regarding changes in government policies and regulations. The values range from "1" to "7", where the lowest value means that having access to the information is impossible, and the highest value means that it is extremely easy.
E-Government Development Index
UN E-Government Survey 2012
93 UN member states
The United Nations E-Government development index is a composite indicator measuring the willingness and capacity of national administrations to use information and communication technology to deliver public services. The index is a weighted average of three normalized scores on 3 dimensions of E-Government: (i) scope and quality of online services, (ii) development status of telecommunication infrastructure, and (iii) inherent human capital. The composite value of each component index is normalized to fall between 0 (the worst score) and 1 (the best score). And the overall index is the arithmetic average of the three component indexes.
Open Government (WJP)
World Justice Project - Rule of Law Index (Factor 5 - Open Government)
65 countries and 1 additional jurisdiction
Open Government includes at its core the opportunity to know what the law is and what conduct is permitted and prohibited. Questionnaires are administered to more than 300 potential local experts per country through leading local polling companies. The Open Government index consists of 36 variables combined to form the following six sub-factors:
1 The laws are comprehensible to the public
2 The laws are publicized and widely accessible
3 The laws are stable 4 The right to petition the government and public participation is effectively guaranteed 5 Official drafts of laws and regulations are available to the public
6 Official information is available on request Open Government score is an average of these sub-factors. All scores range between 0 and 1, where 1 signifies a higher adherence to the rule of law.
Democracy (Polity IV)
Integrated Network for Societal Conflict Research (INSCR) - Center for Systemic Peace
164 countries
The Democracy indicator is an additive eleven-point scale (0-10), with the higher score implying a more democratic regime. The operational indicator of democracy is derived from coding of the competitiveness of political participation variables, the openness and competitiveness of executive recruitment variables, and
15

constraints on the chief executive variables using specific weights.
Autocracy (Polity IV)
Integrated Network for Societal Conflict Research (INSCR) - Center for Systemic Peace
164 countries
The Autocracy indicator is an additive eleven-point scale (0-10), with the higher score implying a more autocratic regime. The operational indicator of autocracy is derived from coding of the competitiveness of political participation variables, the regulation of participation variables, the openness and competitiveness of executive recruitment variables, and constraints on the chief executive variables using specific weights.
Polity (Polity IV)
Integrated Network for Societal Conflict Research (INSCR) - Center for Systemic Peace
164 countries
The POLITY variable provides a convenient avenue for examining general regime effects in analyses. The POLITY score is computed by subtracting the Autocracy score from the Democracy score; the resulting unified polity scale ranges from +10 (strongly democratic) to 10 (strongly autocratic).
Freedom house political rights index
Freedom House - Freedom in the World 2012
195 countries and 14 related and disputed territories
Political rights ratings are based on an evaluation of three subcategories: electoral process, political pluralism and participation, and functioning of government.
Freedom house civil rights index
Freedom House - Freedom in the World 2012
195 countries and 14 related and disputed territories
Civil liberties ratings are based on an evaluation of four subcategories: freedom of expression and belief, associational and organizational rights, rule of law, and personal autonomy and individual rights. Each country is assigned a numerical rating from 1 to 7 for both political rights and civil liberties, with 1 representing the most free and 7 the least free. The average of the political rights and civil liberties ratings, known as the freedom rating, determines the overall status. House also assigns upward or downward trend arrows to countries which saw general positive or negative trends during the year that were not significant enough to result in a ratings change.
Control of corruption
Worldwide Governance Indicators- Control of Corruption (CC)
213 countries
The CC indicator captures perceptions of the extent to which public power is exercised for private gain, including both petty and grand forms of corruption, as well as "capture" of the state by elites and private interests. The CC indicator is forms part of the Worldwide Governance Indicators, which draw on data from 31 different sources that provide information on various aspects of governance. The aggregate indicators combine the views of a large number of enterprise, citizen and expert survey respondents in industrial and developing countries. The individual data sources underlying the aggregate indicators are drawn from a diverse variety of survey institutes, think tanks, non-governmental organizations, and international organizations. The aggregate indicators are reported in two ways: (1) in their standard normal units, ranging from approximately -2.5 to 2.5, and (2) in percentile rank terms from 0 to 100, with higher values corresponding to better outcomes.
Internet Usage World Development Indicators
142 countries Internet users per 100 people
16

Table 2a: Economies by score on the Regulatory Transparency Index (RTI)
1.00 (Highest) 0.66 0.33 0.00 (Lowest) Australia Afghanistan Antigua and Barbuda Angola
Austria Albania Armenia Bolivia
Belgium Argentina Bahamas, The Cameroon
Bulgaria Bahrain Bangladesh Chad
Canada Brunei Darussalam Belarus Congo, Dem. Rep.
Cape Verde Burkina Faso Belize Congo, Rep.
Croatia Colombia Benin Djibouti
Cyprus Côte d'Ivoire Bosnia and Herzegovina
Dominican Republic
Denmark Czech Republic Botswana Equatorial Guinea
Estonia Dominica Burundi Haiti
Finland Ecuador Central African Republic
Lesotho
France El Salvador China Micronesia, Fed. Sts.
Georgia Fiji Comoros Sierra Leone
Germany Guinea-Bissau Costa Rica
Hong Kong SAR, China
Indonesia Egypt, Arab Rep.
Hungary Jordan Eritrea
Iceland Kazakhstan Gabon
Ireland Lao PDR Gambia, The
Israel Latvia Greece
Italy Lebanon Grenada
Japan Madagascar Guatemala
Korea, Rep. Mongolia Guinea
Lithuania New Zealand Guyana
Luxembourg Nigeria Honduras
Marshall Islands Papua New Guinea India
Mauritius Peru Jamaica
Mexico Poland Kenya
Morocco Puerto Rico Kuwait
Netherlands Russian Federation Liberia
Norway São Tomé and Principe
Macedonia, FYR
Pakistan Saudi Arabia Malawi
Portugal South Africa Mali
Romania Tanzania Mauritania
Serbia Trinidad and Tobago Mozambique
Singapore Vietnam Namibia
Slovak Republic Nicaragua
Slovenia Niger
17

Spain Oman
St. Vincent and the Grenadines
Philippines
Sweden Rwanda
Switzerland Senegal
Taiwan, China Seychelles
Thailand Solomon Islands
Turkey St. Kitts and Nevis
United Kingdom St. Lucia
United States Sudan
Uruguay Tonga
Zambia Tunisia
Uganda
United Arab Emirates
Venezuela, R.B.
Yemen, Rep.
18

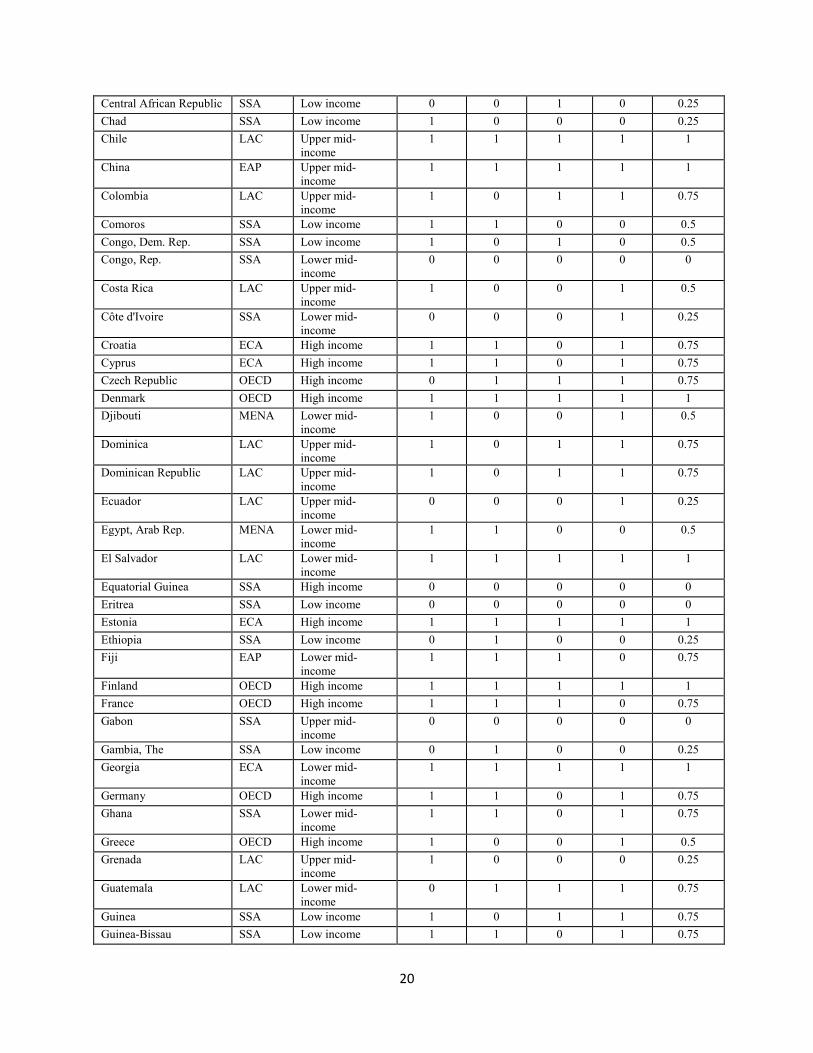
Table 3a: New Transparency Data
Eco
nom
y
Reg
ion
Inco
me
Gro
up
Acc
essi
bilit
y of
In
corp
orat
ion
Fees
Acc
essi
bilit
y of
E
lect
rici
ty
Con
nect
ion
Fees
Acc
essi
bilit
y of
B
uild
ing
Perm
ittin
g D
ocum
ents
Acc
essi
bilit
y of
Pr
oper
ty
Reg
istr
atio
n Fe
es
Reg
ulat
ory
Tra
nspa
renc
y In
dex
Afghanistan SA Low income 1 0 0 0 0.25 Albania ECA Lower mid-
income 1 1 1 1 1
Algeria MENA Upper mid-income
1 0 0 1 0.5
Angola SSA Upper mid-income
1 0 0 1 0.5
Antigua and Barbuda LAC Upper mid-income
0 0 0 0 0
Argentina LAC Upper mid-income
1 0 1 1 0.75
Armenia ECA Lower mid-income
1 1 1 1 1
Australia OECD High income 1 1 1 1 1 Austria OECD High income 1 1 0 1 0.75 Azerbaijan ECA Upper mid-
income 1 1 0 1 0.75
Bahamas, The LAC High income 1 0 1 0 0.5 Bahrain MENA High income 1 0 0 0 0.25 Bangladesh SA Low income 1 1 1 1 1 Barbados LAC High income 1 1 1 1 1 Belarus ECA Upper mid-
income 1 0 0 1 0.5
Belgium OECD High income 1 1 1 1 1 Belize LAC Lower mid-
income 1 0 1 0 0.5
Benin SSA Low income 0 0 1 0 0.25 Bhutan SA Lower mid-
income 1 0 1 1 0.75
Bolivia LAC Lower mid-income
1 0 0 1 0.5
Bosnia and Herzegovina ECA Upper mid-income
0 1 1 1 0.75
Botswana SSA Upper mid-income
0 0 0 0 0
Brazil LAC Upper mid-income
1 1 0 1 0.75
Brunei Darussalam EAP High income 0 1 0 0 0.25 Bulgaria ECA Upper mid-
income 1 1 1 1 1
Burkina Faso SSA Low income 1 1 1 1 1 Burundi SSA Low income 0 0 1 0 0.25 Cambodia EAP Low income 0 0 0 1 0.25 Cameroon SSA Lower mid-
income 0 0 1 1 0.5
Canada OECD High income 1 1 1 1 1 Cape Verde SSA Lower mid-
income 1 0 0 0 0.25
19
Central African Republic SSA Low income 0 0 1 0 0.25 Chad SSA Low income 1 0 0 0 0.25 Chile LAC Upper mid-
income 1 1 1 1 1
China EAP Upper mid-income
1 1 1 1 1
Colombia LAC Upper mid-income
1 0 1 1 0.75
Comoros SSA Low income 1 1 0 0 0.5 Congo, Dem. Rep. SSA Low income 1 0 1 0 0.5 Congo, Rep. SSA Lower mid-
income 0 0 0 0 0
Costa Rica LAC Upper mid-income
1 0 0 1 0.5
Côte d'Ivoire SSA Lower mid-income
0 0 0 1 0.25
Croatia ECA High income 1 1 0 1 0.75 Cyprus ECA High income 1 1 0 1 0.75 Czech Republic OECD High income 0 1 1 1 0.75 Denmark OECD High income 1 1 1 1 1 Djibouti MENA Lower mid-
income 1 0 0 1 0.5
Dominica LAC Upper mid-income
1 0 1 1 0.75
Dominican Republic LAC Upper mid-income
1 0 1 1 0.75
Ecuador LAC Upper mid-income
0 0 0 1 0.25
Egypt, Arab Rep. MENA Lower mid-income
1 1 0 0 0.5
El Salvador LAC Lower mid-income
1 1 1 1 1
Equatorial Guinea SSA High income 0 0 0 0 0 Eritrea SSA Low income 0 0 0 0 0 Estonia ECA High income 1 1 1 1 1 Ethiopia SSA Low income 0 1 0 0 0.25 Fiji EAP Lower mid-
income 1 1 1 0 0.75
Finland OECD High income 1 1 1 1 1 France OECD High income 1 1 1 0 0.75 Gabon SSA Upper mid-
income 0 0 0 0 0
Gambia, The SSA Low income 0 1 0 0 0.25 Georgia ECA Lower mid-
income 1 1 1 1 1
Germany OECD High income 1 1 0 1 0.75 Ghana SSA Lower mid-
income 1 1 0 1 0.75
Greece OECD High income 1 0 0 1 0.5 Grenada LAC Upper mid-
income 1 0 0 0 0.25
Guatemala LAC Lower mid-income
0 1 1 1 0.75
Guinea SSA Low income 1 0 1 1 0.75 Guinea-Bissau SSA Low income 1 1 0 1 0.75
20

Guyana LAC Lower mid-income
0 1 0 0 0.25
Haiti LAC Low income 0 0 1 0 0.25 Honduras LAC Lower mid-
income 1 0 1 1 0.75
Hong Kong SAR, China EAP High income 1 1 1 1 1 Hungary OECD High income 0 1 1 0 0.5 Iceland OECD High income 1 1 1 1 1 India SA Lower mid-
income 1 1 0 1 0.75
Indonesia EAP Lower mid-income
1 1 0 1 0.75
Iran, Islamic Rep. MENA Upper mid-income
1 0 1 0 0.5
Iraq MENA Lower mid-income
0 0 0 0 0
Ireland OECD High income 1 1 1 1 1 Israel OECD High income 1 1 1 1 1 Italy OECD High income 1 1 1 1 1 Jamaica LAC Upper mid-
income 1 1 0 1 0.75
Japan OECD High income 1 1 1 1 1 Jordan MENA Upper mid-
income 1 0 0 1 0.5
Kazakhstan ECA Upper mid-income
0 1 0 0 0.25
Kenya SSA Low income 1 0 1 1 0.75 Kiribati EAP Lower mid-
income 0 1 0 0 0.25
Korea, Rep. OECD High income 1 1 0 1 0.75 Kosovo ECA Lower mid-
income 1 1 0 1 0.75
Kuwait MENA High income 1 0 1 0 0.5 Kyrgyz Republic ECA Low income 1 1 0 1 0.75 Lao PDR EAP Lower mid-
income 0 1 0 0 0.25
Latvia ECA Upper mid-income
1 1 1 1 1
Lebanon MENA Upper mid-income
1 1 0 0 0.5
Lesotho SSA Lower mid-income
0 0 0 1 0.25
Liberia SSA Low income 1 0 1 1 0.75 Lithuania ECA Upper mid-
income 1 1 1 1 1
Luxembourg OECD High income 1 0 0 1 0.5 Macedonia, FYR ECA Upper mid-
income 1 1 1 1 1
Madagascar SSA Low income 1 1 0 1 0.75 Malawi SSA Low income 0 1 1 0 0.5 Malaysia EAP Upper mid-
income 1 1 1 1 1
Maldives SA Upper mid-income
1 0 0 0 0.25
Mali SSA Low income 1 1 1 0 0.75 Malta ECA High income 1 0 1 0 0.5
21

Marshall Islands EAP Lower mid-income
0 1 1 0 0.5
Mauritania SSA Low income 0 0 0 0 0 Mauritius SSA Upper mid-
income 1 1 1 1 1
Mexico LAC Upper mid-income
1 1 0 1 0.75
Micronesia, Fed. Sts EAP Lower mid-income
1 0 0 0 0.25
Moldova ECA Lower mid-income
1 1 0 1 0.75
Mongolia EAP Lower mid-income
1 0 1 1 0.75
Montenegro ECA Upper mid-income
1 1 0 1 0.75
Morocco MENA Lower mid-income
1 0 0 1 0.5
Mozambique SSA Low income 0 0 1 1 0.5 Namibia SSA Upper mid-
income 0 1 1 0 0.5
Nepal SA Low income 1 0 1 0 0.5 Netherlands OECD High income 1 1 1 1 1 New Zealand OECD High income 1 1 1 1 1 Nicaragua LAC Lower mid-
income 0 1 1 1 0.75
Niger SSA Low income 1 0 0 0 0.25 Nigeria SSA Lower mid-
income 1 0 0 1 0.5
Norway OECD High income 1 0 1 1 0.75 Oman MENA High income 1 1 1 0 0.75 Pakistan SA Lower mid-
income 1 1 1 0 0.75
Palau EAP Upper mid-income
1 0 0 1 0.5
Panama LAC Upper mid-income
1 1 0 0 0.5
Papua New Guinea EAP Lower mid-income
1 1 0 1 0.75
Paraguay LAC Lower mid-income
1 0 0 1 0.5
Peru LAC Upper mid-income
1 1 0 1 0.75
Philippines EAP Lower mid-income
1 1 0 1 0.75
Poland OECD High income 1 1 0 1 0.75 Portugal OECD High income 1 1 1 1 1 Puerto Rico LAC High income 1 0 1 1 0.75 Qatar MENA High income 1 0 1 0 0.5 Romania ECA Upper mid-
income 1 1 0 1 0.75
Russian Federation ECA Upper mid-income
0 1 0 1 0.5
Rwanda SSA Low income 1 0 1 1 0.75 Samoa EAP Lower mid-
income 1 0 1 0 0.5
São Tomé and Principe SSA Lower mid-income
1 0 1 1 0.75
22

Saudi Arabia MENA High income 1 1 0 0 0.5 Senegal SSA Lower mid-
income 1 0 1 0 0.5
Serbia ECA Upper mid-income
1 1 0 1 0.75
Seychelles SSA Upper mid-income
1 0 0 1 0.5
Sierra Leone SSA Low income 1 0 1 1 0.75 Singapore EAP High income 1 1 1 1 1 Slovak Republic OECD High income 1 1 1 1 1 Slovenia OECD High income 1 1 0 1 0.75 Solomon Islands EAP Lower mid-
income 1 0 0 0 0.25
South Africa SSA Upper mid-income
1 1 1 1 1
Spain OECD High income 1 1 1 1 1 Sri Lanka SA Lower mid-
income 1 0 1 1 0.75
St. Kitts and Nevis LAC High income 0 0 1 0 0.25 St. Lucia LAC Upper mid-
income 0 1 1 0 0.5
St. Vincent and the Grenadines
LAC Upper mid-income
1 0 1 0 0.5
Sudan SSA Lower mid-income
0 1 0 0 0.25
Suriname LAC Upper mid-income
1 0 0 0 0.25
Swaziland SSA Lower mid-income
1 0 1 0 0.5
Sweden OECD High income 1 1 1 1 1 Switzerland OECD High income 1 1 1 1 1 Syrian Arab Republic MENA Lower mid-
income 1 0 0 0 0.25
Taiwan, China EAP High income 1 1 1 1 1 Tajikistan ECA Low income 1 1 0 0 0.5 Tanzania SSA Low income 1 1 1 1 1 Thailand EAP Upper mid-
income 1 1 1 1 1
Timor-Leste EAP Lower mid-income
1 1 1 0 0.75
Togo SSA Low income 1 0 0 0 0.25 Tonga EAP Lower mid-
income 1 1 0 0 0.5
Trinidad and Tobago LAC High income 1 1 1 1 1 Tunisia MENA Upper mid-
income 1 0 0 1 0.5
Turkey ECA Upper mid-income
1 1 1 1 1
Uganda SSA Low income 1 0 1 1 0.75 Ukraine ECA Lower mid-
income 1 1 0 1 0.75
United Arab Emirates MENA High income 1 0 1 1 0.75 United Kingdom OECD High income 1 1 1 1 1 United States OECD High income 1 1 1 1 1 Uruguay LAC Upper mid- 1 0 1 1 0.75
23

income Uzbekistan ECA Lower mid-
income 0 1 0 1 0.5
Vanuatu EAP Lower mid-income
1 0 0 1 0.5
Venezuela, RB LAC Upper mid-income
1 0 0 0 0.25
Vietnam EAP Lower mid-income
1 1 1 1 1
West Bank and Gaza MENA Lower mid-income
1 0 0 0 0.25
Yemen, Rep. MENA Lower mid-income
1 0 0 1 0.5
Zambia SSA Lower mid-income
1 0 0 1 0.5
Zimbabwe SSA Low income 1 1 0 0 0.5
Note: See http://www.doingbusiness.org/data/transparency for links to the relevant websites to access fee schedules.
24

Table 4a: Transparency Data by Income Group
Accessibility of Information on
Company Incorporation
Fees
Accessibility of Information on
Building Permitting Fees
Accessibility of Information on
Electricity Connection
Fees
Accessibility of Information on
Property Registration
Fees
Regulatory Transparency
Index
Entire Sample
Number of Economies 185 185 185 185 185
Average 0.79 0.52 0.55 0.64 0.62
Low Income
Number of Economies 33 33 33 33 33
Average 0.66 0.54 0.39 0.42 0.50
Lower middle income
Number of Economies 53 53 53 53 53
Average 0.75 0.39 0.49 0.60 0.56
Upper middle income
Number of Economies 49 49 49 49 49
Average 0.81 0.42 0.53 0.71 0.62
High income
Number of Economies 50 50 50 50 50
Average 0.90 0.74 0.76 0.76 0.79
25

Table 5a: Transparency Data by Region
Accessibility of Information on
Company Incorporation
Fees
Accessibility of Information on
Building Permitting Fees
Accessibility of Information on
Electricity Connection Fees
Accessibility of Information on
Property Registration
Fees
Regulatory Transparency
Index
Entire Sample
Number of Economies 185 185 185 185 185
Average 0.79 0.52 0.55 0.64 0.62
East Asia & Pacific
Number of Economies 24 24 24 24 24
Average 0.79 0.50 0.70 0.58 0.64
Europe & Central Asia
Number of Economies 26 26 26 26 26
Average 0.84 0.42 0.84 0.88 0.76
High income: OECD
Number of Economies 30 30 30 30 30
Average 0.93 0.76 0.90 0.93 0.88
Latin America & Caribbean
Number of Economies 33 33 33 33 33
Average 0.75 0.57 0.39 0.63 0.59
Middle East & North Africa
Number of Economies 18 18 18 18 18
Average 0.94 0.27 0.22 0.38 0.45
South Asia
Number of Economies 8 8 8 8 8
Average 1.00 0.62 0.37 0.50 0.62
Sub-Saharan Africa
Number of Economies 46 46 46 46 46
Average 0.60 0.47 0.32 0.47 0.47
26

Table 6a: Correlations Matrix
Acce
ssib
ility
of
inco
rpor
atio
n fe
es
Acce
ssib
ility
of
cons
truc
tion
perm
it fe
es
Acce
ssib
ility
of
elec
trici
ty
conn
ectio
n fe
es
Acce
ssib
ility
of
prop
erty
re
gist
ratio
n fe
es
Inco
rpor
atio
n pr
oced
ures
Cons
truc
tion
proc
edur
es
Elec
trici
ty
proc
edur
es
Prop
erty
pr
oced
ures
Acce
ssib
ility
of
inco
rpor
atio
n fe
es
Acce
ssib
ility
of
elec
trici
ty
conn
ectio
n fe
es
Accessibility of incorporation fees 1Accessibility of construction permit fees 0.3480* 1Accessibility of electricity connection fees 0.6024* 0.4238* 1Accessibility of property registration fees 0.3283* 0.1693* 0.2310* 1Incorporation procedures 0.3045* 0.0829 0.0229 0.037 1Construction procedures -0.0889 -0.0115 -0.0194 -0.1710* 0.1508* 1Electricity procedures -0.0483 0.0702 0.0176 -0.0111 0.1529* 0.2862* 1Property procedures 0.0954 0.0971 0.0433 0.1454 0.3241* 0.0815 0.3050* 1Accessibility of incorporation fees -0.1900* -0.0098 -0.1860* -0.0748 -0.1943* -0.088 -0.0604 -0.0832 1Accessibility of electricity connection fees -0.2440* -0.1256 -0.1910* -0.1999* -0.2910* 0.0579 0.0882 -0.1332 0.0445 1Accessibility of construction permit fees -0.1068 -0.2173* 0.0383 -0.0167 -0.1987* -0.1012 -0.1592* -0.1597* 0.0929 0.099Accessibility of property registration fees -0.2994* -0.1446 -0.2219* -0.1255 -0.1415 0.1046 0.1634* -0.0332 0.3371* 0.2122*Regulatory Transparency Index -0.3474* -0.2150* -0.2262* -0.1734* -0.3433* -0.0062 0.0161 -0.1715* 0.5565* 0.5865*Ease of DB (rank) 0.5359* 0.3643* 0.4626* 0.3135* 0.4746* 0.1509* 0.1812* 0.3131* -0.3283* -0.4343*Regulatory Quality -0.4124* -0.3398* -0.3742* -0.1854* -0.3486* -0.1431 -0.1688* -0.2062* 0.2490* 0.3974*Voice and Accountability -0.3398* -0.2902* -0.3095* -0.0767 -0.2965* -0.1955* -0.1711* -0.1134 0.2086* 0.2676*OBI Rank -0.3930* -0.2495* -0.3312* -0.3504* -0.1793 -0.0047 0.0587 -0.0072 0.1726 0.4431*Transparent Policymaking Rank 0.3478* 0.1953* 0.2863* 0.0884 0.3825* 0.1108 0.1629 0.2771* -0.2595* -0.3202*E-Government Development Index -0.5192* -0.3613* -0.4931* -0.2999* -0.2472* -0.0328 0.0425 -0.1249 0.2748* 0.4039*Open Government (WJP) -0.3748* -0.3312* -0.4681* -0.1795 -0.2679* -0.2630* -0.2329 -0.3427* 0.2527* 0.3720*GNI pc -0.3012* -0.2350* -0.2773* -0.1391 -0.2048* -0.1740* -0.1634* -0.1709* 0.2079* 0.1907*
Acce
ssib
ility
of
cons
truc
tion
perm
it fe
es
Acce
ssib
ility
of
prop
erty
re
gist
ratio
n fe
es
Regu
lato
ry
Tran
spar
ency
In
dex
Ease
of D
B (r
ank)
Regu
lato
ry
Qua
lity
Voice
and
Ac
coun
tabi
lity
OBI
Ran
k
Tran
spar
ent
Polic
ymak
ing
Rank
E-Go
vern
men
t De
velo
pmen
t In
dex
Ope
n Go
vern
men
t (W
JP)
GNI p
c
Accessibility of incorporation feesAccessibility of construction permit feesAccessibility of electricity connection feesAccessibility of property registration feesIncorporation proceduresConstruction proceduresElectricity proceduresProperty proceduresAccessibility of incorporation feesAccessibility of electricity connection feesAccessibility of construction permit fees 1Accessibility of property registration fees 0.1394 1Regulatory Transparency Index 0.5751* 0.6953* 1Ease of DB (rank) -0.3081* -0.3665* -0.5965* 1Regulatory Quality 0.3371* 0.3785* 0.5702* -0.8350* 1Voice and Accountability 0.2896* 0.2834* 0.4380* -0.5787* 0.7135* 1OBI Rank 0.1314 0.3556* 0.4853* -0.6145* 0.6936* 0.7612* 1Transparent Policymaking Rank -0.2346* -0.2830* -0.4496* 0.7096* -0.6881* -0.4962* -0.4146* 1E-Government Development Index 0.1841* 0.3626* 0.5105* -0.8245* 0.8106* 0.6016* 0.6527* -0.5642* 1Open Government (WJP) 0.2213 0.3045* 0.5227* -0.7947* 0.8297* 0.7443* 0.6879* -0.7355* 0.8328* 1GNI pc 0.2578* 0.1826* 0.3475* -0.6238* 0.7210* 0.5316* 0.5234* -0.5671* 0.7343* 0.7883* 1
27

Table 7a: Ease of Doing a Business
Table 8a: Regulatory Quality
The Ease of Doing Business, rank (1-185)Accessibility of incorporation fees (0-1) -22.817***
[6.215]Accessibility of electricity connection fees (0-1) -27.124***
[5.279]Accessibility of construction permit fees (0-1) -19.732***
[5.259]Accessibility of property registration fees (0-1) -24.530***
[5.617]Regulatory Transparency Index (0-1) -69.655***
[9.636]Voice and Accountability (0-100) -11.213***
[3.868]OBI Rank (0-100) -0.738***
[0.211]Transparent Policymaking Rank (1-7) 0.552***
[0.095]E-Government Development Index (0-1) -200.204***
[24.395]Open Government (WJP) (0-1) -170.930**
[45.986]Log GNI pc -25.555***-24.539***-25.819***-25.288***-22.038***-22.931***-17.622***-18.578*** -2.004 -10.675**
[1.465] [1.441] [1.428] [1.421] [1.522] [2.164] [3.239] [2.366] [3.425] [4.957]Constant 327.243***315.617** 321.692** 322.635***323.235** 286.073***271.764** 203.193** 209.362***258.375***
[11.556] [11.995] [11.700] [11.173] [10.360] [18.033] [20.235] [25.891] [18.166] [24.215]
Observations 185 185 185 185 185 183 93 118 178 66R-squared 0.596 0.627 0.601 0.614 0.689 0.599 0.533 0.693 0.684 0.662Robust standard errors in brackets*** p<0.01, ** p<0.05, * p<0.1
Regulatory quality, rank (0-100)Accessibility of incorporation fees (0-1) 0.212*
[0.118]Accessibility of electricity connection fees (0-1) 0.380***
[0.093]Accessibility of construction permit fees (0-1) 0.404***
[0.082]Accessibility of property registration fees (0-1) 0.436***
[0.093]Regulatory Transparency Index (0-1) 1.096***
[0.157]Voice and Accountability (0-100) 0.382***
[0.062]OBI Rank (0-100) 0.014***
[0.003]Transparent Policymaking Rank (1-7) -0.008***
[0.002]E-Government Development Index (0-1) 2.553***
[0.471]Open Government (WJP) (0-1) 3.197***
[0.812]Log GNI pc 0.476*** 0.454*** 0.466*** 0.458*** 0.411*** 0.342*** 0.272*** 0.391*** 0.167** 0.196**
[0.028] [0.028] [0.025] [0.025] [0.027] [0.036] [0.045] [0.039] [0.066] [0.086]Constant -4.199*** -4.058*** -4.157*** -4.160*** -4.172*** -2.877*** -2.891*** -2.620*** -2.696*** -3.047***
[0.231] [0.228] [0.212] [0.212] [0.199] [0.304] [0.301] [0.427] [0.355] [0.375]
Observations 183 183 183 183 183 183 93 117 178 66R-squared 0.622 0.652 0.66 0.662 0.713 0.709 0.63 0.765 0.673 0.719Robust standard errors in brackets*** p<0.01, ** p<0.05, * p<0.1
28

VII. References
Alesina, Alberto, Silvia Ardagna, Giuseppe Nicoletti and Fabio Schiantarelli. 2005. “Regulation and Investment.” Journal of the European Economic Association 3 (4): 791–825.
Antunes, Antonio and Tiago Cavalcanti. 2009. “Start-Up Costs, Limited Enforcement and the Hidden Economy.” Review of Economics and Statistics 91(1): 20-32.
Ackerlof, George A., (1970), "The Market for Lemons: Quality Uncertainty and the Market Mechanism." Quarterly Journal of Economics 84 (No. 3, August), pp. 488-500.
Barseghyan, Levon. 2008. “Entry Costs and Cross-Country Differences in Productivity and Output.” Journal of Economic Growth, 13:145–167.
Besley, Timothy and Robin Burgess. 2002. “The Political Economy Of Government Responsiveness: Theory And Evidence From India.” The Quarterly Journal of Economics 117(4): 1415-1451.
Dabla-Norris, Era, Mark Gradstein and Gabriela Inchauste. 2008. “What Causes Firms to Hide Output? The Determinants of Informality.” Journal of Development Economics 85 (1): 1–27.
Deininger, Klaus and Paul Mpuga. 2005. “Does Greater Accountability Improve the Quality of Public Service Delivery? – Evidence from Uganda.” World Development Volume 33, No. 1, pp. 171-101.
Djankov, Simeon, Rafael La Porta, Florencio López-de-Silanes and Andrei Shleifer. 2009. “Disclosure by Politicians.” NBER Working Paper 14703, National Bureau of Economic Research, Cambridge, MA.
Fisman and Sarria-Allende. 2004. “Regulation of Entry and the Distortion of Industrial Organization.” NBER Working Paper 10929, National Bureau of Economic Research, Cambridge, MA.
Hirschman, Albert O. 1970. Exit, Voice, and Loyalty: Responses to Decline in Firms, Organizations, and States. Cambridge, MA: Harvard University Press.
Hirshleifer, Jack. 1980. “Privacy: Its Origin, Function and Future.” Journal of Legal Studies 9 (4): 649–64.
Islam, Roumeen. 2006. “Does more Transparency go along with better Governance?” Economics and Politics, Volume 18, No. 2.
International Budget Partnership. http://www.internationalbudget.org/.
Kaufmann, Daniel, Kraay, Aart and Mastruzzi, Massimo. 2010. “The Worldwide Governance Indicators: Methodology and Analytical Issues.” World Bank Policy Research Working Paper No. 5430. Washington, DC: World Bank.
29

Klapper, Leora, Luc Laeven and Raghuram Rajan. 2006. “Entry Regulation as a Barrier to Entrepreneurship.” Journal of Financial Economics 82 (3):591-629.
Klapper and Richmond. 2009. “Patterns of Business Creation, Survival, and Growth: Evidence from a Developing Country.” World Bank Working Paper. Washington, DC: World Bank.
Paul, Samuel. 1992. “Accountability in Public Services: Exit, Voice and Control.” World Development 20 (7): 1047–60.
Posner, R., 1981, The Economics of Justice, Cambridge: Harvard University Press.
Rocha, Roberto De Rezende, Farazi, Subika, Khouri, Rania and Pearce, Douglas. 2011. The Status of Bank Lending to SMEes in the Middle East and North Africa Region: The Results of a Joint Survey of the Union of Arab Bank and the World Bank. World Bank Policy Research Working Paper Series.
Stigler, George J. 1971. “The Theory of Economic Regulation.” Bell Journal of Economics and Management Science II: 3-21
Stiglitz, Joseph and A. Weiss, 1981, "Credit Rationing in Markets with Imperfect Information", American Economics Review 71(3): 393-410 1981. Svensson, Jacob and Ritva Reinikka. 2005. “Fighting Corruption to Improve Schooling: Evidence from a Newspaper Campaign in Uganda.” Journal of the European Economic Association, Vol. 3., Issue 2-3, 259-267.
“United Nations E-Government Survey 2012: E-Government for the People.” New York, NY: United Nations.
Williams, Andrew. 2009. “On the release of information by governments: causes and consequences.” Journal of Development Economics, Volume 89, Issue 1, Pages 124–138. World Bank. 2004. World Development Report 2004: Making Services Work for Poor People. Washington, DC: World Bank.
World Bank. 2009. “From Privilege to Competition: Unlocking Private-Led Growth in the Middle East and North Africa.” Washington, DC: World Bank.
World Bank. 2012. Doing Business 2013: Smarter Regulations for Small and Medium-Size Enterprises. Washington, DC: World Bank Group. World Justice Project. 2010. http://worldjusticeproject.org/
30