Embed Size (px)
Citation preview

ISSN 1977-8449
Train or plane?
EEA Report No 19/2020
Transport and environment report 2020

EEA Report No 19/2020
Train or plane? Transport and environment report 2020

Legal noticeThe contents of this publication do not necessarily reflect the official opinions of the European Commission or other institutions of the European Union. Neither the European Environment Agency nor any person or company acting on behalf of the Agency is responsible for the use that may be made of the information contained in this report.
Brexit noticeThe withdrawal of the United Kingdom from the European Union did not affect the production of this report. Data reported by the United Kingdom are included in all analyses and assessments contained herein, unless otherwise indicated.
Copyright notice© European Environment Agency, 2021Reproduction is authorised provided the source is acknowledged.
More information on the European Union is available on the Internet (http://europa.eu).
Luxembourg: Publications Office of the European Union, 2021
ISBN 978-92-9480-390-0ISSN 1977-8449doi: 10.2800/43379
European Environment AgencyKongens Nytorv 61050 Copenhagen KDenmark
Tel.: +45 33 36 71 00Internet: eea.europa.euEnquiries: eea.europa.eu/enquiries
Cover design: EEACover photo: © Alejandra Bize/EEALayout: Formato Verde

3
Contents
Transport and environment report 2020 — Train or plane?
Contents
Acknowledgements ....................................................................................................................................4
Executive summary ....................................................................................................................................5
1 Introduction ..........................................................................................................................................9
2 Passenger rail and air transport in Europe......................................................................................112.1 Introduction ............................................................................................................................................................ 11
2.2 Passenger rail transport in Europe ...................................................................................................................... 12
2.3 Passenger air transport in Europe ....................................................................................................................... 14
2.4 Choicesbetweenrailandairtravel options ....................................................................................................... 16
3 Theenvironmentalimpactsofrailandair transport ....................................................................193.1 Introduction ............................................................................................................................................................ 19
3.2 Environmental impacts of train rides and flights ............................................................................................... 21
3.3 Environmentalimpactsofrelated activities ....................................................................................................... 33
4 European Union and national policy context and international agreements ............................394.1 Introduction ............................................................................................................................................................ 39
4.2 Climate change ....................................................................................................................................................... 41
4.3 Air pollution ............................................................................................................................................................ 44
4.4 Noise ........................................................................................................................................................................ 44
4.5 General policy frameworks, EU initiatives and funding instruments .............................................................. 46
5 Train or plane? ....................................................................................................................................485.1 Introduction ............................................................................................................................................................ 48
5.2 Environmental costs of travelling by rail and air — an analysis for specific city pairs .................................. 49
5.3 The environmental impacts of the modal shift from air to rail ........................................................................ 63
6 Further considerations and recommendations ..............................................................................666.1 Introduction ............................................................................................................................................................ 66
6.2 Whatfactorsinfluencethefutureenvironmentalperformanceofthese modes? ........................................ 66
6.3 Actions and policies to promote a more environmentally sustainable modal choice .................................. 67
Abbreviations, symbols and units ..........................................................................................................70
References .................................................................................................................................................72
Annex 1 Inputs for calculating the environmental costs per trip ......................................................78
Annex 2 Environmental costs per city pair ...........................................................................................87
Transport and environment report 2020 — Train or plane?4
Acknowledgements
Acknowledgements
The preparation of this report was led by Andreas Unterstaller (EEA). The report is based on a draft by the European Topic Centre on Air Pollution, Transport, Noise and Industrial Pollution (ETC/ATNI), written by Sebastiaan Boschmans, Inge Mayeres and Bruno Van Zeebroeck (Transport & Mobility Leuven).
Comments on the draft received from EEA member countries, the European Commission's TERM advisory group (Eurostat, Directorate-General for Environment, Directorate-General for Mobility and Transport, and Directorate-General for Climate Action) and the European Union Aviation Safety Agency are gratefully acknowledged.
5
Executive summary
Transport and environment report 2020 — Train or plane?
Executive summary
Why this topic now?
In a year during which millions in Europe have been confined to their homes and travel activity has dropped dramatically, the question of whether one should take the train or the plane might not seem pertinent. However, before passenger numbers started dwindling in the wake of the pandemic, demand for passenger transport was on a steady upwards trajectory with by far the strongest growth seen in air travel. This long-standing trend is set against the backdrop of the climate crisis and persistent problems with air pollution and environmental noise in Europe. All modes of motorised transport contribute to these problems but to different degrees. The report's topic is also linked to the question of how to achieve a green and resilient economic recovery. The current situation is an opportunity to reflect and to innovate. For these reasons, 'train or plane?' remains a timely and important question.
Policy context
The European Green Deal includes the objective of reducing the greenhouse gas (GHG) emissions from transportby90 %by2050comparedwith1990.Facilitating a shift towards the most sustainable transport modes can make an important contribution to reaching this objective. For passenger transport, a shift from air to rail travel potentially plays a key role.
Objective of the report
The aim of this report is to inform decision-makers on the current status and environmental impact of rail and air passenger travel in Europe. Furthermore, the report looks at how travel choices and their environmental impacts relate to the existing policy context: which factors influence the future environmental performance of these modes, and which policies and actions can promote more environmentally sustainable choices? To come to a satisfactory answer, it is vital to understand the environmental consequences of travelling by rail and air in mainland Europe. This is assessed both in general and for a variety of actual connections between European cities.
Scope and method
Twenty main city pairs within different distance bands, in different parts of Europe and with varying degrees of rail connection quality are analysed in the report. In addition, for each of these pairs, an additional pair of alternative locations in the vicinity of the main cities that is potentially served by the same railway station or airport is analysed. As the car is the dominant mode of passenger transport in Europe and is still often seen as the default choice for intercity travel, even for long distances, it is included in the comparison as a point of reference. To maintain analytical focus and to present in-depth information in the given format, the emphasis is on rail and air travel. It is not the report's ambition to compare all forms of motorised passengertransportin Europe.
The external cost approach, as outlined in the European Commission's handbook on the external costs of transport (EC, 2019d), has been selected because it offers an established way of putting one cost figure on the emission impacts of transport on human health and the environment. Non-emission cost categories, such as accidents and congestion, are included in the handbook but have been excluded from the calculations in this report. It should be noted that these costs can be very significant. For car trips, accidents and congestion (in terms of the cost of delay) are the two dominant categories and much higher than for rail and air travel. On account of a lack of comparable data, the emission costs related to the manufacturing of trains, planes and cars, their maintenance and scrapping, and the construction and maintenance of the transport infrastructure are not covered in the calculations. Hence, the scope is a well-to-wheel/wake analysis, rather than a life cycle analysis.
Key findings
Looking at the general comparison and the specific results for the city pairs, rail travel is always a sensible choice. The emission impacts of aviation are invariably higher on a passenger-kilometre basis. However, flying is not necessarily the most harmful choice. This role is often taken by the conventional car, if single occupancy is assumed. Figure ES.1 displays the emission costs per
Executive summary
6 Transport and environment report 2020 — Train or plane?
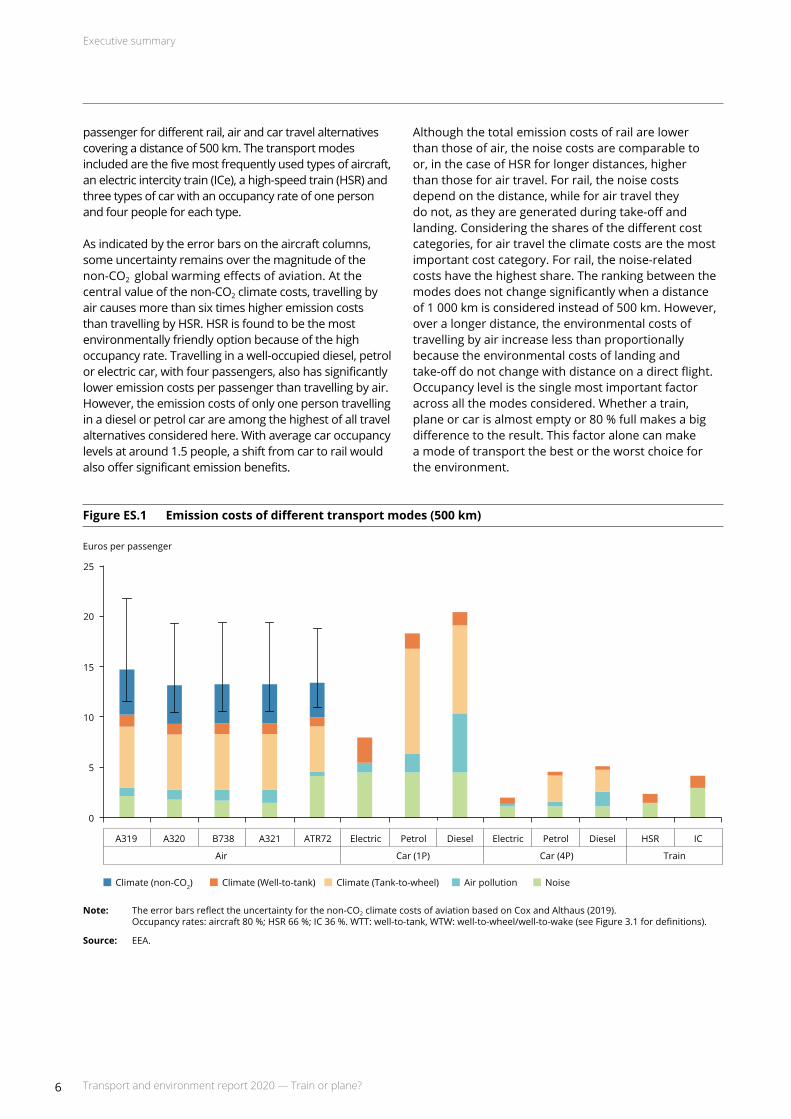
passenger for different rail, air and car travel alternatives coveringadistanceof500 km.Thetransportmodesincluded are the five most frequently used types of aircraft, anelectricintercitytrain(ICe),ahigh-speedtrain (HSR)andthree types of car with an occupancy rate of one person and four people for each type.
As indicated by the error bars on the aircraft columns, some uncertainty remains over the magnitude of the non-CO2 global warming effects of aviation. At the central value of the non-CO2 climate costs, travelling by air causes more than six times higher emission costs than travelling by HSR. HSR is found to be the most environmentally friendly option because of the high occupancy rate. Travelling in a well-occupied diesel, petrol or electric car, with four passengers, also has significantly lower emission costs per passenger than travelling by air. However, the emission costs of only one person travelling in a diesel or petrol car are among the highest of all travel alternatives considered here. With average car occupancy levels at around 1.5 people, a shift from car to rail would also offer significant emission benefits.
Although the total emission costs of rail are lower than those of air, the noise costs are comparable to or, in the case of HSR for longer distances, higher than those for air travel. For rail, the noise costs depend on the distance, while for air travel they do not, as they are generated during take-off and landing. Considering the shares of the different cost categories, for air travel the climate costs are the most important cost category. For rail, the noise-related costs have the highest share. The ranking between the modes does not change significantly when a distance of1 000 kmisconsideredinsteadof500 km.However,over a longer distance, the environmental costs of travelling by air increase less than proportionally because the environmental costs of landing and take-off do not change with distance on a direct flight. Occupancy level is the single most important factor across all the modes considered. Whether a train, planeorcarisalmostemptyor80 %fullmakesabigdifference to the result. This factor alone can make a mode of transport the best or the worst choice for the environment.
Climate (non-CO2) Climate (Well-to-tank) Climate (Tank-to-wheel) Air pollution Noise
A319 A320 B738 A321 ATR72 Electric Petrol Diesel Electric Petrol Diesel HSR IC
Air Car (1P) Car (4P) Train
Euros per passenger
0
5
10
15
25
20
FigureES.1 Emissioncostsofdifferenttransportmodes(500 km)
Note: Theerrorbarsreflecttheuncertaintyforthenon-CO2 climate costs of aviation based on Cox and Althaus (2019). Occupancyrates:aircraft80 %;HSR66 %;IC36 %.WTT:well-to-tank,WTW:well-to-wheel/well-to-wake(seeFigure3.1fordefinitions).
Source: EEA.

Executive summary
7Transport and environment report 2020 — Train or plane?
Modal shift: effect and potential
Going from these findings to the question of what a future shift from air to rail can bring is not straightforward. A big shift to rail requires new infrastructure. For new investment in rail to be environmentally beneficial, the environmental pressures related to the construction (e.g. from the production of cement and steel, and the fuel used for construction) and the maintenance of the infrastructure must be compensated by the reduction in environmental pressures that will be made possible by the opening of the new rail link. New rail infrastructure can quickly result in net GHG emission reductions if the GHG intensity in the construction of the line is low (i.e. if it does not require many complex structures, such as tunnels and bridges), if there is a lot of traffic diverted from more GHG-intensive modes of transport and if the occupancy rate is consistently high. However, more attractive rail options may also lead to additional demand for transport. This could undo some of the environmental gains from switching to rail.
The GHG emissions from aviation within the European Economic Area and from the electricity used in the rail sector are part of the same cap and trade system — the EUEmissionsTradingSystem(EU ETS).Ashiftfromair to electric rail transport would reduce the external costs related to the non-CO2 climate impact of aviation, which is recognised as a source of global warming. It would also reduce all other negative environmental impacts (e.g. air pollution), as aviation has a relatively higher impact per kilometre travelled than rail travel. The effect on cumulative CO2 emissions under the EU ETSisrelativelycomplextoassesswiththecurrentrules and their treatment of aviation emissions. It would require further quantitative analysis to draw robust conclusions.
Furthermore, a realistic view of how much additional demand Europe's railway system can absorb is required. In the short term, passenger rail can grow only modestly by increasing occupancy rates and by offering additional railway services on the existing infrastructure, where the maximum capacity and the available rolling stock allows for that. In the medium term, capacity can be added by procuring additional rolling stock and by upgrading existing rail lines so that they can support more traffic and higher speeds. This can, for example, be done with modern signalling equipment. In the long term, entirely new rail links can
be built and very significant capacity can be added. Alongside more capacity, it also remains an important objective to further improve the environmental performance of rail travel. The continued electrification of rail lines and noise mitigation are important measures in this context.
At the same time, improving the environmental performance of aviation remains highly important. The renewal of the fleet with modern aeroplanes and engines has already resulted in fuel efficiency gains. Theregulatorylimitsforenginenitrogen oxide (NOx) emissions have been tightened over time and individual aircraft have become less noisy. The more widespread use of sustainable aviation fuel and improvements in ground operations and air traffic management could further reduce the negative environmentalimpactsof aviation.
Lessons learnt
When it comes to supporting a smart modal shift, one question is of central importance. In which cases does flying offer irreplaceable benefits for travellers and under which conditions can it be replaced with less polluting modes, such as rail? As short-haul flights have a disproportionate impact on health and the environment, efforts should focus on replacing those flights. This is typically also the travel distance for which good, less polluting alternatives tend to be most readily available or are easiest to develop. To strike a better balance between rail and air travel, it would also help to make cross-border rail travel hassle free. Integrated booking and ticketing across Europe would go a long way towards achieving this goal.
Rail and aviation should be complementary, as they have distinct advantages and disadvantages in what they offer. The findings of this report imply that aviation should focus on connections where there is not, or not yet, a reasonable alternative to flying while working towards a more integrated railway network across Europe. Rail and aviation also offer the potential for multimodal trips, whereby a trip combines air transport on one leg and a railway trip on another leg, rather than travelling the whole distance by air. For this to happen, major airports need to be connected to the HSR network. It is also important that choosing rail is not just an environmentally sound, but also a more affordable, choice.
Executive summary
8 Transport and environment report 2020 — Train or plane?
As is apparent from some sections of the report, there is a certain imbalance between the information and studies available on the environmental impacts of rail and aviation. Looking at the scientific literature, aviation has so far attracted more research interest in its environmental impact. Especially for embedded emissions from vehicle manufacturing and operational procedures and their impacts, rail is not well captured in the literature. Addressing this imbalance would help support decision-makers who are looking to understand and encourage modal shift. The relative lack of publicly accessible, harmonised data on rail passenger numbers also makes the comparison more difficult. It would be useful if official statistics in Europe captured the number of people travelling between the main European railway stations.
Even when good alternatives to air travel are available, it is also necessary that people make a conscious choice for every longer trip and consider all available transport options — regarding not just their financial costs but also their environmental costs. Making reliable and consistent environmental information available is vital. A standardised way of comparing the environmental performance of the transport modes available for making a certain trip would be an important step forward. Finally, a broad-based shift towards rail requires a long-term perspective, integrated planning at the European level and rail transport capacity to match the future demand that such a shift will entail.

9
Introduction
Transport and environment report 2020 — Train or plane?
(1) HSRreferstorailservicesoperatingonspecificallydesignedlineswithamaximumoperatingspeedofatleast250 km/handservicesoperatingonconventionallineswithamaximumoperatingspeedofatleast200 km/h.
1 Introduction
The EU and governments around the world have adopted the United Nations (UN) 2030 agenda for sustainable development (UN, 2015b) and the Paris Agreement on climate change (UN, 2015a). The recently adopted European Green Deal forms part of the European Commission's strategy to implement the UN 2030agendaandtheSustainableDevelopmentGoals (SDGs). The ambition is to achieve climate neutrality by 2050. Every sector should contribute. For the transport sector the Commission's communication on the Green Deal sets out the need to reduce transportemissionsby90 %by2050(comparedwith1990) (EC, 2019b). The recent proposal by the European Commission for the next multiannual budget, entitled 'A recovery plan for Europe', is also geared towards enabling a green and digital transition (EC, 2020e).
The European aviation environmental report 2019 indicates that the aviation sector causes substantial environmental problems in terms of climate impacts and local environmental problems (EASA et al., 2019). Moreover, although environmental efficiency is expected to improve further in the future, air travel is also forecast to grow — although the timeline and the rate of growth have become more uncertain on account of the COVID-19 outbreak — leading to an expected increase in the local and global environmental impacts of air travel. Although actions can be undertaken by the aviation sector itself to reduce its environmental impacts, a shift to less polluting modes is central to reducing the environmental footprint of travel. Scenarios calculated by the International Energy Agency (IEA) indicate that limiting the global averagetemperatureincreasetobelow2 °Calsorequires the substitution of intra-continental flights on mediumdistancesofupto1 000 kmwithhigh-speedrail (HSR) (1) (IEA, 2017).
There is also a growing awareness among citizens of the environmental and climate problems caused by air transport, with some of them being ready to reconsider their travel behaviour, for example by shiftingfromplanetotrainfortheirtravel(EIB, 2020).Moreover, within the context of the COVID-19 pandemic, environmental requirements or reducing competition with HSR, for example by cutting relatively short distance domestic routes or imposing a minimum price for air tickets, are mentioned as a condition for state aid for airlines. Examples can be found in France (RailExpress, 2020), Austria (Grüll, 2020) and the Netherlands (Morgan, 2020a).
For medium to longer distance passenger travel up to 1 000 kmwithinmainlandEurope,whichisthemainscope of this report, people have different options besides air transport: rail (including HSR), coach and car. To varying degrees these modes are substitutes for air transport in this market segment. This report focuses on rail and air passenger transport. In addition to being substitutes, they also offer potential for multimodal trips, whereby a trip combines air transport on one leg and a railway trip on another leg, rather than travelling the whole way by air.
The aim of the report is to get a better insight into the following questions:
• What are the environmental consequences of travellingbyrailand/orairtransportformedium- tolong-distance travel in mainland Europe? This is assessed both in general and for a selection of 20 city pairs in Europe.
• How are these choices and their environmental impacts affected by the existing policy context?
Introduction
10 Transport and environment report 2020 — Train or plane?
• Which factors influence the future environmental performance of these modes and which policies and actions can promote a more environmentally sustainable modal choice?
The structure of the report is as follows. First, Chapter 2 gives an overview of the evolution of rail and air transport in Europe and their market share and projected evolution, referring also to the uncertainties created by the COVID-19 crisis. The chapter also sketches the broader context of these two sectors. Next, Chapter 3 describes the main environmental impacts of rail and air transport and presents evidence on the magnitude of these impacts as well as their evolution over time. Then,
Chapter 4providesanoverviewoftherelevantEU,national and international policies concerning rail and air transport and their environmental impacts. Chapter 5givesfurtherinsightintotheenvironmentalcosts of travelling by rail and air, based on the analysis of specific city pairs. In addition, it discusses the environmental gains that could be obtained by a modal shift from air to rail. Special attention is given to the role played by the EU Emissions Trading System (ETS). Finally, Chapter 6 discusses how future developments are expected to change this picture and which actions and policies can play a role in improving the environmental sustainability of modal choices.
Box 1.1 Country groupings
Throughout the report, abbreviations are used to refer to specific country groupings. The following definitions are used:
• EU-28:the28EUMemberStatesasof1 July2013to31January2020;
• EU-27:the27EUMemberStatesasof1 February2020;
• EEA-33:the33membercountriesoftheEEAasof1 July2013to31January2020(28EUMemberStatesplusIceland,Liechtenstein,Norway,SwitzerlandandTurkey);
• EEA-32:the32membercountriesoftheEEAasof1 February2020(27EUMemberStatesplusIceland,Liechtenstein,Norway,SwitzerlandandTurkey);
• EFTAcountries:countriesoftheEuropeanFreeTradeAssociation:Iceland,Liechtenstein,NorwayandSwitzerland;
• European Economic Area: EU-27 Member States plus Iceland, Norway and Liechtenstein. The European Economic Area statusoftheUnitedKingdomappliesuntil31 December2020.
11
Passenger rail and air transport in Europe
Transport and environment report 2020 — Train or plane?
Key messages
• Despite the rapid growth of high-speed rail in the last few decades, passenger rail transport is still mainly seen by users as a viable choice for domestic travel.
• There is not yet a real European high-speed rail network because of a lack of connections between the national lines.
• Air travel in the EU-28 grew considerably between 2000 and 2018. A substantial share of air travel and flights is national or intra-EU, market segments for which rail can be an alternative.
• While high-speed rail has an impact on the number of seats offered, there is mixed evidence for how this affects the number of flights, which is most relevant from an environmental point of view.
• Evidenceshowsthat4yearsaftertheintroductionofhigh-speedrail10-20 %ofdemandisnew,induced,demand,withvariations across routes. The other high-speed rail travellers switch from a different mode. The main modal shift is from conventional rail, but for particular routes the shift from air travel is considerable.
2 Passenger rail and air transport in Europe
2.1 Introduction
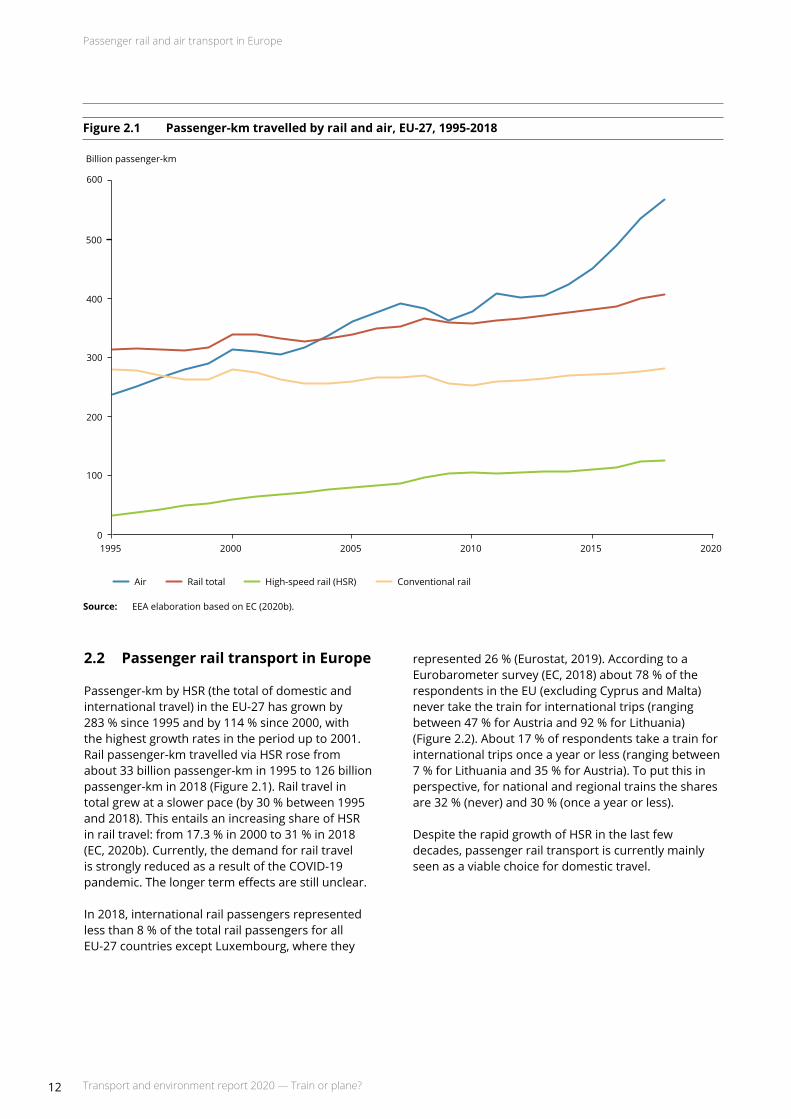
In 2018, a total of 569 billion passenger-km were travelled by air in the EU-27 (the 27 EU Member Statesasof1 February2020),comparedwithatotalof 407 billion passenger-km by rail, which includes 126 billion passenger-km by high-speed rail (HSR) (EC, 2020b).This chapterdescribeshowthetwosectors have evolved over time (Sections 2.2 and 2.3). It alsoexploresthechoicesbetweenrailandairtraveloptions, focusing ontheimpactofHSRonairtravelsupply and demand (Section 2.4).
Both rail and air transport have undergone significant changes in the past few decades. Figure 2.1 presents the evolution of rail and air transport in the EU-27 between 1995 and 2018. For rail transport a distinction is made between HSR and 'conventional rail transport'. When considering this figure, it should be noted that the market segments covered are not completely comparable between rail and air: the data for rail transport also cover shorter distance daily travel, for which air travel is not an alternative, and the data for air transport cover also long-haul flights, for which rail travel is not an alternative.
Passenger rail and air transport in Europe
12 Transport and environment report 2020 — Train or plane?
2.2 Passenger rail transport in Europe
Passenger-km by HSR (the total of domestic and international travel) in the EU-27 has grown by 283 %since1995andby114 %since2000,withthe highest growth rates in the period up to 2001. Rail passenger-km travelled via HSR rose from about 33 billion passenger-km in 1995 to 126 billion passenger-km in 2018 (Figure 2.1). Rail travel in totalgrewataslowerpace(by30 %between1995and 2018). This entails an increasing share of HSR inrailtravel:from17.3 %in2000to31 %in2018(EC, 2020b). Currently, the demand for rail travel is strongly reduced as a result of the COVID-19 pandemic. The longer term effects are still unclear.
In 2018, international rail passengers represented lessthan8 %ofthetotalrailpassengersforallEU-27 countries except Luxembourg, where they
Figure 2.1 Passenger-km travelled by rail and air, EU-27, 1995-2018
Source: EEA elaboration based on EC (2020b).
Billion passenger-km
0
100
200
300
600
400
1995 2000 2005 2010 2015 2020
500
Air Rail total High-speed rail (HSR) Conventional rail
represented26 %(Eurostat,2019).AccordingtoaEurobarometersurvey(EC,2018)about78 %oftherespondents in the EU (excluding Cyprus and Malta) never take the train for international trips (ranging between47 %forAustriaand92 %forLithuania)(Figure2.2).About17 %ofrespondentstakeatrainforinternational trips once a year or less (ranging between 7 %forLithuaniaand35 %forAustria).Toputthisinperspective, for national and regional trains the shares are32 %(never)and30 %(onceayearorless).
Despite the rapid growth of HSR in the last few decades, passenger rail transport is currently mainly seen as a viable choice for domestic travel.

Passenger rail and air transport in Europe
13Transport and environment report 2020 — Train or plane?
Figure 2.2 Eurobarometer 463 — how often do you use rail for …?
Notes: Geographical coverage: EU-28, excluding Cyprus and Malta. Base: all respondents (n=25 537).
Source: EC (2018).
100
2 2 1 7 26 30 32
1 4 17 78
0 10 20 30 40 50 60 70 80 90
National or regional trips(excluding suburban trains)
International trips
Percentage
Daily/Almost daily Several times per week Once a week Several times per month
Several times per year Once a year or less Never
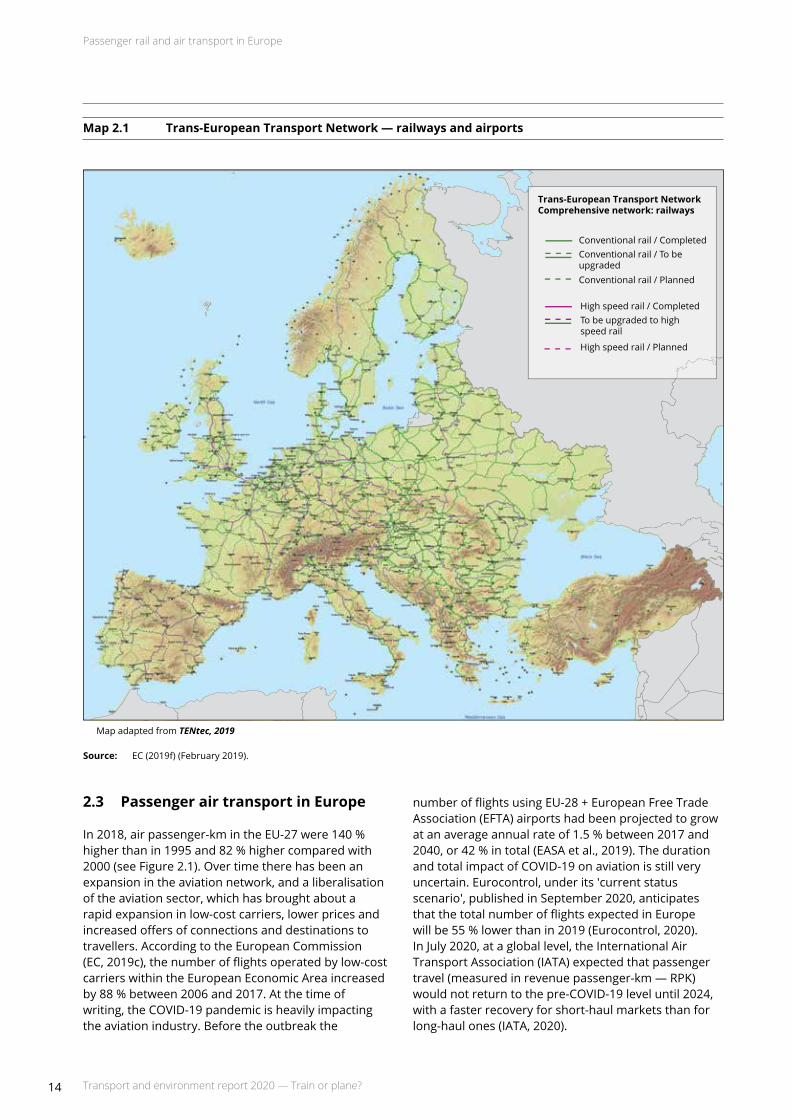
The growth in travel by HSR is linked to the expansion of the network. The length of the HSR lines in the EU-27increasedfrom1 001 kmin1990to9 169 kmin2019.Anadditional2 059 kmisunderconstruction(EC, 2020b). Map 2.1 presents an overview of the existing and planned HSR lines in Europe. Although the network has already expanded and further expansion is planned, a recent audit report by the European Court of Auditors (ECA) points out that there is not yet a real European HSR network. The report describes it as 'an ineffective patchwork of poorly connected national lines' and points to a lack of a realistic long-term plan to connect the different parts of the existing network (ECA, 2018).
Since 2010, the supply of night train services has been reduced significantly. Still, a 2017 study for the European Parliament indicates that there is a potential
demand for night train services (Steer Davies Gleave and Politecnico di Milano, 2017). Recently, some services have been (re)introduced or existing services have been expanded (e.g. by ÖBB, Regiojet, Leo Express and Snälltåget). Sweden and the Netherlands have also been considering the case for night trains (Savelberg, 2019;Trafikverket,2020)andwillreintroducenighttrains in the near future (Ministerie van Infrastructuur enWaterstaat,2019;Morgan,2020b).
A recent development in the European rail market is low-cost services such as those offered by Ouigo, iZY, Flixtrain or EVA (EC, 2019e) for the long-distance rail market, following the example of low-cost air carriers.
Passenger rail and air transport in Europe
14 Transport and environment report 2020 — Train or plane?
2.3 Passenger air transport in Europe
In2018,airpassenger-kmintheEU-27were140 %higherthanin1995and82 %highercomparedwith2000 (see Figure 2.1). Over time there has been an expansion in the aviation network, and a liberalisation of the aviation sector, which has brought about a rapid expansion in low-cost carriers, lower prices and increased offers of connections and destinations to travellers. According to the European Commission (EC, 2019c),thenumberofflightsoperatedbylow-costcarriers within the European Economic Area increased by88 %between2006and2017.Atthetimeofwriting, the COVID-19 pandemic is heavily impacting the aviation industry. Before the outbreak the
Map 2.1 Trans-European Transport Network — railways and airports
Source: EC (2019f) (February 2019).
Map adapted from TENtec, 2019
High speed rail / CompletedTo be upgraded to highspeed rail
High speed rail / Planned
Conventional rail / CompletedConventional rail / To beupgraded Conventional rail / Planned
Trans-European Transport NetworkComprehensive network: railways
numberof flightsusingEU-28 + EuropeanFreeTradeAssociation (EFTA) airports had been projected to grow atanaverageannualrateof1.5 %between2017and2040,or42 %intotal(EASAetal.,2019).Thedurationand total impact of COVID-19 on aviation is still very uncertain. Eurocontrol, under its 'current status scenario', published in September 2020, anticipates that the total number of flights expected in Europe willbe55 %lowerthanin2019(Eurocontrol,2020).InJuly2020,atagloballevel,theInternationalAirTransport Association (IATA) expected that passenger travel (measured in revenue passenger-km — RPK) would not return to the pre-COVID-19 level until 2024, with a faster recovery for short-haul markets than for long-haul ones (IATA, 2020).

Passenger rail and air transport in Europe
15Transport and environment report 2020 — Train or plane?
Figure 2.3 Number of air passengers carried by type of transport, EU-27, 2019
Source: EEA, based on Eurostat (avia_paoc, passengers carried).
To identify the air travel market segment that is relevant for a shift to rail, a first approximation can be derived from the share of domestic and intra-EU travel intotalairtravelintheEU.Figure2.3andFigure 2.4give the number of passengers carried and flights by type of transport (national, intra-EU or extra-EU) fortheEU-27.In2019,about35 %ofairpassenger
transport (in terms of flights and passengers carried) concerned intra-EU transport, while national transport accountedfor15.5 %(passengerscarried)and21 %(flights).The countrieswiththelargestnumberofflights for national transport were Spain, France, Italy and Germany.
International transport extra-EU-27 International transport intra-EU-27 National transport
0
50
100
150
250
200
Spai
nGer
man
yFr
ance
Italy
Nethe
rland
sGre
ece
Portu
gal
Polan
dIre
land
Swed
enAu
stria
Belg
ium
Denm
ark
Finlan
dRo
man
iaCz
echi
aHun
gary
Bulga
riaCy
prus
Croa
tiaLa
tvia
Mal
taLit
huan
iaLu
xem
bour
gEs
toni
aSl
ovak
iaSl
oven
ia
Millions
0EU-27
200
400
600
800
1 000
1 200

Passenger rail and air transport in Europe
16 Transport and environment report 2020 — Train or plane?
Among the 50 busiest connections in 2018 within the EU-27, somewhat more than half were domestic connections (including some overseas connections, which are outside the scope of this report). All top 10 connectionsin2018,listedinTable2.1,weredomestic connections. Considering all air passenger travelintheEU-27,about16 %ofpassengerscarriedwere domestic travellers (EC, 2020b).
Figure 2.4 Number of flights by type of transport, EU-27, 2019
Source: EEA,basedonEurostat(avia_paoc,commercialairflights).
International transport extra-EU-27 International transport intra-EU-27 National transport
0
1.0
2.0
1.6
Spai
n
Germ
any
Fran
ceIta
lyNet
herla
nds
Greec
ePo
rtuga
l
Pola
nd
Irela
nd
Swed
en
Aust
riaBe
lgium
Denm
ark
Finla
ndRo
man
iaCz
echi
aHun
gary
Bulga
ria
Cypr
us
Croa
tia
Latv
ia
Mal
ta
Lithu
ania
Luxe
mbo
urg
Esto
nia
Slov
akia
Slov
enia
Millions
0EU-27
1
3
4
6
7
9
2
5
8
0.2
0.4
0.6
0.8
1.8
1.2
1.4
Table 2.1 Top 10 airport pairs for intra-EU air transport,EU-27,2018
Passengers carried (× 1 000)
Madrid/Barajas-Barcelona 2 467.8
Frankfurt (Main)-Berlin/Tegel 2 292.6
Toulouse/Blagnac-Paris/Orly 2 282.4
Paris/Orly-Nice/Côte d'Azur 2 144.6
Palma-Barcelona 2 035.7
Berlin/Tegel-Munich 1 985.3
Catania/Fontanarossa-Rome/Fiumicino 1 980.6
Palma-Madrid/Barajas 1 967.3
Munich-Hamburg 1 745.7
Palermo/Punta Raisi-Rome/Fiumicino 1 666.9
Note: Passengersarrivinganddepartingfromfirstnamedairport.
Source: EC (2020b).
2.4 Choices between rail and air travel options
2.4.1 Rail and air as substitutes and complements
People who want to make medium to longer distance trips in mainland Europe usually have many options: rail (including HSR), air, car and coach. To varying degrees these modes of transport can replace, or substitute for, each other in this market segment. In general, people's choice will depend on many factors, which also apply when one considers the choice between rail and air travel, on which this report focuses. The main factors determining the choice are price, travel time, travel time reliability, frequency of the connections and other factors such as convenience, comfort and safety (Givoni and Dobruszkes,2013;Clewlowetal.,2014;Savelbergand de Lange, 2018). For example, HSR is found to be a good substitute for air transport for trips up to 2.5 or 3 hours, but less so for longer travel times (JiangandLi,2016).Theextenttowhicheachofthefactors plays a role depends, however, on the travel purpose (business, leisure) and on the preferences of the person who travels. For example, Behrens and Pels (2012) find for the London-Paris market, business passengers are more sensitive to total travel time

Passenger rail and air transport in Europe
17Transport and environment report 2020 — Train or plane?
and weekly frequency than leisure travellers and are less sensitive to fares. People in both the business and leisure market segments make a trade-off between various trip attributes. In both segments, for example, longer average travel time by rail may be offset by higher frequency and/or lower fares. The substitution between rail and aviation is explored further in Section 2.4.2,forthespecificcaseofHSR.
In addition to being substitutes, rail and air also offer the potential for multimodal trips. In that case a trip combines air transport on one leg and a railway trip on another leg, rather than travelling the whole way by air. In this respect the 2011 Transport White Paper states that all major airports should be linked to the railway network. Furthermore, the Trans-European Transport Network (TEN-T) Regulation — Regulation (EU) No 1315/2013 — stipulates that until 2030 the most important core network components, including urban nodes and airports, are expected to have multimodal links, as long as they are economically viable, environmentally sustainable and feasible.
2.4.2 The impact of high-speed rail on air travel supply and demand
A number of studies have tried to identify the impact of HSR on air travel supply and demand in Europe. Dobruszkes et al. (2014) analysed the impact of HSR on the air services supplied (in terms of number of seats and number of flights). They looked at a wide range of 161 city pairs in Europe where HSR competes with air. Most of these are domestic routes (in France, Germany, Italy and Spain) and 36 are international routes. They found that shorter HSR travel times mean fewer air services and that the number of flights and seats offered are affected similarly. This impact diminishes quickly between 2 and 2.5 hours of HSR travel time. Albalate et al. (2015) also found an impact of HSR on air services in Europe, but they concluded that flight frequencies are not reduced significantly, while the number of seats provided by airlines are, which is different from the finding of the previous study. Hub airports have seen a larger reduction in air services than non-hub airports, with a larger reduction in hub airports that have no on-site HSR station. Dobruszkes et al. (2014) found that HSR frequency has only a small impact on air services. Considering airline strategies, the number of air services increases with the presence of airline hubs. In this case there may be a role for rail to replace short-haul flights to feed long-haul flights, for which Albalate et al. (2015) also offer some evidence.
The impact on emissions will depend on what will happen with the slots that are freed up as a result of the initial reduction in air services and to what extent additional long-haul trips are made. Moreover, the modes chosen for trips from and to the station may be different for HSR stations in city centres compared with those located near airports (Dobruszkes et al. (2014)).
Evidence on the impact of HSR services on travel demand (rather than supply) for a wide range of routes is more difficult to collect, as many studies consider only specific routes. Moreover, econometric analyses that also try to identify the impacts of changes in socio-economic factors, prices, etc., are not widely available. The literature review by Givoni and Dobruszkes (2013), which also covers regions outside the EU, finds that, some4yearsaftertheintroductionofHSR,10-20%ofdemand for HSR travel is new, induced, demand, with variations across routes. The other HSR travellers are people who switch from a different mode. The main mode of origin depends on the routes considered, the importance of the modes before the introduction of the HSR and the mode characteristics. The review finds that the main modal shift is from conventional rail to HSR, but that for particular routes the shift from air can be large (e.g. for the London to Paris/Lille/Brussels route or the Madrid-Seville HSR line). Considering the modal shares before and after the introduction of HSR (and taking into account induced demand), air transport loses most market share. For HSR travel times up to 3.5 hours, HSRmayhaveamarketshareof50%ormoreintherail-air market. Of course, these impacts on demand also interact with the supply impacts discussed in the previous paragraphs.
Clewlow et al. (2014) analysed the determinants of air passenger traffic between 90 airport pairs in France, Germany, Italy, Spain and the United Kingdom from 1995 to 2009. Taking into account the influence of other factors, such as gross domestic product (GDP), fuel price, hub status of the airport and population density, they found that air transport between domestic city pairs is reduced when HSR is present in the market. The substitution between rail and air is found to also depend on variations in city and airport characteristics. For non-domestic intra-EU travel the presence of HSR also reduces air travel, but not as strongly. The authors point to the fact that in this case city pairs are less likely to be within a distance for which HSR may be an option. The presence of low-cost carriers is found to have a significant positive effect on intra-EU air travel, leading to a substantial net increase in passenger-km travelled. This indicates that a system-wide perspective is required.
Passenger rail and air transport in Europe
18 Transport and environment report 2020 — Train or plane?
Worldwide HSR activity (measured in passenger-km) ishighestinChina,followedbytheEUandJapan.Togethertheyaccountfor95%ofpassenger-kmtravelled by HSR. In 2018, China alone accounted for 71 %(UIC,2020b).InJapan,thecountrywiththelongesttradition in HSR, the market share of HSR has always been larger than that of air transport for routes of less than 600 miles (960 km) (Albalate et al., 2015). This is linked to high frequency, attractive fares, stations located close to city centres and the attention given to safety, reliability and punctuality. For example, for the 550 km long Shinkansen route between Tokyo and Osaka, ECA (2018) reports an average delay of
only24seconds.JiangandLi(2016)furtherexplorethe larger market share of low-cost air carriers in EuropecomparedwithJapanandpointtothefollowingdifferences: (1) HSR was already well established in Japanbeforethearrivaloflow-costcarriers,whereasinEuropetheyemergedinthesameperiod;(2)Europespans a larger area and has more polycentric city development, which creates more opportunities for low-cost carriers and makes it more difficult to provide HSRservicesefficiently;and(3)thereisadifferencein regulatory environment and market conditions, with a relatively more open market attitude in Europe, according to the authors.

19
The environmental impacts of rail and air transport
Transport and environment report 2020 — Train or plane?
3 The environmental impacts of rail and air transport
Key messages
• Environmental pressures arise from activities related to passenger rail and air transport. These include the operation of trains and aircraft, the supply of energy, the transport of travellers to and from the railway station or airport, the auxiliary operations, the up-and-down stream process and maintenance for the trains and aircraft and the construction and maintenance of the infrastructure.
• In addition to negative impacts from air pollution, greenhouse gas emissions and noise, both modes of transport also cause soil and water pollution and habitat damage and produce waste.
• The total environmental costs in the EU-28 of air pollution, climate change, well-to-tank emissions and noise caused byflyingaresubstantiallyhigher(EUR 32.7billionforaselectionof33airports)thanthosecausedbyrailpassengertransport(EUR 7.8billion).Forrailtransport,thenoisecostsandcostsrelatedtowell-to-tankemissionsarethemostimportant. For air transport, the climate change costs (including non-CO2 impacts) are the largest category.
• For new investment in rail to be environmentally beneficial, the environmental impacts from the construction of infrastructure must be compensated for by the reduced environmental impacts made possible by the opening of the new rail link.
3.1 Introduction
Both rail and air travel lead to an increase in several environmental pressures, but their contribution differs. This chapter gives a general overview of the environmental impacts of the two modes. The environmentalpressures(indicatedinlightgreyin Table 3.1) arise from various activities related to rail and air transport. Although the categories
of impacts and activities are largely similar for rail and air, in general the magnitude of the impacts is different. For some of these impacts and activities rail has a better environmental performance than aviation, while for others the opposite is the case or the comparison depends on the specific case that is considered, as will be discussed further in this chapter for the categories indicated in dark grey in Table3.1.

The environmental impacts of rail and air transport
20 Transport and environment report 2020 — Train or plane?
Table 3.1 Overview of activities related to rail and air transport and their environmental impacts
Rail Air
Clim
ate
chan
ge
Air
pol
luti
on
Noi
se
Soil
and
wat
er p
ollu
tion
Hab
itat
dam
age
Visu
al in
trus
ion
Was
te
Environmentalimpactsoftrainridesandflights(Section3.2)
Train/air travelTrain operations
Take-off and landingClimbing outCruisingApproach
Energy production, transmission, distribution
Electricity generation, transmission and distributionDiesel refining and distribution
Jetfuelrefininganddistribution
Environmentalimpactsofrelatedactivities(Section3.3)
Travel to/from stations and airports and system operation
Transport to/from station/airport (Section 3.3.1)
Transport to/from railway stations
Transport to/from airports
Rail/airport operations IdlingAuxiliariesShunting
Auxiliary power unitStart-upTaxiing
Vehicles
Up-and-down stream process (Section 3.3.2)
Manufacturing of trains and propulsion system and end of life
Aircraft and engine manufacturing and end of life
Maintenance Train maintenanceAircraft and engine maintenance
Infrastructure
Construction(Section 3.3.2)Construction of stations and tracks
Construction of airport and runway, taxiway, tarmac and parking
Operation and maintenance (Section 3.3.3)
Operation and maintenance of stations and tracks
Operation and maintenance of airport
De-icing of aircraft and runways
Operation and maintenance of ground support equipment
Note: Lightgrey,environmentalimpacts;darkgrey,mainimpactsdiscussedindetail.
Source: EEA.
The environmental impacts of rail and air transport
21Transport and environment report 2020 — Train or plane?
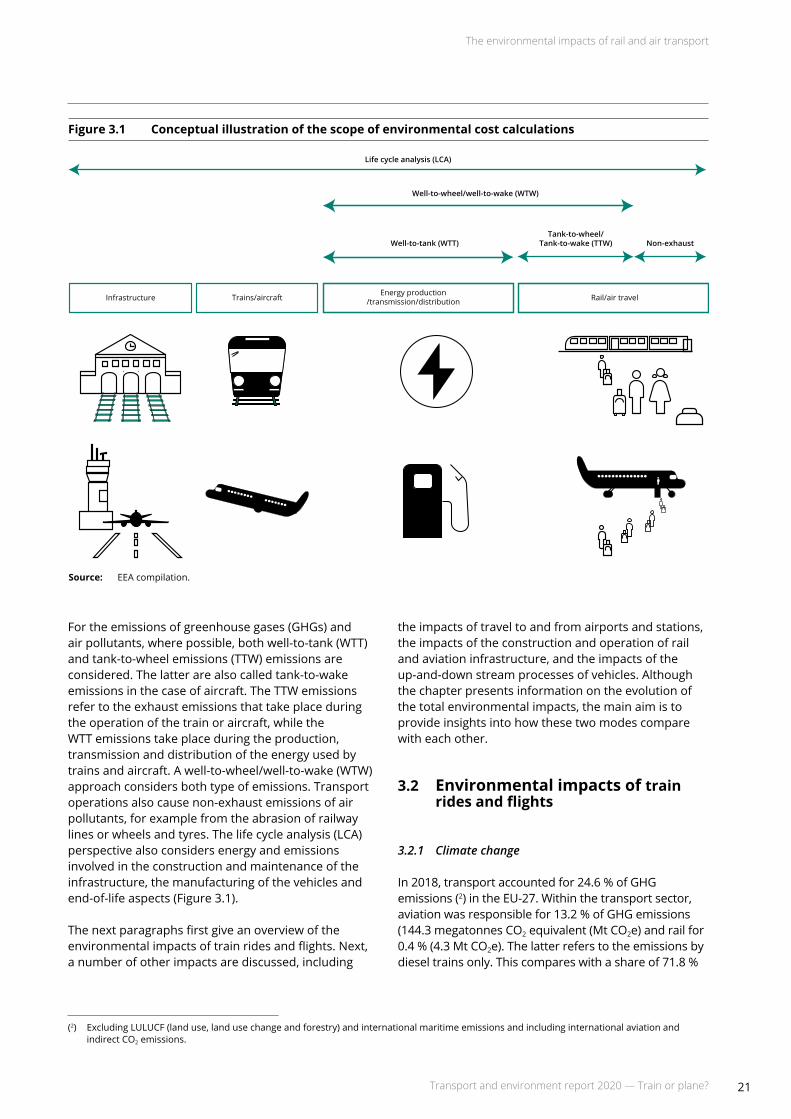
For the emissions of greenhouse gases (GHGs) and air pollutants, where possible, both well-to-tank (WTT) and tank-to-wheel emissions (TTW) emissions are considered. The latter are also called tank-to-wake emissions in the case of aircraft. The TTW emissions refer to the exhaust emissions that take place during the operation of the train or aircraft, while the WTT emissions take place during the production, transmission and distribution of the energy used by trains and aircraft. A well-to-wheel/well-to-wake (WTW) approach considers both type of emissions. Transport operations also cause non-exhaust emissions of air pollutants, for example from the abrasion of railway lines or wheels and tyres. The life cycle analysis (LCA) perspective also considers energy and emissions involved in the construction and maintenance of the infrastructure, the manufacturing of the vehicles and end-of-life aspects (Figure 3.1).
The next paragraphs first give an overview of the environmental impacts of train rides and flights. Next, a number of other impacts are discussed, including
the impacts of travel to and from airports and stations, the impacts of the construction and operation of rail and aviation infrastructure, and the impacts of the up-and-down stream processes of vehicles. Although the chapter presents information on the evolution of the total environmental impacts, the main aim is to provide insights into how these two modes compare witheach other.
3.2 Environmental impacts of train rides and flights
3.2.1 Climate change
In2018,transportaccountedfor24.6 %ofGHGemissions (2) in the EU-27. Within the transport sector, aviationwasresponsiblefor13.2 %ofGHGemissions(144.3 megatonnes CO2equivalent(Mt CO2e) and rail for 0.4 %(4.3 Mt CO2e). The latter refers to the emissions by dieseltrainsonly.Thiscompareswithashareof71.8 %
Figure 3.1 Conceptual illustration of the scope of environmental cost calculations
Source: EEA compilation.
Life cycle analysis (LCA)
Well-to-wheel/well-to-wake (WTW)
Well-to-tank (WTT)Tank-to-wheel/
Tank-to-wake (TTW) Non-exhaust
Infrastructure Trains/aircraft Energy production/transmission/distribution Rail/air travel
(2) Excluding LULUCF (land use, land use change and forestry) and international maritime emissions and including international aviation and indirect CO2 emissions.
The environmental impacts of rail and air transport
22 Transport and environment report 2020 — Train or plane?
forroadtransportandashareof14.1 %fornavigation(EC, 2020b). Apart from these, TTW emissions from rail and air transport also lead to indirect GHG emissions as a result of the production, transport and transmission of the fuels and electricity that they consume. These emissions are called WTT emissions.
Rail transport
For rail transport the TTW GHG emissions are determined by rail travel demand in combination with other factors, including the following:
• the specific energy consumption of the passenger trains(energypervehicle-km);
• thenumberofpassengersonthetrains;
• railtrafficmanagementprocedures;
• the GHG emission intensity of energy consumed by rail.
The specific energy consumption of the passenger trains increases with the train size and weight and depends on the speed and powertrain type. Other things being
equal, electric trains are more energy efficient than diesel trains. For the market segments considered in thisreport,electrictrainsarethemost relevant.
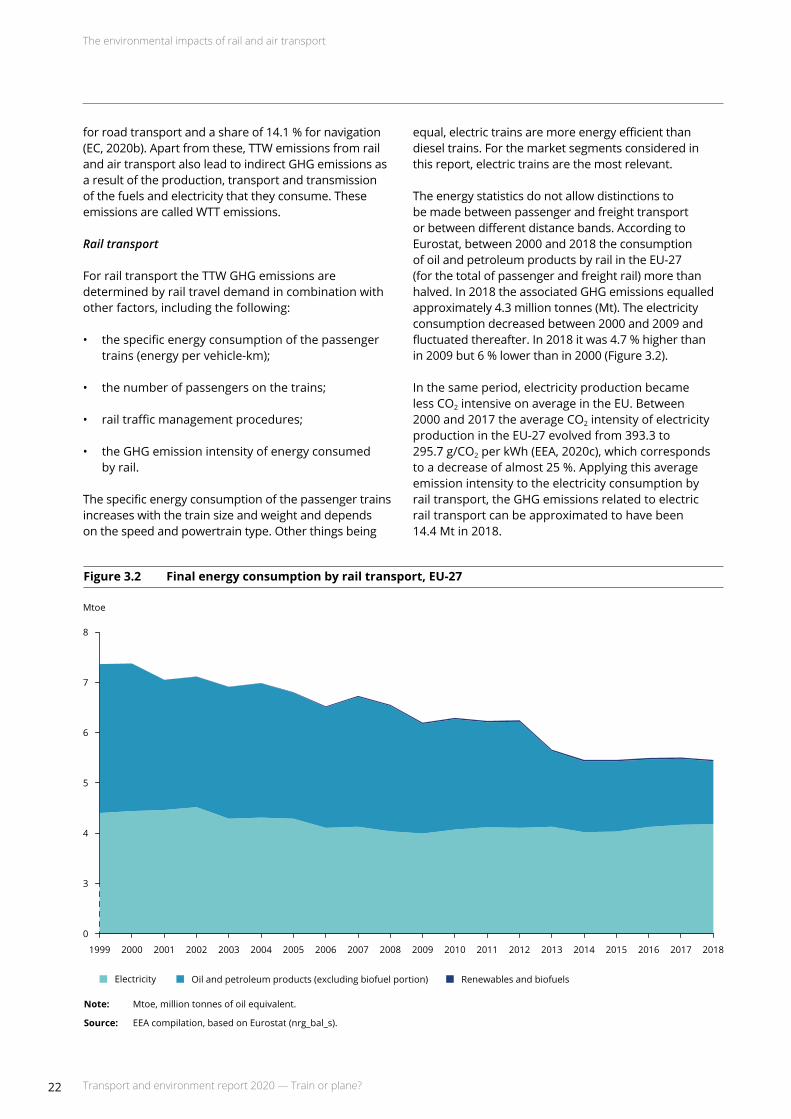
The energy statistics do not allow distinctions to be made between passenger and freight transport or between different distance bands. According to Eurostat, between 2000 and 2018 the consumption of oil and petroleum products by rail in the EU-27 (for the total of passenger and freight rail) more than halved. In 2018 the associated GHG emissions equalled approximately 4.3 million tonnes (Mt). The electricity consumption decreased between 2000 and 2009 and fluctuatedthereafter.In2018itwas4.7 %higherthanin2009but6 %lowerthanin2000(Figure3.2).
In the same period, electricity production became less CO2 intensive on average in the EU. Between 2000 and 2017 the average CO2 intensity of electricity production in the EU-27 evolved from 393.3 to 295.7 g/CO2 per kWh (EEA, 2020c), which corresponds toadecreaseofalmost25 %.Applyingthisaverageemission intensity to the electricity consumption by rail transport, the GHG emissions related to electric rail transport can be approximated to have been 14.4 Mtin2018.
Figure 3.2 Final energy consumption by rail transport, EU-27
Note: Mtoe, million tonnes of oil equivalent.
Source: EEA compilation, based on Eurostat (nrg_bal_s).
3
4
5
6
7
8
0
Mtoe
1999 2000 2001 2002 2003 2004 2005 2006 2007 2008 2009 2010 2011 2012 2013 2014 2015 2016 2017 2018
Electricity Oil and petroleum products (excluding biofuel portion) Renewables and biofuels
The environmental impacts of rail and air transport
23Transport and environment report 2020 — Train or plane?
Air transport
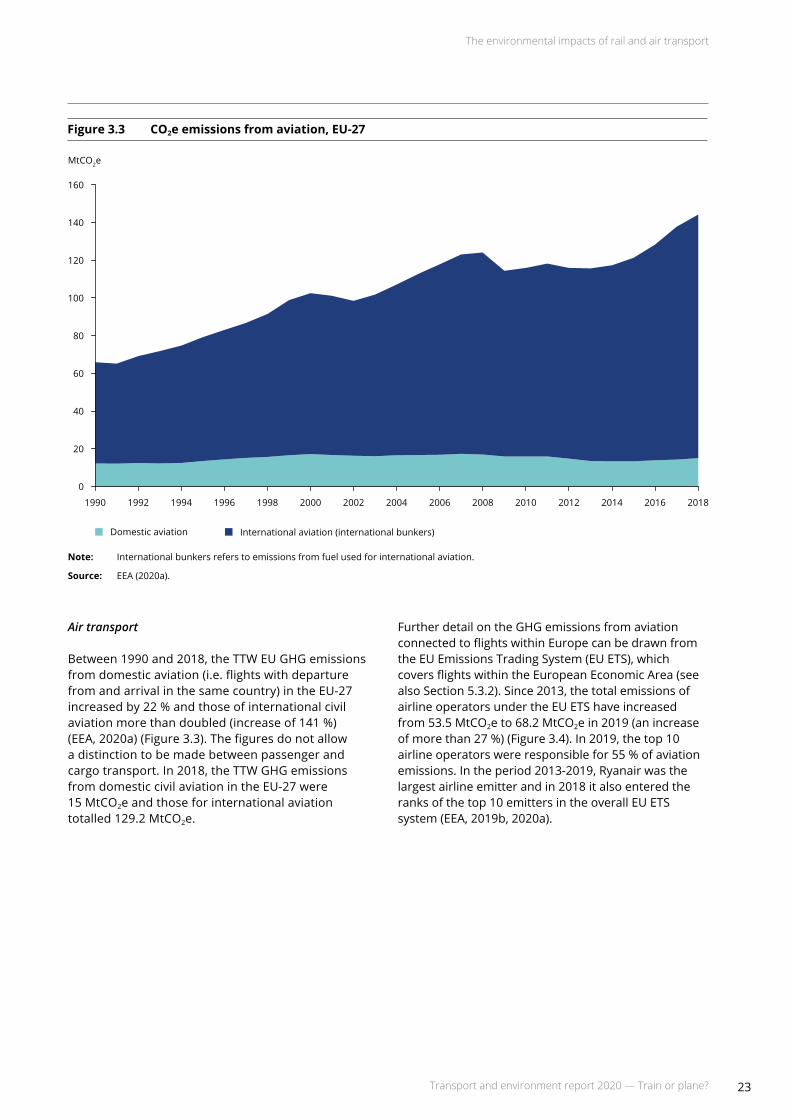
Between 1990 and 2018, the TTW EU GHG emissions from domestic aviation (i.e. flights with departure from and arrival in the same country) in the EU-27 increasedby22 %andthoseofinternationalcivilaviationmorethandoubled(increaseof141 %)(EEA, 2020a) (Figure 3.3). The figures do not allow a distinction to be made between passenger and cargo transport. In 2018, the TTW GHG emissions from domestic civil aviation in the EU-27 were 15 MtCO2e and those for international aviation totalled129.2 MtCO2e.
Further detail on the GHG emissions from aviation connected to flights within Europe can be drawn from theEUEmissionsTradingSystem(EU ETS),whichcovers flights within the European Economic Area (see also Section 5.3.2). Since 2013, the total emissions of airlineoperatorsundertheEU ETShaveincreasedfrom53.5 MtCO2eto68.2 MtCO2e in 2019 (an increase ofmorethan27 %)(Figure3.4).In2019,thetop10airlineoperatorswereresponsiblefor55 %ofaviationemissions. In the period 2013-2019, Ryanair was the largest airline emitter and in 2018 it also entered the ranksofthetop10emittersintheoverallEU ETSsystem (EEA, 2019b, 2020a).
Figure 3.3 CO2e emissions from aviation, EU-27
Note: International bunkers refers to emissions from fuel used for international aviation.
Source: EEA (2020a).
20
40
60
80
100
120
140
160
0
MtCO2e
1990 1992 1994 1996 1998 2000 2002 2004 2006 2008 2010 2012 2014 2016 2018
Domestic aviation International aviation (international bunkers)

The environmental impacts of rail and air transport
24 Transport and environment report 2020 — Train or plane?
The GHG emissions of aviation are determined by the evolution of air transport demand in combination with additional factors, including:
• theenergyefficiencyoftheaircraft;
• theoccupancyrateoftheaircraft;
• airtrafficmanagementandoperations;
• the share of sustainable aviation fuels.
The central outlook for 2040 presented by EASA et al. (2019) for flights departing from the EU-27 and the United Kingdom (UK) and the European Free Trade Association (EFTA) countries projects a growth in CO2 emissions from 21 %to37 %,comparedwith2017,dependingonthetechnological developments. Although the outlook was produced before the COVID-19 outbreak, it still gives an indication of the potential GHG reduction challenges ahead under various scenarios. Even in the low-traffic case, where thenumberofflightsin2040isassumedtobeonly6 %higher than in 2017, there is still a need for further GHG abatement, although emissions are then projected to be
8-18 %lowerthanin2017(dependingonthetechnologicaldevelopments). In the high-demand forecast, the emissions are61-85 %higherin2040thantheywerein2017.
In addition to CO2, aviation also emits short-lived climate forcers, including sulphur dioxide (SO2), nitrogen oxides (NOx) and black carbon, leading to changes in the radiative forcing in the atmosphere. Such pollutants can have both global warming and cooling effects, with the net effect being warming. In addition, sulphate aerosols and water vapour can lead to contrails and cirrus cloud formation, and thereby contribute to net climate warming. Unlike CO2 emissions, the non-CO2 effects differ as a function of the flight altitude, time of day, weather, location, etc. (Scheelhaase et al., 2016). In the recent update of the handbook on the external costs of transport, the European Commission (EC, 2019d) estimated that the non-CO2 effects of aviation contribute about half of the climate warming impact of aviation. The uncertainty about the non-CO2 impacts is larger than for CO2, especially for cloud-induced impacts (Lee, 2018). A recent report by EASA (2020c) fully confirmed the importance of non-CO2 climate impacts from aviation.
Figure3.4 AviationGHGemissionsintheEU ETSandthetop10emittersinaviation(2013-2019)
Notes: Fortheperiod2013-2019,onlyflightswithintheEuropeanEconomicAreawereundertheEU ETS.FlightsbetweenthecontinentalEuropean Economic Area and its outermost regions were also exempt.
Source: EEA.
10
20
30
40
50
60
70
0
MtCO2e
2013 2014 2015 2016 2017 2018 2019
OthersKLMVueling Airlines, S.A.Eurowings GmbHWizz Air
SASAir FranceBritish AirwaysDeutsche Lufthansa AGEasyjetRyanair

The environmental impacts of rail and air transport
25Transport and environment report 2020 — Train or plane?
3.2.2 Air pollution
Figure 3.5 presents the contribution in 2018 of rail (diesel trains) and air transport to the emissions of air pollutants for all of the 32 member countries of the EEA asof1 February2020(EEA-32).
Rail transport
Rail transport generates TTW emissions of air pollutants via the operation of diesel trains. Both diesel and electric trains also cause non-exhaust particulate matter (PM) emissions via the abrasion of powerlines, wheels on tracks and brakes. The share of diesel trains in total emissions in the EEA-32 is limited. The WTT emissions caused by the production and transmission of electricity for electric trains, which are more relevant for the market segments considered in this report, are not included in Figure 3.5, as they are not reported separately in the emission inventories.
Air transport
Air transport emits several air pollutants during taxiing, take-off and landing, and cruising at altitude.
The TTW emissions of air pollutants by aviation are determined by the evolution of air transport demand in combination with additional factors, including:
• the energy efficiency and the abatement technologiesoftheaircraft;
• theoccupancyrateoftheaircraft;
• air traffic management and operational measures.
The share of aviation in the total emissions of air pollutants in the EEA-32 is relatively small. For 2018, the largest share was found for NOx emissions, to whichairtransportcontributes5.5 %(Figure3.5).Theshare of domestic aviation in the emissions from air transportrangesbetween12 %and30 %dependingonthe pollutant that is considered (Table 3.2). The share of landing and take-off (LTO) in the aviation emissions is the largest for non-methane volatile organic compounds(NMVOC)(39 %),followedbyPM(26 %)andNOx and SOx(15 %).
Figure3.5 Shareofairpollutantemissionsbyrail(diesel)andcivilaviationintotalemissions,EEA-32,2018
Notes: Shareintotalemissions,includingmemoitems;thecivilaviationemissionsincludeemissionsduringlanding,take-offandcruise.CO,carbonmonoxide;NMVOC,non-methanevolatileorganiccompounds;PM2.5,particulatematterwithadiameterof2.5 μmorless;PM10, particulatematterwithadiameterof10 μmorless.
Source: EEA (LRTAP).
Percentage shares
1
2
3
4
5
6
0
CO NMVOC NOx PM2.5 SOxPM10
Domestic aviation International aviation Rail (diesel)
0.40.1
0.7
0.1 0.1 0.1
1.9
0.2
5.5
0.60.4
0.6
0.1 0.0
0.70.5
0.6
0.0

The environmental impacts of rail and air transport
26 Transport and environment report 2020 — Train or plane?
Table 3.2 Share of domestic aviation and landing and take-off in emissions of air pollutants by aviation,EEA-32, 2018
PollutantShare of domestic aviation in
aviation emissions(%)Share of landing and take-off emissions in
totalaviationemissions(%)
CO 16 24
NMVOC 30 39
NOx 12 15
PM2.5 14 26
PM10 14 26
SOx 13 15
Note: PM2.5,particulatematterwithadiameterof2.5 μmorless;PM10,particulatematterwithadiameterof10 μmorless.
Source: EEA (LRTAP).
The WTT emissions from air transport also contribute to air pollution. These are the emissions related to the production and transport of jet fuel. These emissions occur at locations other than where the transport activities take place and hence have a different impact on health and the environment.
Impacts of air pollution
The health impacts of air pollutants depend on several factors, including the altitude at which pollutants are emitted. The largest health effects are related to air pollution concentrations at ground level in areas with a high population density. The concentration levels depend on the emissions of air pollutants by the different sectors, atmospheric transformations and meteorological conditions. Emissions at higher altitudes of SOx, NOx and black carbon also lead to climate change impacts (see Section 3.2.1). Air pollution also leads to damage to materials and buildings, crop losses in the agricultural sector and adverse impacts on nature and biodiversity.
3.2.3 Noise impacts
Rail transport and aviation are the second and third sources of environmental noise in Europe. Rail has an impact during the entire trajectory, while the impacts of air traffic mostly occur during LTO. Data submitted by countriesundertheEnvironmentalNoiseDirective (END)(EU, 2002) give an insight into noise exposure for roads, railways, airports and industry within agglomerations, as well as for major roads, major railways and major airports outside agglomerations.
Rail transport
About 20 million people in the EEA-32 (excluding Turkey) are estimated to be exposed to rail traffic noise of at least 55 decibels (dB) during the
day-evening-night period (day-evening-night-level indicator of noise — Lden) (Figure 3.6). Half of these people are exposed within urban areas and the other half outside urban areas. Nearly 16 million people areaffectedbynight-timerailnoiseof50 dBLnight (night-level indicator of noise) and higher, of which 8.6 millionpeopleoutsideurbanareas.Thismeansthatabout4.3 %ofthepopulationisaffectedbyrail traffic noise levels that exceed the thresholds of the END during the day-evening-night period and 3.4 %duringthenight-timeperiod(2020b).Thesefigurescoverbothpassengerandfreightrail;forrailpassenger transport they do not make a distinction betweenshort-andlong-distance transport.
Air transport
The END defines air traffic noise as noise caused by aircraft LTOs in the areas surrounding airports. Population exposure to aircraft noise is estimated through the calculation of noise contours around airports, which correspond with areas in which the noise exceeds a given level, and by determining the size of the population within these areas. According to the data collected for major airports under the END, it is estimatedfortheEEA-32thatapproximately2 millionpeople in urban areas are exposed to air traffic noise levelsofatleast55 dBduringtheday-evening-nightperiodand0.8 millionpeopleduringthenightperiod.Outsideurbanareas,thefiguresare0.9and0.3 million,respectively (EEA (2020b), excluding UK data). The number of people exposed to air traffic noise is smaller than for rail, but the annoyance response to air traffic noise is larger than for rail noise at the same noise levels (WHO Europe, 2018). Moreover, new evidence from the World Health Organization (WHO) shows that the annoyance response to air traffic noise has increased over time and is higher than indicated by exposure-response functions based on older data (EEA, 2020b).
The environmental impacts of rail and air transport
27Transport and environment report 2020 — Train or plane?
Health impacts of exposure to noise
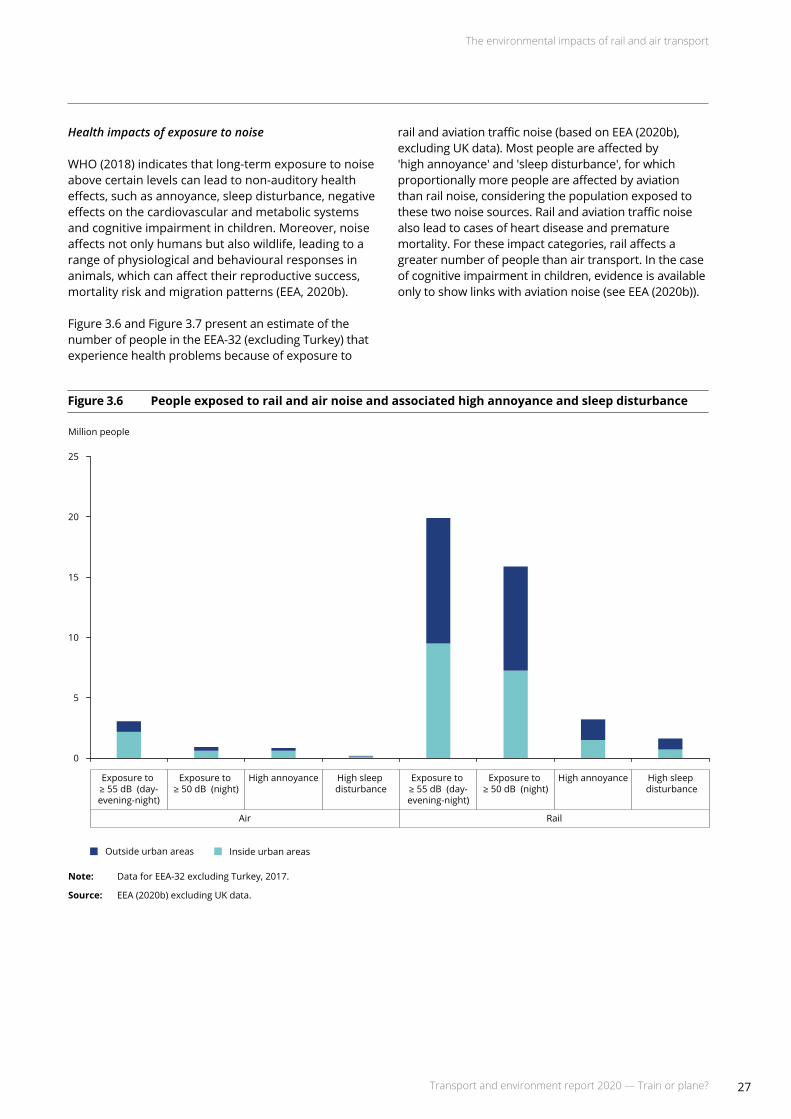
WHO (2018) indicates that long-term exposure to noise above certain levels can lead to non-auditory health effects, such as annoyance, sleep disturbance, negative effects on the cardiovascular and metabolic systems and cognitive impairment in children. Moreover, noise affects not only humans but also wildlife, leading to a range of physiological and behavioural responses in animals, which can affect their reproductive success, mortality risk and migration patterns (EEA, 2020b).
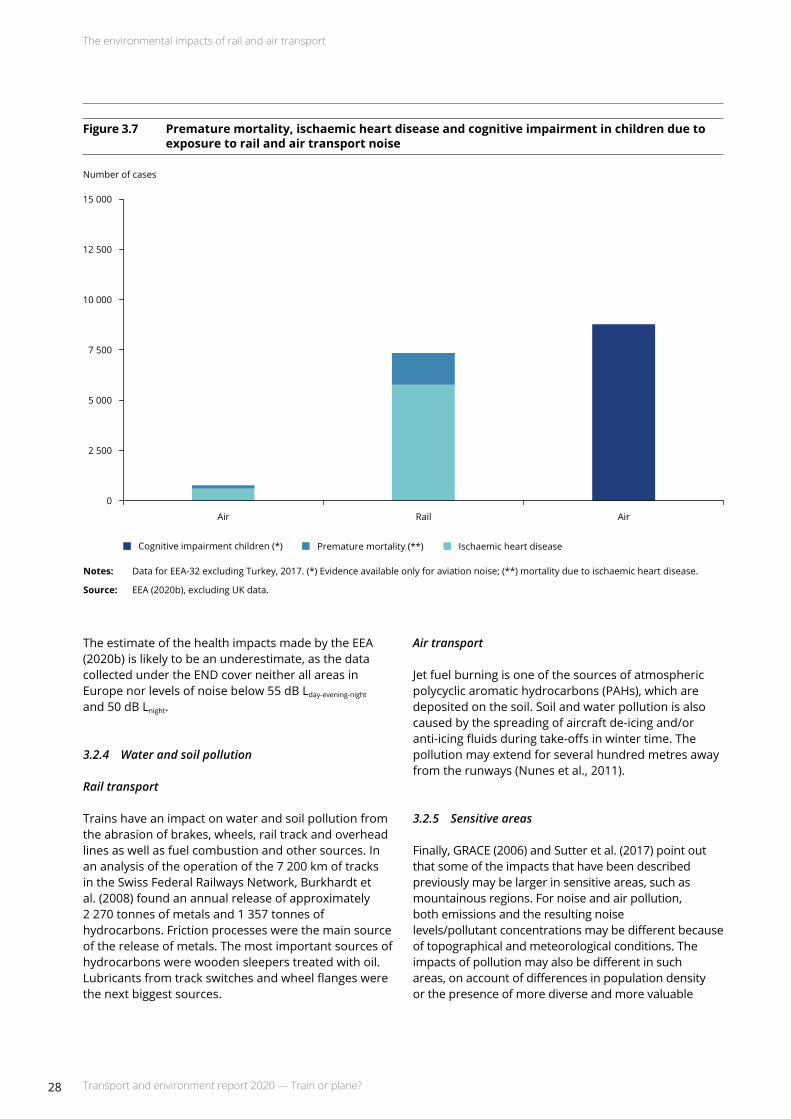
Figure 3.6 and Figure 3.7 present an estimate of the number of people in the EEA-32 (excluding Turkey) that experience health problems because of exposure to
rail and aviation traffic noise (based on EEA (2020b), excluding UK data). Most people are affected by 'high annoyance' and 'sleep disturbance', for which proportionally more people are affected by aviation than rail noise, considering the population exposed to these two noise sources. Rail and aviation traffic noise also lead to cases of heart disease and premature mortality. For these impact categories, rail affects a greater number of people than air transport. In the case of cognitive impairment in children, evidence is available only to show links with aviation noise (see EEA (2020b)).
Figure 3.6 People exposed to rail and air noise and associated high annoyance and sleep disturbance
Note: Data for EEA-32 excluding Turkey, 2017.
Source: EEA (2020b) excluding UK data.
Million people
5
10
15
20
25
0
Exposure to ≥ 55 dB (day-evening-night)
Outside urban areas Inside urban areas
Exposure to ≥ 50 dB (night)
High annoyance High sleep disturbance
Exposure to ≥ 50 dB (night)
Exposure to ≥ 55 dB (day-evening-night)
High annoyance High sleep disturbance
Air Rail
The environmental impacts of rail and air transport
28 Transport and environment report 2020 — Train or plane?
The estimate of the health impacts made by the EEA (2020b) is likely to be an underestimate, as the data collected under the END cover neither all areas in Europenorlevelsofnoisebelow55 dB Lday-evening-night and 50 dB Lnight.
3.2.4 Water and soil pollution
Rail transport
Trains have an impact on water and soil pollution from the abrasion of brakes, wheels, rail track and overhead lines as well as fuel combustion and other sources. In ananalysisoftheoperationofthe7 200 kmoftracksin the Swiss Federal Railways Network, Burkhardt et al. (2008) found an annual release of approximately 2 270 tonnesofmetalsand1 357tonnesofhydrocarbons. Friction processes were the main source of the release of metals. The most important sources of hydrocarbons were wooden sleepers treated with oil. Lubricants from track switches and wheel flanges were thenextbiggest sources.
Figure 3.7 Premature mortality, ischaemic heart disease and cognitive impairment in children due to exposure to rail and air transport noise
Notes: DataforEEA-32excludingTurkey,2017.(*)Evidenceavailableonlyforaviationnoise;(**)mortalityduetoischaemicheartdisease.
Source: EEA (2020b), excluding UK data.
Number of cases
2 500
5 000
7 500
10 000
12 500
15 000
0
Air Rail Air
Cognitive impairment children (*) Premature mortality (**) Ischaemic heart disease
Air transport
Jetfuelburningisoneofthesourcesofatmosphericpolycyclic aromatic hydrocarbons (PAHs), which are deposited on the soil. Soil and water pollution is also caused by the spreading of aircraft de-icing and/or anti-icing fluids during take-offs in winter time. The pollution may extend for several hundred metres away from the runways (Nunes et al., 2011).
3.2.5 Sensitive areas
Finally, GRACE (2006) and Sutter et al. (2017) point out that some of the impacts that have been described previously may be larger in sensitive areas, such as mountainous regions. For noise and air pollution, both emissions and the resulting noise levels/pollutant concentrations may be different because of topographical and meteorological conditions. The impacts of pollution may also be different in such areas, on account of differences in population density or the presence of more diverse and more valuable
The environmental impacts of rail and air transport
29Transport and environment report 2020 — Train or plane?
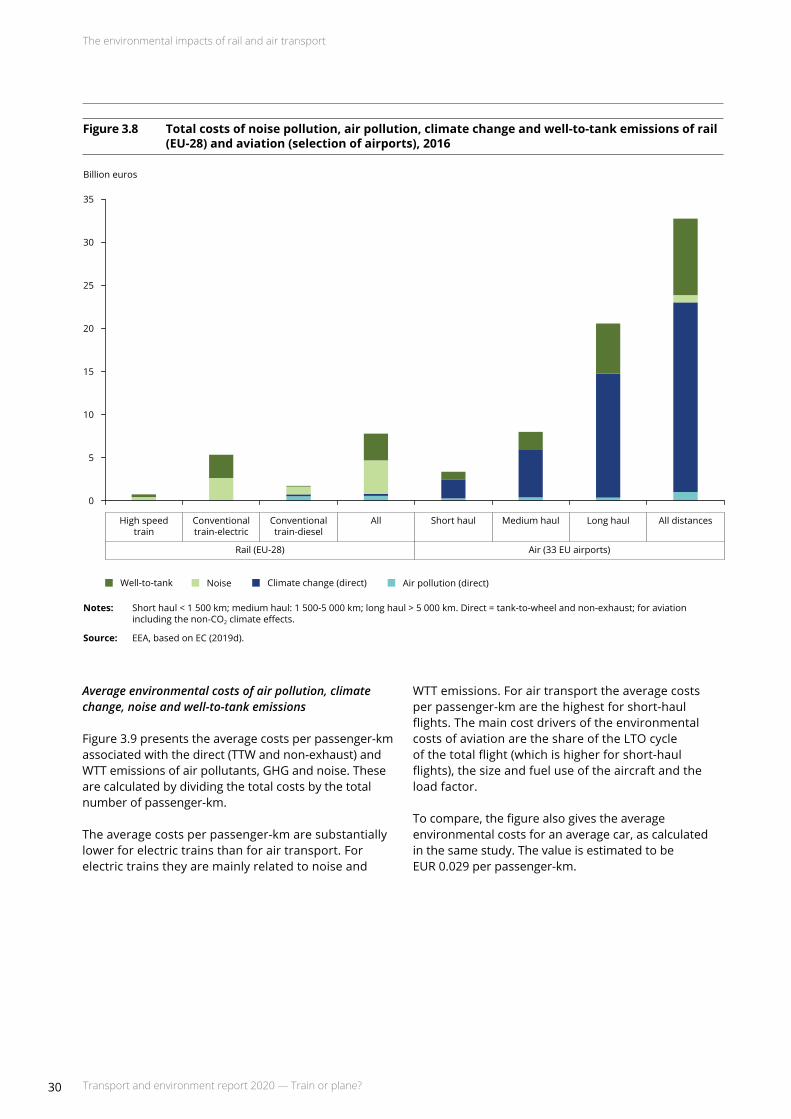
Including the other environmental impacts, and extrapolating to all air transport in the EU, results inatotalenvironmentalcostofEUR 48billionforaviation (for both passenger and freight transport) and EUR 10.4 billionforrailpassengertransport.
For rail transport, the noise costs and costs related to WTT emissions are the most important. The WTT category that is reported includes the costs from the WTT emissions of both GHG and air pollutants. Although high-speedrail(HSR)accountsforabout27 %ofEU-28rail travel (see Section 2.2), its environmental costs are about9.4 %ofthecostsforpassengerrailintotal.Thisis because electric trains are more energy efficient than diesel trains. Although high-speed trains have a higher electricity consumption per train-km than conventional electric trains they have a larger capacity and they can transport more passengers per train.
For air transport, the main costs are related to the TTW GHG emissions, followed by the WTT emissions (in this case of both GHG and air pollutants). For air pollution and climate change, the costs of air transport (Figure 3.8)makesadistinctionbetweenshort-,medium- and long-haul flights. For the noise costs of air transport, this distinction cannot be made and the costs are reported for all flights. The direct air pollution costs of aviation are relatively small compared with the other cost categories. According to the Commission (EC, 2019d),theyconsistmainlyofcostsrelatedtotheLTO of aircraft, as the cruising emissions lead to almost no air pollution damage.
The study also considers the climate effects of non-CO2 emissions by aviation. More specifically, the total climate change costs of aviation are calculated by multiplying the total CO2e emissions from an aircraft by afactorof2.
ecosystems. Finally, the monetary value of the impacts may also differ from the EU average, depending on the country where these sensitive areas are located.
3.2.6 Environmental costs of train rides and flights
The previous sections have given an overview of the main environmental impacts of train rides and flights. This section evaluates the overall impacts of the WTT and TTW emissions of air pollutants and GHG, and the noise costs, by expressing them in monetary terms. This sheds light on the relative importance of the various impact categories as well as that of the costs of rail versus air travel.
It draws upon a recent study for the European Commission (EC, 2019d) that aims to provide information on how to generate state-of-the-art estimates for all main external costs of transport, including the environmental costs. The costs presented below are expressed in euros at average EU-28 prices in 2016. For the monetary evaluation of the GHG emissions the results reported here are based on a valueofEUR 100pertonneofCO2e. For aviation the costs relate to a selection of 33 airports in the EU, which accountforslightlymorethan50 %oftotalpassengerscarried by the main airports in the EU.
Total costs of air pollution, climate change, noise and well-to-tank emissions
The total costs of air pollution, climate change, noise and WTT emissions are higher for the selection of airports(EUR 32.7 billioneuro)thanfortotalpassengerrailintheEU-28(EUR 7.8billion)(Figure3.8).Thesefigures for air and rail transport compare with a cost of EUR 161.2billionforroadpassengertransport.
The environmental impacts of rail and air transport
30 Transport and environment report 2020 — Train or plane?
Average environmental costs of air pollution, climate change, noise and well-to-tank emissions
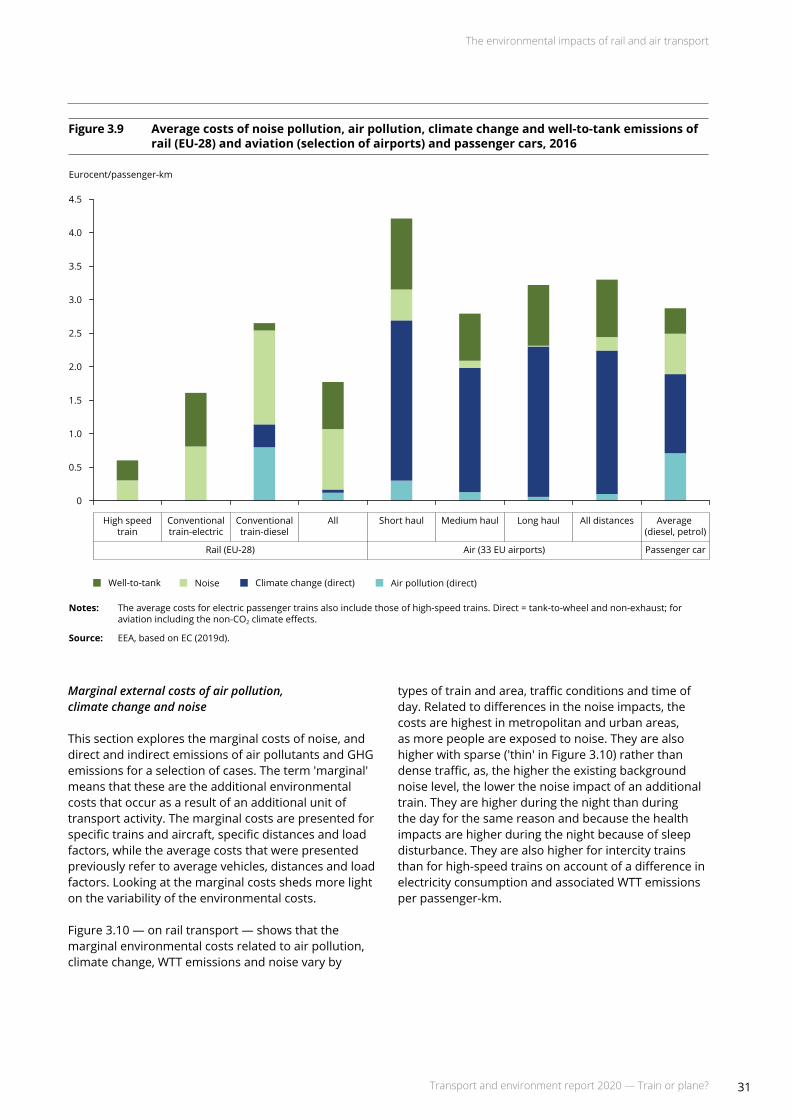
Figure 3.9 presents the average costs per passenger-km associated with the direct (TTW and non-exhaust) and WTT emissions of air pollutants, GHG and noise. These are calculated by dividing the total costs by the total number of passenger-km.
The average costs per passenger-km are substantially lower for electric trains than for air transport. For electric trains they are mainly related to noise and
Figure 3.8 Total costs of noise pollution, air pollution, climate change and well-to-tank emissions of rail (EU-28)andaviation(selectionofairports),2016
Notes: Shorthaul< 1 500 km;mediumhaul:1 500-5 000 km;longhaul> 5 000 km.Direct = tank-to-wheelandnon-exhaust;foraviationincluding the non-CO2climateeffects.
Source: EEA, based on EC (2019d).
WTT emissions. For air transport the average costs per passenger-km are the highest for short-haul flights. The main cost drivers of the environmental costs of aviation are the share of the LTO cycle of the total flight (which is higher for short-haul flights), the size and fuel use of the aircraft and the load factor.
To compare, the figure also gives the average environmental costs for an average car, as calculated in the same study. The value is estimated to be EUR 0.029perpassenger-km.
Billion euros
5
10
15
25
20
30
35
0
High speedtrain
Conventionaltrain-electric
Conventionaltrain-diesel
All Medium haulShort haul Long haul All distances
Rail (EU-28) Air (33 EU airports)
Well-to-tank Noise Climate change (direct) Air pollution (direct)
The environmental impacts of rail and air transport
31Transport and environment report 2020 — Train or plane?
Marginal external costs of air pollution, climate change and noise
This section explores the marginal costs of noise, and direct and indirect emissions of air pollutants and GHG emissions for a selection of cases. The term 'marginal' means that these are the additional environmental costs that occur as a result of an additional unit of transport activity. The marginal costs are presented for specific trains and aircraft, specific distances and load factors, while the average costs that were presented previously refer to average vehicles, distances and load factors. Looking at the marginal costs sheds more light on the variability of the environmental costs.
Figure 3.10 — on rail transport — shows that the marginal environmental costs related to air pollution, climate change, WTT emissions and noise vary by
Figure 3.9 Average costs of noise pollution, air pollution, climate change and well-to-tank emissions of rail(EU-28)andaviation(selectionofairports)andpassengercars,2016
Notes: Theaveragecostsforelectricpassengertrainsalsoincludethoseofhigh-speedtrains.Direct = tank-to-wheelandnon-exhaust;foraviation including the non-CO2climateeffects.
Source: EEA, based on EC (2019d).
types of train and area, traffic conditions and time of day. Related to differences in the noise impacts, the costs are highest in metropolitan and urban areas, as more people are exposed to noise. They are also higher with sparse ('thin' in Figure 3.10) rather than dense traffic, as, the higher the existing background noise level, the lower the noise impact of an additional train. They are higher during the night than during the day for the same reason and because the health impacts are higher during the night because of sleep disturbance. They are also higher for intercity trains than for high-speed trains on account of a difference in electricity consumption and associated WTT emissions per passenger-km.
Eurocent/passenger-km
0.5
1.0
1.5
3.0
2.0
4.0
4.5
2.5
3.5
0
Well-to-tank Noise Climate change (direct) Air pollution (direct)
High speedtrain
Conventionaltrain-electric
Conventionaltrain-diesel
All Medium haulShort haul Long haul All distances Average (diesel, petrol)
Rail (EU-28) Air (33 EU airports) Passenger car
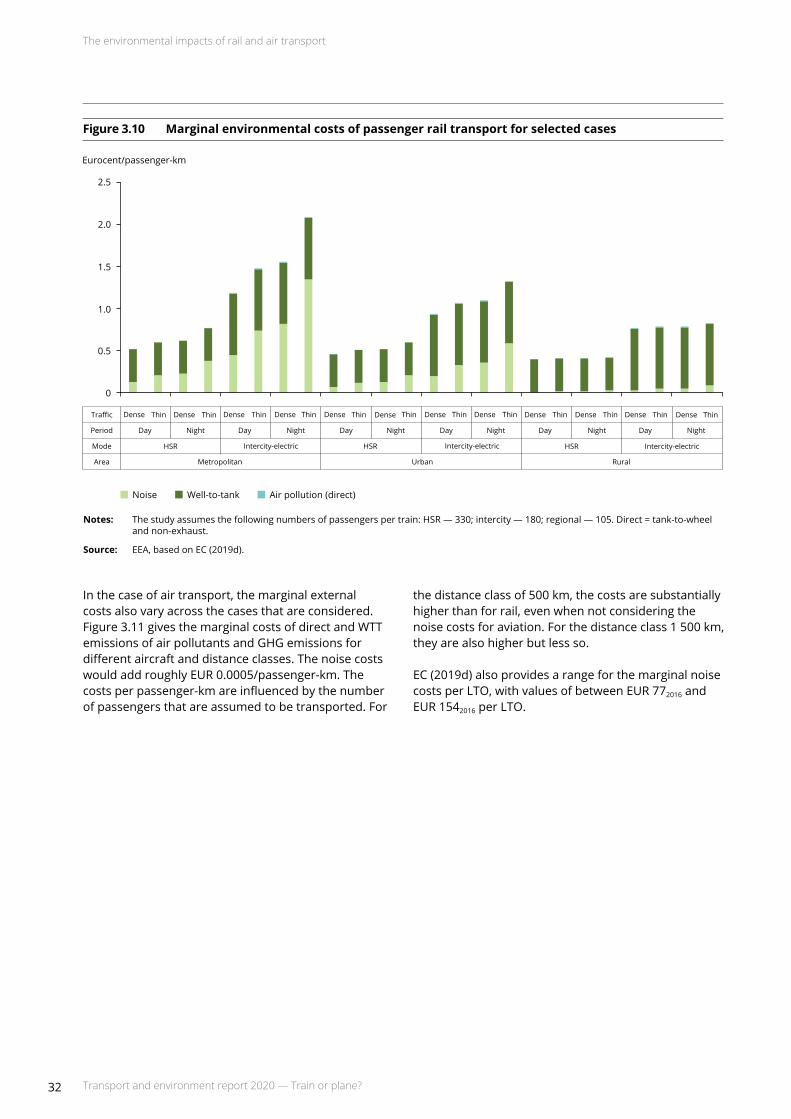
The environmental impacts of rail and air transport
32 Transport and environment report 2020 — Train or plane?
In the case of air transport, the marginal external costs also vary across the cases that are considered. Figure 3.11 gives the marginal costs of direct and WTT emissions of air pollutants and GHG emissions for different aircraft and distance classes. The noise costs wouldaddroughlyEUR 0.0005/passenger-km.Thecosts per passenger-km are influenced by the number of passengers that are assumed to be transported. For
Figure 3.10 Marginal environmental costs of passenger rail transport for selected cases
Notes: Thestudyassumesthefollowingnumbersofpassengerspertrain:HSR—330;intercity—180;regional—105.Direct = tank-to-wheeland non-exhaust.
Source: EEA, based on EC (2019d).
Noise Well-to-tank Air pollution (direct)
2.0
2.5
1.5
1.0
0.5
Eurocent/passenger-km
0
ThinDense ThinDense ThinDense ThinDense ThinDense ThinDense ThinDense ThinDense ThinDense ThinDense ThinDense ThinDense
HSR Intercity-electric
Metropolitan
NightDay Day Night Day
Intercity-electric
Period
Mode
Traffic
Area Rural
NightDayDay Day Night
Urban
HSR
Night
Intercity-electric
Night
HSR
thedistanceclassof500 km,thecostsaresubstantiallyhigher than for rail, even when not considering the noisecostsforaviation.Forthedistanceclass1 500 km,they are also higher but less so.
EC (2019d) also provides a range for the marginal noise costsperLTO,withvaluesofbetweenEUR 772016 and EUR 1542016 per LTO.

The environmental impacts of rail and air transport
33Transport and environment report 2020 — Train or plane?
3.3 Environmental impacts of related activities
For a complete comparison of the environmental impacts of rail and aviation it is important to consider the impacts not only of rail and air travel itself but also of the related activities, of which an overview was given in Table 3.1. Some elements are highlighted below.
3.3.1 Environmental impacts of travel to and from railway stations and airports
Taking a door-to-door perspective, the environmental costs of rail and air travel should also consider the environmental costs of travelling to and from the railway station and airport. Depending on the location of the railway stations and airports and their accessibility via public transport, the environmental costs of these trips may differ. The environmental impacts of different modes for first and last mile transport were discussed in last year's transport and environment report (EEA, 2019c).
Figure 3.11 Marginal costs of air pollution, climate change and well-to-tank emissions of passenger air transport for selected cases
Notes: Thestudyassumesthefollowingnumberofpassengersperaircraft:BombardierCRJ900—67;Embraer170(ERJ-170-100)—57;AirbusA320-232—139;Boeing737-700—108;AirbusA340-300—280;Boeing777-300ER—373.Direct = tank-to-wheelandnon-exhaust;foraviation including the non-CO2climateeffects.
Source: EEA, based on EC (2019d).
3.3.2 Up- and downstream impacts of vehicles and infrastructure
Trains, aircraft and auxiliary vehicles
The life cycle of vehicles consists of production, maintenance, repair and disposal. Throughout this life cycle, negative environmental impacts arise, related to the emissions of air pollutants, GHGs and other pollutants. These impacts are related mainly to aircraft and trains but also to auxiliary equipment. For example, aviation requires ground support activities, for which various types of equipment are used, such as auxiliary power units, fuel trucks, aircraft tugs and belt loaders. Rail transport requires machines and vehicles for tasks such as shunting, track treatment and infrastructure monitoring.
As an example of the life cycle costs of vehicles, Figure 3.12presentsresultsfromastudyby(Liu et al., 2016),whouseanLCAtoestimatetheenergy and emissions from nearly 430 manufacturing activities for the production of aircraft. These activities
Air pollution (direct) Climate change (direct)
Eurocent/passenger-km
500 km 1 500 km 3 000 km 5 000 km 15 000 km
Well-to-tank
Embraer 170 Airbus 320 Boeing 737 Airbus 320 Boeing 737 Airbus 340 Boeing 777 Airbus 340 Boeing 777BombardierCRJ900
0
1
2
3
4
6
5
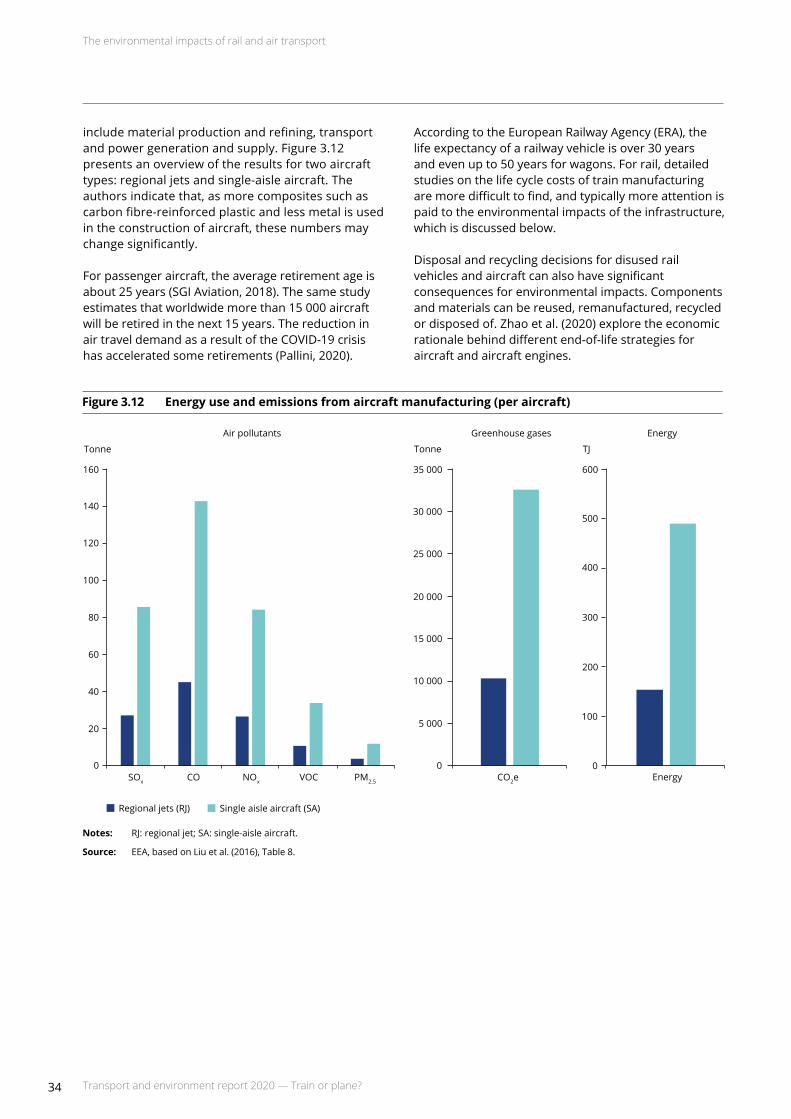
The environmental impacts of rail and air transport
34 Transport and environment report 2020 — Train or plane?
include material production and refining, transport and power generation and supply. Figure 3.12 presents an overview of the results for two aircraft types: regional jets and single-aisle aircraft. The authorsindicatethat, asmorecompositessuchascarbon fibre-reinforced plastic and less metal is used in the construction of aircraft, these numbers may change significantly.
For passenger aircraft, the average retirement age is about 25 years (SGI Aviation, 2018). The same study estimatesthatworldwidemorethan15 000aircraftwill be retired in the next 15 years. The reduction in air travel demand as a result of the COVID-19 crisis has accelerated some retirements (Pallini, 2020).
Figure3.12 Energyuseandemissionsfromaircraftmanufacturing(peraircraft)
Notes: RJ:regionaljet;SA:single-aisleaircraft.
Source: EEA, based on Liu et al. (2016), Table 8.
Regional jets (RJ) Single aisle aircraft (SA)
SOx
0
20
40
60
100
120
160
140
80
CO NOx VOC PM2.5 CO2e
Tonne
0
5 000
10 000
15 000
25 000
35 000
30 000
20 000
Tonne
Energy
TJ
0
100
200
300
400
600
500
Air pollutants Greenhouse gases Energy
According to the European Railway Agency (ERA), the life expectancy of a railway vehicle is over 30 years and even up to 50 years for wagons. For rail, detailed studies on the life cycle costs of train manufacturing are more difficult to find, and typically more attention is paid to the environmental impacts of the infrastructure, which is discussed below.
Disposal and recycling decisions for disused rail vehicles and aircraft can also have significant consequences for environmental impacts. Components and materials can be reused, remanufactured, recycled or disposed of. Zhao et al. (2020) explore the economic rationale behind different end-of-life strategies for aircraft and aircraft engines.

The environmental impacts of rail and air transport
35Transport and environment report 2020 — Train or plane?
Infrastructure
Similar to vehicles, the life cycle of rail and air infrastructure (e.g. stations, airports, railway tracks, rail control centres) consists of the construction, maintenance and disposal of infrastructures. Each of these stages has environmental impacts.
For air transport, GHG emissions are embedded in the construction and expansion of airports. For example, in the comparison of three schemes for the expansion of UK airport capacity, the CO2e emissions related to the construction of airport facilities and surface access infrastructurewerefoundtorangefrom3.9 Mt CO2e (LondonGatwicksecondrunway)to11.3 Mt CO2e (London Heathrow north-west runway), depending on the magnitude of the construction programme (UK DepartmentforTransport,2018).
For rail, the literature has paid a lot of attention to the emissions that are embedded in the construction and maintenance of rail (including HSR) lines and the extent to which these can be offset by lower emissions of rail transport compared with the modes it replaces. A review of four HSR lines for the International Union
of Railways (UIC) by Baron et al. (2011) finds that the carbon footprint of the construction of HSR lines rangesfrom96to270 t CO2 per km of track per year. For the HSR project in the Basque Country in Spain, a recent study by Bueno et al. (2017) found a footprint of251 t CO2 per km of track per year, which is at the high end of this range. This is due to the high number of tunnels and viaducts that are needed for the line. In an LCA for the Tours-Bordeaux high-speed line, de Bortoli et al. (2020) presented various environmental indicators and the extent to which individual construction components and activities contribute to them. Figure 3.13 shows that major contributions to the GHG emissions for that project come from roadbed (22 %)andrails(21 %),followedbytheimpactsrelatedtoviaducts(14 %),ballast(11 %)andsleepers(10 %).Smaller contributors are construction stage transport, building machines, the power supply system and chairs and fasteners. In general these impacts are very project specific and depend on, for example, the terrain, which has implications for the civil engineering structures that are required, the type of tracks (gravel bed tracks versus ballastless tracks — the latter having higher embedded emissions in construction but less maintenance),etc.
Figure 3.13 Contribution of infrastructure components to the life cycle GHG emissions of single-track construction for the Tours-Bordeaux high-speed line
Source: EEA, based on de Bortoli et al. (2020).
Roadbed Machines Ballast Sleepers Rails Chairs and fasteners Energy system Viaducts Transport
21 %
10 %
11 %
1 %
5 %
14 %
9 %
22 %
7 %

The environmental impacts of rail and air transport
36 Transport and environment report 2020 — Train or plane?
For new investments in rail to be environmentally beneficial, the environmental impacts embedded in the construction and maintenance must be compensated for by the reduced environmental impacts made possible by the opening of the new rail link.
Based on Westin and Kågeson (2012) and the International Energy Agency (IEA) (2019), the net impact on GHG emissions of opening a new HSR line depends on the following:
• the GHG intensity of the construction and maintenanceoftheinfrastructure;
• the difference in GHG emissions per passenger-km betweenrailtravelandthemodesthatitreplaces;
• the volume of rail traffic: both new traffic and traffic divertedfromothermodes;
• the extent to which the new line frees capacity on existing lines.
Regarding this last point, freeing capacity on existing lines would allow for an even larger modal shift towards rail transport, for both passenger and freight transport, with the associated reduction in emissions.
The IEA (2019) identifies cases where a new HSR line can almost immediately lead to net reductions in GHG emissions. These are cases with low GHG emission intensity in the construction of the line, low WTW GHG emissions of rail, a high diversion of traffic from GHG-intensive modes and a high occupancy rate for rail. However, in cases with low potential, where the opposite of these conditions applies, it can take more than 50 years before a net reduction in GHG emissions is realised.
The construction and operation of airports, stations and railway lines also has an impact on land use. Impacts are both direct, through the uptake of land by the hubs and infrastructure themselves, and indirect, through the land development projects that are induced by their presence. Additional land take causes habitat damage and fragmentation, leading to adverse effects on ecosystems and biodiversity. In the case of railway lines, barrier
effects arise in the form of physical and behavioural barriers to wildlife movement, as well as disturbance to populations living close to them, on account of noise, vibrations, chemical pollution and human presence. Mortality among animals trying to cross the infrastructure is another — and most visible — manifestation of the barrier effect. However, the magnitude of the effects is still not very well known (Barrientos and Borda de Agua, 2017). Other impacts of the infrastructures are visual intrusion, soil sealing and soil and water pollution from the use of herbicides. The recently published EU Taxonomy report, in its list of assessment criteria for the 'do no significant harm' assessment of the construction of land infrastructure (which includes railway infrastructure), also identified the following other types of potential environmentalharm(EU TechnicalExpertGrouponSustainable Finance, 2020):
• contamination of water during construction and unsustainable use of water during construction and operations;
• unsustainable use of resources during construction, e.g. generating large amounts of waste, no recycling/reuseofconstructionwaste;
• noise pollution as a result of the poor condition of railtracks;
• change and degradation of hydromorphological conditions of water bodies as a result of railway infrastructure (in particular tunnels), affecting aquaticecosystems;
• thespreadofinvasiveplants(suchasJapaneseknotweed) along transport infrastructure.
A number of studies have tried to express the costs of habitat damage and fragmentation in monetary terms. Table 3.3, adapted from EC (2019d), gives an example of such estimates at the EU-28 level for rail and aviation infrastructure, on an annual basis. These are average figures for the EU-28, and it should be kept in mind that local conditions are likely to have a large impact on the costs and that research on this topic as well as on the monetisation of the effects is still ongoing.
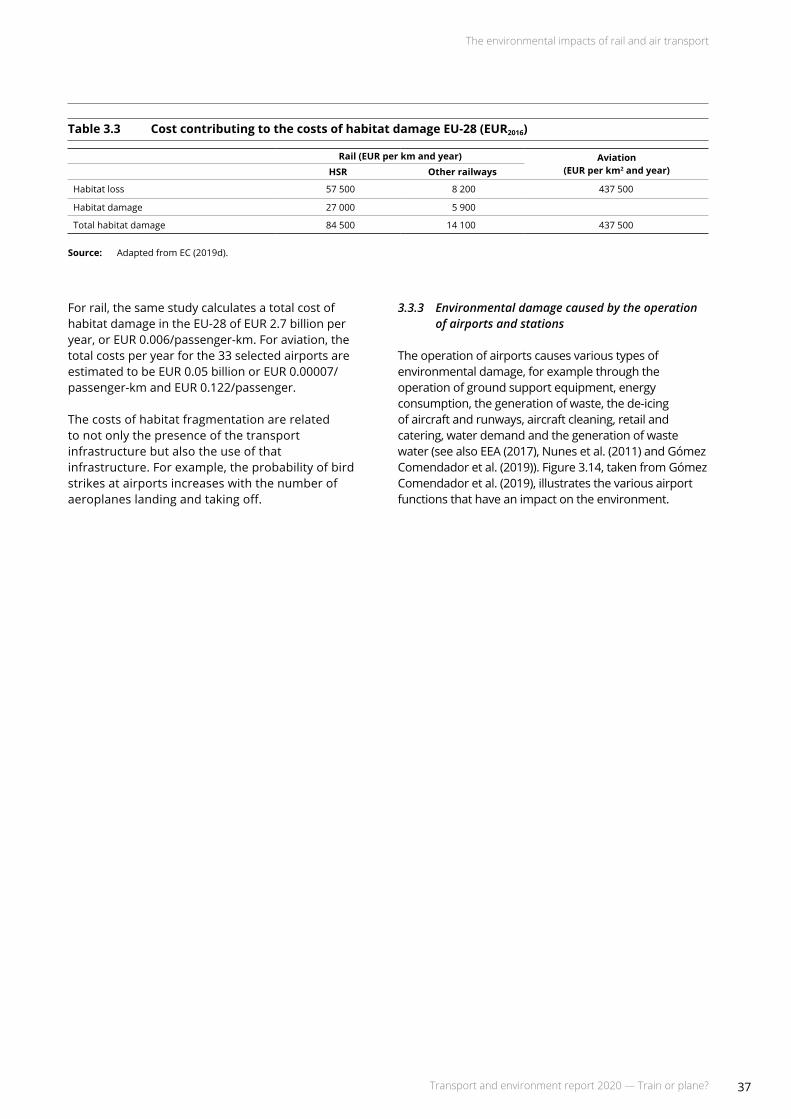
The environmental impacts of rail and air transport
37Transport and environment report 2020 — Train or plane?
Table 3.3 Cost contributing to the costs of habitat damage EU-28 (EUR2016)
Rail(EURperkmandyear) Aviation (EUR per km2andyear)HSR Other railways
Habitat loss 57 500 8 200 437 500
Habitat damage 27 000 5 900
Total habitat damage 84 500 14 100 437 500
Source: Adapted from EC (2019d).
For rail, the same study calculates a total cost of habitatdamageintheEU-28ofEUR 2.7billionperyear,orEUR 0.006/passenger-km.Foraviation,thetotal costs per year for the 33 selected airports are estimatedtobeEUR 0.05billionorEUR 0.00007/passenger-kmandEUR 0.122/passenger.
The costs of habitat fragmentation are related to not only the presence of the transport infrastructure but also the use of that infrastructure. For example, the probability of bird strikes at airports increases with the number of aeroplanes landing and taking off.
3.3.3 Environmental damage caused by the operation of airports and stations
The operation of airports causes various types of environmental damage, for example through the operation of ground support equipment, energy consumption, the generation of waste, the de-icing of aircraft and runways, aircraft cleaning, retail and catering, water demand and the generation of waste water (see also EEA (2017), Nunes et al. (2011) and Gómez Comendador et al. (2019)). Figure 3.14, taken from Gómez Comendador et al. (2019), illustrates the various airport functions that have an impact on the environment.

The environmental impacts of rail and air transport
38 Transport and environment report 2020 — Train or plane?
In an analogous way, the operation of the railway system also leads to environmental damage. IZT and Macroplan (2012) identified the following main energy consuming activities in stations and
Figure 3.14 Functional elements of the airport affecting the environment
Source: Based on Gómez Comendador et al. (2019). Reproduced under the terms and conditions of the Creative Commons CC BY 4.0 licence (https://creativecommons.org/licenses/by/4.0/).
Functional elements:
1. Airport access: road connections and public transport to the airport
2. Parking
3. Passenger terminals
4. Control tower (air navigation)
5. Aeronautical office buildings
6. Aircraft/airport vehicles maintenance facilities
7. Hangars
8. Runways and taxiways
9. De-icing equipment for aircraft
10. Tanks with anti-freeze liquid (glycol)
11. Aircraft parking area with drainage pipes
12. De-icing equipment for the tracks
13. Tanks with antifreeze (acetates and formats)
14. Equipment for refuelling aircraft
15. Tanks for fuel storage
16. Fuel for the maintenance team
17. Urban waste
18. Hazardous waste
19. Services for buildings (water and heating)
20. Aircraft maintenance test
21. Aircraft take-off, landing and rolling
2010
4
7
9
21
8
11
12
15
16 17 13
x
18
19
5
14
3
6
1
2
concessions: heating, cooling, lighting, ventilation and air-conditioning in stations, platforms and shops/concessions, station elevators and escalators, maintenance and depots.
39
European Union and national policy context and international agreements
Transport and environment report 2020 — Train or plane?
4 European Union and national policy context and international agreements
Key messages
• At the EU level, the climate change impacts of rail and aviation are tackled, directly or indirectly, by a 'basket of measures' comprising support for the development of innovative technologies, operational improvements, the promotion of renewable energy through the Renewable Energy Directive and market-based measures, in particular the EU Emissions Trading System. Although the recast of the Renewable Energy Directive does not currently set a specific target for aviation, the European Commission is considering legislative options to boost the production and uptake of sustainable aviation fuels.
• At the international level, the International Civil Aviation Organization (ICAO) sets standards for noise, local air quality impacts and carbon dioxide emissions. Furthermore, the Carbon Offsetting and Reduction Scheme for International Aviation, or CORSIA, an initiative of the ICAO, targets the carbon emissions of international civil aviation. Its pilot phase starts in 2021.
• More general EU policy frameworks, transport policies, initiatives and funding instruments also influence the development of rail and air transport demand and supply and, therefore, the context in which environmental policies operate.
4.1 Introduction
The environmental impacts of medium- to long-distance passenger travel by rail and air are mitigated by various policies at EU and international levels on the one hand and at the national level on the other. First of all, a number of general EU policy frameworks apply to both transport modes. In addition, mode-specific policies are used or will come into use at EU, national
and international levels. The policy instruments include a wide range of measures, including pricing policies (taxes, charges, subsidies), technology standards, other command-and-control measures, infrastructure measures and support for research and development (R&D)aswellasmoregeneralmeasures.Table 4.1 gives a general overview, with a focus on the control of the environmental impacts caused by climate change, air pollution and noise.

European Union and national policy context and international agreements
40 Transport and environment report 2020 — Train or plane?
Table 4.1 Overview of policy frameworks and policies at EU, national and international levels
Environmental impact
Government level
Policies
Rail Air
Climate change
EU
General framework: EU climate and energy frameworkRenewable Energy DirectiveEuropean Green Deal
ETS (electric trains) ETS (intra-EEA aviation)
InternationalCORSIACO2 standards for new aircraft (ICAO standards)
NationalFuel taxesElectricity taxesRenewable energy policies
Fuel taxes (domestic flights) or ticket taxes
Policies on sustainable aviation fuels
Air pollution
EU
General framework:Air Quality DirectiveNational Emission Ceilings Directive
Emission standards for diesel locomotives and railcars (non-road mobile machinery regulation)
Aircraft emission standards (in line with ICAO standards)
International Engine emission standards (ICAO standards)
National National taxes/chargesAirport charges differentiated by aircraft emission levels
Noise
EU
General framework: Environmental Noise Directive
Rail noise emission limitsRegulatory framework for noise-differentiated rail track access charges schemes
Noise certification standards (in line with ICAO standards)Regulation(EU)No 598/2014ontheprocedures concerning the introduction of noise-related operating restrictions (also taking into account other environmental impacts)
InternationalNoise certification standardsProcedures concerning the introduction of noise-related operating restrictions
NationalNoise-differentiated rail track access chargesRail noise abatement programmes
Noise-differentiated airport chargesAviation noise abatement schemesNoise-related operating restrictions
General
EU
Sustainable and Smart Mobility Strategy 2020EU strategy on low-emission mobility 2016Transport White Paper 2011TEN-T programme Connecting Europe FacilityERDF and Cohesion Fund/ESIFsHorizon 2020 transportEuropean digital strategy
Railway packagesRecast of the Interoperability DirectiveShift2Rail
Air Service RegulationSESSESARClean Sky joint undertaking
National Non-environmental rail chargesNon-environmental airport charges and aviation taxes
Note: CORSIA,CarbonOffsettingandReductionSchemeforInternationalAviation;ERDF,EuropeanRegionalDevelopmentFund;ESIF,EuropeanStructuralandInvestmentFund;ETS,EmissionsTradingSystem;ICAO,InternationalCivilAviationOrganization;SES,SingleEuropeanSkyinitiative;SESAR,SingleEuropeanSkyAirTrafficManagementResearch;TEN-T,Trans-EuropeanNetworksforTransport.
European Union and national policy context and international agreements
41Transport and environment report 2020 — Train or plane?
4.2 Climate change
4.2.1 EU policies
The UN 2030 agenda for sustainable development and the Paris Agreement on climate change form the general background for the relevant EU policies. The EU's commitment to reaching its objectives finds expression in the EU 2030 energy and climate framework, the Energy Union, the circular economy action plan and the EU implementation of the 2030 agenda for sustainable development. The European Green Deal also forms part of the European Commission's strategy to implement the United Nation's 2030 agenda and the Sustainable DevelopmentGoals(SDGs).Itseeksa90 %reductionin transport emissions by 2050 compared with 1990 (EC, 2019b).
The Renewable Energy Directive (2009/28/CE) and its revision in 2015 through Directive (EU) 2015/1513 set the regulatory framework for renewable energy in Europe upto2020.Itsetsatargetofa10 %shareofrenewableenergy by 2020 in transport. For evaluating whether the target has been achieved, the target is computed as the ratio of the amount of all types of renewable energy consumed in all forms of transport and of the amount of petrol, diesel, biofuels and electricity used in road and rail transport. Renewable fuel in aviation can in principle also contribute to the target share. The directive imposes additional restrictions on the type of fuels that can be used.
In the EU transport sector, renewable energy made up around8.3 %ofallenergyusein2018.Withrenewableelectricity playing only a small role in transport, the bulk of renewable energy use in this sector comes from biofuels (Eurostat, 2020b). The use of sustainable aviation fuels (SAFs) in the EU is very small — for 2017 it was estimated tobeonlyabout0.05 %ofthetotaljetfuelconsumption(EC, 2020c).
TheRED II,astherecastoftheRenewableEnergyDirective (Directive (EU) 2018/2001) is known, applies to the period 2021-2030 and confirms the increased use of renewable energy as an instrumental part of the actions required to meet the EU climate change mitigation objectives. For transport, which in 2018 still relied on fossilfuelsfor94 %ofitsenergysupply(Eurostat,2020c),the share of renewable energy supplied for final energy consumptionshouldbeatleast14 %by2030.Thetargetis set with respect to all types of fuels consumed in road and rail transport. Limits are imposed on biofuels made from crops with a high risk of causing high indirect land use change (ILUC), i.e. food or feed crops or those crops for which a significant expansion of the production area would be into land with high carbon stocks. Such biofuels should gradually be phased out by the end of 2030.
Certain biofuels and types of biogas get an extra incentive, as their energy content is multiplied by two in calculating the share of renewables. This applies to two groups of fuels: (1) fuels produced from used cooking oil and animal fats,forwhichamaximumshareisalsoimposed;and(2) the so-called advanced biofuels for which a gradually increasing minimum share also applies. Extra incentives are given to the use of renewable electricity in rail transport and to the use of renewable fuels (other than food- and feed-based fuels) supplied to aviation.
No specific target is set for aviation. However, the European Commission is currently considering legislative options to boost the production and uptake of SAFs (EC, 2020c).
The greenhouse gas (GHG) emissions of rail and of aviation within the European Economic Area are addressed directly or indirectly by the EU Emissions Trading System (ETS), which is discussed further in Section 5.3.2.Forrail,theEU ETSisrelevantforelectrifiedrailtransport.About72 %oftotalrailtransport(intermsof train-km) takes place on electrified lines (Schroten et al., 2019). By incentivising the electrification of rail infrastructure for the Trans-European Transport Network (TEN-T) 'core network', the TEN-T policy leads to a shift inGHGemissionsfromrailtransportintotheEU ETS.Foraviation,thecurrentscopeoftheEU ETScoversonly flights within the European Economic Area, which correspondstoabout36 %oftheCO2 emissions from aviation (including international bunkers) of the countries in the European Economic Area in 2018. The rest of the emissions, from inbound or outbound flights to and from the European Economic Area, are currently outside the scope of the system.
For air transport, the 1944 Chicago Convention on International Civil Aviation (Article 24) established the principle that fuel on board aircraft flying to, from or across the territory of another contracting state should be exempt from any national or local duties and charges. A series of bilateral agreements have subsequently extended this exemption to 'fuel supplied in the territory of one State party to an airline of the other party' (EEA, 2016). Under the EU Directive on the common system of value added tax (VAT) (2006/112/EC), the supply of goods for the fuelling and provisioning of aircraft for commercial air traffic on international routes should be exempt from VAT(Article 148).TheEnergyTaxationDirective(2003/96/EC) states that aircraft fuel, for commercial operations, is exempt from excise duty. Still, Member States may limit the exemption to intra-community and international flights. Currently no aviation fuel taxes are levied in the EU (CE Delft and SEO Amsterdam Economics, 2019). The European Green Deal states that '… in the context of the revision of the Energy Taxation Directive, the Commission will look closely at the current tax exemptions including for aviation and maritime fuels …' (EC, 2019b, p. 10).

European Union and national policy context and international agreements
42 Transport and environment report 2020 — Train or plane?
4.2.2 International
At the international level, the Carbon Offsetting and Reduction Scheme for International Aviation (CORSIA) (ICAO, 2019a), an initiative of the International Civil Aviation Organization (ICAO), targets the carbon emissions of international civil aviation (i.e. civil aviation flights that depart in one country and arrive in a different country). Figure 4.1 gives an overview of the scheme. The ambition is to limit the carbon emissions from this sector to the level of emissions in 2020 (so-called carbon neutral growth from 2020).
CORSIA is a world-wide scheme that enables the air transport sector to offset its non-domestic emissions by purchasing and cancelling eligible carbon credits and/or deducting CO2 emissions corresponding to the use of certainfuels.Itwillbeimplementedinthree phases:
• The pilot phase (2021-2023) and first phase (2024-2026) will apply to states that have volunteered to participate in the scheme.
• The second phase (2027-2035) will apply to all states that have an individual share of international aviation activities, in revenue tonne-kilometres (RTKs),in2018above0.5 %oftotalRTKsorthatarewithinthe90 %cumulativeshare, from largest to smallest, of all international aviation activity in the form of RTKs. The least developed countries, small island developing states and landlocked developing countries are excluded unless they volunteer to participate in this phase.
InJune2020,theICAOCouncildeterminedthattheCORSIA baseline, originally calculated as the average of 2019 and 2020 emissions from the aviation sector, will
Figure4.1 DesignoftheCarbonOffsettingandReductionSchemeforInternationalAviation(CORSIA)
Note: MRV,Monitoring,reportingandverification.
Source: Maertens et al. (2019). Reproduced under the terms and conditions of the Creative Commons CC BY 4.0 licence (https://creativecommons.org/licenses/by/4.0).
Pilot phase(2021-2023)
Phase 1(2024-2026)
Phase 2(2027-2035)
StateA
StateC
MRVonly
StateB
MRVonly
StateD
MRVonly
Offsetting and MRV
Voluntary participation of 88 states representing about 77 % of international aviation activity (June 2020)
Mandatory participation of all states whose carriers account for > 0.5 % of global RTK in 2018
Offsetting requirementat carrier level *
Operator’s individual emissions on covered routes
Growth factor= x
* Reduced by use of CORSIA eligible fuels
2021-2029
Growth factorCO2 emissions growth on
CORSIA-routes between 2019baseline and reporting year
100 % sectoral
2030-2032
Minimum 20 % individual
Maximum 80 % sectoral
2033-2035
Minimum 30 % individual
Maximum 70 % sectoral
Carr
ier
leve
lCo
untr
y le
vel
Participating in CORSIA Not participating in CORSIA
MRVonly

European Union and national policy context and international agreements
43Transport and environment report 2020 — Train or plane?
be changed to the value of the 2019 emissions for the CORSIA implementation during the pilot phase from 2021 to 2023 (ICAO, 2020c).
In each phase, all international flights on the routes between states, both of which are included in CORSIA, are covered by the offsetting requirements of CORSIA. Asof30 June2020,88 states,correspondingto76.82 %of international aviation activity, have indicated that they will voluntarily participate in CORSIA from its outset (ICAO, 2020a).
In the two first phases of CORSIA, the offsetting requirements of aircraft operators will be calculated on a sectoral approach, while a hybrid approach will be adopted afterwards.
• From 2021 to 2029, the amount of CO2 offsetting requirements for each operator will be calculated by multiplying the operator's annual emissions with a single sectoral growth factor every year.
• From 2030 onwards, the amount of CO2 offsetting requirements will be calculated following a hybrid approach that takes into account both the sectoral growth factor and growth factors of individual operators;theindividualfactors'contributiontothecalculation of CO2 offsetting requirements will be at least20 %from2030to2032andatleast70 %from2033 to 2035.
The use of certain fuels, the so-called CORSIA eligible fuels, can reduce aircraft operators' offsetting requirements under CORSIA. Two categories of fuel can bedistinguished:
• CORSIA sustainable aviation fuel. This is a renewable or waste-derived aviation fuel that meets the CORSIA sustainability criteria.
• CORSIA lower carbon aviation fuel. This is a fossil-based aviation fuel that meets the CORSIA sustainability criteria. These are traditional fossil fuels produced in a way that reduces their climate impact.
Table 4.2 presents the current CORSIA sustainability criteria for the CORSIA eligible fuels (additional criteria are undergoing adoption procedures). The baseline life cycle emissions value of jet fuel, to which the life cycle emissions of alternative fuels are compared, is set at 89 g CO2e/MJ.
It is expected that offsetting emissions will remain the less expensive option in the short term and that CORSIA will not trigger the large-scale use of SAF. For example, Mayeres et al. (2019) found that with offset pricesofEUR 10to50pertonneofCO2 there would be no uptake of SAFs in 2030. However, the higher fuel costs associated with the offset requirement lead to some emission reduction in the aviation sector itself. The bulk of the emission reduction would be realised viaoffsettingemissionsinother sectors.
CORSIA complements international CO2 standards for new aircraft that were adopted by ICAO in 2017. The standards apply to type designs from 2020 and to aircraft that are already in production as of 2023. Those in-production aircraft that do not meet the standard by 2028 can no longer be produced unless their designs aresufficientlymodified(ICAO, 2019a).
Table 4.2 CORSIA sustainability criteria for CORSIA eligible fuels
Theme Principle Criteria
GHGsPrinciple: CORSIA eligible fuel should generate lower carbon emissions on a life cycle basis.
Criterion 1: CORSIA eligible fuel should achieve net GHG emissions reductionsofatleast10 %comparedwiththebaselinelifecycleemissionsvalues for aviation fuel on a life cycle basis.
Carbon stockPrinciple: CORSIA eligible fuel should not be made from biomass obtained from land with high carbon stock.
Criterion 1: CORSIA eligible fuel should not be made from biomass obtainedfromlandconvertedafter1 January2008thatwasprimaryforest, wetlands or peat lands and/or contributes to the degradation of the carbon stock in primary forests, wetlands or peat lands, as these lands all have high carbon stocks.
Criterion2:Intheeventoflanduseconversionafter1 January2008,asdefined based on IPCC land categories, direct land use change (DLUC) emissions shall be calculated. If DLUC greenhouse gas emissions exceed the default induced land use change (ILUC) value, the DLUC value will replace the default ILUC value.
Note: IPCC, Intergovernmental Panel on Climate Change.
Source: ICAO (2019b).

European Union and national policy context and international agreements
44 Transport and environment report 2020 — Train or plane?
4.2.3 National
At the national level, many countries levy fuel taxes on dieselconsumptionbytrains.AccordingtoSchrotenet al.(2019), Belgium, Hungary and Sweden do not charge fuel taxes on diesel for rail transport and in the other EU-27 countries there is significant variation in the rates. According to the same study only 16 of the EU-27 Member States tax the electricity used in rail transport (and two have no rail system). Two countries in Europe tax jet fuel for domestic flights, both of them non-EU countries (Norway and Switzerland). A number of countries in the European Economic Area levy aviation ticket taxes.
There are initiatives in some European countries to support the uptake of SAF. For example, Norway introduced the world's first national mandate for jetbiofuelin2018,callingforatleast0.5 %SAFfrom sustainable non-food sources from 2020. The Norwegian government aims to increase this mandate to30 %by2030(NorwegianMinistryofClimateandEnvironment, 2019). The Netherlands is studying SAF supplyobligationswitha14 %targetin2030(Ministerievan Infrastructuur en Waterstaat, 2020). Similar mandates have also been proposed in Finland, France, Germany, Spain and Sweden.
4.2.4 Voluntary schemes and company initiatives
Examples also exist of voluntary schemes organised at the level of an airline or another organisation, whereby individual travellers compensate for their GHG emissions by making a financial contribution to a GHG-reduction project or pay for an uptake of SAFs. Examples of the latter are the corporate biofuel programme of Royal Dutch Airlines (KLM, 2020), Lufthansa's Compensaid platform (Lufthansa, 2020) and the Swedish Fly Green Fund (Fly Green Fund, forthcoming). Several European airlines have recently implemented airline-level voluntary offsetting schemes, suchasEasyJet,AirFranceandBritishAirways(AirFrance,2020;BritishAirways,2020;Easyjet,2020).Other examples of such schemes are documented in Deane and Pye (2016) and Becken and Mackey (2017). Irwin (2009) describes theoretical and empirical evidence of cases in which people take voluntary actions to reduce their emissions.
The experience of most voluntary contribution schemes is that their uptake is relatively limited and that they therefore make only a limited contribution to sustainable fuel uptake or GHG offsets. They can therefore be expected to lead to emission reductions that are smaller than socially optimal (Irwin, 2009). However, they help raise awareness and may signal customers' preference for more sustainable air travel to airlines.
4.3 Air pollution
The Air Quality Directive and the National Emission Ceilings Directive form the general framework for air quality in Europe. The former introduces ambient air quality standards for the protection of human health, while the latter sets national commitments to reduce emissions for Member States and the EU for five air pollutants: (1) nitrogen oxides (NOx), (2) non-methane volatile organic compounds (NMVOCs), (3) sulphur dioxide (SO2), (4) ammonia (NH3) and (5) fine particulate matter (PM2.5).
Within Europe, railway engines' emissions are regulated by the non-road mobile machinery (NRMM) Regulation (EU) 2016/1628. At the national level, Schroten et al. (2019) found that in rail infrastructure access charges there is only a small differentiation according to emission characteristics.
In the case of aviation, the EU has set aircraft emission standards in line with the engine certification standards set by the ICAO (ICAO, 2019a). The ICAO emissions certification standards regulate smoke and various gaseous emissions from aircraft engines, including unburned hydrocarbons (HCs), carbon monoxide (CO), nitrogen oxides (NOx) and non-volatile particulate matter (nvPM). The smoke limit aims to control visible emissions, whereas the limits for gaseous emissions and nvPM were set to address local air quality issues in the vicinity of airports. A reference landing and take-off (LTO) cycle is used as the basis for the calculation of the mass of gaseous emissions and the mass and number of particles. The standards apply to new certified engine types and sometimes in-production engines (EASA et al., 2019). In March 2020, ICAO adopted a new nvPM mass and number engine emission standard that applies to both new and in-production engines from 2023 onwards (ICAO, 2020b). Such harmonised standards give a long-term incentive to invest in emission reductions. They are complemented at some airports by charges that are differentiated according to the emission characteristics of the aircraft (Schroten et al., 2019). These charges vary between airports.
4.4 Noise
The Environmental Noise Directive (Directive 2002/49/EC) sets the general framework for environmental noise management.
Noise emission limits are applied in the EU for new railway rolling stock. The obligation forms part of the Railway Interoperability Directive ((EU) 2016/797), through a technical specification for interoperability on noise. Since its initial adoption in 2005, it has been amended several times. The latest version is Commission Regulation (EU) No 1304/2014 on the
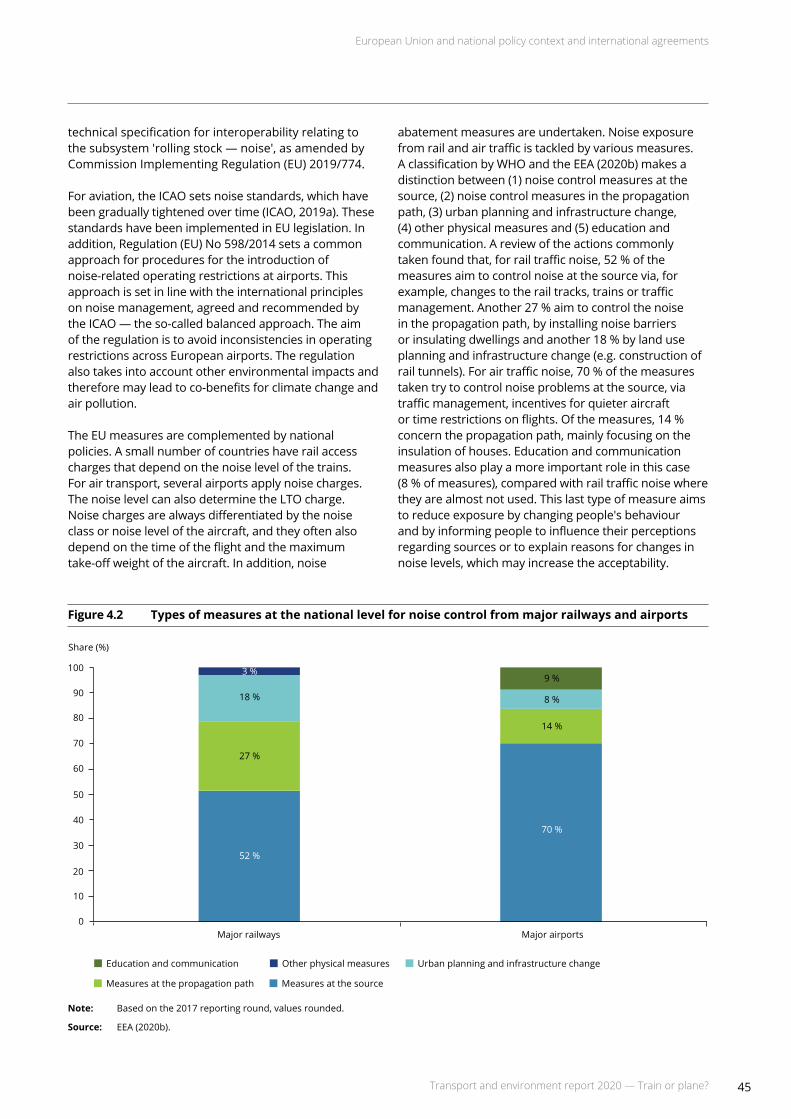
European Union and national policy context and international agreements
45Transport and environment report 2020 — Train or plane?
technical specification for interoperability relating to the subsystem 'rolling stock — noise', as amended by Commission Implementing Regulation (EU) 2019/774.
For aviation, the ICAO sets noise standards, which have been gradually tightened over time (ICAO, 2019a). These standards have been implemented in EU legislation. In addition,Regulation(EU)No 598/2014setsacommonapproach for procedures for the introduction of noise-related operating restrictions at airports. This approach is set in line with the international principles on noise management, agreed and recommended by the ICAO — the so-called balanced approach. The aim of the regulation is to avoid inconsistencies in operating restrictions across European airports. The regulation also takes into account other environmental impacts and therefore may lead to co-benefits for climate change and air pollution.
The EU measures are complemented by national policies. A small number of countries have rail access charges that depend on the noise level of the trains. For air transport, several airports apply noise charges. The noise level can also determine the LTO charge. Noise charges are always differentiated by the noise class or noise level of the aircraft, and they often also depend on the time of the flight and the maximum take-off weight of the aircraft. In addition, noise
abatement measures are undertaken. Noise exposure from rail and air traffic is tackled by various measures. A classification by WHO and the EEA (2020b) makes a distinctionbetween(1) noisecontrolmeasuresatthesource, (2) noise control measures in the propagation path, (3) urban planning and infrastructure change, (4) other physical measures and (5) education and communication. A review of the actions commonly takenfoundthat,forrailtrafficnoise,52 %ofthemeasures aim to control noise at the source via, for example, changes to the rail tracks, trains or traffic management.Another27 %aimtocontrolthenoisein the propagation path, by installing noise barriers orinsulatingdwellingsandanother18 %bylanduseplanningandinfrastructurechange(e.g. constructionofrailtunnels).Forairtrafficnoise,70 %ofthemeasurestaken try to control noise problems at the source, via traffic management, incentives for quieter aircraft ortimerestrictionsonflights.Ofthemeasures,14 %concern the propagation path, mainly focusing on the insulation of houses. Education and communication measures also play a more important role in this case (8 %ofmeasures),comparedwithrailtrafficnoisewherethey are almost not used. This last type of measure aims to reduce exposure by changing people's behaviour and by informing people to influence their perceptions regarding sources or to explain reasons for changes in noiselevels,whichmayincreasethe acceptability.
Figure 4.2 Types of measures at the national level for noise control from major railways and airports
Note: Based on the 2017 reporting round, values rounded.
Source: EEA (2020b).
Major railways Major airports
Share (%)
0
10
30
40
60
70
100
90
20
50
80
Education and communication Other physical measures Urban planning and infrastructure change
Measures at the propagation path Measures at the source
9 %
8 %
14 %
70 %
52 %
27 %
18 %
3 %

European Union and national policy context and international agreements
46 Transport and environment report 2020 — Train or plane?
4.5 General policy frameworks, EU initiatives and funding instruments
General policy frameworks, transport policies, initiatives and funding instruments influence the overall development of transport demand and supply in the rail and air travel sectors and therefore the context in which the environmental policies described above operate. A selection is presented in Table 4.1. The key items are described here.
In December 2020, the European Commission published its Sustainable and Smart Mobility Strategy(EC, 2020g).The new strategy acknowledges that reducing emissions and becoming more sustainable is the most important challenge for Europe's transport sector. It also states that achieving the ambition of the European Green Deal requires a 'fundamental transformation' of the mobility system towards sustainability and away from fossil fuels. The strategy calls for a shift towards more sustainable modes of transport and putting in place the right incentives to support the shift.
Rail plays an important role in this context. The strategy includes the objective to increase the number of rail passengers and to create an 'affordable high-speed rail network' across Europe. In concrete terms, the strategy aims to double high-speed rail traffic by 2030 and triple it by 2050. Making high-speed rail services available on short-haul distances and enabling carbon-neutral collectivepassengertravelfordistancesbelow500 kmby 2030 are also among its objectives. To improve long-distance passenger rail services in Europe, a specific action plan proposal has been announced for 2021.
The strategy on low-emission mobility, published in 2016 (EC, 2016), contains the following main elements: (1) increasing the efficiency of the transport system bymakingthemostofdigitaltechnologies;(2)smartpricing and further encouraging the shift to lower emissiontransportmodes;(3)thefasterdeploymentoflow-emissionalternativeenergyfortransport;and(4) themovetowardszero-emissionvehicles.
The 2011 Transport White Paper (EC, 2011b) set an ambitious goal of reducing GHG emissions from transportby60 %by2050comparedwiththelevelof these emissions in 1990. To achieve this, overall objectives regarding modal shift were set, proposing among other things:
• By 2030, the length of the existing high-speed rail (HSR) network should be tripled and a dense railway network should be maintained in all Member States. By 2050, the European HSR network should be complete and the majority of medium-distance passengers should travel by rail.
• By 2030, there should be a fully functional and EU-wide multimodal TEN-T 'core network', while by 2050 there should be a network of high quality and capacity, with a corresponding set of information services.
• By 2050, all core network airports should be connected to the rail network, preferably the HSR network.
• By 2020, a framework for a European multimodal transport information, management and payment system should be established.
The White Paper proposes a two-pronged strategy to promote a modal shift: first, to confront all modes with their full costs (including the costs of negative externalities) and, second, to directly improve the market conditions in non-road modes. The range of policy measures for improving the attractiveness of non-road modes is based on financial and regulatory mechanisms to increase their efficiency, with the associated effect of reducing their prices for users. A first subcategory is the financial support through dedicated programmes. At the European level, transport projects can benefit from numerous sources of financial assistance. Examples are the EuropeanRegionalDevelopmentFund(ERDF);theCohesion Fund/European Structural and Investment Fund(ESIF);theConnectingEuropeFacility(CEF),in which multimodal integration is an overarching priority;andloansandguaranteesfromtheEuropean InvestmentBank(EIB).Moreover,thesuccessive European framework programmes for research and technological development, and their successor, the Horizon 2020 framework programme for research and innovation, also provide support for transport projects. Promoting a modal shift away from road is a major criterion in the selection of the TEN-Tprojects.
A second subcategory consists in eliminating administrative and technical barriers that diminish the attractiveness of specific modes. In the railway sector, the railway packages and the recast of the Directive on the interoperability of the rail system within the Community (known as the Interoperability Directive) aim to create an internal market in rail transport by opening up rail transport to regulated competition and removing operational barriers.
For the aviation sector, the Air Service Regulation (Regulation(EC)No 008/2008oncommonrulesfor the operation of air services in the Community) provides the economic framework for air transport in the European Community.
European Union and national policy context and international agreements
47Transport and environment report 2020 — Train or plane?
The Shift2Rail joint undertaking (S2RJU)isaformofpublic-private partnership in the rail sector. It supports research and innovation activities that can contribute to achieving the Single European Railway Area and to increasing the attractiveness and competitiveness and improving the safety of rail in Europe. Shift2Rail aims to introduce better trains to the market (quieter, more comfortable, more dependable, etc.) that operate on an innovative rail network infrastructure, at a lower life cycle cost and with the capacity to cope with rising demand for rail transport for passengers and freight. By improving the competitiveness and attractiveness of rail services, combined with increased capacity, the share of travel by rail can increase, which contributes to reducing the CO2 emissions of the transport sector.
The Single European Sky (SES) initiative, adopted by the European Commission in 2004 (and amended in 2009),andtheSES IIlegislativepackageof2013aimto modernise and harmonise air traffic management (ATM) systems by means of innovative technological and operational solutions. Its core idea is to shift the design of ATM from the national level to the EU level to realise efficiencies of scale and to reduce administrative and technical barriers created by the legacy of national approaches. To this end, national air traffic control organisations are required to work together in regional airspace blocks. Binding key performance targets were introduced for safety, capacity, cost efficiency and environmental performance. Eurocontrol, as the network manager, performs certain tasks that
are most efficiently carried out centrally (e.g. route design).The regulatoryframeworkiscoupledwithatechnological modernisation programme, the 'SESAR project' (Single European Sky ATM Research), with the provision for financial incentives.
One of the four high-level goals of the SES initiative is to reduce the environmental impact per flight by 10 %,comparedwith2005.Twoenvironmentalkeyperformance indicators (KPIs) are defined, by which the length of the trajectory flown can be assessed. In 2017, theactualtrajectorywasonaverage2.81 %longerthan the great-circle distance (PRB, 2018). Vertical flight efficiency, non-CO2 emissions, noise levels or air quality are not yet covered by the SES performance scheme (EASA et al., 2019).
In addition, the Clean Sky joint undertaking, funded by the Horizon 2020 programme, supports the development of innovative, cutting-edge aviation technology aimed at reducing emissions of CO2 and air pollutants and noise levels produced by aircraft.
The European digital strategy formulates the EU's approach to digital technological development and to the ways in which technology will be used to meet climate-neutrality objectives. One example is that telecommunications, networks and connectivity make it possible to collaborate remotely instead of travelling, the usefulness of which has become very prominent during the COVID-19 pandemic.
Transport and environment report 2020 — Train or plane?48
Train or plane?
5 Train or plane?
5.1 Introduction
This chapter further explores the environmental costs of travelling by train and air in mainland Europe, based on an analysis for specific city pairs. Although the focus lies on these two modes, their environmental costs are also compared with those of travelling by car, which is the dominant mode of passenger transport in Europe.
The following environmental cost categories are considered:
• diesel train, aeroplane, car: the tank-to-wheel/-wake (TTW) emissions of greenhouse gases (GHGs) and airpollutants;
• car: emissions related to tyre and brake wear combinedandtoroadsurfacewear (3);
• electric train, aeroplane, car: the well-to-tank (WTT) emissions of GHGs related to fuel and electricity production,transmissionanddistribution;
Key messages
• An analysis of 20 city pairs shows that the environmental costs of rail travel are substantially lower than those of air travel.
• Because of the high environmental costs of landing and take-off, the environmental costs of air travel rise less than proportionally with distance.
• The environmental costs of travelling to and from the railway station/airport account for only a small share of the total environmental costs if the city centre is the origin/destination. They are the largest when the main trip is done by air, as airports are most often located further away from the city centre than railway stations. The costs can become more important when the origins and destinations differ from the city centres of the city pairs considered.
• In all cases, electric rail transport between the city pairs and air travel between the airport pairs is covered by the EU Emissions Trading System, which has implications for the ultimate impact of a modal shift in greenhouse gas emissions, asdiscussedinSection5.3.3.
(3) Non-exhaust emissions are also relevant for rail and aviation, but no emission factors are available.
• train,aeroplane,car:noisepollution;
• the non-CO2 climate costs of aviation.
The environmental costs related to the manufacturing of the vehicles (and batteries for electric cars), their maintenance and the construction and maintenance of the transport infrastructure are not covered in this analysis. Hence, the scope is a well-to-wheel/-wake (WTW) analysis, rather than a life cycle analysis (see the illustration of these concepts in Figure 3.1.
In addition to this environmental cost analysis, this chapter further investigates the implications for the environment of a shift from rail to air transport, including the mechanisms at work in the EU Emissions Trading System (ETS).
Train or plane?
49Transport and environment report 2020 — Train or plane?
5.2 Environmental costs of travelling by rail and air — an analysis for specific city pairs
5.2.1 Selection of the city pairs
This chapter assesses the environmental impacts of travel for 20 main city pairs. For the selection of the city pairs the following steps were followed:
• First, Eurostat data were gathered on the annual number of passengers on direct flights between airports in the EU-27 (Eurostat, 2020a). The top 70 airport pairs were identified, and connections to the EU's outermost regions (e.g. the Azores or the Canary Islands) (EC, 2020f) and connections to islands in Europe were excluded. The main city in the vicinity of each airport was identified.
• In order to get a geographically balanced set of city pairs across mainland EU countries, several connections were added.
• Only city pairs with a rail connection were considered.
Out of this longlist of city pairs, 20 city pairs were selected. In this selection, the following additional criteria were used:
• There should be a balanced coverage of three distance bands, where distance is measured by the distance by car between the city pairs by the fastest route on a popular web mapping service.
– Of the 20 city pairs, six pairs cover a car distance below500 km,eightpairscoveradistanceofbetween500and750 km,andsixpairscoveradistanceofbetween750and1 100 km.Thethree distance bands are relevant for the choice between rail and air transport and cover both distances for which rail is competitive with air and distances for which that is less the case.
• The selection covers both city pairs with a good railway connection and pairs with a railway connection of medium to lower quality. For the quality assessment of the rail connection, account was taken of the travel time by rail, the rail travel time per kilometre and the number of transfers per hour, using data collected via the web mapping service and Trainline (forthcoming). This information was collected before the COVID-19 outbreakinthe EU:
– The rail connection is taken to be of high quality if the travel time is below 4 hours and the number of transfers per hour and the traveltimeperkilometrearebelowthe80 %percentile value for the longlist of city pairs. If one of the last conditions is not met, the connection is taken to be of medium quality.
– The rail connection is also taken to be of medium quality if the travel time is between 4 and8hoursandthenumberoftransfersperhour and the travel time per hour are below the80 %percentilevalueforthelonglistofcitypairs. If one of the last conditions is not met, the connection is taken to be of lower quality.
– The rail connection is also taken to be of lower qualityifthetraveltimeislongerthan8 hours.
– Five city pairs have a high-quality rail connection according to the criteria defined above. Another six pairs have a medium quality, while the others have a lower quality connection, usually because the maximum travel time of 8 hours is exceeded.
For each city pair, an alternative origin/destination pair was selected, consisting of two other cities in the vicinity that are potentially served by the railway station or airport of the main cities. This takes into account the fact that the travel distance to/from the railway station/airport is not necessarily the travel distance from the centres of the main cities.
Table 5.1 presents the selection of city pairs, the associated additional city pairs, the distance by car and the distance by air as well as an assessment of the quality of the rail connection based on the criteria presented above. In addition, the table gives the number of air travellers in 2018, based on Eurostat data. For some city pairs, numbers are given for the rail travellers based on various sources. However, as no European data set is available for rail passengers for the respective city pairs, the information in this column is less complete. The lack of statistics for rail travel between European cities comparable to those for aviation makes assessing the current situation and the policy options more difficult.
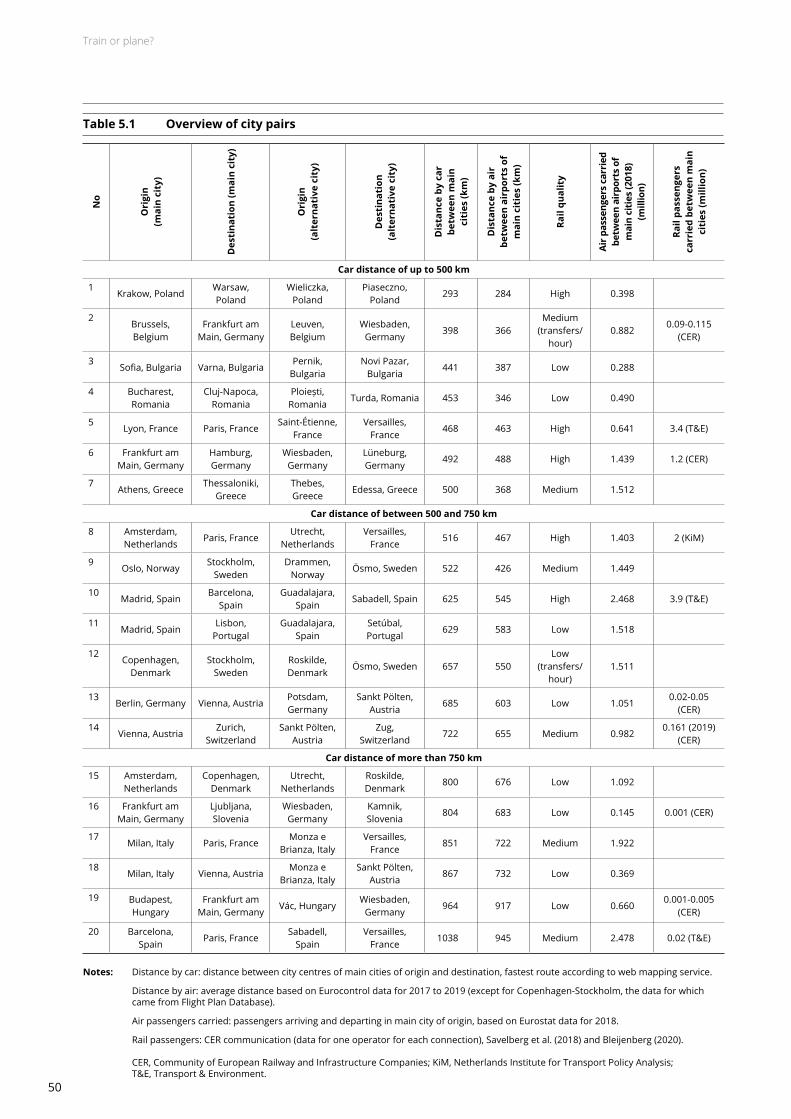
Train or plane?
50
Table 5.1 Overview of city pairs
No
Ori
gin
(maincity)
Destina
tion
(maincity)
Ori
gin
(alterna
tive
city)
Des
tina
tion
(alterna
tive
city)
Dis
tanc
e by
car
be
twee
n m
ain
cities (k
m)
Dis
tanc
e by
air
be
twee
n ai
rpor
ts o
f maincities(k
m)
Rail
qual
ity
Air p
asse
nger
s ca
rrie
d be
twee
n ai
rpor
ts o
f maincities(2018)
(million)
Rail
pass
enge
rs
carr
ied
betw
een
mai
n cities(m
illion)
Cardistanceofupto500 km
1Krakow, Poland
Warsaw, Poland
Wieliczka, Poland
Piaseczno, Poland
293 284 High 0.398
2Brussels, Belgium
Frankfurt am Main, Germany
Leuven, Belgium
Wiesbaden, Germany
398 366Medium
(transfers/hour)
0.8820.09-0.115
(CER)
3Sofia, Bulgaria Varna, Bulgaria
Pernik, Bulgaria
Novi Pazar, Bulgaria
441 387 Low 0.288
4 Bucharest, Romania
Cluj-Napoca, Romania
Ploiești,Romania
Turda, Romania 453 346 Low 0.490
5Lyon, France Paris, France
Saint-Étienne, France
Versailles, France
468 463 High 0.641 3.4 (T&E)
6 Frankfurt am Main, Germany
Hamburg, Germany
Wiesbaden, Germany
Lüneburg, Germany
492 488 High 1.439 1.2 (CER)
7Athens, Greece
Thessaloniki, Greece
Thebes, Greece
Edessa, Greece 500 368 Medium 1.512
Cardistanceofbetween500and750 km
8 Amsterdam, Netherlands
Paris, FranceUtrecht,
NetherlandsVersailles,
France516 467 High 1.403 2 (KiM)
9Oslo, Norway
Stockholm, Sweden
Drammen, Norway
Ösmo, Sweden 522 426 Medium 1.449
10Madrid, Spain
Barcelona, Spain
Guadalajara, Spain
Sabadell, Spain 625 545 High 2.468 3.9 (T&E)
11Madrid, Spain
Lisbon, Portugal
Guadalajara, Spain
Setúbal, Portugal
629 583 Low 1.518
12Copenhagen,
DenmarkStockholm,
Sweden Roskilde, Denmark
Ösmo, Sweden 657 550Low
(transfers/hour)
1.511
13Berlin, Germany Vienna, Austria
Potsdam, Germany
Sankt Pölten, Austria
685 603 Low 1.0510.02-0.05
(CER)
14Vienna, Austria
Zurich, Switzerland
Sankt Pölten, Austria
Zug, Switzerland
722 655 Medium 0.9820.161 (2019)
(CER)
Cardistanceofmorethan750 km
15 Amsterdam, Netherlands
Copenhagen, Denmark
Utrecht, Netherlands
Roskilde, Denmark
800 676 Low 1.092
16 Frankfurt am Main, Germany
Ljubljana, Slovenia
Wiesbaden, Germany
Kamnik, Slovenia
804 683 Low 0.145 0.001 (CER)
17Milan, Italy Paris, France
Monza e Brianza, Italy
Versailles, France
851 722 Medium 1.922
18Milan, Italy Vienna, Austria
Monza e Brianza, Italy
Sankt Pölten, Austria
867 732 Low 0.369
19 Budapest, Hungary
Frankfurt am Main, Germany
Vác, Hungary Wiesbaden,
Germany 964 917 Low 0.660
0.001-0.005 (CER)
20 Barcelona, Spain
Paris, FranceSabadell,
SpainVersailles,
France1038 945 Medium 2.478 0.02 (T&E)
Notes: Distance by car: distance between city centres of main cities of origin and destination, fastest route according to web mapping service.
Distance by air: average distance based on Eurocontrol data for 2017 to 2019 (except for Copenhagen-Stockholm, the data for which came from Flight Plan Database).
Air passengers carried: passengers arriving and departing in main city of origin, based on Eurostat data for 2018.
Rail passengers: CER communication (data for one operator for each connection), Savelberg et al. (2018) and Bleijenberg (2020). CER,CommunityofEuropeanRailwayandInfrastructureCompanies;KiM,NetherlandsInstituteforTransportPolicyAnalysis; T&E,Transport& Environment.

Train or plane?
51Transport and environment report 2020 — Train or plane?
5.2.2 Calculating the environmental impacts
The environmental impacts are calculated for each city pair and its associated alternative cities. Account is taken of the environmental costs of transport to and from the railway station or airport (referred to belowas pre-andposttransport).Thecostscanbeconsidered to be the marginal environmental costs: the costsofanadditionalpassenger-kmforeachcity pair, using a specific train/aircraft type, with a specific load factor, covering a specific distance, just to name a few of the characteristics of the transport options between the city pair. Figure 5.1 illustrates the approachforonecitypair.
For the main trip, the environmental impacts are calculated for three modes: car, rail and air transport. Although the focus of the report and of the discussion in this section lies on rail and air transport, the environmental costs are also calculated for car transport, as an additional point of comparison. For transporttoandfromthemainrailwaystationorairport, the distance by car from the city centre to the main railway station or airport is taken. Three modes are considered: car, bus and (heavy) rail.
Table 5.2 shows the car, bus and train types considered for the city pairs as well as a selection of aircrafttypes (4). It also presents the capacity of the
vehicles/aircraft as well as the assumption that is made for the occupancy rates. The occupancy rate of the aeroplanes is based on data from Eurostat for the respective city pairs (see Table A1.2 in Annex 1).
Two types of car with an internal combustion engine are included as is an electric car, while recognising that for longer distance trips, the range of the electric car still entails higher time costs of travel on account of additional and longer charging stops.
For rail transport, five different trains are included in the analysis. The high-speed train is the only train that cannot be used for transport to/from the railway station/airport. For the city pairs that do not have a high-speed rail (HSR) connection (see Table A1.2 in Annex 1), intercity trains are used for the main trip. The city pairs that do have an HSR connection obviously use it as a main transport mode. The occupancy rate given is taken to be the same as that in Schrotenetal.(2019).
For car travel, two different average occupancy rates are used: one and four. The first reflects the conditions for business travel or recreational travel by one person, and the second reflects the conditions for recreational travel with a larger group. The environmental costs of travelling with two or three people will logically lie in between the two values reported here.
Figure 5.1 Illustration of the approach for a trip between Brussels/Leuven and Frankfurt/Wiesbaden
(4) See Annex 1 for the full list of aircraft types.
Brussels
Leuven
Frankfurt
Wiesbaden
CAR
AIR
Brussels
Leuven
Brussels airport(EBBR)
Frankfurt
Wiesbaden
BUS
Frankfurt am Mainairport(EDDF)
Car or public transport
Car or public transport
BUS
RAIL
Brussels
Leuven
Bruxelles Midi
Frankfurt
Wiesbaden
BUS
Frankfurt (Main)
Hbf
Car or public transport
Car or public transport
BUS

Train or plane?
52 Transport and environment report 2020 — Train or plane?
In the graphs shown below, not all transport types are shown for the sake of clarity. Of course, which transport modeandvehicletypeisusedisindicatedfor eachgraph.
The environmental cost categories considered are described in Section 5.1. For bus transport, the same cost categories are considered as for car transport. The inputs for the calculation of the emissions are presented in Annex 1.
As indicated in Section 3.2.1, aviation also emits short-lived climate forcers, including SO2, NOx and black carbon. This leads to changes in the radiative forcing in the climate system, including the forming of contrails and cirrus clouds, which both warm the atmosphere. In the report by the European Commission (EC, 2019d) the total climate change costs of aviation are taken to be twice the costs of the CO2 emissions alone. To compare, a recent report for the German Environmental Agency indicated that the total impact (for the global fleet) is about five times the impact of CO2 emissions alone for constant emissions, and the total impact for pulse emissions (e.g. for emissions of an individual flight) is about three times the impact of CO2 emissions. That report points out that, rather than using a constant factor, the underlying processes can also be accounted for in a better way. However, this requires more data than are available here (Niklaß et al., 2020). To reflect the uncertainty over the non-CO2 climate costs of aviation, the approach of Cox and Althaus (2019) is followed. They take the total climate impact during the flightphaseatanaltitudeabove9 kmtobeafactorof1.3-3.6 of the combustion-related CO2 emissions. Based on this information three different options were taken into account for the non-CO2 climate costs: base, medium or central, and high values, in which the non-CO2 climate costs amount to 0.3, 1 and 2.6 times, respectively, the impact of the CO2 emissions during the climb, cruise, descent(CCD phase).Themediumvaluecorrespondstothe approach taken in EC (2019d). It should be noted that the non-CO2 climate effect could be slightly overstated
here,becausetheCCDphasestartsatanaltitudeof10 mand ends when the aeroplane descends below an altitude of300 m(Gobletetal.,2015).Thisalsojustifiestherangeof aviation-related non-CO2 emissions that was adopted here. Most recently, the European Aviation Safety Agency prepared an updated analysis of the non-CO2 effects of aviation at the request of the European Commission (EASA, 2020c). The new report confirms the significance of these effects and, by and large, also confirms the range of non-CO2 climate costs used here. However, as the analysis was published in late 2020, it was not possible to fully align the calculations with the findings of the report.
In order to calculate the costs related to the emissions of air pollutants and GHGs, we use the cost per kilogram or tonne of emissions put forward in EC (2019d). For all city pairs, we use the average EU value. The costs for the air pollutants include the costs related to the health effects, crop loss, biodiversity loss and material damage and are determined using the impact pathway method. In this approach, the environmental costs are estimated by following the pathway from source emissions via changes in the quality of air, soil and water to physical impacts, which are then expressed in monetary costs. For the GHG emissions, EC (2019d) considers so-called avoidance costs, i.e. the costs that are implied by achieving the target set by the Paris Agreement. The central value for the short- and medium-term costs (up to 2030) is EUR 100/t CO2e,whilethelowandhighvaluesareEUR 60andEUR 189/t CO2e, respectively. In this report the central value is used. All values used are summarised in Annex 1.
For noise pollution, the evidence from EC (2019d) on the average external noise costs per vehicle-km, train-km and landing and take-off (LTO) is taken as an approximation to calculate the external noise costs (see also Annex 1). Behind this average value are costs that are highly dependent on the time of day, population density and vehicle type/aircraft, as discussed in Section3.2.6.
Table 5.2 Overview of vehicle/train/aeroplane types, capacity and assumptions about occupancy rate
Mode Vehicle/aeroplane type Capacity Occupancy Occupancyrate(%)
Train
High-speed train 500 330 66
Intercity electric train 500 180 36
Intercity diesel train 500 180 36
Regional electric train 350 105 21
Regional diesel train 350 105 21
Bus Bus,Euro VI,diesel 30 20 66
Car
MediumpetrolEuro 6(upto2016)
5 1 and 4 20-80MediumdieselEuro 6(upto2016)
Medium electric car
Source: Railandbus:Schrotenetal.(2019).Occupancyrateforaircraftandcarsbasedonauthors'assumptions;foraircraftcapacity,see Table A1.1inAnnex1.

Train or plane?
53Transport and environment report 2020 — Train or plane?
5.2.3 Comparing the environmental performance
Comparison of different transport modes
The different transport modes are compared in two graphs: Figure 5.2 displays the environmental costs for all of the different transport modes travelling the same distanceof500 kmonthemaintrajectory.Onlythefive most frequently used aircraft types are displayed. Figure 5.3presentsthesameinformationforadistanceof1 000 km.Inbothfigures,anaircraftoccupancyrateof80 %isassumed.Thesetwofiguresmakeitpossibletospot the differences between the transport modes when their main trajectories are the same. A discussion of the different city pairs will follow later in which the distances for the different transport modes will differ from each other.
Consideringthedistanceclassof500 kmfirst(Figure 5.2),itcanbeseenthatforthecentralvalueof the non-CO2 climate costs, travelling by air causes more than six times higher environmental costs than travelling by HSR. Travelling in a fully occupied car, with four people, also has significantly lower environmental costs per passenger than travelling by air. The costs of only one person travelling in a diesel or petrol car is the highest of all travel alternatives considered here.
Comparing Figure 5.2 and Figure 5.3, it can be seen that the ranking between the different transport
modes does not change significantly for the two distances. It is clear that the train is the transport mode with the lowest cost, except for electric cars with four occupants. These electric cars seem to have a comparable environmental cost to that of trains. For electric cars with one passenger, the noise costs account for about half of the environmental costs. The occupancy rate and the noise cost make electric cars with one passenger the third most environmentally friendly option. Second after rail come diesel and petrol cars with four occupants. Apart from electric cars with one passenger, it is unclear which transport mode will have the third lowest cost, either cars with one passenger or air travel. This will depend on the non-CO2 climate costs of aviation and will be discussed in more detail. The figures show the central value for the non-CO2 climate costs, which equals the costs of the CO2 emissions during CCD. The low and high values that were indicated earlier, 0.3 and 1.6 times the costs of the CO2 emissions, are shown as error bars, to indicate the uncertainty around this component.
Although the environmental cost per passenger of rail is lower than that of air, the noise costs are comparable or, in the case of HSR for longer distances, higher than for air travel. For rail, the noise costs depend on the distance, while for air travel they do not, as they are generated during LTO.
Figure5.2 Emissioncostsofdifferenttransportmodes(500 km)
Note: Theerrorbarsreflecttheuncertaintyforthenon-CO2 climate costs of aviation based on Cox and Althaus (2019). Occupancy rates: aircraft80 %;HSR66 %;IC(intercitytrain)36 %.
Source: EEA.
Climate (non-CO2) Climate (Well-to-tank) Climate (Tank-to-wheel) Air pollution Noise
A319 A320 B738 A321 ATR72 Electric Petrol Diesel Electric Petrol Diesel HSR IC
Air Car (1P) Car (4P) Train
Euros per passenger
0
5
10
15
25
20

Train or plane?
54 Transport and environment report 2020 — Train or plane?
Figure 5.4 shows the relative contribution of the different environmental cost categories and, above each bar, the total costs per passenger-km for each transport mode and vehicle type. For air transport, this figure presents the case of the Airbus A320. For airtraveltheclimatecostsarethemostimportantcost category. For rail, the costs are mainly noise related,withrespectivesharesof62 %and71 %for HSR and intercity rail. The same holds true for electriccars,forwhich57 %oftheenvironmentalcostcorresponds to noise costs. Note that the total cost for intercity trains is higher than that for HSR. This is the result of two aspects. Firstly, while the electricity consumption per train-km is higher for HSR than for the electric intercity train, the assumed occupancy rate is substantially higher for HSR (see Table 5.2), leading to a lower electricity consumption per passenger-km.
Figure5.3 Emissioncostsofdifferenttransportmodes(1 000 km)
Note: Theerrorbarsreflecttheuncertaintyforthenon-CO2 climate costs of aviation based on Cox and Althaus (2019). Occupancy rates: aircraft80 %;HSR66 %;IC(intercitytrain)36 %.
Source: EEA.
Euros per passenger
0
5
10
20
25
30
45
40
15
35
A319 A320 B738 A321 ATR72 Electric Petrol Diesel Electric Petrol Diesel HSR IC
Air Car (1P) Car (4P) Train
Climate (non-CO2) Climate (Well-to-tank) Climate (Tank-to-wheel) Air pollution Noise
Secondly, thenoisecostperpassenger-kmisalsohigher for the intercity train, because of higher costs per train-km and a lower occupancy rate.
The effect of the number of passengers on the environmental cost per passenger-km is even greater for passenger cars. When four seats in a five seater car are occupied, the cost per passenger-km comes close to that of rail. However, when the average number of passengers per car drops to one, the environmental costs per passenger-km fall within the range of the costs related to aeroplanes. This, however,dependsonthenon-CO2 climate costs of flying. When the central value is taken for these costs, the environmental impact of a car trip with one occupant is bigger than that of one person travelling by aeroplane.

Train or plane?
55Transport and environment report 2020 — Train or plane?
It is important to stress the impact of the aviation-related non-CO2 climate costs. There still is, as already said, uncertainty about the magnitude of this component. The figures therefore consider a wide range for this cost, from 0.3 times to 2.6 times the costs of the CO2 emissions while at cruising altitude. Figure 5.2 shows thatformedium-distanceflightsof500 kmthecostsof travelling in bigger aeroplanes become comparable to those of diesel and petrol cars with one passenger, and this is even the case for the highest estimate for the non-CO2 climate costs. However, when a smaller aeroplane is chosen with fewer available seats, the costs are only comparable to the costs of cars if the lowest estimate of the non-CO2 climate costs is taken.
Forlongerdistanceflightsof1 000 km,theenvironmental costs per passenger of air travel decrease, but they remain substantially higher than for the best performing modes. At the high value for
Figure 5.4 Environmental cost split per passenger-km: share of environmental cost categories
Note: Theerrorbarsreflecttheuncertaintyforthenon-CO2 climate costs of aviation based on Cox and Althaus (2019). Occupancy rates: aircraft80 %;HSR66 %;IC(intercitytrain)36 %.ICEV,internalcombustionenginevehicle.
Source: EEA.
the non-CO2 climate costs, aircraft have comparable or somewhat lower environmental costs than conventional passenger cars with a low occupancy rate.
The previous paragraph demonstrates the importance of non-CO2 climate costs, but it also indicates that the costs per passenger-km of travelling by air decrease with increasingdistance.ThiscanalsobeseeninFigure 5.4,whichdisplaysthecostsfortravelling500 kmand1 000 kmbyAirbusA320.Figure5.5helpstoexplainthis. This figure indicates the relative contribution of the two different phases of flights: LTO and CCD. Where the contribution is about 50-50 for the first city pair at adistanceof284 km(dependingontheaircraft),thecontributionoftheLTOphasedropstolessthan30 %forthelongestdistanceflightof945 km.Thisislogical,because the environmental cost of the LTO phase is about the same for all flights. For longer flights its contribution is therefore smaller given the longer CCD phase.
7 %
50 %
20 %
23 %
32 %
12 %
57 %38 %
62 %
29 %
71 %
29 %
8 %
41 %
8 %
14 %
35 %
8 %
43 %
5 %9 %
0.039
0.016
0.005
0.008
0.026
0.020
0.000
0.005
0.015
0.025
0.035
0.045
0.040
0.010
0.030
0.020
Euros per passenger-km
AirCar (1P) Train
HSR ICel A320(500 km)
A320(1 000 km)ElectricAverage ICEV
Climate (non-CO2) Climate (Well-to-tank) Climate (Tank-to-wheel) Air pollution Noise
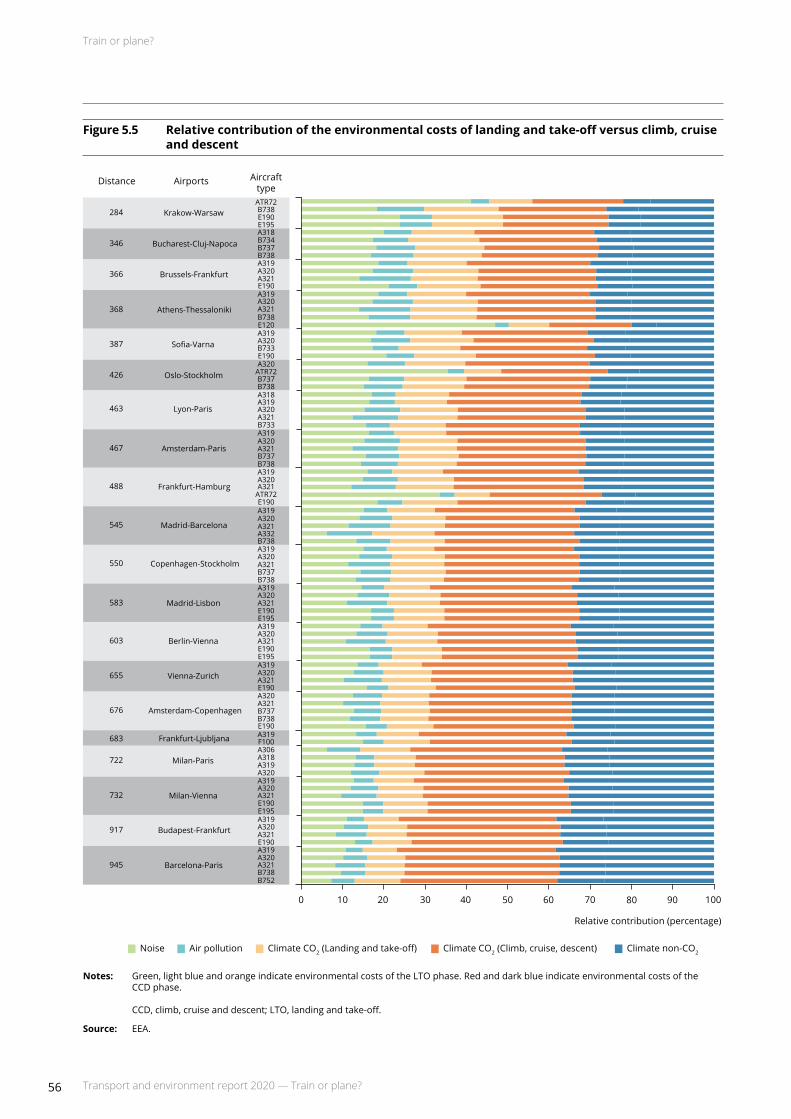
Train or plane?
56 Transport and environment report 2020 — Train or plane?
Figure 5.5 Relative contribution of the environmental costs of landing and take-off versus climb, cruise and descent
Notes: Green, light blue and orange indicate environmental costs of the LTO phase. Red and dark blue indicate environmental costs of the CCD phase. CCD,climb,cruiseanddescent;LTO,landingandtake-off.
Source: EEA.
Relative contribution (percentage)
60 70 9080 10040 503020100
Noise Air pollution Climate CO2 (Landing and take-off) Climate CO2 (Climb, cruise, descent) Climate non-CO2
ATR72B738
E195E190
A318B734
B738B737
A319A320
E190A321
A319A320
B738E120
A321
A319A320
E190B733
A320ATR72
B738B737
A318A319
A321B733
A320
A319A320
B737B738A319A320
ATR72E190
A321
A319A320
A332B738
A321
A319A320
B737B738
A321
A319A320
E190E195
A321
A319A320
E190E195
A321
A319A320
E190A321
A320A321
B738E190A319F100
B737
A306A318
A320A319
A319A320
E190E195
A321
A319A320
E190A321
A319A320
B752B738A321
Krakow-Warsaw
Bucharest-Cluj-Napoca
Brussels-Frankfurt
Athens-Thessaloniki
Sofia-Varna
Oslo-Stockholm
Lyon-Paris
Amsterdam-Paris
Frankfurt-Hamburg
Madrid-Lisbon
Madrid-Barcelona
Copenhagen-Stockholm
Berlin-Vienna
Vienna-Zurich
Amsterdam-Copenhagen
Milan-Vienna
Budapest-Frankfurt
Barcelona-Paris
Frankfurt-Ljubljana
Milan-Paris
346
284
368
366
426
387
467
463
545
488
550
603
583
676
655
722
683
917
945
732
AirportsDistance Aircrafttype
A321
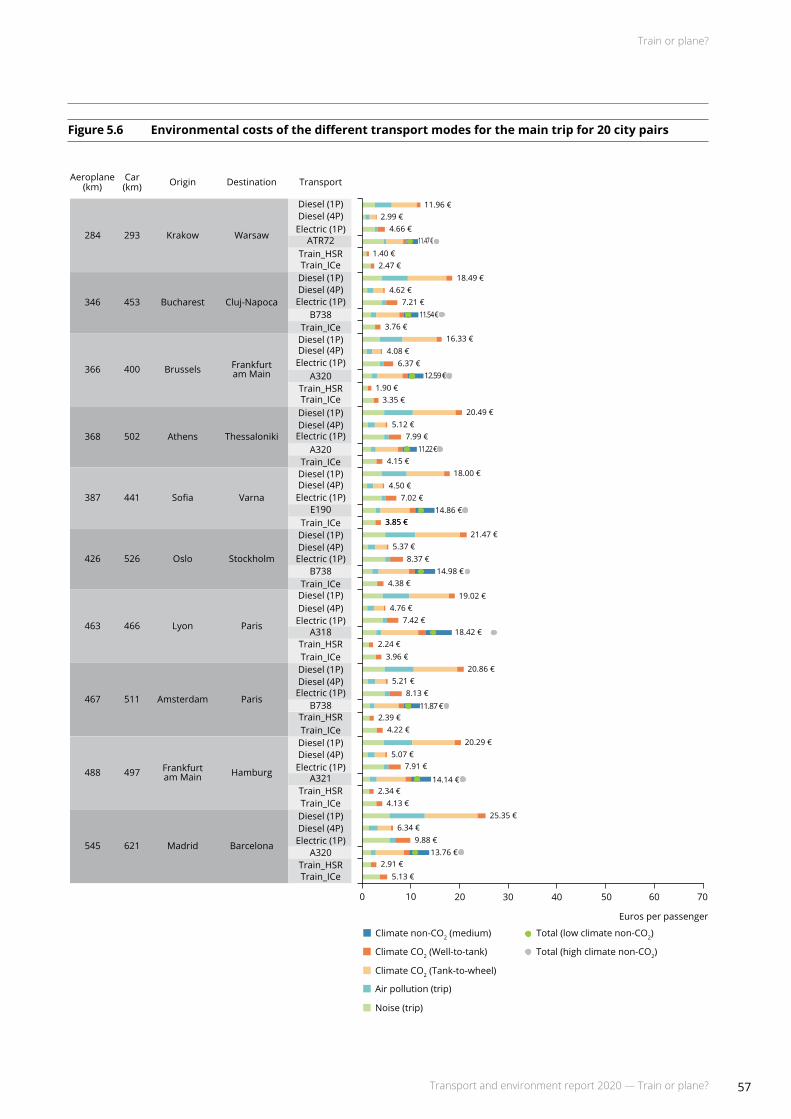
Train or plane?
57Transport and environment report 2020 — Train or plane?
Figure 5.6 Environmental costs of the different transport modes for the main trip for 20 city pairs
Climate non-CO2 (medium)
Climate CO2 (Well-to-tank)
Noise (trip)
Total (low climate non-CO2)
Total (high climate non-CO2)
Climate CO2 (Tank-to-wheel)
Air pollution (trip)
Aeroplane(km) DestinationOriginCar
(km) Transport
Diesel (1P)
293 Krakow
Bucharest
Brussels
Athens
Sofia
Oslo
Lyon
Amsterdam
Frankfurtam Main
Madrid
Warsaw
Cluj-Napoca
Frankfurtam Main
Thessaloniki
Varna
Stockholm
Paris
Paris
Hamburg
Barcelona
284
346
366
368
387
426
463
467
488
545
453
400
502
441
526
466
511
497
621
Electric (1P)Diesel (4P)
ATR72Train_HSRTrain_ICe
Diesel (1P)Diesel (4P)Electric (1P)
B738Train_ICe
Diesel (4P)Diesel (1P)
Electric (1P)A320
Train_HSRTrain_ICe
Diesel (1P)
Electric (1P)
Train_ICeDiesel (1P)
A320
Diesel (4P)Electric (1P)
E190Train_ICe
Diesel (1P)Diesel (4P)
B738Electric (1P)
Train_ICeDiesel (1P)
Electric (1P)Diesel (4P)
A318
Train_ICeDiesel (1P)Diesel (4P)
Train_HSR
Electric (1P)B738
Train_HSRTrain_ICe
Diesel (1P)Diesel (4P)Electric (1P)
A320Train_HSRTrain_ICe
Diesel (1P)Diesel (4P)Electric (1P)
A321
Train_ICeTrain_HSR
Diesel (4P)
Euros per passenger
700 10 20 30 40 50 60
11.96 €
11.47 €
2.99 €4.66 €
1.40 €2.47 €
18.49 €4.62 €
7.21 €11.54 €
3.76 €16.33 €
4.08 €6.37 €
12.59 €1.90 €
3.35 €20.49 €
5.12 €7.99 €
11.22 €
18.00 €4.15 €
4.50 €7.02 €
14.86 €3.85 €
21.47 €3.85 €
5.37 €8.37 €
14.98 €4.38 €
19.02 €4.76 €
7.42 €18.42 €
2.24 €3.96 €
20.86 €5.21 €
8.13 €11.87 €
2.39 €4.22 €
20.29 €5.07 €
7.91 €
14.14 €2.34 €
4.13 €25.35 €
6.34 €9.88 €
13.76 €2.91 €
5.13 €

Train or plane?
58 Transport and environment report 2020 — Train or plane?
Figure5.6 Environmentalcostsofthedifferenttransportmodesforthemaintripfor20citypairs(cont.)
Note: Grey dot — environmental cost with high value for non-CO2 climate cost. Green dot — environmental cost with low value for non-CO2 climatecost.HSR,high-speedrail;ICe,electricintercitytrain.
Source: EEA.
Climate non-CO2 (medium)
Climate CO2 (Well-to-tank)
Noise (trip)
Total (low climate non-CO2)
Total (high climate non-CO2)
Climate CO2 (Tank-to-wheel)
Air pollution (trip)
Aeroplane(km) DestinationOriginCar
(km) Transport
Diesel (1P)
657 Copenhagen
Madrid
Berlin
Vienna
Amsterdam
Frankfurtam Main
Milan
Milan
Budapest
Barcelona
Stockholm
Lisbon
Vienna
Zurich
Copenhagen
Ljubljana
Paris
Vienna
Frankfurtam Main
Paris
550
583
603
655
676
683
722
732
917
945
662
639
725
791
801
914
883
964
1 036
Electric (1P)Diesel (4P)
B738Train_HSRTrain_ICe
Diesel (1P)Diesel (4P)Electric (1P)
A320Train_ICe
Diesel (4P)Diesel (1P)
Electric (1P)A320
Train_ICeDiesel (1P)
Electric (1P)
Train_ICeDiesel (1P)
A320
Diesel (4P)Electric (1P)
B738Train_ICe
Diesel (1P)Diesel (4P)
A319Electric (1P)
Train_ICeDiesel (1P)
Electric (1P)Diesel (4P)
A320
Train_ICeDiesel (1P)Diesel (4P)
Train_HSR
Electric (1P)A320
Train_HSRTrain_ICe
Diesel (1P)Diesel (4P)Electric (1P)
A320Train_HSRTrain_ICe
Diesel (1P)Diesel (4P)Electric (1P)
A321Train_ICe
Diesel (4P)
Euros per passenger
700 10 20 30 40 50 60
26.82 €
16.85 €
6.70 €10.46 €
3.11 €5.50 €
27.02 €6.76 €
10.54 €13.61 €
5.24 €26.08 €
6.52 €10.17 €
16.62 €5.50 €
29.59 €7.40 €
11.54 €15.79 €
32.29 €6.05 €
8.07 €12.59 €
15.08 €6.60 €
32.69 €8.17 €
12.75 €41.27 €
6.73 €37.31 €
9.33 €14.55 €15.40 €
4.07 €
7.18 €36.04 €
9.01 €14.05 €
19.70 €4.16 €
7.35 €39.35 €
9.84 €15.34 €
19.99 €
42.29 €8.18 €
10.57 €16.49 €
17.54 €4.94 €
8.73 €

Train or plane?
59Transport and environment report 2020 — Train or plane?
Trajectory comparison of different transport modes
The previous section showed the relation between the different transport modes and their respective costs. It is,however,clearthatnotalltransportmodescanbeused on every trajectory. For example, not all city pairs are connected by HSR and large aircraft with a large number of passengers on board are not used for all city pairs. Therefore, Figure 5.6 indicates the environmental costs of travelling between the different city pairs, with their available transport modes.
The environmental costs displayed for each city pair and transport mode and their interrelationship are largely in line with the story in the previous section. However, some elements have an impact on the relative magnitude of the costs of the different transport modes.
The first element is the difference in trajectory length for the different transport modes. This is most evident for the Milan-Paris case. The distance travelled from the origintothedestinationis914 kmand722 kmforthecar and aeroplane, respectively. This makes an aeroplane more attractive when looking at the environmental cost, despite the — in most cases — higher costs for aeroplanes per kilometre travelled. A second influence is the aeroplane used on the trajectory. When an aeroplane with a lower number of seats is used, the cost per passenger increases and therefore this type of transport will be less attractive from an environmental perspective. Furthermore, the emission characteristics of the different aeroplanes can differ significantly. For some city pairs, relatively old aeroplanes are used, with a less efficient propulsion system than that of newer aeroplanes on other trajectories. A third parameter, which has only a small influence on the relative magnitudes, is the availability of an HSR connection between the two cities. If there is only an intercity train for the whole trajectory, the environmental costs for an electric car with four occupants will become comparable with trains. This, however, is not the case for electric cars with only one occupant, as these have a higher environmental cost than railtravel.
In addition to these elements, the transport to and from the railway station/airport could also have an impact on the relative performance of the transport modes. Details about how these costs were computed can be found in Annex 1. Figure 5.7 displays the environmental costs per main city pair. It can be seen that the impact of the environmental costs of pre- and post-transport phases is limited. In fact, these costs are even negligible for all transport modes except for air transport. This is because airports are most often located further away from the city centre than railway stations. Naturally there is no pre- and post-transport cost for trajectories with a passenger car as the main transport mode, as the whole trip is assumed to be done by car.
It must be noted here that the pre- and post-transport costs for trains in Figure 5.7 are shown only for intercity electrictrains;forcars,costsforonlyadieselcarwithone occupant are shown. However, even with this last relatively environmentally unfriendly transport mode the environmental costs of pre- and post-transport are negligible, except for cases where an aeroplane is the transport mode on the main trajectory.
The magnitude and share of the environmental costs of the pre- and post-transport phases increases, however, when these are calculated for the alternative city pairs. This is shown in Figure 5.8 and Figure 5.9. These figures present the environmental costs for the main and alternative city pair, respectively, in the Barcelona-Paris case. When the train is the main transport mode, Figure 5.9 shows a non-negligible, andactuallylarge,environmentalcostforthepre- andpost-transport phases in contrast to Figure 5.8. For air transport as the main transport mode, the difference is rather limited. In both cases, the cost is non-negligible, depending on the mode that is chosen. It should be noted here that the chosen main trajectory is rather long, so that the environmental cost of pre- and post-transport phases are, of course, of lesser importance in this case. The environmental costs for the other city pairs can be found in Annex 2 and show comparable results.
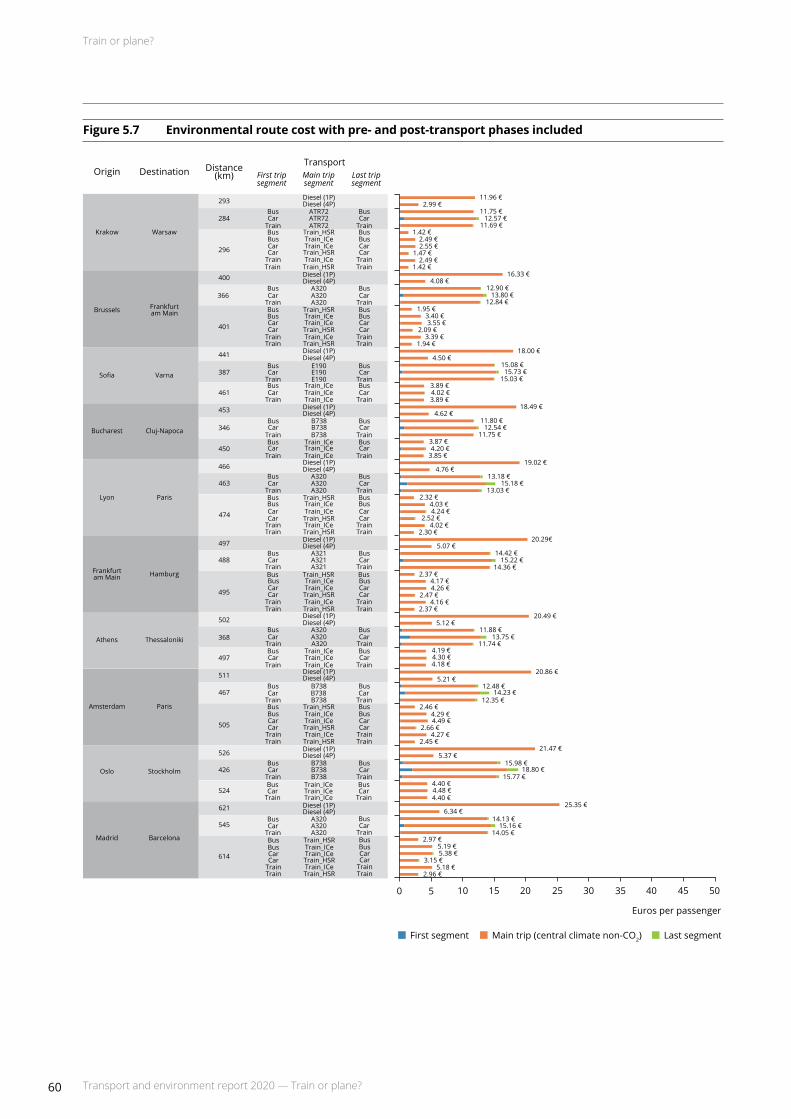
Train or plane?
60 Transport and environment report 2020 — Train or plane?
Euros per passenger
500 5 10 15 20 25 30 35 40 45
Last segmentMain trip (central climate non-CO2)First segment
BusCar
Train
BusBus
CarCar
TrainTrain
CarTrain
Bus
BusBus
CarCar
TrainTrain
BusCar
BusCar
Train
Train
BusCar
TrainBus
TrainCar
Bus
TrainBus
Car
BusCar
TrainTrain
Car
CarTrain
Bus
BusBus
CarTrain
Car
Train
BusCar
Train
CarTrain
Bus
BusCar
BusTrain
BusCar
TrainTrain
Car
CarBus
TrainBus
TrainCar
BusCar
Train
BusBus
CarCar
TrainTrain
CarTrain
Bus
BusBus
CarCar
TrainTrain
BusCar
BusCar
Train
Train
BusCar
TrainBus
TrainCar
Bus
TrainBus
Car
BusCar
TrainTrain
Car
CarTrain
Bus
BusBus
CarTrain
Car
Train
BusCar
Train
CarTrain
Bus
BusCar
BusTrain
BusCar
TrainTrain
Car
CarBus
TrainBus
TrainCar
Diesel (1P)293
284
Krakow
Brussels
Sofia
Bucharest
Lyon
Frankfurtam Main
Athens
Amsterdam
Oslo
Madrid
Warsaw
Frankfurtam Main
Varna
Cluj-Napoca
Paris
Hamburg
Thessaloniki
Paris
Stockholm
Barcelona
296
400
366
401
441
387
461
453
346
450
466
463
474
497
488
495
502
368
497
511
467
505
526
426
524
621
545
614
ATR72Diesel (4P)
ATR72ATR72
Train_ICeTrain_HSR
Train_ICeTrain_HSR
Train_HSRTrain_ICe
Diesel (1P)Diesel (4P)
A320A320
A320
Train_HSRTrain_ICe
Train_HSRTrain_ICe
Train_ICeTrain_HSR
Diesel (4P)Diesel (1P)
E190E190
Train_ICeTrain_ICe
E190
Train_ICeDiesel (1P)
B738B738B738
Train_ICe
Train_ICeDiesel (1P)
Train_ICe
Diesel (4P)A320
A320Train_HSR
A320
Train_ICeTrain_ICe
Train_ICeTrain_HSR
Train_HSR
Diesel (1P)Diesel (4P)
A321A321
A321
Train_HSRTrain_ICe
Train_HSRTrain_ICe
Train_ICe
Train_HSRDiesel (1P)
A320Diesel (4P)
A320A320
Train_ICeTrain_ICe
Diesel (1P)Diesel (4P)
Train_ICe
B738B738
Train_HSRB738
Train_ICeTrain_ICe
Train_ICeTrain_HSR
Train_HSR
BusCar
BusTrain
BusCar
TrainTrain
Car
BusCar
BusTrain
BusCar
TrainTrain
Car
Diesel (1P)Diesel (4P)
A320A320
Train_HSRA320
Train_ICeTrain_ICe
Train_ICeTrain_HSR
Train_HSR
Diesel (1P)Diesel (4P)
B738B738
B738Train_ICe
Train_ICeTrain_ICe
Diesel (4P)
Main tripsegment
Last tripsegment
First tripsegment
DestinationOrigin Distance(km)
Transport
11.96 €2.99 €
11.75 €12.57 €
11.69 €1.42 €
2.49 €2.55 €
1.47 €2.49 €
1.42 €16.33 €
4.08 €12.90 €
13.80 €12.84 €
1.95 €3.40 €3.55 €
2.09 €3.39 €
1.94 €18.00 €
4.50 €15.08 €15.73 €
15.03 €3.89 €4.02 €3.89 €
18.49 €4.62 €
11.80 €12.54 €
11.75 €3.87 €4.20 €
3.85 €19.02 €
4.76 €13.18 €
15.18 €13.03 €
2.32 €4.03 €4.24 €
2.52 €4.02 €
2.30 €20.29€
5.07 €14.42 €
15.22 €14.36 €
2.37 €4.17 €4.26 €
2.47 €4.16 €
2.37 €20.49 €
5.12 €11.88 €
13.75 €11.74 €
4.19 €4.30 €4.18 €
20.86 €5.21 €
12.48 €14.23 €
12.35 €2.46 €
4.29 €4.49 €
2.66 €4.27 €
2.45 €21.47 €
5.37 €15.98 €
18.80 €15.77 €
4.40 €4.48 €4.40 €
25.35 €6.34 €
14.13 €15.16 €
14.05 €2.97 €
5.19 €5.38 €
3.15 €5.18 €
2.96 €
Figure 5.7 Environmental route cost with pre- and post-transport phases included
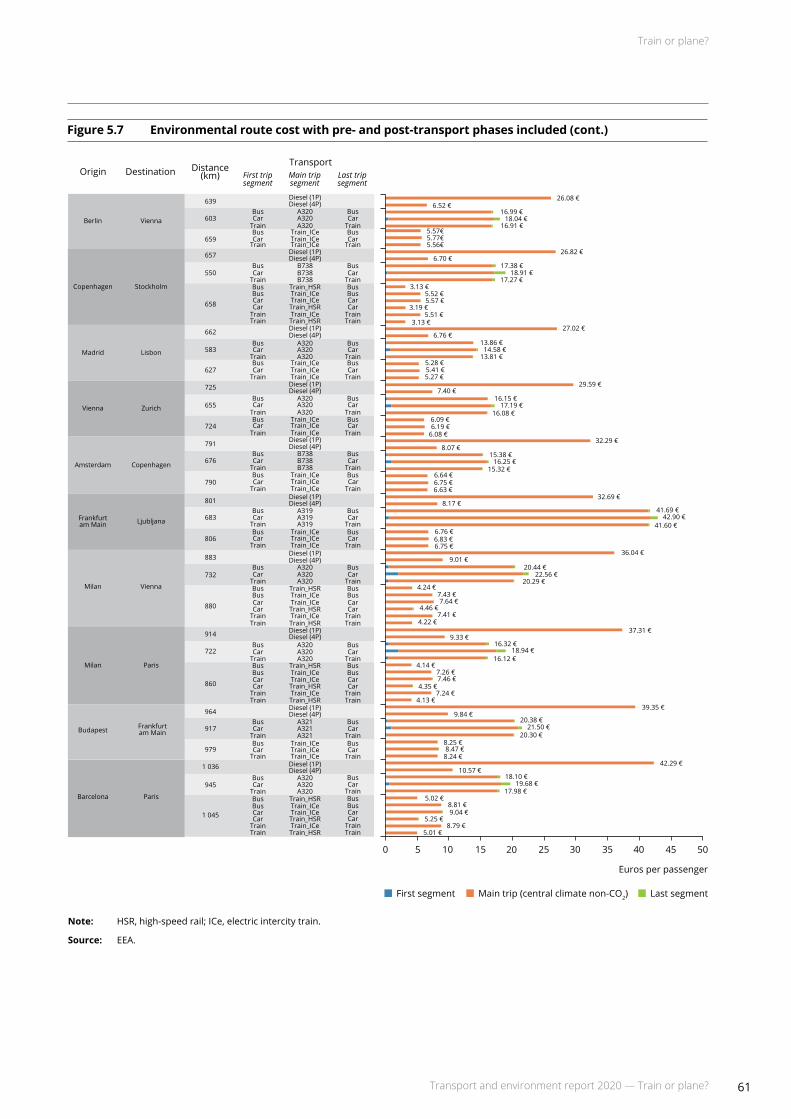
Train or plane?
61Transport and environment report 2020 — Train or plane?
500 5 10 15 20 25 30 35 40 45
Last segmentMain trip (central climate non-CO2)First segment
Euros per passenger
BusCar
Train
CarBus
Train
CarTrain
Bus
BusBus
CarCar
TrainTrain
BusCar
BusCar
Train
Train
BusCar
TrainBus
TrainCar
Bus
TrainBus
Car
CarTrain
CarTrain
Bus
BusCar
Train
BusCar
Train
BusCar
Bus
BusCar
BusTrain
BusCar
TrainTrain
Car
CarBus
TrainBus
TrainCar
BusCar
Train
CarBus
Train
CarTrain
Bus
BusBus
CarCar
TrainTrain
BusCar
BusCar
Train
Train
BusCar
TrainBus
TrainCar
Bus
TrainBus
Car
CarTrain
CarTrain
Bus
BusCar
Train
BusCar
Train
BusCar
Bus
BusCar
BusTrain
BusCar
TrainTrain
Car
CarBus
TrainBus
TrainCar
Diesel (1P)639
603
659
Berlin
Copenhagen
Madrid
Vienna
Amsterdam
Frankfurtam Main
Milan
Milan
Budapest
Barcelona
Vienna
Stockholm
Lisbon
Zurich
Copenhagen
Ljubljana
Vienna
Paris
Frankfurtam Main
Paris
657
550
658
662
583
627
725
655
724
791
676
790
801
683
806
883
732
880
914
722
860
964
917
979
1 036
945
1 045
A320Diesel (4P)
A320A320
Train_ICeTrain_ICe
Train_ICeDiesel (1P)Diesel (4P)
B738B738
B738
Train_HSRTrain_ICe
Train_HSRTrain_ICe
Train_ICeTrain_HSR
Diesel (4P)Diesel (1P)
A320A320
Train_ICeTrain_ICe
A320
Train_ICeDiesel (1P)
A320A320A320
Train_ICe
Train_ICeDiesel (1P)
Train_ICe
Diesel (4P)B738
B738Train_ICe
B738
Train_ICeTrain_ICe
Diesel (1P)Diesel (4P)
A319A319
A319
Train_ICeTrain_ICeTrain_ICe
Diesel (1P)
A320Diesel (4P)
A320A320
Train_ICeTrain_ICe
Diesel (1P)Diesel (4P)
Train_HSR
TrainTrain
CarTrainTrain
CarTrain_ICeTrain_HSR
Train_HSR
A320A320
Train_HSRA320
Train_ICeTrain_ICe
Train_ICeTrain_HSR
Train_HSR
BusCar
BusTrain
BusCar
TrainTrain
Car
BusCar
BusTrain
BusCar
TrainTrain
Car
Diesel (1P)Diesel (4P)
A320A320
Train_HSRA320
Train_ICeTrain_ICe
Train_ICeTrain_HSR
Train_HSR
Diesel (1P)Diesel (4P)
A321A321
A321Train_ICe
Train_ICeTrain_ICe
Diesel (4P)
Main tripsegment
Last tripsegment
First tripsegment
DestinationOrigin Distance(km)
Transport
26.08 €6.52 €
16.99 €18.04 €
16.91 €5.57€
5.56€5.77€
26.82 €6.70 €
17.38 €18.91 €
17.27 €3.13 €
5.52 €5.57 €
3.19 €5.51 €
3.13 €27.02 €
6.76 €13.86 €
14.58 €13.81 €
5.28 €5.41 €5.27 €
29.59 €7.40 €
16.15 €17.19 €
16.08 €6.09 €6.19 €
6.08 €32.29 €
8.07 €15.38 €
16.25 €15.32 €
6.64 €6.75 €6.63 €
32.69 €8.17 €
41.69 €42.90 €
41.60 €6.76 €6.83 €6.75 €
36.04 €9.01 €
20.44 €22.56 €
20.29 €4.24 €
7.43 €7.64 €
4.46 €7.41 €
4.22 €37.31 €
9.33 €16.32 €
18.94 €16.12 €
4.14 €7.26 €7.46 €
4.35 €7.24 €
4.13 €39.35 €
9.84 €20.38 €
21.50 €20.30 €
8.25 €8.47 €
8.24 €42.29 €
10.57 €18.10 €
19.68 €17.98 €
5.02 €8.81 €9.04 €
5.25 €8.79 €
5.01 €
Figure5.7 Environmentalroutecostwithpre-andpost-transportphasesincluded(cont.)
Note: HSR,high-speedrail;ICe,electricintercitytrain.
Source: EEA.
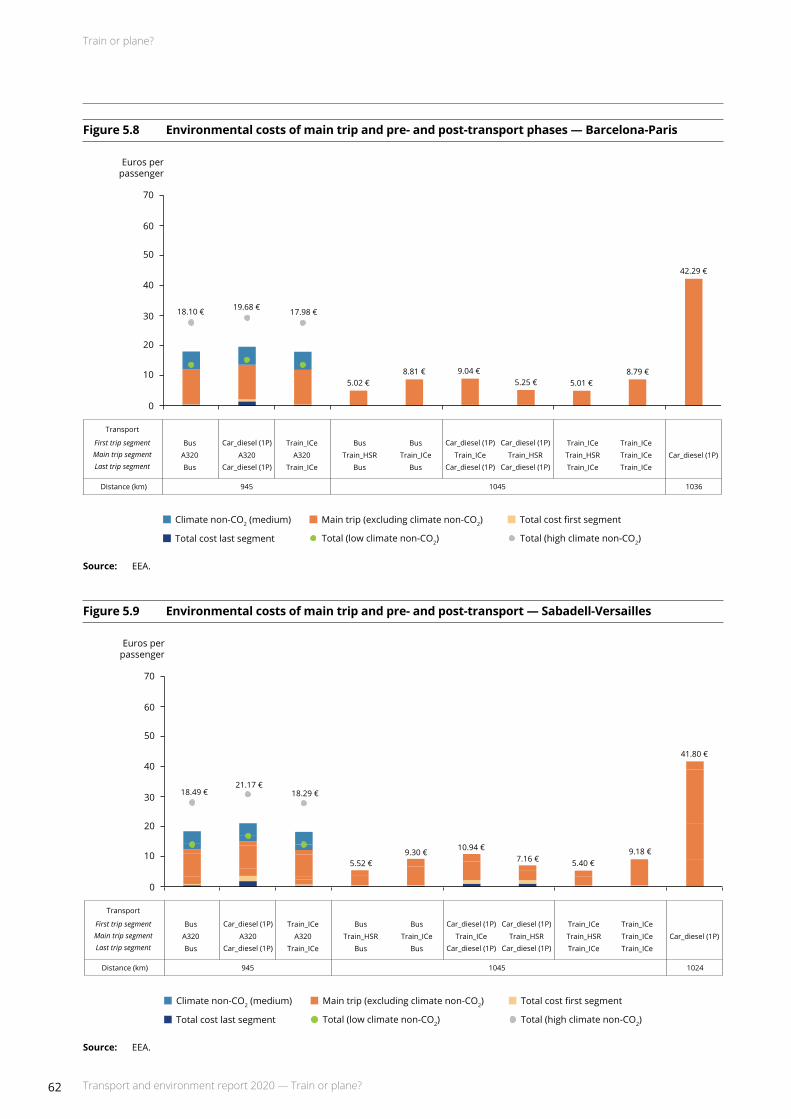
Train or plane?
62 Transport and environment report 2020 — Train or plane?
Figure 5.8 Environmental costs of main trip and pre- and post-transport phases — Barcelona-Paris
Figure 5.9 Environmental costs of main trip and pre- and post-transport — Sabadell-Versailles
Bus
Bus
Car_diesel (1P)
Car_diesel (1P) Train_ICe
Train_ICe
945
A320 A320 A320
Train_ICe
Train_ICe
Train_ICe
Main trip segmentLast trip segment
First trip segment
Transport
Distance (km) 1036
Car_diesel (1P)
Car_diesel (1P) Train_ICe
Train_ICeTrain_HSR Train_HSR
1045
Bus
Bus
Train_ICe
Bus
Bus Car_diesel (1P)
Car_diesel (1P)
Train_HSRCar_diesel (1P) Train_ICe
50
60
70
40
30
20
10
0
19.68 € 17.98 €
42.29 €
5.02 €8.81 € 9.04 €
5.25 € 5.01 €8.79 €
18.10 €
Climate non-CO2 (medium) Main trip (excluding climate non-CO2)
Total (low climate non-CO2) Total (high climate non-CO2)
Total cost first segment
Total cost last segment
Euros per passenger
Source: EEA.
Source: EEA.
Bus
Bus
Car_diesel (1P)
Car_diesel (1P) Train_ICe
Train_ICe
945
A320 A320 A320
Train_ICe
Train_ICe
Train_ICe
Main trip segmentLast trip segment
First trip segment
Transport
Distance (km) 1024
Car_diesel (1P)
Car_diesel (1P) Train_ICe
Train_ICeTrain_HSR Train_HSR
1045
Bus
Bus
Train_ICe
Bus
Bus Car_diesel (1P)
Car_diesel (1P)
Train_HSRCar_diesel (1P) Train_ICe
18.49 €21.17 €
18.29 €
41.80 €
5.52 €9.30 € 10.94 €
7.16 € 5.40 €9.18 €
50
60
70
40
30
20
10
Euros per passenger
0
Climate non-CO2 (medium) Main trip (excluding climate non-CO2)
Total (low climate non-CO2) Total (high climate non-CO2)
Total cost first segment
Total cost last segment
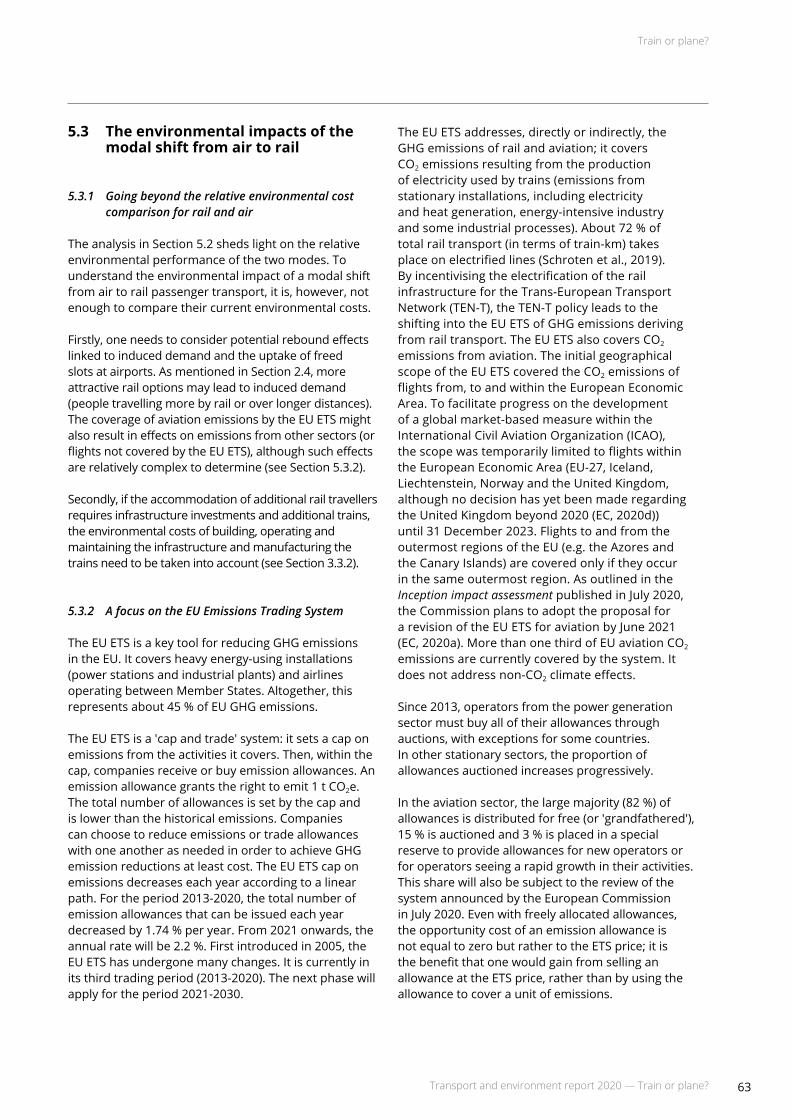
Train or plane?
63Transport and environment report 2020 — Train or plane?
5.3 The environmental impacts of the modal shift from air to rail
5.3.1 Going beyond the relative environmental cost comparison for rail and air
The analysis in Section 5.2 sheds light on the relative environmental performance of the two modes. To understand the environmental impact of a modal shift from air to rail passenger transport, it is, however, not enough to compare their current environmental costs.
Firstly, one needs to consider potential rebound effects linked to induced demand and the uptake of freed slots at airports. As mentioned in Section 2.4, more attractive rail options may lead to induced demand (people travelling more by rail or over longer distances). ThecoverageofaviationemissionsbytheEU ETSmightalso result in effects on emissions from other sectors (or flightsnotcoveredbytheEU ETS),althoughsucheffectsare relatively complex to determine (see Section 5.3.2).
Secondly, if the accommodation of additional rail travellers requires infrastructure investments and additional trains, the environmental costs of building, operating and maintaining the infrastructure and manufacturing the trains need to be taken into account (see Section 3.3.2).
5.3.2 A focus on the EU Emissions Trading System
TheEU ETSisakeytoolforreducingGHGemissionsin the EU. It covers heavy energy-using installations (power stations and industrial plants) and airlines operating between Member States. Altogether, this representsabout45 %ofEUGHGemissions.
TheEU ETSisa'capandtrade'system:itsetsacaponemissions from the activities it covers. Then, within the cap, companies receive or buy emission allowances. An emissionallowancegrantstherighttoemit1 t CO2e. The total number of allowances is set by the cap and is lower than the historical emissions. Companies can choose to reduce emissions or trade allowances with one another as needed in order to achieve GHG emissionreductionsatleastcost.TheEU ETScaponemissions decreases each year according to a linear path. For the period 2013-2020, the total number of emission allowances that can be issued each year decreasedby1.74 %peryear.From2021onwards,theannualratewillbe2.2%.Firstintroducedin2005,theEU ETShasundergonemanychanges.Itiscurrentlyinits third trading period (2013-2020). The next phase will apply for the period 2021-2030.
TheEU ETSaddresses,directlyorindirectly,theGHGemissionsofrailandaviation;itcoversCO2 emissions resulting from the production of electricity used by trains (emissions from stationary installations, including electricity and heat generation, energy-intensive industry andsomeindustrialprocesses).About72 %oftotal rail transport (in terms of train-km) takes place on electrified lines (Schroten et al., 2019). By incentivising the electrification of the rail infrastructure for the Trans-European Transport Network (TEN-T), the TEN-T policy leads to the shiftingintotheEU ETSofGHGemissionsderivingfromrailtransport.TheEU ETSalsocoversCO2 emissions from aviation. The initial geographical scopeoftheEU ETScoveredtheCO2 emissions of flights from, to and within the European Economic Area. To facilitate progress on the development of a global market-based measure within the International Civil Aviation Organization (ICAO), the scope was temporarily limited to flights within the European Economic Area (EU-27, Iceland, Liechtenstein, Norway and the United Kingdom, although no decision has yet been made regarding the United Kingdom beyond 2020 (EC, 2020d)) until31 December2023.Flightstoandfromtheoutermost regions of the EU (e.g. the Azores and the Canary Islands) are covered only if they occur in the same outermost region. As outlined in the Inception impact assessmentpublishedinJuly2020,the Commission plans to adopt the proposal for arevisionoftheEU ETSforaviationbyJune2021(EC, 2020a). More than one third of EU aviation CO2 emissions are currently covered by the system. It does not address non-CO2 climate effects.
Since 2013, operators from the power generation sector must buy all of their allowances through auctions, with exceptions for some countries. In other stationary sectors, the proportion of allowances auctioned increases progressively.
Intheaviationsector,thelargemajority(82 %)ofallowances is distributed for free (or 'grandfathered'), 15 %isauctionedand3 %isplacedinaspecialreserve to provide allowances for new operators or for operators seeing a rapid growth in their activities. This share will also be subject to the review of the system announced by the European Commission inJuly2020.Evenwithfreelyallocatedallowances,the opportunity cost of an emission allowance is notequaltozerobutrathertotheETSprice;itisthe benefit that one would gain from selling an allowance at the ETS price, rather than by using the allowance to cover a unit of emissions.
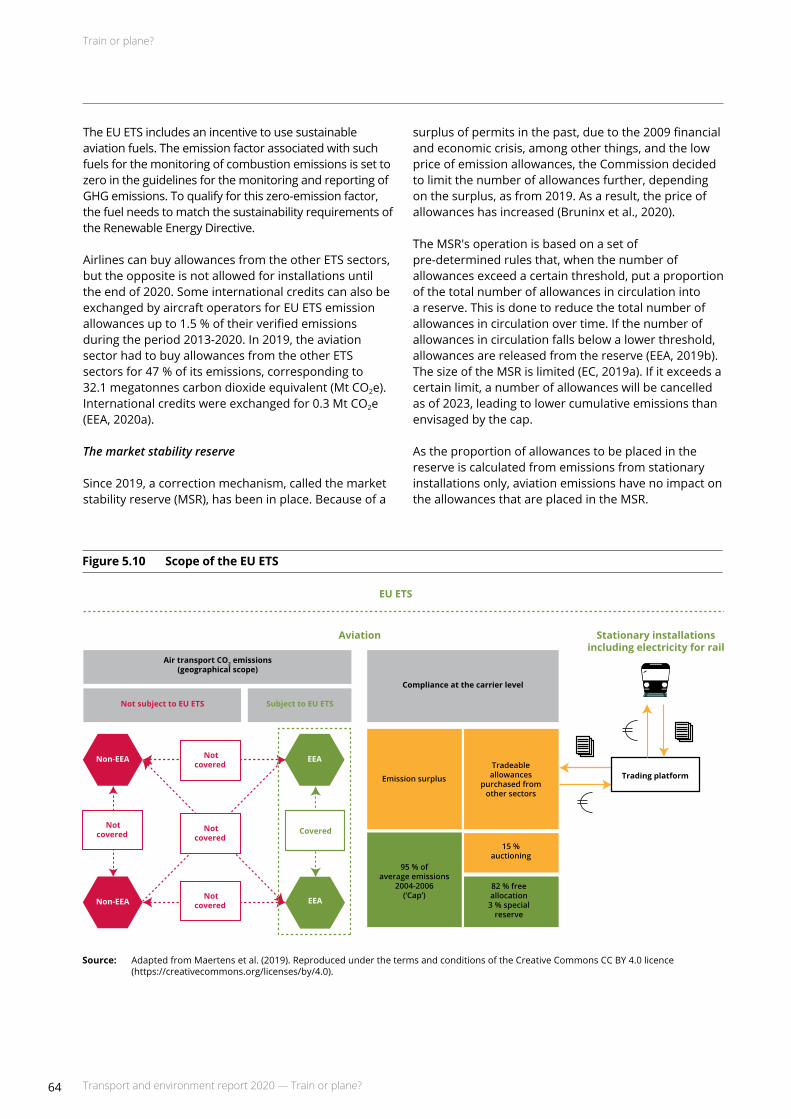
Train or plane?
64 Transport and environment report 2020 — Train or plane?
TheEU ETSincludesanincentivetousesustainableaviation fuels. The emission factor associated with such fuels for the monitoring of combustion emissions is set to zero in the guidelines for the monitoring and reporting of GHG emissions. To qualify for this zero-emission factor, the fuel needs to match the sustainability requirements of the Renewable Energy Directive.
Airlines can buy allowances from the other ETS sectors, but the opposite is not allowed for installations until the end of 2020. Some international credits can also be exchangedbyaircraftoperatorsforEU ETSemissionallowancesupto1.5 %oftheirverifiedemissionsduring the period 2013-2020. In 2019, the aviation sector had to buy allowances from the other ETS sectorsfor47 %ofitsemissions,correspondingto32.1megatonnescarbondioxideequivalent(Mt CO2e). Internationalcreditswereexchangedfor0.3 Mt CO2e (EEA, 2020a).
The market stability reserve
Since 2019, a correction mechanism, called the market stability reserve (MSR), has been in place. Because of a
surplus of permits in the past, due to the 2009 financial and economic crisis, among other things, and the low price of emission allowances, the Commission decided to limit the number of allowances further, depending on the surplus, as from 2019. As a result, the price of allowances has increased (Bruninx et al., 2020).
The MSR's operation is based on a set of pre-determined rules that, when the number of allowances exceed a certain threshold, put a proportion of the total number of allowances in circulation into a reserve. This is done to reduce the total number of allowances in circulation over time. If the number of allowances in circulation falls below a lower threshold, allowances are released from the reserve (EEA, 2019b). The size of the MSR is limited (EC, 2019a). If it exceeds a certain limit, a number of allowances will be cancelled as of 2023, leading to lower cumulative emissions than envisaged by the cap.
As the proportion of allowances to be placed in the reserve is calculated from emissions from stationary installations only, aviation emissions have no impact on the allowances that are placed in the MSR.
Figure5.10 ScopeoftheEU ETS
Source: Adapted from Maertens et al. (2019). Reproduced under the terms and conditions of the Creative Commons CC BY 4.0 licence (https://creativecommons.org/licenses/by/4.0).
Non-EEA
Non-EEA
Notcovered
EEA
Covered
EEA
Notcovered
Notcovered
Emission surplus
Notcovered
95 % of average emissions
2004-2006(’Cap’)
Tradeable allowances
purchased from other sectors
15 % auctioning
82 % free allocation
3 % special reserve
Trading platform
Not subject to EU ETS
Air transport CO2 emissions(geographical scope)
Compliance at the carrier level
Subject to EU ETS
Aviation Stationary installationsincluding electricity for rail
EU ETS

Train or plane?
65Transport and environment report 2020 — Train or plane?
5.3.3 The EU ETS and the reduction in GHG emissions from a modal shift from air to rail
GHG emissions from aviation within the European Economic Area and from the electricity used in the rail sector are both part of the same cap and trade system—theEU ETS.Foraviation,theEU ETSisrelevant for CO2 emissions related to the jet fuel burn as well as part of the WTT GHG emissions for the jet fuelproducedinthecountriescoveredbytheEU ETS.The non-CO2 impacts of aviation on climate change arenotaddressedbytheEU ETS,andthereforethemechanisms described below do not apply to them. Forrailtransport,theEU ETSisrelevantfortheGHGemissions caused by electricity production.
The inclusion of CO2 emissions from electricity used by rail and the emissions from intra-EEA aviation in theEU ETSmeansthatanETSpriceaffectsemissionsfrom both modes of transport. As air transport is more carbon intensive than electric rail transport, the relative cost increase of air transport compared with that of rail transportishigherthanintheabsenceoftheEU ETS.Hence, this system encourages a modal shift from air to railtransportfortheareacoveredbytheEU ETS.
InthecontextoftheEU ETS,theconsequencesofa modal shift from plane to train on the number of available allowances, ETS prices and, ultimately, GHG emissions are particularly complex to analyse. From a simplistic point of view, the net reduction in emissions for travel realised by the switch from air to rail would reducethenetdemandforemissionallowances;thefreed-up allowances would become available to other ETS sectors, which would have the possibility of buying them and increasing their emissions. The total cap on emissions, which reflects the EU's ambitions to reduce GHG emissions, would continue to be respected.
In reality, such effects are difficult to analyse, in particular from the quantitative point of view. As explained above, aviation emissions do not affect the number of allowances placed in the MSR and therefore the number of auctioned allowances. In the current context, where the aviation sector is a net buyer of stationary allowances, the reduction in aviation emissions would reduce the overall demand for auctioned allowances. This would, in turn, be a factor in decreasing allowance auction prices —oneof arangeofmanyotherfactorsaffectingauction prices. This decreasing effect could be counterbalanced, to a limited extent, by the increased demand for allowances from the power generation sector in order to cover for increased electricity use resulting from train travel. The demand for allowances could also be affected by the increased emissions from other industrial ETS sectors contributing to the additional development of railway infrastructure (e.g. steel and cement).
The relative effects of these factors on auction prices and their further impact on emissions from other sectors could be determined by studying the relative impacts of various parameters to draw clear conclusions on the overall impact of a modal shift from aviation to rail. The overall effect of a decrease in aviation emissions would depend on the magnitude of the decrease.
Although there are uncertainties regarding the consequencesoftheEU ETSfortheenvironmentalcosts of rail and air transport within the European Economic Area, the impacts of a modal shift from plane to train are much clearer for those environmental costs notcoveredbytheEU ETS.Theseconsistofthenoisecosts and the air pollution costs and for aviation they also include the non-CO2 climate costs.

Transport and environment report 2020 — Train or plane?66
Further considerations and recommendations
6 Further considerations and recommendations
6.1 Introduction
The environmental performance of rail and air passenger transport presented in this report is a snapshot of the current situation. Therefore, it is important to also consider how this picture may change inthefuture.ThisisdiscussedinSection6.2.
In addition, given the better environmental performance of rail compared with air travel, this chapter considers how the shift from air to rail can be promoted. This is the topic of Section 6.3.
A general consideration is that policymaking in this field requires good data. For air transport, Eurostat publishes a relatively extensive data set at various levels of detail, although data on air travel per distance class are not readily available. For rail transport, the publicly available data are more limited. These data gaps make assessing the situation today and evaluating existing and new policy options more difficult.
Key messages
• The environmental performance of rail and air transport can be expected to improve in the future. Alongside market mechanisms, policies play an important role by providing incentives for the development and adoption of new technologies and fuels. Better traffic management, more efficient operations and other actions can also improve the environmental sustainability of rail and air transport.
• Confronting rail and air travellers with the non-internalised environmental costs of their travel choices is an important way to strike a balance between rail and air transport.
• Travel time cost and travel time reliability are the key parameters that influence modal choice. Improving the efficiency and reliability of rail passenger transport and making it more seamless across European borders is key to increasing its attractiveness. Factors such as convenience, comfort, quality of service and safety also merit additional attention.
• Although some of the approaches to increase rail travel's speed and capacity can be implemented in the short to medium term, many require substantial investments and take a long time. The same applies for the (re-)introduction of night trains, which could offer a strategy to deal with longer rail travel times. In all cases the social benefits should be compared with the social costs, including the environmental costs.
6.2 What factors influence the future environmental performance of these modes?
The environmental performance of rail and air travel as presented in Chapter 5 can be expected to change in the future. This will be the case not only for rail and air transport but also for the other modes of transport.
For air transport, the future environmental performance depends on further technical improvements in aircraft design and technology, including a possible move to electric, hybrid electric or hydrogen-powered aircraft for some market segments, improvements in air traffic management, improvementsinairtransportoperations(e.g. changesin the occupancy rates of the aircraft), and the uptake of sustainable aviation fuels. Depending on the conversion technology and the type of feedstock, such fuels could realise a reduction in greenhouse gas (GHG) emissionsofbetween26 %and94 %(EASA etal.,2019).
Further considerations and recommendations
67Transport and environment report 2020 — Train or plane?
However, these figures do not yet take into account negative effects from (in)direct land use change. Recently, the role that synthetic fuels produced with renewable energy could play in the longer term has also attracted a lot of attention. The extent to which these developments take place will be influenced to a large degree by policies. The policies currently in place, including the EU Emissions Trading System (ETS), have been discussed in Chapter 4, but further incentives for research and development (R&D) of new technologies and sustainable aviation fuels, as well as other incentives for the uptake of these technologies and fuels, would accelerate change further. For example, for sustainable aviation fuels, various options exist, such as a fuel facilitation initiative, a fuel monitoring system, subsidies for such fuels, an auctioning system or an aviation-specific blending mandate (EASA, 2020a, 2020b;EC,2020h).
In the rail sector, further improvements can also be expected. For rail transport, the further electrification of rail and the fact that electric rail transport is indirectlyincludedintheEU ETS,withadecreasingcap,will reduce the climate impacts. The Renewable Energy Directive also aims to reduce the climate impact of electricity production. In addition, the environmental performance will be determined by the standards that are set for new trains and by the measures that are taken to reduce noise exposure. The environmental performance will also depend on the evolution of occupancy rates, as for air transport.
6.3 Actions and policies to promote a more environmentally sustainable modal choice
The promotion of rail transport over air transport, in the light of its better environmental performance, must build on an understanding of the factors that play a role when people make travel choices. As discussed in Section 2.4.1,themainfactorsinfluencingthemodalchoice are price, travel time, travel time reliability, frequency of the connections and other factors such as convenience, comfort and safety (Clewlow et al., 2014;GivoniandDobruszkes,2013;SavelberganddeLange, 2018).
As discussed in Section 2.4, in some cases the presence of a high-speed rail (HSR) connection leads to fewer air services or could even result in discontinuing the air link. In the latter case the modal choice is between rail and road transport. The same situation would arise if governments put conditions on the air services that can still be offered for connections with a good rail connection. For example, in France the state aid provided to Air France during the COVID-19 crisis is
conditional on its limiting domestic flights between cities connected by a rail journey of less than 2.5 hours (RailExpress, 2020).
Considering then the case in which people do have the choice between rail and air transport, it is useful to consider in more detail what the factors influencing modal choice are.
The first factor is the travel cost. Both for rail and air travel, the direct financial cost is the ticket price. Given yield management strategies, there is high variability in fares. Fares depend on the time of booking and the time of travel, whether the trip can be changed and refunded or not, etc. Supplements often apply for air travel if one wishes to reserve a seat or take luggage.
For aviation, most countries in the European Economic Area charge value added tax (VAT) on domestic flights, with many countries applying lower rates than the standard VAT rates (CE Delft and SEO Amsterdam Economics, 2019). International air travellers do not pay VAT, and only Norway and Switzerland levy a tax on jet fuel for domestic flights. For travel in the area coveredbytheEU ETS,railandairoperatorsare(in)directlyconfrontedwithacarbonpriceviatheEU ETSallowance cost. Depending on the pricing policies of the rail and air companies, this cost will form part of theticketprice.TheEU ETScurrentlyappliesonlytoflights within the European Economic Area. The future impact of CORSIA (the Carbon Offsetting and Reduction Scheme for International Aviation) is still uncertain and it has not yet been decided how it will relate to the EU ETS.However,theoffsetpricewillincreasethecostsfor airlines, which then also have to decide to what extent they want to let their customers pay for this, as inthecaseoftheEU ETS.
Using taxes to confront travellers with the non-internalised environmental costs of their travel is an important way to create a balance between rail and airtransport.
The second factor is travel time cost and travel time reliability. Travel time costs take into account the total travel time and the fact that different parts of the journey may be perceived as more costly than others. For example, the perceived time costs are higher for unpleasant or cumbersome parts of the journey (especially when one travels with luggage), such as transfers, the need to hurry to make a transfer and time required for security procedures. Apart from the travel time cost, the reliability of travel time also plays a role, which depends on congestion, incidents, etc. Action can be taken to improve rail travel time costs to make it a more attractive choice.

Further considerations and recommendations
68 Transport and environment report 2020 — Train or plane?
For air travel, the time flying is only part of the travel time. Travel time to and from the airport, as well as check-in time and time required for security procedures and luggage collection cause the total air travel time to be significantly longer than the time spent flying. Usually people experience this extra time as more bothersome than the time spent flying. The Flightpath 2050 vision (EC, 2011a) sets a concrete goal that'90 %oftravellersshouldbeabletocompletetheir journey door-to-door within 4 hours throughout Europe'. It adds that 'Passengers … are able to transfer seamlessly between transport modes to reach the final destination smoothly, predictably and on-time.' Such ambitions make it even more imperative to improve the travel time experience by rail.
For rail travel, the journey to and from the railway station can be shorter than that to the airport. However, as discussed in Section 5.3.2, the distance travelled for first and last mile travel depends on the point of origin and destination and whether they are close to the railway station. Usually when travelling by rail there is no extra time required for check-in, security and luggage reclaim. However, time spent on the train can be substantially longer and, if transfers need to be made, transfer time is experienced as more bothersome than the time on the train. In contrast, when travelling by train there may be more possibilities to work or relax than when travelling in economy class by air.
Rail travel time can be improved in various ways (APPM and Goudappel Coffeng, 2015), either by improving the efficiency of use of the existing infrastructure or by making changes in the infrastructure. Operators can improve the travel time costs by offering more direct connections or reducing the number of stops. The latter, of course, means that people that use these stops then have to make a transfer. Travel time can also be improved by improving cross-border travel and ensuring better interoperability, which the railway packages adopted at the EU level aim to realise. Other ways are to increase the speed on tracks where trains still run slower than the maximum speed, to increase the maximum speed of existing tracks, to build additional passing tracks that faster trains can use to pass slower trains or to provide new high-speed services onnewhigh-speedtracks.RegardingHSR,Figure 2.3in Chapter 2 presents the connections in the EU for which a further expansion of HSR infrastructure is planned. From this discussion, it is clear that in addition to the role for train operators, there are also roles for the EU, national governments and network operators.
Another strategy to deal with longer rail travel times for longer distances (e.g. between 800 and 1 200 km) is an increased use of night trains. The time and money cost of travel is then compensated for by saving the cost of hotel accommodation. For example, a recent report identified eight destinations that could potentially be served from the Netherlands: Copenhagen, Milan, Munich, Prague, Turin,Vienna,WarsawandZurich(Savelberg, 2019).Another example is the study by UIC and DB International (2013) on the potential for operating very-long-distance night trains on high-speed networks. In the study for the Netherlands, Savelberg (2019) points out that there are still a number of barriers, some of which are also mentioned in the study by UIC and DB International (2013). More specifically, night trains are costly to operate. To these costs, high infrastructure charges are added on account of the long distance and the presence of additional charges on top of the base tariff. The study also points out that the operators that were consulted consider the infrastructure charges high, although they do not yet cover all infrastructure costs. A point raised by the operators was the lack of a level playing field with air transport. Another barrier has to do with competition from regular rail services for the capacity of the infrastructure because both services run on the same infrastructure. The study estimates that, if these barriers are removed, in the longrun0.7-1 milliontripsperyearcouldbemadeby night train on these connections (Savelberg, 2019). However, the noise impacts of night trains are larger than for similar trains during the day, because of the lower background noise levels and the health impacts of sleep disturbance (see Figure 3.10).
Although some of the approaches to increase rail travel speed can be relatively cheap and quick to implement, others require substantial investment and take more time. The same applies for the (re-)introduction of night trains. In all cases, the social benefits should be compared with the social costs, including the environmental costs. A report by the ECA (2018) points out that a good assessment of the costs and benefits is often lacking and stresses the need for a cost-benefit analysis to support decisions. Moreover, it points to the importance of coordination across borders. In the case of investments in new HSR infrastructure, Chapter 2 identified the conditions that ensure that the GHG costs embedded in the construction of the infrastructure are compensated for by a reduction in emissions from travelling. When assessing the emission impacts of travelling, account must also be taken of the expected future developments in the emission factors for the different modes of transport.

Further considerations and recommendations
69Transport and environment report 2020 — Train or plane?
The frequency of the service is another factor that influences the modal choice. Car transport is very flexible in that respect. However, in the case of rail and air transport, travel is according to set train schedules and flight plans. The frequency determines how many passengers can be transported (together with the capacity of the train/aircraft). A schedule with higher frequency services is more likely to correspond to travellers' desired time schedule. If that is not the case, so-called schedule delay costs arise, because one arrives earlier or later than desired. A higher frequency also reduces the transfer time between two journey legs.
Another way of motivating people to make environmentally sustainable choices is to provide information on the environmental impacts of their modal choice in order to increase their awareness of the problems. For example, the European Union Aviation Safety Agency (EASA) was recently tasked by the Commission to work on the concept of environmental labelling in line with EU policies and with a view to allowing intermodal comparisons (EASA, 2019).AnotherexampleistheEcoPassengerplatform developed for the International Union of Railways (UIC, 2020a).
Finally, factors such as convenience, comfort, quality of service and safety play a role in modal choices. These factors are generally more difficult to quantify but should not be ignored. How easy is it to find information on travel routes and fares and to book trips? Is there integrated ticketing and rail travel planning across borders? What is the quality of information available before booking a trip and also during the trip, especially in the case of delays or cancellations? Is there financial compensation in the case of missed connections and how easily can it be obtained? How much luggage can one take and how easy is it to travel with luggage? How comfortable and safe is it to travel? These are factors under the control of transport operators, but policies also form a framework for them to work in.
A good understanding of each of these factors is essential for bringing about the desired shift to the most sustainable modes of transport. This report sought to explore a shift from air to rail transport and the environmental and health benefits that it could bring about. By doing so, its authors hope to contribute to the important debate on how to make Europe's mobility system fit for the future.

Transport and environment report 2020 — Train or plane?70
Abbreviations, symbols and units
Abbreviations, symbols and units
µm MicrometreATM Air traffic managementCCD Climb, cruise, descentCEF Connecting Europe FacilityCER Community of European Railway and Infrastructure CompaniesCO Carbon monoxideCO2 Carbon dioxideCO2e Carbon dioxide equivalentCORSIA Carbon Offsetting and Reduction Scheme for International AviationCOVID-19 Coronavirus disease 2019dB DecibelEASA European Union Aviation Safety AgencyECA European Court of AuditorsEEA European Environment AgencyEFTA European Free Trade AssociationEIB European Investment BankEND Environmental Noise DirectiveERA European Railway AgencyERDF European Regional Development FundESIF European Structural and Investment FundETS Emissions Trading SystemEU European Unionft Feetg GramGDP Gross domestic productGHG Greenhouse gasGRACE Generalisation of Research on Accounts and Cost EstimationHC HydrocarbonHSR High-speed railIATA International Air Transport AssociationICAO International Civil Aviation OrganizationIC Intercity trainICe Intercity electric trainIEA International Energy AgencyILUC Indirect land use changeIZT Institute for Future Studies and Technology Assessment (Germany)JU Jointundertakingkg KilogramKiM Netherlands Institute for Transport Policy Analysis

Abbreviations, symbols and units
71Transport and environment report 2020 — Train or plane?
km KilometreKPI Key performance indicatorkWh Kilowatt-hourl LitreLCA Life cycle analysisLden Day- evening-night-level indicator of noiseLnight Night-level indicator of noiseLTO Landing and take-offLULUCF Land use, land use change and forestryMJ MegajouleMSR Market stability reserveMt Million tonnesMtCO2e Megatonnes carbon dioxide equivalentNH3 AmmoniaN2O Nitrous oxideNMVOC Non-methane volatile organic compoundNOx Nitrogen oxidesNRMM Non-road mobile machinerynvPM Non-volatile particulate matterPAH Polycyclic aromatic hydrocarbonPb LeadPM Particulate matterPM2.5 Particulatematterwithadiameterof2.5 μmorlessPM10 Particulatematterwithadiameterof10 μmorlessR&D Research and developmentRED Renewable Energy DirectiveRPK Revenue passenger-kmRTK Revenue tonne-kmS2R Shift2RailSAF Sustainable aviation fuelSDG Sustainable Development GoalSES Single European Sky initiativeSESAR Single European Sky Air Traffic Management ResearchSO2 Sulphur dioxideSOx Sulphur oxidest TonneT&E Transport & EnvironmentTEN-T Trans-European Transport NetworkTERM Transport and Environment Reporting MechanismTSP Total suspended particlesUIC International Union of RailwaysUN United NationsTTW Tank-to-wheelVAT Value added taxvkm Vehicle-kilometreWHO World Health OrganizationWTT Well-to-tankWTW Well-to-wheel/-wake

Transport and environment report 2020 — Train or plane?72
References
References
Air France, 2020, 'Can I offset CO2 emissions related to my Air France trip?', AirFrance (https://www.airfrance.be/BE/en/common/faq/about-air-france/can-i-calculate-co2-emissions-related-to-my-trip-with-air-france.htm) accessed 1 October 2020.
Albalate, D., et al., 2015, 'Competition and cooperation between high-speed rail and air transportation services in Europe', Journal of Transport Geography 42, pp. 166-174(DOI:10.1016/j.jtrangeo.2014.07.003).
APPM and Goudappel Coffeng, 2015, Van toplocatie naar internationale bestemming per spoor. Verdiepend onderzoek spoor in kader van Mirt-Onderzoek internationale connectiviteit Zuidelijke Randstad, Final report for the Dutch Ministry of Infrastructure and the Environment, APPM and Goudappel Coffeng, Hoofddorp/Amsterdam, Netherlands.
Baron, T., et al., 2011, Carbon footprint of high speed rail, International Union of Railways, Paris.
Barrientos, R. and Borda de Agua, L., 2017, 'Railways as barriers for wildlife: current knowledge', in: Railway ecology, Springer International Publishing, Cham, Switzerland, pp. 43-64.
Becken, S. and Mackey, B., 2017, 'What role for offsetting aviation greenhouse gas emissions in a deep-cut carbon world?', Journal of Air Transport Management 63, pp. 71-83 (DOI: 10.1016/j.jairtraman.2017.05.009).
Behrens, C. and Pels, E., 2012, 'Intermodal competition in the London-Paris passenger market: high-speed rail and air transport', Journal of Urban Economics 71(3), pp. 278-288(DOI:10.1016/j.jue.2011.12.005).
Berveling,J.,etal.,2020,Met de stroom mee. Het stimuleren van elektrisch rijden, Kennisinstituut voor Mobiliteitsbeleid, The Hague, Netherlands (https://www.kimnet.nl/publicaties/rapporten/2020/07/01/met-de-stroom-mee-het-stimuleren-van-elektrisch-rijden).
Bleijenberg, A., 2020, Air2Rail. Reducing CO2 from intra-European aviation by a modal shift from air to rail, Study commissioned by the European Federation for Transport and Environment, Koios Strategy, Delft, Netherlands.
British Airways, 2020, 'Carbon Neutral | Leapfrog', British Airways (https://www.pureleapfrog.org/ba/carbon_neutral/) accessed 1 October 2020.
Bruninx, K., et al., 2020, 'The long-term impact of the market stability reserve on the EU emission trading system', Energy Economics 89, p. 104746 (DOI: 10.1016/j.eneco.2020.104746).
Bueno, G., et al., 2017, 'Evaluating the environmental performance of the high speed rail project in the Basque Country, Spain', Research in Transportation Economics 62, pp. 44-56 (DOI: 10.1016/j.retrec.2017.02.004).
Burkhardt, M., et al., 2008, 'Diffuse release of environmental hazards by railways', Desalination 226(1-3), pp. 106-113 (DOI: 10.1016/j.desal.2007.02.102).
CE Delft and SEO Amsterdam Economics, 2019, Taxes in the field of aviation and their impact, European Commission, Brussels (https://op.europa.eu/en/publication-detail/-/publication/0b1c6cdd-88d3-11e9-9369-01aa75ed71a1).
Clewlow, R. R., et al., 2014, 'The impact of high-speed rail and low-cost carriers on European air passenger traffic', Transport Policy 33, pp. 136-143 (DOI: 10.1016/j.tranpol.2014.01.015).
Cox,B.andAlthaus,H.-J.,2019,How to include non-CO2 climate change contributions of air travel at ETH Zurich, Study on behalf of the Mobility Platform of ETH Zurich, INFRAS, Bern, Switzerland.
de Bortoli, A., et al., 2020, 'A life cycle model for high-speed rail infrastructure: environmental inventories and assessment of the Tours-Bordeaux railway in France', International Journal of Life Cycle Assessment 25(4), pp. 814-830 (DOI: 10.1007/s11367-019-01727-2).
Deane, P. and Pye, S., 2016, Biofuels for aviation: review and analysis of options for market development, Insight_E Policy Report No 4, Insight_E (www.insightenergy.org).
References
73Transport and environment report 2020 — Train or plane?
Dobruszkes, F., et al., 2014, 'Does European high-speed rail affect the current level of air services? An EU-wide analysis', Transportation Research Part A: Policy and Practice 69, pp. 461-475 (DOI: 10.1016/j.tra.2014.09.004).
EASA, 2019, 'Environmental label programme — stakeholders workshop', European Union Aviation Safety Agency (https://www.easa.europa.eu/newsroom-and-events/events/environmental-label-programme-%E2%80%93-stakeholders-workshop)accessed7 October2020.
EASA, et al., 2019, European aviation environmental report 2019, European Union Aviation Safety Agency, Cologne, Germany.
EASA, 2020a, Sustainable aviation fuel 'facilitation initiative', European Union Aviation Safety Agency, Cologne, Germany (https://www.easa.europa.eu/sites/default/files/dfu/sustainable_aviation_fuel_facilitation_initiative_0.pdf).
EASA, 2020b, Sustainable aviation fuel 'monitoring system', European Union Aviation Safety Agency, Cologne, Germany (https://www.easa.europa.eu/sites/default/files/dfu/sustainable_aviation_fuel_monitoring_system_0.pdf).
EASA, 2020c, Updated analysis of the non-CO2 climate impacts of aviation and potential policy measures pursuant to the EU Emissions Trading System Directive Article 30(4), Final Report, European Aviation Safety Agency (EASA) (https://eur-lex.europa.eu/legal-content/EN/TXT/?uri=SWD:2020:277:FIN).
Easyjet,2020,'Carbonoffsetting',EasyJet(https://www.easyjet.com/en/sustainability)accessed1October 2020.
EC, 2011a, Flightpath 2050 — Europe's vision for aviation — report of the High Level Group on Aviation Research, European Commission, Luxembourg (https://ec.europa.eu/transport/sites/transport/files/modes/air/doc/flightpath2050.pdf).
EC, 2011b, White Paper — Roadmap to a single European transport area: towards a competitive and resource efficient transport system (COM(2011) 144 final).
EC, 2016, Communication from the Commission to the European Parliament, the Council, the European Economic and Social Committee and the Committee of the Regions 'A European strategy for low-emission mobility'(COM(2016)501finalof20July2016).
EC, 2018, Flash Eurobarometer 463 — Europeans' satisfaction with passenger rail services, European Commission, Brussels.
EC, 2019a, Communication from the Commission 'Publication of the total number of allowances in circulation in 2018 for the purposes of the Market Stability Reserve under the EU Emissions Trading System established by Directive 2003/87/EC' (C(2019) 3288 final of 14 May 2019).
EC, 2019b, Communication from the Commission to the European Parliament, the European Council, the Council, the European Economic and Social Committee and the Committee of the Regions 'The European Green Deal' (COM(2019) 640 final of 11 December 2019).
EC, 2019c, Evaluation of the Regulation (EC) No 1008/2008 on common rules for the operation of air services in the Community (SWD(2019) 296 final of 9 July2019).
EC, 2019d, Handbook on the external costs of transport, Publications Office of the European Union, Luxembourg.
EC, 2019e, Sixth report on monitoring development of the rail market (SWD(2019) 13 final).
EC, 2019f, 'Trans-European Transport Network TENTEC — Maps', European Commission (https://ec.europa.eu/transport/infrastructure/tentec/tentec-portal/site/en/maps.html) accessed 25 September 2020.
EC, 2020a, 'EU emissions trading system — updated rules for aviation', European Commission (https://ec.europa.eu/info/law/better-regulation/have-your-say/initiatives/12494-Revision-of-the-EU-Emission-Trading-System-Directive-concerning-aviation-) accessed 7 October2020.
EC, 2020b, EU transport in figures — statistical pocketbook 2020, European Union, Luxembourg (https://ec.europa.eu/transport/facts-fundings/statistics/pocketbook-2020_en).
EC, 2020c, Inception impact assessment — ReFuelEU Aviation — sustainable aviation fuels, European Commission, Brussels (https://ec.europa.eu/info/law/better-regulation/have-your-say/initiatives/12303-ReFuelEU-Aviation-Sustainable-Aviation-Fuels).

References
74 Transport and environment report 2020 — Train or plane?
EC, 2020d, 'Notice to stakeholders — withdrawal of the United Kingdom and the EU Emissions Trading System (EU ETS)', European Commission (https://ec.europa.eu/info/sites/info/files/brexit_files/info_site/emissions-trading-system_en_0.pdf).
EC, 2020e, 'Recovery plan for Europe', European Commission (https://ec.europa.eu/info/live-work-travel-eu/health/coronavirus-response/recovery-plan-europe_en)accessed15June2020.
EC, 2020f, 'Regional policy & outermost regions', European Commission (https://ec.europa.eu/regional_policy/en/policy/themes/outermost-regions/) accessed 28July2020.
EC, 2020g, Sustainable and Smart Mobility Strategy – putting European transport on track for the future, Communication from the Commission (COM(2020) 789 final).
EC, 2020h, 'Sustainable aviation fuels — ReFuelEU Aviation', European Commission (https://ec.europa.eu/info/law/better-regulation/have-your-say/initiatives/12303-ReFuelEU-Aviation-Sustainable-Aviation-Fuels) accessed 7 October 2020.
ECA, 2018, A European high-speed rail network: not a reality but an ineffective patchwork, European Court of Auditors, Luxembourg.
EEA, 2016, Transitions towards a more sustainable mobility system — TERM 2016: Transport and Environment Reporting Mechanism (TERM) report, EEA Report No 34/2016, European Environment Agency (https://www.eea.europa.eu/publications/term-report-2016) accessed 10 December 2018.
EEA, 2017, Aviation and shipping — impacts on Europe's environment — TERM 2017: Transport and Environment Reporting Mechanism (TERM) report, EEA Report No 22/2017, European Environment Agency.
EEA, 2019a, EMEP/EEA air pollutant emission inventory guidebook 2019 — technical guidance to prepare national emission inventories, EEA Report No 13/2019, EEA (https://www.eea.europa.eu/publications/emep-eea-guidebook-2019).
EEA, 2019b, The EU Emissions Trading System in numbers — trends and projections in the EU ETS in 2019, Eionet Report ETC/CME No 3/2019, European Environment Agency.
EEA, 2019c, The first and last mile — the key to sustainable urban transport — transport and environment report 2019, EEA Report No 18/2019, European Environment Agency.
EEA, 2020a, 'EEA greenhouse gas — data viewer', European Environment Agency (https://www.eea.europa.eu/data-and-maps/data/data-viewers/greenhouse-gases-viewer)accessed24July2020.
EEA, 2020b, Environmental noise in Europe — 2020, EEA Report No 22/2019, European Environment Agency.
EEA, 2020c, 'Greenhouse gas emission intensity of electricitygenerationinEurope(ENER 038)',EuropeanEnvironment Agency (https://www.eea.europa.eu/data-and-maps/indicators/overview-of-the-electricity-production-3/assessment) accessed 15 December 2020.
EIB, 2020, The EIB Climate Survey 2019-2020 — how citizens are confronting the climate crisis and what actions they expect from policy makers and businesses, European Investment Bank, Luxembourg (https://www.eib.org/en/publications/flip/the-eib-climate-survey-2019-2020/index.html#p=1)accessed24July2020.
EU, 2002, Directive 2002/49/EC of the European ParliamentandoftheCouncilof25June2002relatingto the assessment and management of environmental noise(OJL189,18.7.2002,pp.12-25).
EU Technical Expert Group on Sustainable Finance, 2020, Taxonomy report — technical annex, European Commission, Brussels (https://ec.europa.eu/info/sites/info/files/business_economy_euro/banking_and_finance/documents/200309-sustainable-finance-teg-final-report-taxonomy-annexes_en.pdf).
Eurocontrol, 2020, 'Eurocontrol revises downwards draft traffic scenarios for September to February 2021', Eurocontrol (https://www.eurocontrol.int/sites/default/files/2020-09/eurocontrol-draft-traffic-scenarios-14092020.pdf).
Eurostat, 2019, 'Passenger transport statistics', Statistics Explained (https://ec.europa.eu/eurostat/statistics-explained/index.php/Passenger_transport_statistics#Rail_passengers)accessed24July2020.
Eurostat, 2020a, 'Detailed air passenger transport by reporting country and routes (avia_par)', Eurostat (https://ec.europa.eu/eurostat/web/transport/data/database) accessed 14 February 2020.
Eurostat, 2020b, 'Renewable energy statistic', Statistics Explained (https://ec.europa.eu/eurostat/statistics-explained/index.php/Renewable_energy_statistics#of_renewable_energy_used_in_transport_activities_in_2018) accessed 30 April 2020.

References
75Transport and environment report 2020 — Train or plane?
Eurostat, 2020c, 'Simplified energy balances', Eurostat Data Explorer (https://appsso.eurostat.ec.europa.eu/nui/show.do?dataset=nrg_bal_s&lang=en) accessed 28 July2020.
Fly Green Fund, 'Reducera dina flygresors koldioxidutsläpp', Fly Green Fund (http://flygreenfund.se/)accessed28July2020.
Givoni, M. and Dobruszkes, F., 2013, 'A review of ex-post evidence for mode substitution and induced demand following the introduction of high-speed rail', Transport Reviews 33(6), pp. 720-742 (DOI: 10.1080/01441647.2013.853707).
Goblet, V., et al., 2015, 'Identifying phases of flight in general aviation operations', conference paper presented at: AIAA Aviation Technology, Integration, andOperationsConference,Dallas,TX,22June2015.
Gómez Comendador, V. F., et al., 2019, 'A holistic approach to the environmental certification of green airports', Sustainability 11(15), p. 4043 (DOI: 10.3390/su11154043).
GRACE, 2006, Environmental costs in sensitive areas — Generalisation of Research on Accounts and Cost Estimation (GRACE), University of Leeds, Leeds, UK.
Grüll, P., 2020, 'The green compromise in the Austrian Airlines bailout', www.euractiv.com (https://www.euractiv.com/section/aviation/news/the-green-compromise-in-the-austrian-airines-bailout/) accessed 24July2020.
IATA, 2020, 'Recovery delayed as international travel remains locked down', International Air Transport Association (https://www.iata.org/en/pressroom/pr/2020-07-28-02/) accessed 25 September 2020.
ICAO, 2019a, 2019 environmental report — aviation and environment, International Civil Aviation Organization, Montréal, Canada.
ICAO, 2019b, CORSIA sustainability criteria for CORSIA eligible fuels, International Civil Aviation Organization, Montréal, Canada (https://www.icao.int/environmental-protection/CORSIA/Documents/ICAO%20document%2005%20-%20Sustainability%20Criteria.pdf).
ICAO, 2020a, 'CORSIA states for chapter 3 state pairs', International Civil Aviation Organization (https://www.icao.int/environmental-protection/CORSIA/Documents/CORSIA_States_for_Chapter3_State_Pairs_Jul2020.pdf)accessed 1 October 2020.
ICAO, 2020b, 'ICAO Council adopts important environmental standard', International Civil Aviation Organization (https://www.icao.int/Newsroom/Pages/ICAO-Council-adopts-important-environmental-standard.aspx) accessed 30 September 2020.
ICAO, 2020c, 'ICAO Council agrees to the safeguard adjustment for CORSIA in light of COVID-19 pandemic', International Civil Aviation Organization (https://www.icao.int/Newsroom/Pages/ICAO-Council-agrees-to-the-safeguard-adjustment-for-CORSIA-in-light-of-COVID19-pandemic.aspx)accessed28July2020.
IEA, 2017, Energy technology perspectives 2017, International Energy Agency, Paris.
IEA, 2019, The future of rail — opportunities for energy and the environment, International Energy Agency, Paris.
Irwin, T., 2009, Implications for climate-change policy of research on cooperation in social dilemmas, Policy Research Working Paper No 5006, World Bank, Washington, DC.
IZT and Macroplan, 2012, Study on non-traction energy consumption and related CO2 emissions from the European railway sector, Institute for Future Studies and Technology Assessment (IZT) and Macroplan, Copenhagen and Berlin (https://uic.org/IMG/pdf/uic_non-traction_energy_study_final_report_june_2012.pdf).
Jiang,C.andLi,X.,2016,'Lowcostcarrierandhigh-speed rail: a macroeconomic comparison between JapanandWesternEurope',Research in Transportation Business & Management 21, pp. 3-10 (DOI: 10.1016/j.rtbm.2016.05.006).
KLM, 2020, 'KLM corporate biofuel programme', Royal Dutch Airlines (https://www.klm.com/travel/nl_en/prepare_for_travel/fly_co2_neutral/all_about_sustainable_travel/biofuel.htm)accessed28July2020.
Knörr, W. and Hüttermann, R., 2016, Ecopassenger — environmental methodology and data — update 2016, Institute for Energy and Environmental Research, Heidelberg/Hanover, Germany.
Lee, D. S., 2018, The current state of scientific understanding of the non-CO2 effects of aviation on climate, Report Commissioned by the UK Department for Transport, Manchester Metropolitan University, Manchester, UK (https://assets.publishing.service.gov.uk/government/uploads/system/uploads/attachment_data/file/813342/non-CO2-effects-report.pdf).
References
76 Transport and environment report 2020 — Train or plane?
Liu, H., et al., 2016, 'A comparative life-cycle energy and emissions analysis for intercity passenger transportation in the U.S. by aviation, intercity bus, and automobile', Transportation Research Part D: Transport and Environment 48, pp. 267-283 (DOI: 10.1016/j.trd.2016.08.027).
Lufthansa, 2020, 'Compensaid — fly CO2-neutral', Lufthansa (https://compensaid.de) accessed 30 September2020.
Maertens, S., et al., 2019, 'Options to continue the EU ETS for aviation in a CORSIA-world', Sustainability 11(20), p. 5703 (DOI: 10.3390/su11205703).
Mayeres, I., et al., 2019, Selection of policy options and definition of plausible targets and pathways — combined Deliverable 2.1.4 and 2.3.1 of the ESFERA project on 'Coordination of renewable fuel stakeholders' strategy in the field of aviation', Study for the European Commission, Transport & Mobility Leuven, SENASA, ONERA, Wageningen University & Research, Leuven, Belgium.
Ministerie van Infrastructuur en Waterstaat, 2019, 'De internationale nachttrein komt terug naar Nederland', Rijksoverheid (https://www.rijksoverheid.nl/actueel/nieuws/2019/10/10/de-internationale-nachttrein-komt-terug-naar-nederland) accessed 25 September 2020.
Ministerie van Infrastructuur en Waterstaat, 2020, 'Van Nieuwenhuizen verplicht gebruik schonere brandstof luchtvaart', Rijksoverheid (https://www.rijksoverheid.nl/actueel/nieuws/2020/03/03/van-nieuwenhuizen-verplicht-gebruik-schonere-brandstof-luchtvaart) accessed 1 October 2020.
Morgan, S., 2020a, 'Dutch government unveils KLM rescue plan', Euractiv (https://www.euractiv.com/section/aviation/news/dutch-government-unveils-klm-rescue-plan/)accessed24July2020.
Morgan, S., 2020b, 'Sweden's night train to Brussels to debut in 2022', Euractiv (https://www.euractiv.com/section/railways/news/swedens-night-train-to-brussels-to-debut-in-2022/) accessed 25 September 2020.
Niklaß, M., et al., 2020, Integration of non-CO2 effects of aviation in the EU ETS and under CORSIA, Report No FB000270/ENG, Umweltbundesamt, Dessau-Roßlau, Germany.
Norwegian Ministry of Climate and Environment, 2019, 'More advanced biofuel in aviation', Government.no (https://www.regjeringen.no/en/aktuelt/mer-avansert-biodrivstoff-i-luftfarten/id2643700/) accessed 1 October 2020.
Nunes, L. M., et al., 2011, 'Environmental impacts on soil and groundwater at airports: origin, contaminants of concern and environmental risks', Journal of Environmental Monitoring 13(11), pp. 3026-3039 (DOI: 10.1039/C1EM10458F).
Pallini, T., 2020, 'Even more iconic planes are disappearing from the sky earlier than planned as the coronavirus continues to wreak airline havoc', Business Insider (https://www.businessinsider.com/coronavirus-havoc-forces-airlines-to-retire-iconic-planes-sooner-2020-3)accessed27July2020.
PRB, 2018, PRB advice to the Commission in the setting of Union-wide performance targets for RP3, Performance Review Body of the Single European Sky, Brussels.
RailExpress, 2020, 'Air France pushed to cut flights where high speed rail operates', RailExpress (https://www.railexpress.com.au/air-france-pushed-flights-high-speed-rail/)accessed15June2020.
Savelberg, F., 2019, Slapend onderweg — potentieel van de internationale nachttrein van en naar Nederland, Kennisinstituut voor Mobiliteitsbeleid, The Hague, Netherlands.
Savelberg, F. and de Lange, M., 2018, Substitutiemogelijkheden van luchtvaart naar spoor, Kennisinstituut voor Mobiliteitsbeleid, The Hague, Netherlands.
Scheelhaase,J.D.,etal.,2016,'Howtobestaddressaviation's full climate impact from an economic policy point of view? Main results from AviClim research project', Transportation Research Part D: Transport and Environment 45, pp. 112-125 (DOI: 10.1016/j.trd.2015.09.002).
Schroten, A., et al., 2019, Transport taxes and charges in Europe — an overview study of economic internalisation measures applied in Europe, European Commission, Brussels.
SGI Aviation, 2018, Aircraft Decommissioning Study, Final report, SGI Aviation, Amsterdam, Netherlands.
Steer Davies Gleave and Politecnico di Milano, 2017, Research for TRAN Committee — passenger trains in Europe: the end of the line?, European Parliament, Brussels.
Sutter, D., et al., 2017, External costs in mountain areas, Final Report for EU Strategy for the Alpine Region EUSALP — Action Group 4 Mobility, INFRAS and Herry Consult, Zürich and Vienna.

References
77Transport and environment report 2020 — Train or plane?
Trafikverket, 2020, 'Delredovisning av regeringsuppdraget att utreda nattåg till Europa', Trafikverket (https://www.trafikverket.se/om-oss/nyheter/Nationellt/2020-01/delredovisning-av-regeringsuppdraget-att-utreda-nattag-till-europa/) accessed15June2020.
Trainline, 'Search, compare & buy cheap train & bus tickets', Trainline (https://www.thetrainline.com/) accessed28July2020.
UIC, 2020a, 'EcoPassenger', International Union of Railways (http://www.ecopassenger.org/bin/query.exe/en?L=vs_uic) accessed 7 October 2020.
UIC, 2020b, High speed traffic in the world, International Union of Railways, Paris (https://uic.org/IMG/pdf/20200127_high_speed_passenger_km.pdf).
UIC and DB International, 2013, UIC study night trains 2.0, International Union of Railways, Paris (https://www.wirsindanderswo.de/fileadmin/user_upload/Download-Dateien/study_night_trains_2.0.pdf).
UK Department for Transport, 2018, Appraisal of sustainability: airports national policy statement, UK Department for Transport, London (https://assets.publishing.service.gov.uk/government/uploads/system/uploads/attachment_data/file/713271/aos-airports-nps-main-report.pdf).
UN, 2015a, 'Paris Agreement', United Nations (https://sustainabledevelopment.un.org/frameworks/parisagreement) accessed 7 October 2020.
UN, 2015b, 'Transforming our world: the 2030 Agenda for Sustainable Development', United Nations (https://sustainabledevelopment.un.org/post2015/transformingourworld) accessed 7 October 2020.
Westin,J.andKågeson,P.,2012,'Canhighspeedrail offset its embedded emissions?', Transportation Research Part D: Transport and Environment 17(1), pp. 1-7 (DOI: 10.1016/j.trd.2011.09.006).
WHO Europe, 2018, Environmental noise guidelines for the European region, World Health Organization Regional Office for Europe, Copenhagen (http://www.euro.who.int/en/health-topics/environment-and-health/noise/publications/2018/environmental-noise-guidelines-for-the-european-region-2018) accessed 7 December2018.
Zhao, X., et al., 2020, 'Disposal and recycle economic assessment for aircraft and engine end of life solution evaluation', Applied Sciences 10(2), p. 522 (DOI: 10.3390/app10020522).
Transport and environment report 2020 — Train or plane?78
Inputs for calculating the environmental costs per trip
Annex 1 Inputs for calculating the environmental costs per trip
Distances
For the main trip the distances are determined as follows: for car travel, the distance between the city centres is taken, using the fastest route according to a web mapping service. For air transport, the distance is based on data provided by Eurocontrol. For rail transport, the distance via the rail network is difficulttoobtain;therefore,thedistanceiscurrentlyapproximated by the car distance.
For transport to and from the main railway station or airport, the distance by car from the city centre to the main railway station or airport is used. Three modes are considered: car, bus and (heavy) rail. If travel distances are short they can also be covered on foot, in
which case the environmental impact Is zero. However, people may also choose to use another mode, even for short distances, when they have to take luggage. No account could be taken of the actual travel options and travel distances in each case, as this information could not be obtained from online route planners during the COVID-19 outbreak. Therefore, the findings for travel to and from the main railway stations or airports should be seen as approximations.
Aircraft types and train types for main trip between city pairs
Table A1.1 gives an overview of the aircraft used in the different city pairs, as well as their capacity and the occupancy assumed in the calculations.
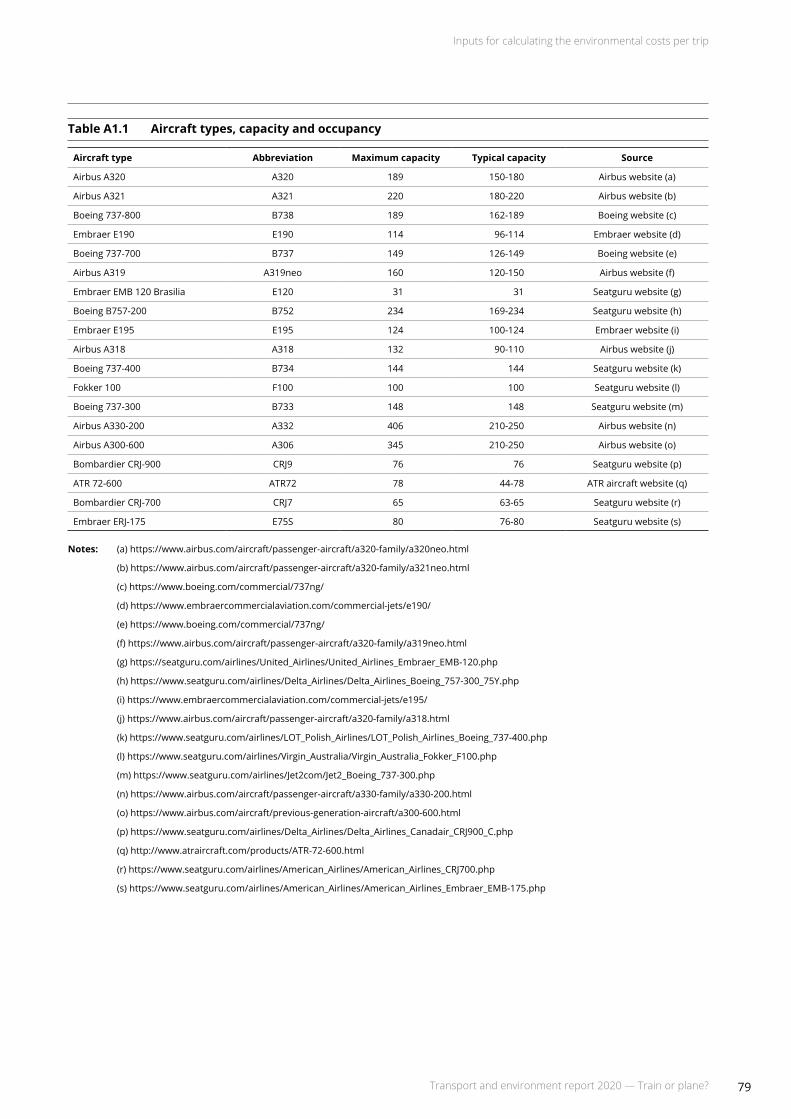
Inputs for calculating the environmental costs per trip
79Transport and environment report 2020 — Train or plane?
Table A1.1 Aircraft types, capacity and occupancy
Aircraft type Abbreviation Maximum capacity Typical capacity Source
Airbus A320 A320 189 150-180 Airbuswebsite (a)
Airbus A321 A321 220 180-220 Airbuswebsite (b)
Boeing 737-800 B738 189 162-189 Boeingwebsite (c)
Embraer E190 E190 114 96-114 Embraerwebsite (d)
Boeing 737-700 B737 149 126-149 Boeingwebsite (e)
Airbus A319 A319neo 160 120-150 Airbuswebsite (f)
Embraer EMB 120 Brasilia E120 31 31 Seatguruwebsite (g)
Boeing B757-200 B752 234 169-234 Seatguruwebsite (h)
Embraer E195 E195 124 100-124 Embraerwebsite (i)
Airbus A318 A318 132 90-110 Airbuswebsite (j)
Boeing 737-400 B734 144 144 Seatguruwebsite (k)
Fokker 100 F100 100 100 Seatguruwebsite (l)
Boeing 737-300 B733 148 148 Seatguruwebsite (m)
Airbus A330-200 A332 406 210-250 Airbuswebsite (n)
Airbus A300-600 A306 345 210-250 Airbuswebsite (o)
BombardierCRJ-900 CRJ9 76 76 Seatguruwebsite (p)
ATR 72-600 ATR72 78 44-78 ATRaircraftwebsite (q)
BombardierCRJ-700 CRJ7 65 63-65 Seatguruwebsite (r)
EmbraerERJ-175 E75S 80 76-80 Seatguru website (s)
Notes: (a) https://www.airbus.com/aircraft/passenger-aircraft/a320-family/a320neo.html
(b) https://www.airbus.com/aircraft/passenger-aircraft/a320-family/a321neo.html
(c) https://www.boeing.com/commercial/737ng/
(d) https://www.embraercommercialaviation.com/commercial-jets/e190/
(e) https://www.boeing.com/commercial/737ng/
(f) https://www.airbus.com/aircraft/passenger-aircraft/a320-family/a319neo.html
(g) https://seatguru.com/airlines/United_Airlines/United_Airlines_Embraer_EMB-120.php
(h) https://www.seatguru.com/airlines/Delta_Airlines/Delta_Airlines_Boeing_757-300_75Y.php
(i) https://www.embraercommercialaviation.com/commercial-jets/e195/
(j) https://www.airbus.com/aircraft/passenger-aircraft/a320-family/a318.html
(k) https://www.seatguru.com/airlines/LOT_Polish_Airlines/LOT_Polish_Airlines_Boeing_737-400.php
(l) https://www.seatguru.com/airlines/Virgin_Australia/Virgin_Australia_Fokker_F100.php
(m)https://www.seatguru.com/airlines/Jet2com/Jet2_Boeing_737-300.php
(n) https://www.airbus.com/aircraft/passenger-aircraft/a330-family/a330-200.html
(o) https://www.airbus.com/aircraft/previous-generation-aircraft/a300-600.html
(p)https://www.seatguru.com/airlines/Delta_Airlines/Delta_Airlines_Canadair_CRJ900_C.php
(q) http://www.atraircraft.com/products/ATR-72-600.html
(r)https://www.seatguru.com/airlines/American_Airlines/American_Airlines_CRJ700.php
(s) https://www.seatguru.com/airlines/American_Airlines/American_Airlines_Embraer_EMB-175.php
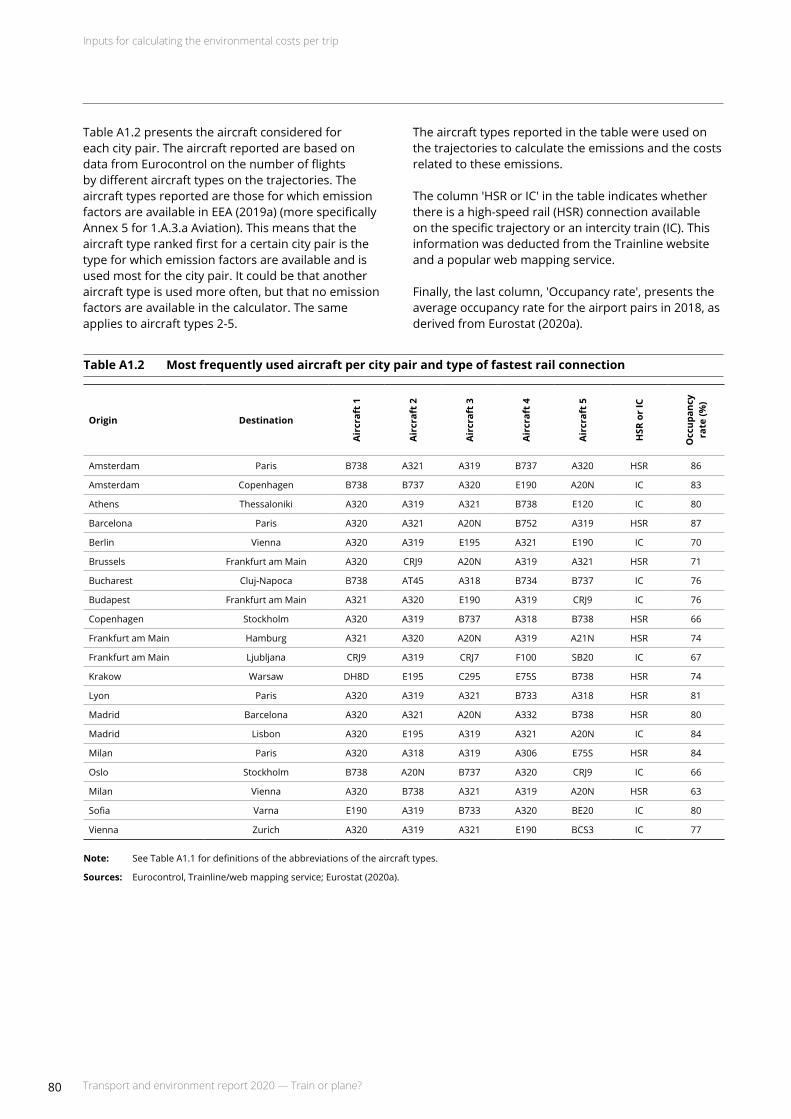
Inputs for calculating the environmental costs per trip
80 Transport and environment report 2020 — Train or plane?
Table A1.2 presents the aircraft considered for each city pair. The aircraft reported are based on data from Eurocontrol on the number of flights by different aircraft types on the trajectories. The aircraft types reported are those for which emission factors are available in EEA (2019a) (more specifically Annex 5 for 1.A.3.a Aviation). This means that the aircraft type ranked first for a certain city pair is the type for which emission factors are available and is used most for the city pair. It could be that another aircraft type is used more often, but that no emission factors are available in the calculator. The same applies to aircraft types 2-5.
The aircraft types reported in the table were used on the trajectories to calculate the emissions and the costs related to these emissions.
The column 'HSR or IC' in the table indicates whether there is a high-speed rail (HSR) connection available on the specific trajectory or an intercity train (IC). This information was deducted from the Trainline website and a popular web mapping service.
Finally, the last column, 'Occupancy rate', presents the average occupancy rate for the airport pairs in 2018, as derived from Eurostat (2020a).
Table A1.2 Most frequently used aircraft per city pair and type of fastest rail connection
Origin Destination
Air
craf
t 1
Air
craf
t 2
Air
craf
t 3
Air
craf
t 4
Air
craf
t 5
HSR
or
IC
Occ
upan
cy
rate(%
)
Amsterdam Paris B738 A321 A319 B737 A320 HSR 86
Amsterdam Copenhagen B738 B737 A320 E190 A20N IC 83
Athens Thessaloniki A320 A319 A321 B738 E120 IC 80
Barcelona Paris A320 A321 A20N B752 A319 HSR 87
Berlin Vienna A320 A319 E195 A321 E190 IC 70
Brussels Frankfurt am Main A320 CRJ9 A20N A319 A321 HSR 71
Bucharest Cluj-Napoca B738 AT45 A318 B734 B737 IC 76
Budapest Frankfurt am Main A321 A320 E190 A319 CRJ9 IC 76
Copenhagen Stockholm A320 A319 B737 A318 B738 HSR 66
Frankfurt am Main Hamburg A321 A320 A20N A319 A21N HSR 74
Frankfurt am Main Ljubljana CRJ9 A319 CRJ7 F100 SB20 IC 67
Krakow Warsaw DH8D E195 C295 E75S B738 HSR 74
Lyon Paris A320 A319 A321 B733 A318 HSR 81
Madrid Barcelona A320 A321 A20N A332 B738 HSR 80
Madrid Lisbon A320 E195 A319 A321 A20N IC 84
Milan Paris A320 A318 A319 A306 E75S HSR 84
Oslo Stockholm B738 A20N B737 A320 CRJ9 IC 66
Milan Vienna A320 B738 A321 A319 A20N HSR 63
Sofia Varna E190 A319 B733 A320 BE20 IC 80
Vienna Zurich A320 A319 A321 E190 BCS3 IC 77
Note: SeeTableA1.1fordefinitionsoftheabbreviationsoftheaircrafttypes.
Sources: Eurocontrol,Trainline/webmappingservice;Eurostat(2020a).
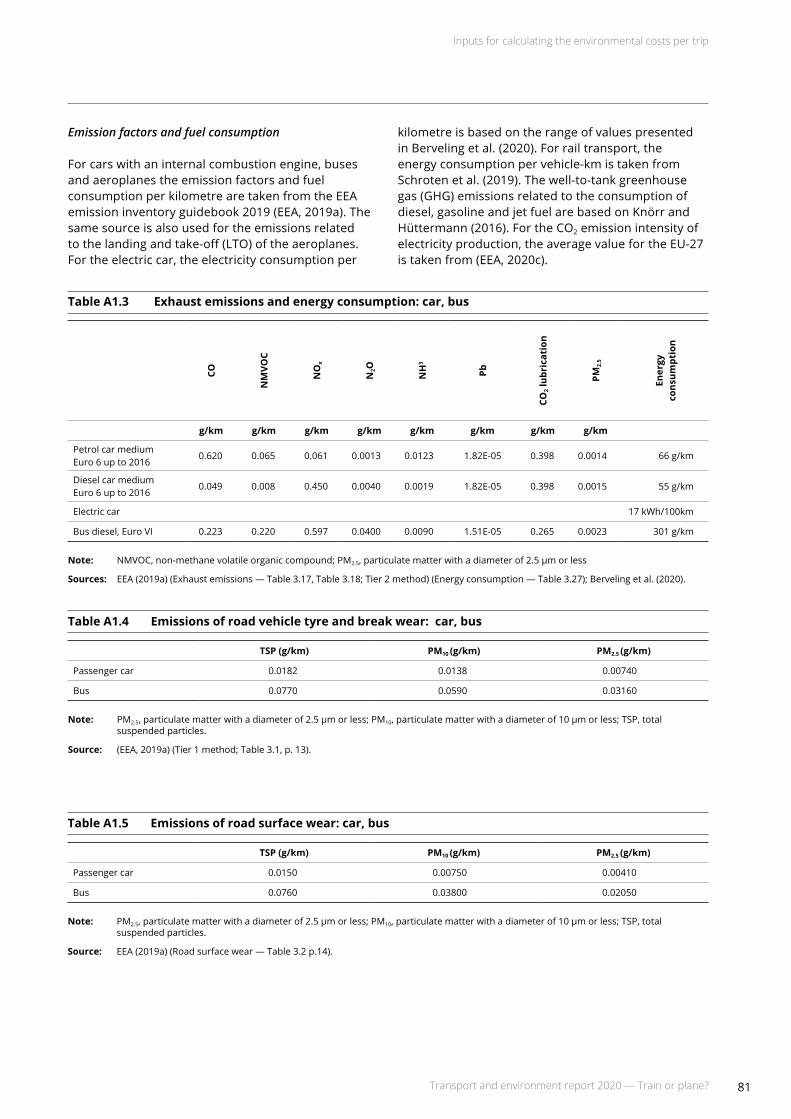
Inputs for calculating the environmental costs per trip
81Transport and environment report 2020 — Train or plane?
Emission factors and fuel consumption
For cars with an internal combustion engine, buses and aeroplanes the emission factors and fuel consumption per kilometre are taken from the EEA emission inventory guidebook 2019 (EEA, 2019a). The same source is also used for the emissions related to the landing and take-off (LTO) of the aeroplanes. For the electric car, the electricity consumption per
kilometre is based on the range of values presented in Berveling et al. (2020). For rail transport, the energy consumption per vehicle-km is taken from Schroten et al. (2019). The well-to-tank greenhouse gas (GHG) emissions related to the consumption of diesel, gasoline and jet fuel are based on Knörr and Hüttermann (2016). For the CO2 emission intensity of electricity production, the average value for the EU-27 is taken from (EEA, 2020c).
Table A1.3 Exhaust emissions and energy consumption: car, bus
CO
NM
VOC
NO
x
N2O
NH
3
Pb
CO2 l
ubri
cati
on
PM2.
5
Ener
gy
cons
umpt
ion
g/km g/km g/km g/km g/km g/km g/km g/km
Petrol car medium Euro 6upto2016
0.620 0.065 0.061 0.0013 0.0123 1.82E-05 0.398 0.0014 66 g/km
Diesel car medium Euro 6upto2016
0.049 0.008 0.450 0.0040 0.0019 1.82E-05 0.398 0.0015 55 g/km
Electric car 17 kWh/100km
Busdiesel,Euro VI 0.223 0.220 0.597 0.0400 0.0090 1.51E-05 0.265 0.0023 301 g/km
Note: NMVOC,non-methanevolatileorganiccompound;PM2.5,particulatematterwithadiameterof2.5 μmorless
Sources: EEA(2019a)(Exhaustemissions—Table3.17,Table3.18;Tier2method)(Energyconsumption—Table3.27);Bervelingetal.(2020).
Table A1.4 Emissions of road vehicle tyre and break wear: car, bus
TSP(g/km) PM10 (g/km) PM2.5 (g/km)
Passenger car 0.0182 0.0138 0.00740
Bus 0.0770 0.0590 0.03160
Note: PM2.5,particulatematterwithadiameterof2.5 μmorless;PM10,particulatematterwithadiameterof10 μmorless;TSP,totalsuspended particles.
Source: (EEA,2019a)(Tier1method;Table3.1,p.13).
Table A1.5 Emissions of road surface wear: car, bus
TSP(g/km) PM10 (g/km) PM2.5 (g/km)
Passenger car 0.0150 0.00750 0.00410
Bus 0.0760 0.03800 0.02050
Note: PM2.5,particulatematterwithadiameterof2.5 μmorless;PM10,particulatematterwithadiameterof10 μmorless;TSP,totalsuspended particles.
Source: EEA (2019a) (Road surface wear — Table 3.2 p.14).

Inputs for calculating the environmental costs per trip
82 Transport and environment report 2020 — Train or plane?
TableA1.6 Emissionfactorsandfuelconsumptionforlandingandtake-off(LTO)andclimb,cruise, descent(CCD)(A320)
Aircraft type
Estimatedparameters(basedonyear2015)
A320 Most frequently observed cruise flightlevel(100ft)
Duration (hh:mm:ss)
Fuel burn (kg)
CO2 (kg)
NOx (kg)
SOx (kg)Airbus
Default LTO (1) cycle (see table below)
Default for a busy European airport,year 2015
0:27:00 742.54 2 338.99 10.97 0.62
ICAO default 0:32:54 816.17 2 570.93 11.28 0.69
'Climb, cruise, descent' stage length (NM)
125 180 0:21:37 931.92 2 935.54 17.53 0.78
200 270 0:31:18 1 356.45 4 272.81 25.70 1.14
250 280 0:37:44 1 647.38 5 189.25 30.11 1.38
500 320 1:10:49 2 946.00 9 279.91 47.54 2.47
750 360 1:45:05 4 124.49 12 992.15 62.11 3.46
1 000 380 2:18:37 5 273.37 16 611.12 76.68 4.43
1 500 380 3:25:45 7 768.61 24 471.13 108.80 6.53
2 000 380 4:32:47 10 483.84 33 024.10 144.83 8.81
2 500 380 5:39:50 12 914.24 40 679.86 175.23 10.85
3 000 380 6:46:01 15 846.86 49 917.60 216.57 13.31
Note: HC,hydrocarbon;NM,nauticalmile;PM,particulatematter.
Source: EEA (2019a) (Annex 5).
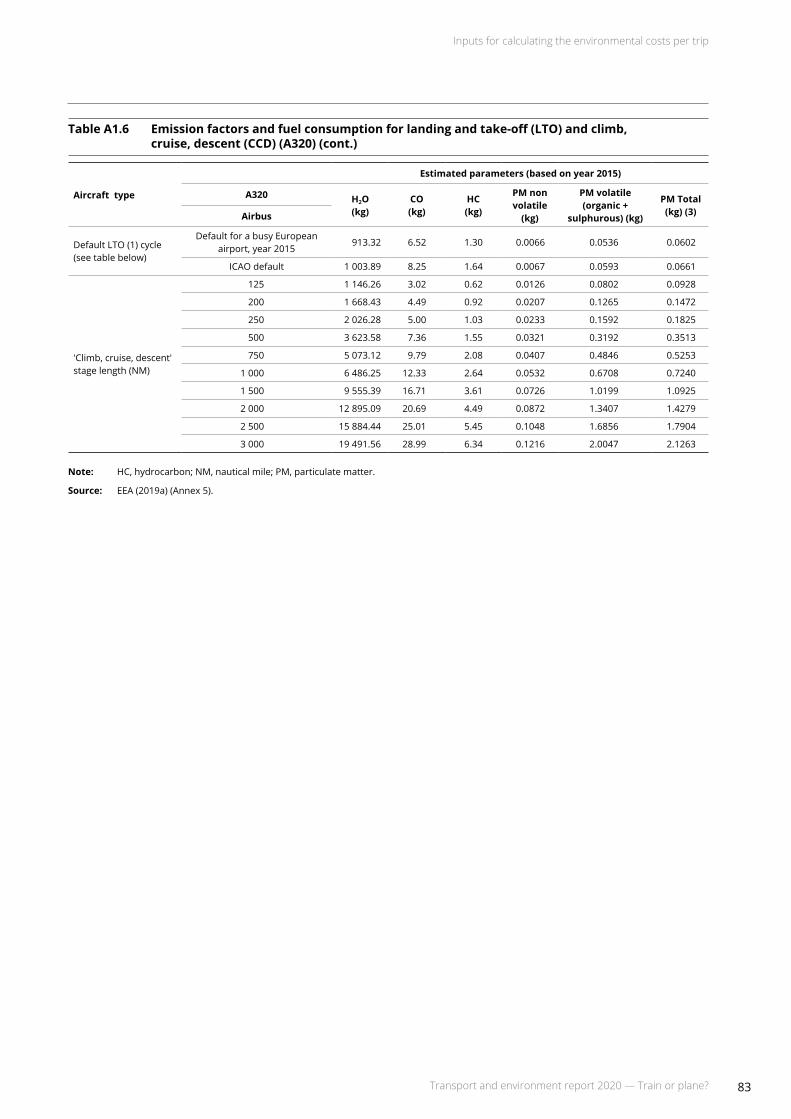
Inputs for calculating the environmental costs per trip
83Transport and environment report 2020 — Train or plane?
TableA1.6 Emissionfactorsandfuelconsumptionforlandingandtake-off(LTO)andclimb,cruise, descent(CCD)(A320)(cont.)
Aircraft type
Estimatedparameters(basedonyear2015)
A320 H2O (kg)
CO (kg)
HC (kg)
PM non volatile (kg)
PM volatile (organic +
sulphurous)(kg)
PM Total (kg)(3)Airbus
Default LTO (1) cycle (see table below)
Default for a busy European airport, year 2015
913.32 6.52 1.30 0.0066 0.0536 0.0602
ICAO default 1 003.89 8.25 1.64 0.0067 0.0593 0.0661
'Climb, cruise, descent' stage length (NM)
125 1 146.26 3.02 0.62 0.0126 0.0802 0.0928
200 1 668.43 4.49 0.92 0.0207 0.1265 0.1472
250 2 026.28 5.00 1.03 0.0233 0.1592 0.1825
500 3 623.58 7.36 1.55 0.0321 0.3192 0.3513
750 5 073.12 9.79 2.08 0.0407 0.4846 0.5253
1 000 6 486.25 12.33 2.64 0.0532 0.6708 0.7240
1 500 9 555.39 16.71 3.61 0.0726 1.0199 1.0925
2 000 12 895.09 20.69 4.49 0.0872 1.3407 1.4279
2 500 15 884.44 25.01 5.45 0.1048 1.6856 1.7904
3 000 19 491.56 28.99 6.34 0.1216 2.0047 2.1263
Note: HC,hydrocarbon;NM,nauticalmile;PM,particulatematter.
Source: EEA (2019a) (Annex 5).

Inputs for calculating the environmental costs per trip
84 Transport and environment report 2020 — Train or plane?
Table A1.7 Technical and operational characteristics of reference passenger trains
CharacteristicsHigh
speedIntercity Regional
SourceElectric Diesel Electric Diesel
Reference vehicle ID PT1 PT2 PT3 PT4 PT5
Presence of tilting technology Yes Yes Yes No No www.railway-technology.com
Train length (m) 200 200 200 110 110
Highspeed:UIC,Siemens (2017a)Intercity:CEDelft(2017);Fornelli (2013)Regional trains: Estimations made based on Table of Train Weights (2013);Heros(undated,a);Heros(undated, b)
Train weight (t) 450 450 450 250 250High speed: SCNFIntercity/regional trains: Table of Train Weights (2013)
Maximum axle weight (t) 17.7 n/a n/a n/a n/a UIC
Axle load (t) 17.5 21.5 21.5 15 15Highspeed:Siemens(2017a, 2017b)Intercity: CE Delft (2017)Regional train: Fornelli (2013)
Maximum speed (km/h) 320 160 160 140 140Highspeed:NCRRP(2015);SNCFIntercityandregional:Fornelli (2013)
Number of seats 500 500 500 350 350
Fornelli(2013);NCRRP(2015);RailwayTechnology(undated);Siemens(2017a);Talgo(2017);Trenitalia (2017)
Number of passengers per train 330 180 180 105 105
High speed: based on an EU average occupancyrateof66 %(estimatedbased on UIC (2013), Ortega (2013), EEA (2016b), Doomernik (2014), Dinu (2016) and Italo (2016).Intercity: based on average occupancyrateof36 %(estimatedbased on CE Delft (2014) and Hayashi et al. (2015))Regional train: based on average occupancyrateof30 %(basedonCEDelft (2014) and (UITP, 2016))
Energy consumption (kWh/vkm if electric or l/km if diesel)
20 15 4 12.5 3CEDelft(2014);Bosquetetal.(2013);NCRRP(2015);LukaszewiczandAndersson (2009)
Note: vkm, vehicle-km.
Source: Schroten et al. (2019), for the references see that publication.
Table A1.8 Well-to-tank emission factors for petrol, diesel and jet fuel
CO2 (kg/kg) NOx (g/kg) NMVOC(g/kg) PM(g/kg)
Petrol (including biofuels) 0.46 1.7 2.1 0.07
Diesel (including biofuels) 0.48 1.8 1.5 0.08
Kerosene 0.63 1.7 1.5 0.06
Note: NMVOC,non-methanevolatileorganiccompound;PM,particulatematter.
Source: Knörr and Hüttermann (2016) (Table 2.1).

Inputs for calculating the environmental costs per trip
85Transport and environment report 2020 — Train or plane?
Figure A1.1 CO2 emission intensity of electricity production per Member State, 2017
Source: EEA (2020c).
gCO2/kWh
0
100
300
400
600
700
1 000
900
200
500
800
Estonia
Poland
Cypru
s
Greece
Bulgaria
Netherla
ndsMalta
Czech
ia
Germany
Ireland
Portuga
lSp
ainEU-27
EU-28
United Kingd
om
RomaniaIta
ly
Hungary
Slove
nia
Croatia
Belgium
Denmark
Slova
kia
Austria
Finland
France
Luxe
mbourg
Lithuania
Latvi
a
Norway
Sweden
Monetary valuation per unit of emission (air pollutants and greenhouse gas) and of noise costs
TableA1.9 Thecostofemissionsofairpollutants(euro/kg)andgreenhousegas(GHG)(euro/tonne)
Pollutant Unit Value
CO2e central
EUR/tonne
100
CO2e low 60
CO2e high 189
NH3
EUR/kg
17.5
NMVOC 1.2
SO2 10.9
NOx transport, city 21.3
NOx transport, rural 12.6
PM2.5 transport, metropole 381
PM2.5 transport, city 123
PM2.5 transport, rural 70
PM10 average 22.3
Note: NMVOC,non-methanevolatileorganiccompound;PM2.5,particulatematterwithadiameterof2.5 μmorless;PM10, particulate matter withadiameterof10 μm or less.
Source: EC (2019d) (Table 14 (air pollutants) and Table 24 (CO2e)).
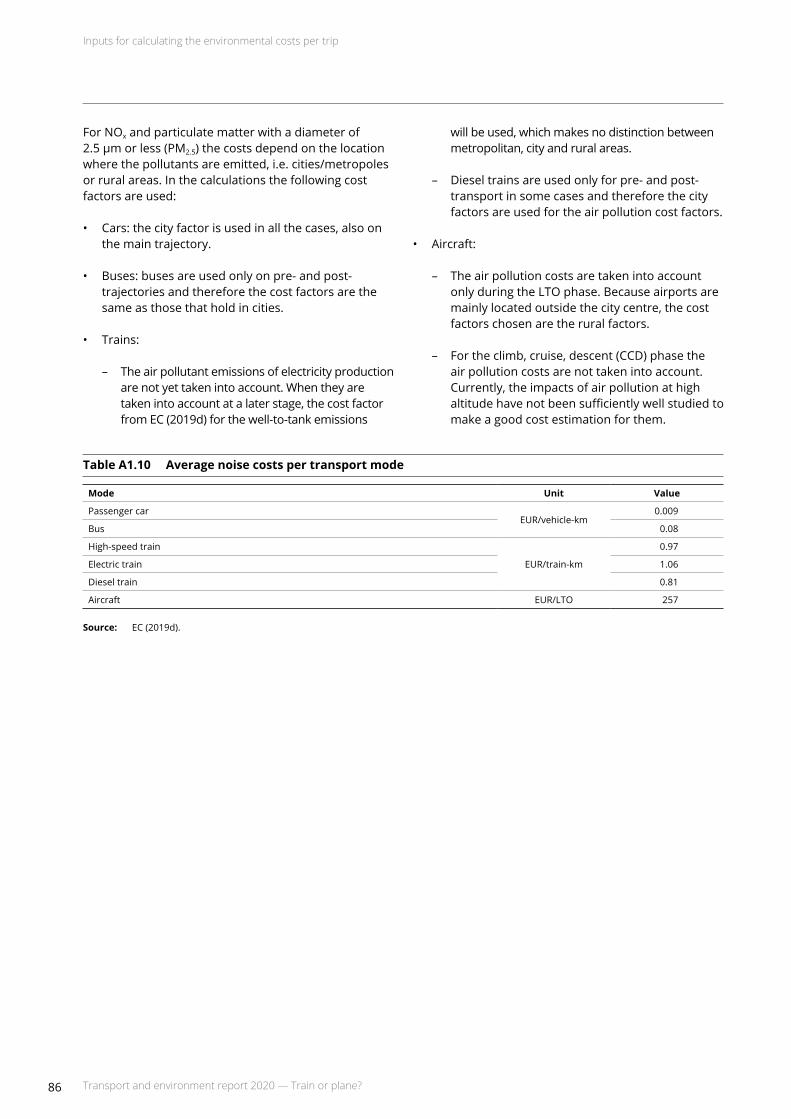
Inputs for calculating the environmental costs per trip
86 Transport and environment report 2020 — Train or plane?
For NOx and particulate matter with a diameter of 2.5 μmorless(PM2.5) the costs depend on the location where the pollutants are emitted, i.e. cities/metropoles or rural areas. In the calculations the following cost factors are used:
• Cars: the city factor is used in all the cases, also on the main trajectory.
• Buses: buses are used only on pre- and post-trajectories and therefore the cost factors are the same as those that hold in cities.
• Trains:
– The air pollutant emissions of electricity production are not yet taken into account. When they are taken into account at a later stage, the cost factor from EC (2019d) for the well-to-tank emissions
will be used, which makes no distinction between metropolitan, city and rural areas.
– Diesel trains are used only for pre- and post-transport in some cases and therefore the city factors are used for the air pollution cost factors.
• Aircraft:
– The air pollution costs are taken into account only during the LTO phase. Because airports are mainly located outside the city centre, the cost factors chosen are the rural factors.
– For the climb, cruise, descent (CCD) phase the air pollution costs are not taken into account. Currently, the impacts of air pollution at high altitude have not been sufficiently well studied to make a good cost estimation for them.
Table A1.10 Average noise costs per transport mode
Mode Unit Value
Passenger carEUR/vehicle-km
0.009
Bus 0.08
High-speed train
EUR/train-km
0.97
Electric train 1.06
Diesel train 0.81
Aircraft EUR/LTO 257
Source: EC (2019d).

87
Environmental costs per city pair
Transport and environment report 2020 — Train or plane?
Annex 2 Environmental costs per city pair
FigureA2.1 Environmentalcostsofmaintripandpre/posttransport—(1)Krakow-Warsaw
Source: EEA.
Bus
Bus
Car_diesel (1P)
Car_diesel (1P) Train_ICe
Train_ICe
284
ATR72 ATR72 ATR72
Train_ICe
Train_ICe
Train_ICe
Main trip segmentLast trip segment
First trip segment
Transport
Distance (km) 293
Car_diesel (1P)
Car_diesel (1P) Train_ICe
Train_ICeTrain_HSR Train_HSR
296
Bus
Bus
Train_ICe
Bus
Bus Car_diesel (1P)
Car_diesel (1P)
Train_HSRCar_diesel (1P) Train_ICe
11.75 € 12.57 € 11.69 €11.96 €
1.42 € 2.49 € 2.55 € 1.47 € 1.42 € 2.49 €
50
60
70
40
30
20
10
0
Climate non-CO2 (medium) Main trip (excluding climate non-CO2)
Total (low climate non-CO2) Total (high climate non-CO2)
Total cost first segment
Total cost last segment
Euros per passenger
This annex gives the environmental costs for all main and alternative city pairs, with a distinction according to the environmental costs for transport to/from the railway station (pre- and post-transport) and for the main trip. In each case, these graphs are shown first for the main city pair and then for the alternative city pair.
For each main transport mode, the figures also present the number of kilometres between the city pairs (for car) and the main city pairs (for air and rail).

Environmental costs per city pair
88 Transport and environment report 2020 — Train or plane?
FigureA2.2 Environmentalcostsofmaintripandpre/posttransport—(1alt)Wieliczka-Piaseczno
Source: EEA.
Source: EEA.
Bus
Bus
Car_diesel (1P)
Car_diesel (1P) Train_ICe
Train_ICe
284
ATR72 ATR72 ATR72
Train_ICe
Train_ICe
Train_ICe
Main trip segmentLast trip segment
First trip segment
Transport
Distance (km) 293
Car_diesel (1P)
Car_diesel (1P) Train_ICe
Train_ICeTrain_HSR Train_HSR
296
Bus
Bus
Train_ICe
Bus
Bus Car_diesel (1P)
Car_diesel (1P)
Train_HSRCar_diesel (1P) Train_ICe
Euros per passenger
Climate non-CO2 (medium) Main trip (excluding climate non-CO2)
Total (low climate non-CO2) Total (high climate non-CO2)
Total cost first segment
Total cost last segment
50
60
70
40
30
20
10
0
13.13 € 11.81 €
11.96 €
1.75 € 2.83 € 3.84 € 2.76 € 1.68 € 2.75 €
11.90 €
Figure A2.3 Environmentalcostsofmaintripandpre/posttransport—(2)Brussels-FrankfurtamMain
Bus
Bus
Car_diesel (1P)
Car_diesel (1P) Train_ICe
Train_ICe
366
A320 A320 A320
Train_ICe
Train_ICe
Train_ICe
Main trip segmentLast trip segment
First trip segment
Transport
Distance (km) 400
Car_diesel (1P)
Car_diesel (1P) Train_ICe
Train_ICeTrain_HSR Train_HSR
401
Bus
Bus
Train_ICe
Bus
Bus Car_diesel (1P)
Car_diesel (1P)
Train_HSRCar_diesel (1P) Train_ICe
Climate non-CO2 (medium) Main trip (excluding climate non-CO2)
Total (low climate non-CO2) Total (high climate non-CO2)
Total cost first segment
Total cost last segment
50
60
70
40
30
20
10
0
12.90 € 13.80 € 12.84 €
1.95 € 3.40 € 3.55 € 2.09 € 1.94 € 3.39 €
16.33 €
Euros per passenger

Environmental costs per city pair
89Transport and environment report 2020 — Train or plane?
Figure A2.4 Environmentalcostsofmaintripandpre/posttransport—(2alt)Leuven-Wiesbaden
Climate non-CO2 (medium) Main trip (excluding climate non-CO2)
Total (low climate non-CO2) Total (high climate non-CO2)
Total cost first segment
Total cost last segment
Euros per passenger
50
60
70
40
30
20
10
0
14.75 €
14.16 €
13.15 € 13.03 €
2.61 € 4.06 €6.08 € 4.63 €
2.46 € 3.91 €
Bus
Bus
Car_diesel (1P)
Car_diesel (1P) Train_ICe
Train_ICe
366
A320 A320 A320
Train_ICe
Train_ICe
Train_ICe
Main trip segmentLast trip segment
First trip segment
Transport
Distance (km) 347
Car_diesel (1P)
Car_diesel (1P) Train_ICe
Train_ICeTrain_HSR Train_HSR
401
Bus
Bus
Train_ICe
Bus
Bus Car_diesel (1P)
Car_diesel (1P)
Train_HSRCar_diesel (1P) Train_ICe
Source: EEA.
Source: EEA.
FigureA2.5 Environmentalcostsofmaintripandpre/posttransport—(3)Sofia-Varna
Bus
Bus
Car_diesel (1P)
Car_diesel (1P)
Car_diesel (1P) Train_ICe
Train_ICe
Train_ICe
Train_ICeTrain_ICe Car_diesel (1P)Train_ICe
461 441387
Bus
Bus
E190 E190 E190Car_diesel (1P) Train_ICe
Main trip segmentLast trip segment
First trip segment
Transport
Distance (km)
15.08 € 15.73 € 15.03 €
3.89 € 4.02 € 3.89 €
18.00 €
50
60
70
40
30
20
10
0
Euros per passenger
Climate non-CO2 (medium) Main trip (excluding climate non-CO2)
Total (low climate non-CO2) Total (high climate non-CO2)
Total cost first segment
Total cost last segment

Environmental costs per city pair
90 Transport and environment report 2020 — Train or plane?
Figure A2.6 Environmentalcostsofmaintripandpre/posttransport—(3alt)Pernik-NoviPazar
Source: EEA.
Source: EEA.
Figure A2.7 Environmentalcostsofmaintripandpre/posttransport—(4)Bucharest-ClujNapoca
Bus
Bus
Car_diesel (1P)
Car_diesel (1P)
Car_diesel (1P) Train_ICe
Train_ICe
Train_ICe
Train_ICeTrain_ICe Car_diesel (1P)Train_ICe
461 372387
Bus
Bus
E190 E190 E190Car_diesel (1P) Train_ICe
Main trip segmentLast trip segment
First trip segment
Transport
Distance (km)
Euros per passenger
15.98 €19.20 €
15.74 €
5.14 €8.81 €
4.87 €
15.18 €
50
60
70
40
30
20
10
0
Climate non-CO2 (medium) Main trip (excluding climate non-CO2)
Total (low climate non-CO2) Total (high climate non-CO2)
Total cost first segment
Total cost last segment
Bus
Bus
Car_diesel (1P)
Car_diesel (1P)
Car_diesel (1P) Train_ICe
Train_ICe
Train_ICe
Train_ICeTrain_ICe Car_diesel (1P)Train_ICe
450 453346
Bus
Bus
B738 B738 B738Car_diesel (1P) Train_ICe
Main trip segmentLast trip segment
First trip segment
Transport
Distance (km)
60
50
40
30
10
0
20
70
0
Euros per passenger
Climate non-CO2 (medium) Main trip (excluding climate non-CO2)
Total (low climate non-CO2) Total (high climate non-CO2)
Total cost first segment
Total cost last segment
11.80 € 12.54 € 11.75 €
3.87 € 4.20 € 3.85 €
18.49 €

Environmental costs per city pair
91Transport and environment report 2020 — Train or plane?
Figure A2.8 Environmentalcostsofmaintripandpre/posttransport—(4alt)Ploiești-Turda
Source: EEA.
Source: EEA.
Figure A2.9 Environmentalcostsofmaintripandpre/posttransport—(5)Lyon-Paris
Climate non-CO2 (medium) Main trip (excluding climate non-CO2)
Total (low climate non-CO2) Total (high climate non-CO2)
Total cost first segment
Total cost last segment
Bus
Bus
Car_diesel (1P)
Car_diesel (1P)
Car_diesel (1P) Train_ICe
Train_ICe
Train_ICe
Train_ICeTrain_ICe Car_diesel (1P)Train_ICe
450 351346
Bus
Bus
B738 B738 B738Car_diesel (1P) Train_ICe
Main trip segmentLast trip segment
First trip segment
Transport
Distance (km)
12.45 €15.04 €
12.26 €
4.77 € 7.66 €4.56 €
14.33 €
50
60
70
40
30
20
10
0
Euros per passenger
Bus
Bus
Car_diesel (1P)
Car_diesel (1P) Train_ICe
Train_ICe
463
A320 A320 A320
Train_ICe
Train_ICe
Train_ICe
Main trip segmentLast trip segment
First trip segment
Transport
Distance (km) 466
Car_diesel (1P)
Car_diesel (1P) Train_ICe
Train_ICeTrain_HSR Train_HSR
474
Bus
Bus
Train_ICe
Bus
Bus Car_diesel (1P)
Car_diesel (1P)
Train_HSRCar_diesel (1P) Train_ICe
13.18€15.18 €
13.03 €
4.03 €2.32 € 4.24 €2.52 € 2.30 € 4.02 €
19.02 €
50
60
70
40
30
20
10
0
Euros per passenger
Climate non-CO2 (medium) Main trip (excluding climate non-CO2)
Total (low climate non-CO2) Total (high climate non-CO2)
Total cost first segment
Total cost last segment
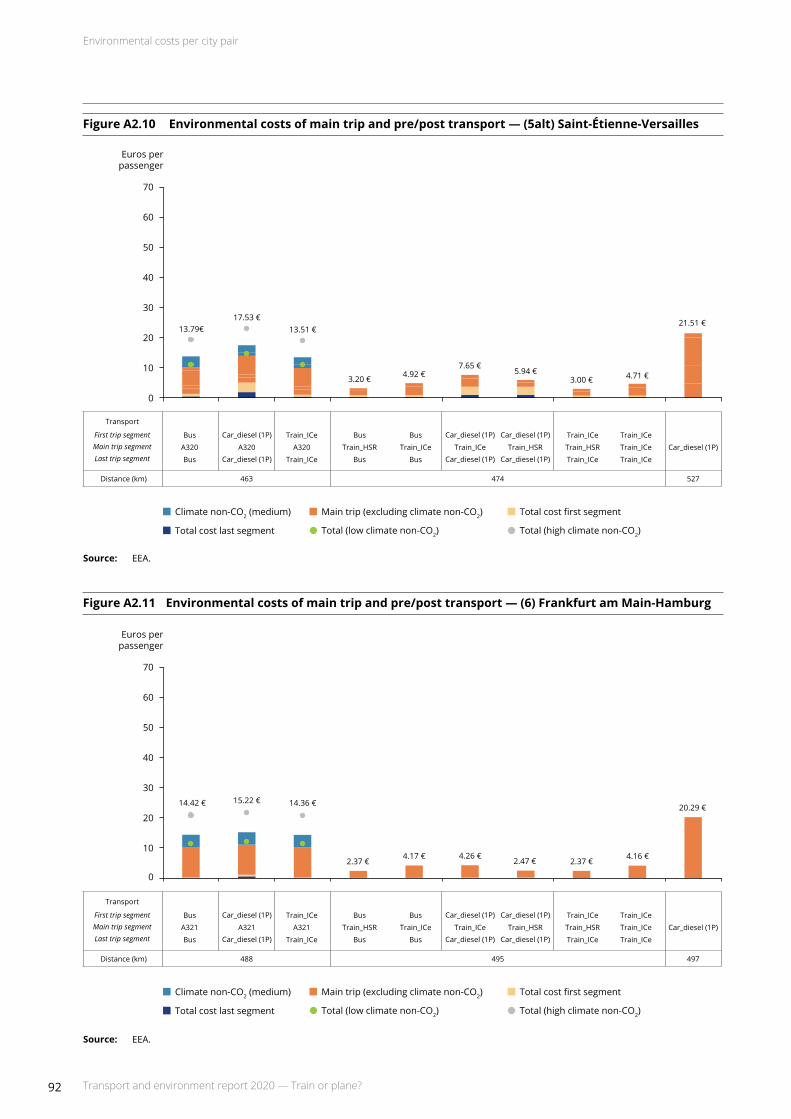
Environmental costs per city pair
92 Transport and environment report 2020 — Train or plane?
Figure A2.10 Environmentalcostsofmaintripandpre/posttransport—(5alt)Saint-Étienne-Versailles
Source: EEA.
Source: EEA.
Figure A2.11 Environmentalcostsofmaintripandpre/posttransport—(6)FrankfurtamMain-Hamburg
Bus
Bus
Car_diesel (1P)
Car_diesel (1P) Train_ICe
Train_ICe
463
A320 A320 A320
Train_ICe
Train_ICe
Train_ICe
Main trip segmentLast trip segment
First trip segment
Transport
Distance (km) 527
Car_diesel (1P)
Car_diesel (1P) Train_ICe
Train_ICeTrain_HSR Train_HSR
474
Bus
Bus
Train_ICe
Bus
Bus Car_diesel (1P)
Car_diesel (1P)
Train_HSRCar_diesel (1P) Train_ICe
13.79€17.53 €
13.51 €
4.92 €3.20 €
7.65 €5.94 €
3.00 € 4.71 €
21.51 €
50
60
70
40
30
20
10
0
Climate non-CO2 (medium) Main trip (excluding climate non-CO2)
Total (low climate non-CO2) Total (high climate non-CO2)
Total cost first segment
Total cost last segment
Euros per passenger
Bus
Bus
Car_diesel (1P)
Car_diesel (1P) Train_ICe
Train_ICe
488
A321 A321 A321
Train_ICe
Train_ICe
Train_ICe
Main trip segmentLast trip segment
First trip segment
Transport
Distance (km) 497
Car_diesel (1P)
Car_diesel (1P) Train_ICe
Train_ICeTrain_HSR Train_HSR
495
Bus
Bus
Train_ICe
Bus
Bus Car_diesel (1P)
Car_diesel (1P)
Train_HSRCar_diesel (1P) Train_ICe
Euros per passenger
50
60
70
40
30
20
10
0
14.42 € 15.22 € 14.36 €
2.37 €4.17 € 4.26 €
2.47 € 2.37 €4.16 €
20.29 €
Climate non-CO2 (medium) Main trip (excluding climate non-CO2)
Total (low climate non-CO2) Total (high climate non-CO2)
Total cost first segment
Total cost last segment
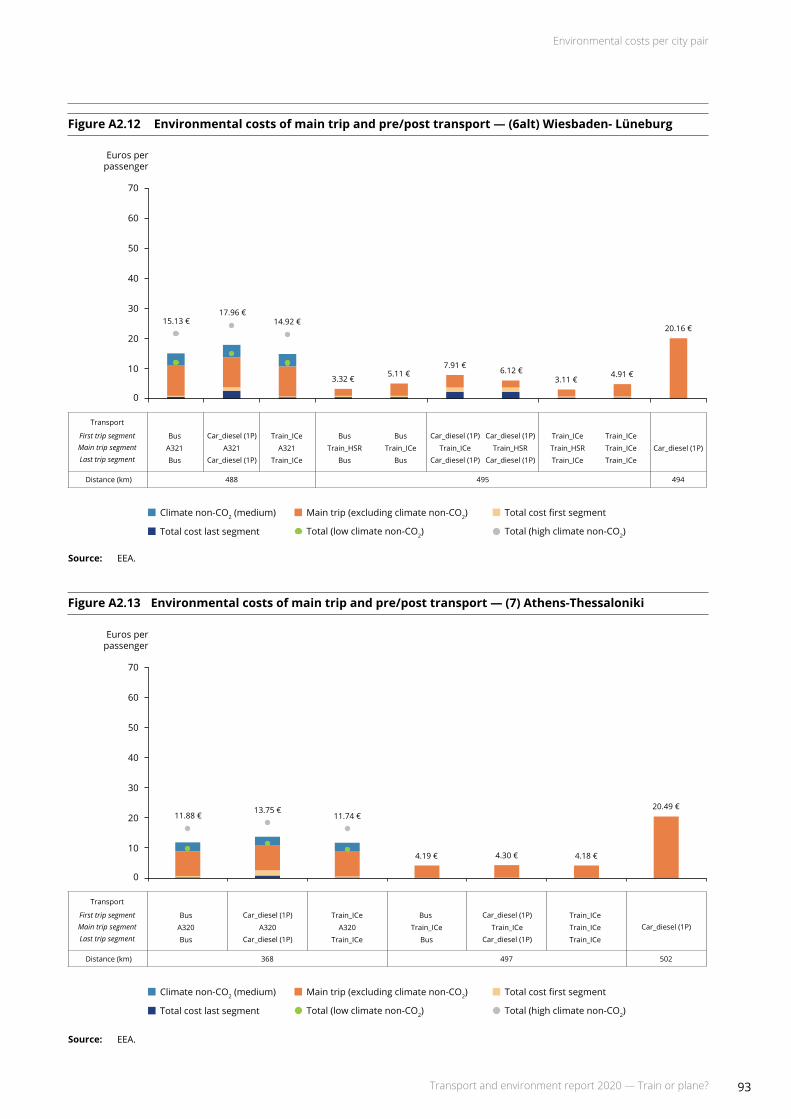
Environmental costs per city pair
93Transport and environment report 2020 — Train or plane?
Figure A2.12 Environmentalcostsofmaintripandpre/posttransport—(6alt)Wiesbaden-Lüneburg
Source: EEA.
Source: EEA.
Figure A2.13 Environmentalcostsofmaintripandpre/posttransport—(7)Athens-Thessaloniki
Bus
Bus
Car_diesel (1P)
Car_diesel (1P) Train_ICe
Train_ICe
488
A321 A321 A321
Train_ICe
Train_ICe
Train_ICe
Main trip segmentLast trip segment
First trip segment
Transport
Distance (km) 494
Car_diesel (1P)
Car_diesel (1P) Train_ICe
Train_ICeTrain_HSR Train_HSR
495
Bus
Bus
Train_ICe
Bus
Bus Car_diesel (1P)
Car_diesel (1P)
Train_HSRCar_diesel (1P) Train_ICe
Euros per passenger
50
60
70
40
30
20
10
0
15.13 €17.96 €
14.92 €
3.32 €5.11 €
7.91 € 6.12 €3.11 €
4.91 €
20.16 €
Climate non-CO2 (medium) Main trip (excluding climate non-CO2)
Total (low climate non-CO2) Total (high climate non-CO2)
Total cost first segment
Total cost last segment
Bus
Bus
Car_diesel (1P)
Car_diesel (1P)
Car_diesel (1P) Train_ICe
Train_ICe
Train_ICe
Train_ICeTrain_ICe Car_diesel (1P)Train_ICe
497 502368
Bus
Bus
A320 A320 A320Car_diesel (1P) Train_ICe
Main trip segmentLast trip segment
First trip segment
Transport
Distance (km)
Euros per passenger
50
60
70
40
30
20
10
0
13.75 €11.74 €
4.19 € 4.30 € 4.18 €
20.49 €11.88 €
Climate non-CO2 (medium) Main trip (excluding climate non-CO2)
Total (low climate non-CO2) Total (high climate non-CO2)
Total cost first segment
Total cost last segment

Environmental costs per city pair
94 Transport and environment report 2020 — Train or plane?
Figure A2.14 Environmentalcostsofmaintripandpre/posttransport—(7alt)Thebes-Edessa
Source: EEA.
Source: EEA.
Figure A2.15 Environmentalcostsofmaintripandpre/posttransport—(8)Amsterdam-Paris
Bus
Bus
Car_diesel (1P)
Car_diesel (1P)
Car_diesel (1P) Train_ICe
Train_ICe
Train_ICe
Train_ICeTrain_ICe Car_diesel (1P)Train_ICe
497 465368
Bus
Bus
A320 A320 A320Car_diesel (1P) Train_ICe
Main trip segmentLast trip segment
First trip segment
Transport
Distance (km)
Climate non-CO2 (medium) Main trip (excluding climate non-CO2)
Total (low climate non-CO2) Total (high climate non-CO2)
Total cost first segment
Total cost last segment
Euros per passenger
50
60
70
40
30
20
10
0
13.58 €
20.32 €
13.08 €
5.85 €
10.69 €
5.49 €
18.98 €
Bus
Bus
Car_diesel (1P)
Car_diesel (1P) Train_ICe
Train_ICe
467
B738 B738 B738
Train_ICe
Train_ICe
Train_ICe
Main trip segmentLast trip segment
First trip segment
Transport
Distance (km) 511
Car_diesel (1P)
Car_diesel (1P) Train_ICe
Train_ICeTrain_HSR Train_HSR
505
Bus
Bus
Train_ICe
Bus
Bus Car_diesel (1P)
Car_diesel (1P)
Train_HSRCar_diesel (1P) Train_ICe
Climate non-CO2 (medium) Main trip (excluding climate non-CO2)
Total (low climate non-CO2) Total (high climate non-CO2)
Total cost first segment
Total cost last segment
50
60
70
40
30
20
10
0
14.23 €12.35 €
2.46 €4.29 € 4.49 €
2.66 € 2.45 €4.27 €
20.86 €12.48 €
Euros per passenger
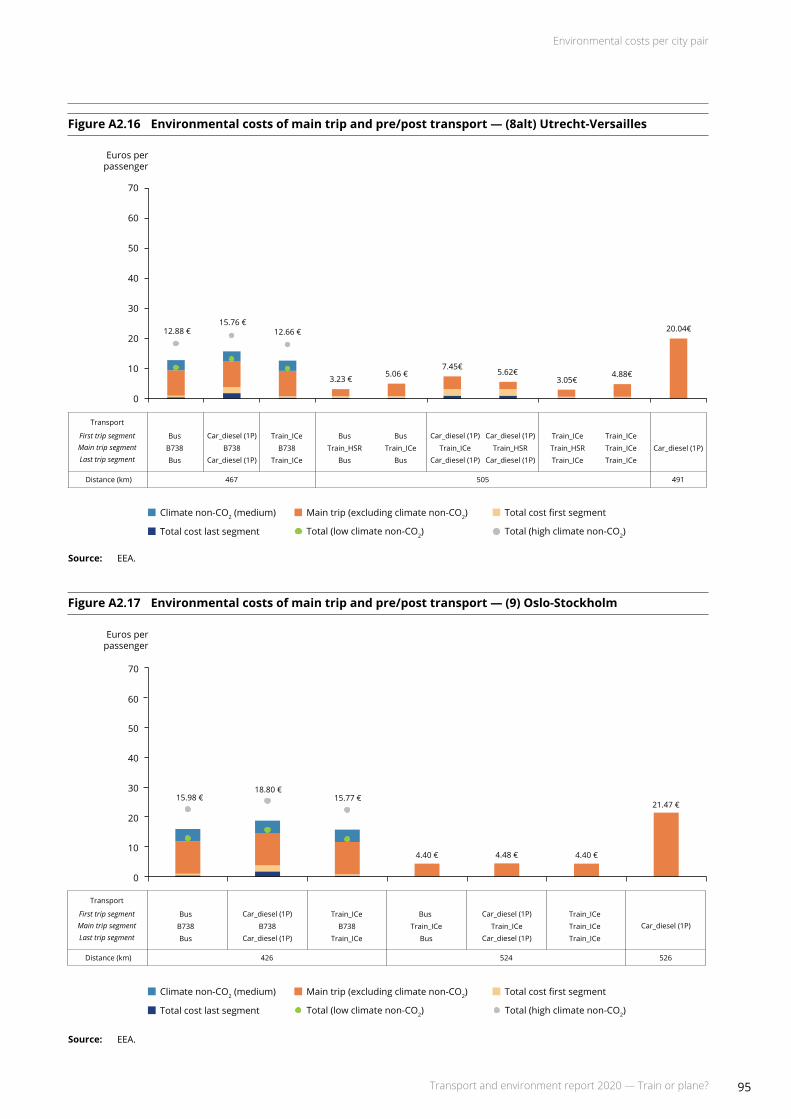
Environmental costs per city pair
95Transport and environment report 2020 — Train or plane?
Figure A2.16 Environmentalcostsofmaintripandpre/posttransport—(8alt)Utrecht-Versailles
Source: EEA.
Source: EEA.
Figure A2.17 Environmentalcostsofmaintripandpre/posttransport—(9)Oslo-Stockholm
Bus
Bus
Car_diesel (1P)
Car_diesel (1P) Train_ICe
Train_ICe
467
B738 B738 B738
Train_ICe
Train_ICe
Train_ICe
Main trip segmentLast trip segment
First trip segment
Transport
Distance (km) 491
Car_diesel (1P)
Car_diesel (1P) Train_ICe
Train_ICeTrain_HSR Train_HSR
505
Bus
Bus
Train_ICe
Bus
Bus Car_diesel (1P)
Car_diesel (1P)
Train_HSRCar_diesel (1P) Train_ICe
Euros per passenger
50
60
70
40
30
20
10
0
12.88 €15.76 €
12.66 €
3.23 €5.06 €
7.45€5.62€
3.05€4.88€
20.04€
Climate non-CO2 (medium) Main trip (excluding climate non-CO2)
Total (low climate non-CO2) Total (high climate non-CO2)
Total cost first segment
Total cost last segment
Euros per passenger
15.98 €
60
50
40
30
10
0
20
70
18.80 €15.77 €
4.40 € 4.48 € 4.40 €
21.47 €
Climate non-CO2 (medium) Main trip (excluding climate non-CO2)
Total (low climate non-CO2) Total (high climate non-CO2)
Total cost first segment
Total cost last segment
Bus
Bus
Car_diesel (1P)
Car_diesel (1P)
Car_diesel (1P) Train_ICe
Train_ICe
Train_ICe
Train_ICeTrain_ICe Car_diesel (1P)Train_ICe
524 526426
Bus
Bus
B738 B738 B738Car_diesel (1P) Train_ICe
Main trip segmentLast trip segment
First trip segment
Transport
Distance (km)

Environmental costs per city pair
96 Transport and environment report 2020 — Train or plane?
Figure A2.18 Environmentalcostsofmaintripandpre/posttransport—(9alt)Drammen-Ösmo
Source: EEA.
Source: EEA.
Figure A2.19 Environmentalcostsofmaintripandpre/posttransport—(10)Madrid-Barcelona
Bus
Bus
Car_diesel (1P)
Car_diesel (1P)
Car_diesel (1P) Train_ICe
Train_ICe
Train_ICe
Train_ICeTrain_ICe Car_diesel (1P)Train_ICe
524 553426
Bus
Bus
B738 B738 B738Car_diesel (1P) Train_ICe
Main trip segmentLast trip segment
First trip segment
Transport
Distance (km)
Euros per passenger
60
50
40
30
10
0
20
70
16.93 €
22.48 €
16.52 €
5.37 €8.18 €
5.16 €
22.57 €
Climate non-CO2 (medium) Main trip (excluding climate non-CO2)
Total (low climate non-CO2) Total (high climate non-CO2)
Total cost first segment
Total cost last segment
Bus
Bus
Car_diesel (1P)
Car_diesel (1P) Train_ICe
Train_ICe
545
A320 A320 A320
Train_ICe
Train_ICe
Train_ICe
Main trip segmentLast trip segment
First trip segment
Transport
Distance (km) 621
Car_diesel (1P)
Car_diesel (1P) Train_ICe
Train_ICeTrain_HSR Train_HSR
614
Bus
Bus
Train_ICe
Bus
Bus Car_diesel (1P)
Car_diesel (1P)
Train_HSRCar_diesel (1P) Train_ICe
50
60
70
40
30
20
10
0
Euros per passenger
14.13 € 15.16 € 14.05 €
2.97 €5.19 € 5.38 €
3.15 € 2.96 €5.18 €
25.35 €
Climate non-CO2 (medium) Main trip (excluding climate non-CO2)
Total (low climate non-CO2) Total (high climate non-CO2)
Total cost first segment
Total cost last segment
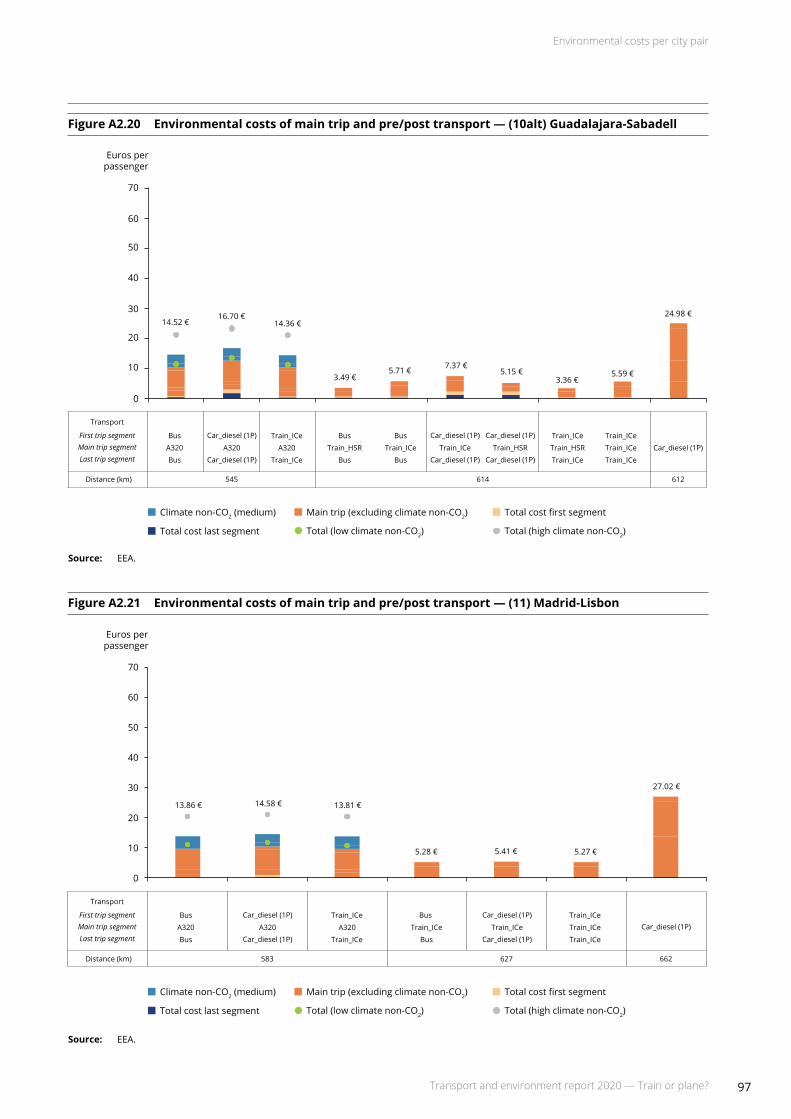
Environmental costs per city pair
97Transport and environment report 2020 — Train or plane?
Figure A2.20 Environmentalcostsofmaintripandpre/posttransport—(10alt)Guadalajara-Sabadell
Source: EEA.
Source: EEA.
Figure A2.21 Environmentalcostsofmaintripandpre/posttransport—(11)Madrid-Lisbon
Bus
Bus
Car_diesel (1P)
Car_diesel (1P) Train_ICe
Train_ICe
545
A320 A320 A320
Train_ICe
Train_ICe
Train_ICe
Main trip segmentLast trip segment
First trip segment
Transport
Distance (km) 612
Car_diesel (1P)
Car_diesel (1P) Train_ICe
Train_ICeTrain_HSR Train_HSR
614
Bus
Bus
Train_ICe
Bus
Bus Car_diesel (1P)
Car_diesel (1P)
Train_HSRCar_diesel (1P) Train_ICe
50
60
70
40
30
20
10
0
Euros per passenger
14.52 €16.70 €
14.36 €
3.49 €5.71 € 7.37 €
5.15 €3.36 €
5.59 €
24.98 €
Climate non-CO2 (medium) Main trip (excluding climate non-CO2)
Total (low climate non-CO2) Total (high climate non-CO2)
Total cost first segment
Total cost last segment
Bus
Bus
Car_diesel (1P)
Car_diesel (1P)
Car_diesel (1P) Train_ICe
Train_ICe
Train_ICe
Train_ICeTrain_ICe Car_diesel (1P)Train_ICe
627 662583
Bus
Bus
A320 A320 A320Car_diesel (1P) Train_ICe
Main trip segmentLast trip segment
First trip segment
Transport
Distance (km)
27.02 €
50
60
70
40
30
20
10
Euros per passenger
0
13.86 € 14.58 € 13.81 €
5.28 € 5.41 € 5.27 €
Climate non-CO2 (medium) Main trip (excluding climate non-CO2)
Total (low climate non-CO2) Total (high climate non-CO2)
Total cost first segment
Total cost last segment

Environmental costs per city pair
98 Transport and environment report 2020 — Train or plane?
Figure A2.22 Environmentalcostsofmaintripandpre/posttransport—(11alt)Guadalajara-Setúbal
Source: EEA.
Source: EEA.
Figure A2.23 Environmentalcostsofmaintripandpre/posttransport—(12)Copenhagen-Stockholm
Bus
Bus
Car_diesel (1P)
Car_diesel (1P)
Car_diesel (1P) Train_ICe
Train_ICe
Train_ICe
Train_ICeTrain_ICe Car_diesel (1P)Train_ICe
627 637583
Bus
Bus
A320 A320 A320Car_diesel (1P) Train_ICe
Main trip segmentLast trip segment
First trip segment
Transport
Distance (km)
14.43 €16.76 €
14.26 €
6.03 €8.31 €
5.87 €
26.00 €
50
60
70
40
30
20
10
Euros perpassenger
0
Climate non-CO2 (medium) Main trip (excluding climate non-CO2)
Total (low climate non-CO2) Total (high climate non-CO2)
Total cost first segment
Total cost last segment
Bus
Bus
Car_diesel (1P)
Car_diesel (1P) Train_ICe
Train_ICe
550
B738 B738 B738Main trip segmentLast trip segment
First trip segment
Transport
Distance (km) 657
Car_diesel (1P)
Car_diesel (1P) Train_ICe
Train_ICeTrain_HSR Train_HSR
658
Bus
Bus
Train_ICe
Bus
Bus Car_diesel (1P)
Car_diesel (1P)
Train_HSRCar_diesel (1P) Train_ICe
Train_ICe
Train_ICe
Train_ICe
50
60
70
40
30
20
10
Euros perpassenger
0
17.38 € 18.91 € 17.27 € 26.82 €
3.13 €5.52 € 5.57 €
3.19 € 3.13 €5.51 €
Climate non-CO2 (medium) Main trip (excluding climate non-CO2)
Total (low climate non-CO2) Total (high climate non-CO2)
Total cost first segment
Total cost last segment
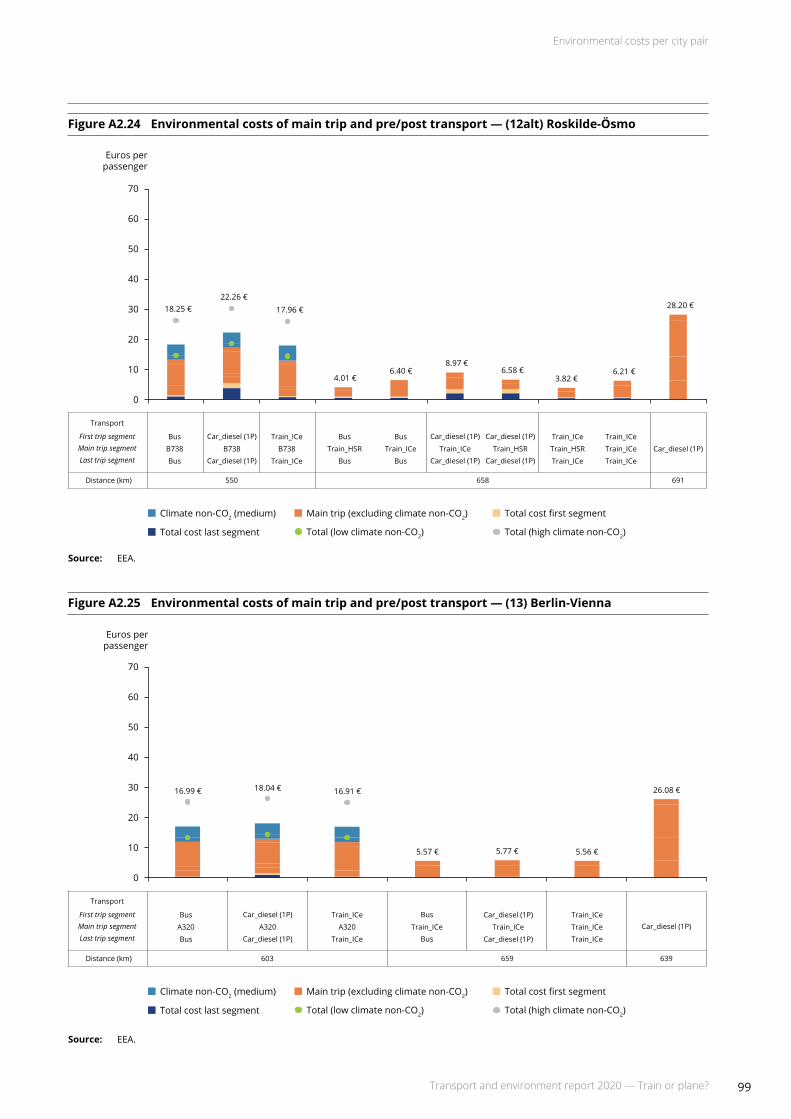
Environmental costs per city pair
99Transport and environment report 2020 — Train or plane?
FigureA2.24 Environmentalcostsofmaintripandpre/posttransport—(12alt)Roskilde-Ösmo
Source: EEA.
Source: EEA.
FigureA2.25 Environmentalcostsofmaintripandpre/posttransport—(13)Berlin-Vienna
Bus
Bus
Car_diesel (1P)
Car_diesel (1P) Train_ICe
Train_ICe
550
B738 B738 B738
Train_ICe
Train_ICe
Train_ICe
Main trip segmentLast trip segment
First trip segment
Transport
Distance (km) 691
Car_diesel (1P)
Car_diesel (1P) Train_ICe
Train_ICeTrain_HSR Train_HSR
658
Bus
Bus
Train_ICe
Bus
Bus Car_diesel (1P)
Car_diesel (1P)
Train_HSRCar_diesel (1P) Train_ICe
50
60
70
40
30
20
10
Euros perpassenger
0
18.25 €22.26 €
17.96 €
4.01 €6.40 €
8.97 €6.58 €
3.82 €6.21 €
28.20 €
Climate non-CO2 (medium) Main trip (excluding climate non-CO2)
Total (low climate non-CO2) Total (high climate non-CO2)
Total cost first segment
Total cost last segment
Bus
Bus
Car_diesel (1P)
Car_diesel (1P)
Bus Car_diesel (1P)
Train_ICe
Train_ICe
Train_ICe Train_ICe Car_diesel (1P)Train_ICe
639659603
Train_ICe
Train_ICe
A320 A320 A320Bus Car_diesel (1P)
Main trip segmentLast trip segment
First trip segment
Transport
Distance (km)
50
60
70
40
30
20
10
Euros perpassenger
0
16.99 € 18.04 € 16.91 € 26.08 €
5.57 € 5.77 € 5.56 €
Climate non-CO2 (medium) Main trip (excluding climate non-CO2)
Total (low climate non-CO2) Total (high climate non-CO2)
Total cost first segment
Total cost last segment
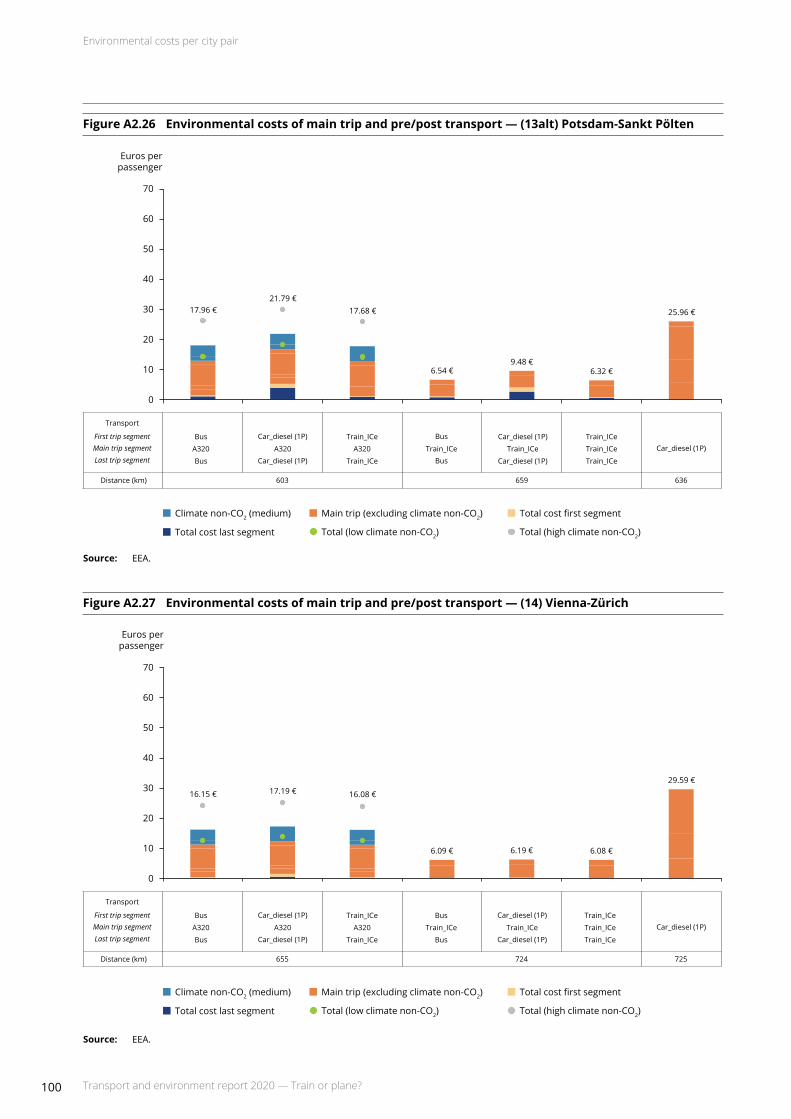
Environmental costs per city pair
100 Transport and environment report 2020 — Train or plane?
FigureA2.26 Environmentalcostsofmaintripandpre/posttransport—(13alt)Potsdam-SanktPölten
Source: EEA.
Source: EEA.
FigureA2.27 Environmentalcostsofmaintripandpre/posttransport—(14)Vienna-Zürich
Bus
Bus
Car_diesel (1P)
Car_diesel (1P)
Bus Car_diesel (1P)
Train_ICe
Train_ICe
Train_ICe Train_ICe Car_diesel (1P)Train_ICe
636659603
Train_ICe
Train_ICe
A320 A320 A320Bus Car_diesel (1P)
Main trip segmentLast trip segment
First trip segment
Transport
Distance (km)
17.96 €21.79 €
17.68 € 25.96 €
6.54 €9.48 €
6.32 €
50
60
70
40
30
20
10
Euros per passenger
0
Climate non-CO2 (medium) Main trip (excluding climate non-CO2)
Total (low climate non-CO2) Total (high climate non-CO2)
Total cost first segment
Total cost last segment
Bus
Bus
Car_diesel (1P)
Car_diesel (1P)
Car_diesel (1P) Train_ICe
Train_ICe
Train_ICe
Train_ICeTrain_ICe Car_diesel (1P)Train_ICe
724 725655
Bus
Bus
A320 A320 A320Car_diesel (1P) Train_ICe
Main trip segmentLast trip segment
First trip segment
Transport
Distance (km)
16.15 € 17.19 € 16.08 €
6.09 € 6.19 € 6.08 €
29.59 €
50
60
70
40
30
20
10
Euros perpassenger
0
Climate non-CO2 (medium) Main trip (excluding climate non-CO2)
Total (low climate non-CO2) Total (high climate non-CO2)
Total cost first segment
Total cost last segment
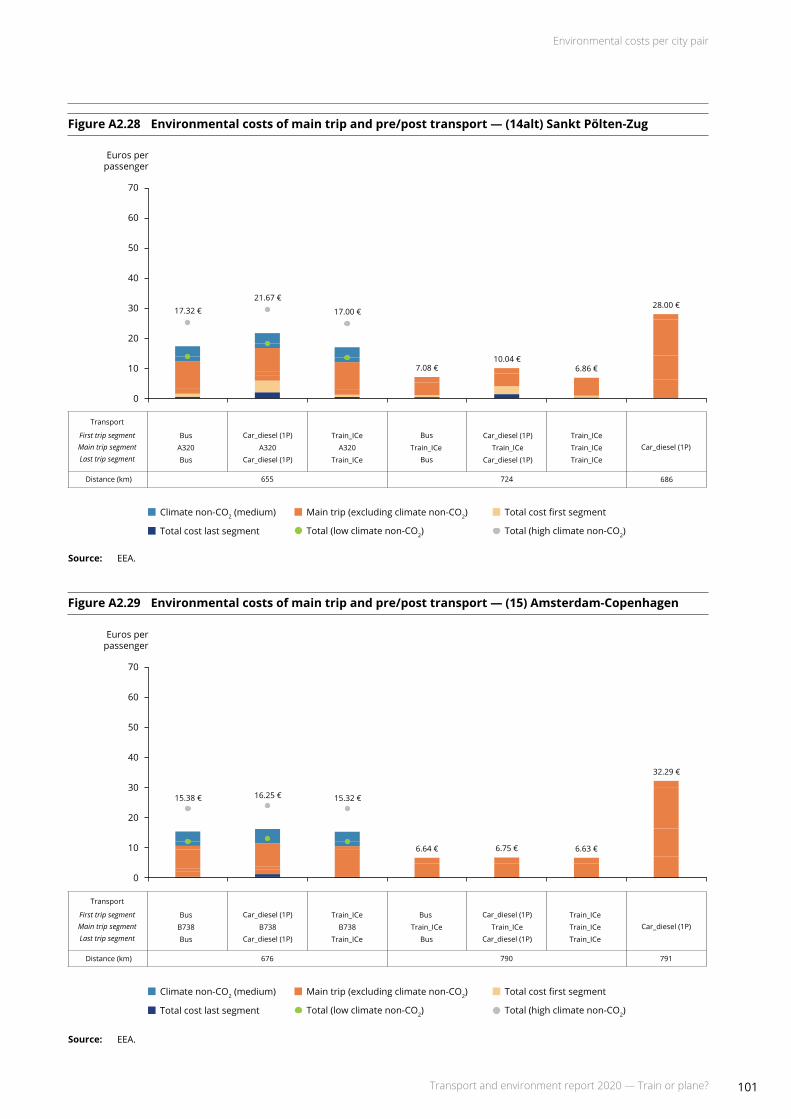
Environmental costs per city pair
101Transport and environment report 2020 — Train or plane?
FigureA2.28 Environmentalcostsofmaintripandpre/posttransport—(14alt)SanktPölten-Zug
Source: EEA.
Source: EEA.
FigureA2.29 Environmentalcostsofmaintripandpre/posttransport—(15)Amsterdam-Copenhagen
Bus
Bus
Car_diesel (1P)
Car_diesel (1P)
Bus Car_diesel (1P)
Train_ICe
Train_ICe
Train_ICe Train_ICe Car_diesel (1P)Train_ICe
686724655
Train_ICe
Train_ICe
A320 A320 A320Bus Car_diesel (1P)
Main trip segmentLast trip segment
First trip segment
Transport
Distance (km)
17.32 €21.67 €
17.00 €28.00 €
7.08 €10.04 €
6.86 €
50
60
70
40
30
20
10
Euros perpassenger
0
Climate non-CO2 (medium) Main trip (excluding climate non-CO2)
Total (low climate non-CO2) Total (high climate non-CO2)
Total cost first segment
Total cost last segment
Bus
Bus
Car_diesel (1P)
Car_diesel (1P)
Car_diesel (1P) Train_ICe
Train_ICe
Train_ICe
Train_ICeTrain_ICe Car_diesel (1P)Train_ICe
790 791676
Bus
Bus
B738 B738 B738Car_diesel (1P) Train_ICe
Main trip segmentLast trip segment
First trip segment
Transport
Distance (km)
15.38 € 16.25 € 15.32 €
6.64 € 6.75 € 6.63 €
32.29 €
50
60
70
40
30
20
10
Euros perpassenger
0
Climate non-CO2 (medium) Main trip (excluding climate non-CO2)
Total (low climate non-CO2) Total (high climate non-CO2)
Total cost first segment
Total cost last segment
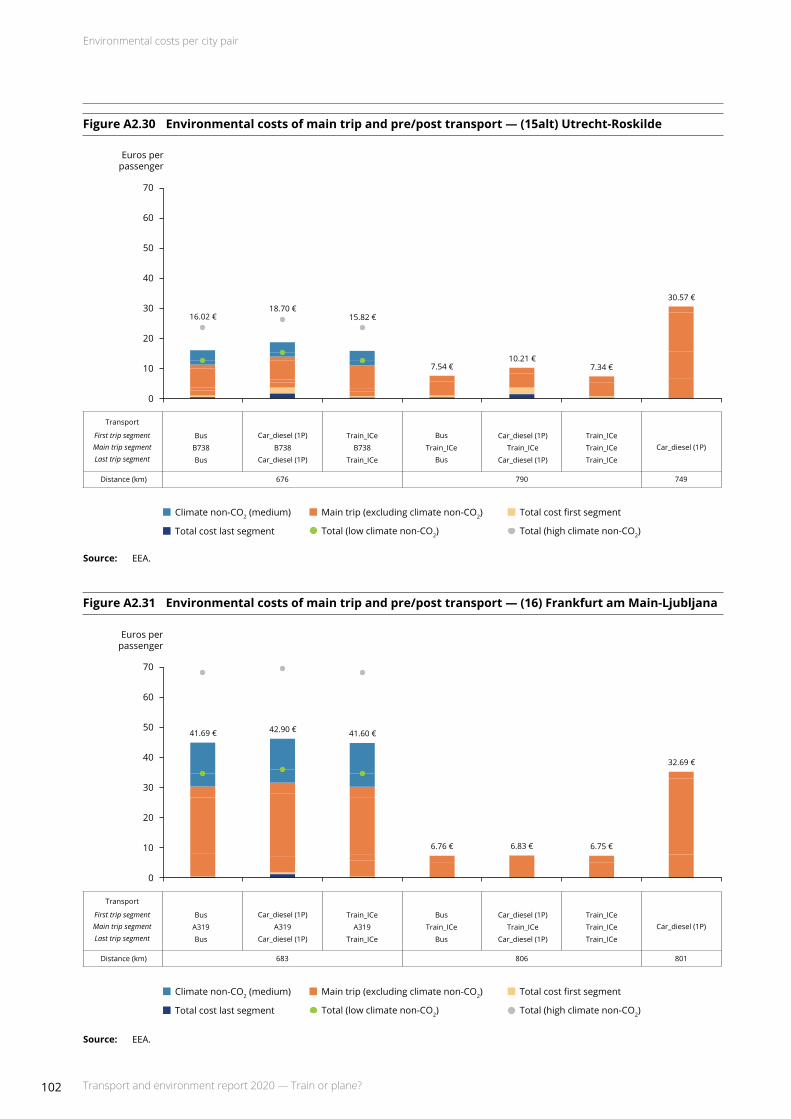
Environmental costs per city pair
102 Transport and environment report 2020 — Train or plane?
FigureA2.30 Environmentalcostsofmaintripandpre/posttransport—(15alt)Utrecht-Roskilde
Source: EEA.
Source: EEA.
FigureA2.31 Environmentalcostsofmaintripandpre/posttransport—(16)FrankfurtamMain-Ljubljana
Bus
Bus
Car_diesel (1P)
Car_diesel (1P)
Bus Car_diesel (1P)
Train_ICe
Train_ICe
Train_ICe Train_ICe Car_diesel (1P)Train_ICe
749790676
Train_ICe
Train_ICe
B738 B738 B738Bus Car_diesel (1P)
Main trip segmentLast trip segment
First trip segment
Transport
Distance (km)
16.02 €18.70 €
15.82 €
30.57 €
7.54 €10.21 €
7.34 €
50
60
70
40
30
20
10
Euros perpassenger
0
Climate non-CO2 (medium) Main trip (excluding climate non-CO2)
Total (low climate non-CO2) Total (high climate non-CO2)
Total cost first segment
Total cost last segment
Bus
Bus
Car_diesel (1P)
Car_diesel (1P)
Bus Car_diesel (1P)
Train_ICe
Train_ICe
Train_ICe Train_ICe Car_diesel (1P)Train_ICe
801806683
Train_ICe
Train_ICe
A319 A319 A319
Bus Car_diesel (1P)
Main trip segmentLast trip segment
First trip segment
Transport
Distance (km)
41.69 € 42.90 € 41.60 €
32.69 €
6.76 € 6.83 € 6.75 €
50
60
70
40
30
20
10
Euros perpassenger
0
Climate non-CO2 (medium) Main trip (excluding climate non-CO2)
Total (low climate non-CO2) Total (high climate non-CO2)
Total cost first segment
Total cost last segment

Environmental costs per city pair
103Transport and environment report 2020 — Train or plane?
FigureA2.32 Environmentalcostsofmaintripandpre/posttransport—(16alt)Wiesbaden-Kamnik
Source: EEA.
Source: EEA.
FigureA2.33 Environmentalcostsofmaintripandpre/posttransport—(17)Milan-Paris
Bus
Bus
Car_diesel (1P)
Car_diesel (1P)
Car_diesel (1P) Train_ICe
Train_ICe
Train_ICe
Train_ICeTrain_ICe Car_diesel (1P)Train_ICe
806 827683
Bus
Bus
A319 A319 A319Car_diesel (1P) Train_ICe
Main trip segmentLast trip segment
First trip segment
Transport
Distance (km)
41.72 € 42.99 € 41.62 €
7.35 €9.12 €
7.22 €
33.76 €
50
60
70
40
30
20
10
Euros perpassenger
0
Climate non-CO2 (medium) Main trip (excluding climate non-CO2)
Total (low climate non-CO2) Total (high climate non-CO2)
Total cost first segment
Total cost last segment
Bus
Bus
Car_diesel (1P)
Car_diesel (1P) Train_ICe
Train_ICe
722
A320 A320 A320
Train_ICe
Train_ICe
Train_ICe
Main trip segmentLast trip segment
First trip segment
Transport
Distance (km) 914
Car_diesel (1P)
Car_diesel (1P) Train_ICe
Train_ICeTrain_HSR Train_HSR
860
Bus
Bus
Train_ICe
Bus
Bus Car_diesel (1P)
Car_diesel (1P)
Train_HSRCar_diesel (1P) Train_ICe
16.32 €18.94 €
16.12 €
4.14 €7.26 € 7.46 €
4.35 € 4.13 €7.24 €
37.31 €
50
60
70
40
30
20
10
Euros perpassenger
0
Climate non-CO2 (medium) Main trip (excluding climate non-CO2)
Total (low climate non-CO2) Total (high climate non-CO2)
Total cost first segment
Total cost last segment
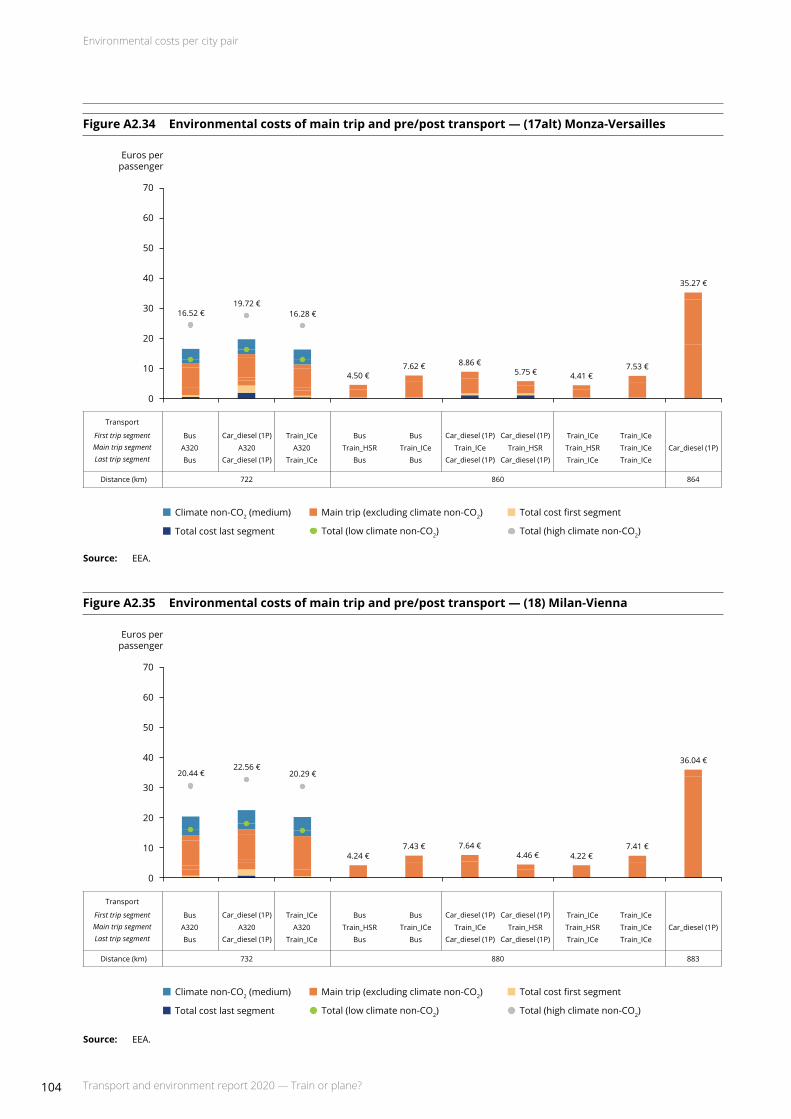
Environmental costs per city pair
104 Transport and environment report 2020 — Train or plane?
FigureA2.34 Environmentalcostsofmaintripandpre/posttransport—(17alt)Monza-Versailles
Source: EEA.
Source: EEA.
FigureA2.35 Environmentalcostsofmaintripandpre/posttransport—(18)Milan-Vienna
Bus
Bus
Car_diesel (1P)
Car_diesel (1P) Train_ICe
Train_ICe
722
A320 A320 A320
Train_ICe
Train_ICe
Train_ICe
Main trip segmentLast trip segment
First trip segment
Transport
Distance (km) 864
Car_diesel (1P)
Car_diesel (1P) Train_ICe
Train_ICeTrain_HSR Train_HSR
860
Bus
Bus
Train_ICe
Bus
Bus Car_diesel (1P)
Car_diesel (1P)
Train_HSRCar_diesel (1P) Train_ICe
16.52 €19.72 €
16.28 €
4.50 €7.62 € 8.86 €
5.75 € 4.41 €7.53 €
35.27 €
50
60
70
40
30
20
10
Euros perpassenger
0
Climate non-CO2 (medium) Main trip (excluding climate non-CO2)
Total (low climate non-CO2) Total (high climate non-CO2)
Total cost first segment
Total cost last segment
Bus
Bus
Car_diesel (1P)
Car_diesel (1P) Train_ICe
Train_ICe
732
A320 A320 A320
Train_ICe
Train_ICe
Train_ICe
Main trip segmentLast trip segment
First trip segment
Transport
Distance (km) 883
Car_diesel (1P)
Car_diesel (1P) Train_ICe
Train_ICeTrain_HSR Train_HSR
880
Bus
Bus
Train_ICe
Bus
Bus Car_diesel (1P)
Car_diesel (1P)
Train_HSRCar_diesel (1P) Train_ICe
20.44 €22.56 €
20.29 €
4.24 €7.43 € 7.64 €
4.46 € 4.22 €7.41 €
36.04 €
50
60
70
40
30
20
10
Euros perpassenger
0
Climate non-CO2 (medium) Main trip (excluding climate non-CO2)
Total (low climate non-CO2) Total (high climate non-CO2)
Total cost first segment
Total cost last segment

Environmental costs per city pair
105Transport and environment report 2020 — Train or plane?
FigureA2.36 Environmentalcostsofmaintripandpre/posttransport—(18alt)MonzaeBrianza-Sankt Pölten
Source: EEA.
Source: EEA.
FigureA2.37 Environmentalcostsofmaintripandpre/posttransport—(19)Budapest-Milan
Bus
Bus
Car_diesel (1P)
Car_diesel (1P) Train_ICe
Train_ICe
732
A320 A320 A320
Train_ICe
Train_ICe
Train_ICe
Main trip segmentLast trip segment
First trip segment
Transport
Distance (km) 809
Car_diesel (1P)
Car_diesel (1P) Train_ICe
Train_ICeTrain_HSR Train_HSR
880
Bus
Bus
Train_ICe
Bus
Bus Car_diesel (1P)
Car_diesel (1P)
Train_HSRCar_diesel (1P) Train_ICe
21.33 €
25.98 €
20.99 € 33.02 €
5.01 €8.19 €
10.60 €7.41 €
4.83 €8.01 €
50
60
70
40
30
20
10
Euros perpassenger
0
Climate non-CO2 (medium) Main trip (excluding climate non-CO2)
Total (low climate non-CO2) Total (high climate non-CO2)
Total cost first segment
Total cost last segment
Bus
Bus
Car_diesel (1P)
Car_diesel (1P)
Car_diesel (1P) Train_ICe
Train_ICe
Train_ICe
Train_ICeTrain_ICe Car_diesel (1P)Train_ICe
979 964917
Bus
Bus
A321 A321 A321Car_diesel (1P) Train_ICe
Main trip segmentLast trip segment
First trip segment
Transport
Distance (km)
20.38 € 21.50 € 20.30 €
39.35 €
8.25 € 8.47 € 8.24 €
50
60
70
40
30
20
10
Euros perpassenger
0
Climate non-CO2 (medium) Main trip (excluding climate non-CO2)
Total (low climate non-CO2) Total (high climate non-CO2)
Total cost first segment
Total cost last segment
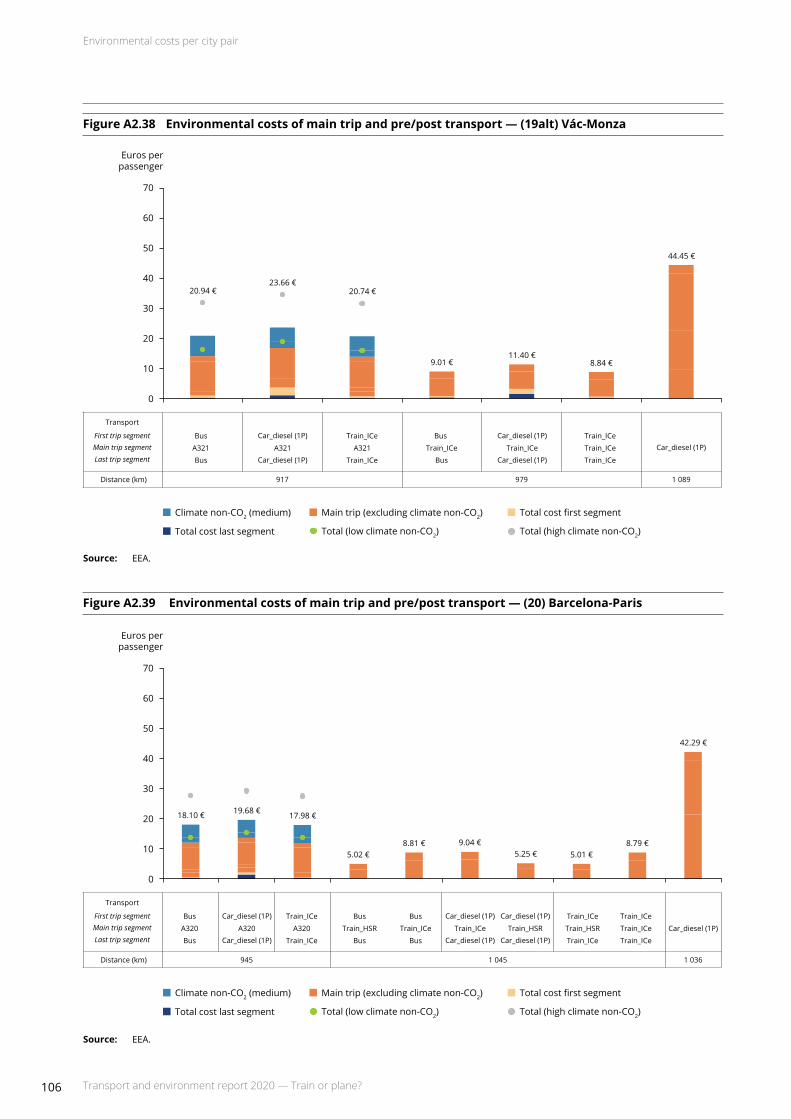
Environmental costs per city pair
106 Transport and environment report 2020 — Train or plane?
FigureA2.38 Environmentalcostsofmaintripandpre/posttransport—(19alt)Vác-Monza
Source: EEA.
Source: EEA.
FigureA2.39 Environmentalcostsofmaintripandpre/posttransport—(20)Barcelona-Paris
Bus
Bus
Car_diesel (1P)
Car_diesel (1P)
Car_diesel (1P) Train_ICe
Train_ICe
Train_ICe
Train_ICeTrain_ICe Car_diesel (1P)Train_ICe
979 1 089917
Bus
Bus
A321 A321 A321Car_diesel (1P) Train_ICe
Main trip segmentLast trip segment
First trip segment
Transport
Distance (km)
20.94 €23.66 €
20.74 €
9.01 €11.40 €
8.84 €
44.45 €50
60
70
40
30
20
10
Euros perpassenger
0
Climate non-CO2 (medium) Main trip (excluding climate non-CO2)
Total (low climate non-CO2) Total (high climate non-CO2)
Total cost first segment
Total cost last segment
Bus
Bus
Car_diesel (1P)
Car_diesel (1P) Train_ICe
Train_ICe
945
A320 A320 A320
Train_ICe
Train_ICe
Train_ICe
Main trip segmentLast trip segment
First trip segment
Transport
Distance (km) 1 036
Car_diesel (1P)
Car_diesel (1P) Train_ICe
Train_ICeTrain_HSR Train_HSR
1 045
Bus
Bus
Train_ICe
Bus
Bus Car_diesel (1P)
Car_diesel (1P)
Train_HSRCar_diesel (1P) Train_ICe
18.10 € 19.68 € 17.98 €
42.29 €
5.02 €8.81 € 9.04 €
5.25 € 5.01 €8.79 €
50
60
70
40
30
20
10
Euros perpassenger
0
Climate non-CO2 (medium) Main trip (excluding climate non-CO2)
Total (low climate non-CO2) Total (high climate non-CO2)
Total cost first segment
Total cost last segment
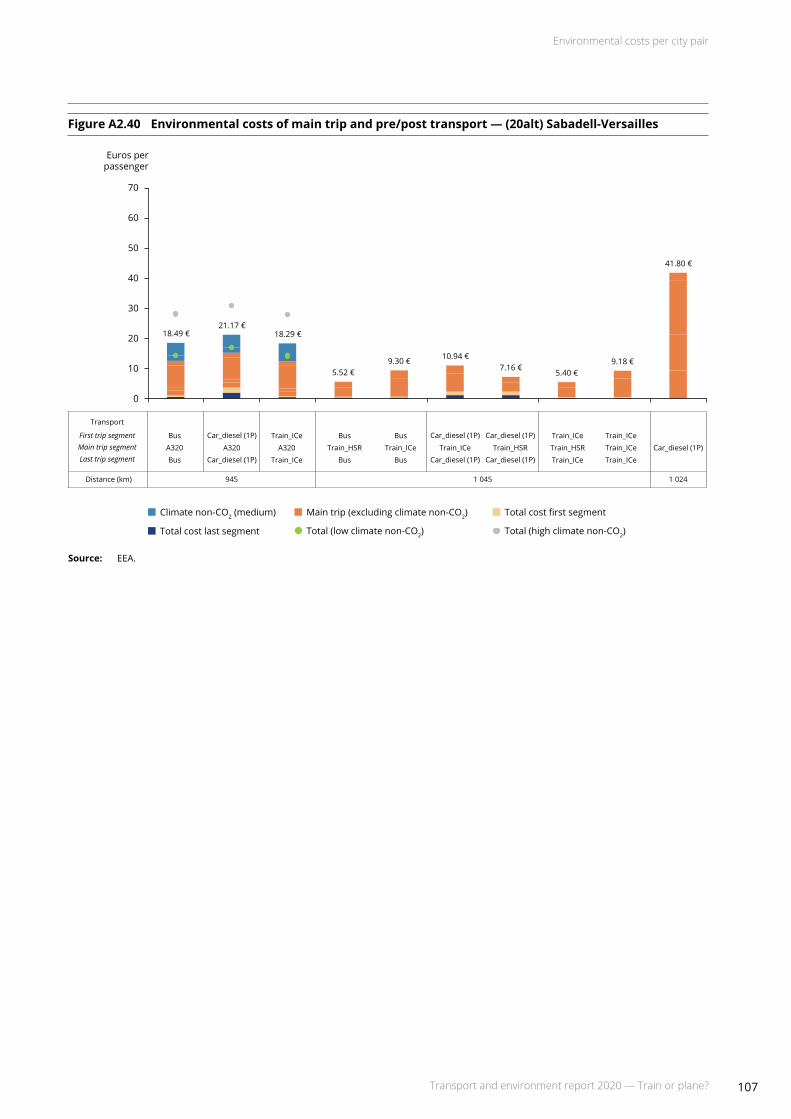
Environmental costs per city pair
107Transport and environment report 2020 — Train or plane?
FigureA2.40 Environmentalcostsofmaintripandpre/posttransport—(20alt)Sabadell-Versailles
Source: EEA.
Bus
Bus
Car_diesel (1P)
Car_diesel (1P) Train_ICe
Train_ICe
945
A320 A320 A320
Train_ICe
Train_ICe
Train_ICe
Main trip segmentLast trip segment
First trip segment
Transport
Distance (km) 1 024
Car_diesel (1P)
Car_diesel (1P) Train_ICe
Train_ICeTrain_HSR Train_HSR
1 045
Bus
Bus
Train_ICe
Bus
Bus Car_diesel (1P)
Car_diesel (1P)
Train_HSRCar_diesel (1P) Train_ICe
18.49 €21.17 €
18.29 €
41.80 €
5.52 €9.30 € 10.94 €
7.16 €5.40 €
9.18 €
50
60
70
40
30
20
10
Euros perpassenger
0
Climate non-CO2 (medium) Main trip (excluding climate non-CO2)
Total (low climate non-CO2) Total (high climate non-CO2)
Total cost first segment
Total cost last segment


European Environment Agency
Transport and environment report 2020 — Train or plane?
2021 — 107 pp. — 21 x 29.7 cm
ISBN 978-92-9480-390-0doi: 10.2800/43379
Getting in touch with the EU
In personAll over the European Union there are hundreds of Europe Direct information centres. You can find the address of the centre nearest you at: https://europa.eu/european-union/contact_en
On the phone or by emailEurope Direct is a service that answers your questions about the European Union. You can contact this service:• by freephone: 00 800 6 7 8 9 10 11 (certain operators may charge for these calls),• at the following standard number: +32 22999696 or • by email via: https://europa.eu/european-union/contact_en
Finding information about the EU
OnlineInformation about the European Union in all the official languages of the EU is available on the Europa website at: https://europa.eu/european-union/index_en
EU publications
You can download or order free and priced EU publications at: https://op.europa.eu/en/web/general-publications/publications. Multiple copies of free publications may be obtained by contacting Europe Direct or your local information centre (see https://europa.eu/european-union/contact_en).
TH-AL-21-010-EN
-Ndoi:10.2800/43379
European Environment AgencyKongens Nytorv 61050 Copenhagen KDenmarkTel.: +45 33 36 71 00Web: eea.europa.euEnquiries: eea.europa.eu/enquiries


![TS-3GA-25.415(R99)v3.12.0 UTRAN Iu interface user plane ... · UTRAN Iu interface user plane protocols ... "UTRAN Iu Interface Data Transport and Transport Signalling". [5] 3GPP TS](https://img.pdfslide.net/doc/110x75/5b4d0f027f8b9ac6118bb2ed/ts-3ga-25415r99v3120-utran-iu-interface-user-plane-utran-iu-interface.jpg)