Embed Size (px)
Citation preview
TRANSPORT STATISTICS 2012
National Statistics Office, Malta
2012
Published by the National Statistics Office
Lascaris Valletta VLT 2000
Malta Tel.: (+356) 25 99 70 00
Fax:(+356) 25 99 72 05 / 25 99 71 03 e-mail: [email protected]
website: http://www.nso.gov.mt
CIP Data Transport Statistics 2012. – Valletta: National Statistics Office, 2012 xii, 156p. ISBN: 978-99957-29-34-9 ISSN: 1681-780X For further information, please contact: Unit A4: International Trade and Transport Statistics Directorate A: Economic Statistics National Statistics Office Lascaris Valletta VLT 2000 Malta Tel.: (+356) 25 99 71 70 e-mail: [email protected] Our publications are available from: Unit D2: External Cooperation and Communication Directorate D: Resources and Support Services National Statistics Office Lascaris Valletta VLT 2000 Tel.: (+356) 25 99 72 19 Fax: (+356) 25 99 72 05
C O N T E N T S
T = Table C = Chart
Page
Commentary ix
Air Transport
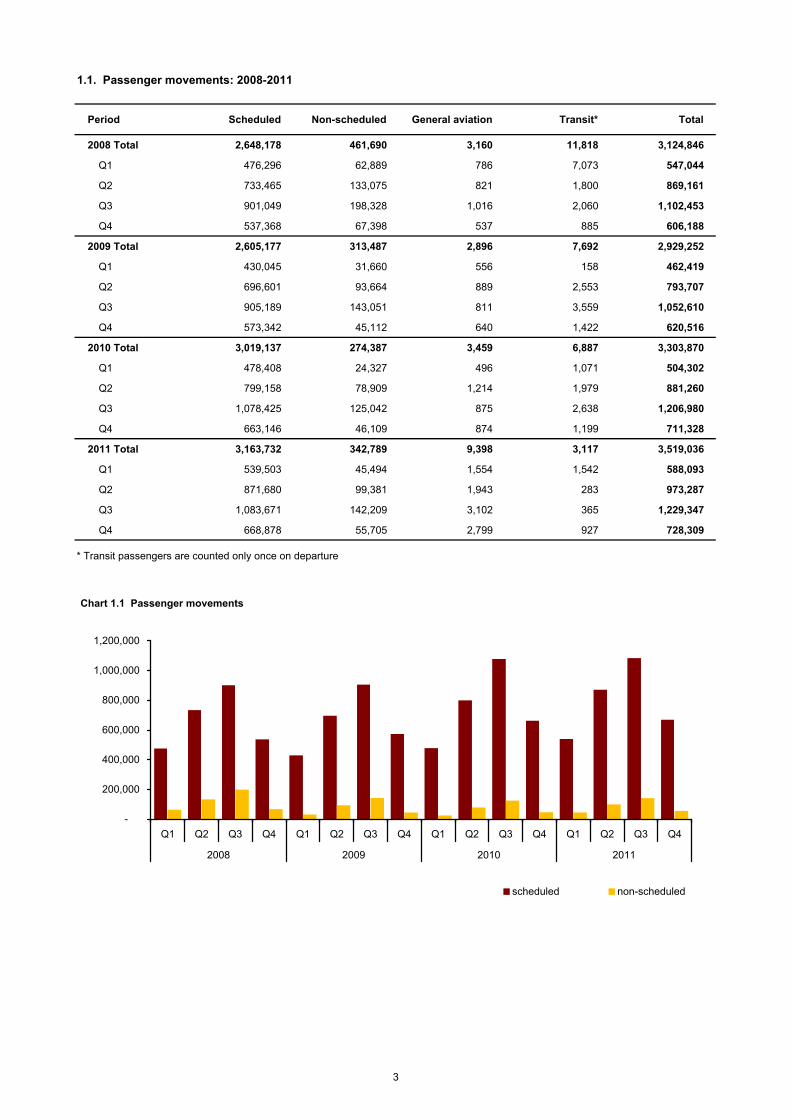
T1.1 Passenger movements: 2008-2011 3
C1.1 Passenger movements 3
T1.2 Passenger movements by country/region: 2008-2011 4
T1.3 Passenger movements by major airports: 2008-2011 5
T1.4 Passenger movements by major airports - UK and Ireland: 2008-2011 6
T1.5 Passenger movements by major airports - Scandinavia: 2008-2011 7
T1.6 Passenger movements by major airports - Germany: 2008-2011 8
T1.7 Passenger movements by major airports - Other European countries: 2008-2011 9
T1.8 Passenger movements by major airports - Italy: 2008-2011 10
T1.9 Main airlines, flight and passenger movements: 2008-2011 11
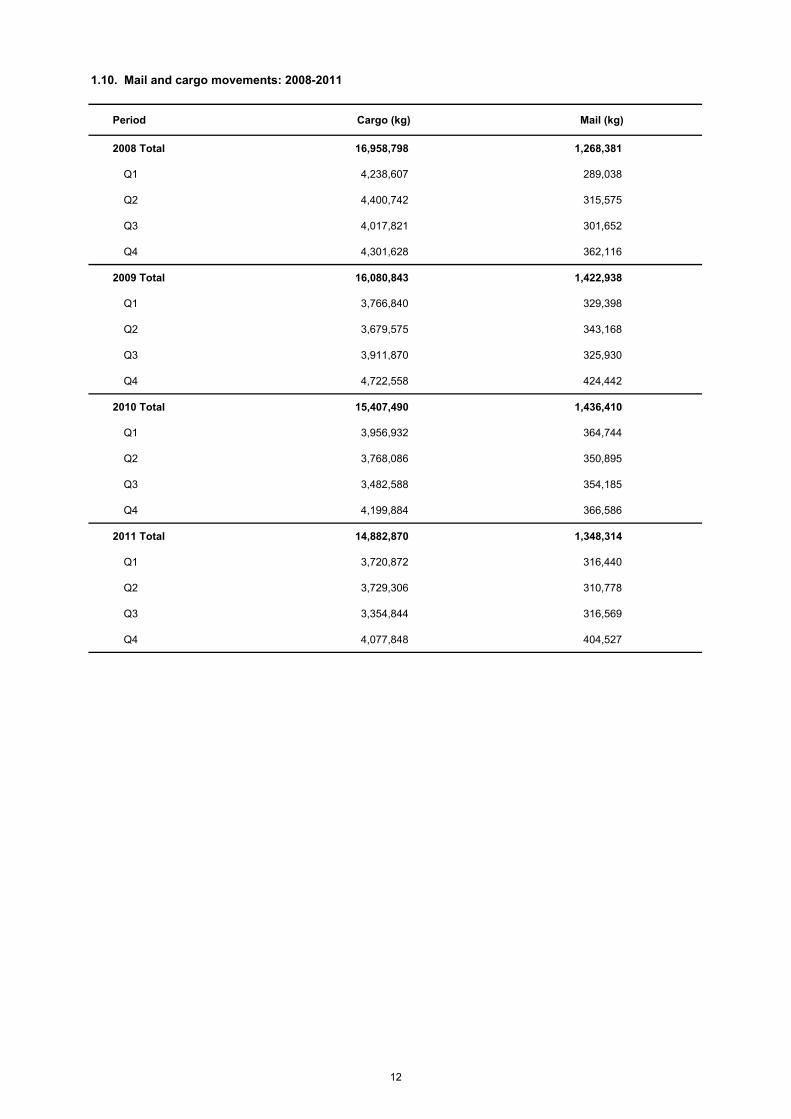
T1.10 Mail and cargo movements: 2008-2011 12
Sea Transport
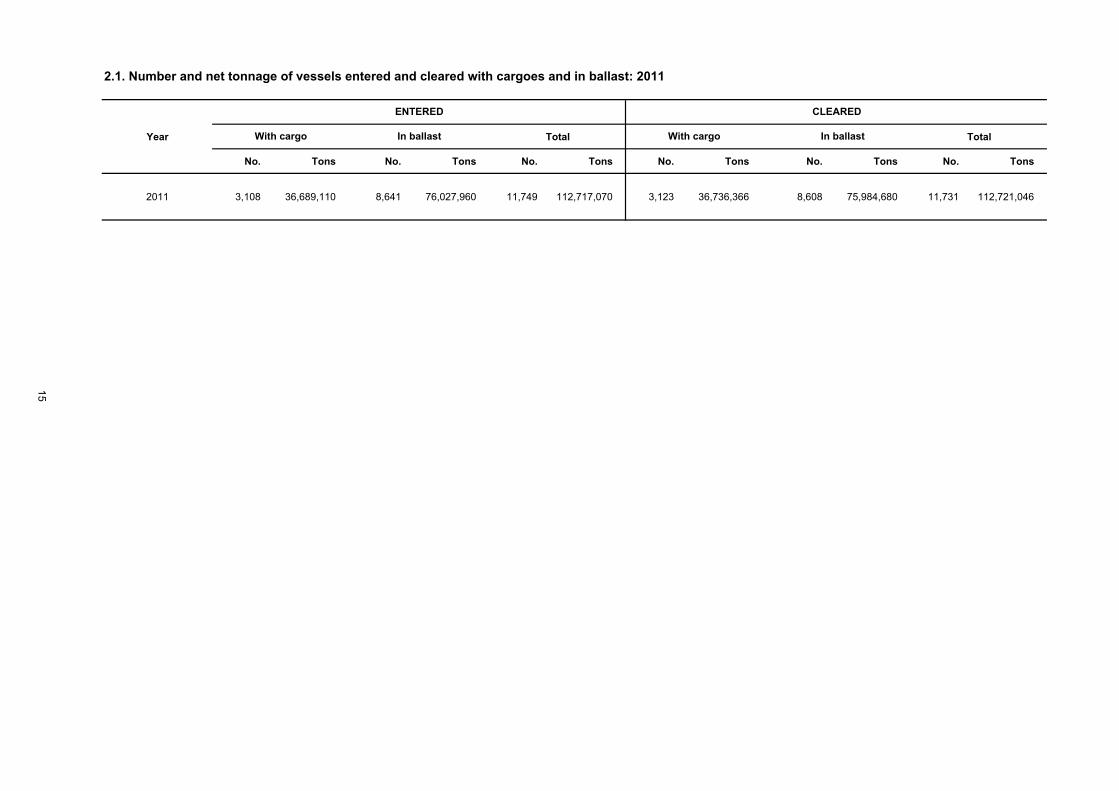
T2.1 Number and net tonnage of vessels entered and cleared with cargoes and in ballast: 2011 15
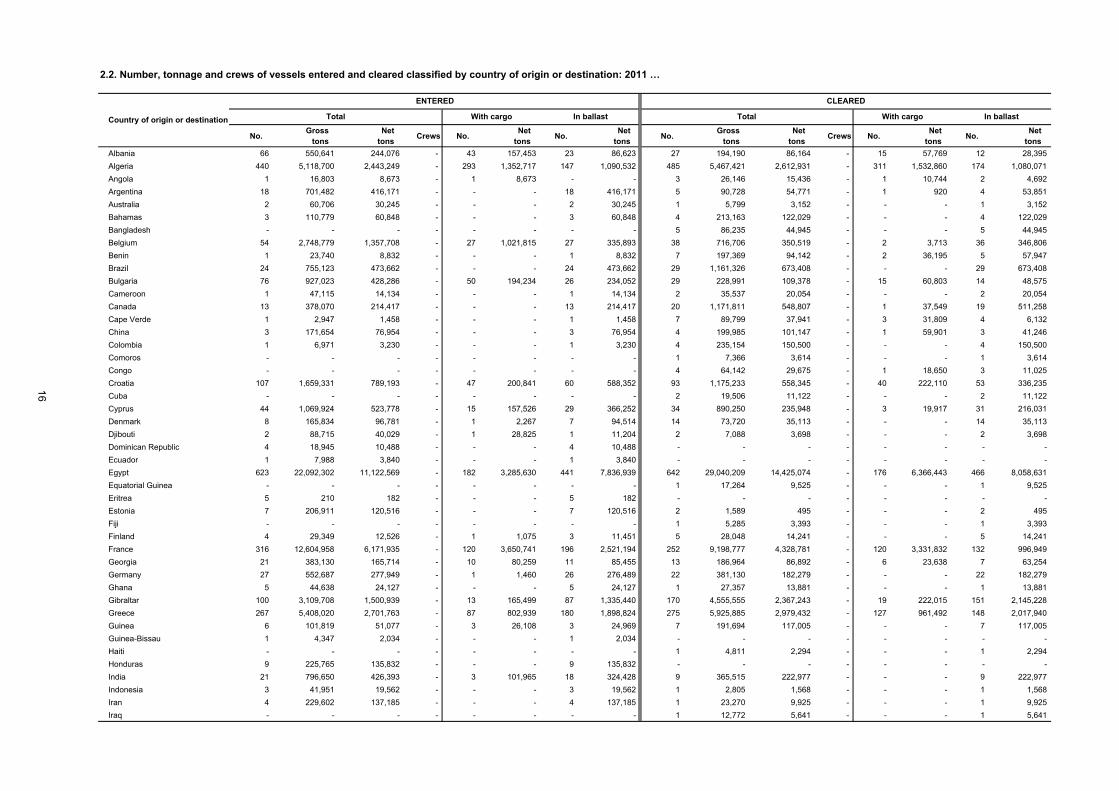
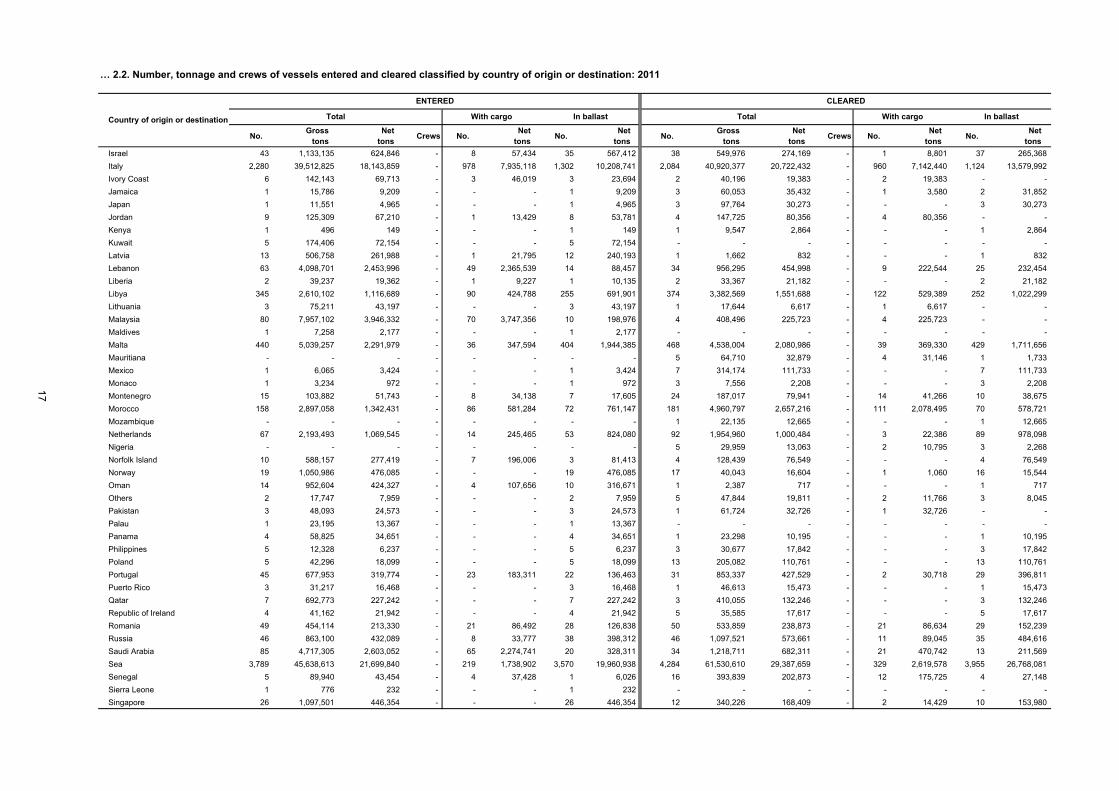
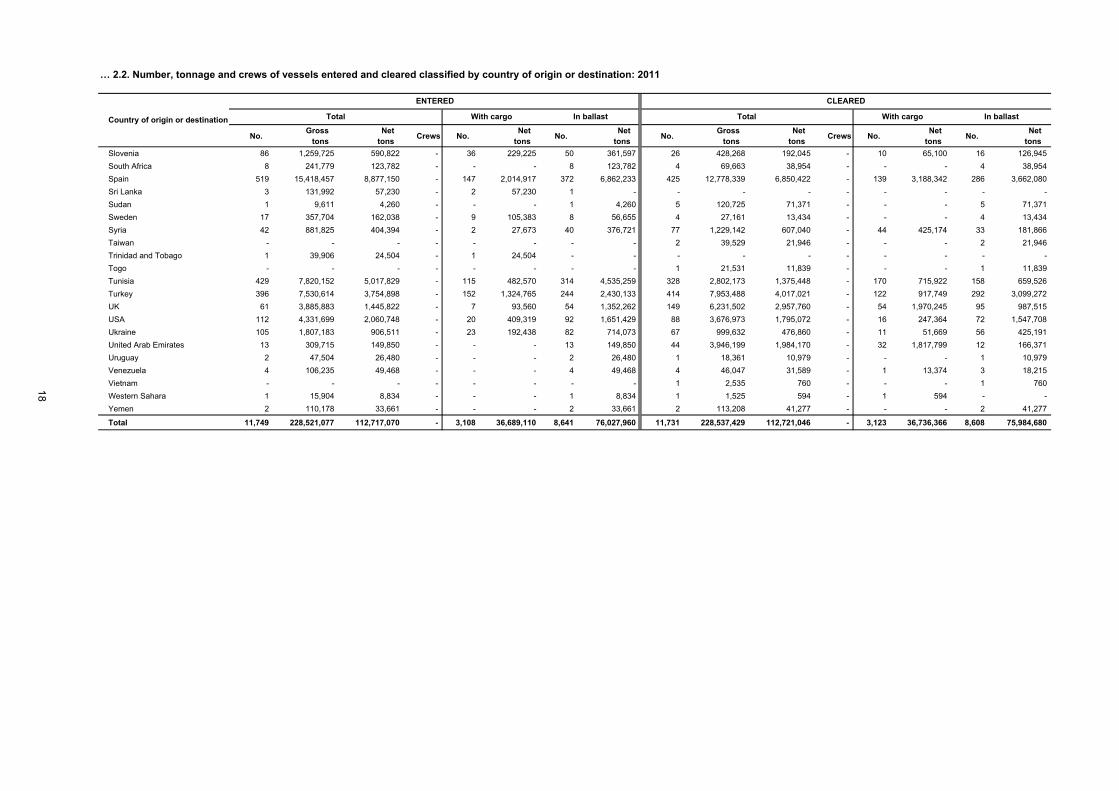
T2.2 Number, tonnage and crews of vessels entered and cleared classified by country of origin or destination: 2011 16
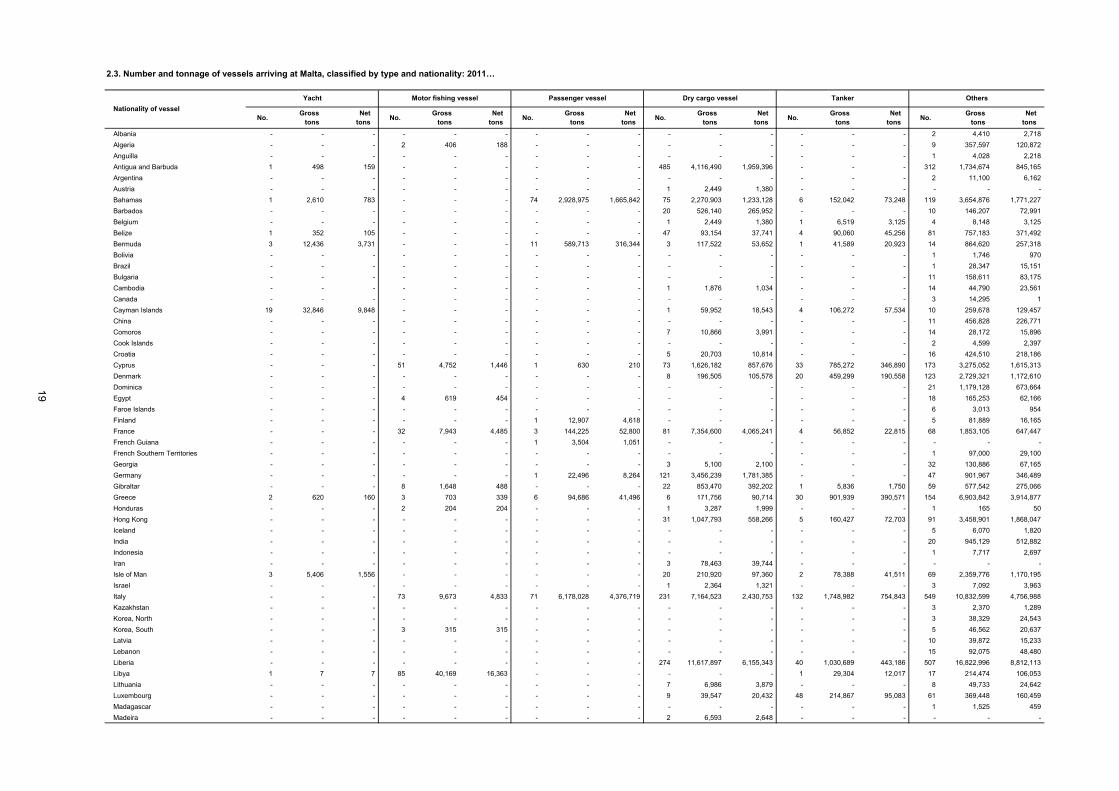
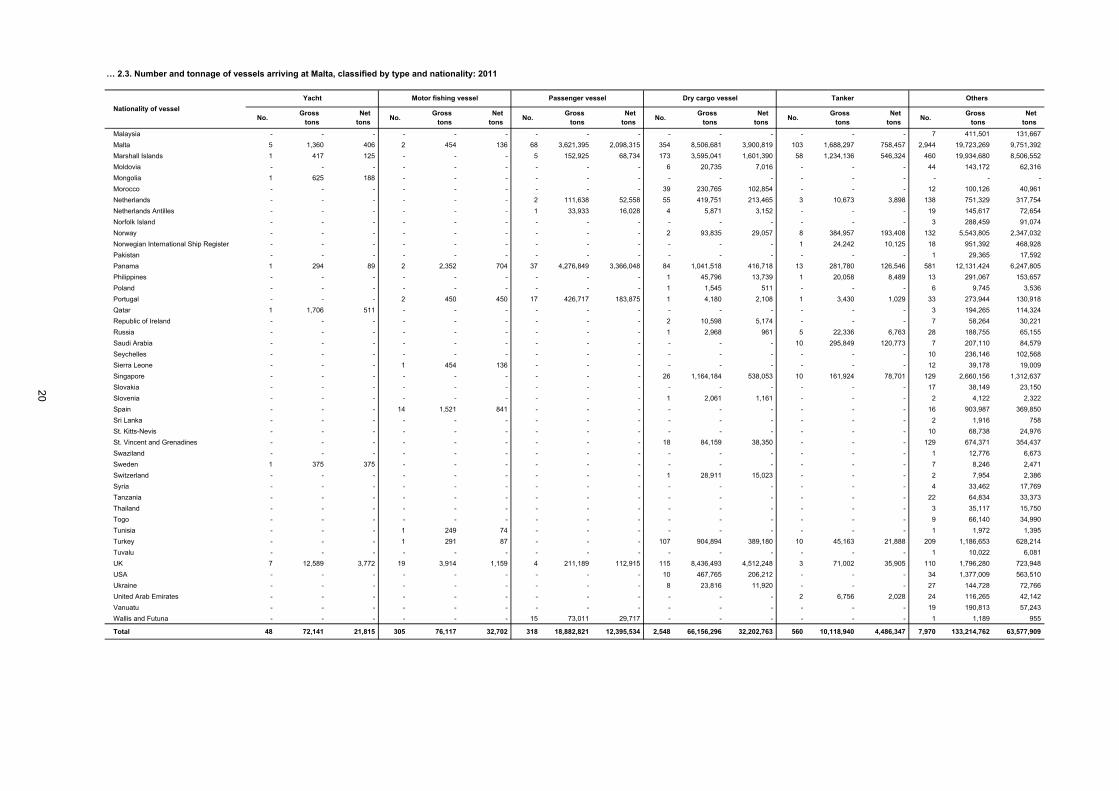
T2.3 Number and tonnage of vessels arriving at Malta, classified by type and nationality: 2011 19
T2.4 Number and tonnage of vessels departing from Malta, classified by type and nationality: 2011 21
T2.5 Number, tonnage and crews of vessels entered and cleared, classified by nationality: 2011 23
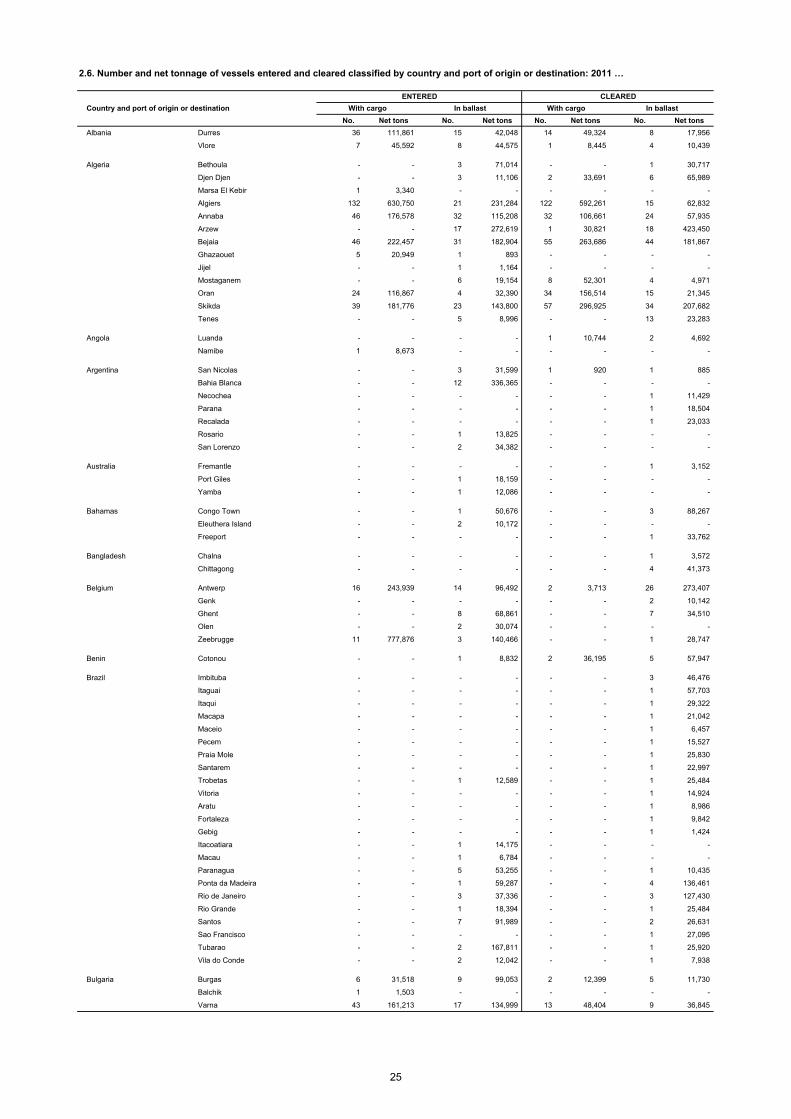
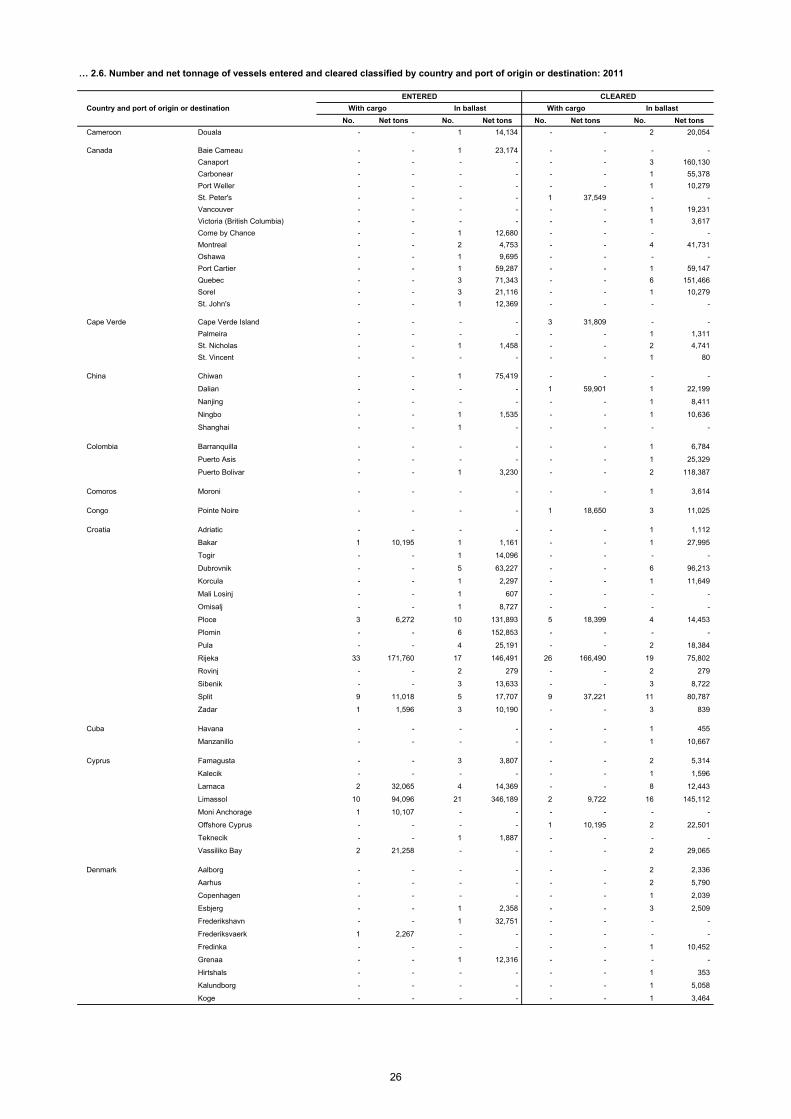
T2.6 Number and net tonnage of vessels entered and cleared classified by country and port of origin or destination: 2011 25
T2.7 Number and tonnage of vessels entered and cleared classified by country of origin or destination and nationality: 2011 39
T2.8 Number and net tonnage of vessels entered and cleared with cargo and in ballast, classified by type of vessel: 2011 64
Page
Sea Transport (cont.)
T2.9 Number and net tonnage of vessels entered, classified by range of net tonnage and by month: 2011 65
T2.10 Number and tonnage of vessels entered, classified by range of gross tonnage: 2011 67
T2.11 Number and tonnage of vessels entered with cargoes and in ballast classified by range of net tonnage: 2011 68
T2.12 Number and tonnage of vessels cleared, classified by duration of stay in harbour: 2011 69
T2.13 Number and tonnage of Maltese vessels cleared, classified by country and port of origin or destination: 2011 70
T2.14 Number, tonnage and type of vessels, registered under the Merchant Shipping Act, 1973: 2011 76
T2.15 Tonnage of cargo unloaded and loaded at Malta: 2006-2011 76
T2.16 Cargo unloaded and loaded classified by country of origin/destination of vessel: 2011 77
T2.17 Cargo unloaded and loaded by vessel classified by nationality of vessel: 2011 82
T2.18 Unitised cargo and number of units unloaded and loaded: 2010-2011 83
T2.19 Stock of fishing vessels registered in Malta and Gozo by region: 2011 84
T2.20 Stock of fishing vessels registered in Malta and Gozo by length group: 2011 84
T2.21 Stock of fishing licences by type of licence and type of vessels: 2011 85
T2.22 Stock of fishing licences by type of licence and region: 2011 85
T2.23 Stock of fishing licences by type of vessel and current base port: 2011 86
T2.24 Cruise liners: transit passengers 88
T2.25 Cruise liners: passenger embarkations 88
T2.26 Cruise liners: passenger landings 89
T2.27 Total passenger traffic 89
T2.28 Cruise liner calls 90
T2.29 Sea transport between Malta and Gozo: 2009-2011 91
C2.1 Vehicles: 2009-2011 91
C2.2 Passengers: 2009-2011 91
T2.30 Monthly sea transport between Malta and Gozo: 2010-2011 92
Road Transport
T3.1 Total road traffic accidents 95
C3.1 Total road traffic accidents by region: 2009-2011 95
T3.2 Minor road traffic accidents 96
T3.3 Casualties in road traffic accidents 97
C3.2 Casualties in road traffic accidents: 2009-2011 97
Page
Road Transport (cont.)
T3.4 Injuries sustained by drivers in road traffic accidents 98
T3.5 Injuries sustained by passengers in road traffic accidents 98
T3.6 Injuries sustained by pedestrians in road traffic accidents 98
T3.7 Total injuries sustained in road traffic accidents: by type of injury 99
T3.8 Road traffic casualties by type of injury: monthly 99
T3.9 Road traffic casualties by type of injury, age and sex 100
T3.10 Road traffic casualties by type of injury, age and means of transport 101
T3.11 Road traffic casualties by travellers, age and means of transport 102
T3.12 Road traffic casualties by day of the week 103
C3.3 Total road traffic casualties by day of the week: January-December 2011 103
C3.4 Total road traffic accidents by day of the week: January-December 2011 103
T3.13 Road traffic accidents by locality 104
C3.5 Top 10 localities for traffic accidents: 2011 105
T3.14 Stock of licensed motor vehicles 106
T3.15 Newly-licensed motor vehicles 106
T3.16 Newly-licensed 'new' motor vehicles 107
T3.17 Newly-licensed 'used' motor vehicles 107
T3.18 Exported motor vehicles 108
T3.19 Scrapped motor vehicles 108
T3.20 Garaged motor vehicles 109
T3.21 Stock of licensed vehicles as at end of year by vehicle group and age of vehicle 110
T3.22 Average age of vehicles as at end of year 110
T3.23 Stock of licensed vehicles as at end of year by vehicle group and fuel type: 2011 111
T3.24 Stock of licensed vehicles as at end of year by vehicle group and region: 2011 112
T3.25 Transport indicators 113
T3.26 License holders indicators 113
T3.27 Rate of motorisation by region 113
T3.28 Transport Equipment (Vehicles) as at end 2011
Number of passenger road vehicles licensed in the country 114
T3.29 Transport Equipment (Vehicles) as at end 2011
Goods-carrying vehicles, special purpose vehicles and road tractors licensed in the country 116
T3.30 Transport Equipment (Vehicles) as at end 2011
Number of passenger road vehicles registered in the country 118
T3.31 Transport Equipment (Vehicles) as at end 2011
Goods-carrying vehicles, special purpose vehicles and road tractors registered in the country 120
Page
Road Transport (cont.)
T3.32 Vehicle Road-worthiness Test (VRT): 2011 122
T3.33 Total licence holders by region 123
T3.34 Total licence holders by age group and sex 123
T3.35 Stock of licence categories issued as at end 2011 124
T3.36 Driving license tests carried out in 2011 125
T3.37 Driving license tests carried out by gender: 2011 125
T3.38 Contraventions issued by the Police: by region 126
C3.6 Contraventions issued by the Police: by region 126
T3.39 Contraventions issued by the Police: monthly 127
C3.7 Contraventions issued by the Police: monthly 127
T3.40 Contraventions issued by the Police: by contravention category 128
T3.41 Contraventions issued by the Police: by locality 129
C3.8 Top 10 localities for transport related contraventions issued by the Police: 2011 130
T3.42 Minimum fines issued by the Police: by contravention category 131
T3.43 Contraventions issued by Local Wardens: by region 132
C3.9 Contraventions issued by Local Wardens: by region 132
T3.44 Contraventions issued by Local Wardens: monthly 133
C3.10 Contraventions issued by Local Wardens: monthly 133
T3.45 Contraventions issued by Local Wardens: by contravention category 134
T3.46 Contraventions issued by Local Wardens: by locality 135
C3.11 Top 10 localities for transport related contraventions issued by Local Wardens: 2011 136
T3.47 Minimum fines issued by the Wardens: by contravention category 137
T3.48 Speed cameras contraventions: 2011 138
T3.49 Speed cameras fines expected income: 2011 138
T3.50 Number of commuters using public transport in 2011 139
T3.51 Tickets sales in Malta – residents 140
T3.52 Tickets sales in Malta – non-residents 140
T3.53 Tickets sales in Gozo 140
T3.54 Bus stops, bus shelters and bus routes 140
Page
Transport Accounts
T4.1 Production Account (Nace 49): 2010-2011 143
T4.2 Production Account (Nace 50): 2010-2011 143
T4.3 Production Account (Nace 51): 2010-2011 143
T4.4 Production Account (Nace 52): 2010-2011 144
T4.5 Production Account: Totals (Nace 49-52): 2010-2011 144
T4.6 Employment (Nace 49): 2010-2011 145
T4.7 Employment (Nace 50): 2010-2011 145
T4.8 Employment (Nace 51): 2010-2011 146
T4.9 Employment (Nace 52): 2010-2011 146
T4.10 Compensation of Employees (Nace 49): 2010-2011 147
T4.11 Compensation of Employees (Nace 50): 2010-2011 147
T4.12 Compensation of Employees (Nace 51): 2010-2011 147
T4.13 Compensation of Employees (Nace 52): 2010-2011 147
Appendices 151

C O M M E N T A R Y AIR TRANSPORT In 2011, passenger traffic at the Malta International Airport increased by 215,166 or 6.5 per cent when compared to 2010 (Table 1.1). Fluctuations in figures were recorded on a quarterly basis throughout the year as shown below:
January-March - + 16.6 per cent
April-June - + 10.4 per cent
July-September - + 1.9 per cent
October-December - + 2.4 per cent
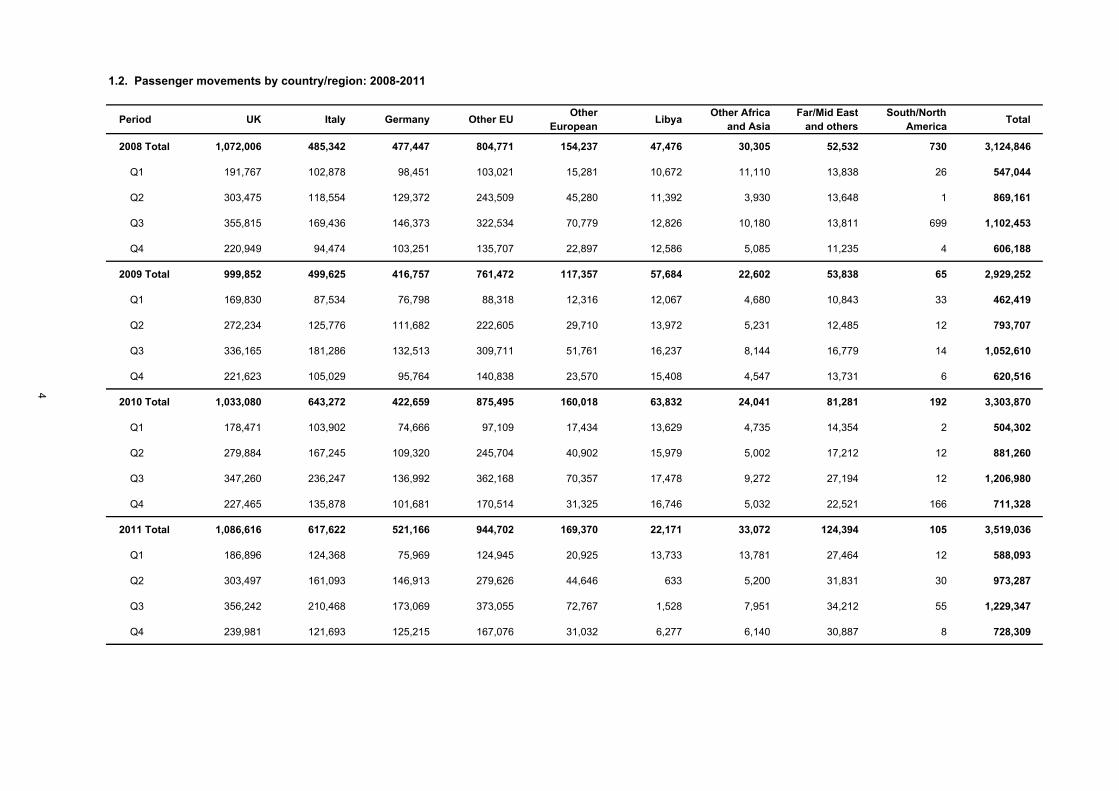
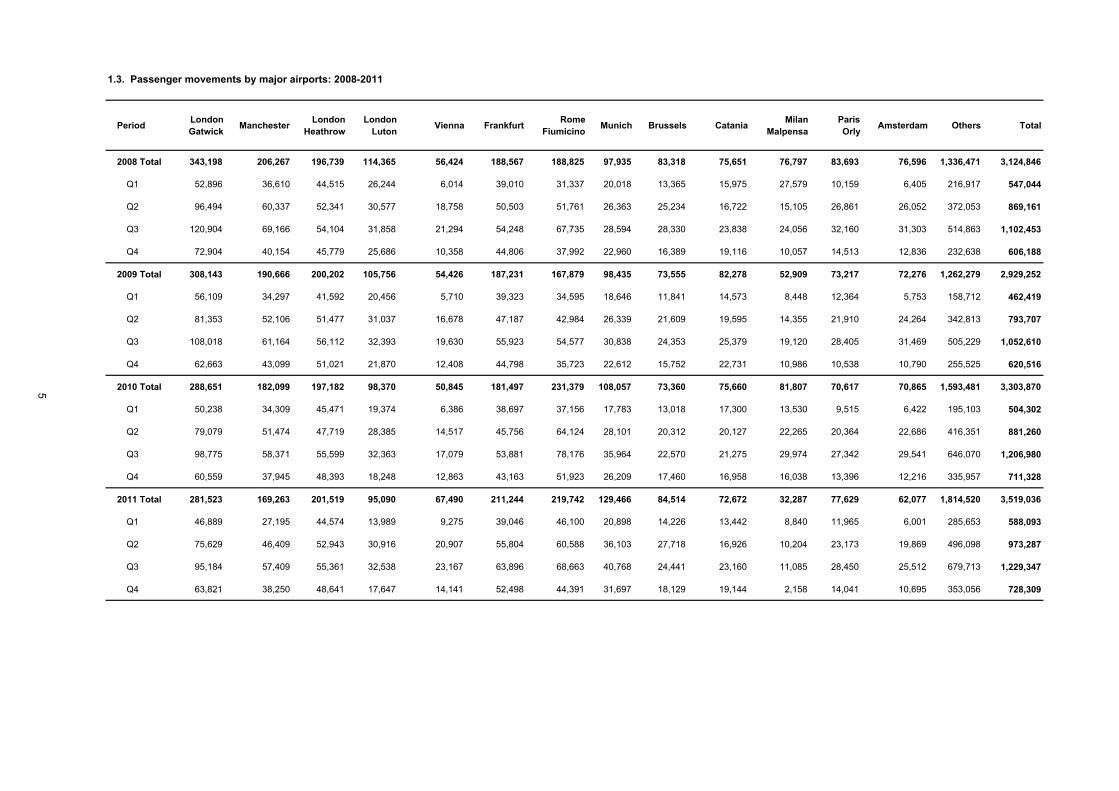
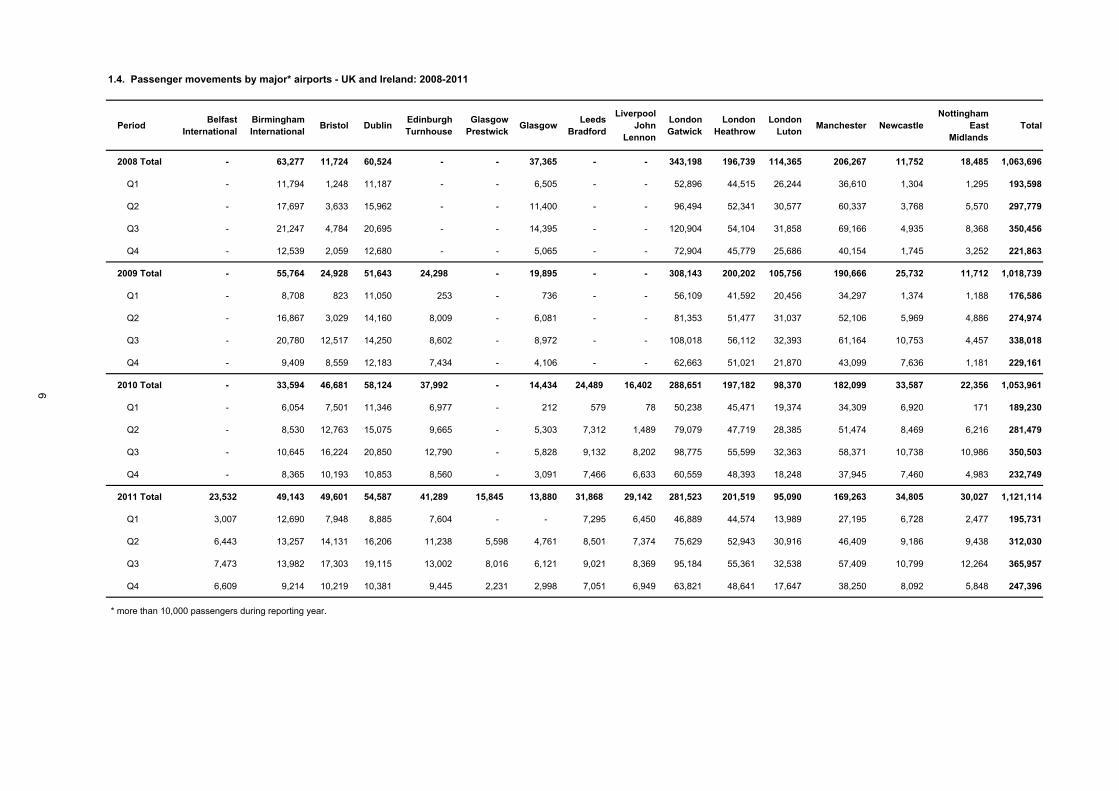
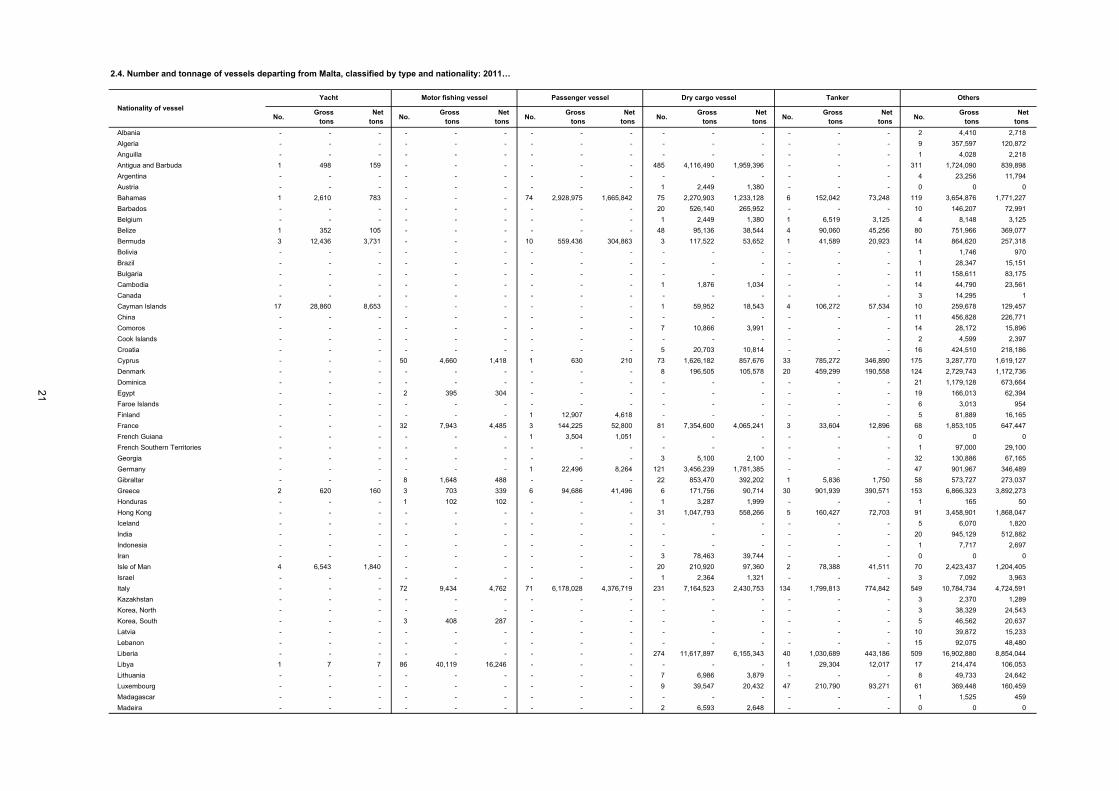
In 2011, there was a notable increase in traffic to most destinations. Traditionally, the key destinations in 2011 were in the UK, with 1,086,616 passengers, 30.9 per cent, of the total movements. Italy, the second largest destination, registered 617,622 passengers or approximately four percent less than the previous year (Table 1.2). UK major airports (and Irish airports) remained the most frequented by passengers travelling to and from Malta. Altogether, as specified in Table 1.4, these airports accounted for 1,121,114 passengers. The largest number of passengers passed through London Gatwick – 281,523 – followed by London Heathrow and Manchester with 201,519 and 169,263 passengers respectively. During the year under review, Air Malta remained the major air carrier, accounting for 44.1 per cent of the total aircraft movements and 47.7 per cent of the total passenger movements. In 2011, the national airline carried 1,679,018 passengers, almost at par with the previous year. Ryanair followed with 5,475 trips and 787,178 passengers (Table 1.9). During 2011, a total weight of 14,882,870 kg of cargo, or a decrease of 3.4 per cent over the previous year, was processed by the Malta International Airport. Also, a total weight of 1,348,314 kg of mail was processed, a decrease of 6.1 per cent over 2010 (Table 1.10). SEA TRANSPORT A substantial number of the yachts arriving in Malta during 2011 – 19 vessels – were registered in the Cayman Islands. The highest number of passenger-vessels arriving in Malta – 74 vessels – were registered in the Bahamas (Table 2.3). Moreover, as at the end of the year under review, the total number of vessels registered in Malta amounted to 5,847, including 2,602 yachts, 796 fishing vessels, 1,366 dry cargo vessels and 622 liquid bulk vessels (Table 2.14). In 2011, 1,936,944 tons of unitised cargo were unloaded, an increase of 43,827 tons when compared to 2010. The total amount of loaded unitised cargo reached 468,890 tons, an increase of 16,301 tons, or 3.6 per cent, when compared to the previous year (Table 2.18). During the year under review, the number of cruise liner calls totalled 311, an increase of 36 over 2010. Transit passengers amounted to 444,831, a drop of 3.7 per cent over the previous year. Embarkations from and landings in Malta stood at 55,927 and 55,564 persons respectively (Tables 2.24–2.28). As at the end of 2011, the stock of fishing vessels stood at 3,007. MPVs comprised the largest proportion of fishing vessels with 1,296, or 43.1 per cent of the total. The largest registration group of fishing vessels was the MFC, totalling 1,921 vessels. Fishing vessels registered in the South Eastern district account for 27.7 per cent of the total (Tables 2.19–2.23).
ix
Commuters between Malta and Gozo increased by 2.3 per cent, to 4,124,931. Furthermore, 1,116,276 vehicles were carried by scheduled Gozo Channel ferries, up by 1.1 per cent when compared to 2010 (Table 2.29). During the year under review, the number of inter-island trips amounted to 19,816, down by one per cent from 2010. ROAD TRANSPORT
i. Road Traffic Accidents In 2011 the number of reported traffic accidents reached 14,624, an increase of 537 cases, or 3.9
per cent over the previous year. Increases were registered in all districts, with the largest increase recorded in the Northern Harbour district, up by 269 cases (Table 3.1).
1,577 traffic casualties, 986 of whom were drivers, occurred in 2011. 854 drivers suffered slight
injuries, 124 suffered grievous ones, while eight accidents proved fatal. During the same period 348 passengers and 123 pedestrians suffered slight injuries, while 46 passengers and 65 pedestrians suffered grievous ones. Moreover, injuries sustained by nine pedestrians eventually proved fatal, thus raising the total number of fatalities in 2011 to 17 (Tables 3.4–3.8).
On a gender basis, slightly-injured persons numbered 1,325, of whom 737 were males and 588
were females. Grievously-injured persons stood at 235, the majority being males. Of the 17 fatalities, 14 were males. The largest number of male and female casualties was in the 26-40 age group (Table 3.9).
75.3 per cent of casualties were caused by passenger cars while 14.1 per cent were caused by
motorcycles. Of the 17 fatalities, nine were caused by passenger cars and five were caused by motorcycles (Tables 3.10–3.11).
The highest traffic casualty rate occurred on Sundays, accounting for 15.5 per cent of the total.
The highest accident rate was recorded on Fridays, totalling 2,296 cases, and the lowest on Sundays, with 1,538 cases. However, Sundays topped the highest casualty-to-accident ratio (Table 3.12).
Birkirkara was the locality with the highest rate of traffic accidents, with 921 cases. Marsa and
Qormi followed, with 808 and 792 reported accidents respectively (Table 3.13). ii. Licensed Motor Vehicles As at the end of 2011, the number of licensed vehicles in Malta amounted to 311,947. Private
vehicles totalled 239,987 or 76.9 per cent (Table 3.14). Newly-licensed motor vehicles amounted to 19,041; of these, 7,749 were newly-licensed ‘new’ vehicles and 11,292, were newly-licensed ‘used’ ones (Tables 3.15–3.17).
A total of 6,860 vehicles were scrapped, of which 87.9 per cent were private cars. Also, 125 cars
were exported, while 9,853 other vehicles were garaged (Tables 3.18–3.20). iii. Transport Equipment In December 2011, registered motorcycles amounted to 30,185 – of these 29,083 were recorded
as having a petrol engine, nine a diesel engine and 1,039 with alternative power sources. Furthermore, 22,786, or 75.5 per cent, were over 10 years old.
Passenger cars amounted to 342,881 – of these 255,136 had a petrol engine, 83,515 a diesel
engine and 294 had alternative power sources. Moreover, 265,063 passenger cars, or 77.3 per cent of the total, were over 10 years old. Passenger cars having a Gross Vehicle Weight (GVW) of between 1,250kg and 1,499kg constituted the largest share, amounting to 127,654, or 37.2 per cent of the total.
The tally for motor coaches, buses and trolley buses was 2,620, the vast majority having a diesel
engine. Again, the majority of these vehicles were over 10 years old – 81.1 per cent of the total.
x
Registered goods-carrying and special purpose vehicles amounted to 70,776, with 89.5 per cent
having a carrying capacity of more than 1,500 kg. Of these vehicles, 6,485 had a petrol engine, 62,922 had a diesel engine and 338 were powered by an alternative source. The majority of goods-carrying and special purpose vehicles (53.6 per cent) had a GVW of between 2,000 kg and 4,999 kg. Most of these vehicles were also over 10 years old.
Road tractors numbered 2,359 – two had a petrol engine and 2,235 a diesel engine. In respect of
age since manufactured, road tractors followed the pattern of other vehicle types with 89.2 per cent past the 10-year mark (Tables 3.30–3.31).
iv. Vehicle Road-Worthiness Test During the course of 2011, 136,874 tests were carried out on vehicles falling under Class 2A, 2B
and 3. 80.5 per cent of the vehicles tested passed the initial test, while 24,746 were re-tested, with the vast majority passing the second time round (Table 3.32).
v. Driving Licences By the end of 2011, the total number of driving licences issued amounted to 229,867. The largest
number – 66,403 or 28.9 per cent of the total – were registered in the Northern Harbour district (Table 3.33). On a gender basis, there were 139,473 male and 90,394 female driving-licence holders. The majority of licence holders were aged 40-59 (Table 3.34).
vi. Contraventions In 2011, 83,909 traffic-related contraventions were issued by the Police, with the majority being
issued in the Northern Harbour district. The largest contravention group was for ‘Illegal/unauthorised parking’, amounting to 22,086, or 26.3 per cent of the total. St Julian’s topped the highest tally of contraventions issued by the Police, with 7,260 contraventions (Tables 3.38–3.42).
Traffic-related contraventions issued by the local wardens amounted to 139,448. The majority
(36.4 per cent) of these contraventions were also issued in the Northern Harbour district. As with the Police, the largest contravention group booked by the Wardens was for ‘Illegal/unauthorised parking’, amounting to 57,276 contraventions given, or 41.1 per cent of the total. Floriana was the locality with the highest tally of contraventions issued by Wardens, with 13,165, or 9.4 per cent of the total (Tables 3.43–3.47).
In 2011, speed camera contraventions totalled 27,509, of which 22,393, or 81.4 per cent of the
total, being in the ‘<=15km/h over speed limit’ group. The camera which caught the most over-speeding vehicles was the one installed in Triq in-Nutar Żarb, Ħ’Attard, totalling 5,194 contraventions (Tables 3.48–3.49).
TRANSPORT ACCOUNTS In 2011, the Transport Sector increased by 7.4 per cent when compared to 2010. This increase in gross value added was mainly driven by the Water Transport sector (NACE 50):- (+25.4 per cent); the Land Transport sector (NACE 49):- (+18.2 per cent); and the Supporting and Auxiliary Transport activities (NACE 52):- (+6.2 per cent). The increase in gross value added was the result of an increase in sea transport between Malta and Libya during 2011, due to the Libyan crisis, and an increase in inter-island transport. This growth was however offset by a decline of 15.6 per cent in the air transport sector (NACE 51). The drop in flights to and from the North African region caused the decline in this sector.
xi

AIR TRANSPORT

Period Scheduled Non-scheduled General aviation Transit* Total
2008 Total 2,648,178 461,690 3,160 11,818 3,124,846
Q1 476,296 62,889 786 7,073 547,044
Q2 733,465 133,075 821 1,800 869,161
Q3 901,049 198,328 1,016 2,060 1,102,453
Q4 537,368 67,398 537 885 606,188
2009 Total 2,605,177 313,487 2,896 7,692 2,929,252
Q1 430,045 31,660 556 158 462,419
Q2 696,601 93,664 889 2,553 793,707
Q3 905,189 143,051 811 3,559 1,052,610
Q4 573,342 45,112 640 1,422 620,516
2010 Total 3,019,137 274,387 3,459 6,887 3,303,870
Q1 478,408 24,327 496 1,071 504,302
Q2 799,158 78,909 1,214 1,979 881,260
Q3 1,078,425 125,042 875 2,638 1,206,980
Q4 663,146 46,109 874 1,199 711,328
2011 Total 3,163,732 342,789 9,398 3,117 3,519,036
Q1 539,503 45,494 1,554 1,542 588,093
Q2 871,680 99,381 1,943 283 973,287
Q3 1,083,671 142,209 3,102 365 1,229,347
Q4 668,878 55,705 2,799 927 728,309
1.1. Passenger movements: 2008-2011
* Transit passengers are counted only once on departure
Chart 1.1 Passenger movements
-
200,000
400,000
600,000
800,000
1,000,000
1,200,000
Q1 Q2 Q3 Q4 Q1 Q2 Q3 Q4 Q1 Q2 Q3 Q4 Q1 Q2 Q3 Q4
2008 2009 2010 2011
scheduled non-scheduled
3
Period UK Italy Germany Other EUOther
EuropeanLibya
Other Africa and Asia
Far/Mid East and others
South/North America
Total
2008 Total 1,072,006 485,342 477,447 804,771 154,237 47,476 30,305 52,532 730 3,124,846
Q1 191,767 102,878 98,451 103,021 15,281 10,672 11,110 13,838 26 547,044
Q2 303,475 118,554 129,372 243,509 45,280 11,392 3,930 13,648 1 869,161
Q3 355,815 169,436 146,373 322,534 70,779 12,826 10,180 13,811 699 1,102,453
Q4 220,949 94,474 103,251 135,707 22,897 12,586 5,085 11,235 4 606,188
2009 Total 999,852 499,625 416,757 761,472 117,357 57,684 22,602 53,838 65 2,929,252
Q1 169,830 87,534 76,798 88,318 12,316 12,067 4,680 10,843 33 462,419
Q2 272,234 125,776 111,682 222,605 29,710 13,972 5,231 12,485 12 793,707
Q3 336,165 181,286 132,513 309,711 51,761 16,237 8,144 16,779 14 1,052,610
Q4 221,623 105,029 95,764 140,838 23,570 15,408 4,547 13,731 6 620,516
2010 Total 1,033,080 643,272 422,659 875,495 160,018 63,832 24,041 81,281 192 3,303,870
Q1 178,471 103,902 74,666 97,109 17,434 13,629 4,735 14,354 2 504,302
Q2 279,884 167,245 109,320 245,704 40,902 15,979 5,002 17,212 12 881,260
Q3 347,260 236,247 136,992 362,168 70,357 17,478 9,272 27,194 12 1,206,980
Q4 227,465 135,878 101,681 170,514 31,325 16,746 5,032 22,521 166 711,328
2011 Total 1,086,616 617,622 521,166 944,702 169,370 22,171 33,072 124,394 105 3,519,036
Q1 186,896 124,368 75,969 124,945 20,925 13,733 13,781 27,464 12 588,093
Q2 303,497 161,093 146,913 279,626 44,646 633 5,200 31,831 30 973,287
Q3 356,242 210,468 173,069 373,055 72,767 1,528 7,951 34,212 55 1,229,347
Q4 239,981 121,693 125,215 167,076 31,032 6,277 6,140 30,887 8 728,309
1.2. Passenger movements by country/region: 2008-2011
4
PeriodLondon Gatwick
ManchesterLondon
HeathrowLondon
LutonVienna Frankfurt
Rome Fiumicino
Munich Brussels Catania Milan
MalpensaParis Orly
Amsterdam Others Total
2008 Total 343,198 206,267 196,739 114,365 56,424 188,567 188,825 97,935 83,318 75,651 76,797 83,693 76,596 1,336,471 3,124,846
Q1 52,896 36,610 44,515 26,244 6,014 39,010 31,337 20,018 13,365 15,975 27,579 10,159 6,405 216,917 547,044
Q2 96,494 60,337 52,341 30,577 18,758 50,503 51,761 26,363 25,234 16,722 15,105 26,861 26,052 372,053 869,161
Q3 120,904 69,166 54,104 31,858 21,294 54,248 67,735 28,594 28,330 23,838 24,056 32,160 31,303 514,863 1,102,453
Q4 72,904 40,154 45,779 25,686 10,358 44,806 37,992 22,960 16,389 19,116 10,057 14,513 12,836 232,638 606,188
2009 Total 308,143 190,666 200,202 105,756 54,426 187,231 167,879 98,435 73,555 82,278 52,909 73,217 72,276 1,262,279 2,929,252
Q1 56,109 34,297 41,592 20,456 5,710 39,323 34,595 18,646 11,841 14,573 8,448 12,364 5,753 158,712 462,419
Q2 81,353 52,106 51,477 31,037 16,678 47,187 42,984 26,339 21,609 19,595 14,355 21,910 24,264 342,813 793,707
Q3 108,018 61,164 56,112 32,393 19,630 55,923 54,577 30,838 24,353 25,379 19,120 28,405 31,469 505,229 1,052,610
Q4 62,663 43,099 51,021 21,870 12,408 44,798 35,723 22,612 15,752 22,731 10,986 10,538 10,790 255,525 620,516
2010 Total 288,651 182,099 197,182 98,370 50,845 181,497 231,379 108,057 73,360 75,660 81,807 70,617 70,865 1,593,481 3,303,870
Q1 50,238 34,309 45,471 19,374 6,386 38,697 37,156 17,783 13,018 17,300 13,530 9,515 6,422 195,103 504,302
Q2 79,079 51,474 47,719 28,385 14,517 45,756 64,124 28,101 20,312 20,127 22,265 20,364 22,686 416,351 881,260
Q3 98,775 58,371 55,599 32,363 17,079 53,881 78,176 35,964 22,570 21,275 29,974 27,342 29,541 646,070 1,206,980
Q4 60,559 37,945 48,393 18,248 12,863 43,163 51,923 26,209 17,460 16,958 16,038 13,396 12,216 335,957 711,328
2011 Total 281,523 169,263 201,519 95,090 67,490 211,244 219,742 129,466 84,514 72,672 32,287 77,629 62,077 1,814,520 3,519,036
Q1 46,889 27,195 44,574 13,989 9,275 39,046 46,100 20,898 14,226 13,442 8,840 11,965 6,001 285,653 588,093
Q2 75,629 46,409 52,943 30,916 20,907 55,804 60,588 36,103 27,718 16,926 10,204 23,173 19,869 496,098 973,287
Q3 95,184 57,409 55,361 32,538 23,167 63,896 68,663 40,768 24,441 23,160 11,085 28,450 25,512 679,713 1,229,347
Q4 63,821 38,250 48,641 17,647 14,141 52,498 44,391 31,697 18,129 19,144 2,158 14,041 10,695 353,056 728,309
1.3. Passenger movements by major airports: 2008-2011
5
PeriodBelfast
International Birmingham International
Bristol DublinEdinburghTurnhouse
Glasgow Prestwick
Glasgow Leeds
Bradford
Liverpool John
Lennon
London Gatwick
London Heathrow
London Luton
Manchester Newcastle Nottingham
East Midlands
Total
2008 Total - 63,277 11,724 60,524 - - 37,365 - - 343,198 196,739 114,365 206,267 11,752 18,485 1,063,696
Q1 - 11,794 1,248 11,187 - - 6,505 - - 52,896 44,515 26,244 36,610 1,304 1,295 193,598
Q2 - 17,697 3,633 15,962 - - 11,400 - - 96,494 52,341 30,577 60,337 3,768 5,570 297,779
Q3 - 21,247 4,784 20,695 - - 14,395 - - 120,904 54,104 31,858 69,166 4,935 8,368 350,456
Q4 - 12,539 2,059 12,680 - - 5,065 - - 72,904 45,779 25,686 40,154 1,745 3,252 221,863
2009 Total - 55,764 24,928 51,643 24,298 - 19,895 - - 308,143 200,202 105,756 190,666 25,732 11,712 1,018,739
Q1 - 8,708 823 11,050 253 - 736 - - 56,109 41,592 20,456 34,297 1,374 1,188 176,586
Q2 - 16,867 3,029 14,160 8,009 - 6,081 - - 81,353 51,477 31,037 52,106 5,969 4,886 274,974
Q3 - 20,780 12,517 14,250 8,602 - 8,972 - - 108,018 56,112 32,393 61,164 10,753 4,457 338,018
Q4 - 9,409 8,559 12,183 7,434 - 4,106 - - 62,663 51,021 21,870 43,099 7,636 1,181 229,161
2010 Total - 33,594 46,681 58,124 37,992 - 14,434 24,489 16,402 288,651 197,182 98,370 182,099 33,587 22,356 1,053,961
Q1 - 6,054 7,501 11,346 6,977 - 212 579 78 50,238 45,471 19,374 34,309 6,920 171 189,230
Q2 - 8,530 12,763 15,075 9,665 - 5,303 7,312 1,489 79,079 47,719 28,385 51,474 8,469 6,216 281,479
Q3 - 10,645 16,224 20,850 12,790 - 5,828 9,132 8,202 98,775 55,599 32,363 58,371 10,738 10,986 350,503
Q4 - 8,365 10,193 10,853 8,560 - 3,091 7,466 6,633 60,559 48,393 18,248 37,945 7,460 4,983 232,749
2011 Total 23,532 49,143 49,601 54,587 41,289 15,845 13,880 31,868 29,142 281,523 201,519 95,090 169,263 34,805 30,027 1,121,114
Q1 3,007 12,690 7,948 8,885 7,604 - - 7,295 6,450 46,889 44,574 13,989 27,195 6,728 2,477 195,731
Q2 6,443 13,257 14,131 16,206 11,238 5,598 4,761 8,501 7,374 75,629 52,943 30,916 46,409 9,186 9,438 312,030
Q3 7,473 13,982 17,303 19,115 13,002 8,016 6,121 9,021 8,369 95,184 55,361 32,538 57,409 10,799 12,264 365,957
Q4 6,609 9,214 10,219 10,381 9,445 2,231 2,998 7,051 6,949 63,821 48,641 17,647 38,250 8,092 5,848 247,396
* more than 10,000 passengers during reporting year.
1.4. Passenger movements by major* airports - UK and Ireland: 2008-2011
6
Period Billund Copenhagen OsloStockholm
ArlandaStockholm
SkavstaTotal
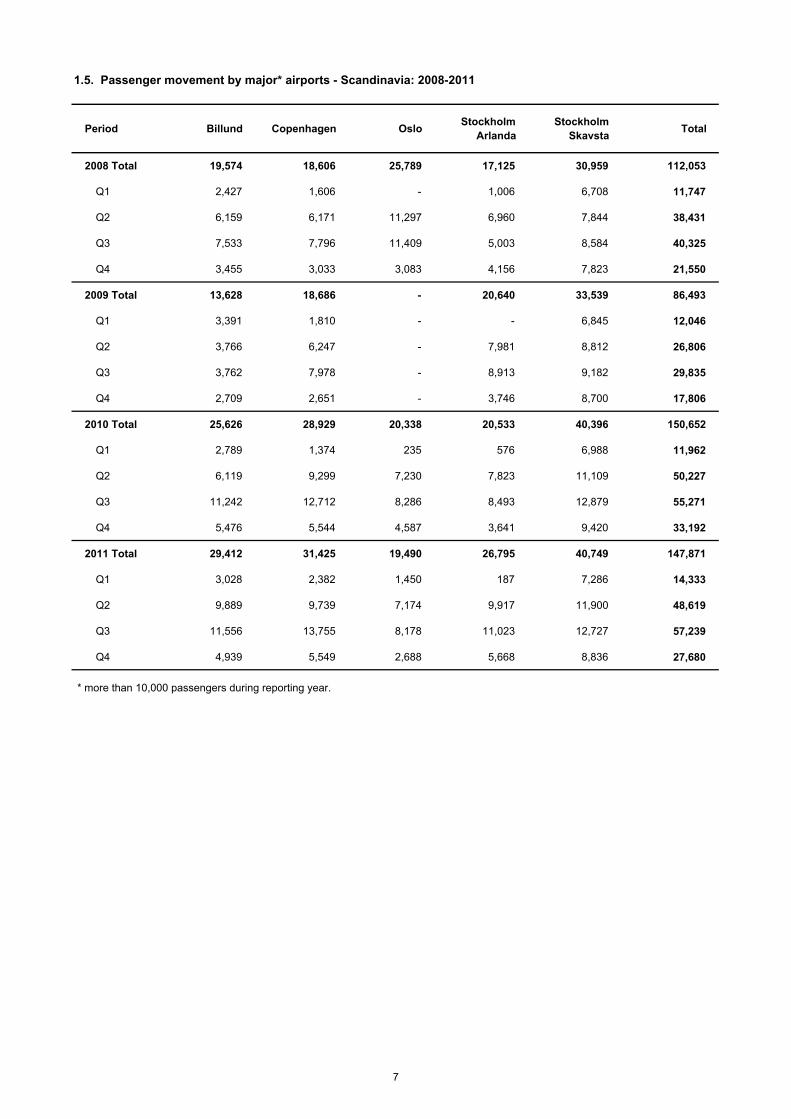
2008 Total 19,574 18,606 25,789 17,125 30,959 112,053
Q1 2,427 1,606 - 1,006 6,708 11,747
Q2 6,159 6,171 11,297 6,960 7,844 38,431
Q3 7,533 7,796 11,409 5,003 8,584 40,325
Q4 3,455 3,033 3,083 4,156 7,823 21,550
2009 Total 13,628 18,686 - 20,640 33,539 86,493
Q1 3,391 1,810 - - 6,845 12,046
Q2 3,766 6,247 - 7,981 8,812 26,806
Q3 3,762 7,978 - 8,913 9,182 29,835
Q4 2,709 2,651 - 3,746 8,700 17,806
2010 Total 25,626 28,929 20,338 20,533 40,396 150,652
Q1 2,789 1,374 235 576 6,988 11,962
Q2 6,119 9,299 7,230 7,823 11,109 50,227
Q3 11,242 12,712 8,286 8,493 12,879 55,271
Q4 5,476 5,544 4,587 3,641 9,420 33,192
2011 Total 29,412 31,425 19,490 26,795 40,749 147,871
Q1 3,028 2,382 1,450 187 7,286 14,333
Q2 9,889 9,739 7,174 9,917 11,900 48,619
Q3 11,556 13,755 8,178 11,023 12,727 57,239
Q4 4,939 5,549 2,688 5,668 8,836 27,680
* more than 10,000 passengers during reporting year.
1.5. Passenger movement by major* airports - Scandinavia: 2008-2011
7
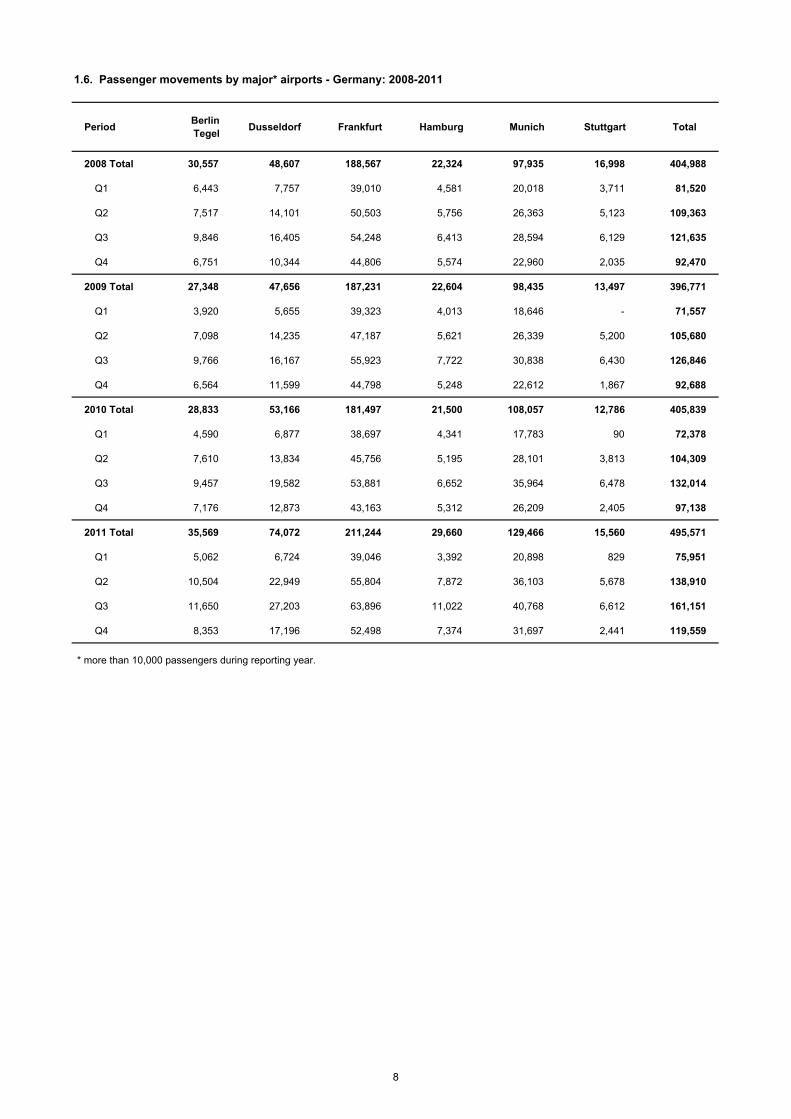
PeriodBerlin Tegel
Dusseldorf Frankfurt Hamburg Munich Stuttgart Total
2008 Total 30,557 48,607 188,567 22,324 97,935 16,998 404,988
Q1 6,443 7,757 39,010 4,581 20,018 3,711 81,520
Q2 7,517 14,101 50,503 5,756 26,363 5,123 109,363
Q3 9,846 16,405 54,248 6,413 28,594 6,129 121,635
Q4 6,751 10,344 44,806 5,574 22,960 2,035 92,470
2009 Total 27,348 47,656 187,231 22,604 98,435 13,497 396,771
Q1 3,920 5,655 39,323 4,013 18,646 - 71,557
Q2 7,098 14,235 47,187 5,621 26,339 5,200 105,680
Q3 9,766 16,167 55,923 7,722 30,838 6,430 126,846
Q4 6,564 11,599 44,798 5,248 22,612 1,867 92,688
2010 Total 28,833 53,166 181,497 21,500 108,057 12,786 405,839
Q1 4,590 6,877 38,697 4,341 17,783 90 72,378
Q2 7,610 13,834 45,756 5,195 28,101 3,813 104,309
Q3 9,457 19,582 53,881 6,652 35,964 6,478 132,014
Q4 7,176 12,873 43,163 5,312 26,209 2,405 97,138
2011 Total 35,569 74,072 211,244 29,660 129,466 15,560 495,571
Q1 5,062 6,724 39,046 3,392 20,898 829 75,951
Q2 10,504 22,949 55,804 7,872 36,103 5,678 138,910
Q3 11,650 27,203 63,896 11,022 40,768 6,612 161,151
Q4 8,353 17,196 52,498 7,374 31,697 2,441 119,559
* more than 10,000 passengers during reporting year.
1.6. Passenger movements by major* airports - Germany: 2008-2011
8
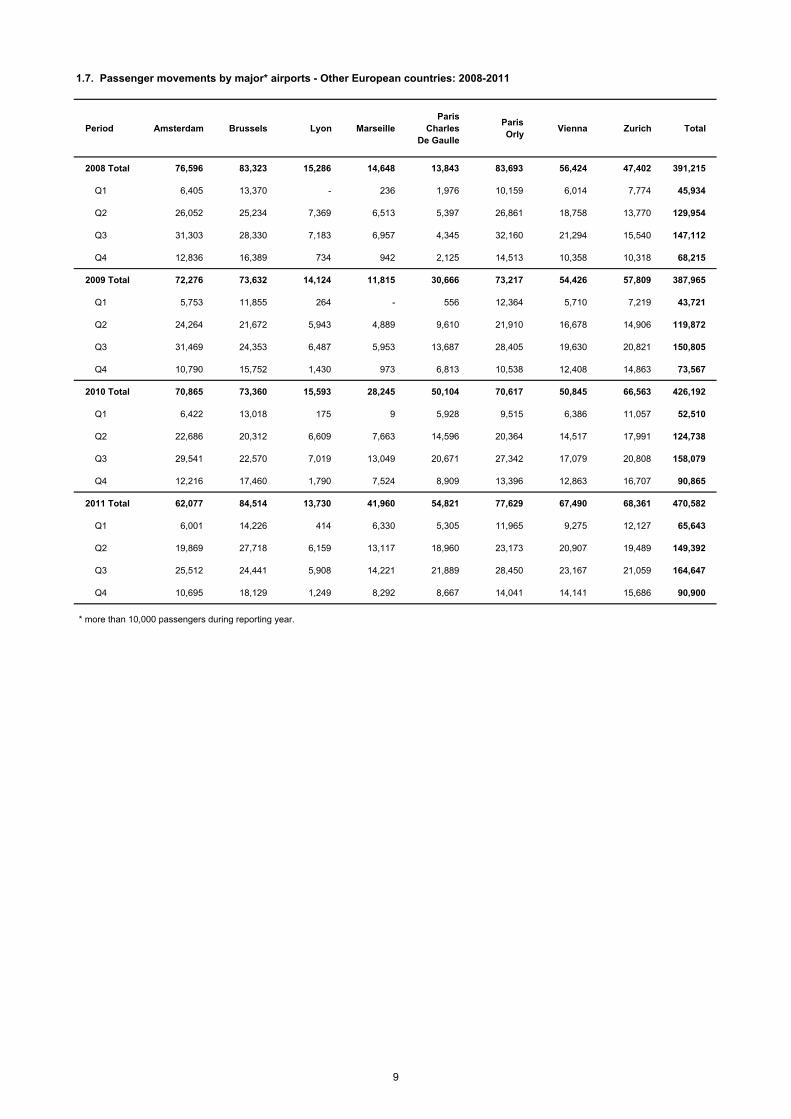
Period Amsterdam Brussels Lyon MarseilleParis
Charles De Gaulle
Paris Orly
Vienna Zurich Total
2008 Total 76,596 83,323 15,286 14,648 13,843 83,693 56,424 47,402 391,215
Q1 6,405 13,370 - 236 1,976 10,159 6,014 7,774 45,934
Q2 26,052 25,234 7,369 6,513 5,397 26,861 18,758 13,770 129,954
Q3 31,303 28,330 7,183 6,957 4,345 32,160 21,294 15,540 147,112
Q4 12,836 16,389 734 942 2,125 14,513 10,358 10,318 68,215
2009 Total 72,276 73,632 14,124 11,815 30,666 73,217 54,426 57,809 387,965
Q1 5,753 11,855 264 - 556 12,364 5,710 7,219 43,721
Q2 24,264 21,672 5,943 4,889 9,610 21,910 16,678 14,906 119,872
Q3 31,469 24,353 6,487 5,953 13,687 28,405 19,630 20,821 150,805
Q4 10,790 15,752 1,430 973 6,813 10,538 12,408 14,863 73,567
2010 Total 70,865 73,360 15,593 28,245 50,104 70,617 50,845 66,563 426,192
Q1 6,422 13,018 175 9 5,928 9,515 6,386 11,057 52,510
Q2 22,686 20,312 6,609 7,663 14,596 20,364 14,517 17,991 124,738
Q3 29,541 22,570 7,019 13,049 20,671 27,342 17,079 20,808 158,079
Q4 12,216 17,460 1,790 7,524 8,909 13,396 12,863 16,707 90,865
2011 Total 62,077 84,514 13,730 41,960 54,821 77,629 67,490 68,361 470,582
Q1 6,001 14,226 414 6,330 5,305 11,965 9,275 12,127 65,643
Q2 19,869 27,718 6,159 13,117 18,960 23,173 20,907 19,489 149,392
Q3 25,512 24,441 5,908 14,221 21,889 28,450 23,167 21,059 164,647
Q4 10,695 18,129 1,249 8,292 8,667 14,041 14,141 15,686 90,900
* more than 10,000 passengers during reporting year.
1.7. Passenger movements by major* airports - Other European countries: 2008-2011
9
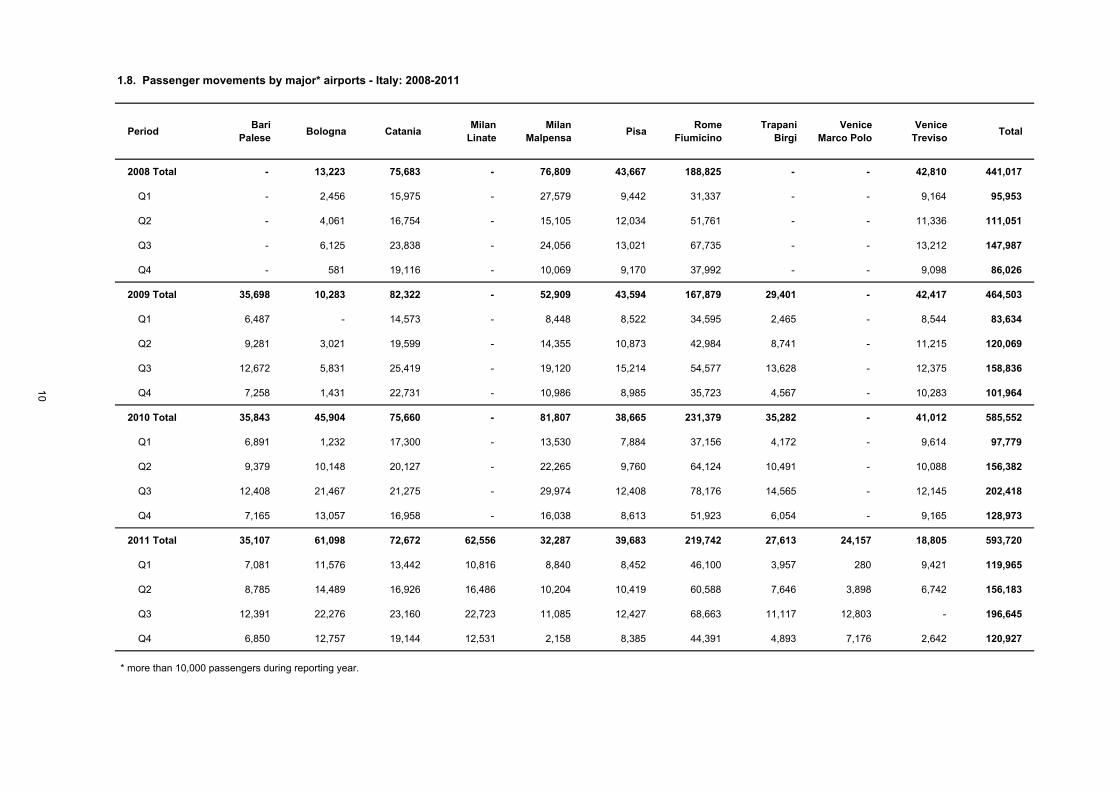
PeriodBari
PaleseBologna Catania
Milan Linate
Milan Malpensa
PisaRome
FiumicinoTrapani
BirgiVenice
Marco PoloVenice
TrevisoTotal
2008 Total - 13,223 75,683 - 76,809 43,667 188,825 - - 42,810 441,017
Q1 - 2,456 15,975 - 27,579 9,442 31,337 - - 9,164 95,953
Q2 - 4,061 16,754 - 15,105 12,034 51,761 - - 11,336 111,051
Q3 - 6,125 23,838 - 24,056 13,021 67,735 - - 13,212 147,987
Q4 - 581 19,116 - 10,069 9,170 37,992 - - 9,098 86,026
2009 Total 35,698 10,283 82,322 - 52,909 43,594 167,879 29,401 - 42,417 464,503
Q1 6,487 - 14,573 - 8,448 8,522 34,595 2,465 - 8,544 83,634
Q2 9,281 3,021 19,599 - 14,355 10,873 42,984 8,741 - 11,215 120,069
Q3 12,672 5,831 25,419 - 19,120 15,214 54,577 13,628 - 12,375 158,836
Q4 7,258 1,431 22,731 - 10,986 8,985 35,723 4,567 - 10,283 101,964
2010 Total 35,843 45,904 75,660 - 81,807 38,665 231,379 35,282 - 41,012 585,552
Q1 6,891 1,232 17,300 - 13,530 7,884 37,156 4,172 - 9,614 97,779
Q2 9,379 10,148 20,127 - 22,265 9,760 64,124 10,491 - 10,088 156,382
Q3 12,408 21,467 21,275 - 29,974 12,408 78,176 14,565 - 12,145 202,418
Q4 7,165 13,057 16,958 - 16,038 8,613 51,923 6,054 - 9,165 128,973
2011 Total 35,107 61,098 72,672 62,556 32,287 39,683 219,742 27,613 24,157 18,805 593,720
Q1 7,081 11,576 13,442 10,816 8,840 8,452 46,100 3,957 280 9,421 119,965
Q2 8,785 14,489 16,926 16,486 10,204 10,419 60,588 7,646 3,898 6,742 156,183
Q3 12,391 22,276 23,160 22,723 11,085 12,427 68,663 11,117 12,803 - 196,645
Q4 6,850 12,757 19,144 12,531 2,158 8,385 44,391 4,893 7,176 2,642 120,927
* more than 10,000 passengers during reporting year.
1.8. Passenger movements by major* airports - Italy: 2008-2011
10
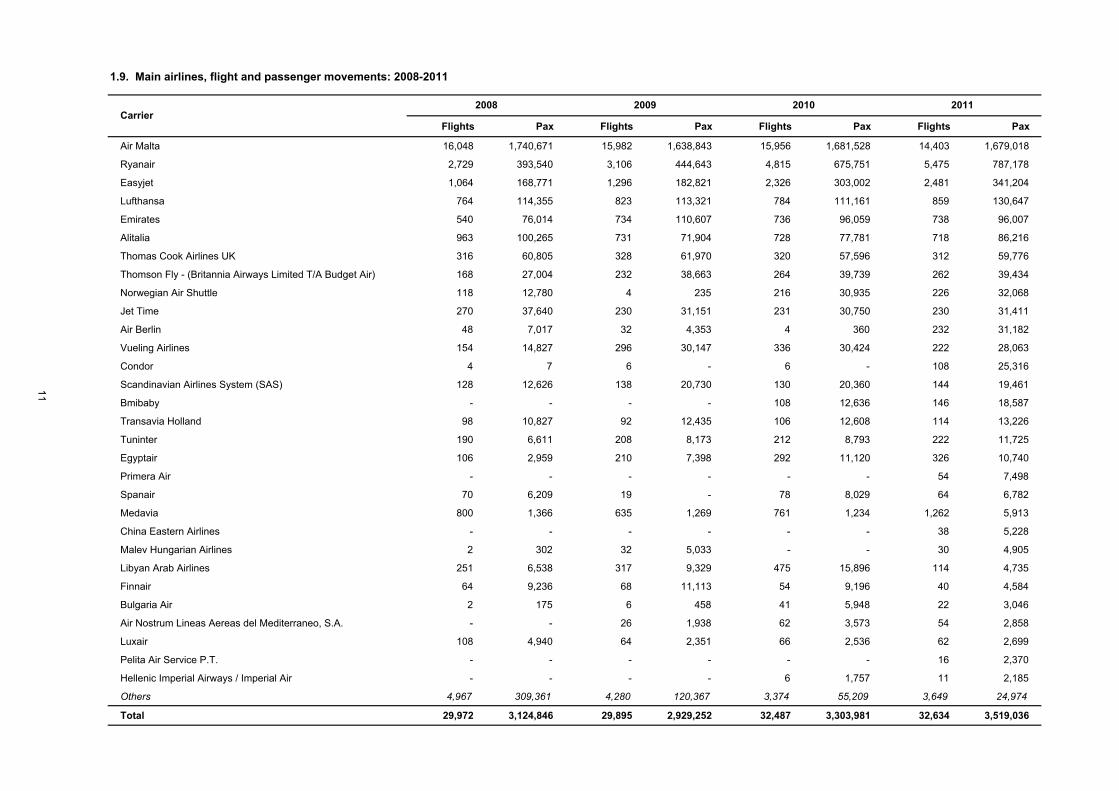
Flights Pax Flights Pax Flights Pax Flights Pax
Air Malta 16,048 1,740,671 15,982 1,638,843 15,956 1,681,528 14,403 1,679,018
Ryanair 2,729 393,540 3,106 444,643 4,815 675,751 5,475 787,178
Easyjet 1,064 168,771 1,296 182,821 2,326 303,002 2,481 341,204
Lufthansa 764 114,355 823 113,321 784 111,161 859 130,647
Emirates 540 76,014 734 110,607 736 96,059 738 96,007
Alitalia 963 100,265 731 71,904 728 77,781 718 86,216
Thomas Cook Airlines UK 316 60,805 328 61,970 320 57,596 312 59,776
Thomson Fly - (Britannia Airways Limited T/A Budget Air) 168 27,004 232 38,663 264 39,739 262 39,434
Norwegian Air Shuttle 118 12,780 4 235 216 30,935 226 32,068
Jet Time 270 37,640 230 31,151 231 30,750 230 31,411
Air Berlin 48 7,017 32 4,353 4 360 232 31,182
Vueling Airlines 154 14,827 296 30,147 336 30,424 222 28,063
Condor 4 7 6 - 6 - 108 25,316
Scandinavian Airlines System (SAS) 128 12,626 138 20,730 130 20,360 144 19,461
Bmibaby - - - - 108 12,636 146 18,587
Transavia Holland 98 10,827 92 12,435 106 12,608 114 13,226
Tuninter 190 6,611 208 8,173 212 8,793 222 11,725
Egyptair 106 2,959 210 7,398 292 11,120 326 10,740
Primera Air - - - - - - 54 7,498
Spanair 70 6,209 19 - 78 8,029 64 6,782
Medavia 800 1,366 635 1,269 761 1,234 1,262 5,913
China Eastern Airlines - - - - - - 38 5,228
Malev Hungarian Airlines 2 302 32 5,033 - - 30 4,905
Libyan Arab Airlines 251 6,538 317 9,329 475 15,896 114 4,735
Finnair 64 9,236 68 11,113 54 9,196 40 4,584
Bulgaria Air 2 175 6 458 41 5,948 22 3,046
Air Nostrum Lineas Aereas del Mediterraneo, S.A. - - 26 1,938 62 3,573 54 2,858
Luxair 108 4,940 64 2,351 66 2,536 62 2,699
Pelita Air Service P.T. - - - - - - 16 2,370
Hellenic Imperial Airways / Imperial Air - - - - 6 1,757 11 2,185
Others 4,967 309,361 4,280 120,367 3,374 55,209 3,649 24,974
Total 29,972 3,124,846 29,895 2,929,252 32,487 3,303,981 32,634 3,519,036
1.9. Main airlines, flight and passenger movements: 2008-2011
2011Carrier
20102008 2009
11
Period Cargo (kg) Mail (kg)
2008 Total 16,958,798 1,268,381
Q1 4,238,607 289,038
Q2 4,400,742 315,575
Q3 4,017,821 301,652
Q4 4,301,628 362,116
2009 Total 16,080,843 1,422,938
Q1 3,766,840 329,398
Q2 3,679,575 343,168
Q3 3,911,870 325,930
Q4 4,722,558 424,442
2010 Total 15,407,490 1,436,410
Q1 3,956,932 364,744
Q2 3,768,086 350,895
Q3 3,482,588 354,185
Q4 4,199,884 366,586
2011 Total 14,882,870 1,348,314
Q1 3,720,872 316,440
Q2 3,729,306 310,778
Q3 3,354,844 316,569
Q4 4,077,848 404,527
1.10. Mail and cargo movements: 2008-2011
12
SEA TRANSPORT

Year Total Total
No. Tons No. Tons No. Tons No. Tons No. Tons No. Tons
2011 3,108 36,689,110 8,641 76,027,960 11,749 112,717,070 3,123 36,736,366 8,608 75,984,680 11,731 112,721,046
2.1. Number and net tonnage of vessels entered and cleared with cargoes and in ballast: 2011
ENTERED CLEARED
With cargo In ballast With cargo In ballast
15
No.Gross
tonsNet
tonsCrews No.
Net tons
No.Net
tonsNo.
Gross tons
Net tons
Crews No.Net
tonsNo.
Net tons
Albania 66 550,641 244,076 - 43 157,453 23 86,623 27 194,190 86,164 - 15 57,769 12 28,395
Algeria 440 5,118,700 2,443,249 - 293 1,352,717 147 1,090,532 485 5,467,421 2,612,931 - 311 1,532,860 174 1,080,071
Angola 1 16,803 8,673 - 1 8,673 - - 3 26,146 15,436 - 1 10,744 2 4,692
Argentina 18 701,482 416,171 - - - 18 416,171 5 90,728 54,771 - 1 920 4 53,851
Australia 2 60,706 30,245 - - - 2 30,245 1 5,799 3,152 - - - 1 3,152
Bahamas 3 110,779 60,848 - - - 3 60,848 4 213,163 122,029 - - - 4 122,029
Bangladesh - - - - - - - - 5 86,235 44,945 - - - 5 44,945
Belgium 54 2,748,779 1,357,708 - 27 1,021,815 27 335,893 38 716,706 350,519 - 2 3,713 36 346,806
Benin 1 23,740 8,832 - - - 1 8,832 7 197,369 94,142 - 2 36,195 5 57,947
Brazil 24 755,123 473,662 - - - 24 473,662 29 1,161,326 673,408 - - - 29 673,408
Bulgaria 76 927,023 428,286 - 50 194,234 26 234,052 29 228,991 109,378 - 15 60,803 14 48,575
Cameroon 1 47,115 14,134 - - - 1 14,134 2 35,537 20,054 - - - 2 20,054
Canada 13 378,070 214,417 - - - 13 214,417 20 1,171,811 548,807 - 1 37,549 19 511,258
Cape Verde 1 2,947 1,458 - - - 1 1,458 7 89,799 37,941 - 3 31,809 4 6,132
China 3 171,654 76,954 - - - 3 76,954 4 199,985 101,147 - 1 59,901 3 41,246
Colombia 1 6,971 3,230 - - - 1 3,230 4 235,154 150,500 - - - 4 150,500
Comoros - - - - - - - - 1 7,366 3,614 - - - 1 3,614
Congo - - - - - - - - 4 64,142 29,675 - 1 18,650 3 11,025
Croatia 107 1,659,331 789,193 - 47 200,841 60 588,352 93 1,175,233 558,345 - 40 222,110 53 336,235
Cuba - - - - - - - - 2 19,506 11,122 - - - 2 11,122
Cyprus 44 1,069,924 523,778 - 15 157,526 29 366,252 34 890,250 235,948 - 3 19,917 31 216,031
Denmark 8 165,834 96,781 - 1 2,267 7 94,514 14 73,720 35,113 - - - 14 35,113
Djibouti 2 88,715 40,029 - 1 28,825 1 11,204 2 7,088 3,698 - - - 2 3,698
Dominican Republic 4 18,945 10,488 - - - 4 10,488 - - - - - - - -
Ecuador 1 7,988 3,840 - - - 1 3,840 - - - - - - - -
Egypt 623 22,092,302 11,122,569 - 182 3,285,630 441 7,836,939 642 29,040,209 14,425,074 - 176 6,366,443 466 8,058,631
Equatorial Guinea - - - - - - - - 1 17,264 9,525 - - - 1 9,525
Eritrea 5 210 182 - - - 5 182 - - - - - - - -
Estonia 7 206,911 120,516 - - - 7 120,516 2 1,589 495 - - - 2 495
Fiji - - - - - - - - 1 5,285 3,393 - - - 1 3,393
Finland 4 29,349 12,526 - 1 1,075 3 11,451 5 28,048 14,241 - - - 5 14,241
France 316 12,604,958 6,171,935 - 120 3,650,741 196 2,521,194 252 9,198,777 4,328,781 - 120 3,331,832 132 996,949
Georgia 21 383,130 165,714 - 10 80,259 11 85,455 13 186,964 86,892 - 6 23,638 7 63,254
Germany 27 552,687 277,949 - 1 1,460 26 276,489 22 381,130 182,279 - - - 22 182,279
Ghana 5 44,638 24,127 - - - 5 24,127 1 27,357 13,881 - - - 1 13,881
Gibraltar 100 3,109,708 1,500,939 - 13 165,499 87 1,335,440 170 4,555,555 2,367,243 - 19 222,015 151 2,145,228
Greece 267 5,408,020 2,701,763 - 87 802,939 180 1,898,824 275 5,925,885 2,979,432 - 127 961,492 148 2,017,940
Guinea 6 101,819 51,077 - 3 26,108 3 24,969 7 191,694 117,005 - - - 7 117,005
Guinea-Bissau 1 4,347 2,034 - - - 1 2,034 - - - - - - - -
Haiti - - - - - - - - 1 4,811 2,294 - - - 1 2,294
Honduras 9 225,765 135,832 - - - 9 135,832 - - - - - - - -
India 21 796,650 426,393 - 3 101,965 18 324,428 9 365,515 222,977 - - - 9 222,977
Indonesia 3 41,951 19,562 - - - 3 19,562 1 2,805 1,568 - - - 1 1,568
Iran 4 229,602 137,185 - - - 4 137,185 1 23,270 9,925 - - - 1 9,925
Iraq - - - - - - - - 1 12,772 5,641 - - - 1 5,641
2.2. Number, tonnage and crews of vessels entered and cleared classified by country of origin or destination: 2011 …
Country of origin or destination
ENTERED CLEARED
Total With cargo In ballast Total With cargo In ballast
16
No.Gross
tonsNet
tonsCrews No.
Net tons
No.Net
tonsNo.
Gross tons
Net tons
Crews No.Net
tonsNo.
Net tons
Israel 43 1,133,135 624,846 - 8 57,434 35 567,412 38 549,976 274,169 - 1 8,801 37 265,368
Italy 2,280 39,512,825 18,143,859 - 978 7,935,118 1,302 10,208,741 2,084 40,920,377 20,722,432 - 960 7,142,440 1,124 13,579,992
Ivory Coast 6 142,143 69,713 - 3 46,019 3 23,694 2 40,196 19,383 - 2 19,383 - -
Jamaica 1 15,786 9,209 - - - 1 9,209 3 60,053 35,432 - 1 3,580 2 31,852
Japan 1 11,551 4,965 - - - 1 4,965 3 97,764 30,273 - - - 3 30,273
Jordan 9 125,309 67,210 - 1 13,429 8 53,781 4 147,725 80,356 - 4 80,356 - -
Kenya 1 496 149 - - - 1 149 1 9,547 2,864 - - - 1 2,864
Kuwait 5 174,406 72,154 - - - 5 72,154 - - - - - - - -
Latvia 13 506,758 261,988 - 1 21,795 12 240,193 1 1,662 832 - - - 1 832
Lebanon 63 4,098,701 2,453,996 - 49 2,365,539 14 88,457 34 956,295 454,998 - 9 222,544 25 232,454
Liberia 2 39,237 19,362 - 1 9,227 1 10,135 2 33,367 21,182 - - - 2 21,182
Libya 345 2,610,102 1,116,689 - 90 424,788 255 691,901 374 3,382,569 1,551,688 - 122 529,389 252 1,022,299
Lithuania 3 75,211 43,197 - - - 3 43,197 1 17,644 6,617 - 1 6,617 - -
Malaysia 80 7,957,102 3,946,332 - 70 3,747,356 10 198,976 4 408,496 225,723 - 4 225,723 - -
Maldives 1 7,258 2,177 - - - 1 2,177 - - - - - - - -
Malta 440 5,039,257 2,291,979 - 36 347,594 404 1,944,385 468 4,538,004 2,080,986 - 39 369,330 429 1,711,656
Mauritiana - - - - - - - - 5 64,710 32,879 - 4 31,146 1 1,733
Mexico 1 6,065 3,424 - - - 1 3,424 7 314,174 111,733 - - - 7 111,733
Monaco 1 3,234 972 - - - 1 972 3 7,556 2,208 - - - 3 2,208
Montenegro 15 103,882 51,743 - 8 34,138 7 17,605 24 187,017 79,941 - 14 41,266 10 38,675
Morocco 158 2,897,058 1,342,431 - 86 581,284 72 761,147 181 4,960,797 2,657,216 - 111 2,078,495 70 578,721
Mozambique - - - - - - - - 1 22,135 12,665 - - - 1 12,665
Netherlands 67 2,193,493 1,069,545 - 14 245,465 53 824,080 92 1,954,960 1,000,484 - 3 22,386 89 978,098
Nigeria - - - - - - - - 5 29,959 13,063 - 2 10,795 3 2,268
Norfolk Island 10 588,157 277,419 - 7 196,006 3 81,413 4 128,439 76,549 - - - 4 76,549
Norway 19 1,050,986 476,085 - - - 19 476,085 17 40,043 16,604 - 1 1,060 16 15,544
Oman 14 952,604 424,327 - 4 107,656 10 316,671 1 2,387 717 - - - 1 717
Others 2 17,747 7,959 - - - 2 7,959 5 47,844 19,811 - 2 11,766 3 8,045
Pakistan 3 48,093 24,573 - - - 3 24,573 1 61,724 32,726 - 1 32,726 - -
Palau 1 23,195 13,367 - - - 1 13,367 - - - - - - - -
Panama 4 58,825 34,651 - - - 4 34,651 1 23,298 10,195 - - - 1 10,195
Philippines 5 12,328 6,237 - - - 5 6,237 3 30,677 17,842 - - - 3 17,842
Poland 5 42,296 18,099 - - - 5 18,099 13 205,082 110,761 - - - 13 110,761
Portugal 45 677,953 319,774 - 23 183,311 22 136,463 31 853,337 427,529 - 2 30,718 29 396,811
Puerto Rico 3 31,217 16,468 - - - 3 16,468 1 46,613 15,473 - - - 1 15,473
Qatar 7 692,773 227,242 - - - 7 227,242 3 410,055 132,246 - - - 3 132,246
Republic of Ireland 4 41,162 21,942 - - - 4 21,942 5 35,585 17,617 - - - 5 17,617
Romania 49 454,114 213,330 - 21 86,492 28 126,838 50 533,859 238,873 - 21 86,634 29 152,239
Russia 46 863,100 432,089 - 8 33,777 38 398,312 46 1,097,521 573,661 - 11 89,045 35 484,616
Saudi Arabia 85 4,717,305 2,603,052 - 65 2,274,741 20 328,311 34 1,218,711 682,311 - 21 470,742 13 211,569
Sea 3,789 45,638,613 21,699,840 - 219 1,738,902 3,570 19,960,938 4,284 61,530,610 29,387,659 - 329 2,619,578 3,955 26,768,081
Senegal 5 89,940 43,454 - 4 37,428 1 6,026 16 393,839 202,873 - 12 175,725 4 27,148
Sierra Leone 1 776 232 - - - 1 232 - - - - - - - -
Singapore 26 1,097,501 446,354 - - - 26 446,354 12 340,226 168,409 - 2 14,429 10 153,980
… 2.2. Number, tonnage and crews of vessels entered and cleared classified by country of origin or destination: 2011
Country of origin or destination
ENTERED CLEARED
Total With cargo In ballast Total With cargo In ballast
17
No.Gross
tonsNet
tonsCrews No.
Net tons
No.Net
tonsNo.
Gross tons
Net tons
Crews No.Net
tonsNo.
Net tons
Slovenia 86 1,259,725 590,822 - 36 229,225 50 361,597 26 428,268 192,045 - 10 65,100 16 126,945
South Africa 8 241,779 123,782 - - - 8 123,782 4 69,663 38,954 - - - 4 38,954
Spain 519 15,418,457 8,877,150 - 147 2,014,917 372 6,862,233 425 12,778,339 6,850,422 - 139 3,188,342 286 3,662,080
Sri Lanka 3 131,992 57,230 - 2 57,230 1 - - - - - - - - -
Sudan 1 9,611 4,260 - - - 1 4,260 5 120,725 71,371 - - - 5 71,371
Sweden 17 357,704 162,038 - 9 105,383 8 56,655 4 27,161 13,434 - - - 4 13,434
Syria 42 881,825 404,394 - 2 27,673 40 376,721 77 1,229,142 607,040 - 44 425,174 33 181,866
Taiwan - - - - - - - - 2 39,529 21,946 - - - 2 21,946
Trinidad and Tobago 1 39,906 24,504 - 1 24,504 - - - - - - - - - -
Togo - - - - - - - - 1 21,531 11,839 - - - 1 11,839
Tunisia 429 7,820,152 5,017,829 - 115 482,570 314 4,535,259 328 2,802,173 1,375,448 - 170 715,922 158 659,526
Turkey 396 7,530,614 3,754,898 - 152 1,324,765 244 2,430,133 414 7,953,488 4,017,021 - 122 917,749 292 3,099,272
UK 61 3,885,883 1,445,822 - 7 93,560 54 1,352,262 149 6,231,502 2,957,760 - 54 1,970,245 95 987,515
USA 112 4,331,699 2,060,748 - 20 409,319 92 1,651,429 88 3,676,973 1,795,072 - 16 247,364 72 1,547,708
Ukraine 105 1,807,183 906,511 - 23 192,438 82 714,073 67 999,632 476,860 - 11 51,669 56 425,191
United Arab Emirates 13 309,715 149,850 - - - 13 149,850 44 3,946,199 1,984,170 - 32 1,817,799 12 166,371
Uruguay 2 47,504 26,480 - - - 2 26,480 1 18,361 10,979 - - - 1 10,979
Venezuela 4 106,235 49,468 - - - 4 49,468 4 46,047 31,589 - 1 13,374 3 18,215
Vietnam - - - - - - - - 1 2,535 760 - - - 1 760
Western Sahara 1 15,904 8,834 - - - 1 8,834 1 1,525 594 - 1 594 - -
Yemen 2 110,178 33,661 - - - 2 33,661 2 113,208 41,277 - - - 2 41,277
Total 11,749 228,521,077 112,717,070 - 3,108 36,689,110 8,641 76,027,960 11,731 228,537,429 112,721,046 - 3,123 36,736,366 8,608 75,984,680
… 2.2. Number, tonnage and crews of vessels entered and cleared classified by country of origin or destination: 2011
Country of origin or destination
ENTERED CLEARED
Total With cargo In ballast Total With cargo In ballast
18
No.Gross
tonsNet
tonsNo.
Gross tons
Net tons
No.Gross
tonsNet
tonsNo.
Gross tons
Net tons
No.Gross
tonsNet
tonsNo.
Gross tons
Net tons
Albania - - - - - - - - - - - - - - - 2 4,410 2,718
Algeria - - - 2 406 188 - - - - - - - - - 9 357,597 120,872
Anguilla - - - - - - - - - - - - - - - 1 4,028 2,218
Antigua and Barbuda 1 498 159 - - - - - - 485 4,116,490 1,959,396 - - - 312 1,734,674 845,165
Argentina - - - - - - - - - - - - - - - 2 11,100 6,162
Austria - - - - - - - - - 1 2,449 1,380 - - - - - -
Bahamas 1 2,610 783 - - - 74 2,928,975 1,665,842 75 2,270,903 1,233,128 6 152,042 73,248 119 3,654,876 1,771,227
Barbados - - - - - - - - - 20 526,140 265,952 - - - 10 146,207 72,991
Belgium - - - - - - - - - 1 2,449 1,380 1 6,519 3,125 4 8,148 3,125
Belize 1 352 105 - - - - - - 47 93,154 37,741 4 90,060 45,256 81 757,183 371,492
Bermuda 3 12,436 3,731 - - - 11 589,713 316,344 3 117,522 53,652 1 41,589 20,923 14 864,620 257,318
Bolivia - - - - - - - - - - - - - - - 1 1,746 970
Brazil - - - - - - - - - - - - - - - 1 28,347 15,151
Bulgaria - - - - - - - - - - - - - - - 11 158,611 83,175
Cambodia - - - - - - - - - 1 1,876 1,034 - - - 14 44,790 23,561
Canada - - - - - - - - - - - - - - - 3 14,295 1
Cayman Islands 19 32,846 9,848 - - - - - - 1 59,952 18,543 4 106,272 57,534 10 259,678 129,457
China - - - - - - - - - - - - - - - 11 456,828 226,771
Comoros - - - - - - - - - 7 10,866 3,991 - - - 14 28,172 15,896
Cook Islands - - - - - - - - - - - - - - - 2 4,599 2,397
Croatia - - - - - - - - - 5 20,703 10,814 - - - 16 424,510 218,186
Cyprus - - - 51 4,752 1,446 1 630 210 73 1,626,182 857,676 33 785,272 346,890 173 3,275,052 1,615,313
Denmark - - - - - - - - - 8 196,505 105,578 20 459,299 190,558 123 2,729,321 1,172,610
Dominica - - - - - - - - - - - - - - - 21 1,179,128 673,664
Egypt - - - 4 619 454 - - - - - - - - - 18 165,253 62,166
Faroe Islands - - - - - - - - - - - - - - - 6 3,013 954
Finland - - - - - - 1 12,907 4,618 - - - - - - 5 81,889 16,165
France - - - 32 7,943 4,485 3 144,225 52,800 81 7,354,600 4,065,241 4 56,852 22,815 68 1,853,105 647,447
French Guiana - - - - - - 1 3,504 1,051 - - - - - - - - -
French Southern Territories - - - - - - - - - - - - - - - 1 97,000 29,100
Georgia - - - - - - - - - 3 5,100 2,100 - - - 32 130,886 67,165
Germany - - - - - - 1 22,496 8,264 121 3,456,239 1,781,385 - - - 47 901,967 346,489
Gibraltar - - - 8 1,648 488 - - - 22 853,470 392,202 1 5,836 1,750 59 577,542 275,066
Greece 2 620 160 3 703 339 6 94,686 41,496 6 171,756 90,714 30 901,939 390,571 154 6,903,842 3,914,877
Honduras - - - 2 204 204 - - - 1 3,287 1,999 - - - 1 165 50
Hong Kong - - - - - - - - - 31 1,047,793 558,266 5 160,427 72,703 91 3,458,901 1,868,047
Iceland - - - - - - - - - - - - - - - 5 6,070 1,820
India - - - - - - - - - - - - - - - 20 945,129 512,882
Indonesia - - - - - - - - - - - - - - - 1 7,717 2,697
Iran - - - - - - - - - 3 78,463 39,744 - - - - - -
Isle of Man 3 5,406 1,556 - - - - - - 20 210,920 97,360 2 78,388 41,511 69 2,359,776 1,170,195
Israel - - - - - - - - - 1 2,364 1,321 - - - 3 7,092 3,963
Italy - - - 73 9,673 4,833 71 6,178,028 4,376,719 231 7,164,523 2,430,753 132 1,748,982 754,843 549 10,832,599 4,756,988
Kazakhstan - - - - - - - - - - - - - - - 3 2,370 1,289
Korea, North - - - - - - - - - - - - - - - 3 38,329 24,543
Korea, South - - - 3 315 315 - - - - - - - - - 5 46,562 20,637
Latvia - - - - - - - - - - - - - - - 10 39,872 15,233
Lebanon - - - - - - - - - - - - - - - 15 92,075 48,480
Liberia - - - - - - - - - 274 11,617,897 6,155,343 40 1,030,689 443,186 507 16,822,996 8,812,113
Libya 1 7 7 85 40,169 16,363 - - - - - - 1 29,304 12,017 17 214,474 106,053
Lithuania - - - - - - - - - 7 6,986 3,879 - - - 8 49,733 24,642
Luxembourg - - - - - - - - - 9 39,547 20,432 48 214,867 95,083 61 369,448 160,459
Madagascar - - - - - - - - - - - - - - - 1 1,525 459
Madeira - - - - - - - - - 2 6,593 2,648 - - - - - -
2.3. Number and tonnage of vessels arriving at Malta, classified by type and nationality: 2011…
Nationality of vessel
Yacht Motor fishing vessel Passenger vessel Dry cargo vessel Tanker Others
19
No.Gross
tonsNet
tonsNo.
Gross tons
Net tons
No.Gross
tonsNet
tonsNo.
Gross tons
Net tons
No.Gross
tonsNet
tonsNo.
Gross tons
Net tons
Malaysia - - - - - - - - - - - - - - - 7 411,501 131,667
Malta 5 1,360 406 2 454 136 68 3,621,395 2,098,315 354 8,506,681 3,900,819 103 1,688,297 758,457 2,944 19,723,269 9,751,392
Marshall Islands 1 417 125 - - - 5 152,925 68,734 173 3,595,041 1,601,390 58 1,234,136 546,324 460 19,934,680 8,506,552
Moldovia - - - - - - - - - 6 20,735 7,016 - - - 44 143,172 62,316
Mongolia 1 625 188 - - - - - - - - - - - - - - -
Morocco - - - - - - - - - 39 230,765 102,854 - - - 12 100,126 40,961
Netherlands - - - - - - 2 111,638 52,558 55 419,751 213,465 3 10,673 3,898 138 751,329 317,754
Netherlands Antilles - - - - - - 1 33,933 16,028 4 5,871 3,152 - - - 19 145,617 72,654
Norfolk Island - - - - - - - - - - - - - - - 3 288,459 91,074
Norway - - - - - - - - - 2 93,835 29,057 8 384,957 193,408 132 5,543,805 2,347,032
Norwegian International Ship Register - - - - - - - - - - - - 1 24,242 10,125 18 951,392 468,928
Pakistan - - - - - - - - - - - - - - - 1 29,365 17,592
Panama 1 294 89 2 2,352 704 37 4,276,849 3,366,048 84 1,041,518 416,718 13 281,780 126,546 581 12,131,424 6,247,805
Philippines - - - - - - - - - 1 45,796 13,739 1 20,058 8,489 13 291,067 153,657
Poland - - - - - - - - - 1 1,545 511 - - - 6 9,745 3,536
Portugal - - - 2 450 450 17 426,717 183,875 1 4,180 2,108 1 3,430 1,029 33 273,944 130,918
Qatar 1 1,706 511 - - - - - - - - - - - - 3 194,265 114,324
Republic of Ireland - - - - - - - - - 2 10,598 5,174 - - - 7 58,264 30,221
Russia - - - - - - - - - 1 2,968 961 5 22,336 6,763 28 188,755 65,155
Saudi Arabia - - - - - - - - - - - - 10 295,849 120,773 7 207,110 84,579
Seychelles - - - - - - - - - - - - - - - 10 236,146 102,568
Sierra Leone - - - 1 454 136 - - - - - - - - - 12 39,178 19,009
Singapore - - - - - - - - - 26 1,164,184 538,053 10 161,924 78,701 129 2,660,156 1,312,637
Slovakia - - - - - - - - - - - - - - - 17 38,149 23,150
Slovenia - - - - - - - - - 1 2,061 1,161 - - - 2 4,122 2,322
Spain - - - 14 1,521 841 - - - - - - - - - 16 903,987 369,850
Sri Lanka - - - - - - - - - - - - - - - 2 1,916 758
St. Kitts-Nevis - - - - - - - - - - - - - - - 10 68,738 24,976
St. Vincent and Grenadines - - - - - - - - - 18 84,159 38,350 - - - 129 674,371 354,437
Swaziland - - - - - - - - - - - - - - - 1 12,776 6,673
Sweden 1 375 375 - - - - - - - - - - - - 7 8,246 2,471
Switzerland - - - - - - - - - 1 28,911 15,023 - - - 2 7,954 2,386
Syria - - - - - - - - - - - - - - - 4 33,462 17,769
Tanzania - - - - - - - - - - - - - - - 22 64,834 33,373
Thailand - - - - - - - - - - - - - - - 3 35,117 15,750
Togo - - - - - - - - - - - - - - - 9 66,140 34,990
Tunisia - - - 1 249 74 - - - - - - - - - 1 1,972 1,395
Turkey - - - 1 291 87 - - - 107 904,894 389,180 10 45,163 21,888 209 1,186,653 628,214
Tuvalu - - - - - - - - - - - - - - - 1 10,022 6,081
UK 7 12,589 3,772 19 3,914 1,159 4 211,189 112,915 115 8,436,493 4,512,248 3 71,002 35,905 110 1,796,280 723,948
USA - - - - - - - - - 10 467,765 206,212 - - - 34 1,377,009 563,510
Ukraine - - - - - - - - - 8 23,816 11,920 - - - 27 144,728 72,766
United Arab Emirates - - - - - - - - - - - - 2 6,756 2,028 24 116,265 42,142
Vanuatu - - - - - - - - - - - - - - - 19 190,813 57,243
Wallis and Futuna - - - - - - 15 73,011 29,717 - - - - - - 1 1,189 955
Total 48 72,141 21,815 305 76,117 32,702 318 18,882,821 12,395,534 2,548 66,156,296 32,202,763 560 10,118,940 4,486,347 7,970 133,214,762 63,577,909
… 2.3. Number and tonnage of vessels arriving at Malta, classified by type and nationality: 2011
Nationality of vessel
Yacht Motor fishing vessel Passenger vessel Dry cargo vessel Tanker Others
20
No.Gross
tonsNet
tonsNo.
Gross tons
Net tons
No.Gross
tonsNet
tonsNo.
Gross tons
Net tons
No.Gross
tonsNet
tonsNo.
Gross tons
Net tons
Albania - - - - - - - - - - - - - - - 2 4,410 2,718
Algeria - - - - - - - - - - - - - - - 9 357,597 120,872
Anguilla - - - - - - - - - - - - - - - 1 4,028 2,218
Antigua and Barbuda 1 498 159 - - - - - - 485 4,116,490 1,959,396 - - - 311 1,724,090 839,898
Argentina - - - - - - - - - - - - - - - 4 23,256 11,794
Austria - - - - - - - - - 1 2,449 1,380 - - - 0 0 0
Bahamas 1 2,610 783 - - - 74 2,928,975 1,665,842 75 2,270,903 1,233,128 6 152,042 73,248 119 3,654,876 1,771,227
Barbados - - - - - - - - - 20 526,140 265,952 - - - 10 146,207 72,991
Belgium - - - - - - - - - 1 2,449 1,380 1 6,519 3,125 4 8,148 3,125
Belize 1 352 105 - - - - - - 48 95,136 38,544 4 90,060 45,256 80 751,966 369,077
Bermuda 3 12,436 3,731 - - - 10 559,436 304,863 3 117,522 53,652 1 41,589 20,923 14 864,620 257,318
Bolivia - - - - - - - - - - - - - - - 1 1,746 970
Brazil - - - - - - - - - - - - - - - 1 28,347 15,151
Bulgaria - - - - - - - - - - - - - - - 11 158,611 83,175
Cambodia - - - - - - - - - 1 1,876 1,034 - - - 14 44,790 23,561
Canada - - - - - - - - - - - - - - - 3 14,295 1
Cayman Islands 17 28,860 8,653 - - - - - - 1 59,952 18,543 4 106,272 57,534 10 259,678 129,457
China - - - - - - - - - - - - - - - 11 456,828 226,771
Comoros - - - - - - - - - 7 10,866 3,991 - - - 14 28,172 15,896
Cook Islands - - - - - - - - - - - - - - - 2 4,599 2,397
Croatia - - - - - - - - - 5 20,703 10,814 - - - 16 424,510 218,186
Cyprus - - - 50 4,660 1,418 1 630 210 73 1,626,182 857,676 33 785,272 346,890 175 3,287,770 1,619,127
Denmark - - - - - - - - - 8 196,505 105,578 20 459,299 190,558 124 2,729,743 1,172,736
Dominica - - - - - - - - - - - - - - - 21 1,179,128 673,664
Egypt - - - 2 395 304 - - - - - - - - - 19 166,013 62,394
Faroe Islands - - - - - - - - - - - - - - - 6 3,013 954
Finland - - - - - - 1 12,907 4,618 - - - - - - 5 81,889 16,165
France - - - 32 7,943 4,485 3 144,225 52,800 81 7,354,600 4,065,241 3 33,604 12,896 68 1,853,105 647,447
French Guiana - - - - - - 1 3,504 1,051 - - - - - - 0 0 0
French Southern Territories - - - - - - - - - - - - - - - 1 97,000 29,100
Georgia - - - - - - - - - 3 5,100 2,100 - - - 32 130,886 67,165
Germany - - - - - - 1 22,496 8,264 121 3,456,239 1,781,385 - - - 47 901,967 346,489
Gibraltar - - - 8 1,648 488 - - - 22 853,470 392,202 1 5,836 1,750 58 573,727 273,037
Greece 2 620 160 3 703 339 6 94,686 41,496 6 171,756 90,714 30 901,939 390,571 153 6,866,323 3,892,273
Honduras - - - 1 102 102 - - - 1 3,287 1,999 - - - 1 165 50
Hong Kong - - - - - - - - - 31 1,047,793 558,266 5 160,427 72,703 91 3,458,901 1,868,047
Iceland - - - - - - - - - - - - - - - 5 6,070 1,820
India - - - - - - - - - - - - - - - 20 945,129 512,882
Indonesia - - - - - - - - - - - - - - - 1 7,717 2,697
Iran - - - - - - - - - 3 78,463 39,744 - - - 0 0 0
Isle of Man 4 6,543 1,840 - - - - - - 20 210,920 97,360 2 78,388 41,511 70 2,423,437 1,204,405
Israel - - - - - - - - - 1 2,364 1,321 - - - 3 7,092 3,963
Italy - - - 72 9,434 4,762 71 6,178,028 4,376,719 231 7,164,523 2,430,753 134 1,799,813 774,842 549 10,784,734 4,724,591
Kazakhstan - - - - - - - - - - - - - - - 3 2,370 1,289
Korea, North - - - - - - - - - - - - - - - 3 38,329 24,543
Korea, South - - - 3 408 287 - - - - - - - - - 5 46,562 20,637
Latvia - - - - - - - - - - - - - - - 10 39,872 15,233
Lebanon - - - - - - - - - - - - - - - 15 92,075 48,480
Liberia - - - - - - - - - 274 11,617,897 6,155,343 40 1,030,689 443,186 509 16,902,880 8,854,044
Libya 1 7 7 86 40,119 16,246 - - - - - - 1 29,304 12,017 17 214,474 106,053
Lithuania - - - - - - - - - 7 6,986 3,879 - - - 8 49,733 24,642
Luxembourg - - - - - - - - - 9 39,547 20,432 47 210,790 93,271 61 369,448 160,459
Madagascar - - - - - - - - - - - - - - - 1 1,525 459
Madeira - - - - - - - - - 2 6,593 2,648 - - - 0 0 0
2.4. Number and tonnage of vessels departing from Malta, classified by type and nationality: 2011…
Nationality of vessel
Yacht Motor fishing vessel Passenger vessel Dry cargo vessel Tanker Others
21
No.Gross
tonsNet
tonsNo.
Gross tons
Net tons
No.Gross
tonsNet
tonsNo.
Gross tons
Net tons
No.Gross
tonsNet
tonsNo.
Gross tons
Net tons
Malaysia - - - - - - - - - - - - - - - 7 411,501 131,667
Malta 5 1,635 489 1 454 136 68 3,621,395 2,098,315 358 8,543,055 3,924,072 113 1,709,478 768,174 2,918 19,693,377 9,738,059
Marshall Islands - - - - - - 5 152,925 68,734 172 3,571,319 1,591,547 57 1,227,983 543,409 461 19,957,978 8,516,747
Moldovia - - - - - - - - - 6 20,735 7,016 - - - 44 143,172 62,316
Mongolia 1 625 188 - - - - - - - - - - - - 0 0 0
Morocco - - - - - - - - - 39 230,765 102,854 - - - 12 100,126 40,961
Netherlands - - - - - - 2 111,638 52,558 55 419,751 213,465 3 10,673 3,898 138 748,775 316,986
Netherlands Antilles - - - - - - 1 33,933 16,028 4 5,871 3,152 - - - 19 145,617 72,654
Norfolk Island - - - - - - - - - - - - - - - 3 288,459 91,074
Norway - - - - - - - - - 3 97,371 30,117 8 384,957 193,408 133 5,546,612 2,347,890
Norwegian International Ship Register - - - - - - - - - - - - 1 24,242 10,125 18 951,392 468,928
Pakistan - - - - - - - - - - - - - - - 1 29,365 17,592
Panama 1 294 89 1 1,176 352 37 4,276,849 3,366,048 83 1,037,282 415,448 15 313,296 139,405 578 12,053,370 6,201,105
Philippines - - - - - - - - - 1 45,796 13,739 1 20,058 8,489 13 291,067 153,657
Poland - - - - - - - - - 1 1,545 511 - - - 6 9,745 3,536
Portugal - - - 2 450 450 17 426,717 183,875 1 4,180 2,108 1 3,430 1,029 33 273,944 130,918
Qatar 1 1,706 511 - - - - - - - - - - - - 3 194,265 114,324
Republic of Ireland - - - - - - - - - 2 10,598 5,174 - - - 8 63,563 32,808
Russia - - - - - - - - - 1 2,968 961 5 22,336 6,763 27 166,630 66,228
Saudi Arabia - - - - - - - - - - - - 10 295,849 120,773 7 207,110 84,579
Seychelles - - - - - - - - - - - - - - - 10 236,146 102,568
Sierra Leone - - - 2 991 296 - - - - - - - - - 11 38,883 18,886
Singapore - - - - - - - - - 26 1,164,184 538,053 10 161,924 78,701 130 2,661,203 1,312,951
Slovakia - - - - - - - - - - - - - - - 17 38,149 23,150
Slovenia - - - - - - - - - 1 2,061 1,161 - - - 2 4,122 2,322
Spain - - - 14 1,521 841 - - - - - - - - - 17 904,105 369,885
Sri Lanka - - - - - - - - - - - - - - - 2 1,916 758
St. Kitts-Nevis - - - - - - - - - - - - - - - 10 68,738 24,976
St. Vincent and Grenadines - - - - - - - - - 18 84,159 38,350 - - - 129 670,315 352,249
Swaziland - - - - - - - - - - - - - - - 1 12,776 6,673
Sweden 1 375 375 - - - - - - - - - - - - 7 8,246 2,471
Switzerland - - - - - - - - - 1 28,911 15,023 - - - 2 7,954 2,386
Syria - - - - - - - - - - - - - - - 4 33,462 17,769
Tanzania - - - - - - - - - - - - - - - 22 64,834 33,373
Thailand - - - - - - - - - - - - - - - 3 35,117 15,750
Togo - - - - - - - - - - - - - - - 9 66,140 34,990
Tunisia - - - 1 249 74 - - - - - - - - - 1 1,972 1,395
Turkey - - - 1 291 87 - - - 106 896,571 384,378 10 45,163 21,888 210 1,192,100 631,550
Tuvalu - - - - - - - - - - - - - - - 1 10,022 6,081
UK 7 12,589 3,772 18 3,708 1,098 4 211,189 112,915 115 8,436,493 4,512,248 4 94,246 46,031 108 1,787,260 718,737
USA - - - - - - - - - 10 467,765 206,212 - - - 34 1,377,009 563,510
Ukraine - - - - - - - - - 8 23,816 11,920 - - - 27 144,728 72,766
United Arab Emirates - - - - - - - - - - - - 2 6,756 2,028 24 116,265 42,142
Vanuatu - - - - - - - - - - - - - - - 19 186,772 56,030
Wallis and Futuna - - - - - - 15 73,011 29,717 - - - - - - 1 1,189 955
Total 46 69,150 20,862 297 74,252 31,765 317 18,852,544 12,384,053 2,551 66,161,907 32,211,964 572 10,212,234 4,524,402 7,948 133,167,342 63,548,000
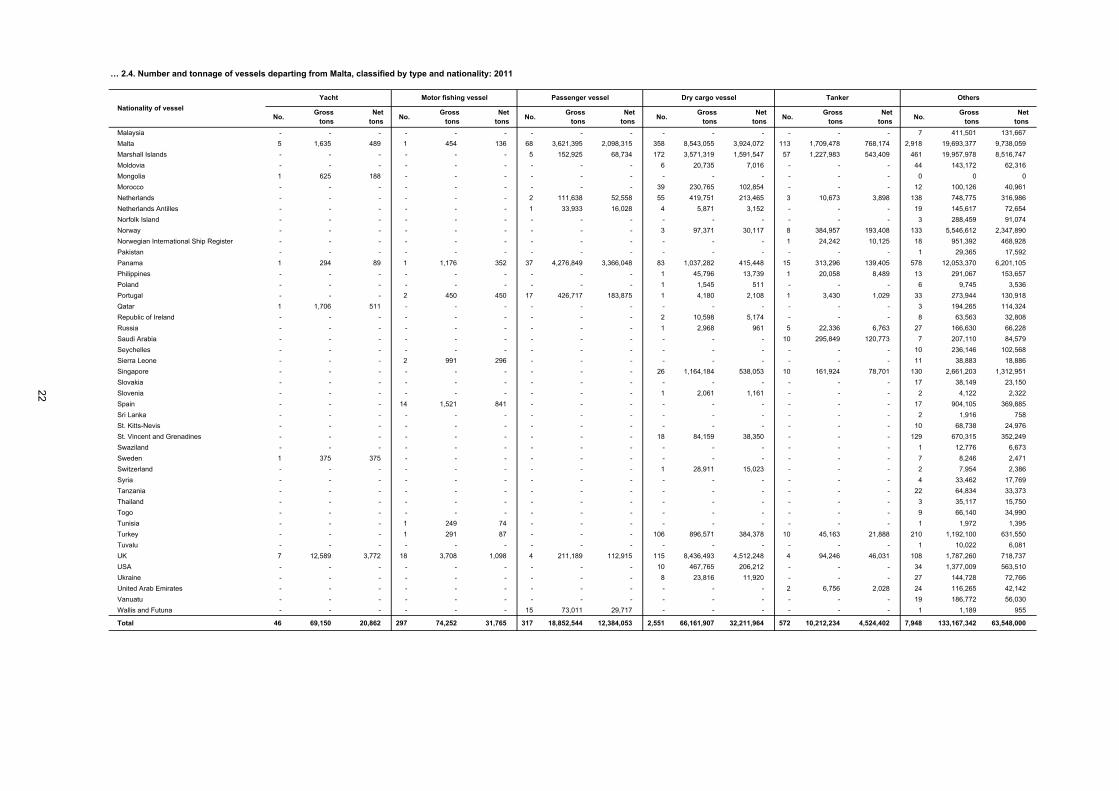
… 2.4. Number and tonnage of vessels departing from Malta, classified by type and nationality: 2011
Nationality of vessel
Yacht Motor fishing vessel Passenger vessel Dry cargo vessel Tanker Others
22
No. Gross tons Net tons Crews No. Net tons No. Net tons No. Gross tons Net tons Crews No. Net tons No. Net tons
Albania 2 4,410 2,718 - - - 2 2,718 2 4,410 2,718 - - - 2 2,718
Algeria 11 358,003 121,060 - - - 11 121,060 9 357,597 120,872 - - - 9 120,872
Anguilla 1 4,028 2,218 - - - 1 2,218 1 4,028 2,218 - - - 1 2,218
Antigua and Barbuda 798 5,851,662 2,804,720 - 485 1,959,396 313 845,324 797 5,841,078 2,799,453 - 485 1,959,396 312 840,057
Argentina 2 11,100 6,162 - - - 2 6,162 4 23,256 11,794 - - - 4 11,794
Austria 1 2,449 1,380 - 1 1,380 - - 1 2,449 1,380 - 1 1,380 - -
Bahamas 275 9,009,406 4,744,228 - 81 1,306,376 194 3,437,852 275 9,009,406 4,744,228 - 81 1,306,376 194 3,437,852
Barbados 30 672,347 338,943 - 20 265,952 10 72,991 30 672,347 338,943 - 20 265,952 10 72,991
Belgium 6 17,116 7,630 - 2 4,505 4 3,125 6 17,116 7,630 - 2 4,505 4 3,125
Belize 133 940,749 454,594 - 51 82,997 82 371,597 133 937,514 452,982 - 52 83,800 81 369,182
Bermuda 32 1,625,880 651,968 - 4 74,575 28 577,393 31 1,595,603 640,487 - 4 74,575 27 565,912
Bolivia 1 1,746 970 - - - 1 970 1 1,746 970 - - - 1 970
Brazil 1 28,347 15,151 - - - 1 15,151 1 28,347 15,151 - - - 1 15,151
Bulgaria 11 158,611 83,175 - - - 11 83,175 11 158,611 83,175 - - - 11 83,175
Cambodia 15 46,666 24,595 - 1 1,034 14 23,561 15 46,666 24,595 - 1 1,034 14 23,561
Canada 3 14,295 1 - - - 3 1 3 14,295 1 - - - 3 1
Cayman Islands 34 458,748 215,382 - 5 76,077 29 139,305 32 454,762 214,187 - 5 76,077 27 138,110
China 11 456,828 226,771 - - - 11 226,771 11 456,828 226,771 - - - 11 226,771
Comoros 21 39,038 19,887 - 7 3,991 14 15,896 21 39,038 19,887 - 7 3,991 14 15,896
Cook Islands 2 4,599 2,397 - - - 2 2,397 2 4,599 2,397 - - - 2 2,397
Croatia 21 445,213 229,000 - 5 10,814 16 218,186 21 445,213 229,000 - 5 10,814 16 218,186
Cyprus 331 5,691,888 2,821,535 - 106 1,204,566 225 1,616,969 332 5,704,514 2,825,321 - 106 1,204,566 226 1,620,755
Denmark 151 3,385,125 1,468,746 - 28 296,136 123 1,172,610 152 3,385,547 1,468,872 - 28 296,136 124 1,172,736
Dominica 21 1,179,128 673,664 - - - 21 673,664 21 1,179,128 673,664 - - - 21 673,664
Egypt 22 165,872 62,620 - - - 22 62,620 21 166,408 62,698 - - - 21 62,698
Faroe Islands 6 3,013 954 - - - 6 954 6 3,013 954 - - - 6 954
Finland 6 94,796 20,783 - - - 6 20,783 6 94,796 20,783 - - - 6 20,783
France 188 9,416,725 4,792,788 - 85 4,088,056 103 704,732 187 9,393,477 4,782,869 - 84 4,078,137 103 704,732
French Guiana 1 3,504 1,051 - - - 1 1,051 1 3,504 1,051 - - - 1 1,051
French Southern Territories 1 97,000 29,100 - - - 1 29,100 1 97,000 29,100 - - - 1 29,100
Georgia 35 135,986 69,265 - 3 2,100 32 67,165 35 135,986 69,265 - 3 2,100 32 67,165
Germany 169 4,380,702 2,136,138 - 121 1,781,385 48 354,753 169 4,380,702 2,136,138 - 121 1,781,385 48 354,753
Gibraltar 90 1,438,496 669,506 - 23 393,952 67 275,554 89 1,434,681 667,477 - 23 393,952 66 273,525
Greece 201 8,073,546 4,438,157 - 36 481,285 165 3,956,872 200 8,036,027 4,415,553 - 36 481,285 164 3,934,268
Honduras 4 3,656 2,253 - 1 1,999 3 254 3 3,554 2,151 - 1 1,999 2 152
Hong Kong 127 4,667,121 2,499,016 - 36 630,969 91 1,868,047 127 4,667,121 2,499,016 - 36 630,969 91 1,868,047
Iceland 5 6,070 1,820 - - - 5 1,820 5 6,070 1,820 - - - 5 1,820
India 20 945,129 512,882 - - - 20 512,882 20 945,129 512,882 - - - 20 512,882
Indonesia 1 7,717 2,697 - - - 1 2,697 1 7,717 2,697 - - - 1 2,697
Iran 3 78,463 39,744 - 3 39,744 - - 3 78,463 39,744 - 3 39,744 - -
Isle of Man 94 2,654,490 1,310,622 - 22 138,871 72 1,171,751 96 2,719,288 1,345,116 - 22 138,871 74 1,206,245
Israel 4 9,456 5,284 - 1 1,321 3 3,963 4 9,456 5,284 - 1 1,321 3 3,963
Italy 1,056 25,933,805 12,324,136 - 363 3,185,596 693 9,138,540 1,057 25,936,532 12,311,667 - 365 3,205,595 692 9,106,072
Kazakhstan 3 2,370 1,289 - - - 3 1,289 3 2,370 1,289 - - - 3 1,289
Korea, North 3 38,329 24,543 - - - 3 24,543 3 38,329 24,543 - - - 3 24,543
Korea, South 8 46,877 20,952 - - - 8 20,952 8 46,970 20,924 - - - 8 20,924
Latvia 10 39,872 15,233 - - - 10 15,233 10 39,872 15,233 - - - 10 15,233
Lebanon 15 92,075 48,480 - - - 15 48,480 15 92,075 48,480 - - - 15 48,480
Liberia 821 29,471,582 15,410,642 - 314 6,598,529 507 8,812,113 823 29,551,466 15,452,573 - 314 6,598,529 509 8,854,044
Libya 104 283,954 134,440 - 1 12,017 103 122,423 105 283,904 134,323 - 1 12,017 104 122,306
Lithuania 15 56,719 28,521 - 7 3,879 8 24,642 15 56,719 28,521 - 7 3,879 8 24,642
In ballast
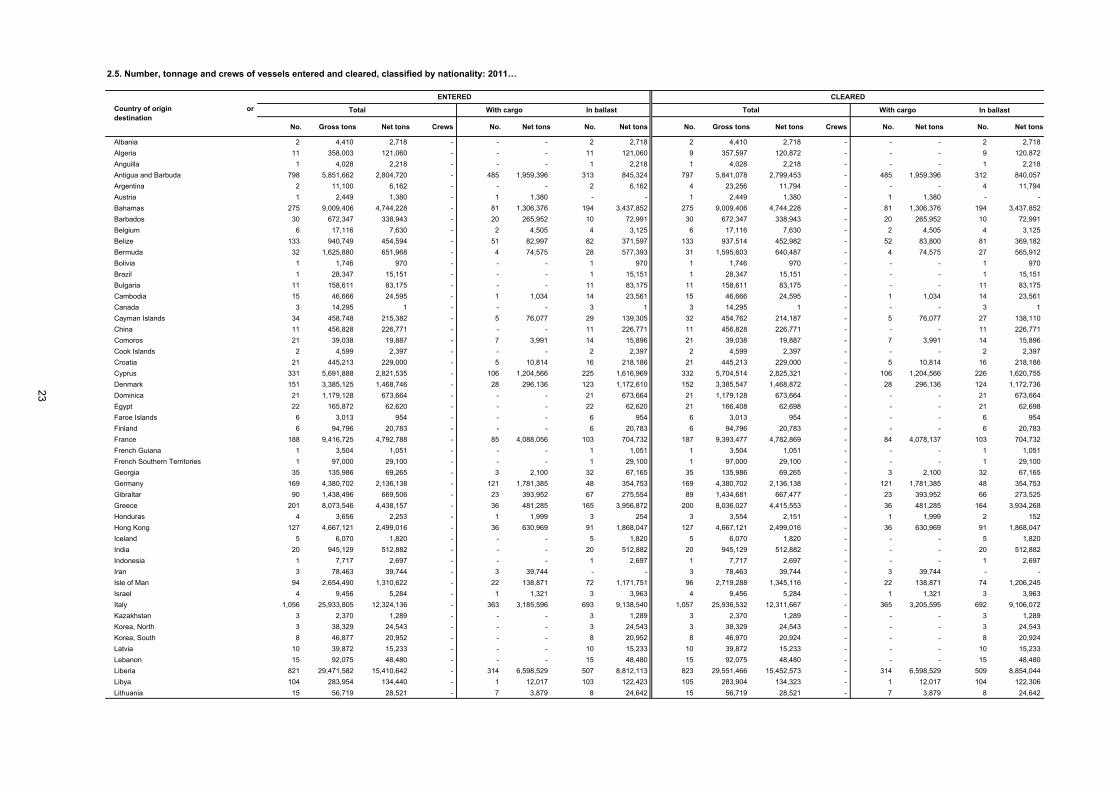
2.5. Number, tonnage and crews of vessels entered and cleared, classified by nationality: 2011…
Country of origin or destination
ENTERED CLEARED
Total With cargo In ballast Total With cargo
23
No. Gross tons Net tons Crews No. Net tons No. Net tons No. Gross tons Net tons Crews No. Net tons No. Net tons
Luxembourg 118 623,862 275,974 - 57 115,515 61 160,459 117 619,785 274,162 - 56 113,703 61 160,459
Madagascar 1 1,525 459 - - - 1 459 1 1,525 459 - - - 1 459
Madeira 2 6,593 2,648 - 2 2,648 - - 2 6,593 2,648 - 2 2,648 - -
Malaysia 7 411,501 131,667 - - - 7 131,667 7 411,501 131,667 - - - 7 131,667
Malta 3,476 33,541,456 16,509,525 - 457 4,659,276 3,019 11,850,249 3,463 33,569,394 16,529,245 - 471 4,692,246 2,992 11,836,999
Marshall Islands 697 24,917,199 10,723,125 - 231 2,147,714 466 8,575,411 695 24,910,205 10,720,437 - 229 2,134,956 466 8,585,481
Moldovia 50 163,907 69,332 - 6 7,016 44 62,316 50 163,907 69,332 - 6 7,016 44 62,316
Mongolia 1 625 188 - - - 1 188 1 625 188 - - - 1 188
Morocco 51 330,891 143,815 - 39 102,854 12 40,961 51 330,891 143,815 - 39 102,854 12 40,961
Netherlands 198 1,293,391 587,675 - 58 217,363 140 370,312 198 1,290,837 586,907 - 58 217,363 140 369,544
Netherlands Antilles 24 185,421 91,834 - 4 3,152 20 88,682 24 185,421 91,834 - 4 3,152 20 88,682
Norfolk Island 3 288,459 91,074 - - - 3 91,074 3 288,459 91,074 - - - 3 91,074
Norway 142 6,022,597 2,569,497 - 10 222,465 132 2,347,032 144 6,028,940 2,571,415 - 11 223,525 133 2,347,890
Norwegian International Ship Register 19 975,634 479,053 - 1 10,125 18 468,928 19 975,634 479,053 - 1 10,125 18 468,928
Pakistan 1 29,365 17,592 - - - 1 17,592 1 29,365 17,592 - - - 1 17,592
Panama 718 17,734,217 10,157,910 - 97 543,264 621 9,614,646 715 17,682,267 10,122,447 - 98 554,853 617 9,567,594
Philippines 15 356,921 175,885 - 2 22,228 13 153,657 15 356,921 175,885 - 2 22,228 13 153,657
Poland 7 11,290 4,047 - 1 511 6 3,536 7 11,290 4,047 - 1 511 6 3,536
Portugal 54 708,721 318,380 - 2 3,137 52 315,243 54 708,721 318,380 - 2 3,137 52 315,243
Qatar 4 195,971 114,835 - - - 4 114,835 4 195,971 114,835 - - - 4 114,835
Republic of Ireland 9 68,862 35,395 - 2 5,174 7 30,221 10 74,161 37,982 - 2 5,174 8 32,808
Russia 34 214,059 72,879 - 6 7,724 28 65,155 33 191,934 73,952 - 6 7,724 27 66,228
Saudi Arabia 17 502,959 205,352 - 10 120,773 7 84,579 17 502,959 205,352 - 10 120,773 7 84,579
Seychelles 10 236,146 102,568 - - - 10 102,568 10 236,146 102,568 - - - 10 102,568
Sierra Leone 13 39,632 19,145 - - - 13 19,145 13 39,874 19,182 - - - 13 19,182
Singapore 165 3,986,264 1,929,391 - 36 616,754 129 1,312,637 166 3,987,311 1,929,705 - 36 616,754 130 1,312,951
Slovakia 17 38,149 23,150 - - - 17 23,150 17 38,149 23,150 - - - 17 23,150
Slovenia 3 6,183 3,483 - 1 1,161 2 2,322 3 6,183 3,483 - 1 1,161 2 2,322
Spain 30 905,508 370,691 - - - 30 370,691 31 905,626 370,726 - - - 31 370,726
Sri Lanka 2 1,916 758 - - - 2 758 2 1,916 758 - - - 2 758
St. Kitts-Nevis 10 68,738 24,976 - - - 10 24,976 10 68,738 24,976 - - - 10 24,976
St. Vincent and Grenadines 147 758,530 392,787 - 18 38,350 129 354,437 147 754,474 390,599 - 18 38,350 129 352,249
Swaziland 1 12,776 6,673 - - - 1 6,673 1 12,776 6,673 - - - 1 6,673
Sweden 8 8,621 2,846 - - - 8 2,846 8 8,621 2,846 - - - 8 2,846
Switzerland 3 36,865 17,409 - 1 15,023 2 2,386 3 36,865 17,409 - 1 15,023 2 2,386
Syria 4 33,462 17,769 - - - 4 17,769 4 33,462 17,769 - - - 4 17,769
Tanzania 22 64,834 33,373 - - - 22 33,373 22 64,834 33,373 - - - 22 33,373
Thailand 3 35,117 15,750 - - - 3 15,750 3 35,117 15,750 - - - 3 15,750
Togo 9 66,140 34,990 - - - 9 34,990 9 66,140 34,990 - - - 9 34,990
Tunisia 2 2,221 1,469 - - - 2 1,469 2 2,221 1,469 - - - 2 1,469
Turkey 327 2,137,001 1,039,369 - 117 411,068 210 628,301 327 2,134,125 1,037,903 - 116 406,266 211 631,637
Tuvalu 1 10,022 6,081 - - - 1 6,081 1 10,022 6,081 - - - 1 6,081
UK 258 10,531,467 5,389,947 - 118 4,548,153 140 841,794 256 10,545,485 5,394,801 - 119 4,558,279 137 836,522
USA 44 1,844,774 769,722 - 10 206,212 34 563,510 44 1,844,774 769,722 - 10 206,212 34 563,510
Ukraine 35 168,544 84,686 - 8 11,920 27 72,766 35 168,544 84,686 - 8 11,920 27 72,766
United Arab Emirates 26 123,021 44,170 - 2 2,028 24 42,142 26 123,021 44,170 - 2 2,028 24 42,142
Vanuatu 19 190,813 57,243 - - - 19 57,243 19 186,772 56,030 - - - 19 56,030
Wallis and Futuna 16 74,200 30,672 - - - 16 30,672 16 74,200 30,672 - - - 16 30,672
Total 11,749 228,521,077 112,717,070 - 3,108 36,689,110 8,641 76,027,960 11,731 228,537,429 112,721,046 - 3,123 36,736,366 8,608 75,984,680
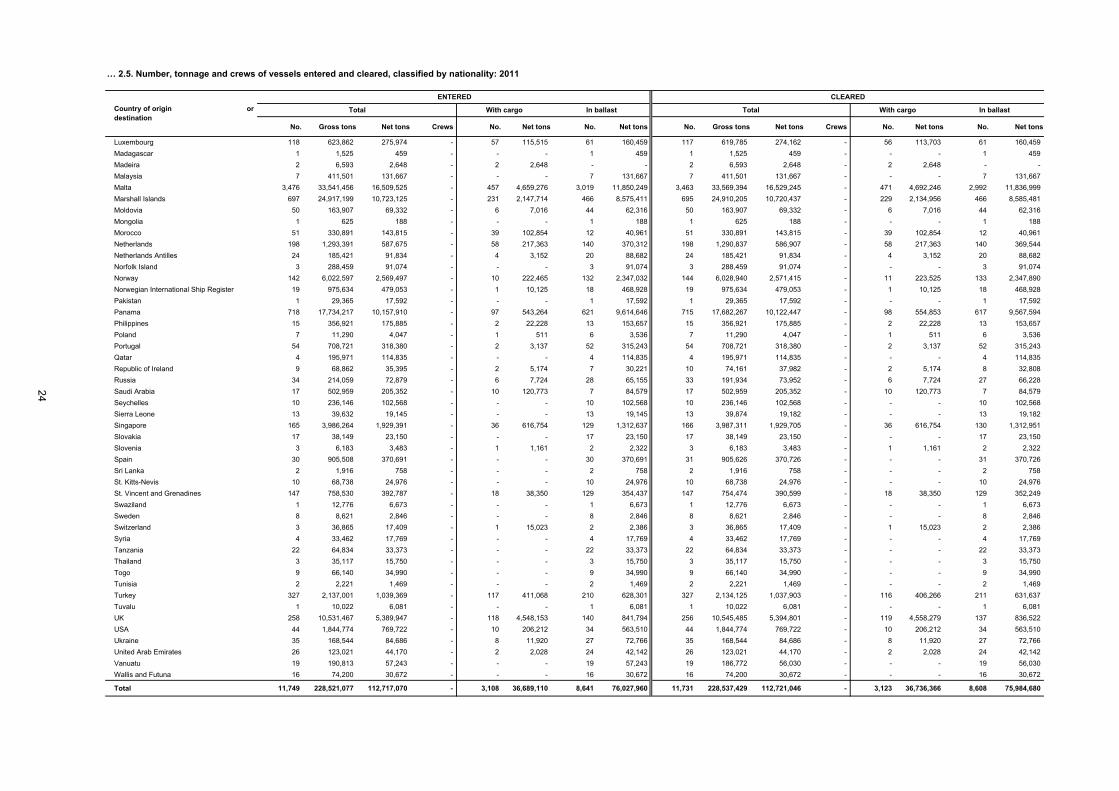
… 2.5. Number, tonnage and crews of vessels entered and cleared, classified by nationality: 2011
Country of origin or destination
ENTERED CLEARED
Total With cargo In ballast Total With cargo In ballast
24
No. Net tons No. Net tons No. Net tons No. Net tons
Albania Durres 36 111,861 15 42,048 14 49,324 8 17,956
Vlore 7 45,592 8 44,575 1 8,445 4 10,439
Algeria Bethoula - - 3 71,014 - - 1 30,717
Djen Djen - - 3 11,106 2 33,691 6 65,989
Marsa El Kebir 1 3,340 - - - - - -
Algiers 132 630,750 21 231,284 122 592,261 15 62,832
Annaba 46 176,578 32 115,208 32 106,661 24 57,935
Arzew - - 17 272,619 1 30,821 18 423,450
Bejaia 46 222,457 31 182,904 55 263,686 44 181,867
Ghazaouet 5 20,949 1 893 - - - -
Jijel - - 1 1,164 - - - -
Mostaganem - - 6 19,154 8 52,301 4 4,971
Oran 24 116,867 4 32,390 34 156,514 15 21,345
Skikda 39 181,776 23 143,800 57 296,925 34 207,682
Tenes - - 5 8,996 - - 13 23,283
Angola Luanda - - - - 1 10,744 2 4,692
Namibe 1 8,673 - - - - - -
Argentina San Nicolas - - 3 31,599 1 920 1 885
Bahia Blanca - - 12 336,365 - - - -
Necochea - - - - - - 1 11,429
Parana - - - - - - 1 18,504
Recalada - - - - - - 1 23,033
Rosario - - 1 13,825 - - - -
San Lorenzo - - 2 34,382 - - - -
Australia Fremantle - - - - - - 1 3,152
Port Giles - - 1 18,159 - - - -
Yamba - - 1 12,086 - - - -
Bahamas Congo Town - - 1 50,676 - - 3 88,267
Eleuthera Island - - 2 10,172 - - - -
Freeport - - - - - - 1 33,762
Bangladesh Chalna - - - - - - 1 3,572
Chittagong - - - - - - 4 41,373
Belgium Antwerp 16 243,939 14 96,492 2 3,713 26 273,407
Genk - - - - - - 2 10,142
Ghent - - 8 68,861 - - 7 34,510
Olen - - 2 30,074 - - - -
Zeebrugge 11 777,876 3 140,466 - - 1 28,747
Benin Cotonou - - 1 8,832 2 36,195 5 57,947
Brazil Imbituba - - - - - - 3 46,476
Itaguai - - - - - - 1 57,703
Itaqui - - - - - - 1 29,322
Macapa - - - - - - 1 21,042
Maceio - - - - - - 1 6,457
Pecem - - - - - - 1 15,527
Praia Mole - - - - - - 1 25,830
Santarem - - - - - - 1 22,997
Trobetas - - 1 12,589 - - 1 25,484
Vitoria - - - - - - 1 14,924
Aratu - - - - - - 1 8,986
Fortaleza - - - - - - 1 9,842
Gebig - - - - - - 1 1,424
Itacoatiara - - 1 14,175 - - - -
Macau - - 1 6,784 - - - -
Paranagua - - 5 53,255 - - 1 10,435
Ponta da Madeira - - 1 59,287 - - 4 136,461
Rio de Janeiro - - 3 37,336 - - 3 127,430
Rio Grande - - 1 18,394 - - 1 25,484
Santos - - 7 91,989 - - 2 26,631
Sao Francisco - - - - - - 1 27,095
Tubarao - - 2 167,811 - - 1 25,920
Vila do Conde - - 2 12,042 - - 1 7,938
Bulgaria Burgas 6 31,518 9 99,053 2 12,399 5 11,730
Balchik 1 1,503 - - - - - -
Varna 43 161,213 17 134,999 13 48,404 9 36,845
2.6. Number and net tonnage of vessels entered and cleared classified by country and port of origin or destination: 2011 …
Country and port of origin or destination
ENTERED CLEARED
With cargo In ballast With cargo In ballast
25
No. Net tons No. Net tons No. Net tons No. Net tons
Cameroon Douala - - 1 14,134 - - 2 20,054
Canada Baie Cameau - - 1 23,174 - - - -
Canaport - - - - - - 3 160,130
Carbonear - - - - - - 1 55,378
Port Weller - - - - - - 1 10,279
St. Peter's - - - - 1 37,549 - -
Vancouver - - - - - - 1 19,231
Victoria (British Columbia) - - - - - - 1 3,617
Come by Chance - - 1 12,680 - - - -
Montreal - - 2 4,753 - - 4 41,731
Oshawa - - 1 9,695 - - - -
Port Cartier - - 1 59,287 - - 1 59,147
Quebec - - 3 71,343 - - 6 151,466
Sorel - - 3 21,116 - - 1 10,279
St. John's - - 1 12,369 - - - -
Cape Verde Cape Verde Island - - - - 3 31,809 - -
Palmeira - - - - - - 1 1,311
St. Nicholas - - 1 1,458 - - 2 4,741
St. Vincent - - - - - - 1 80
China Chiwan - - 1 75,419 - - - -
Dalian - - - - 1 59,901 1 22,199
Nanjing - - - - - - 1 8,411
Ningbo - - 1 1,535 - - 1 10,636
Shanghai - - 1 - - - - -
Colombia Barranquilla - - - - - - 1 6,784
Puerto Asis - - - - - - 1 25,329
Puerto Bolivar - - 1 3,230 - - 2 118,387
Comoros Moroni - - - - - - 1 3,614
Congo Pointe Noire - - - - 1 18,650 3 11,025
Croatia Adriatic - - - - - - 1 1,112
Bakar 1 10,195 1 1,161 - - 1 27,995
Togir - - 1 14,096 - - - -
Dubrovnik - - 5 63,227 - - 6 96,213
Korcula - - 1 2,297 - - 1 11,649
Mali Losinj - - 1 607 - - - -
Omisalj - - 1 8,727 - - - -
Ploce 3 6,272 10 131,893 5 18,399 4 14,453
Plomin - - 6 152,853 - - - -
Pula - - 4 25,191 - - 2 18,384
Rijeka 33 171,760 17 146,491 26 166,490 19 75,802
Rovinj - - 2 279 - - 2 279
Sibenik - - 3 13,633 - - 3 8,722
Split 9 11,018 5 17,707 9 37,221 11 80,787
Zadar 1 1,596 3 10,190 - - 3 839
Cuba Havana - - - - - - 1 455
Manzanillo - - - - - - 1 10,667
Cyprus Famagusta - - 3 3,807 - - 2 5,314
Kalecik - - - - - - 1 1,596
Larnaca 2 32,065 4 14,369 - - 8 12,443
Limassol 10 94,096 21 346,189 2 9,722 16 145,112
Moni Anchorage 1 10,107 - - - - - -
Offshore Cyprus - - - - 1 10,195 2 22,501
Teknecik - - 1 1,887 - - - -
Vassiliko Bay 2 21,258 - - - - 2 29,065
Denmark Aalborg - - - - - - 2 2,336
Aarhus - - - - - - 2 5,790
Copenhagen - - - - - - 1 2,039
Esbjerg - - 1 2,358 - - 3 2,509
Frederikshavn - - 1 32,751 - - - -
Frederiksvaerk 1 2,267 - - - - - -
Fredinka - - - - - - 1 10,452
Grenaa - - 1 12,316 - - - -
Hirtshals - - - - - - 1 353
Kalundborg - - - - - - 1 5,058
Koge - - - - - - 1 3,464
… 2.6. Number and net tonnage of vessels entered and cleared classified by country and port of origin or destination: 2011
Country and port of origin or destination
ENTERED CLEARED
With cargo In ballast With cargo In ballast
26
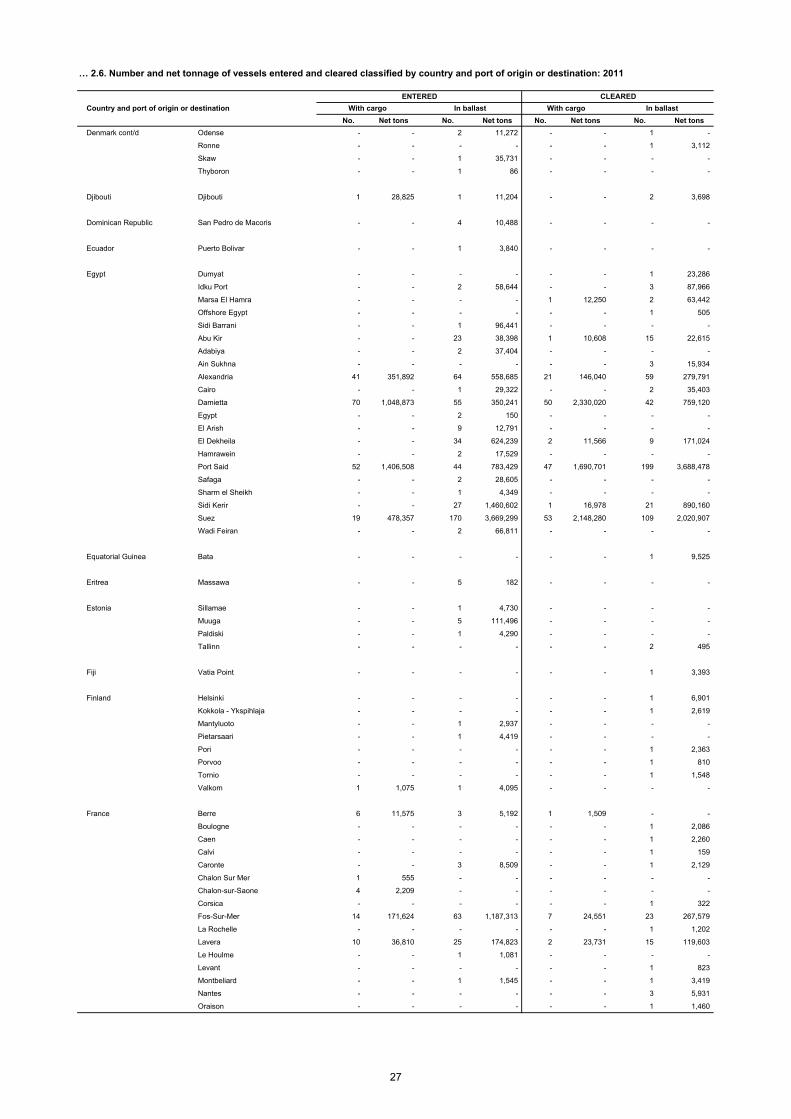
No. Net tons No. Net tons No. Net tons No. Net tons
Denmark cont/d Odense - - 2 11,272 - - 1 -
Ronne - - - - - - 1 3,112
Skaw - - 1 35,731 - - - -
Thyboron - - 1 86 - - - -
Djibouti Djibouti 1 28,825 1 11,204 - - 2 3,698
Dominican Republic San Pedro de Macoris - - 4 10,488 - - - -
Ecuador Puerto Bolivar - - 1 3,840 - - - -
Egypt Dumyat - - - - - - 1 23,286
Idku Port - - 2 58,644 - - 3 87,966
Marsa El Hamra - - - - 1 12,250 2 63,442
Offshore Egypt - - - - - - 1 505
Sidi Barrani - - 1 96,441 - - - -
Abu Kir - - 23 38,398 1 10,608 15 22,615
Adabiya - - 2 37,404 - - - -
Ain Sukhna - - - - - - 3 15,934
Alexandria 41 351,892 64 558,685 21 146,040 59 279,791
Cairo - - 1 29,322 - - 2 35,403
Damietta 70 1,048,873 55 350,241 50 2,330,020 42 759,120
Egypt - - 2 150 - - - -
El Arish - - 9 12,791 - - - -
El Dekheila - - 34 624,239 2 11,566 9 171,024
Hamrawein - - 2 17,529 - - - -
Port Said 52 1,406,508 44 783,429 47 1,690,701 199 3,688,478
Safaga - - 2 28,605 - - - -
Sharm el Sheikh - - 1 4,349 - - - -
Sidi Kerir - - 27 1,460,602 1 16,978 21 890,160
Suez 19 478,357 170 3,669,299 53 2,148,280 109 2,020,907
Wadi Feiran - - 2 66,811 - - - -
Equatorial Guinea Bata - - - - - - 1 9,525
Eritrea Massawa - - 5 182 - - - -
Estonia Sillamae - - 1 4,730 - - - -
Muuga - - 5 111,496 - - - -
Paldiski - - 1 4,290 - - - -
Tallinn - - - - - - 2 495
Fiji Vatia Point - - - - - - 1 3,393
Finland Helsinki - - - - - - 1 6,901
Kokkola - Ykspihlaja - - - - - - 1 2,619
Mantyluoto - - 1 2,937 - - - -
Pietarsaari - - 1 4,419 - - - -
Pori - - - - - - 1 2,363
Porvoo - - - - - - 1 810
Tornio - - - - - - 1 1,548
Valkom 1 1,075 1 4,095 - - - -
France Berre 6 11,575 3 5,192 1 1,509 - -
Boulogne - - - - - - 1 2,086
Caen - - - - - - 1 2,260
Calvi - - - - - - 1 159
Caronte - - 3 8,509 - - 1 2,129
Chalon Sur Mer 1 555 - - - - - -
Chalon-sur-Saone 4 2,209 - - - - - -
Corsica - - - - - - 1 322
Fos-Sur-Mer 14 171,624 63 1,187,313 7 24,551 23 267,579
La Rochelle - - - - - - 1 1,202
Lavera 10 36,810 25 174,823 2 23,731 15 119,603
Le Houlme - - 1 1,081 - - - -
Levant - - - - - - 1 823
Montbeliard - - 1 1,545 - - 1 3,419
Nantes - - - - - - 3 5,931
Oraison - - - - - - 1 1,460
… 2.6. Number and net tonnage of vessels entered and cleared classified by country and port of origin or destination: 2011
Country and port of origin or destination
ENTERED CLEARED
With cargo In ballast With cargo In ballast
27
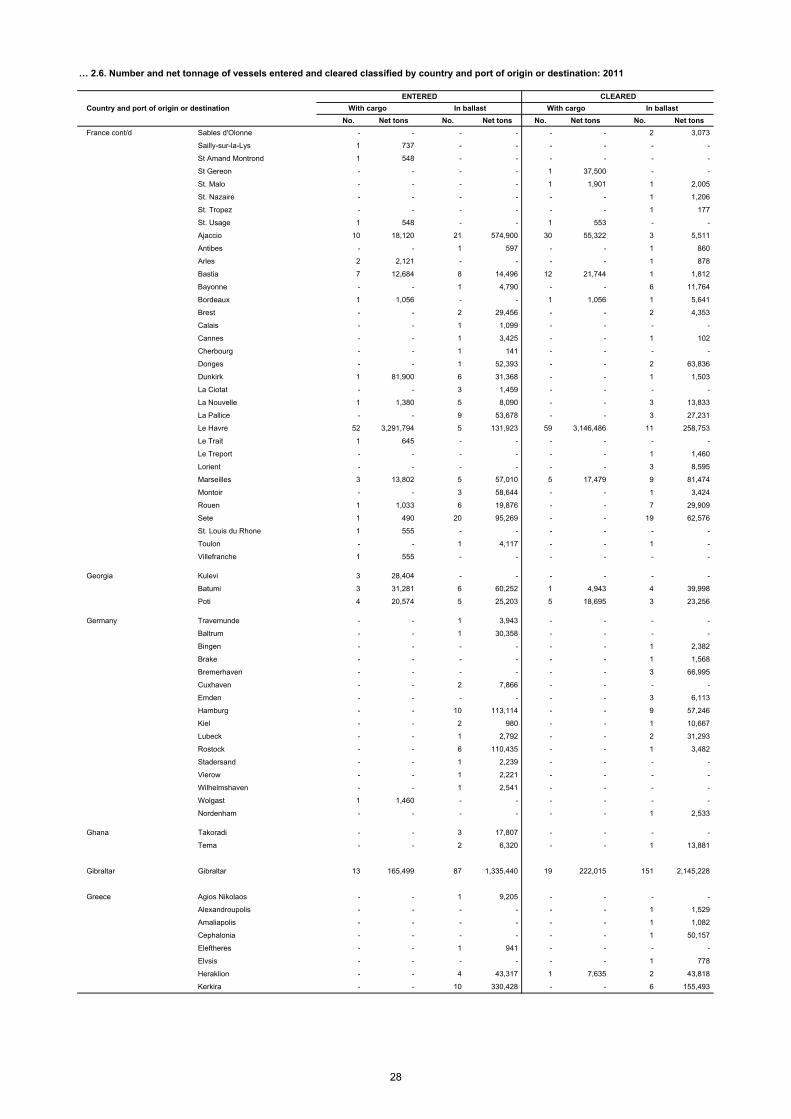
No. Net tons No. Net tons No. Net tons No. Net tons
France cont/d Sables d'Olonne - - - - - - 2 3,073
Sailly-sur-la-Lys 1 737 - - - - - -
St Amand Montrond 1 548 - - - - - -
St Gereon - - - - 1 37,500 - -
St. Malo - - - - 1 1,901 1 2,005
St. Nazaire - - - - - - 1 1,206
St. Tropez - - - - - - 1 177
St. Usage 1 548 - - 1 553 - -
Ajaccio 10 18,120 21 574,900 30 55,322 3 5,511
Antibes - - 1 597 - - 1 860
Arles 2 2,121 - - - - 1 878
Bastia 7 12,684 8 14,496 12 21,744 1 1,812
Bayonne - - 1 4,790 - - 6 11,764
Bordeaux 1 1,056 - - 1 1,056 1 5,641
Brest - - 2 29,456 - - 2 4,353
Calais - - 1 1,099 - - - -
Cannes - - 1 3,425 - - 1 102
Cherbourg - - 1 141 - - - -
Donges - - 1 52,393 - - 2 63,836
Dunkirk 1 81,900 6 31,368 - - 1 1,503
La Ciotat - - 3 1,459 - - - -
La Nouvelle 1 1,380 5 8,090 - - 3 13,833
La Pallice - - 9 53,678 - - 3 27,231
Le Havre 52 3,291,794 5 131,923 59 3,146,486 11 258,753
Le Trait 1 645 - - - - - -
Le Treport - - - - - - 1 1,460
Lorient - - - - - - 3 8,595
Marseilles 3 13,802 5 57,010 5 17,479 9 81,474
Montoir - - 3 58,644 - - 1 3,424
Rouen 1 1,033 6 19,876 - - 7 29,909
Sete 1 490 20 95,269 - - 19 62,576
St. Louis du Rhone 1 555 - - - - - -
Toulon - - 1 4,117 - - 1 -
Villefranche 1 555 - - - - - -
Georgia Kulevi 3 28,404 - - - - - -
Batumi 3 31,281 6 60,252 1 4,943 4 39,998
Poti 4 20,574 5 25,203 5 18,695 3 23,256
Germany Travemunde - - 1 3,943 - - - -
Baltrum - - 1 30,358 - - - -
Bingen - - - - - - 1 2,382
Brake - - - - - - 1 1,568
Bremerhaven - - - - - - 3 66,995
Cuxhaven - - 2 7,866 - - - -
Emden - - - - - - 3 6,113
Hamburg - - 10 113,114 - - 9 57,246
Kiel - - 2 980 - - 1 10,667
Lubeck - - 1 2,792 - - 2 31,293
Rostock - - 6 110,435 - - 1 3,482
Stadersand - - 1 2,239 - - - -
Vierow - - 1 2,221 - - - -
Wilhelmshaven - - 1 2,541 - - - -
Wolgast 1 1,460 - - - - - -
Nordenham - - - - - - 1 2,533
Ghana Takoradi - - 3 17,807 - - - -
Tema - - 2 6,320 - - 1 13,881
Gibraltar Gibraltar 13 165,499 87 1,335,440 19 222,015 151 2,145,228
Greece Agios Nikolaos - - 1 9,205 - - - -
Alexandroupolis - - - - - - 1 1,529
Amaliapolis - - - - - - 1 1,082
Cephalonia - - - - - - 1 50,157
Eleftheres - - 1 941 - - - -
Elvsis - - - - - - 1 778
Heraklion - - 4 43,317 1 7,635 2 43,818
Kerkira - - 10 330,428 - - 6 155,493
… 2.6. Number and net tonnage of vessels entered and cleared classified by country and port of origin or destination: 2011
Country and port of origin or destination
ENTERED CLEARED
With cargo In ballast With cargo In ballast
28
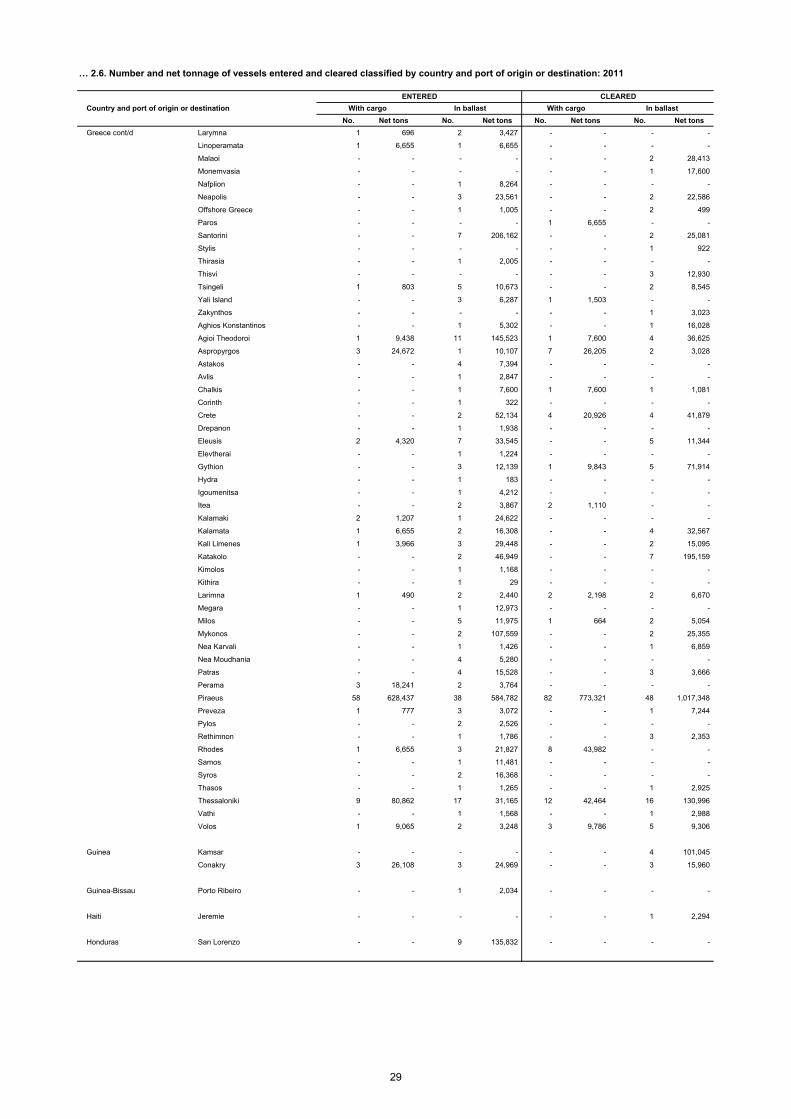
No. Net tons No. Net tons No. Net tons No. Net tons
Greece cont/d Larymna 1 696 2 3,427 - - - -
Linoperamata 1 6,655 1 6,655 - - - -
Malaoi - - - - - - 2 28,413
Monemvasia - - - - - - 1 17,600
Nafplion - - 1 8,264 - - - -
Neapolis - - 3 23,561 - - 2 22,586
Offshore Greece - - 1 1,005 - - 2 499
Paros - - - - 1 6,655 - -
Santorini - - 7 206,162 - - 2 25,081
Stylis - - - - - - 1 922
Thirasia - - 1 2,005 - - - -
Thisvi - - - - - - 3 12,930
Tsingeli 1 803 5 10,673 - - 2 8,545
Yali Island - - 3 6,287 1 1,503 - -
Zakynthos - - - - - - 1 3,023
Aghios Konstantinos - - 1 5,302 - - 1 16,028
Agioi Theodoroi 1 9,438 11 145,523 1 7,600 4 36,625
Aspropyrgos 3 24,672 1 10,107 7 26,205 2 3,028
Astakos - - 4 7,394 - - - -
Avlis - - 1 2,847 - - - -
Chalkis - - 1 7,600 1 7,600 1 1,081
Corinth - - 1 322 - - - -
Crete - - 2 52,134 4 20,926 4 41,879
Drepanon - - 1 1,938 - - - -
Eleusis 2 4,320 7 33,545 - - 5 11,344
Elevtherai - - 1 1,224 - - - -
Gythion - - 3 12,139 1 9,843 5 71,914
Hydra - - 1 183 - - - -
Igoumenitsa - - 1 4,212 - - - -
Itea - - 2 3,867 2 1,110 - -
Kalamaki 2 1,207 1 24,622 - - - -
Kalamata 1 6,655 2 16,308 - - 4 32,567
Kali Limenes 1 3,966 3 29,448 - - 2 15,095
Katakolo - - 2 46,949 - - 7 195,159
Kimolos - - 1 1,168 - - - -
Kithira - - 1 29 - - - -
Larimna 1 490 2 2,440 2 2,198 2 6,670
Megara - - 1 12,973 - - - -
Milos - - 5 11,975 1 664 2 5,054
Mykonos - - 2 107,559 - - 2 25,355
Nea Karvali - - 1 1,426 - - 1 6,859
Nea Moudhania - - 4 5,280 - - - -
Patras - - 4 15,528 - - 3 3,666
Perama 3 18,241 2 3,764 - - - -
Piraeus 58 628,437 38 584,782 82 773,321 48 1,017,348
Preveza 1 777 3 3,072 - - 1 7,244
Pylos - - 2 2,526 - - - -
Rethimnon - - 1 1,786 - - 3 2,353
Rhodes 1 6,655 3 21,827 8 43,982 - -
Samos - - 1 11,481 - - - -
Syros - - 2 16,368 - - - -
Thasos - - 1 1,265 - - 1 2,925
Thessaloniki 9 80,862 17 31,165 12 42,464 16 130,996
Vathi - - 1 1,568 - - 1 2,988
Volos 1 9,065 2 3,248 3 9,786 5 9,306
Guinea Kamsar - - - - - - 4 101,045
Conakry 3 26,108 3 24,969 - - 3 15,960
Guinea-Bissau Porto Ribeiro - - 1 2,034 - - - -
Haiti Jeremie - - - - - - 1 2,294
Honduras San Lorenzo - - 9 135,832 - - - -
… 2.6. Number and net tonnage of vessels entered and cleared classified by country and port of origin or destination: 2011
Country and port of origin or destination
ENTERED CLEARED
With cargo In ballast With cargo In ballast
29
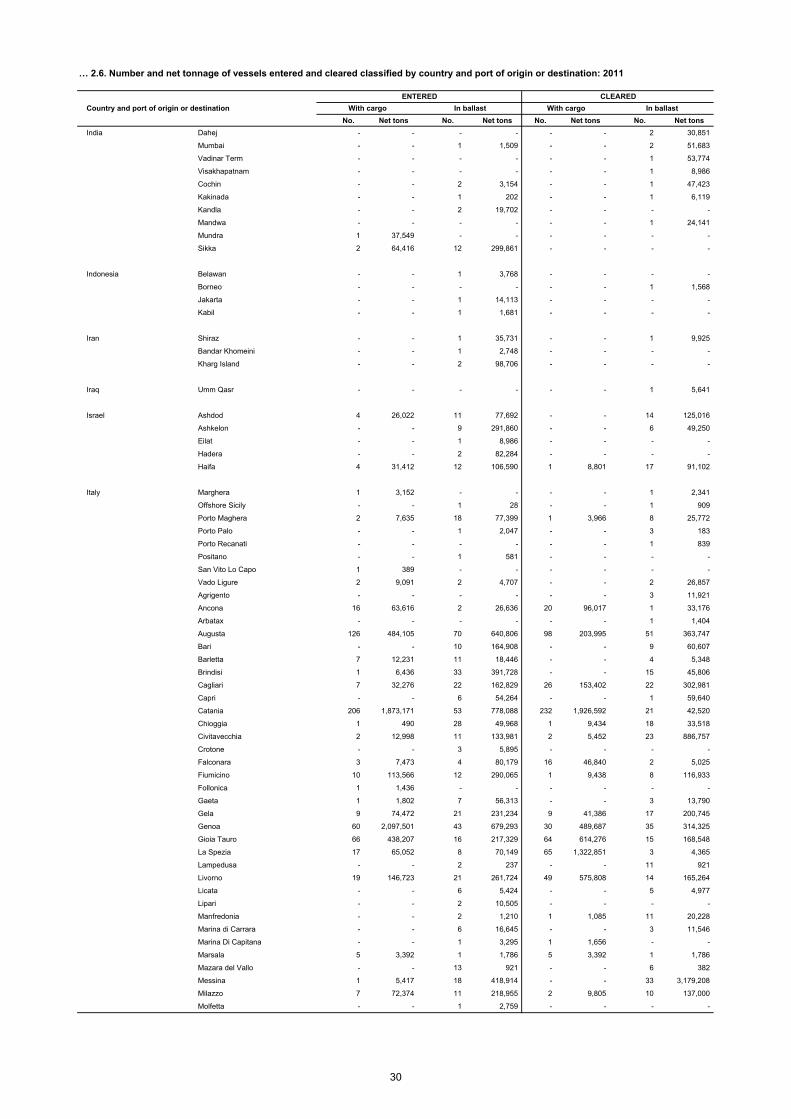
No. Net tons No. Net tons No. Net tons No. Net tons
India Dahej - - - - - - 2 30,851
Mumbai - - 1 1,509 - - 2 51,683
Vadinar Term - - - - - - 1 53,774
Visakhapatnam - - - - - - 1 8,986
Cochin - - 2 3,154 - - 1 47,423
Kakinada - - 1 202 - - 1 6,119
Kandla - - 2 19,702 - - - -
Mandwa - - - - - - 1 24,141
Mundra 1 37,549 - - - - - -
Sikka 2 64,416 12 299,861 - - - -
Indonesia Belawan - - 1 3,768 - - - -
Borneo - - - - - - 1 1,568
Jakarta - - 1 14,113 - - - -
Kabil - - 1 1,681 - - - -
Iran Shiraz - - 1 35,731 - - 1 9,925
Bandar Khomeini - - 1 2,748 - - - -
Kharg Island - - 2 98,706 - - - -
Iraq Umm Qasr - - - - - - 1 5,641
Israel Ashdod 4 26,022 11 77,692 - - 14 125,016
Ashkelon - - 9 291,860 - - 6 49,250
Eilat - - 1 8,986 - - - -
Hadera - - 2 82,284 - - - -
Haifa 4 31,412 12 106,590 1 8,801 17 91,102
Italy Marghera 1 3,152 - - - - 1 2,341
Offshore Sicily - - 1 28 - - 1 909
Porto Maghera 2 7,635 18 77,399 1 3,966 8 25,772
Porto Palo - - 1 2,047 - - 3 183
Porto Recanati - - - - - - 1 839
Positano - - 1 581 - - - -
San Vito Lo Capo 1 389 - - - - - -
Vado Ligure 2 9,091 2 4,707 - - 2 26,857
Agrigento - - - - - - 3 11,921
Ancona 16 63,616 2 26,636 20 96,017 1 33,176
Arbatax - - - - - - 1 1,404
Augusta 126 484,105 70 640,806 98 203,995 51 363,747
Bari - - 10 164,908 - - 9 60,607
Barletta 7 12,231 11 18,446 - - 4 5,348
Brindisi 1 6,436 33 391,728 - - 15 45,806
Cagliari 7 32,276 22 162,829 26 153,402 22 302,981
Capri - - 6 54,264 - - 1 59,640
Catania 206 1,873,171 53 778,088 232 1,926,592 21 42,520
Chioggia 1 490 28 49,968 1 9,434 18 33,518
Civitavecchia 2 12,998 11 133,981 2 5,452 23 886,757
Crotone - - 3 5,895 - - - -
Falconara 3 7,473 4 80,179 16 46,840 2 5,025
Fiumicino 10 113,566 12 290,065 1 9,438 8 116,933
Follonica 1 1,436 - - - - - -
Gaeta 1 1,802 7 56,313 - - 3 13,790
Gela 9 74,472 21 231,234 9 41,386 17 200,745
Genoa 60 2,097,501 43 679,293 30 489,687 35 314,325
Gioia Tauro 66 438,207 16 217,329 64 614,276 15 168,548
La Spezia 17 65,052 8 70,149 65 1,322,851 3 4,365
Lampedusa - - 2 237 - - 11 921
Livorno 19 146,723 21 261,724 49 575,808 14 165,264
Licata - - 6 5,424 - - 5 4,977
Lipari - - 2 10,505 - - - -
Manfredonia - - 2 1,210 1 1,085 11 20,228
Marina di Carrara - - 6 16,645 - - 3 11,546
Marina Di Capitana - - 1 3,295 1 1,656 - -
Marsala 5 3,392 1 1,786 5 3,392 1 1,786
Mazara del Vallo - - 13 921 - - 6 382
Messina 1 5,417 18 418,914 - - 33 3,179,208
Milazzo 7 72,374 11 218,955 2 9,805 10 137,000
Molfetta - - 1 2,759 - - - -
… 2.6. Number and net tonnage of vessels entered and cleared classified by country and port of origin or destination: 2011
Country and port of origin or destination
ENTERED CLEARED
With cargo In ballast With cargo In ballast
30
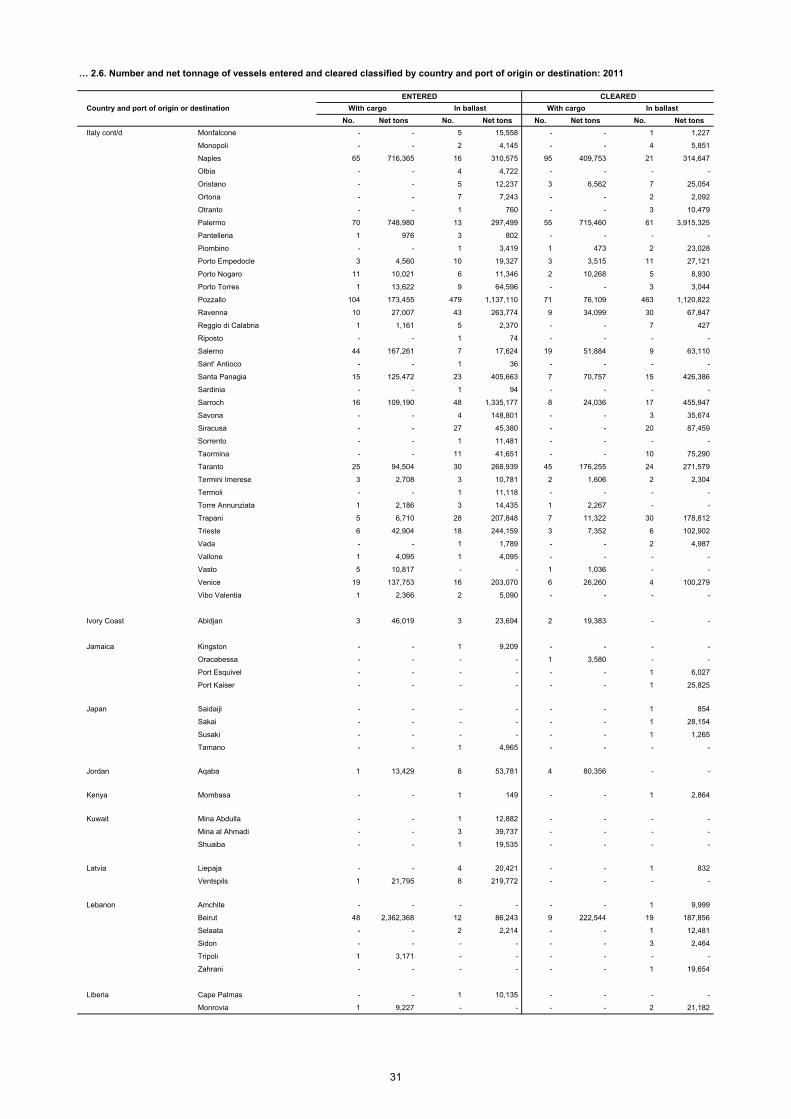
No. Net tons No. Net tons No. Net tons No. Net tons
Italy cont/d Monfalcone - - 5 15,558 - - 1 1,227
Monopoli - - 2 4,145 - - 4 5,851
Naples 65 716,365 16 310,575 95 409,753 21 314,647
Olbia - - 4 4,722 - - - -
Oristano - - 5 12,237 3 6,562 7 25,054
Ortona - - 7 7,243 - - 2 2,092
Otranto - - 1 760 - - 3 10,479
Palermo 70 748,980 13 297,499 55 715,460 61 3,915,325
Pantelleria 1 976 3 802 - - - -
Piombino - - 1 3,419 1 473 2 23,028
Porto Empedocle 3 4,560 10 19,327 3 3,515 11 27,121
Porto Nogaro 11 10,021 6 11,346 2 10,268 5 8,930
Porto Torres 1 13,622 9 64,596 - - 3 3,044
Pozzallo 104 173,455 479 1,137,110 71 76,109 463 1,120,822
Ravenna 10 27,007 43 263,774 9 34,099 30 67,847
Reggio di Calabria 1 1,161 5 2,370 - - 7 427
Riposto - - 1 74 - - - -
Salerno 44 167,261 7 17,624 19 51,884 9 63,110
Sant' Antioco - - 1 36 - - - -
Santa Panagia 15 125,472 23 405,663 7 70,757 15 426,386
Sardinia - - 1 94 - - - -
Sarroch 16 109,190 48 1,335,177 8 24,036 17 455,947
Savona - - 4 148,801 - - 3 35,674
Siracusa - - 27 45,380 - - 20 87,459
Sorrento - - 1 11,481 - - - -
Taormina - - 11 41,651 - - 10 75,290
Taranto 25 94,504 30 268,939 45 176,255 24 271,579
Termini Imerese 3 2,708 3 10,781 2 1,606 2 2,304
Termoli - - 1 11,118 - - - -
Torre Annunziata 1 2,186 3 14,435 1 2,267 - -
Trapani 5 6,710 28 207,848 7 11,322 30 178,812
Trieste 6 42,904 18 244,159 3 7,352 6 102,902
Vada - - 1 1,789 - - 2 4,987
Vallone 1 4,095 1 4,095 - - - -
Vasto 5 10,817 - - 1 1,036 - -
Venice 19 137,753 16 203,070 6 26,260 4 100,279
Vibo Valentia 1 2,366 2 5,090 - - - -
Ivory Coast Abidjan 3 46,019 3 23,694 2 19,383 - -
Jamaica Kingston - - 1 9,209 - - - -
Oracabessa - - - - 1 3,580 - -
Port Esquivel - - - - - - 1 6,027
Port Kaiser - - - - - - 1 25,825
Japan Saidaiji - - - - - - 1 854
Sakai - - - - - - 1 28,154
Susaki - - - - - - 1 1,265
Tamano - - 1 4,965 - - - -
Jordan Aqaba 1 13,429 8 53,781 4 80,356 - -
Kenya Mombasa - - 1 149 - - 1 2,864
Kuwait Mina Abdulla - - 1 12,882 - - - -
Mina al Ahmadi - - 3 39,737 - - - -
Shuaiba - - 1 19,535 - - - -
Latvia Liepaja - - 4 20,421 - - 1 832
Ventspils 1 21,795 8 219,772 - - - -
Lebanon Amchite - - - - - - 1 9,999
Beirut 48 2,362,368 12 86,243 9 222,544 19 187,856
Selaata - - 2 2,214 - - 1 12,481
Sidon - - - - - - 3 2,464
Tripoli 1 3,171 - - - - - -
Zahrani - - - - - - 1 19,654
Liberia Cape Palmas - - 1 10,135 - - - -
Monrovia 1 9,227 - - - - 2 21,182
… 2.6. Number and net tonnage of vessels entered and cleared classified by country and port of origin or destination: 2011
Country and port of origin or destination
ENTERED CLEARED
With cargo In ballast With cargo In ballast
31
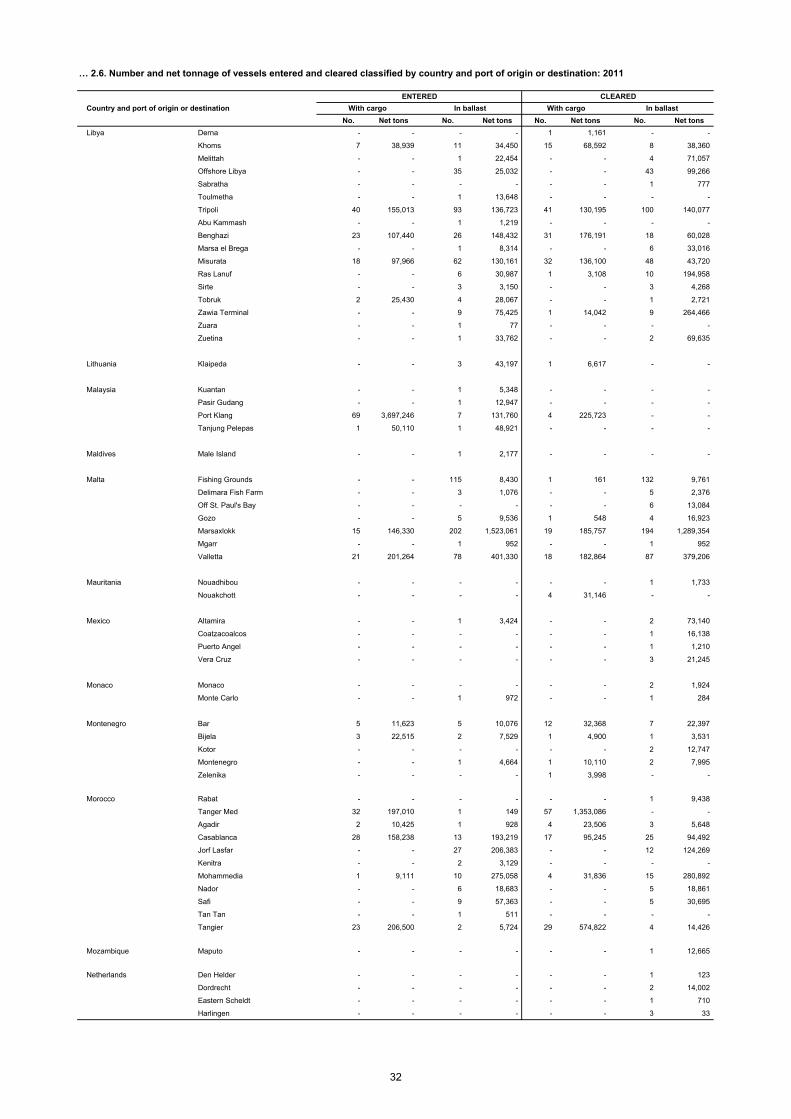
No. Net tons No. Net tons No. Net tons No. Net tons
Libya Derna - - - - 1 1,161 - -
Khoms 7 38,939 11 34,450 15 68,592 8 38,360
Melittah - - 1 22,454 - - 4 71,057
Offshore Libya - - 35 25,032 - - 43 99,266
Sabratha - - - - - - 1 777
Toulmetha - - 1 13,648 - - - -
Tripoli 40 155,013 93 136,723 41 130,195 100 140,077
Abu Kammash - - 1 1,219 - - - -
Benghazi 23 107,440 26 148,432 31 176,191 18 60,028
Marsa el Brega - - 1 8,314 - - 6 33,016
Misurata 18 97,966 62 130,161 32 136,100 48 43,720
Ras Lanuf - - 6 30,987 1 3,108 10 194,958
Sirte - - 3 3,150 - - 3 4,268
Tobruk 2 25,430 4 28,067 - - 1 2,721
Zawia Terminal - - 9 75,425 1 14,042 9 264,466
Zuara - - 1 77 - - - -
Zuetina - - 1 33,762 - - 2 69,635
Lithuania Klaipeda - - 3 43,197 1 6,617 - -
Malaysia Kuantan - - 1 5,348 - - - -
Pasir Gudang - - 1 12,947 - - - -
Port Klang 69 3,697,246 7 131,760 4 225,723 - -
Tanjung Pelepas 1 50,110 1 48,921 - - - -
Maldives Male Island - - 1 2,177 - - - -
Malta Fishing Grounds - - 115 8,430 1 161 132 9,761
Delimara Fish Farm - - 3 1,076 - - 5 2,376
Off St. Paul's Bay - - - - - - 6 13,084
Gozo - - 5 9,536 1 548 4 16,923
Marsaxlokk 15 146,330 202 1,523,061 19 185,757 194 1,289,354
Mgarr - - 1 952 - - 1 952
Valletta 21 201,264 78 401,330 18 182,864 87 379,206
Mauritania Nouadhibou - - - - - - 1 1,733
Nouakchott - - - - 4 31,146 - -
Mexico Altamira - - 1 3,424 - - 2 73,140
Coatzacoalcos - - - - - - 1 16,138
Puerto Angel - - - - - - 1 1,210
Vera Cruz - - - - - - 3 21,245
Monaco Monaco - - - - - - 2 1,924
Monte Carlo - - 1 972 - - 1 284
Montenegro Bar 5 11,623 5 10,076 12 32,368 7 22,397
Bijela 3 22,515 2 7,529 1 4,900 1 3,531
Kotor - - - - - - 2 12,747
Montenegro - - 1 4,664 1 10,110 2 7,995
Zelenika - - - - 1 3,998 - -
Morocco Rabat - - - - - - 1 9,438
Tanger Med 32 197,010 1 149 57 1,353,086 - -
Agadir 2 10,425 1 928 4 23,506 3 5,648
Casablanca 28 158,238 13 193,219 17 95,245 25 94,492
Jorf Lasfar - - 27 206,383 - - 12 124,269
Kenitra - - 2 3,129 - - - -
Mohammedia 1 9,111 10 275,058 4 31,836 15 280,892
Nador - - 6 18,683 - - 5 18,861
Safi - - 9 57,363 - - 5 30,695
Tan Tan - - 1 511 - - - -
Tangier 23 206,500 2 5,724 29 574,822 4 14,426
Mozambique Maputo - - - - - - 1 12,665
Netherlands Den Helder - - - - - - 1 123
Dordrecht - - - - - - 2 14,002
Eastern Scheldt - - - - - - 1 710
Harlingen - - - - - - 3 33
… 2.6. Number and net tonnage of vessels entered and cleared classified by country and port of origin or destination: 2011
Country and port of origin or destination
ENTERED CLEARED
With cargo In ballast With cargo In ballast
32
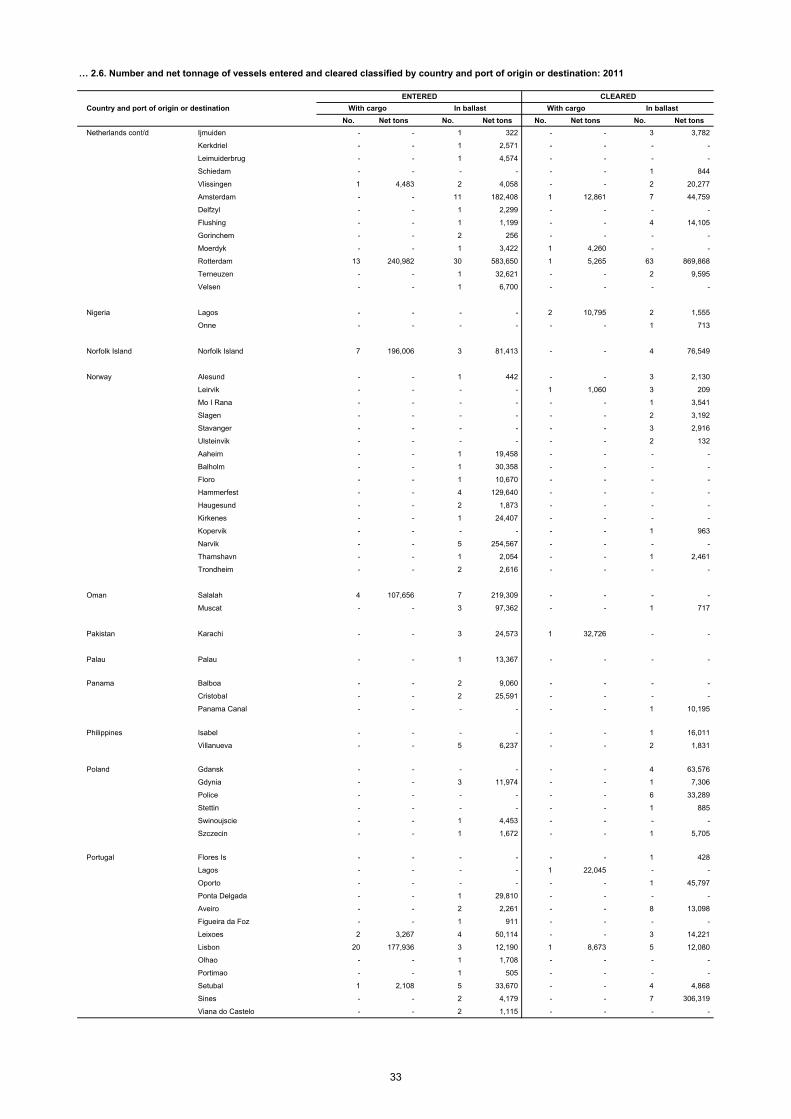
No. Net tons No. Net tons No. Net tons No. Net tons
Netherlands cont/d Ijmuiden - - 1 322 - - 3 3,782
Kerkdriel - - 1 2,571 - - - -
Leimuiderbrug - - 1 4,574 - - - -
Schiedam - - - - - - 1 844
Vlissingen 1 4,483 2 4,058 - - 2 20,277
Amsterdam - - 11 182,408 1 12,861 7 44,759
Delfzyl - - 1 2,299 - - - -
Flushing - - 1 1,199 - - 4 14,105
Gorinchem - - 2 256 - - - -
Moerdyk - - 1 3,422 1 4,260 - -
Rotterdam 13 240,982 30 583,650 1 5,265 63 869,868
Terneuzen - - 1 32,621 - - 2 9,595
Velsen - - 1 6,700 - - - -
Nigeria Lagos - - - - 2 10,795 2 1,555
Onne - - - - - - 1 713
Norfolk Island Norfolk Island 7 196,006 3 81,413 - - 4 76,549
Norway Alesund - - 1 442 - - 3 2,130
Leirvik - - - - 1 1,060 3 209
Mo I Rana - - - - - - 1 3,541
Slagen - - - - - - 2 3,192
Stavanger - - - - - - 3 2,916
Ulsteinvik - - - - - - 2 132
Aaheim - - 1 19,458 - - - -
Balholm - - 1 30,358 - - - -
Floro - - 1 10,670 - - - -
Hammerfest - - 4 129,640 - - - -
Haugesund - - 2 1,873 - - - -
Kirkenes - - 1 24,407 - - - -
Kopervik - - - - - - 1 963
Narvik - - 5 254,567 - - - -
Thamshavn - - 1 2,054 - - 1 2,461
Trondheim - - 2 2,616 - - - -
Oman Salalah 4 107,656 7 219,309 - - - -
Muscat - - 3 97,362 - - 1 717
Pakistan Karachi - - 3 24,573 1 32,726 - -
Palau Palau - - 1 13,367 - - - -
Panama Balboa - - 2 9,060 - - - -
Cristobal - - 2 25,591 - - - -
Panama Canal - - - - - - 1 10,195
Philippines Isabel - - - - - - 1 16,011
Villanueva - - 5 6,237 - - 2 1,831
Poland Gdansk - - - - - - 4 63,576
Gdynia - - 3 11,974 - - 1 7,306
Police - - - - - - 6 33,289
Stettin - - - - - - 1 885
Swinoujscie - - 1 4,453 - - - -
Szczecin - - 1 1,672 - - 1 5,705
Portugal Flores Is - - - - - - 1 428
Lagos - - - - 1 22,045 - -
Oporto - - - - - - 1 45,797
Ponta Delgada - - 1 29,810 - - - -
Aveiro - - 2 2,261 - - 8 13,098
Figueira da Foz - - 1 911 - - - -
Leixoes 2 3,267 4 50,114 - - 3 14,221
Lisbon 20 177,936 3 12,190 1 8,673 5 12,080
Olhao - - 1 1,708 - - - -
Portimao - - 1 505 - - - -
Setubal 1 2,108 5 33,670 - - 4 4,868
Sines - - 2 4,179 - - 7 306,319
Viana do Castelo - - 2 1,115 - - - -
… 2.6. Number and net tonnage of vessels entered and cleared classified by country and port of origin or destination: 2011
Country and port of origin or destination
ENTERED CLEARED
With cargo In ballast With cargo In ballast
33
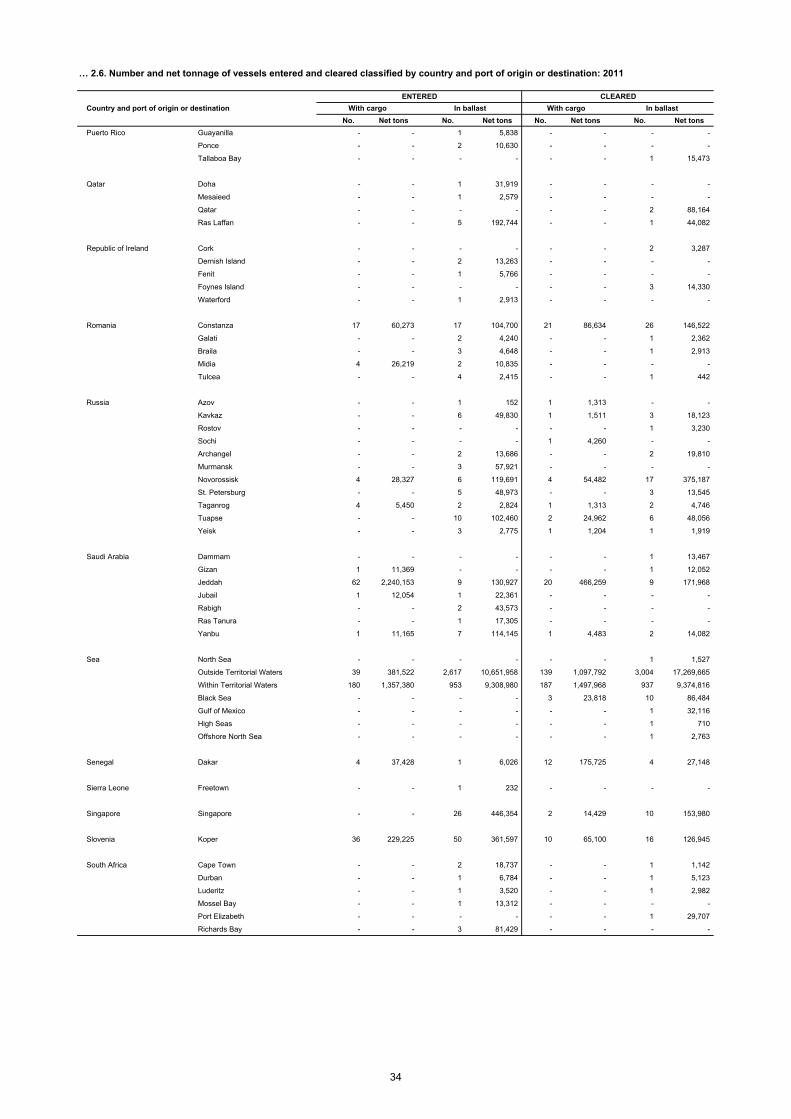
No. Net tons No. Net tons No. Net tons No. Net tons
Puerto Rico Guayanilla - - 1 5,838 - - - -
Ponce - - 2 10,630 - - - -
Tallaboa Bay - - - - - - 1 15,473
Qatar Doha - - 1 31,919 - - - -
Mesaieed - - 1 2,579 - - - -
Qatar - - - - - - 2 88,164
Ras Laffan - - 5 192,744 - - 1 44,082
Republic of Ireland Cork - - - - - - 2 3,287
Dernish Island - - 2 13,263 - - - -
Fenit - - 1 5,766 - - - -
Foynes Island - - - - - - 3 14,330
Waterford - - 1 2,913 - - - -
Romania Constanza 17 60,273 17 104,700 21 86,634 26 146,522
Galati - - 2 4,240 - - 1 2,362
Braila - - 3 4,648 - - 1 2,913
Midia 4 26,219 2 10,835 - - - -
Tulcea - - 4 2,415 - - 1 442
Russia Azov - - 1 152 1 1,313 - -
Kavkaz - - 6 49,830 1 1,511 3 18,123
Rostov - - - - - - 1 3,230
Sochi - - - - 1 4,260 - -
Archangel - - 2 13,686 - - 2 19,810
Murmansk - - 3 57,921 - - - -
Novorossisk 4 28,327 6 119,691 4 54,482 17 375,187
St. Petersburg - - 5 48,973 - - 3 13,545
Taganrog 4 5,450 2 2,824 1 1,313 2 4,746
Tuapse - - 10 102,460 2 24,962 6 48,056
Yeisk - - 3 2,775 1 1,204 1 1,919
Saudi Arabia Dammam - - - - - - 1 13,467
Gizan 1 11,369 - - - - 1 12,052
Jeddah 62 2,240,153 9 130,927 20 466,259 9 171,968
Jubail 1 12,054 1 22,361 - - - -
Rabigh - - 2 43,573 - - - -
Ras Tanura - - 1 17,305 - - - -
Yanbu 1 11,165 7 114,145 1 4,483 2 14,082
Sea North Sea - - - - - - 1 1,527
Outside Territorial Waters 39 381,522 2,617 10,651,958 139 1,097,792 3,004 17,269,665
Within Territorial Waters 180 1,357,380 953 9,308,980 187 1,497,968 937 9,374,816
Black Sea - - - - 3 23,818 10 86,484
Gulf of Mexico - - - - - - 1 32,116
High Seas - - - - - - 1 710
Offshore North Sea - - - - - - 1 2,763
Senegal Dakar 4 37,428 1 6,026 12 175,725 4 27,148
Sierra Leone Freetown - - 1 232 - - - -
Singapore Singapore - - 26 446,354 2 14,429 10 153,980
Slovenia Koper 36 229,225 50 361,597 10 65,100 16 126,945
South Africa Cape Town - - 2 18,737 - - 1 1,142
Durban - - 1 6,784 - - 1 5,123
Luderitz - - 1 3,520 - - 1 2,982
Mossel Bay - - 1 13,312 - - - -
Port Elizabeth - - - - - - 1 29,707
Richards Bay - - 3 81,429 - - - -
… 2.6. Number and net tonnage of vessels entered and cleared classified by country and port of origin or destination: 2011
Country and port of origin or destination
ENTERED CLEARED
With cargo In ballast With cargo In ballast
34
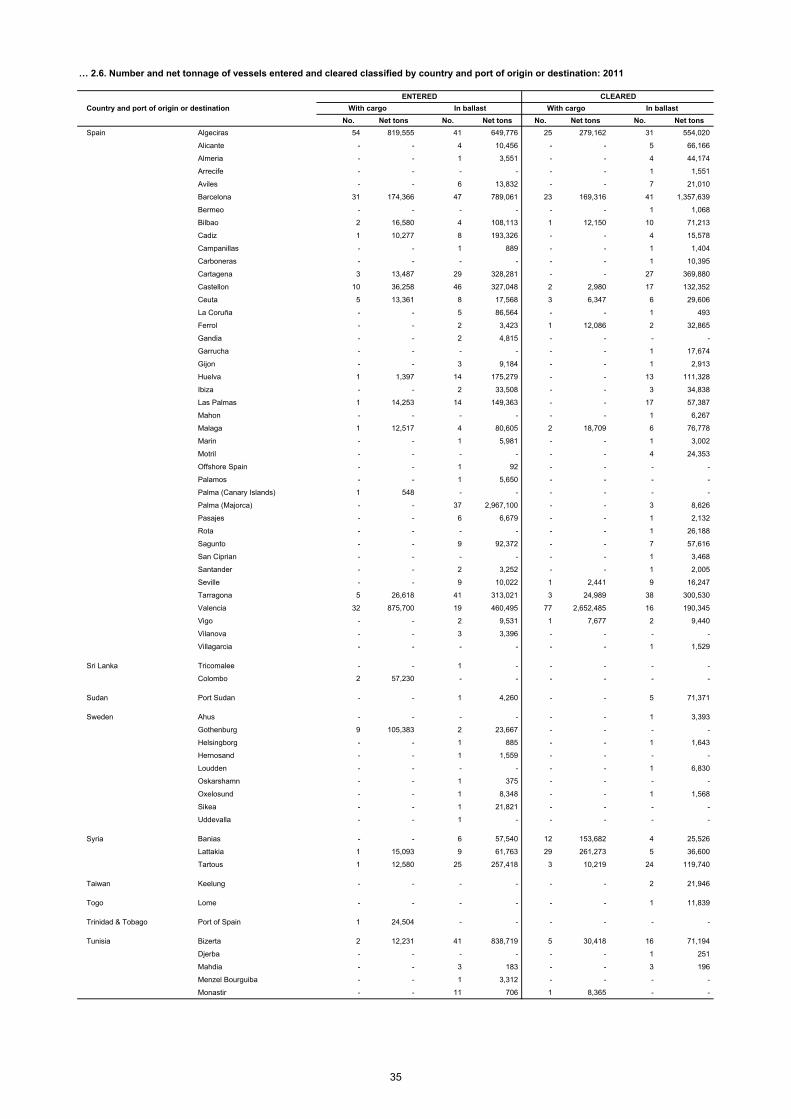
No. Net tons No. Net tons No. Net tons No. Net tons
Spain Algeciras 54 819,555 41 649,776 25 279,162 31 554,020
Alicante - - 4 10,456 - - 5 66,166
Almeria - - 1 3,551 - - 4 44,174
Arrecife - - - - - - 1 1,551
Aviles - - 6 13,832 - - 7 21,010
Barcelona 31 174,366 47 789,061 23 169,316 41 1,357,639
Bermeo - - - - - - 1 1,068
Bilbao 2 16,580 4 108,113 1 12,150 10 71,213
Cadiz 1 10,277 8 193,326 - - 4 15,578
Campanillas - - 1 889 - - 1 1,404
Carboneras - - - - - - 1 10,395
Cartagena 3 13,487 29 328,281 - - 27 369,880
Castellon 10 36,258 46 327,048 2 2,980 17 132,352
Ceuta 5 13,361 8 17,568 3 6,347 6 29,606
La Coruña - - 5 86,564 - - 1 493
Ferrol - - 2 3,423 1 12,086 2 32,865
Gandia - - 2 4,815 - - - -
Garrucha - - - - - - 1 17,674
Gijon - - 3 9,184 - - 1 2,913
Huelva 1 1,397 14 175,279 - - 13 111,328
Ibiza - - 2 33,508 - - 3 34,838
Las Palmas 1 14,253 14 149,363 - - 17 57,387
Mahon - - - - - - 1 6,267
Malaga 1 12,517 4 80,605 2 18,709 6 76,778
Marin - - 1 5,981 - - 1 3,002
Motril - - - - - - 4 24,353
Offshore Spain - - 1 92 - - - -
Palamos - - 1 5,650 - - - -
Palma (Canary Islands) 1 548 - - - - - -
Palma (Majorca) - - 37 2,967,100 - - 3 8,626
Pasajes - - 6 6,679 - - 1 2,132
Rota - - - - - - 1 26,188
Sagunto - - 9 92,372 - - 7 57,616
San Ciprian - - - - - - 1 3,468
Santander - - 2 3,252 - - 1 2,005
Seville - - 9 10,022 1 2,441 9 16,247
Tarragona 5 26,618 41 313,021 3 24,989 38 300,530
Valencia 32 875,700 19 460,495 77 2,652,485 16 190,345
Vigo - - 2 9,531 1 7,677 2 9,440
Vilanova - - 3 3,396 - - - -
Villagarcia - - - - - - 1 1,529
Sri Lanka Tricomalee - - 1 - - - - -
Colombo 2 57,230 - - - - - -
Sudan Port Sudan - - 1 4,260 - - 5 71,371
Sweden Ahus - - - - - - 1 3,393
Gothenburg 9 105,383 2 23,667 - - - -
Helsingborg - - 1 885 - - 1 1,643
Hernosand - - 1 1,559 - - - -
Loudden - - - - - - 1 6,830
Oskarshamn - - 1 375 - - - -
Oxelosund - - 1 8,348 - - 1 1,568
Sikea - - 1 21,821 - - - -
Uddevalla - - 1 - - - - -
Syria Banias - - 6 57,540 12 153,682 4 25,526
Lattakia 1 15,093 9 61,763 29 261,273 5 36,600
Tartous 1 12,580 25 257,418 3 10,219 24 119,740
Taiwan Keelung - - - - - - 2 21,946
Togo Lome - - - - - - 1 11,839
Trinidad & Tobago Port of Spain 1 24,504 - - - - - -
Tunisia Bizerta 2 12,231 41 838,719 5 30,418 16 71,194
Djerba - - - - - - 1 251
Mahdia - - 3 183 - - 3 196
Menzel Bourguiba - - 1 3,312 - - - -
Monastir - - 11 706 1 8,365 - -
… 2.6. Number and net tonnage of vessels entered and cleared classified by country and port of origin or destination: 2011
Country and port of origin or destination
ENTERED CLEARED
With cargo In ballast With cargo In ballast
35
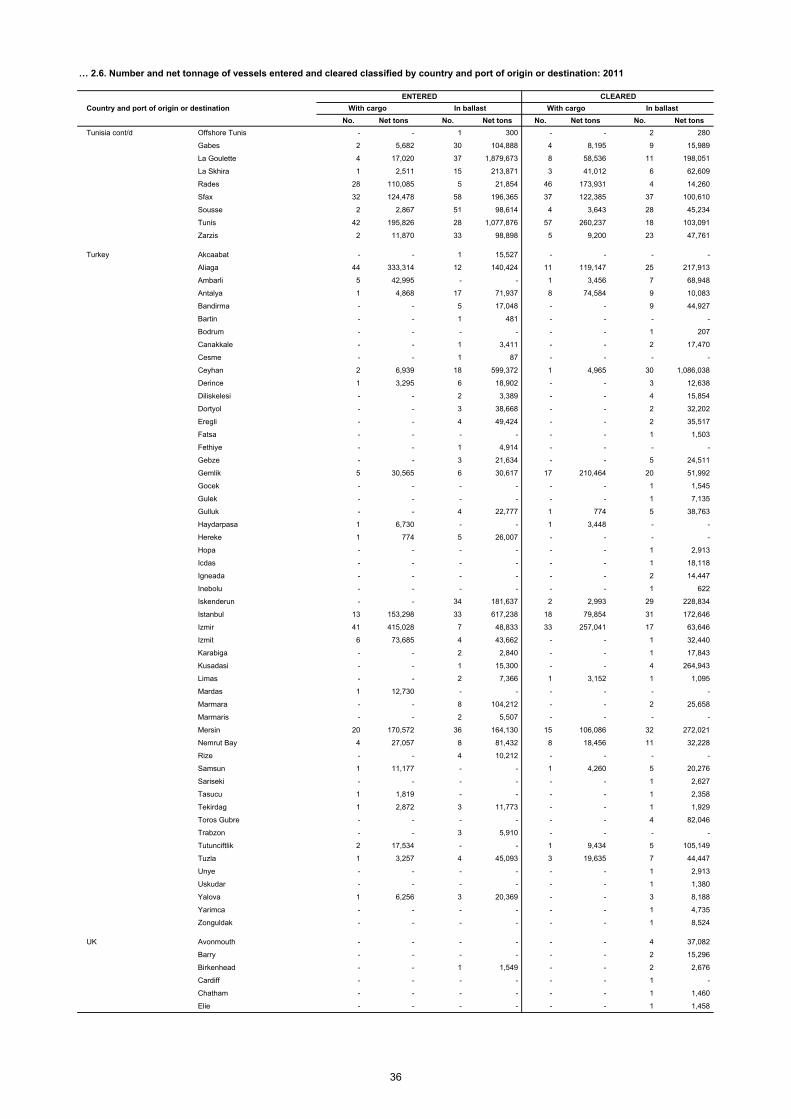
No. Net tons No. Net tons No. Net tons No. Net tons
Tunisia cont/d Offshore Tunis - - 1 300 - - 2 280
Gabes 2 5,682 30 104,888 4 8,195 9 15,989
La Goulette 4 17,020 37 1,879,673 8 58,536 11 198,051
La Skhira 1 2,511 15 213,871 3 41,012 6 62,609
Rades 28 110,085 5 21,854 46 173,931 4 14,260
Sfax 32 124,478 58 196,365 37 122,385 37 100,610
Sousse 2 2,867 51 98,614 4 3,643 28 45,234
Tunis 42 195,826 28 1,077,876 57 260,237 18 103,091
Zarzis 2 11,870 33 98,898 5 9,200 23 47,761
Turkey Akcaabat - - 1 15,527 - - - -
Aliaga 44 333,314 12 140,424 11 119,147 25 217,913
Ambarli 5 42,995 - - 1 3,456 7 68,948
Antalya 1 4,868 17 71,937 8 74,584 9 10,083
Bandirma - - 5 17,048 - - 9 44,927
Bartin - - 1 481 - - - -
Bodrum - - - - - - 1 207
Canakkale - - 1 3,411 - - 2 17,470
Cesme - - 1 87 - - - -
Ceyhan 2 6,939 18 599,372 1 4,965 30 1,086,038
Derince 1 3,295 6 18,902 - - 3 12,638
Diliskelesi - - 2 3,389 - - 4 15,854
Dortyol - - 3 38,668 - - 2 32,202
Eregli - - 4 49,424 - - 2 35,517
Fatsa - - - - - - 1 1,503
Fethiye - - 1 4,914 - - - -
Gebze - - 3 21,634 - - 5 24,511
Gemlik 5 30,565 6 30,617 17 210,464 20 51,992
Gocek - - - - - - 1 1,545
Gulek - - - - - - 1 7,135
Gulluk - - 4 22,777 1 774 5 38,763
Haydarpasa 1 6,730 - - 1 3,448 - -
Hereke 1 774 5 26,007 - - - -
Hopa - - - - - - 1 2,913
Icdas - - - - - - 1 18,118
Igneada - - - - - - 2 14,447
Inebolu - - - - - - 1 622
Iskenderun - - 34 181,637 2 2,993 29 228,834
Istanbul 13 153,298 33 617,238 18 79,854 31 172,646
Izmir 41 415,028 7 48,833 33 257,041 17 63,646
Izmit 6 73,685 4 43,662 - - 1 32,440
Karabiga - - 2 2,840 - - 1 17,843
Kusadasi - - 1 15,300 - - 4 264,943
Limas - - 2 7,366 1 3,152 1 1,095
Mardas 1 12,730 - - - - - -
Marmara - - 8 104,212 - - 2 25,658
Marmaris - - 2 5,507 - - - -
Mersin 20 170,572 36 164,130 15 106,086 32 272,021
Nemrut Bay 4 27,057 8 81,432 8 18,456 11 32,228
Rize - - 4 10,212 - - - -
Samsun 1 11,177 - - 1 4,260 5 20,276
Sariseki - - - - - - 1 2,627
Tasucu 1 1,819 - - - - 1 2,358
Tekirdag 1 2,872 3 11,773 - - 1 1,929
Toros Gubre - - - - - - 4 82,046
Trabzon - - 3 5,910 - - - -
Tutunciftlik 2 17,534 - - 1 9,434 5 105,149
Tuzla 1 3,257 4 45,093 3 19,635 7 44,447
Unye - - - - - - 1 2,913
Uskudar - - - - - - 1 1,380
Yalova 1 6,256 3 20,369 - - 3 8,188
Yarimca - - - - - - 1 4,735
Zonguldak - - - - - - 1 8,524
UK Avonmouth - - - - - - 4 37,082
Barry - - - - - - 2 15,296
Birkenhead - - 1 1,549 - - 2 2,676
Cardiff - - - - - - 1 -
Chatham - - - - - - 1 1,460
Elie - - - - - - 1 1,458
… 2.6. Number and net tonnage of vessels entered and cleared classified by country and port of origin or destination: 2011
Country and port of origin or destination
ENTERED CLEARED
With cargo In ballast With cargo In ballast
36
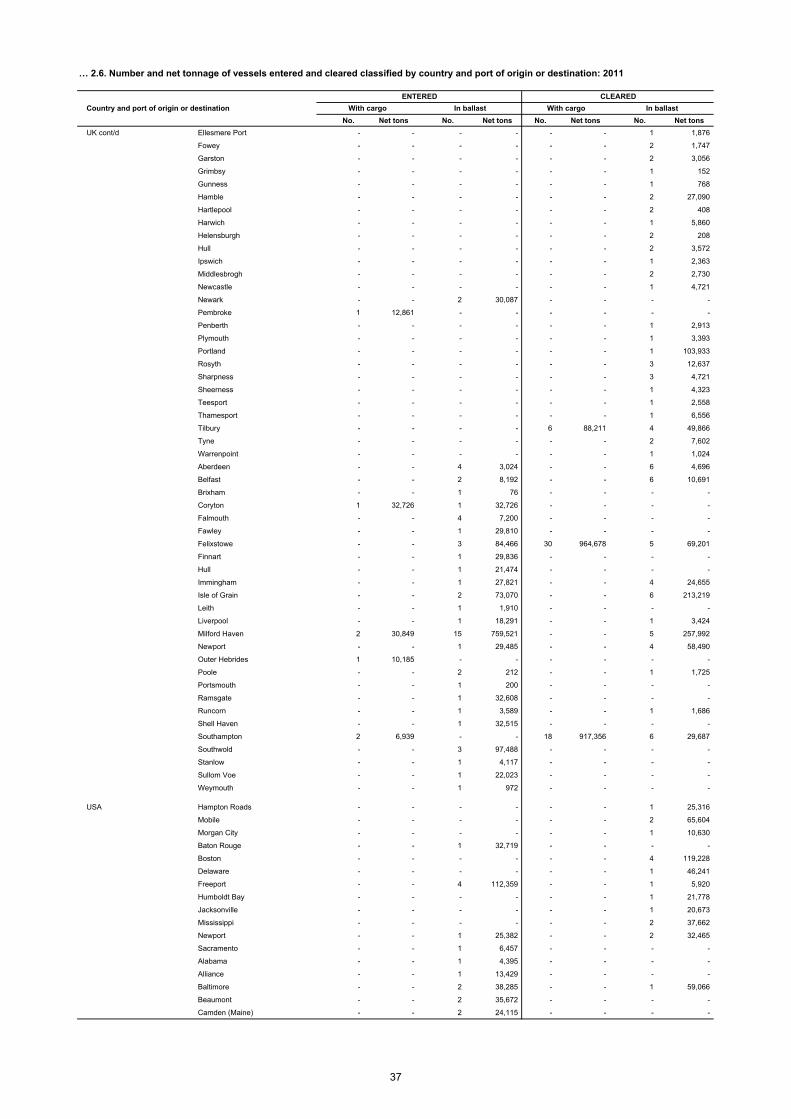
No. Net tons No. Net tons No. Net tons No. Net tons
UK cont/d Ellesmere Port - - - - - - 1 1,876
Fowey - - - - - - 2 1,747
Garston - - - - - - 2 3,056
Grimbsy - - - - - - 1 152
Gunness - - - - - - 1 768
Hamble - - - - - - 2 27,090
Hartlepool - - - - - - 2 408
Harwich - - - - - - 1 5,860
Helensburgh - - - - - - 2 208
Hull - - - - - - 2 3,572
Ipswich - - - - - - 1 2,363
Middlesbrogh - - - - - - 2 2,730
Newcastle - - - - - - 1 4,721
Newark - - 2 30,087 - - - -
Pembroke 1 12,861 - - - - - -
Penberth - - - - - - 1 2,913
Plymouth - - - - - - 1 3,393
Portland - - - - - - 1 103,933
Rosyth - - - - - - 3 12,637
Sharpness - - - - - - 3 4,721
Sheerness - - - - - - 1 4,323
Teesport - - - - - - 1 2,558
Thamesport - - - - - - 1 6,556
Tilbury - - - - 6 88,211 4 49,866
Tyne - - - - - - 2 7,602
Warrenpoint - - - - - - 1 1,024
Aberdeen - - 4 3,024 - - 6 4,696
Belfast - - 2 8,192 - - 6 10,691
Brixham - - 1 76 - - - -
Coryton 1 32,726 1 32,726 - - - -
Falmouth - - 4 7,200 - - - -
Fawley - - 1 29,810 - - - -
Felixstowe - - 3 84,466 30 964,678 5 69,201
Finnart - - 1 29,836 - - - -
Hull - - 1 21,474 - - - -
Immingham - - 1 27,821 - - 4 24,655
Isle of Grain - - 2 73,070 - - 6 213,219
Leith - - 1 1,910 - - - -
Liverpool - - 1 18,291 - - 1 3,424
Milford Haven 2 30,849 15 759,521 - - 5 257,992
Newport - - 1 29,485 - - 4 58,490
Outer Hebrides 1 10,185 - - - - - -
Poole - - 2 212 - - 1 1,725
Portsmouth - - 1 200 - - - -
Ramsgate - - 1 32,608 - - - -
Runcorn - - 1 3,589 - - 1 1,686
Shell Haven - - 1 32,515 - - - -
Southampton 2 6,939 - - 18 917,356 6 29,687
Southwold - - 3 97,488 - - - -
Stanlow - - 1 4,117 - - - -
Sullom Voe - - 1 22,023 - - - -
Weymouth - - 1 972 - - - -
USA Hampton Roads - - - - - - 1 25,316
Mobile - - - - - - 2 65,604
Morgan City - - - - - - 1 10,630
Baton Rouge - - 1 32,719 - - - -
Boston - - - - - - 4 119,228
Delaware - - - - - - 1 46,241
Freeport - - 4 112,359 - - 1 5,920
Humboldt Bay - - - - - - 1 21,778
Jacksonville - - - - - - 1 20,673
Mississippi - - - - - - 2 37,662
Newport - - 1 25,382 - - 2 32,465
Sacramento - - 1 6,457 - - - -
Alabama - - 1 4,395 - - - -
Alliance - - 1 13,429 - - - -
Baltimore - - 2 38,285 - - 1 59,066
Beaumont - - 2 35,672 - - - -
Camden (Maine) - - 2 24,115 - - - -
… 2.6. Number and net tonnage of vessels entered and cleared classified by country and port of origin or destination: 2011
Country and port of origin or destination
ENTERED CLEARED
With cargo In ballast With cargo In ballast
37
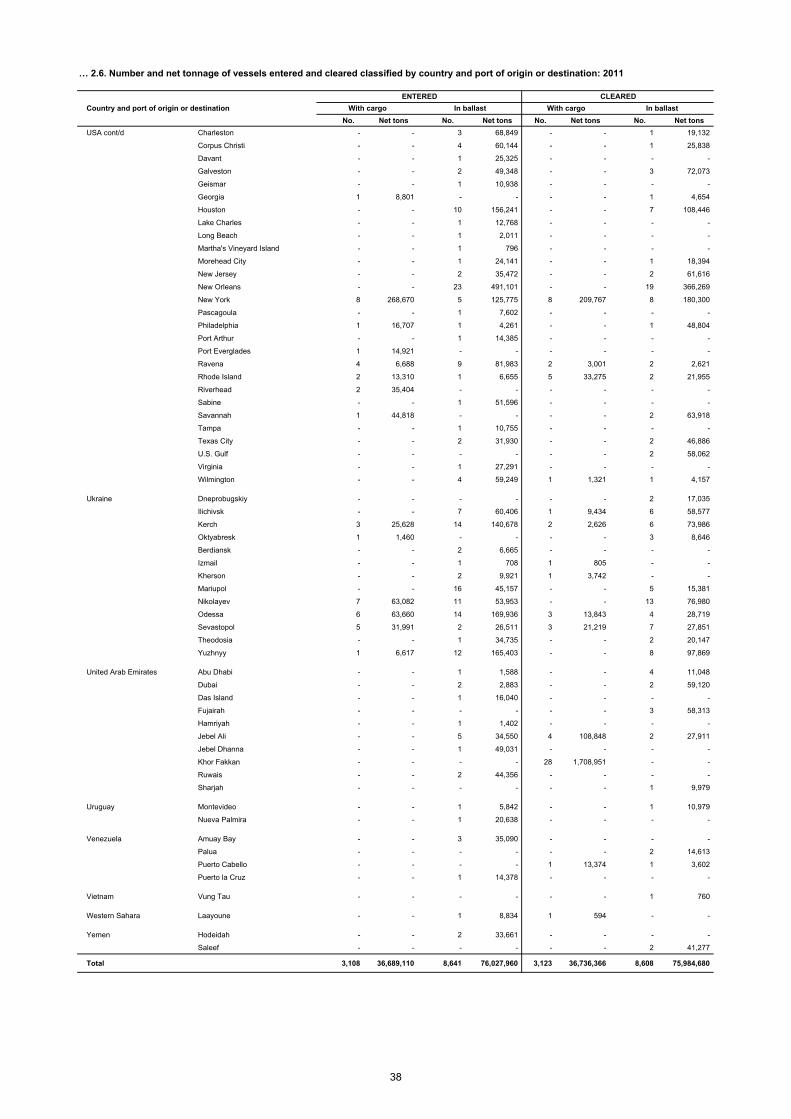
No. Net tons No. Net tons No. Net tons No. Net tons
USA cont/d Charleston - - 3 68,849 - - 1 19,132
Corpus Christi - - 4 60,144 - - 1 25,838
Davant - - 1 25,325 - - - -
Galveston - - 2 49,348 - - 3 72,073
Geismar - - 1 10,938 - - - -
Georgia 1 8,801 - - - - 1 4,654
Houston - - 10 156,241 - - 7 108,446
Lake Charles - - 1 12,768 - - - -
Long Beach - - 1 2,011 - - - -
Martha's Vineyard Island - - 1 796 - - - -
Morehead City - - 1 24,141 - - 1 18,394
New Jersey - - 2 35,472 - - 2 61,616
New Orleans - - 23 491,101 - - 19 366,269
New York 8 268,670 5 125,775 8 209,767 8 180,300
Pascagoula - - 1 7,602 - - - -
Philadelphia 1 16,707 1 4,261 - - 1 48,804
Port Arthur - - 1 14,385 - - - -
Port Everglades 1 14,921 - - - - - -
Ravena 4 6,688 9 81,983 2 3,001 2 2,621
Rhode Island 2 13,310 1 6,655 5 33,275 2 21,955
Riverhead 2 35,404 - - - - - -
Sabine - - 1 51,596 - - - -
Savannah 1 44,818 - - - - 2 63,918
Tampa - - 1 10,755 - - - -
Texas City - - 2 31,930 - - 2 46,886
U.S. Gulf - - - - - - 2 58,062
Virginia - - 1 27,291 - - - -
Wilmington - - 4 59,249 1 1,321 1 4,157
Ukraine Dneprobugskiy - - - - - - 2 17,035
Ilichivsk - - 7 60,406 1 9,434 6 58,577
Kerch 3 25,628 14 140,678 2 2,626 6 73,986
Oktyabresk 1 1,460 - - - - 3 8,646
Berdiansk - - 2 6,665 - - - -
Izmail - - 1 708 1 805 - -
Kherson - - 2 9,921 1 3,742 - -
Mariupol - - 16 45,157 - - 5 15,381
Nikolayev 7 63,082 11 53,953 - - 13 76,980
Odessa 6 63,660 14 169,936 3 13,843 4 28,719
Sevastopol 5 31,991 2 26,511 3 21,219 7 27,851
Theodosia - - 1 34,735 - - 2 20,147
Yuzhnyy 1 6,617 12 165,403 - - 8 97,869
United Arab Emirates Abu Dhabi - - 1 1,588 - - 4 11,048
Dubai - - 2 2,883 - - 2 59,120
Das Island - - 1 16,040 - - - -
Fujairah - - - - - - 3 58,313
Hamriyah - - 1 1,402 - - - -
Jebel Ali - - 5 34,550 4 108,848 2 27,911
Jebel Dhanna - - 1 49,031 - - - -
Khor Fakkan - - - - 28 1,708,951 - -
Ruwais - - 2 44,356 - - - -
Sharjah - - - - - - 1 9,979
Uruguay Montevideo - - 1 5,842 - - 1 10,979
Nueva Palmira - - 1 20,638 - - - -
Venezuela Amuay Bay - - 3 35,090 - - - -
Palua - - - - - - 2 14,613
Puerto Cabello - - - - 1 13,374 1 3,602
Puerto la Cruz - - 1 14,378 - - - -
Vietnam Vung Tau - - - - - - 1 760
Western Sahara Laayoune - - 1 8,834 1 594 - -
Yemen Hodeidah - - 2 33,661 - - - -
Saleef - - - - - - 2 41,277
Total 3,108 36,689,110 8,641 76,027,960 3,123 36,736,366 8,608 75,984,680
… 2.6. Number and net tonnage of vessels entered and cleared classified by country and port of origin or destination: 2011
Country and port of origin or destination
ENTERED CLEARED
With cargo In ballast With cargo In ballast
38
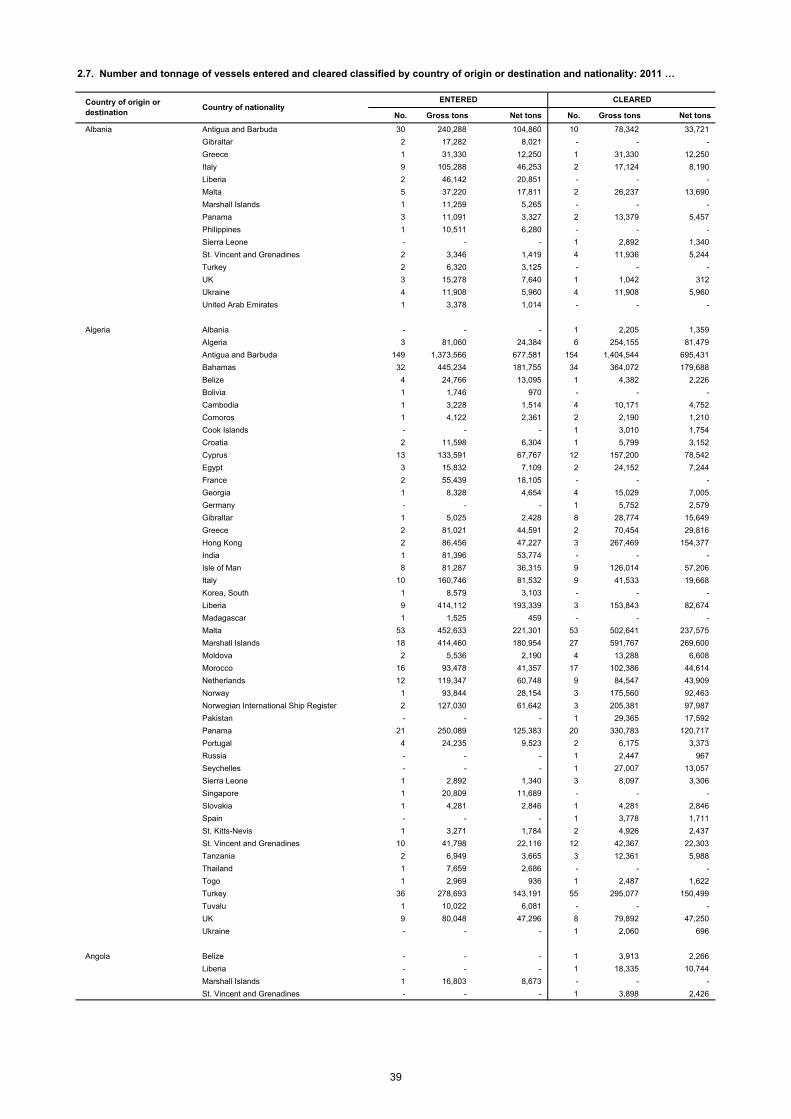
No. Gross tons Net tons No. Gross tons Net tons
Albania Antigua and Barbuda 30 240,288 104,860 10 78,342 33,721
Gibraltar 2 17,282 8,021 - - -
Greece 1 31,330 12,250 1 31,330 12,250
Italy 9 105,288 46,253 2 17,124 8,190
Liberia 2 46,142 20,851 - - -
Malta 5 37,220 17,811 2 26,237 13,690
Marshall Islands 1 11,259 5,265 - - -
Panama 3 11,091 3,327 2 13,379 5,457
Philippines 1 10,511 6,280 - - -
Sierra Leone - - - 1 2,892 1,340
St. Vincent and Grenadines 2 3,346 1,419 4 11,936 5,244
Turkey 2 6,320 3,125 - - -
UK 3 15,278 7,640 1 1,042 312
Ukraine 4 11,908 5,960 4 11,908 5,960
United Arab Emirates 1 3,378 1,014 - - -
Algeria Albania - - - 1 2,205 1,359
Algeria 3 81,060 24,384 6 254,155 81,479
Antigua and Barbuda 149 1,373,566 677,581 154 1,404,544 695,431
Bahamas 32 445,234 181,755 34 364,072 179,688
Belize 4 24,766 13,095 1 4,382 2,226
Bolivia 1 1,746 970 - - -
Cambodia 1 3,228 1,514 4 10,171 4,752
Comoros 1 4,122 2,361 2 2,190 1,210
Cook Islands - - - 1 3,010 1,754
Croatia 2 11,598 6,304 1 5,799 3,152
Cyprus 13 133,591 67,767 12 157,200 78,542
Egypt 3 15,832 7,109 2 24,152 7,244
France 2 55,439 18,105 - - -
Georgia 1 8,328 4,654 4 15,029 7,005
Germany - - - 1 5,752 2,579
Gibraltar 1 5,025 2,428 8 28,774 15,649
Greece 2 81,021 44,591 2 70,454 29,816
Hong Kong 2 86,456 47,227 3 267,469 154,377
India 1 81,396 53,774 - - -
Isle of Man 8 81,287 36,315 9 126,014 57,206
Italy 10 160,746 81,532 9 41,533 19,668
Korea, South 1 8,579 3,103 - - -
Liberia 9 414,112 193,339 3 153,843 82,674
Madagascar 1 1,525 459 - - -
Malta 53 452,633 221,301 53 502,641 237,575
Marshall Islands 18 414,460 180,954 27 591,767 269,600
Moldova 2 5,536 2,190 4 13,288 6,608
Morocco 16 93,478 41,357 17 102,386 44,614
Netherlands 12 119,347 60,748 9 84,547 43,909
Norway 1 93,844 28,154 3 175,560 92,463
Norwegian International Ship Register 2 127,030 61,642 3 205,381 97,987
Pakistan - - - 1 29,365 17,592
Panama 21 250,089 125,383 20 330,783 120,717
Portugal 4 24,235 9,523 2 6,175 3,373
Russia - - - 1 2,447 967
Seychelles - - - 1 27,007 13,057
Sierra Leone 1 2,892 1,340 3 8,097 3,306
Singapore 1 20,809 11,689 - - -
Slovakia 1 4,281 2,846 1 4,281 2,846
Spain - - - 1 3,778 1,711
St. Kitts-Nevis 1 3,271 1,784 2 4,926 2,437
St. Vincent and Grenadines 10 41,798 22,116 12 42,367 22,303
Tanzania 2 6,949 3,665 3 12,361 5,988
Thailand 1 7,659 2,686 - - -
Togo 1 2,969 936 1 2,487 1,622
Turkey 36 278,693 143,191 55 295,077 150,499
Tuvalu 1 10,022 6,081 - - -
UK 9 80,048 47,296 8 79,892 47,250
Ukraine - - - 1 2,060 696
Angola Belize - - - 1 3,913 2,266
Liberia - - - 1 18,335 10,744
Marshall Islands 1 16,803 8,673 - - -
St. Vincent and Grenadines - - - 1 3,898 2,426
2.7. Number and tonnage of vessels entered and cleared classified by country of origin or destination and nationality: 2011 …
Country of origin or destination
Country of nationalityENTERED CLEARED
39
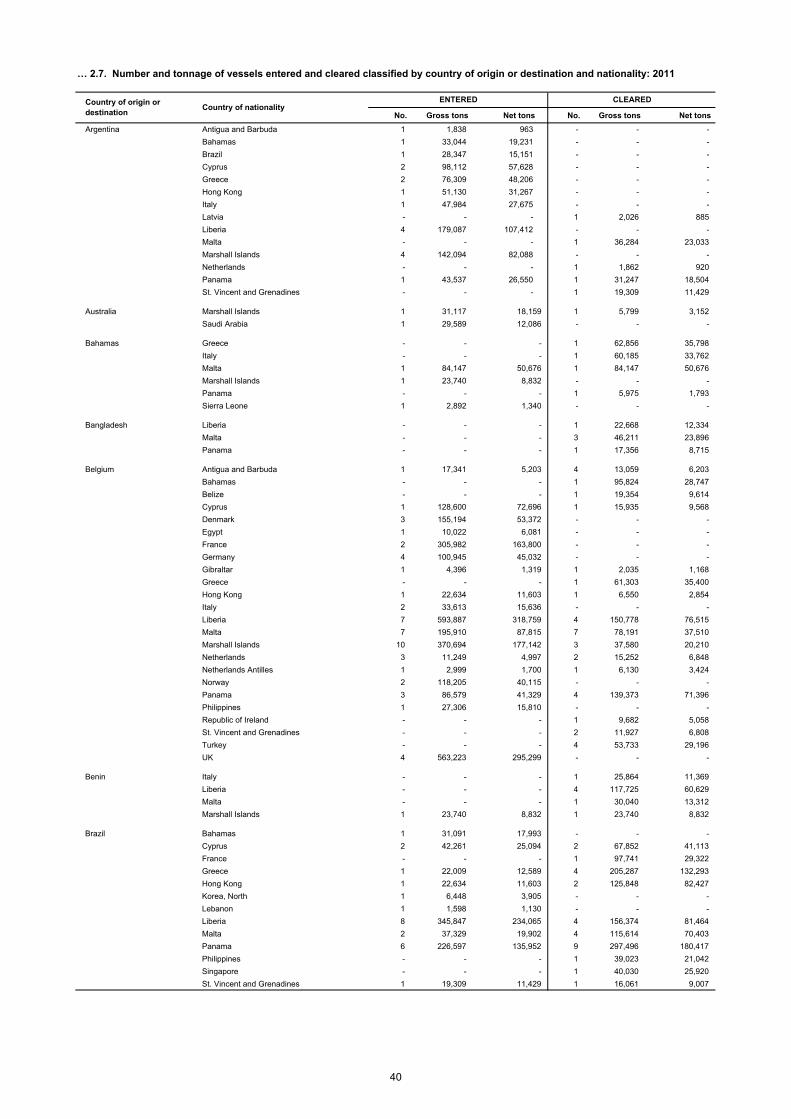
No. Gross tons Net tons No. Gross tons Net tons
Argentina Antigua and Barbuda 1 1,838 963 - - -
Bahamas 1 33,044 19,231 - - -
Brazil 1 28,347 15,151 - - -
Cyprus 2 98,112 57,628 - - -
Greece 2 76,309 48,206 - - -
Hong Kong 1 51,130 31,267 - - -
Italy 1 47,984 27,675 - - -
Latvia - - - 1 2,026 885
Liberia 4 179,087 107,412 - - -
Malta - - - 1 36,284 23,033
Marshall Islands 4 142,094 82,088 - - -
Netherlands - - - 1 1,862 920
Panama 1 43,537 26,550 1 31,247 18,504
St. Vincent and Grenadines - - - 1 19,309 11,429
Australia Marshall Islands 1 31,117 18,159 1 5,799 3,152
Saudi Arabia 1 29,589 12,086 - - -
Bahamas Greece - - - 1 62,856 35,798
Italy - - - 1 60,185 33,762
Malta 1 84,147 50,676 1 84,147 50,676
Marshall Islands 1 23,740 8,832 - - -
Panama - - - 1 5,975 1,793
Sierra Leone 1 2,892 1,340 - - -
Bangladesh Liberia - - - 1 22,668 12,334
Malta - - - 3 46,211 23,896
Panama - - - 1 17,356 8,715
Belgium Antigua and Barbuda 1 17,341 5,203 4 13,059 6,203
Bahamas - - - 1 95,824 28,747
Belize - - - 1 19,354 9,614
Cyprus 1 128,600 72,696 1 15,935 9,568
Denmark 3 155,194 53,372 - - -
Egypt 1 10,022 6,081 - - -
France 2 305,982 163,800 - - -
Germany 4 100,945 45,032 - - -
Gibraltar 1 4,396 1,319 1 2,035 1,168
Greece - - - 1 61,303 35,400
Hong Kong 1 22,634 11,603 1 6,550 2,854
Italy 2 33,613 15,636 - - -
Liberia 7 593,887 318,759 4 150,778 76,515
Malta 7 195,910 87,815 7 78,191 37,510
Marshall Islands 10 370,694 177,142 3 37,580 20,210
Netherlands 3 11,249 4,997 2 15,252 6,848
Netherlands Antilles 1 2,999 1,700 1 6,130 3,424
Norway 2 118,205 40,115 - - -
Panama 3 86,579 41,329 4 139,373 71,396
Philippines 1 27,306 15,810 - - -
Republic of Ireland - - - 1 9,682 5,058
St. Vincent and Grenadines - - - 2 11,927 6,808
Turkey - - - 4 53,733 29,196
UK 4 563,223 295,299 - - -
Benin Italy - - - 1 25,864 11,369
Liberia - - - 4 117,725 60,629
Malta - - - 1 30,040 13,312
Marshall Islands 1 23,740 8,832 1 23,740 8,832
Brazil Bahamas 1 31,091 17,993 - - -
Cyprus 2 42,261 25,094 2 67,852 41,113
France - - - 1 97,741 29,322
Greece 1 22,009 12,589 4 205,287 132,293
Hong Kong 1 22,634 11,603 2 125,848 82,427
Korea, North 1 6,448 3,905 - - -
Lebanon 1 1,598 1,130 - - -
Liberia 8 345,847 234,065 4 156,374 81,464
Malta 2 37,329 19,902 4 115,614 70,403
Panama 6 226,597 135,952 9 297,496 180,417
Philippines - - - 1 39,023 21,042
Singapore - - - 1 40,030 25,920
St. Vincent and Grenadines 1 19,309 11,429 1 16,061 9,007
… 2.7. Number and tonnage of vessels entered and cleared classified by country of origin or destination and nationality: 2011
Country of origin or destination
Country of nationalityENTERED CLEARED
40
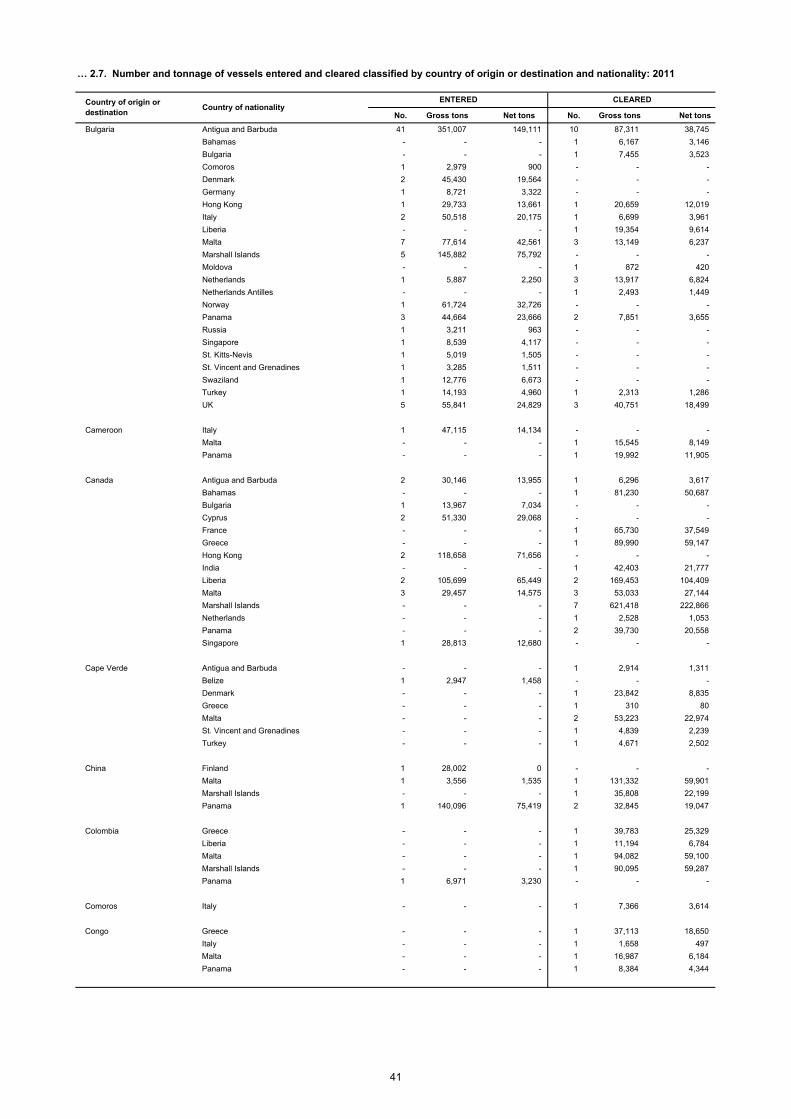
No. Gross tons Net tons No. Gross tons Net tons
Bulgaria Antigua and Barbuda 41 351,007 149,111 10 87,311 38,745
Bahamas - - - 1 6,167 3,146
Bulgaria - - - 1 7,455 3,523
Comoros 1 2,979 900 - - -
Denmark 2 45,430 19,564 - - -
Germany 1 8,721 3,322 - - -
Hong Kong 1 29,733 13,661 1 20,659 12,019
Italy 2 50,518 20,175 1 6,699 3,961
Liberia - - - 1 19,354 9,614
Malta 7 77,614 42,561 3 13,149 6,237
Marshall Islands 5 145,882 75,792 - - -
Moldova - - - 1 872 420
Netherlands 1 5,887 2,250 3 13,917 6,824
Netherlands Antilles - - - 1 2,493 1,449
Norway 1 61,724 32,726 - - -
Panama 3 44,664 23,666 2 7,851 3,655
Russia 1 3,211 963 - - -
Singapore 1 8,539 4,117 - - -
St. Kitts-Nevis 1 5,019 1,505 - - -
St. Vincent and Grenadines 1 3,285 1,511 - - -
Swaziland 1 12,776 6,673 - - -
Turkey 1 14,193 4,960 1 2,313 1,286
UK 5 55,841 24,829 3 40,751 18,499
Cameroon Italy 1 47,115 14,134 - - -
Malta - - - 1 15,545 8,149
Panama - - - 1 19,992 11,905
Canada Antigua and Barbuda 2 30,146 13,955 1 6,296 3,617
Bahamas - - - 1 81,230 50,687
Bulgaria 1 13,967 7,034 - - -
Cyprus 2 51,330 29,068 - - -
France - - - 1 65,730 37,549
Greece - - - 1 89,990 59,147
Hong Kong 2 118,658 71,656 - - -
India - - - 1 42,403 21,777
Liberia 2 105,699 65,449 2 169,453 104,409
Malta 3 29,457 14,575 3 53,033 27,144
Marshall Islands - - - 7 621,418 222,866
Netherlands - - - 1 2,528 1,053
Panama - - - 2 39,730 20,558
Singapore 1 28,813 12,680 - - -
Cape Verde Antigua and Barbuda - - - 1 2,914 1,311
Belize 1 2,947 1,458 - - -
Denmark - - - 1 23,842 8,835
Greece - - - 1 310 80
Malta - - - 2 53,223 22,974
St. Vincent and Grenadines - - - 1 4,839 2,239
Turkey - - - 1 4,671 2,502
China Finland 1 28,002 0 - - -
Malta 1 3,556 1,535 1 131,332 59,901
Marshall Islands - - - 1 35,808 22,199
Panama 1 140,096 75,419 2 32,845 19,047
Colombia Greece - - - 1 39,783 25,329
Liberia - - - 1 11,194 6,784
Malta - - - 1 94,082 59,100
Marshall Islands - - - 1 90,095 59,287
Panama 1 6,971 3,230 - - -
Comoros Italy - - - 1 7,366 3,614
Congo Greece - - - 1 37,113 18,650
Italy - - - 1 1,658 497
Malta - - - 1 16,987 6,184
Panama - - - 1 8,384 4,344
… 2.7. Number and tonnage of vessels entered and cleared classified by country of origin or destination and nationality: 2011
Country of origin or destination
Country of nationalityENTERED CLEARED
41
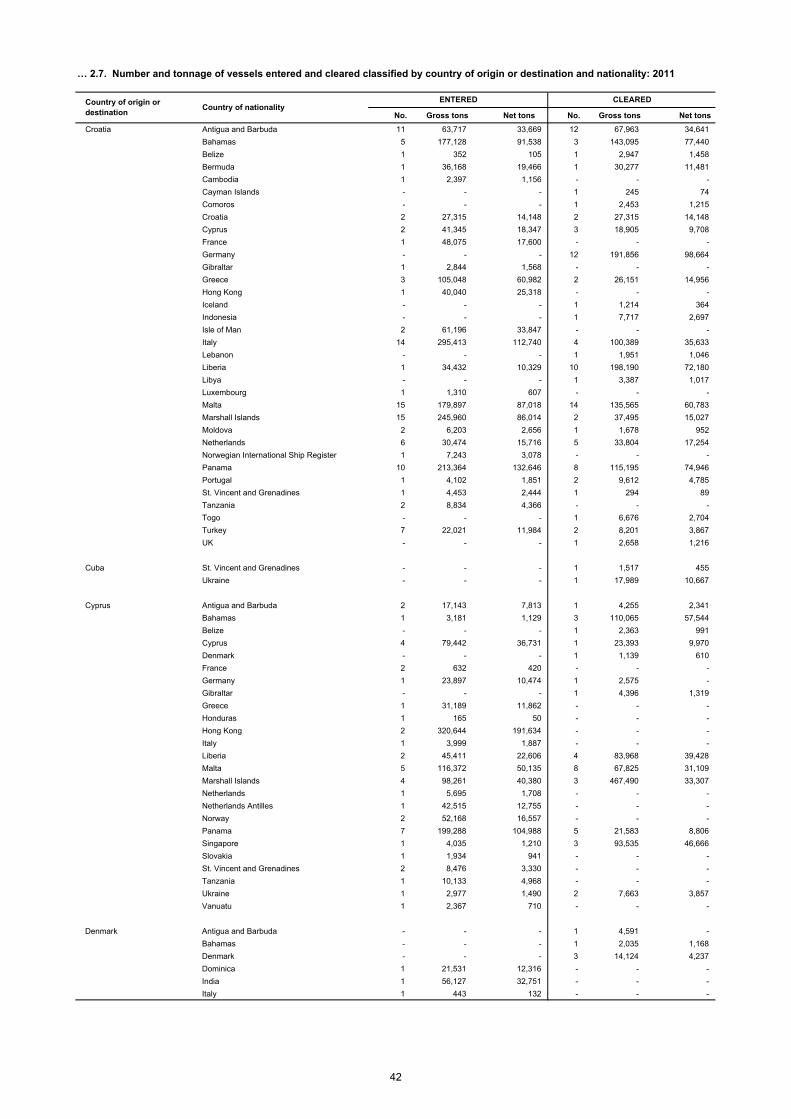
No. Gross tons Net tons No. Gross tons Net tons
Croatia Antigua and Barbuda 11 63,717 33,669 12 67,963 34,641
Bahamas 5 177,128 91,538 3 143,095 77,440
Belize 1 352 105 1 2,947 1,458
Bermuda 1 36,168 19,466 1 30,277 11,481
Cambodia 1 2,397 1,156 - - -
Cayman Islands - - - 1 245 74
Comoros - - - 1 2,453 1,215
Croatia 2 27,315 14,148 2 27,315 14,148
Cyprus 2 41,345 18,347 3 18,905 9,708
France 1 48,075 17,600 - - -
Germany - - - 12 191,856 98,664
Gibraltar 1 2,844 1,568 - - -
Greece 3 105,048 60,982 2 26,151 14,956
Hong Kong 1 40,040 25,318 - - -
Iceland - - - 1 1,214 364
Indonesia - - - 1 7,717 2,697
Isle of Man 2 61,196 33,847 - - -
Italy 14 295,413 112,740 4 100,389 35,633
Lebanon - - - 1 1,951 1,046
Liberia 1 34,432 10,329 10 198,190 72,180
Libya - - - 1 3,387 1,017
Luxembourg 1 1,310 607 - - -
Malta 15 179,897 87,018 14 135,565 60,783
Marshall Islands 15 245,960 86,014 2 37,495 15,027
Moldova 2 6,203 2,656 1 1,678 952
Netherlands 6 30,474 15,716 5 33,804 17,254
Norwegian International Ship Register 1 7,243 3,078 - - -
Panama 10 213,364 132,646 8 115,195 74,946
Portugal 1 4,102 1,851 2 9,612 4,785
St. Vincent and Grenadines 1 4,453 2,444 1 294 89
Tanzania 2 8,834 4,366 - - -
Togo - - - 1 6,676 2,704
Turkey 7 22,021 11,984 2 8,201 3,867
UK - - - 1 2,658 1,216
Cuba St. Vincent and Grenadines - - - 1 1,517 455
Ukraine - - - 1 17,989 10,667
Cyprus Antigua and Barbuda 2 17,143 7,813 1 4,255 2,341
Bahamas 1 3,181 1,129 3 110,065 57,544
Belize - - - 1 2,363 991
Cyprus 4 79,442 36,731 1 23,393 9,970
Denmark - - - 1 1,139 610
France 2 632 420 - - -
Germany 1 23,897 10,474 1 2,575 -
Gibraltar - - - 1 4,396 1,319
Greece 1 31,189 11,862 - - -
Honduras 1 165 50 - - -
Hong Kong 2 320,644 191,634 - - -
Italy 1 3,999 1,887 - - -
Liberia 2 45,411 22,606 4 83,968 39,428
Malta 5 116,372 50,135 8 67,825 31,109
Marshall Islands 4 98,261 40,380 3 467,490 33,307
Netherlands 1 5,695 1,708 - - -
Netherlands Antilles 1 42,515 12,755 - - -
Norway 2 52,168 16,557 - - -
Panama 7 199,288 104,988 5 21,583 8,806
Singapore 1 4,035 1,210 3 93,535 46,666
Slovakia 1 1,934 941 - - -
St. Vincent and Grenadines 2 8,476 3,330 - - -
Tanzania 1 10,133 4,968 - - -
Ukraine 1 2,977 1,490 2 7,663 3,857
Vanuatu 1 2,367 710 - - -
Denmark Antigua and Barbuda - - - 1 4,591 -
Bahamas - - - 1 2,035 1,168
Denmark - - - 3 14,124 4,237
Dominica 1 21,531 12,316 - - -
India 1 56,127 32,751 - - -
Italy 1 443 132 - - -
… 2.7. Number and tonnage of vessels entered and cleared classified by country of origin or destination and nationality: 2011
Country of origin or destination
Country of nationalityENTERED CLEARED
42
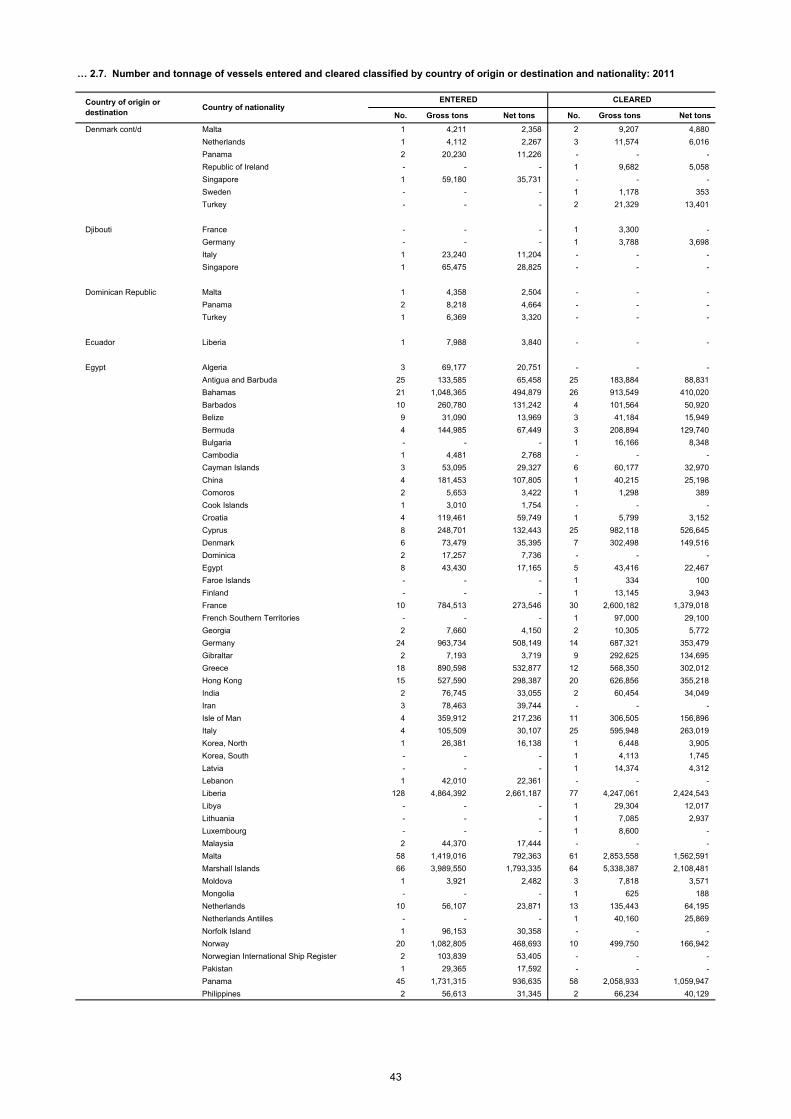
No. Gross tons Net tons No. Gross tons Net tons
Denmark cont/d Malta 1 4,211 2,358 2 9,207 4,880
Netherlands 1 4,112 2,267 3 11,574 6,016
Panama 2 20,230 11,226 - - -
Republic of Ireland - - - 1 9,682 5,058
Singapore 1 59,180 35,731 - - -
Sweden - - - 1 1,178 353
Turkey - - - 2 21,329 13,401
Djibouti France - - - 1 3,300 -
Germany - - - 1 3,788 3,698
Italy 1 23,240 11,204 - - -
Singapore 1 65,475 28,825 - - -
Dominican Republic Malta 1 4,358 2,504 - - -
Panama 2 8,218 4,664 - - -
Turkey 1 6,369 3,320 - - -
Ecuador Liberia 1 7,988 3,840 - - -
Egypt Algeria 3 69,177 20,751 - - -
Antigua and Barbuda 25 133,585 65,458 25 183,884 88,831
Bahamas 21 1,048,365 494,879 26 913,549 410,020
Barbados 10 260,780 131,242 4 101,564 50,920
Belize 9 31,090 13,969 3 41,184 15,949
Bermuda 4 144,985 67,449 3 208,894 129,740
Bulgaria - - - 1 16,166 8,348
Cambodia 1 4,481 2,768 - - -
Cayman Islands 3 53,095 29,327 6 60,177 32,970
China 4 181,453 107,805 1 40,215 25,198
Comoros 2 5,653 3,422 1 1,298 389
Cook Islands 1 3,010 1,754 - - -
Croatia 4 119,461 59,749 1 5,799 3,152
Cyprus 8 248,701 132,443 25 982,118 526,645
Denmark 6 73,479 35,395 7 302,498 149,516
Dominica 2 17,257 7,736 - - -
Egypt 8 43,430 17,165 5 43,416 22,467
Faroe Islands - - - 1 334 100
Finland - - - 1 13,145 3,943
France 10 784,513 273,546 30 2,600,182 1,379,018
French Southern Territories - - - 1 97,000 29,100
Georgia 2 7,660 4,150 2 10,305 5,772
Germany 24 963,734 508,149 14 687,321 353,479
Gibraltar 2 7,193 3,719 9 292,625 134,695
Greece 18 890,598 532,877 12 568,350 302,012
Hong Kong 15 527,590 298,387 20 626,856 355,218
India 2 76,745 33,055 2 60,454 34,049
Iran 3 78,463 39,744 - - -
Isle of Man 4 359,912 217,236 11 306,505 156,896
Italy 4 105,509 30,107 25 595,948 263,019
Korea, North 1 26,381 16,138 1 6,448 3,905
Korea, South - - - 1 4,113 1,745
Latvia - - - 1 14,374 4,312
Lebanon 1 42,010 22,361 - - -
Liberia 128 4,864,392 2,661,187 77 4,247,061 2,424,543
Libya - - - 1 29,304 12,017
Lithuania - - - 1 7,085 2,937
Luxembourg - - - 1 8,600 -
Malaysia 2 44,370 17,444 - - -
Malta 58 1,419,016 792,363 61 2,853,558 1,562,591
Marshall Islands 66 3,989,550 1,793,335 64 5,338,387 2,108,481
Moldova 1 3,921 2,482 3 7,818 3,571
Mongolia - - - 1 625 188
Netherlands 10 56,107 23,871 13 135,443 64,195
Netherlands Antilles - - - 1 40,160 25,869
Norfolk Island 1 96,153 30,358 - - -
Norway 20 1,082,805 468,693 10 499,750 166,942
Norwegian International Ship Register 2 103,839 53,405 - - -
Pakistan 1 29,365 17,592 - - -
Panama 45 1,731,315 936,635 58 2,058,933 1,059,947
Philippines 2 56,613 31,345 2 66,234 40,129
… 2.7. Number and tonnage of vessels entered and cleared classified by country of origin or destination and nationality: 2011
Country of origin or destination
Country of nationalityENTERED CLEARED
43
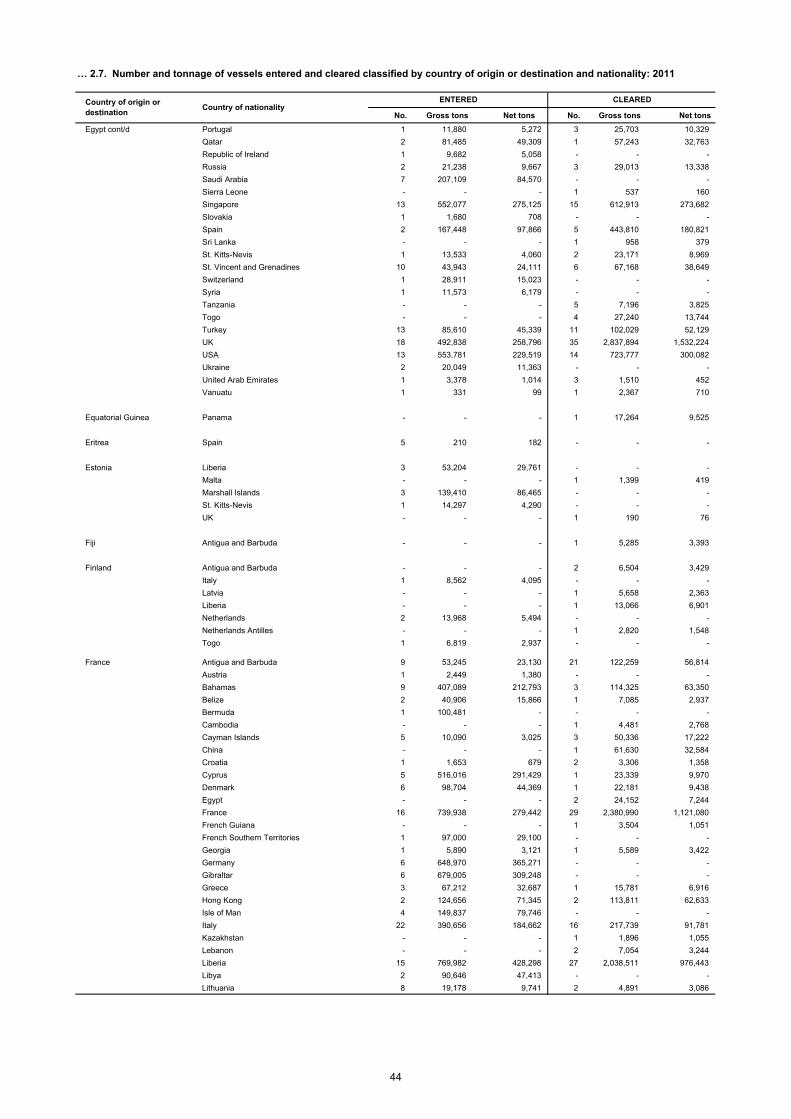
No. Gross tons Net tons No. Gross tons Net tons
Egypt cont/d Portugal 1 11,880 5,272 3 25,703 10,329
Qatar 2 81,485 49,309 1 57,243 32,763
Republic of Ireland 1 9,682 5,058 - - -
Russia 2 21,238 9,667 3 29,013 13,338
Saudi Arabia 7 207,109 84,570 - - -
Sierra Leone - - - 1 537 160
Singapore 13 552,077 275,125 15 612,913 273,682
Slovakia 1 1,680 708 - - -
Spain 2 167,448 97,866 5 443,810 180,821
Sri Lanka - - - 1 958 379
St. Kitts-Nevis 1 13,533 4,060 2 23,171 8,969
St. Vincent and Grenadines 10 43,943 24,111 6 67,168 38,649
Switzerland 1 28,911 15,023 - - -
Syria 1 11,573 6,179 - - -
Tanzania - - - 5 7,196 3,825
Togo - - - 4 27,240 13,744
Turkey 13 85,610 45,339 11 102,029 52,129
UK 18 492,838 258,796 35 2,837,894 1,532,224
USA 13 553,781 229,519 14 723,777 300,082
Ukraine 2 20,049 11,363 - - -
United Arab Emirates 1 3,378 1,014 3 1,510 452
Vanuatu 1 331 99 1 2,367 710
Equatorial Guinea Panama - - - 1 17,264 9,525
Eritrea Spain 5 210 182 - - -
Estonia Liberia 3 53,204 29,761 - - -
Malta - - - 1 1,399 419
Marshall Islands 3 139,410 86,465 - - -
St. Kitts-Nevis 1 14,297 4,290 - - -
UK - - - 1 190 76
Fiji Antigua and Barbuda - - - 1 5,285 3,393
Finland Antigua and Barbuda - - - 2 6,504 3,429
Italy 1 8,562 4,095 - - -
Latvia - - - 1 5,658 2,363
Liberia - - - 1 13,066 6,901
Netherlands 2 13,968 5,494 - - -
Netherlands Antilles - - - 1 2,820 1,548
Togo 1 6,819 2,937 - - -
France Antigua and Barbuda 9 53,245 23,130 21 122,259 56,814
Austria 1 2,449 1,380 - - -
Bahamas 9 407,089 212,793 3 114,325 63,350
Belize 2 40,906 15,866 1 7,085 2,937
Bermuda 1 100,481 - - - -
Cambodia - - - 1 4,481 2,768
Cayman Islands 5 10,090 3,025 3 50,336 17,222
China - - - 1 61,630 32,584
Croatia 1 1,653 679 2 3,306 1,358
Cyprus 5 516,016 291,429 1 23,339 9,970
Denmark 6 98,704 44,369 1 22,181 9,438
Egypt - - - 2 24,152 7,244
France 16 739,938 279,442 29 2,380,990 1,121,080
French Guiana - - - 1 3,504 1,051
French Southern Territories 1 97,000 29,100 - - -
Georgia 1 5,890 3,121 1 5,589 3,422
Germany 6 648,970 365,271 - - -
Gibraltar 6 679,005 309,248 - - -
Greece 3 67,212 32,687 1 15,781 6,916
Hong Kong 2 124,656 71,345 2 113,811 62,633
Isle of Man 4 149,837 79,746 - - -
Italy 22 390,656 184,662 16 217,739 91,781
Kazakhstan - - - 1 1,896 1,055
Lebanon - - - 2 7,054 3,244
Liberia 15 769,982 428,298 27 2,038,511 976,443
Libya 2 90,646 47,413 - - -
Lithuania 8 19,178 9,741 2 4,891 3,086
… 2.7. Number and tonnage of vessels entered and cleared classified by country of origin or destination and nationality: 2011
Country of origin or destination
Country of nationalityENTERED CLEARED
44
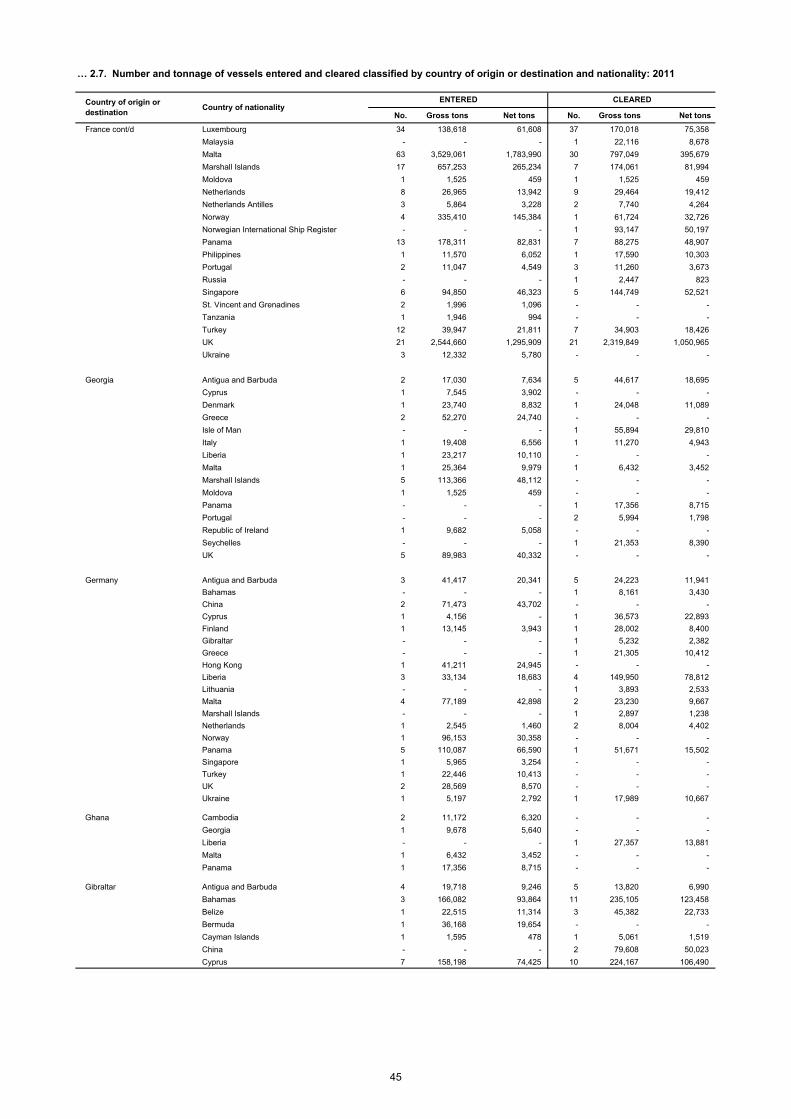
No. Gross tons Net tons No. Gross tons Net tons
France cont/d Luxembourg 34 138,618 61,608 37 170,018 75,358
Malaysia - - - 1 22,116 8,678
Malta 63 3,529,061 1,783,990 30 797,049 395,679
Marshall Islands 17 657,253 265,234 7 174,061 81,994
Moldova 1 1,525 459 1 1,525 459
Netherlands 8 26,965 13,942 9 29,464 19,412
Netherlands Antilles 3 5,864 3,228 2 7,740 4,264
Norway 4 335,410 145,384 1 61,724 32,726
Norwegian International Ship Register - - - 1 93,147 50,197
Panama 13 178,311 82,831 7 88,275 48,907
Philippines 1 11,570 6,052 1 17,590 10,303
Portugal 2 11,047 4,549 3 11,260 3,673
Russia - - - 1 2,447 823
Singapore 6 94,850 46,323 5 144,749 52,521
St. Vincent and Grenadines 2 1,996 1,096 - - -
Tanzania 1 1,946 994 - - -
Turkey 12 39,947 21,811 7 34,903 18,426
UK 21 2,544,660 1,295,909 21 2,319,849 1,050,965
Ukraine 3 12,332 5,780 - - -
Georgia Antigua and Barbuda 2 17,030 7,634 5 44,617 18,695
Cyprus 1 7,545 3,902 - - -
Denmark 1 23,740 8,832 1 24,048 11,089
Greece 2 52,270 24,740 - - -
Isle of Man - - - 1 55,894 29,810
Italy 1 19,408 6,556 1 11,270 4,943
Liberia 1 23,217 10,110 - - -
Malta 1 25,364 9,979 1 6,432 3,452
Marshall Islands 5 113,366 48,112 - - -
Moldova 1 1,525 459 - - -
Panama - - - 1 17,356 8,715
Portugal - - - 2 5,994 1,798
Republic of Ireland 1 9,682 5,058 - - -
Seychelles - - - 1 21,353 8,390
UK 5 89,983 40,332 - - -
Germany Antigua and Barbuda 3 41,417 20,341 5 24,223 11,941
Bahamas - - - 1 8,161 3,430
China 2 71,473 43,702 - - -
Cyprus 1 4,156 - 1 36,573 22,893
Finland 1 13,145 3,943 1 28,002 8,400
Gibraltar - - - 1 5,232 2,382
Greece - - - 1 21,305 10,412
Hong Kong 1 41,211 24,945 - - -
Liberia 3 33,134 18,683 4 149,950 78,812
Lithuania - - - 1 3,893 2,533
Malta 4 77,189 42,898 2 23,230 9,667
Marshall Islands - - - 1 2,897 1,238
Netherlands 1 2,545 1,460 2 8,004 4,402
Norway 1 96,153 30,358 - - -
Panama 5 110,087 66,590 1 51,671 15,502
Singapore 1 5,965 3,254 - - -
Turkey 1 22,446 10,413 - - -
UK 2 28,569 8,570 - - -
Ukraine 1 5,197 2,792 1 17,989 10,667
Ghana Cambodia 2 11,172 6,320 - - -
Georgia 1 9,678 5,640 - - -
Liberia - - - 1 27,357 13,881
Malta 1 6,432 3,452 - - -
Panama 1 17,356 8,715 - - -
Gibraltar Antigua and Barbuda 4 19,718 9,246 5 13,820 6,990
Bahamas 3 166,082 93,864 11 235,105 123,458
Belize 1 22,515 11,314 3 45,382 22,733
Bermuda 1 36,168 19,654 - - -
Cayman Islands 1 1,595 478 1 5,061 1,519
China - - - 2 79,608 50,023
Cyprus 7 158,198 74,425 10 224,167 106,490
… 2.7. Number and tonnage of vessels entered and cleared classified by country of origin or destination and nationality: 2011
Country of origin or destination
Country of nationalityENTERED CLEARED
45
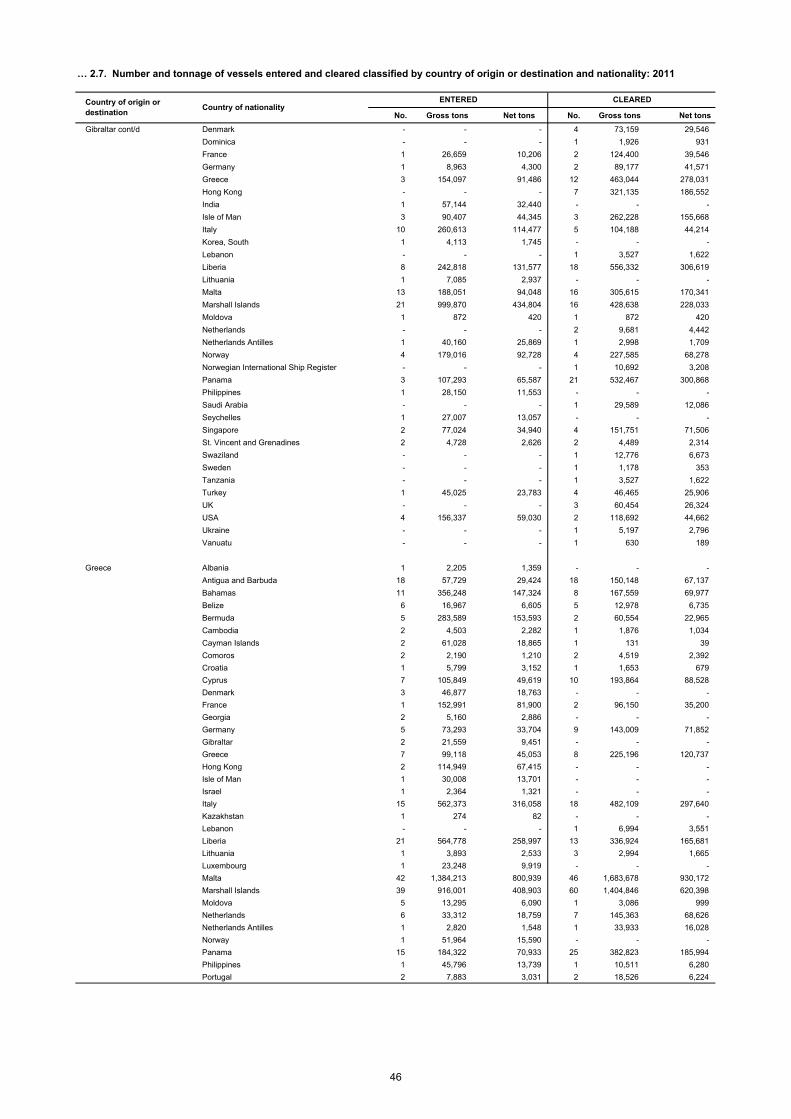
No. Gross tons Net tons No. Gross tons Net tons
Gibraltar cont/d Denmark - - - 4 73,159 29,546
Dominica - - - 1 1,926 931
France 1 26,659 10,206 2 124,400 39,546
Germany 1 8,963 4,300 2 89,177 41,571
Greece 3 154,097 91,486 12 463,044 278,031
Hong Kong - - - 7 321,135 186,552
India 1 57,144 32,440 - - -
Isle of Man 3 90,407 44,345 3 262,228 155,668
Italy 10 260,613 114,477 5 104,188 44,214
Korea, South 1 4,113 1,745 - - -
Lebanon - - - 1 3,527 1,622
Liberia 8 242,818 131,577 18 556,332 306,619
Lithuania 1 7,085 2,937 - - -
Malta 13 188,051 94,048 16 305,615 170,341
Marshall Islands 21 999,870 434,804 16 428,638 228,033
Moldova 1 872 420 1 872 420
Netherlands - - - 2 9,681 4,442
Netherlands Antilles 1 40,160 25,869 1 2,998 1,709
Norway 4 179,016 92,728 4 227,585 68,278
Norwegian International Ship Register - - - 1 10,692 3,208
Panama 3 107,293 65,587 21 532,467 300,868
Philippines 1 28,150 11,553 - - -
Saudi Arabia - - - 1 29,589 12,086
Seychelles 1 27,007 13,057 - - -
Singapore 2 77,024 34,940 4 151,751 71,506
St. Vincent and Grenadines 2 4,728 2,626 2 4,489 2,314
Swaziland - - - 1 12,776 6,673
Sweden - - - 1 1,178 353
Tanzania - - - 1 3,527 1,622
Turkey 1 45,025 23,783 4 46,465 25,906
UK - - - 3 60,454 26,324
USA 4 156,337 59,030 2 118,692 44,662
Ukraine - - - 1 5,197 2,796
Vanuatu - - - 1 630 189
Greece Albania 1 2,205 1,359 - - -
Antigua and Barbuda 18 57,729 29,424 18 150,148 67,137
Bahamas 11 356,248 147,324 8 167,559 69,977
Belize 6 16,967 6,605 5 12,978 6,735
Bermuda 5 283,589 153,593 2 60,554 22,965
Cambodia 2 4,503 2,282 1 1,876 1,034
Cayman Islands 2 61,028 18,865 1 131 39
Comoros 2 2,190 1,210 2 4,519 2,392
Croatia 1 5,799 3,152 1 1,653 679
Cyprus 7 105,849 49,619 10 193,864 88,528
Denmark 3 46,877 18,763 - - -
France 1 152,991 81,900 2 96,150 35,200
Georgia 2 5,160 2,886 - - -
Germany 5 73,293 33,704 9 143,009 71,852
Gibraltar 2 21,559 9,451 - - -
Greece 7 99,118 45,053 8 225,196 120,737
Hong Kong 2 114,949 67,415 - - -
Isle of Man 1 30,008 13,701 - - -
Israel 1 2,364 1,321 - - -
Italy 15 562,373 316,058 18 482,109 297,640
Kazakhstan 1 274 82 - - -
Lebanon - - - 1 6,994 3,551
Liberia 21 564,778 258,997 13 336,924 165,681
Lithuania 1 3,893 2,533 3 2,994 1,665
Luxembourg 1 23,248 9,919 - - -
Malta 42 1,384,213 800,939 46 1,683,678 930,172
Marshall Islands 39 916,001 408,903 60 1,404,846 620,398
Moldova 5 13,295 6,090 1 3,086 999
Netherlands 6 33,312 18,759 7 145,363 68,626
Netherlands Antilles 1 2,820 1,548 1 33,933 16,028
Norway 1 51,964 15,590 - - -
Panama 15 184,322 70,933 25 382,823 185,994
Philippines 1 45,796 13,739 1 10,511 6,280
Portugal 2 7,883 3,031 2 18,526 6,224
… 2.7. Number and tonnage of vessels entered and cleared classified by country of origin or destination and nationality: 2011
Country of origin or destination
Country of nationalityENTERED CLEARED
46
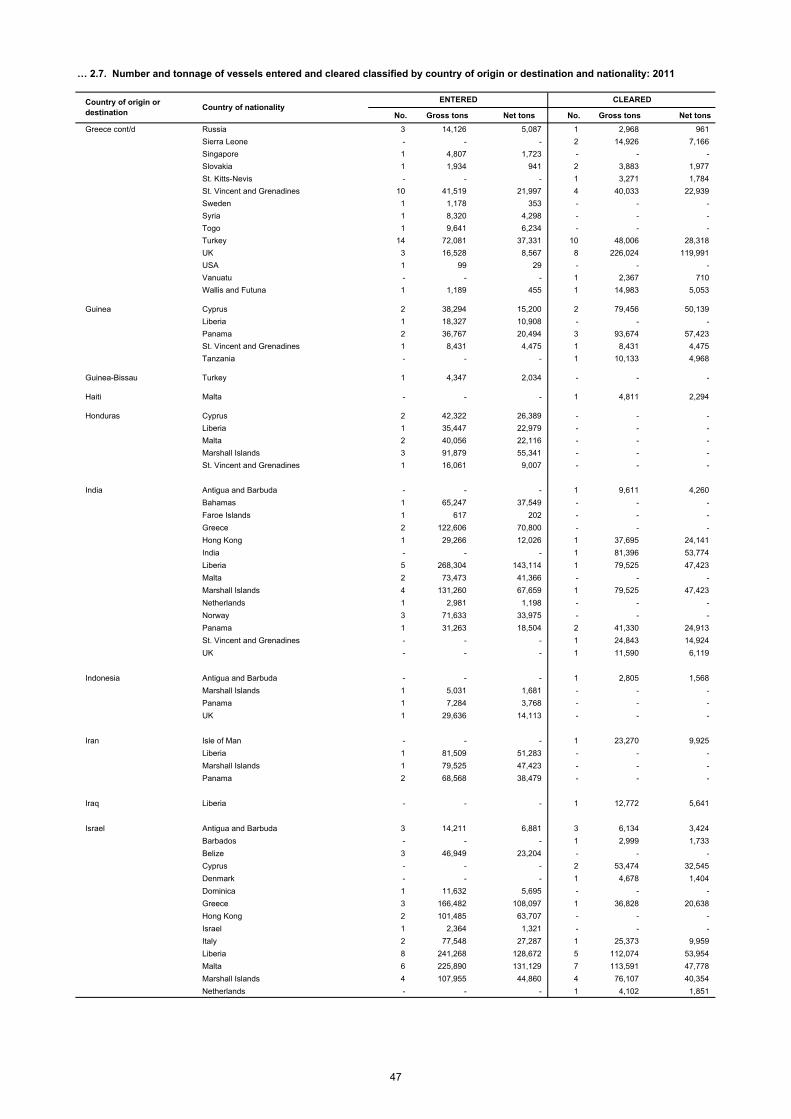
No. Gross tons Net tons No. Gross tons Net tons
Greece cont/d Russia 3 14,126 5,087 1 2,968 961
Sierra Leone - - - 2 14,926 7,166
Singapore 1 4,807 1,723 - - -
Slovakia 1 1,934 941 2 3,883 1,977
St. Kitts-Nevis - - - 1 3,271 1,784
St. Vincent and Grenadines 10 41,519 21,997 4 40,033 22,939
Sweden 1 1,178 353 - - -
Syria 1 8,320 4,298 - - -
Togo 1 9,641 6,234 - - -
Turkey 14 72,081 37,331 10 48,006 28,318
UK 3 16,528 8,567 8 226,024 119,991
USA 1 99 29 - - -
Vanuatu - - - 1 2,367 710
Wallis and Futuna 1 1,189 455 1 14,983 5,053
Guinea Cyprus 2 38,294 15,200 2 79,456 50,139
Liberia 1 18,327 10,908 - - -
Panama 2 36,767 20,494 3 93,674 57,423
St. Vincent and Grenadines 1 8,431 4,475 1 8,431 4,475
Tanzania - - - 1 10,133 4,968
Guinea-Bissau Turkey 1 4,347 2,034 - - -
Haiti Malta - - - 1 4,811 2,294
Honduras Cyprus 2 42,322 26,389 - - -
Liberia 1 35,447 22,979 - - -
Malta 2 40,056 22,116 - - -
Marshall Islands 3 91,879 55,341 - - -
St. Vincent and Grenadines 1 16,061 9,007 - - -
India Antigua and Barbuda - - - 1 9,611 4,260
Bahamas 1 65,247 37,549 - - -
Faroe Islands 1 617 202 - - -
Greece 2 122,606 70,800 - - -
Hong Kong 1 29,266 12,026 1 37,695 24,141
India - - - 1 81,396 53,774
Liberia 5 268,304 143,114 1 79,525 47,423
Malta 2 73,473 41,366 - - -
Marshall Islands 4 131,260 67,659 1 79,525 47,423
Netherlands 1 2,981 1,198 - - -
Norway 3 71,633 33,975 - - -
Panama 1 31,263 18,504 2 41,330 24,913
St. Vincent and Grenadines - - - 1 24,843 14,924
UK - - - 1 11,590 6,119
Indonesia Antigua and Barbuda - - - 1 2,805 1,568
Marshall Islands 1 5,031 1,681 - - -
Panama 1 7,284 3,768 - - -
UK 1 29,636 14,113 - - -
Iran Isle of Man - - - 1 23,270 9,925
Liberia 1 81,509 51,283 - - -
Marshall Islands 1 79,525 47,423 - - -
Panama 2 68,568 38,479 - - -
Iraq Liberia - - - 1 12,772 5,641
Israel Antigua and Barbuda 3 14,211 6,881 3 6,134 3,424
Barbados - - - 1 2,999 1,733
Belize 3 46,949 23,204 - - -
Cyprus - - - 2 53,474 32,545
Denmark - - - 1 4,678 1,404
Dominica 1 11,632 5,695 - - -
Greece 3 166,482 108,097 1 36,828 20,638
Hong Kong 2 101,485 63,707 - - -
Israel 1 2,364 1,321 - - -
Italy 2 77,548 27,287 1 25,373 9,959
Liberia 8 241,268 128,672 5 112,074 53,954
Malta 6 225,890 131,129 7 113,591 47,778
Marshall Islands 4 107,955 44,860 4 76,107 40,354
Netherlands - - - 1 4,102 1,851
… 2.7. Number and tonnage of vessels entered and cleared classified by country of origin or destination and nationality: 2011
Country of origin or destination
Country of nationalityENTERED CLEARED
47
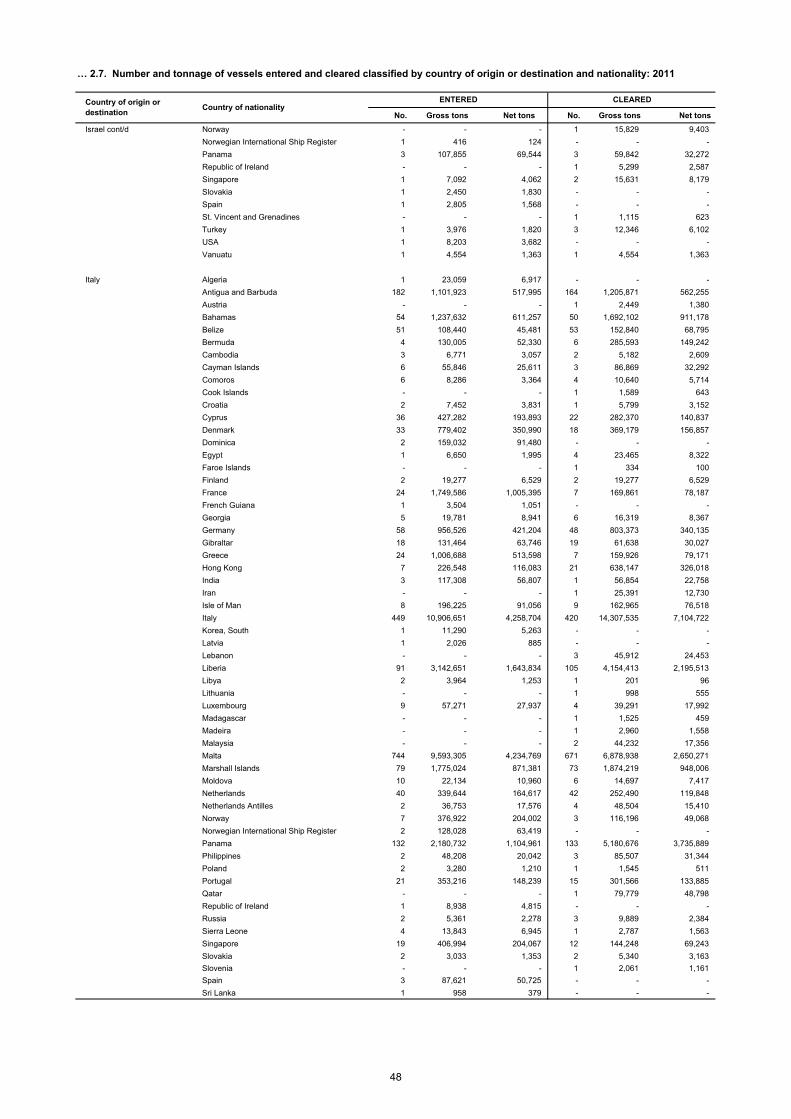
No. Gross tons Net tons No. Gross tons Net tons
Israel cont/d Norway - - - 1 15,829 9,403
Norwegian International Ship Register 1 416 124 - - -
Panama 3 107,855 69,544 3 59,842 32,272
Republic of Ireland - - - 1 5,299 2,587
Singapore 1 7,092 4,062 2 15,631 8,179
Slovakia 1 2,450 1,830 - - -
Spain 1 2,805 1,568 - - -
St. Vincent and Grenadines - - - 1 1,115 623
Turkey 1 3,976 1,820 3 12,346 6,102
USA 1 8,203 3,682 - - -
Vanuatu 1 4,554 1,363 1 4,554 1,363
Italy Algeria 1 23,059 6,917 - - -
Antigua and Barbuda 182 1,101,923 517,995 164 1,205,871 562,255
Austria - - - 1 2,449 1,380
Bahamas 54 1,237,632 611,257 50 1,692,102 911,178
Belize 51 108,440 45,481 53 152,840 68,795
Bermuda 4 130,005 52,330 6 285,593 149,242
Cambodia 3 6,771 3,057 2 5,182 2,609
Cayman Islands 6 55,846 25,611 3 86,869 32,292
Comoros 6 8,286 3,364 4 10,640 5,714
Cook Islands - - - 1 1,589 643
Croatia 2 7,452 3,831 1 5,799 3,152
Cyprus 36 427,282 193,893 22 282,370 140,837
Denmark 33 779,402 350,990 18 369,179 156,857
Dominica 2 159,032 91,480 - - -
Egypt 1 6,650 1,995 4 23,465 8,322
Faroe Islands - - - 1 334 100
Finland 2 19,277 6,529 2 19,277 6,529
France 24 1,749,586 1,005,395 7 169,861 78,187
French Guiana 1 3,504 1,051 - - -
Georgia 5 19,781 8,941 6 16,319 8,367
Germany 58 956,526 421,204 48 803,373 340,135
Gibraltar 18 131,464 63,746 19 61,638 30,027
Greece 24 1,006,688 513,598 7 159,926 79,171
Hong Kong 7 226,548 116,083 21 638,147 326,018
India 3 117,308 56,807 1 56,854 22,758
Iran - - - 1 25,391 12,730
Isle of Man 8 196,225 91,056 9 162,965 76,518
Italy 449 10,906,651 4,258,704 420 14,307,535 7,104,722
Korea, South 1 11,290 5,263 - - -
Latvia 1 2,026 885 - - -
Lebanon - - - 3 45,912 24,453
Liberia 91 3,142,651 1,643,834 105 4,154,413 2,195,513
Libya 2 3,964 1,253 1 201 96
Lithuania - - - 1 998 555
Luxembourg 9 57,271 27,937 4 39,291 17,992
Madagascar - - - 1 1,525 459
Madeira - - - 1 2,960 1,558
Malaysia - - - 2 44,232 17,356
Malta 744 9,593,305 4,234,769 671 6,878,938 2,650,271
Marshall Islands 79 1,775,024 871,381 73 1,874,219 948,006
Moldova 10 22,134 10,960 6 14,697 7,417
Netherlands 40 339,644 164,617 42 252,490 119,848
Netherlands Antilles 2 36,753 17,576 4 48,504 15,410
Norway 7 376,922 204,002 3 116,196 49,068
Norwegian International Ship Register 2 128,028 63,419 - - -
Panama 132 2,180,732 1,104,961 133 5,180,676 3,735,889
Philippines 2 48,208 20,042 3 85,507 31,344
Poland 2 3,280 1,210 1 1,545 511
Portugal 21 353,216 148,239 15 301,566 133,885
Qatar - - - 1 79,779 48,798
Republic of Ireland 1 8,938 4,815 - - -
Russia 2 5,361 2,278 3 9,889 2,384
Sierra Leone 4 13,843 6,945 1 2,787 1,563
Singapore 19 406,994 204,067 12 144,248 69,243
Slovakia 2 3,033 1,353 2 5,340 3,163
Slovenia - - - 1 2,061 1,161
Spain 3 87,621 50,725 - - -
Sri Lanka 1 958 379 - - -
… 2.7. Number and tonnage of vessels entered and cleared classified by country of origin or destination and nationality: 2011
Country of origin or destination
Country of nationalityENTERED CLEARED
48
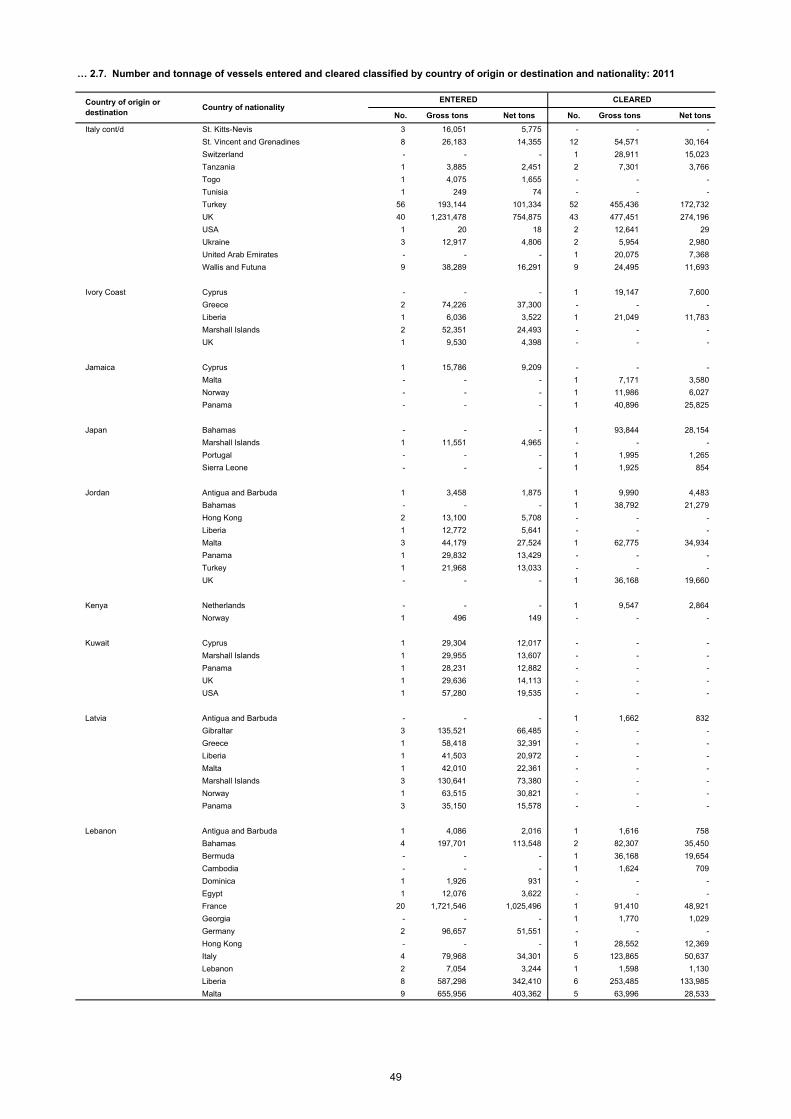
No. Gross tons Net tons No. Gross tons Net tons
Italy cont/d St. Kitts-Nevis 3 16,051 5,775 - - -
St. Vincent and Grenadines 8 26,183 14,355 12 54,571 30,164
Switzerland - - - 1 28,911 15,023
Tanzania 1 3,885 2,451 2 7,301 3,766
Togo 1 4,075 1,655 - - -
Tunisia 1 249 74 - - -
Turkey 56 193,144 101,334 52 455,436 172,732
UK 40 1,231,478 754,875 43 477,451 274,196
USA 1 20 18 2 12,641 29
Ukraine 3 12,917 4,806 2 5,954 2,980
United Arab Emirates - - - 1 20,075 7,368
Wallis and Futuna 9 38,289 16,291 9 24,495 11,693
Ivory Coast Cyprus - - - 1 19,147 7,600
Greece 2 74,226 37,300 - - -
Liberia 1 6,036 3,522 1 21,049 11,783
Marshall Islands 2 52,351 24,493 - - -
UK 1 9,530 4,398 - - -
Jamaica Cyprus 1 15,786 9,209 - - -
Malta - - - 1 7,171 3,580
Norway - - - 1 11,986 6,027
Panama - - - 1 40,896 25,825
Japan Bahamas - - - 1 93,844 28,154
Marshall Islands 1 11,551 4,965 - - -
Portugal - - - 1 1,995 1,265
Sierra Leone - - - 1 1,925 854
Jordan Antigua and Barbuda 1 3,458 1,875 1 9,990 4,483
Bahamas - - - 1 38,792 21,279
Hong Kong 2 13,100 5,708 - - -
Liberia 1 12,772 5,641 - - -
Malta 3 44,179 27,524 1 62,775 34,934
Panama 1 29,832 13,429 - - -
Turkey 1 21,968 13,033 - - -
UK - - - 1 36,168 19,660
Kenya Netherlands - - - 1 9,547 2,864
Norway 1 496 149 - - -
Kuwait Cyprus 1 29,304 12,017 - - -
Marshall Islands 1 29,955 13,607 - - -
Panama 1 28,231 12,882 - - -
UK 1 29,636 14,113 - - -
USA 1 57,280 19,535 - - -
Latvia Antigua and Barbuda - - - 1 1,662 832
Gibraltar 3 135,521 66,485 - - -
Greece 1 58,418 32,391 - - -
Liberia 1 41,503 20,972 - - -
Malta 1 42,010 22,361 - - -
Marshall Islands 3 130,641 73,380 - - -
Norway 1 63,515 30,821 - - -
Panama 3 35,150 15,578 - - -
Lebanon Antigua and Barbuda 1 4,086 2,016 1 1,616 758
Bahamas 4 197,701 113,548 2 82,307 35,450
Bermuda - - - 1 36,168 19,654
Cambodia - - - 1 1,624 709
Dominica 1 1,926 931 - - -
Egypt 1 12,076 3,622 - - -
France 20 1,721,546 1,025,496 1 91,410 48,921
Georgia - - - 1 1,770 1,029
Germany 2 96,657 51,551 - - -
Hong Kong - - - 1 28,552 12,369
Italy 4 79,968 34,301 5 123,865 50,637
Lebanon 2 7,054 3,244 1 1,598 1,130
Liberia 8 587,298 342,410 6 253,485 133,985
Malta 9 655,956 403,362 5 63,996 28,533
… 2.7. Number and tonnage of vessels entered and cleared classified by country of origin or destination and nationality: 2011
Country of origin or destination
Country of nationalityENTERED CLEARED
49
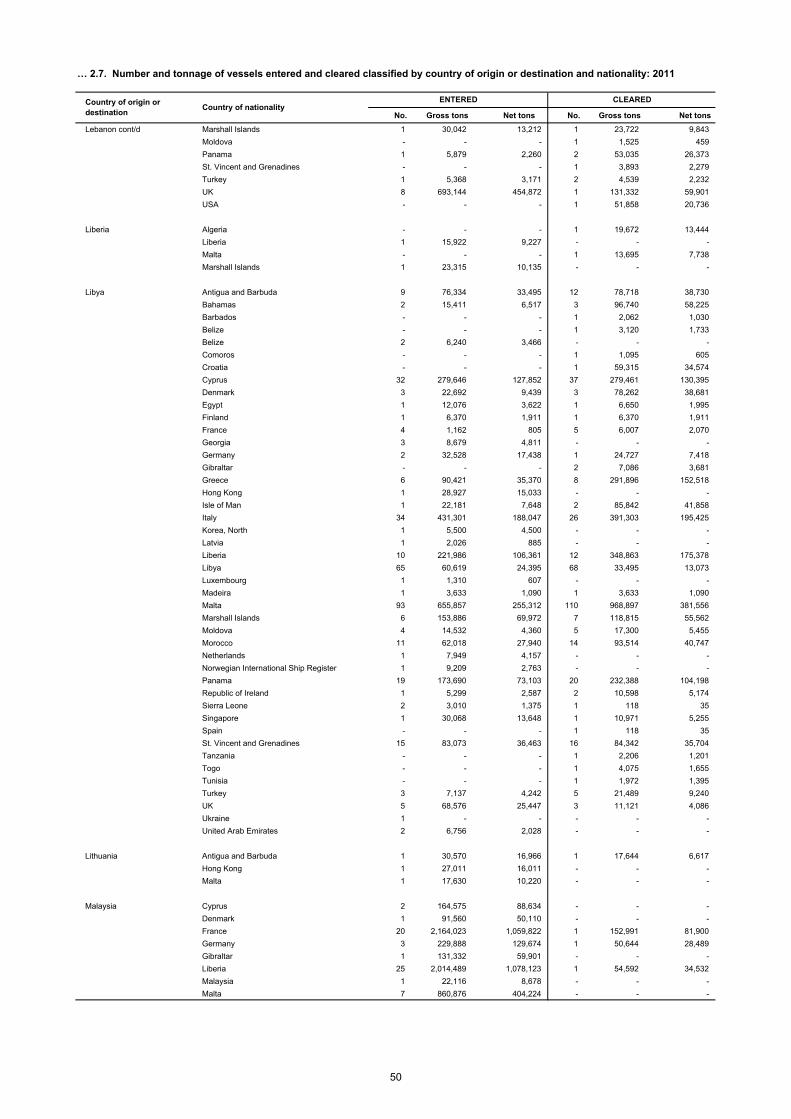
No. Gross tons Net tons No. Gross tons Net tons
Lebanon cont/d Marshall Islands 1 30,042 13,212 1 23,722 9,843
Moldova - - - 1 1,525 459
Panama 1 5,879 2,260 2 53,035 26,373
St. Vincent and Grenadines - - - 1 3,893 2,279
Turkey 1 5,368 3,171 2 4,539 2,232
UK 8 693,144 454,872 1 131,332 59,901
USA - - - 1 51,858 20,736
Liberia Algeria - - - 1 19,672 13,444
Liberia 1 15,922 9,227 - - -
Malta - - - 1 13,695 7,738
Marshall Islands 1 23,315 10,135 - - -
Libya Antigua and Barbuda 9 76,334 33,495 12 78,718 38,730
Bahamas 2 15,411 6,517 3 96,740 58,225
Barbados - - - 1 2,062 1,030
Belize - - - 1 3,120 1,733
Belize 2 6,240 3,466 - - -
Comoros - - - 1 1,095 605
Croatia - - - 1 59,315 34,574
Cyprus 32 279,646 127,852 37 279,461 130,395
Denmark 3 22,692 9,439 3 78,262 38,681
Egypt 1 12,076 3,622 1 6,650 1,995
Finland 1 6,370 1,911 1 6,370 1,911
France 4 1,162 805 5 6,007 2,070
Georgia 3 8,679 4,811 - - -
Germany 2 32,528 17,438 1 24,727 7,418
Gibraltar - - - 2 7,086 3,681
Greece 6 90,421 35,370 8 291,896 152,518
Hong Kong 1 28,927 15,033 - - -
Isle of Man 1 22,181 7,648 2 85,842 41,858
Italy 34 431,301 188,047 26 391,303 195,425
Korea, North 1 5,500 4,500 - - -
Latvia 1 2,026 885 - - -
Liberia 10 221,986 106,361 12 348,863 175,378
Libya 65 60,619 24,395 68 33,495 13,073
Luxembourg 1 1,310 607 - - -
Madeira 1 3,633 1,090 1 3,633 1,090
Malta 93 655,857 255,312 110 968,897 381,556
Marshall Islands 6 153,886 69,972 7 118,815 55,562
Moldova 4 14,532 4,360 5 17,300 5,455
Morocco 11 62,018 27,940 14 93,514 40,747
Netherlands 1 7,949 4,157 - - -
Norwegian International Ship Register 1 9,209 2,763 - - -
Panama 19 173,690 73,103 20 232,388 104,198
Republic of Ireland 1 5,299 2,587 2 10,598 5,174
Sierra Leone 2 3,010 1,375 1 118 35
Singapore 1 30,068 13,648 1 10,971 5,255
Spain - - - 1 118 35
St. Vincent and Grenadines 15 83,073 36,463 16 84,342 35,704
Tanzania - - - 1 2,206 1,201
Togo - - - 1 4,075 1,655
Tunisia - - - 1 1,972 1,395
Turkey 3 7,137 4,242 5 21,489 9,240
UK 5 68,576 25,447 3 11,121 4,086
Ukraine 1 - - - - -
United Arab Emirates 2 6,756 2,028 - - -
Lithuania Antigua and Barbuda 1 30,570 16,966 1 17,644 6,617
Hong Kong 1 27,011 16,011 - - -
Malta 1 17,630 10,220 - - -
Malaysia Cyprus 2 164,575 88,634 - - -
Denmark 1 91,560 50,110 - - -
France 20 2,164,023 1,059,822 1 152,991 81,900
Germany 3 229,888 129,674 1 50,644 28,489
Gibraltar 1 131,332 59,901 - - -
Liberia 25 2,014,489 1,078,123 1 54,592 34,532
Malaysia 1 22,116 8,678 - - -
Malta 7 860,876 404,224 - - -
… 2.7. Number and tonnage of vessels entered and cleared classified by country of origin or destination and nationality: 2011
Country of origin or destination
Country of nationalityENTERED CLEARED
50
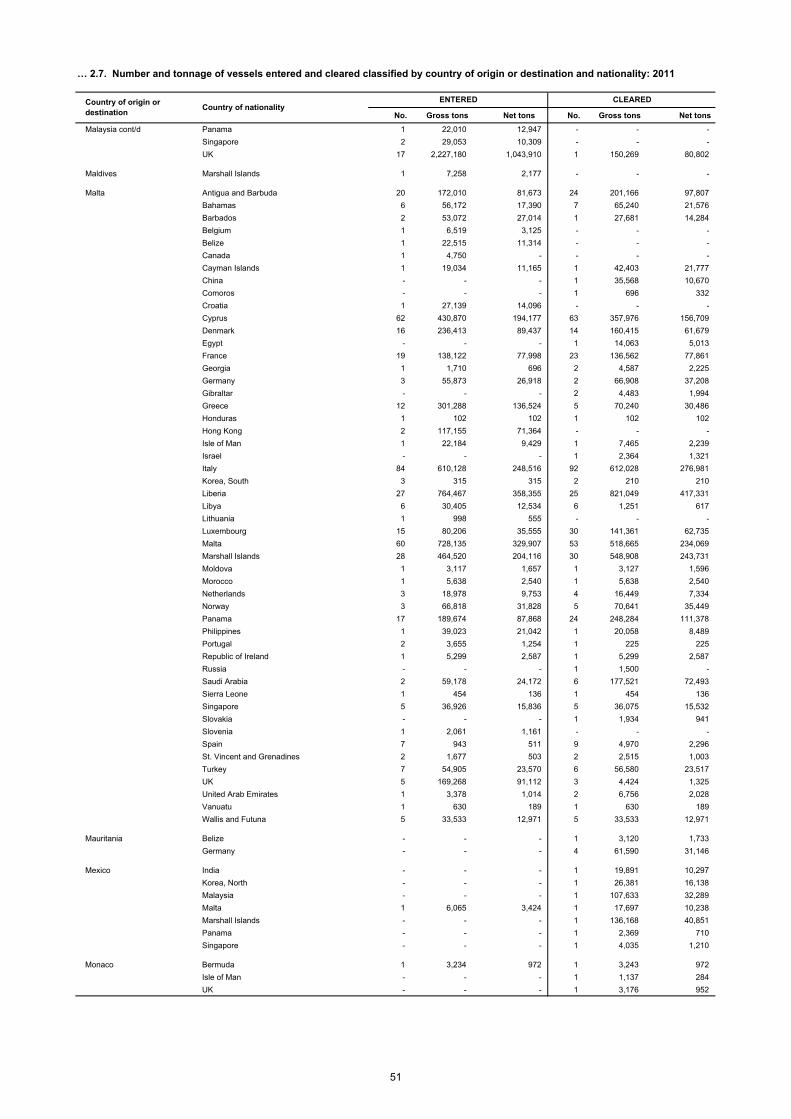
No. Gross tons Net tons No. Gross tons Net tons
Malaysia cont/d Panama 1 22,010 12,947 - - -
Singapore 2 29,053 10,309 - - -
UK 17 2,227,180 1,043,910 1 150,269 80,802
Maldives Marshall Islands 1 7,258 2,177 - - -
Malta Antigua and Barbuda 20 172,010 81,673 24 201,166 97,807
Bahamas 6 56,172 17,390 7 65,240 21,576
Barbados 2 53,072 27,014 1 27,681 14,284
Belgium 1 6,519 3,125 - - -
Belize 1 22,515 11,314 - - -
Canada 1 4,750 - - - -
Cayman Islands 1 19,034 11,165 1 42,403 21,777
China - - - 1 35,568 10,670
Comoros - - - 1 696 332
Croatia 1 27,139 14,096 - - -
Cyprus 62 430,870 194,177 63 357,976 156,709
Denmark 16 236,413 89,437 14 160,415 61,679
Egypt - - - 1 14,063 5,013
France 19 138,122 77,998 23 136,562 77,861
Georgia 1 1,710 696 2 4,587 2,225
Germany 3 55,873 26,918 2 66,908 37,208
Gibraltar - - - 2 4,483 1,994
Greece 12 301,288 136,524 5 70,240 30,486
Honduras 1 102 102 1 102 102
Hong Kong 2 117,155 71,364 - - -
Isle of Man 1 22,184 9,429 1 7,465 2,239
Israel - - - 1 2,364 1,321
Italy 84 610,128 248,516 92 612,028 276,981
Korea, South 3 315 315 2 210 210
Liberia 27 764,467 358,355 25 821,049 417,331
Libya 6 30,405 12,534 6 1,251 617
Lithuania 1 998 555 - - -
Luxembourg 15 80,206 35,555 30 141,361 62,735
Malta 60 728,135 329,907 53 518,665 234,069
Marshall Islands 28 464,520 204,116 30 548,908 243,731
Moldova 1 3,117 1,657 1 3,127 1,596
Morocco 1 5,638 2,540 1 5,638 2,540
Netherlands 3 18,978 9,753 4 16,449 7,334
Norway 3 66,818 31,828 5 70,641 35,449
Panama 17 189,674 87,868 24 248,284 111,378
Philippines 1 39,023 21,042 1 20,058 8,489
Portugal 2 3,655 1,254 1 225 225
Republic of Ireland 1 5,299 2,587 1 5,299 2,587
Russia - - - 1 1,500 -
Saudi Arabia 2 59,178 24,172 6 177,521 72,493
Sierra Leone 1 454 136 1 454 136
Singapore 5 36,926 15,836 5 36,075 15,532
Slovakia - - - 1 1,934 941
Slovenia 1 2,061 1,161 - - -
Spain 7 943 511 9 4,970 2,296
St. Vincent and Grenadines 2 1,677 503 2 2,515 1,003
Turkey 7 54,905 23,570 6 56,580 23,517
UK 5 169,268 91,112 3 4,424 1,325
United Arab Emirates 1 3,378 1,014 2 6,756 2,028
Vanuatu 1 630 189 1 630 189
Wallis and Futuna 5 33,533 12,971 5 33,533 12,971
Mauritania Belize - - - 1 3,120 1,733
Germany - - - 4 61,590 31,146
Mexico India - - - 1 19,891 10,297
Korea, North - - - 1 26,381 16,138
Malaysia - - - 1 107,633 32,289
Malta 1 6,065 3,424 1 17,697 10,238
Marshall Islands - - - 1 136,168 40,851
Panama - - - 1 2,369 710
Singapore - - - 1 4,035 1,210
Monaco Bermuda 1 3,234 972 1 3,243 972
Isle of Man - - - 1 1,137 284
UK - - - 1 3,176 952
… 2.7. Number and tonnage of vessels entered and cleared classified by country of origin or destination and nationality: 2011
Country of origin or destination
Country of nationalityENTERED CLEARED
51
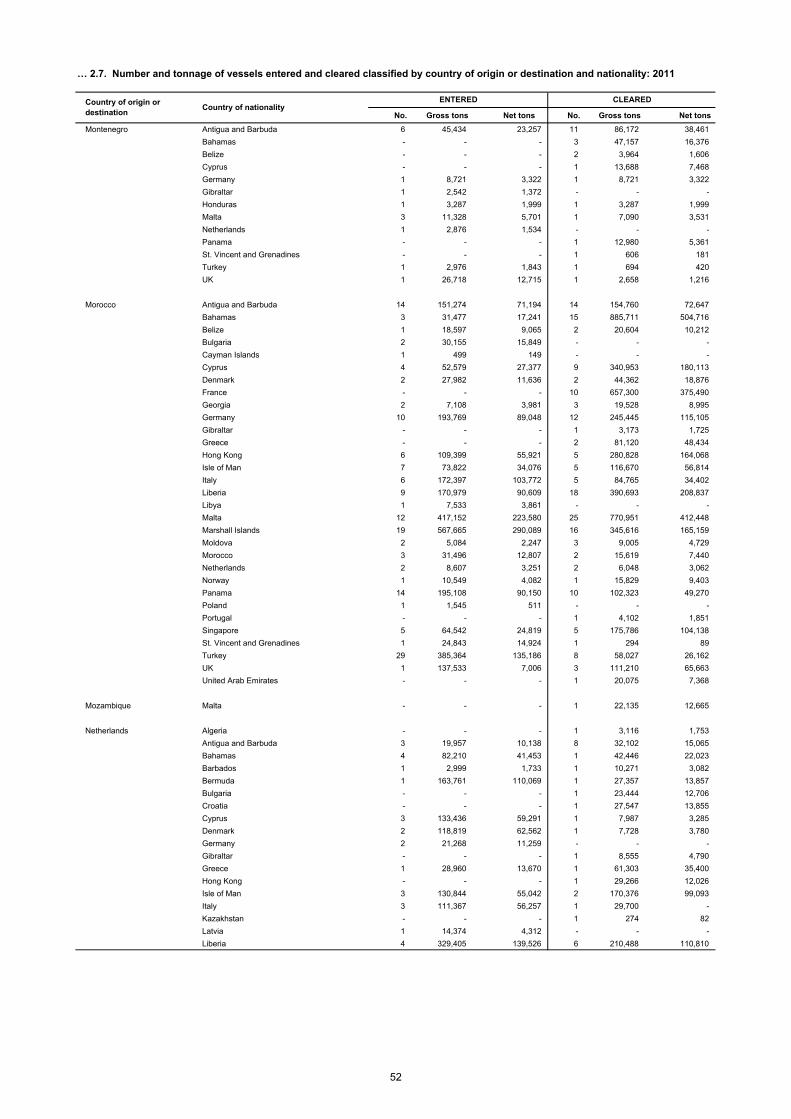
No. Gross tons Net tons No. Gross tons Net tons
Montenegro Antigua and Barbuda 6 45,434 23,257 11 86,172 38,461
Bahamas - - - 3 47,157 16,376
Belize - - - 2 3,964 1,606
Cyprus - - - 1 13,688 7,468
Germany 1 8,721 3,322 1 8,721 3,322
Gibraltar 1 2,542 1,372 - - -
Honduras 1 3,287 1,999 1 3,287 1,999
Malta 3 11,328 5,701 1 7,090 3,531
Netherlands 1 2,876 1,534 - - -
Panama - - - 1 12,980 5,361
St. Vincent and Grenadines - - - 1 606 181
Turkey 1 2,976 1,843 1 694 420
UK 1 26,718 12,715 1 2,658 1,216
Morocco Antigua and Barbuda 14 151,274 71,194 14 154,760 72,647
Bahamas 3 31,477 17,241 15 885,711 504,716
Belize 1 18,597 9,065 2 20,604 10,212
Bulgaria 2 30,155 15,849 - - -
Cayman Islands 1 499 149 - - -
Cyprus 4 52,579 27,377 9 340,953 180,113
Denmark 2 27,982 11,636 2 44,362 18,876
France - - - 10 657,300 375,490
Georgia 2 7,108 3,981 3 19,528 8,995
Germany 10 193,769 89,048 12 245,445 115,105
Gibraltar - - - 1 3,173 1,725
Greece - - - 2 81,120 48,434
Hong Kong 6 109,399 55,921 5 280,828 164,068
Isle of Man 7 73,822 34,076 5 116,670 56,814
Italy 6 172,397 103,772 5 84,765 34,402
Liberia 9 170,979 90,609 18 390,693 208,837
Libya 1 7,533 3,861 - - -
Malta 12 417,152 223,580 25 770,951 412,448
Marshall Islands 19 567,665 290,089 16 345,616 165,159
Moldova 2 5,084 2,247 3 9,005 4,729
Morocco 3 31,496 12,807 2 15,619 7,440
Netherlands 2 8,607 3,251 2 6,048 3,062
Norway 1 10,549 4,082 1 15,829 9,403
Panama 14 195,108 90,150 10 102,323 49,270
Poland 1 1,545 511 - - -
Portugal - - - 1 4,102 1,851
Singapore 5 64,542 24,819 5 175,786 104,138
St. Vincent and Grenadines 1 24,843 14,924 1 294 89
Turkey 29 385,364 135,186 8 58,027 26,162
UK 1 137,533 7,006 3 111,210 65,663
United Arab Emirates - - - 1 20,075 7,368
Mozambique Malta - - - 1 22,135 12,665
Netherlands Algeria - - - 1 3,116 1,753
Antigua and Barbuda 3 19,957 10,138 8 32,102 15,065
Bahamas 4 82,210 41,453 1 42,446 22,023
Barbados 1 2,999 1,733 1 10,271 3,082
Bermuda 1 163,761 110,069 1 27,357 13,857
Bulgaria - - - 1 23,444 12,706
Croatia - - - 1 27,547 13,855
Cyprus 3 133,436 59,291 1 7,987 3,285
Denmark 2 118,819 62,562 1 7,728 3,780
Germany 2 21,268 11,259 - - -
Gibraltar - - - 1 8,555 4,790
Greece 1 28,960 13,670 1 61,303 35,400
Hong Kong - - - 1 29,266 12,026
Isle of Man 3 130,844 55,042 2 170,376 99,093
Italy 3 111,367 56,257 1 29,700 -
Kazakhstan - - - 1 274 82
Latvia 1 14,374 4,312 - - -
Liberia 4 329,405 139,526 6 210,488 110,810
… 2.7. Number and tonnage of vessels entered and cleared classified by country of origin or destination and nationality: 2011
Country of origin or destination
Country of nationalityENTERED CLEARED
52
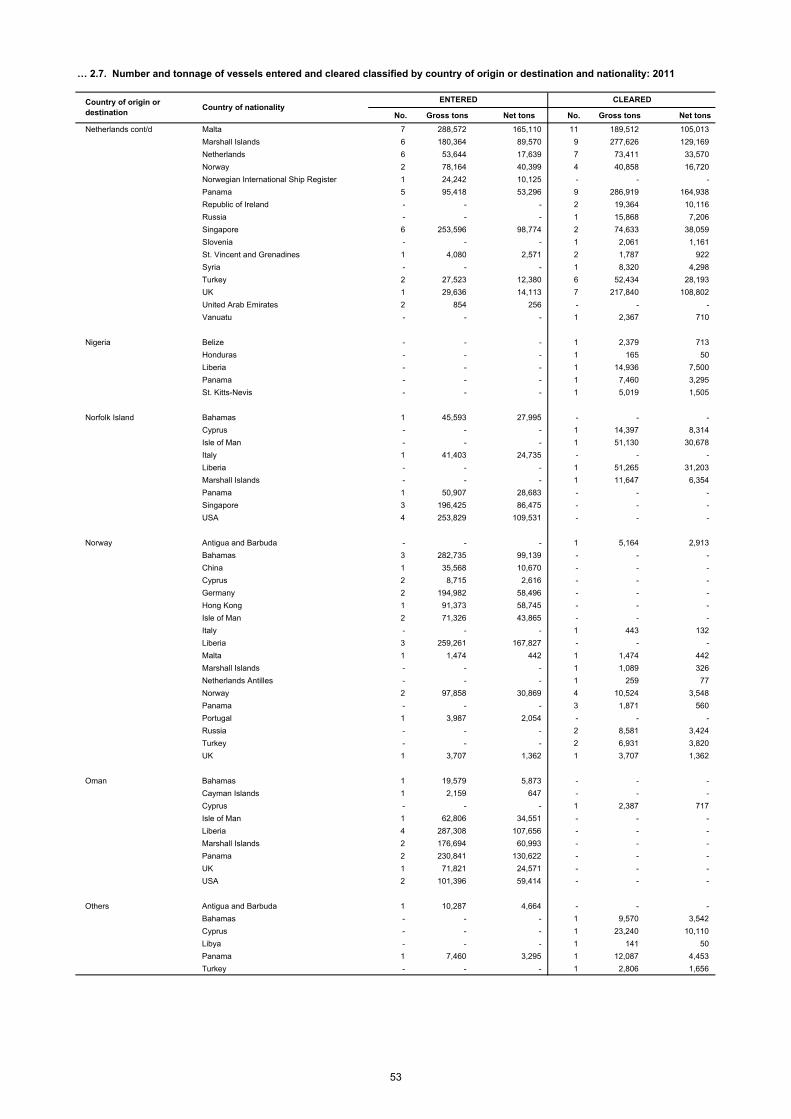
No. Gross tons Net tons No. Gross tons Net tons
Netherlands cont/d Malta 7 288,572 165,110 11 189,512 105,013
Marshall Islands 6 180,364 89,570 9 277,626 129,169
Netherlands 6 53,644 17,639 7 73,411 33,570
Norway 2 78,164 40,399 4 40,858 16,720
Norwegian International Ship Register 1 24,242 10,125 - - -
Panama 5 95,418 53,296 9 286,919 164,938
Republic of Ireland - - - 2 19,364 10,116
Russia - - - 1 15,868 7,206
Singapore 6 253,596 98,774 2 74,633 38,059
Slovenia - - - 1 2,061 1,161
St. Vincent and Grenadines 1 4,080 2,571 2 1,787 922
Syria - - - 1 8,320 4,298
Turkey 2 27,523 12,380 6 52,434 28,193
UK 1 29,636 14,113 7 217,840 108,802
United Arab Emirates 2 854 256 - - -
Vanuatu - - - 1 2,367 710
Nigeria Belize - - - 1 2,379 713
Honduras - - - 1 165 50
Liberia - - - 1 14,936 7,500
Panama - - - 1 7,460 3,295
St. Kitts-Nevis - - - 1 5,019 1,505
Norfolk Island Bahamas 1 45,593 27,995 - - -
Cyprus - - - 1 14,397 8,314
Isle of Man - - - 1 51,130 30,678
Italy 1 41,403 24,735 - - -
Liberia - - - 1 51,265 31,203
Marshall Islands - - - 1 11,647 6,354
Panama 1 50,907 28,683 - - -
Singapore 3 196,425 86,475 - - -
USA 4 253,829 109,531 - - -
Norway Antigua and Barbuda - - - 1 5,164 2,913
Bahamas 3 282,735 99,139 - - -
China 1 35,568 10,670 - - -
Cyprus 2 8,715 2,616 - - -
Germany 2 194,982 58,496 - - -
Hong Kong 1 91,373 58,745 - - -
Isle of Man 2 71,326 43,865 - - -
Italy - - - 1 443 132
Liberia 3 259,261 167,827 - - -
Malta 1 1,474 442 1 1,474 442
Marshall Islands - - - 1 1,089 326
Netherlands Antilles - - - 1 259 77
Norway 2 97,858 30,869 4 10,524 3,548
Panama - - - 3 1,871 560
Portugal 1 3,987 2,054 - - -
Russia - - - 2 8,581 3,424
Turkey - - - 2 6,931 3,820
UK 1 3,707 1,362 1 3,707 1,362
Oman Bahamas 1 19,579 5,873 - - -
Cayman Islands 1 2,159 647 - - -
Cyprus - - - 1 2,387 717
Isle of Man 1 62,806 34,551 - - -
Liberia 4 287,308 107,656 - - -
Marshall Islands 2 176,694 60,993 - - -
Panama 2 230,841 130,622 - - -
UK 1 71,821 24,571 - - -
USA 2 101,396 59,414 - - -
Others Antigua and Barbuda 1 10,287 4,664 - - -
Bahamas - - - 1 9,570 3,542
Cyprus - - - 1 23,240 10,110
Libya - - - 1 141 50
Panama 1 7,460 3,295 1 12,087 4,453
Turkey - - - 1 2,806 1,656
… 2.7. Number and tonnage of vessels entered and cleared classified by country of origin or destination and nationality: 2011
Country of origin or destination
Country of nationalityENTERED CLEARED
53
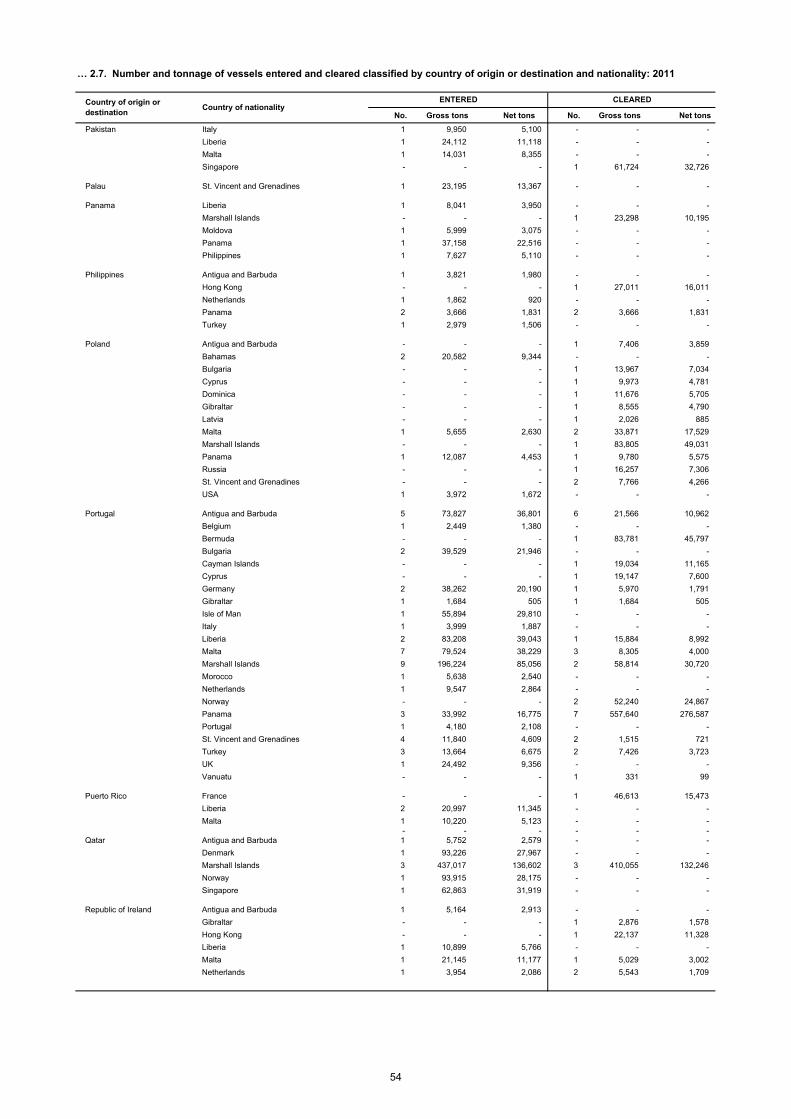
No. Gross tons Net tons No. Gross tons Net tons
Pakistan Italy 1 9,950 5,100 - - -
Liberia 1 24,112 11,118 - - -
Malta 1 14,031 8,355 - - -
Singapore - - - 1 61,724 32,726
Palau St. Vincent and Grenadines 1 23,195 13,367 - - -
Panama Liberia 1 8,041 3,950 - - -
Marshall Islands - - - 1 23,298 10,195
Moldova 1 5,999 3,075 - - -
Panama 1 37,158 22,516 - - -
Philippines 1 7,627 5,110 - - -
Philippines Antigua and Barbuda 1 3,821 1,980 - - -
Hong Kong - - - 1 27,011 16,011
Netherlands 1 1,862 920 - - -
Panama 2 3,666 1,831 2 3,666 1,831
Turkey 1 2,979 1,506 - - -
Poland Antigua and Barbuda - - - 1 7,406 3,859
Bahamas 2 20,582 9,344 - - -
Bulgaria - - - 1 13,967 7,034
Cyprus - - - 1 9,973 4,781
Dominica - - - 1 11,676 5,705
Gibraltar - - - 1 8,555 4,790
Latvia - - - 1 2,026 885
Malta 1 5,655 2,630 2 33,871 17,529
Marshall Islands - - - 1 83,805 49,031
Panama 1 12,087 4,453 1 9,780 5,575
Russia - - - 1 16,257 7,306
St. Vincent and Grenadines - - - 2 7,766 4,266
USA 1 3,972 1,672 - - -
Portugal Antigua and Barbuda 5 73,827 36,801 6 21,566 10,962
Belgium 1 2,449 1,380 - - -
Bermuda - - - 1 83,781 45,797
Bulgaria 2 39,529 21,946 - - -
Cayman Islands - - - 1 19,034 11,165
Cyprus - - - 1 19,147 7,600
Germany 2 38,262 20,190 1 5,970 1,791
Gibraltar 1 1,684 505 1 1,684 505
Isle of Man 1 55,894 29,810 - - -
Italy 1 3,999 1,887 - - -
Liberia 2 83,208 39,043 1 15,884 8,992
Malta 7 79,524 38,229 3 8,305 4,000
Marshall Islands 9 196,224 85,056 2 58,814 30,720
Morocco 1 5,638 2,540 - - -
Netherlands 1 9,547 2,864 - - -
Norway - - - 2 52,240 24,867
Panama 3 33,992 16,775 7 557,640 276,587
Portugal 1 4,180 2,108 - - -
St. Vincent and Grenadines 4 11,840 4,609 2 1,515 721
Turkey 3 13,664 6,675 2 7,426 3,723
UK 1 24,492 9,356 - - -
Vanuatu - - - 1 331 99
Puerto Rico France - - - 1 46,613 15,473
Liberia 2 20,997 11,345 - - -
Malta 1 10,220 5,123 - - - - - - - - -
Qatar Antigua and Barbuda 1 5,752 2,579 - - -
Denmark 1 93,226 27,967 - - -
Marshall Islands 3 437,017 136,602 3 410,055 132,246
Norway 1 93,915 28,175 - - -
Singapore 1 62,863 31,919 - - -
Republic of Ireland Antigua and Barbuda 1 5,164 2,913 - - -
Gibraltar - - - 1 2,876 1,578
Hong Kong - - - 1 22,137 11,328
Liberia 1 10,899 5,766 - - -
Malta 1 21,145 11,177 1 5,029 3,002
Netherlands 1 3,954 2,086 2 5,543 1,709
… 2.7. Number and tonnage of vessels entered and cleared classified by country of origin or destination and nationality: 2011
Country of origin or destination
Country of nationalityENTERED CLEARED
54
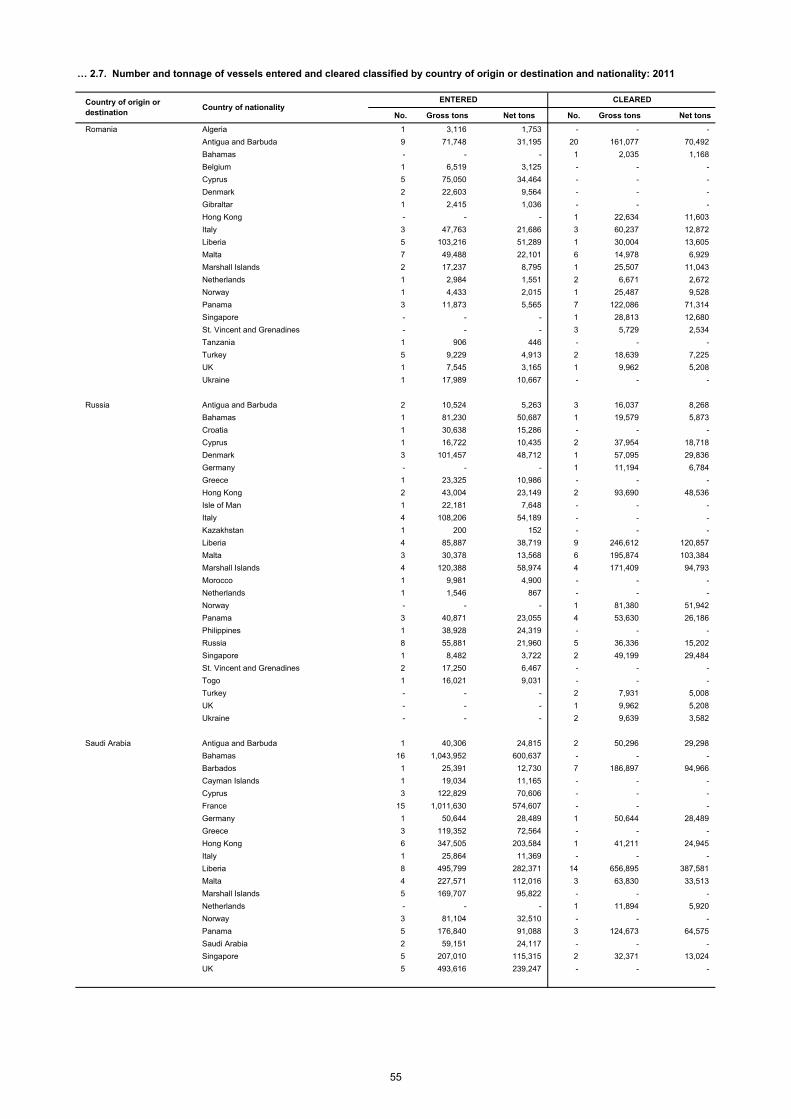
No. Gross tons Net tons No. Gross tons Net tons
Romania Algeria 1 3,116 1,753 - - -
Antigua and Barbuda 9 71,748 31,195 20 161,077 70,492
Bahamas - - - 1 2,035 1,168
Belgium 1 6,519 3,125 - - -
Cyprus 5 75,050 34,464 - - -
Denmark 2 22,603 9,564 - - -
Gibraltar 1 2,415 1,036 - - -
Hong Kong - - - 1 22,634 11,603
Italy 3 47,763 21,686 3 60,237 12,872
Liberia 5 103,216 51,289 1 30,004 13,605
Malta 7 49,488 22,101 6 14,978 6,929
Marshall Islands 2 17,237 8,795 1 25,507 11,043
Netherlands 1 2,984 1,551 2 6,671 2,672
Norway 1 4,433 2,015 1 25,487 9,528
Panama 3 11,873 5,565 7 122,086 71,314
Singapore - - - 1 28,813 12,680
St. Vincent and Grenadines - - - 3 5,729 2,534
Tanzania 1 906 446 - - -
Turkey 5 9,229 4,913 2 18,639 7,225
UK 1 7,545 3,165 1 9,962 5,208
Ukraine 1 17,989 10,667 - - -
Russia Antigua and Barbuda 2 10,524 5,263 3 16,037 8,268
Bahamas 1 81,230 50,687 1 19,579 5,873
Croatia 1 30,638 15,286 - - -
Cyprus 1 16,722 10,435 2 37,954 18,718
Denmark 3 101,457 48,712 1 57,095 29,836
Germany - - - 1 11,194 6,784
Greece 1 23,325 10,986 - - -
Hong Kong 2 43,004 23,149 2 93,690 48,536
Isle of Man 1 22,181 7,648 - - -
Italy 4 108,206 54,189 - - -
Kazakhstan 1 200 152 - - -
Liberia 4 85,887 38,719 9 246,612 120,857
Malta 3 30,378 13,568 6 195,874 103,384
Marshall Islands 4 120,388 58,974 4 171,409 94,793
Morocco 1 9,981 4,900 - - -
Netherlands 1 1,546 867 - - -
Norway - - - 1 81,380 51,942
Panama 3 40,871 23,055 4 53,630 26,186
Philippines 1 38,928 24,319 - - -
Russia 8 55,881 21,960 5 36,336 15,202
Singapore 1 8,482 3,722 2 49,199 29,484
St. Vincent and Grenadines 2 17,250 6,467 - - -
Togo 1 16,021 9,031 - - -
Turkey - - - 2 7,931 5,008
UK - - - 1 9,962 5,208
Ukraine - - - 2 9,639 3,582
Saudi Arabia Antigua and Barbuda 1 40,306 24,815 2 50,296 29,298
Bahamas 16 1,043,952 600,637 - - -
Barbados 1 25,391 12,730 7 186,897 94,966
Cayman Islands 1 19,034 11,165 - - -
Cyprus 3 122,829 70,606 - - -
France 15 1,011,630 574,607 - - -
Germany 1 50,644 28,489 1 50,644 28,489
Greece 3 119,352 72,564 - - -
Hong Kong 6 347,505 203,584 1 41,211 24,945
Italy 1 25,864 11,369 - - -
Liberia 8 495,799 282,371 14 656,895 387,581
Malta 4 227,571 112,016 3 63,830 33,513
Marshall Islands 5 169,707 95,822 - - -
Netherlands - - - 1 11,894 5,920
Norway 3 81,104 32,510 - - -
Panama 5 176,840 91,088 3 124,673 64,575
Saudi Arabia 2 59,151 24,117 - - -
Singapore 5 207,010 115,315 2 32,371 13,024
UK 5 493,616 239,247 - - -
… 2.7. Number and tonnage of vessels entered and cleared classified by country of origin or destination and nationality: 2011
Country of origin or destination
Country of nationalityENTERED CLEARED
55
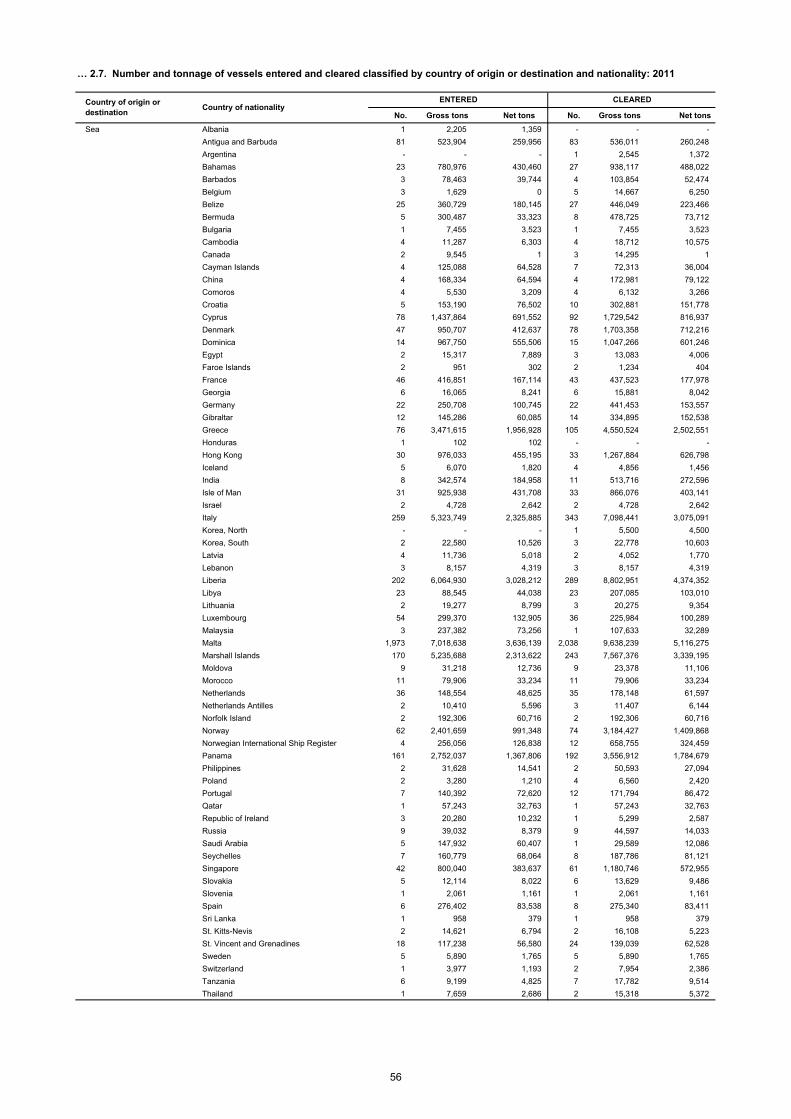
No. Gross tons Net tons No. Gross tons Net tons
Sea Albania 1 2,205 1,359 - - -
Antigua and Barbuda 81 523,904 259,956 83 536,011 260,248
Argentina - - - 1 2,545 1,372
Bahamas 23 780,976 430,460 27 938,117 488,022
Barbados 3 78,463 39,744 4 103,854 52,474
Belgium 3 1,629 0 5 14,667 6,250
Belize 25 360,729 180,145 27 446,049 223,466
Bermuda 5 300,487 33,323 8 478,725 73,712
Bulgaria 1 7,455 3,523 1 7,455 3,523
Cambodia 4 11,287 6,303 4 18,712 10,575
Canada 2 9,545 1 3 14,295 1
Cayman Islands 4 125,088 64,528 7 72,313 36,004
China 4 168,334 64,594 4 172,981 79,122
Comoros 4 5,530 3,209 4 6,132 3,266
Croatia 5 153,190 76,502 10 302,881 151,778
Cyprus 78 1,437,864 691,552 92 1,729,542 816,937
Denmark 47 950,707 412,637 78 1,703,358 712,216
Dominica 14 967,750 555,506 15 1,047,266 601,246
Egypt 2 15,317 7,889 3 13,083 4,006
Faroe Islands 2 951 302 2 1,234 404
France 46 416,851 167,114 43 437,523 177,978
Georgia 6 16,065 8,241 6 15,881 8,042
Germany 22 250,708 100,745 22 441,453 153,557
Gibraltar 12 145,286 60,085 14 334,895 152,538
Greece 76 3,471,615 1,956,928 105 4,550,524 2,502,551
Honduras 1 102 102 - - -
Hong Kong 30 976,033 455,195 33 1,267,884 626,798
Iceland 5 6,070 1,820 4 4,856 1,456
India 8 342,574 184,958 11 513,716 272,596
Isle of Man 31 925,938 431,708 33 866,076 403,141
Israel 2 4,728 2,642 2 4,728 2,642
Italy 259 5,323,749 2,325,885 343 7,098,441 3,075,091
Korea, North - - - 1 5,500 4,500
Korea, South 2 22,580 10,526 3 22,778 10,603
Latvia 4 11,736 5,018 2 4,052 1,770
Lebanon 3 8,157 4,319 3 8,157 4,319
Liberia 202 6,064,930 3,028,212 289 8,802,951 4,374,352
Libya 23 88,545 44,038 23 207,085 103,010
Lithuania 2 19,277 8,799 3 20,275 9,354
Luxembourg 54 299,370 132,905 36 225,984 100,289
Malaysia 3 237,382 73,256 1 107,633 32,289
Malta 1,973 7,018,638 3,636,139 2,038 9,638,239 5,116,275
Marshall Islands 170 5,235,688 2,313,622 243 7,567,376 3,339,195
Moldova 9 31,218 12,736 9 23,378 11,106
Morocco 11 79,906 33,234 11 79,906 33,234
Netherlands 36 148,554 48,625 35 178,148 61,597
Netherlands Antilles 2 10,410 5,596 3 11,407 6,144
Norfolk Island 2 192,306 60,716 2 192,306 60,716
Norway 62 2,401,659 991,348 74 3,184,427 1,409,868
Norwegian International Ship Register 4 256,056 126,838 12 658,755 324,459
Panama 161 2,752,037 1,367,806 192 3,556,912 1,784,679
Philippines 2 31,628 14,541 2 50,593 27,094
Poland 2 3,280 1,210 4 6,560 2,420
Portugal 7 140,392 72,620 12 171,794 86,472
Qatar 1 57,243 32,763 1 57,243 32,763
Republic of Ireland 3 20,280 10,232 1 5,299 2,587
Russia 9 39,032 8,379 9 44,597 14,033
Saudi Arabia 5 147,932 60,407 1 29,589 12,086
Seychelles 7 160,779 68,064 8 187,786 81,121
Singapore 42 800,040 383,637 61 1,180,746 572,955
Slovakia 5 12,114 8,022 6 13,629 9,486
Slovenia 1 2,061 1,161 1 2,061 1,161
Spain 6 276,402 83,538 8 275,340 83,411
Sri Lanka 1 958 379 1 958 379
St. Kitts-Nevis 2 14,621 6,794 2 16,108 5,223
St. Vincent and Grenadines 18 117,238 56,580 24 139,039 62,528
Sweden 5 5,890 1,765 5 5,890 1,765
Switzerland 1 3,977 1,193 2 7,954 2,386
Tanzania 6 9,199 4,825 7 17,782 9,514
Thailand 1 7,659 2,686 2 15,318 5,372
… 2.7. Number and tonnage of vessels entered and cleared classified by country of origin or destination and nationality: 2011
Country of origin or destination
Country of nationalityENTERED CLEARED
56
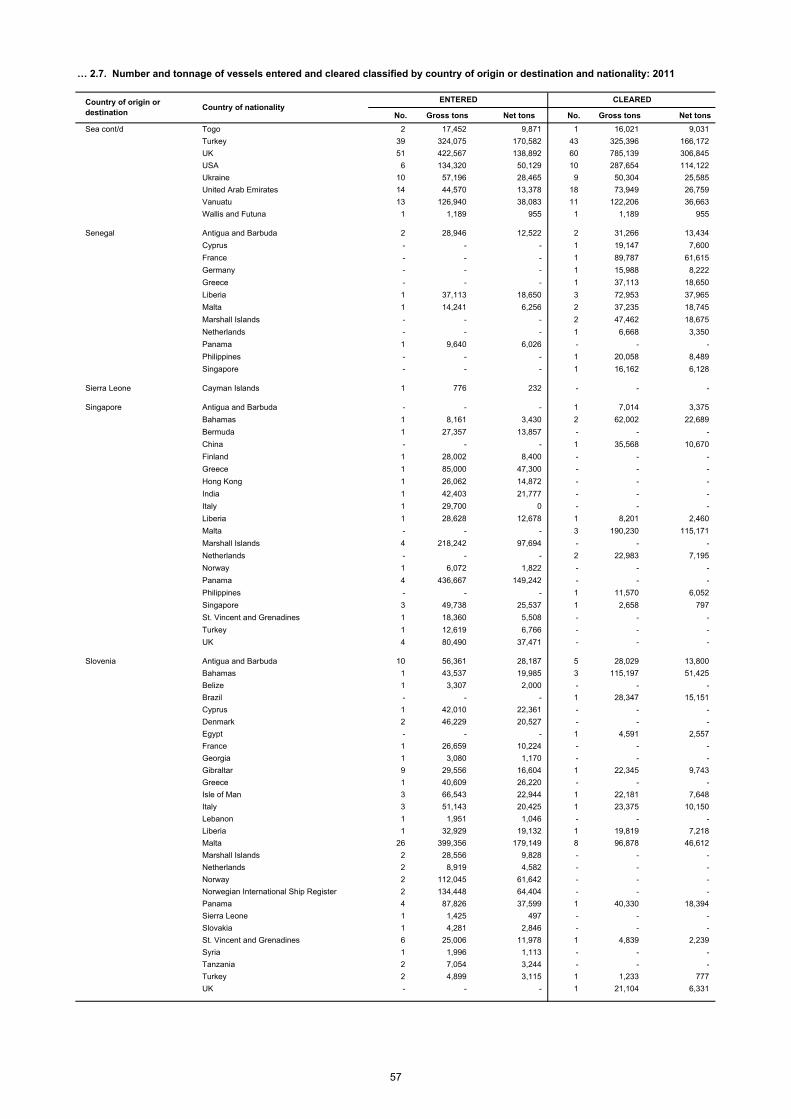
No. Gross tons Net tons No. Gross tons Net tons
Sea cont/d Togo 2 17,452 9,871 1 16,021 9,031
Turkey 39 324,075 170,582 43 325,396 166,172
UK 51 422,567 138,892 60 785,139 306,845
USA 6 134,320 50,129 10 287,654 114,122
Ukraine 10 57,196 28,465 9 50,304 25,585
United Arab Emirates 14 44,570 13,378 18 73,949 26,759
Vanuatu 13 126,940 38,083 11 122,206 36,663
Wallis and Futuna 1 1,189 955 1 1,189 955
Senegal Antigua and Barbuda 2 28,946 12,522 2 31,266 13,434
Cyprus - - - 1 19,147 7,600
France - - - 1 89,787 61,615
Germany - - - 1 15,988 8,222
Greece - - - 1 37,113 18,650
Liberia 1 37,113 18,650 3 72,953 37,965
Malta 1 14,241 6,256 2 37,235 18,745
Marshall Islands - - - 2 47,462 18,675
Netherlands - - - 1 6,668 3,350
Panama 1 9,640 6,026 - - -
Philippines - - - 1 20,058 8,489
Singapore - - - 1 16,162 6,128
Sierra Leone Cayman Islands 1 776 232 - - -
Singapore Antigua and Barbuda - - - 1 7,014 3,375
Bahamas 1 8,161 3,430 2 62,002 22,689
Bermuda 1 27,357 13,857 - - -
China - - - 1 35,568 10,670
Finland 1 28,002 8,400 - - -
Greece 1 85,000 47,300 - - -
Hong Kong 1 26,062 14,872 - - -
India 1 42,403 21,777 - - -
Italy 1 29,700 0 - - -
Liberia 1 28,628 12,678 1 8,201 2,460
Malta - - - 3 190,230 115,171
Marshall Islands 4 218,242 97,694 - - -
Netherlands - - - 2 22,983 7,195
Norway 1 6,072 1,822 - - -
Panama 4 436,667 149,242 - - -
Philippines - - - 1 11,570 6,052
Singapore 3 49,738 25,537 1 2,658 797
St. Vincent and Grenadines 1 18,360 5,508 - - -
Turkey 1 12,619 6,766 - - -
UK 4 80,490 37,471 - - -
Slovenia Antigua and Barbuda 10 56,361 28,187 5 28,029 13,800
Bahamas 1 43,537 19,985 3 115,197 51,425
Belize 1 3,307 2,000 - - -
Brazil - - - 1 28,347 15,151
Cyprus 1 42,010 22,361 - - -
Denmark 2 46,229 20,527 - - -
Egypt - - - 1 4,591 2,557
France 1 26,659 10,224 - - -
Georgia 1 3,080 1,170 - - -
Gibraltar 9 29,556 16,604 1 22,345 9,743
Greece 1 40,609 26,220 - - -
Isle of Man 3 66,543 22,944 1 22,181 7,648
Italy 3 51,143 20,425 1 23,375 10,150
Lebanon 1 1,951 1,046 - - -
Liberia 1 32,929 19,132 1 19,819 7,218
Malta 26 399,356 179,149 8 96,878 46,612
Marshall Islands 2 28,556 9,828 - - -
Netherlands 2 8,919 4,582 - - -
Norway 2 112,045 61,642 - - -
Norwegian International Ship Register 2 134,448 64,404 - - -
Panama 4 87,826 37,599 1 40,330 18,394
Sierra Leone 1 1,425 497 - - -
Slovakia 1 4,281 2,846 - - -
St. Vincent and Grenadines 6 25,006 11,978 1 4,839 2,239
Syria 1 1,996 1,113 - - -
Tanzania 2 7,054 3,244 - - -
Turkey 2 4,899 3,115 1 1,233 777
UK - - - 1 21,104 6,331
… 2.7. Number and tonnage of vessels entered and cleared classified by country of origin or destination and nationality: 2011
Country of origin or destination
Country of nationalityENTERED CLEARED
57
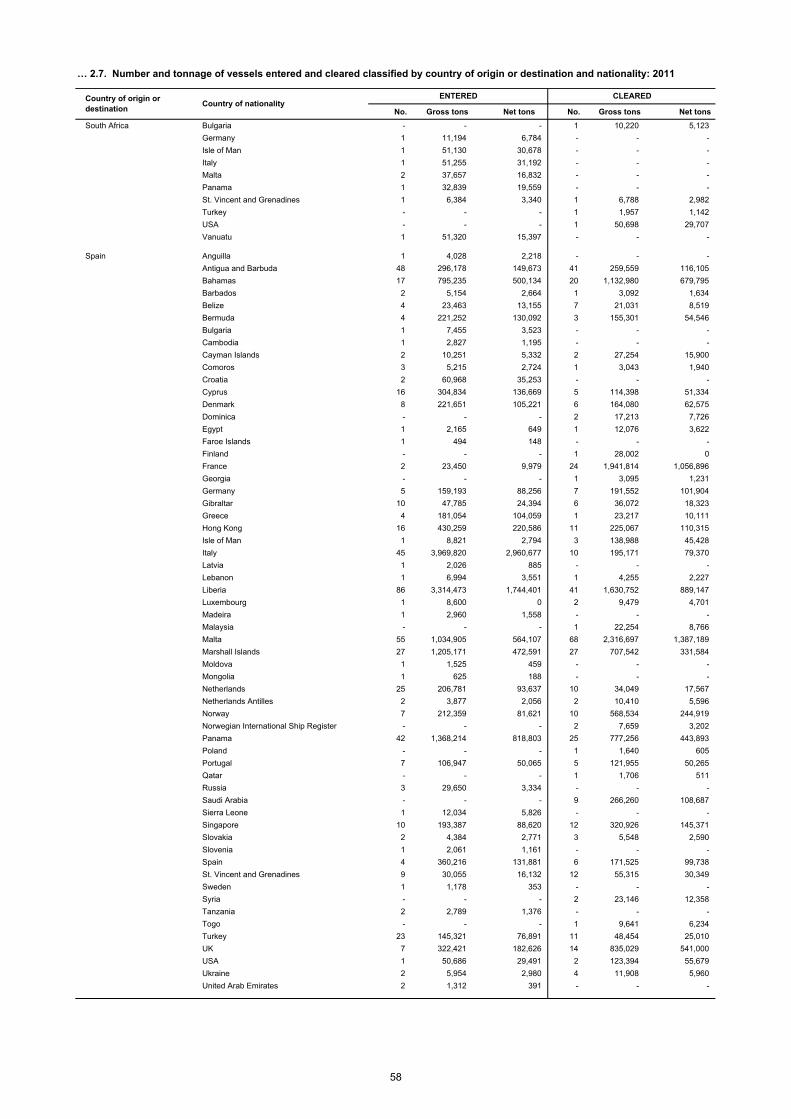
No. Gross tons Net tons No. Gross tons Net tons
South Africa Bulgaria - - - 1 10,220 5,123
Germany 1 11,194 6,784 - - -
Isle of Man 1 51,130 30,678 - - -
Italy 1 51,255 31,192 - - -
Malta 2 37,657 16,832 - - -
Panama 1 32,839 19,559 - - -
St. Vincent and Grenadines 1 6,384 3,340 1 6,788 2,982
Turkey - - - 1 1,957 1,142
USA - - - 1 50,698 29,707
Vanuatu 1 51,320 15,397 - - -
Spain Anguilla 1 4,028 2,218 - - -
Antigua and Barbuda 48 296,178 149,673 41 259,559 116,105
Bahamas 17 795,235 500,134 20 1,132,980 679,795
Barbados 2 5,154 2,664 1 3,092 1,634
Belize 4 23,463 13,155 7 21,031 8,519
Bermuda 4 221,252 130,092 3 155,301 54,546
Bulgaria 1 7,455 3,523 - - -
Cambodia 1 2,827 1,195 - - -
Cayman Islands 2 10,251 5,332 2 27,254 15,900
Comoros 3 5,215 2,724 1 3,043 1,940
Croatia 2 60,968 35,253 - - -
Cyprus 16 304,834 136,669 5 114,398 51,334
Denmark 8 221,651 105,221 6 164,080 62,575
Dominica - - - 2 17,213 7,726
Egypt 1 2,165 649 1 12,076 3,622
Faroe Islands 1 494 148 - - -
Finland - - - 1 28,002 0
France 2 23,450 9,979 24 1,941,814 1,056,896
Georgia - - - 1 3,095 1,231
Germany 5 159,193 88,256 7 191,552 101,904
Gibraltar 10 47,785 24,394 6 36,072 18,323
Greece 4 181,054 104,059 1 23,217 10,111
Hong Kong 16 430,259 220,586 11 225,067 110,315
Isle of Man 1 8,821 2,794 3 138,988 45,428
Italy 45 3,969,820 2,960,677 10 195,171 79,370
Latvia 1 2,026 885 - - -
Lebanon 1 6,994 3,551 1 4,255 2,227
Liberia 86 3,314,473 1,744,401 41 1,630,752 889,147
Luxembourg 1 8,600 0 2 9,479 4,701
Madeira 1 2,960 1,558 - - -
Malaysia - - - 1 22,254 8,766
Malta 55 1,034,905 564,107 68 2,316,697 1,387,189
Marshall Islands 27 1,205,171 472,591 27 707,542 331,584
Moldova 1 1,525 459 - - -
Mongolia 1 625 188 - - -
Netherlands 25 206,781 93,637 10 34,049 17,567
Netherlands Antilles 2 3,877 2,056 2 10,410 5,596
Norway 7 212,359 81,621 10 568,534 244,919
Norwegian International Ship Register - - - 2 7,659 3,202
Panama 42 1,368,214 818,803 25 777,256 443,893
Poland - - - 1 1,640 605
Portugal 7 106,947 50,065 5 121,955 50,265
Qatar - - - 1 1,706 511
Russia 3 29,650 3,334 - - -
Saudi Arabia - - - 9 266,260 108,687
Sierra Leone 1 12,034 5,826 - - -
Singapore 10 193,387 88,620 12 320,926 145,371
Slovakia 2 4,384 2,771 3 5,548 2,590
Slovenia 1 2,061 1,161 - - -
Spain 4 360,216 131,881 6 171,525 99,738
St. Vincent and Grenadines 9 30,055 16,132 12 55,315 30,349
Sweden 1 1,178 353 - - -
Syria - - - 2 23,146 12,358
Tanzania 2 2,789 1,376 - - -
Togo - - - 1 9,641 6,234
Turkey 23 145,321 76,891 11 48,454 25,010
UK 7 322,421 182,626 14 835,029 541,000
USA 1 50,686 29,491 2 123,394 55,679
Ukraine 2 5,954 2,980 4 11,908 5,960
United Arab Emirates 2 1,312 391 - - -
… 2.7. Number and tonnage of vessels entered and cleared classified by country of origin or destination and nationality: 2011
Country of origin or destination
Country of nationalityENTERED CLEARED
58
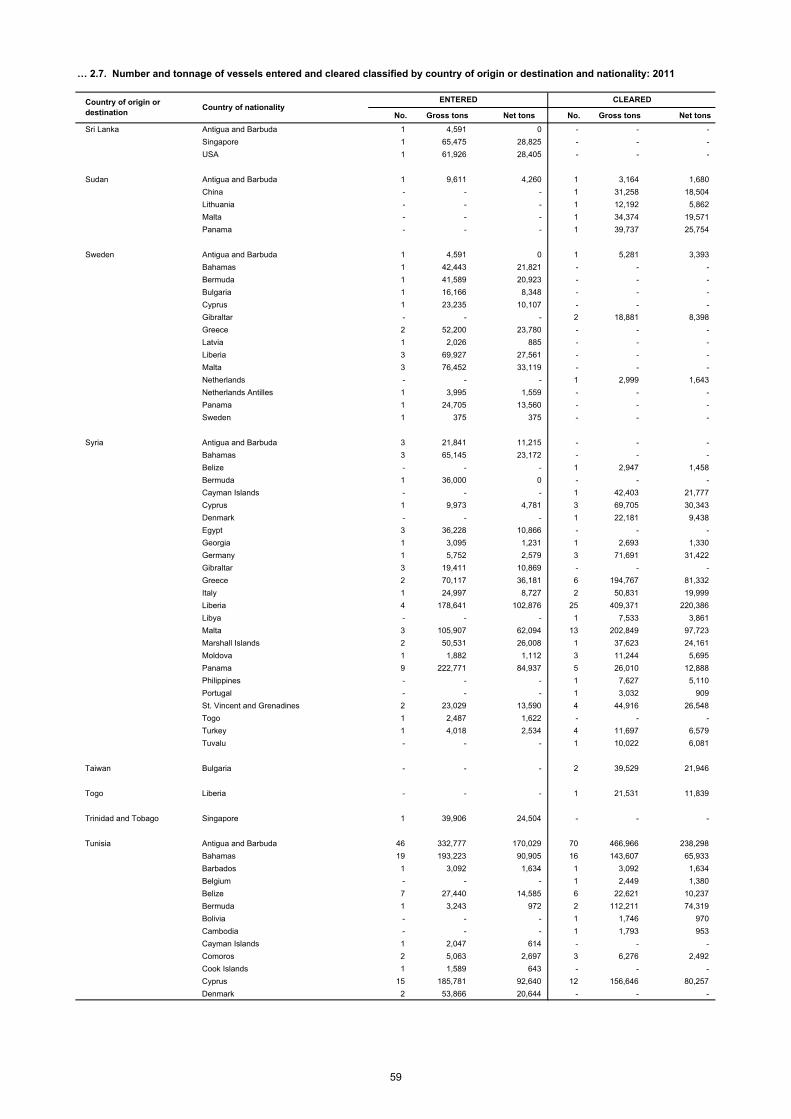
No. Gross tons Net tons No. Gross tons Net tons
Sri Lanka Antigua and Barbuda 1 4,591 0 - - -
Singapore 1 65,475 28,825 - - -
USA 1 61,926 28,405 - - -
Sudan Antigua and Barbuda 1 9,611 4,260 1 3,164 1,680
China - - - 1 31,258 18,504
Lithuania - - - 1 12,192 5,862
Malta - - - 1 34,374 19,571
Panama - - - 1 39,737 25,754
Sweden Antigua and Barbuda 1 4,591 0 1 5,281 3,393
Bahamas 1 42,443 21,821 - - -
Bermuda 1 41,589 20,923 - - -
Bulgaria 1 16,166 8,348 - - -
Cyprus 1 23,235 10,107 - - -
Gibraltar - - - 2 18,881 8,398
Greece 2 52,200 23,780 - - -
Latvia 1 2,026 885 - - -
Liberia 3 69,927 27,561 - - -
Malta 3 76,452 33,119 - - -
Netherlands - - - 1 2,999 1,643
Netherlands Antilles 1 3,995 1,559 - - -
Panama 1 24,705 13,560 - - -
Sweden 1 375 375 - - -
Syria Antigua and Barbuda 3 21,841 11,215 - - -
Bahamas 3 65,145 23,172 - - -
Belize - - - 1 2,947 1,458
Bermuda 1 36,000 0 - - -
Cayman Islands - - - 1 42,403 21,777
Cyprus 1 9,973 4,781 3 69,705 30,343
Denmark - - - 1 22,181 9,438
Egypt 3 36,228 10,866 - - -
Georgia 1 3,095 1,231 1 2,693 1,330
Germany 1 5,752 2,579 3 71,691 31,422
Gibraltar 3 19,411 10,869 - - -
Greece 2 70,117 36,181 6 194,767 81,332
Italy 1 24,997 8,727 2 50,831 19,999
Liberia 4 178,641 102,876 25 409,371 220,386
Libya - - - 1 7,533 3,861
Malta 3 105,907 62,094 13 202,849 97,723
Marshall Islands 2 50,531 26,008 1 37,623 24,161
Moldova 1 1,882 1,112 3 11,244 5,695
Panama 9 222,771 84,937 5 26,010 12,888
Philippines - - - 1 7,627 5,110
Portugal - - - 1 3,032 909
St. Vincent and Grenadines 2 23,029 13,590 4 44,916 26,548
Togo 1 2,487 1,622 - - -
Turkey 1 4,018 2,534 4 11,697 6,579
Tuvalu - - - 1 10,022 6,081
Taiwan Bulgaria - - - 2 39,529 21,946
Togo Liberia - - - 1 21,531 11,839
Trinidad and Tobago Singapore 1 39,906 24,504 - - -
Tunisia Antigua and Barbuda 46 332,777 170,029 70 466,966 238,298
Bahamas 19 193,223 90,905 16 143,607 65,933
Barbados 1 3,092 1,634 1 3,092 1,634
Belgium - - - 1 2,449 1,380
Belize 7 27,440 14,585 6 22,621 10,237
Bermuda 1 3,243 972 2 112,211 74,319
Bolivia - - - 1 1,746 970
Cambodia - - - 1 1,793 953
Cayman Islands 1 2,047 614 - - -
Comoros 2 5,063 2,697 3 6,276 2,492
Cook Islands 1 1,589 643 - - -
Cyprus 15 185,781 92,640 12 156,646 80,257
Denmark 2 53,866 20,644 - - -
… 2.7. Number and tonnage of vessels entered and cleared classified by country of origin or destination and nationality: 2011
Country of origin or destination
Country of nationalityENTERED CLEARED
59
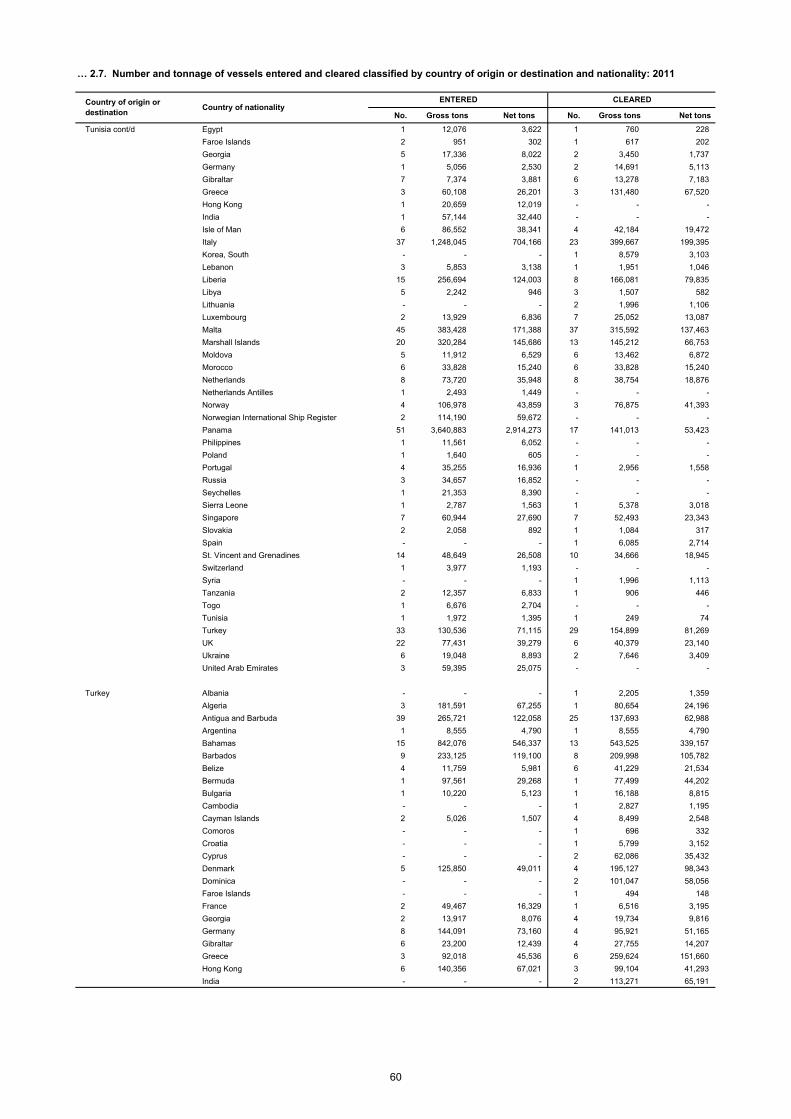
No. Gross tons Net tons No. Gross tons Net tons
Tunisia cont/d Egypt 1 12,076 3,622 1 760 228
Faroe Islands 2 951 302 1 617 202
Georgia 5 17,336 8,022 2 3,450 1,737
Germany 1 5,056 2,530 2 14,691 5,113
Gibraltar 7 7,374 3,881 6 13,278 7,183
Greece 3 60,108 26,201 3 131,480 67,520
Hong Kong 1 20,659 12,019 - - -
India 1 57,144 32,440 - - -
Isle of Man 6 86,552 38,341 4 42,184 19,472
Italy 37 1,248,045 704,166 23 399,667 199,395
Korea, South - - - 1 8,579 3,103
Lebanon 3 5,853 3,138 1 1,951 1,046
Liberia 15 256,694 124,003 8 166,081 79,835
Libya 5 2,242 946 3 1,507 582
Lithuania - - - 2 1,996 1,106
Luxembourg 2 13,929 6,836 7 25,052 13,087
Malta 45 383,428 171,388 37 315,592 137,463
Marshall Islands 20 320,284 145,686 13 145,212 66,753
Moldova 5 11,912 6,529 6 13,462 6,872
Morocco 6 33,828 15,240 6 33,828 15,240
Netherlands 8 73,720 35,948 8 38,754 18,876
Netherlands Antilles 1 2,493 1,449 - - -
Norway 4 106,978 43,859 3 76,875 41,393
Norwegian International Ship Register 2 114,190 59,672 - - -
Panama 51 3,640,883 2,914,273 17 141,013 53,423
Philippines 1 11,561 6,052 - - -
Poland 1 1,640 605 - - -
Portugal 4 35,255 16,936 1 2,956 1,558
Russia 3 34,657 16,852 - - -
Seychelles 1 21,353 8,390 - - -
Sierra Leone 1 2,787 1,563 1 5,378 3,018
Singapore 7 60,944 27,690 7 52,493 23,343
Slovakia 2 2,058 892 1 1,084 317
Spain - - - 1 6,085 2,714
St. Vincent and Grenadines 14 48,649 26,508 10 34,666 18,945
Switzerland 1 3,977 1,193 - - -
Syria - - - 1 1,996 1,113
Tanzania 2 12,357 6,833 1 906 446
Togo 1 6,676 2,704 - - -
Tunisia 1 1,972 1,395 1 249 74
Turkey 33 130,536 71,115 29 154,899 81,269
UK 22 77,431 39,279 6 40,379 23,140
Ukraine 6 19,048 8,893 2 7,646 3,409
United Arab Emirates 3 59,395 25,075 - - -
Turkey Albania - - - 1 2,205 1,359
Algeria 3 181,591 67,255 1 80,654 24,196
Antigua and Barbuda 39 265,721 122,058 25 137,693 62,988
Argentina 1 8,555 4,790 1 8,555 4,790
Bahamas 15 842,076 546,337 13 543,525 339,157
Barbados 9 233,125 119,100 8 209,998 105,782
Belize 4 11,759 5,981 6 41,229 21,534
Bermuda 1 97,561 29,268 1 77,499 44,202
Bulgaria 1 10,220 5,123 1 16,188 8,815
Cambodia - - - 1 2,827 1,195
Cayman Islands 2 5,026 1,507 4 8,499 2,548
Comoros - - - 1 696 332
Croatia - - - 1 5,799 3,152
Cyprus - - - 2 62,086 35,432
Denmark 5 125,850 49,011 4 195,127 98,343
Dominica - - - 2 101,047 58,056
Faroe Islands - - - 1 494 148
France 2 49,467 16,329 1 6,516 3,195
Georgia 2 13,917 8,076 4 19,734 9,816
Germany 8 144,091 73,160 4 95,921 51,165
Gibraltar 6 23,200 12,439 4 27,755 14,207
Greece 3 92,018 45,536 6 259,624 151,660
Hong Kong 6 140,356 67,021 3 99,104 41,293
India - - - 2 113,271 65,191
… 2.7. Number and tonnage of vessels entered and cleared classified by country of origin or destination and nationality: 2011
Country of origin or destination
Country of nationalityENTERED CLEARED
60
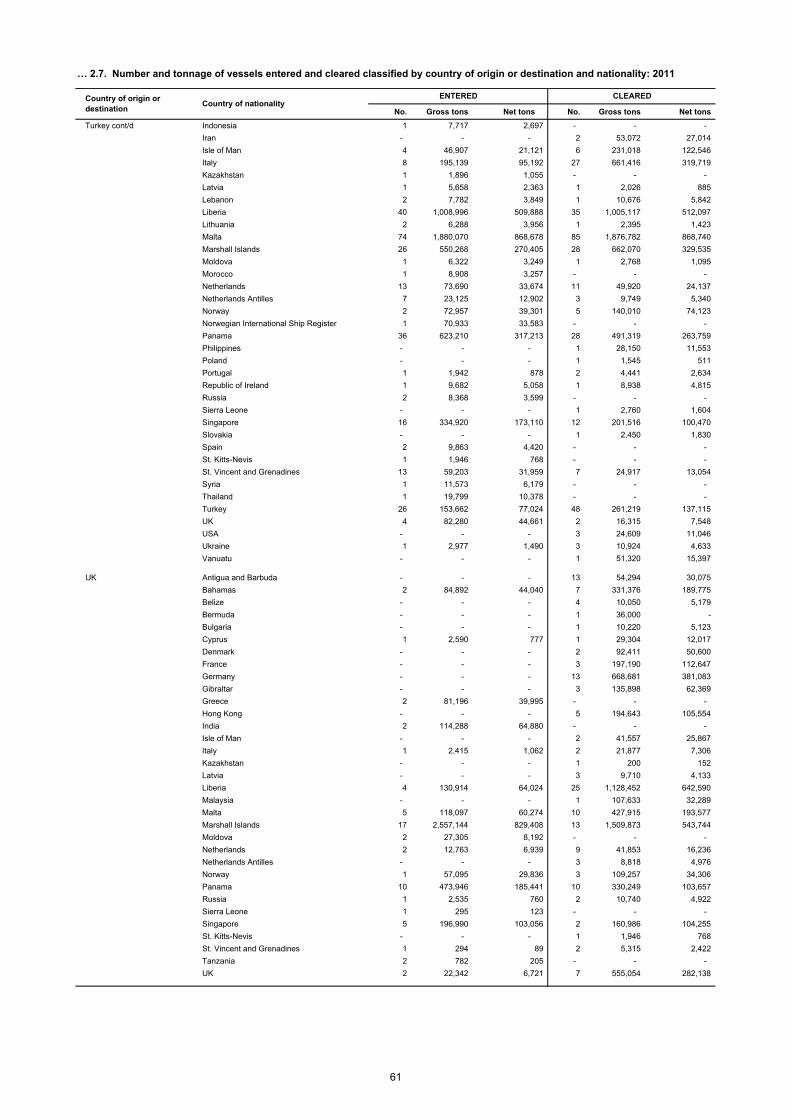
No. Gross tons Net tons No. Gross tons Net tons
Turkey cont/d Indonesia 1 7,717 2,697 - - -
Iran - - - 2 53,072 27,014
Isle of Man 4 46,907 21,121 6 231,018 122,546
Italy 8 195,139 95,192 27 661,416 319,719
Kazakhstan 1 1,896 1,055 - - -
Latvia 1 5,658 2,363 1 2,026 885
Lebanon 2 7,782 3,849 1 10,676 5,842
Liberia 40 1,008,996 509,888 35 1,005,117 512,097
Lithuania 2 6,288 3,956 1 2,395 1,423
Malta 74 1,880,070 868,678 85 1,876,782 868,740
Marshall Islands 26 550,268 270,405 28 662,070 329,535
Moldova 1 6,322 3,249 1 2,768 1,095
Morocco 1 8,908 3,257 - - -
Netherlands 13 73,690 33,674 11 49,920 24,137
Netherlands Antilles 7 23,125 12,902 3 9,749 5,340
Norway 2 72,957 39,301 5 140,010 74,123
Norwegian International Ship Register 1 70,933 33,583 - - -
Panama 36 623,210 317,213 28 491,319 263,759
Philippines - - - 1 28,150 11,553
Poland - - - 1 1,545 511
Portugal 1 1,942 878 2 4,441 2,634
Republic of Ireland 1 9,682 5,058 1 8,938 4,815
Russia 2 8,368 3,599 - - -
Sierra Leone - - - 1 2,760 1,604
Singapore 16 334,920 173,110 12 201,516 100,470
Slovakia - - - 1 2,450 1,830
Spain 2 9,863 4,420 - - -
St. Kitts-Nevis 1 1,946 768 - - -
St. Vincent and Grenadines 13 59,203 31,959 7 24,917 13,054
Syria 1 11,573 6,179 - - -
Thailand 1 19,799 10,378 - - -
Turkey 26 153,662 77,024 48 261,219 137,115
UK 4 82,280 44,661 2 16,315 7,548
USA - - - 3 24,609 11,046
Ukraine 1 2,977 1,490 3 10,924 4,633
Vanuatu - - - 1 51,320 15,397
UK Antigua and Barbuda - - - 13 54,294 30,075
Bahamas 2 84,892 44,040 7 331,376 189,775
Belize - - - 4 10,050 5,179
Bermuda - - - 1 36,000 -
Bulgaria - - - 1 10,220 5,123
Cyprus 1 2,590 777 1 29,304 12,017
Denmark - - - 2 92,411 50,600
France - - - 3 197,190 112,647
Germany - - - 13 668,681 381,083
Gibraltar - - - 3 135,898 62,369
Greece 2 81,196 39,995 - - -
Hong Kong - - - 5 194,643 105,554
India 2 114,288 64,880 - - -
Isle of Man - - - 2 41,557 25,867
Italy 1 2,415 1,062 2 21,877 7,306
Kazakhstan - - - 1 200 152
Latvia - - - 3 9,710 4,133
Liberia 4 130,914 64,024 25 1,128,452 642,590
Malaysia - - - 1 107,633 32,289
Malta 5 118,097 60,274 10 427,915 193,577
Marshall Islands 17 2,557,144 829,408 13 1,509,873 543,744
Moldova 2 27,305 8,192 - - -
Netherlands 2 12,763 6,939 9 41,853 16,236
Netherlands Antilles - - - 3 8,818 4,976
Norway 1 57,095 29,836 3 109,257 34,306
Panama 10 473,946 185,441 10 330,249 103,657
Russia 1 2,535 760 2 10,740 4,922
Sierra Leone 1 295 123 - - -
Singapore 5 196,990 103,056 2 160,986 104,255
St. Kitts-Nevis - - - 1 1,946 768
St. Vincent and Grenadines 1 294 89 2 5,315 2,422
Tanzania 2 782 205 - - -
UK 2 22,342 6,721 7 555,054 282,138
… 2.7. Number and tonnage of vessels entered and cleared classified by country of origin or destination and nationality: 2011
Country of origin or destination
Country of nationalityENTERED CLEARED
61
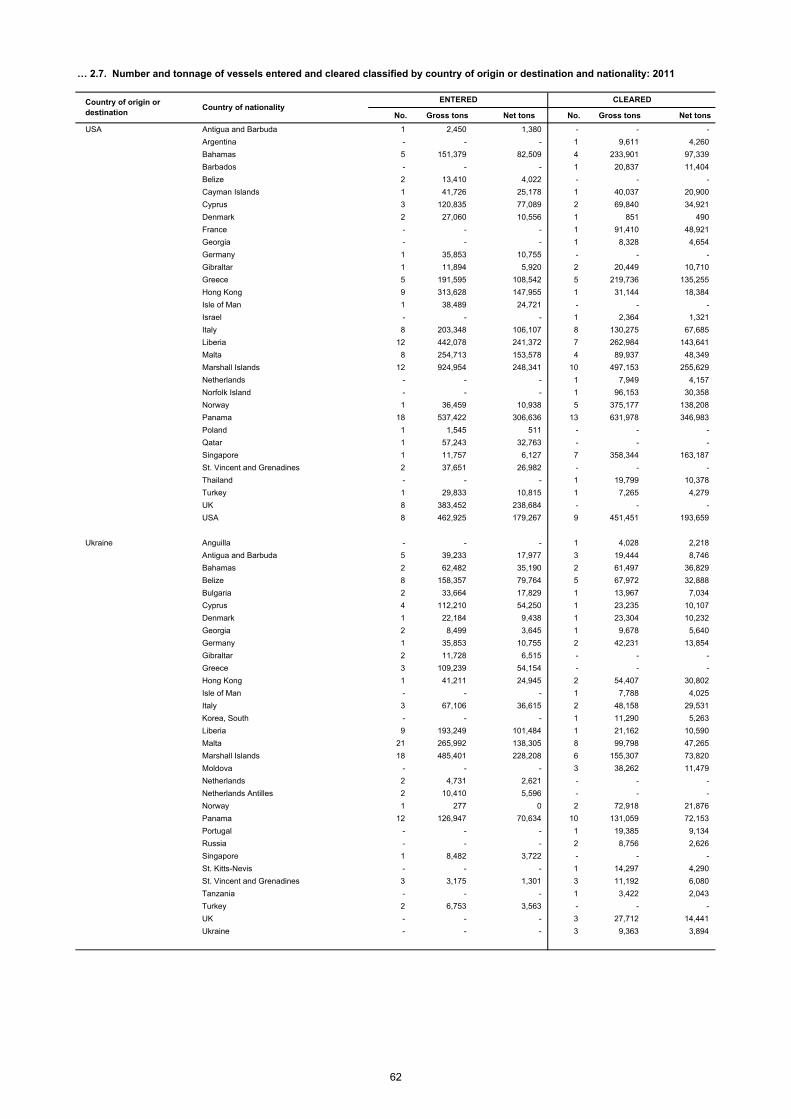
No. Gross tons Net tons No. Gross tons Net tons
USA Antigua and Barbuda 1 2,450 1,380 - - -
Argentina - - - 1 9,611 4,260
Bahamas 5 151,379 82,509 4 233,901 97,339
Barbados - - - 1 20,837 11,404
Belize 2 13,410 4,022 - - -
Cayman Islands 1 41,726 25,178 1 40,037 20,900
Cyprus 3 120,835 77,089 2 69,840 34,921
Denmark 2 27,060 10,556 1 851 490
France - - - 1 91,410 48,921
Georgia - - - 1 8,328 4,654
Germany 1 35,853 10,755 - - -
Gibraltar 1 11,894 5,920 2 20,449 10,710
Greece 5 191,595 108,542 5 219,736 135,255
Hong Kong 9 313,628 147,955 1 31,144 18,384
Isle of Man 1 38,489 24,721 - - -
Israel - - - 1 2,364 1,321
Italy 8 203,348 106,107 8 130,275 67,685
Liberia 12 442,078 241,372 7 262,984 143,641
Malta 8 254,713 153,578 4 89,937 48,349
Marshall Islands 12 924,954 248,341 10 497,153 255,629
Netherlands - - - 1 7,949 4,157
Norfolk Island - - - 1 96,153 30,358
Norway 1 36,459 10,938 5 375,177 138,208
Panama 18 537,422 306,636 13 631,978 346,983
Poland 1 1,545 511 - - -
Qatar 1 57,243 32,763 - - -
Singapore 1 11,757 6,127 7 358,344 163,187
St. Vincent and Grenadines 2 37,651 26,982 - - -
Thailand - - - 1 19,799 10,378
Turkey 1 29,833 10,815 1 7,265 4,279
UK 8 383,452 238,684 - - -
USA 8 462,925 179,267 9 451,451 193,659
Ukraine Anguilla - - - 1 4,028 2,218
Antigua and Barbuda 5 39,233 17,977 3 19,444 8,746
Bahamas 2 62,482 35,190 2 61,497 36,829
Belize 8 158,357 79,764 5 67,972 32,888
Bulgaria 2 33,664 17,829 1 13,967 7,034
Cyprus 4 112,210 54,250 1 23,235 10,107
Denmark 1 22,184 9,438 1 23,304 10,232
Georgia 2 8,499 3,645 1 9,678 5,640
Germany 1 35,853 10,755 2 42,231 13,854
Gibraltar 2 11,728 6,515 - - -
Greece 3 109,239 54,154 - - -
Hong Kong 1 41,211 24,945 2 54,407 30,802
Isle of Man - - - 1 7,788 4,025
Italy 3 67,106 36,615 2 48,158 29,531
Korea, South - - - 1 11,290 5,263
Liberia 9 193,249 101,484 1 21,162 10,590
Malta 21 265,992 138,305 8 99,798 47,265
Marshall Islands 18 485,401 228,208 6 155,307 73,820
Moldova - - - 3 38,262 11,479
Netherlands 2 4,731 2,621 - - -
Netherlands Antilles 2 10,410 5,596 - - -
Norway 1 277 0 2 72,918 21,876
Panama 12 126,947 70,634 10 131,059 72,153
Portugal - - - 1 19,385 9,134
Russia - - - 2 8,756 2,626
Singapore 1 8,482 3,722 - - -
St. Kitts-Nevis - - - 1 14,297 4,290
St. Vincent and Grenadines 3 3,175 1,301 3 11,192 6,080
Tanzania - - - 1 3,422 2,043
Turkey 2 6,753 3,563 - - -
UK - - - 3 27,712 14,441
Ukraine - - - 3 9,363 3,894
… 2.7. Number and tonnage of vessels entered and cleared classified by country of origin or destination and nationality: 2011
Country of origin or destination
Country of nationalityENTERED CLEARED
62
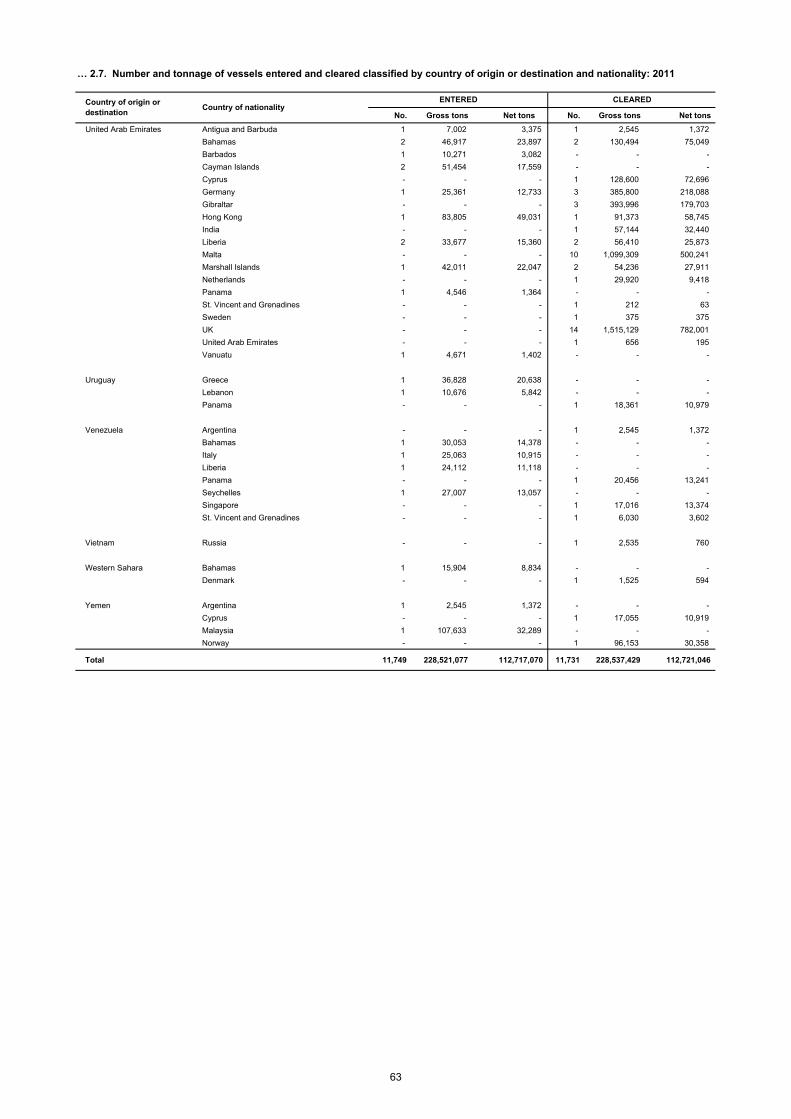
No. Gross tons Net tons No. Gross tons Net tons
United Arab Emirates Antigua and Barbuda 1 7,002 3,375 1 2,545 1,372
Bahamas 2 46,917 23,897 2 130,494 75,049
Barbados 1 10,271 3,082 - - -
Cayman Islands 2 51,454 17,559 - - -
Cyprus - - - 1 128,600 72,696
Germany 1 25,361 12,733 3 385,800 218,088
Gibraltar - - - 3 393,996 179,703
Hong Kong 1 83,805 49,031 1 91,373 58,745
India - - - 1 57,144 32,440
Liberia 2 33,677 15,360 2 56,410 25,873
Malta - - - 10 1,099,309 500,241
Marshall Islands 1 42,011 22,047 2 54,236 27,911
Netherlands - - - 1 29,920 9,418
Panama 1 4,546 1,364 - - -
St. Vincent and Grenadines - - - 1 212 63
Sweden - - - 1 375 375
UK - - - 14 1,515,129 782,001
United Arab Emirates - - - 1 656 195
Vanuatu 1 4,671 1,402 - - -
Uruguay Greece 1 36,828 20,638 - - -
Lebanon 1 10,676 5,842 - - -
Panama - - - 1 18,361 10,979
Venezuela Argentina - - - 1 2,545 1,372
Bahamas 1 30,053 14,378 - - -
Italy 1 25,063 10,915 - - -
Liberia 1 24,112 11,118 - - -
Panama - - - 1 20,456 13,241
Seychelles 1 27,007 13,057 - - -
Singapore - - - 1 17,016 13,374
St. Vincent and Grenadines - - - 1 6,030 3,602
Vietnam Russia - - - 1 2,535 760
Western Sahara Bahamas 1 15,904 8,834 - - -
Denmark - - - 1 1,525 594
Yemen Argentina 1 2,545 1,372 - - -
Cyprus - - - 1 17,055 10,919
Malaysia 1 107,633 32,289 - - -
Norway - - - 1 96,153 30,358
Total 11,749 228,521,077 112,717,070 11,731 228,537,429 112,721,046
… 2.7. Number and tonnage of vessels entered and cleared classified by country of origin or destination and nationality: 2011
Country of origin or destination
Country of nationalityENTERED CLEARED
63
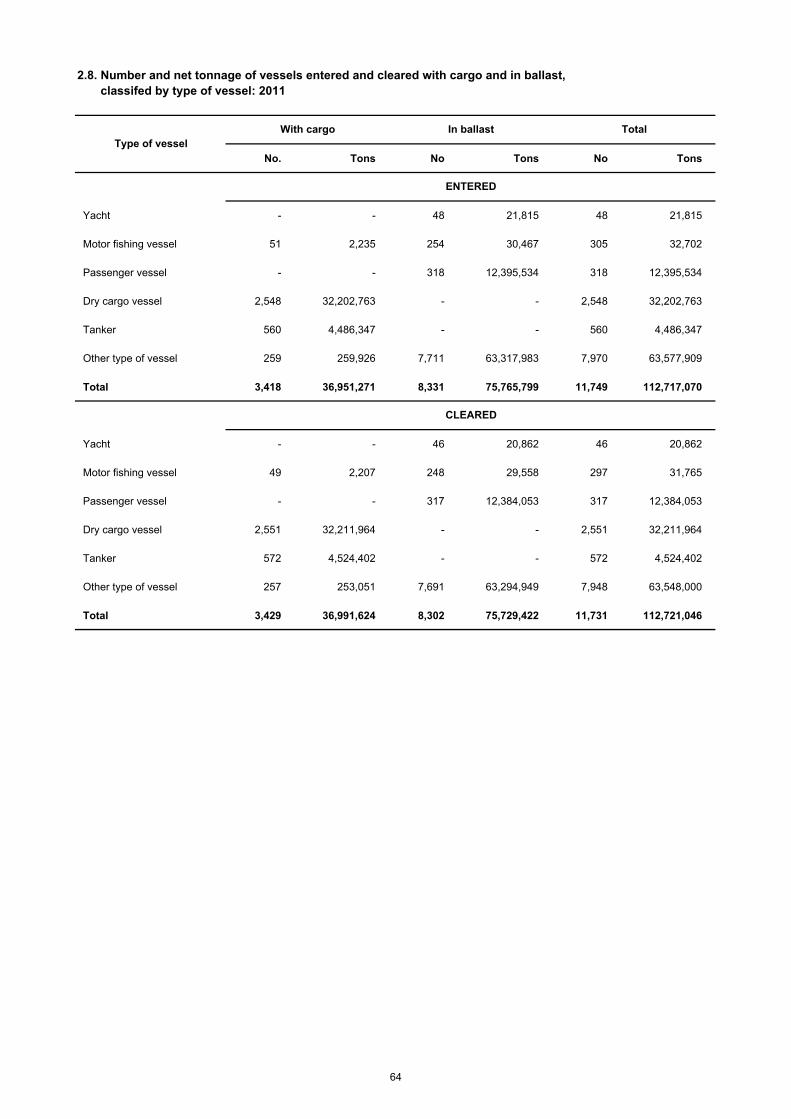
No. Tons No Tons No Tons
Yacht - - 48 21,815 48 21,815
Motor fishing vessel 51 2,235 254 30,467 305 32,702
Passenger vessel - - 318 12,395,534 318 12,395,534
Dry cargo vessel 2,548 32,202,763 - - 2,548 32,202,763
Tanker 560 4,486,347 - - 560 4,486,347
Other type of vessel 259 259,926 7,711 63,317,983 7,970 63,577,909
Total 3,418 36,951,271 8,331 75,765,799 11,749 112,717,070
Yacht - - 46 20,862 46 20,862
Motor fishing vessel 49 2,207 248 29,558 297 31,765
Passenger vessel - - 317 12,384,053 317 12,384,053
Dry cargo vessel 2,551 32,211,964 - - 2,551 32,211,964
Tanker 572 4,524,402 - - 572 4,524,402
Other type of vessel 257 253,051 7,691 63,294,949 7,948 63,548,000
Total 3,429 36,991,624 8,302 75,729,422 11,731 112,721,046
ENTERED
CLEARED
2.8. Number and net tonnage of vessels entered and cleared with cargo and in ballast, classifed by type of vessel: 2011
Type of vesselWith cargo In ballast Total
64
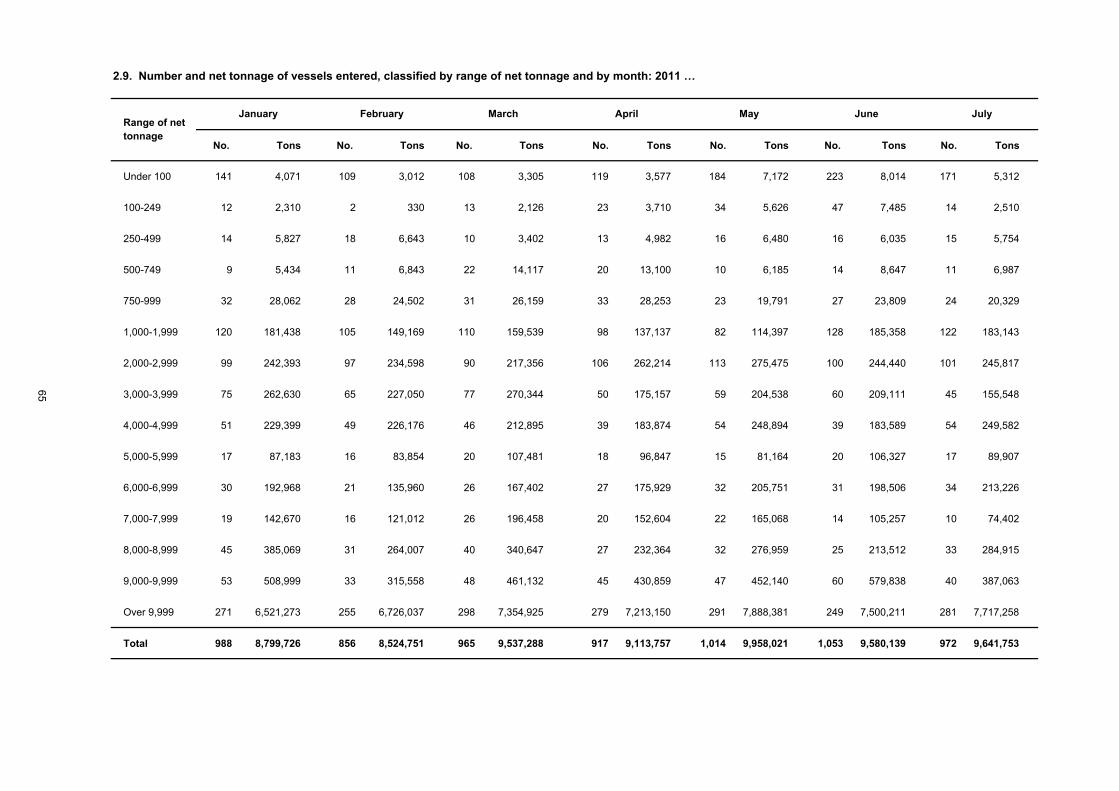
No. Tons No. Tons No. Tons No. Tons No. Tons No. Tons No. Tons
Under 100 141 4,071 109 3,012 108 3,305 119 3,577 184 7,172 223 8,014 171 5,312
100-249 12 2,310 2 330 13 2,126 23 3,710 34 5,626 47 7,485 14 2,510
250-499 14 5,827 18 6,643 10 3,402 13 4,982 16 6,480 16 6,035 15 5,754
500-749 9 5,434 11 6,843 22 14,117 20 13,100 10 6,185 14 8,647 11 6,987
750-999 32 28,062 28 24,502 31 26,159 33 28,253 23 19,791 27 23,809 24 20,329
1,000-1,999 120 181,438 105 149,169 110 159,539 98 137,137 82 114,397 128 185,358 122 183,143
2,000-2,999 99 242,393 97 234,598 90 217,356 106 262,214 113 275,475 100 244,440 101 245,817
3,000-3,999 75 262,630 65 227,050 77 270,344 50 175,157 59 204,538 60 209,111 45 155,548
4,000-4,999 51 229,399 49 226,176 46 212,895 39 183,874 54 248,894 39 183,589 54 249,582
5,000-5,999 17 87,183 16 83,854 20 107,481 18 96,847 15 81,164 20 106,327 17 89,907
6,000-6,999 30 192,968 21 135,960 26 167,402 27 175,929 32 205,751 31 198,506 34 213,226
7,000-7,999 19 142,670 16 121,012 26 196,458 20 152,604 22 165,068 14 105,257 10 74,402
8,000-8,999 45 385,069 31 264,007 40 340,647 27 232,364 32 276,959 25 213,512 33 284,915
9,000-9,999 53 508,999 33 315,558 48 461,132 45 430,859 47 452,140 60 579,838 40 387,063
Over 9,999 271 6,521,273 255 6,726,037 298 7,354,925 279 7,213,150 291 7,888,381 249 7,500,211 281 7,717,258
Total 988 8,799,726 856 8,524,751 965 9,537,288 917 9,113,757 1,014 9,958,021 1,053 9,580,139 972 9,641,753
2.9. Number and net tonnage of vessels entered, classified by range of net tonnage and by month: 2011 …
Range of net tonnage
January February March April May June July
65
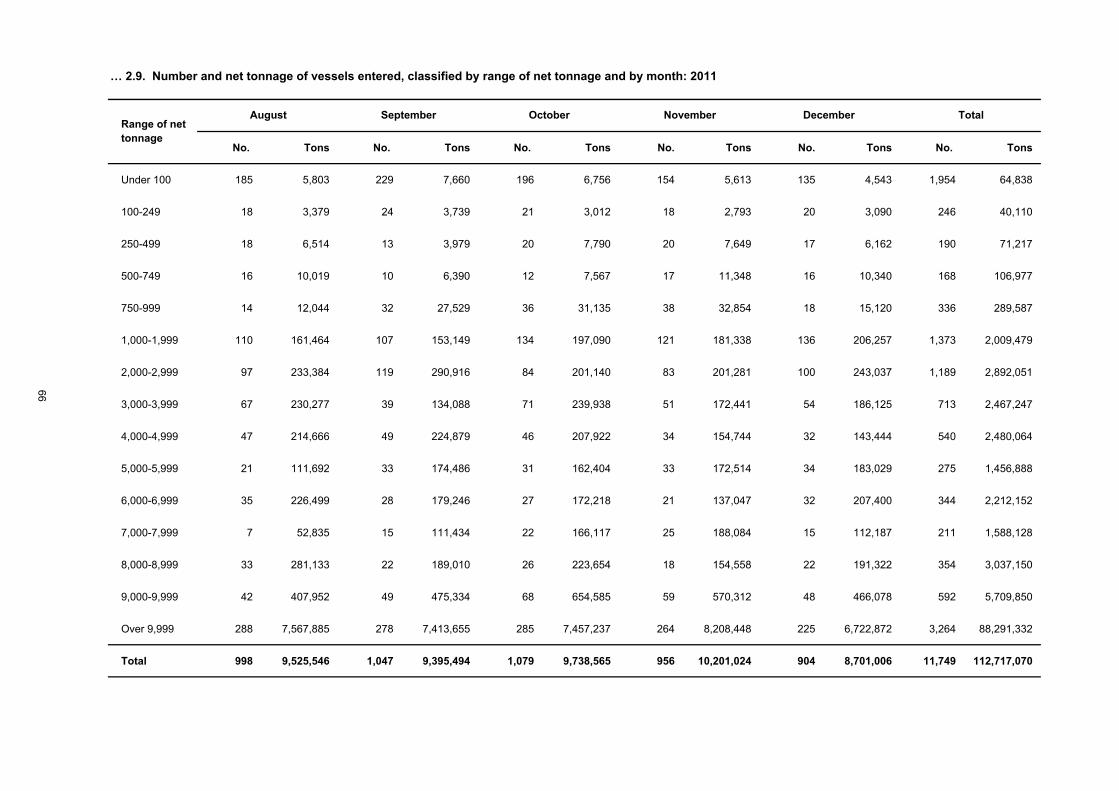
No. Tons No. Tons No. Tons No. Tons No. Tons No. Tons
Under 100 185 5,803 229 7,660 196 6,756 154 5,613 135 4,543 1,954 64,838
100-249 18 3,379 24 3,739 21 3,012 18 2,793 20 3,090 246 40,110
250-499 18 6,514 13 3,979 20 7,790 20 7,649 17 6,162 190 71,217
500-749 16 10,019 10 6,390 12 7,567 17 11,348 16 10,340 168 106,977
750-999 14 12,044 32 27,529 36 31,135 38 32,854 18 15,120 336 289,587
1,000-1,999 110 161,464 107 153,149 134 197,090 121 181,338 136 206,257 1,373 2,009,479
2,000-2,999 97 233,384 119 290,916 84 201,140 83 201,281 100 243,037 1,189 2,892,051
3,000-3,999 67 230,277 39 134,088 71 239,938 51 172,441 54 186,125 713 2,467,247
4,000-4,999 47 214,666 49 224,879 46 207,922 34 154,744 32 143,444 540 2,480,064
5,000-5,999 21 111,692 33 174,486 31 162,404 33 172,514 34 183,029 275 1,456,888
6,000-6,999 35 226,499 28 179,246 27 172,218 21 137,047 32 207,400 344 2,212,152
7,000-7,999 7 52,835 15 111,434 22 166,117 25 188,084 15 112,187 211 1,588,128
8,000-8,999 33 281,133 22 189,010 26 223,654 18 154,558 22 191,322 354 3,037,150
9,000-9,999 42 407,952 49 475,334 68 654,585 59 570,312 48 466,078 592 5,709,850
Over 9,999 288 7,567,885 278 7,413,655 285 7,457,237 264 8,208,448 225 6,722,872 3,264 88,291,332
Total 998 9,525,546 1,047 9,395,494 1,079 9,738,565 956 10,201,024 904 8,701,006 11,749 112,717,070
… 2.9. Number and net tonnage of vessels entered, classified by range of net tonnage and by month: 2011
Range of net tonnage
August September October November December Total
66
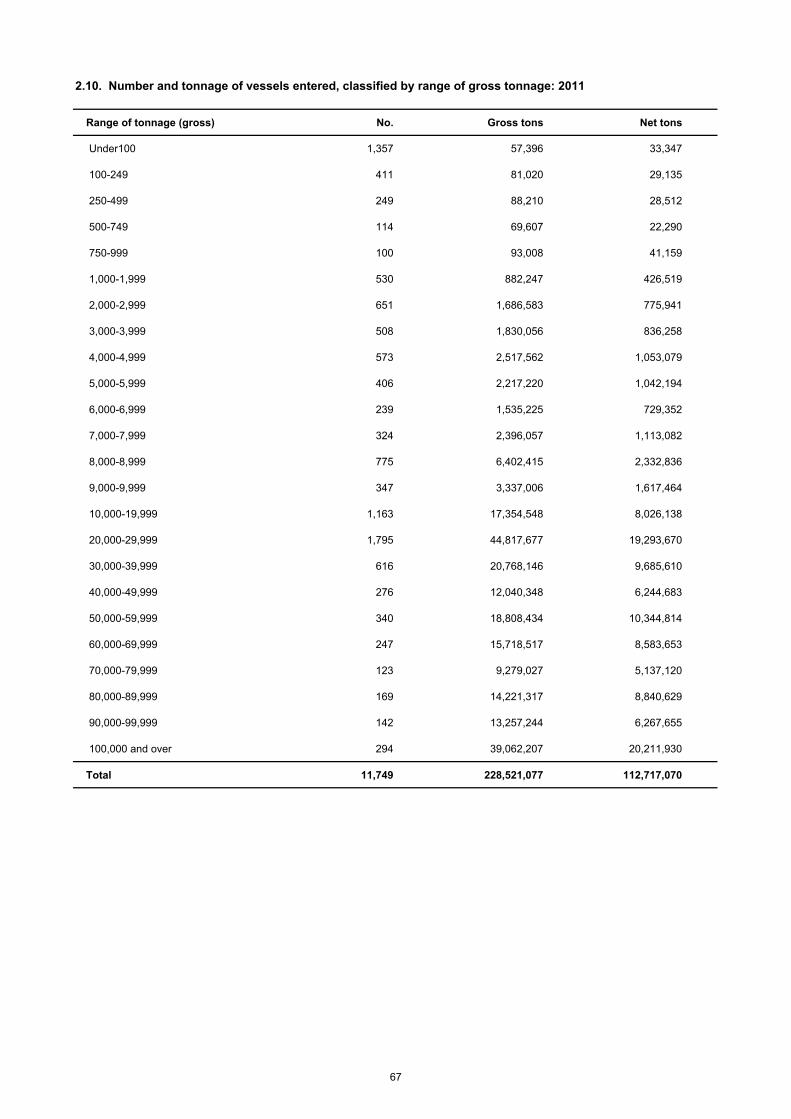
Range of tonnage (gross) No. Gross tons Net tons
Under100 1,357 57,396 33,347
100-249 411 81,020 29,135
250-499 249 88,210 28,512
500-749 114 69,607 22,290
750-999 100 93,008 41,159
1,000-1,999 530 882,247 426,519
2,000-2,999 651 1,686,583 775,941
3,000-3,999 508 1,830,056 836,258
4,000-4,999 573 2,517,562 1,053,079
5,000-5,999 406 2,217,220 1,042,194
6,000-6,999 239 1,535,225 729,352
7,000-7,999 324 2,396,057 1,113,082
8,000-8,999 775 6,402,415 2,332,836
9,000-9,999 347 3,337,006 1,617,464
10,000-19,999 1,163 17,354,548 8,026,138
20,000-29,999 1,795 44,817,677 19,293,670
30,000-39,999 616 20,768,146 9,685,610
40,000-49,999 276 12,040,348 6,244,683
50,000-59,999 340 18,808,434 10,344,814
60,000-69,999 247 15,718,517 8,583,653
70,000-79,999 123 9,279,027 5,137,120
80,000-89,999 169 14,221,317 8,840,629
90,000-99,999 142 13,257,244 6,267,655
100,000 and over 294 39,062,207 20,211,930
Total 11,749 228,521,077 112,717,070
2.10. Number and tonnage of vessels entered, classified by range of gross tonnage: 2011
67
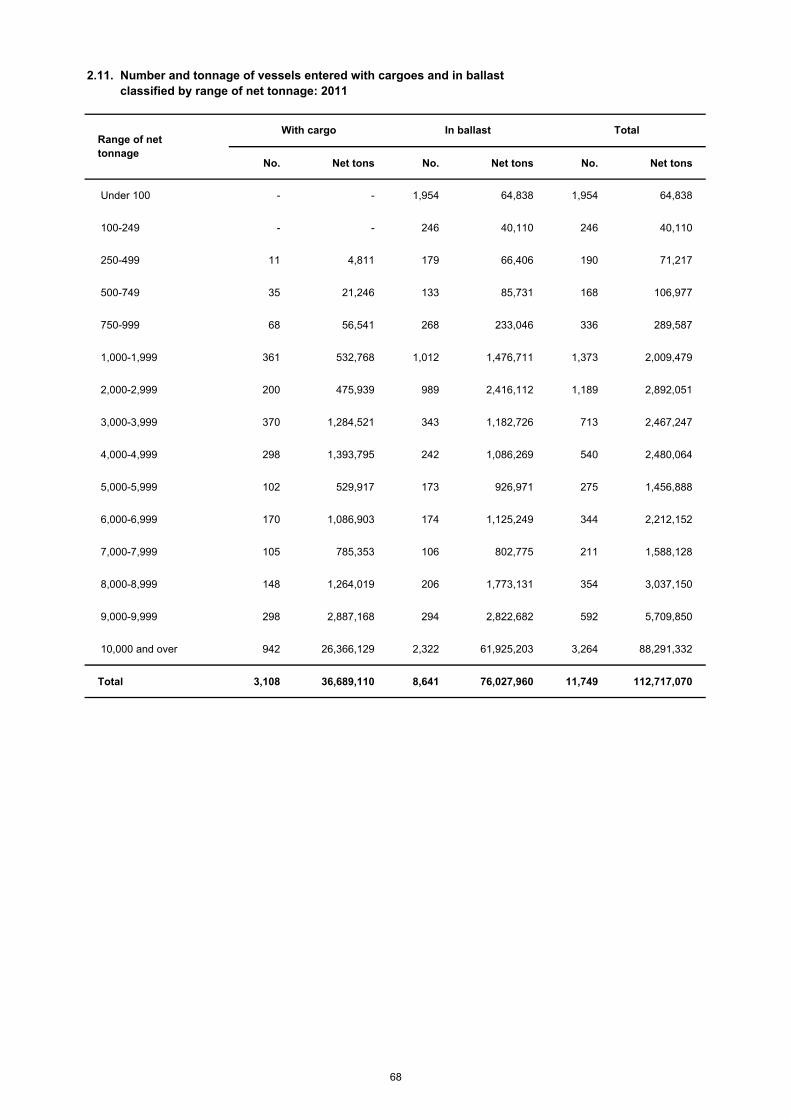
No. Net tons No. Net tons No. Net tons
Under 100 - - 1,954 64,838 1,954 64,838
100-249 - - 246 40,110 246 40,110
250-499 11 4,811 179 66,406 190 71,217
500-749 35 21,246 133 85,731 168 106,977
750-999 68 56,541 268 233,046 336 289,587
1,000-1,999 361 532,768 1,012 1,476,711 1,373 2,009,479
2,000-2,999 200 475,939 989 2,416,112 1,189 2,892,051
3,000-3,999 370 1,284,521 343 1,182,726 713 2,467,247
4,000-4,999 298 1,393,795 242 1,086,269 540 2,480,064
5,000-5,999 102 529,917 173 926,971 275 1,456,888
6,000-6,999 170 1,086,903 174 1,125,249 344 2,212,152
7,000-7,999 105 785,353 106 802,775 211 1,588,128
8,000-8,999 148 1,264,019 206 1,773,131 354 3,037,150
9,000-9,999 298 2,887,168 294 2,822,682 592 5,709,850
10,000 and over 942 26,366,129 2,322 61,925,203 3,264 88,291,332
Total 3,108 36,689,110 8,641 76,027,960 11,749 112,717,070
2.11. Number and tonnage of vessels entered with cargoes and in ballast
Range of net tonnage
With cargo In ballast Total
classified by range of net tonnage: 2011
68
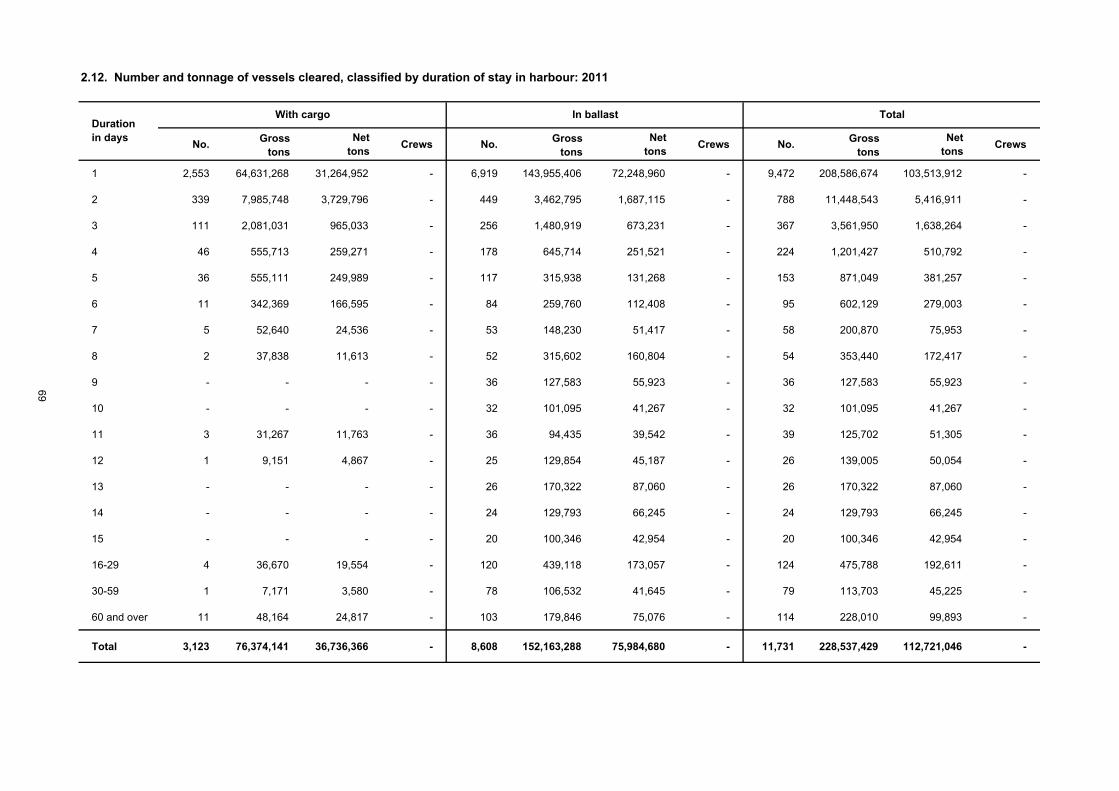
No.Gross
tonsNet
tonsCrews No.
Gross tons
Net tons
Crews No.Gross
tonsNet
tonsCrews
1 2,553 64,631,268 31,264,952 - 6,919 143,955,406 72,248,960 - 9,472 208,586,674 103,513,912 -
2 339 7,985,748 3,729,796 - 449 3,462,795 1,687,115 - 788 11,448,543 5,416,911 -
3 111 2,081,031 965,033 - 256 1,480,919 673,231 - 367 3,561,950 1,638,264 -
4 46 555,713 259,271 - 178 645,714 251,521 - 224 1,201,427 510,792 -
5 36 555,111 249,989 - 117 315,938 131,268 - 153 871,049 381,257 -
6 11 342,369 166,595 - 84 259,760 112,408 - 95 602,129 279,003 -
7 5 52,640 24,536 - 53 148,230 51,417 - 58 200,870 75,953 -
8 2 37,838 11,613 - 52 315,602 160,804 - 54 353,440 172,417 -
9 - - - - 36 127,583 55,923 - 36 127,583 55,923 -
10 - - - - 32 101,095 41,267 - 32 101,095 41,267 -
11 3 31,267 11,763 - 36 94,435 39,542 - 39 125,702 51,305 -
12 1 9,151 4,867 - 25 129,854 45,187 - 26 139,005 50,054 -
13 - - - - 26 170,322 87,060 - 26 170,322 87,060 -
14 - - - - 24 129,793 66,245 - 24 129,793 66,245 -
15 - - - - 20 100,346 42,954 - 20 100,346 42,954 -
16-29 4 36,670 19,554 - 120 439,118 173,057 - 124 475,788 192,611 -
30-59 1 7,171 3,580 - 78 106,532 41,645 - 79 113,703 45,225 -
60 and over 11 48,164 24,817 - 103 179,846 75,076 - 114 228,010 99,893 -
Total 3,123 76,374,141 36,736,366 - 8,608 152,163,288 75,984,680 - 11,731 228,537,429 112,721,046 -
2.12. Number and tonnage of vessels cleared, classified by duration of stay in harbour: 2011
Duration in days
With cargo In ballast Total
69
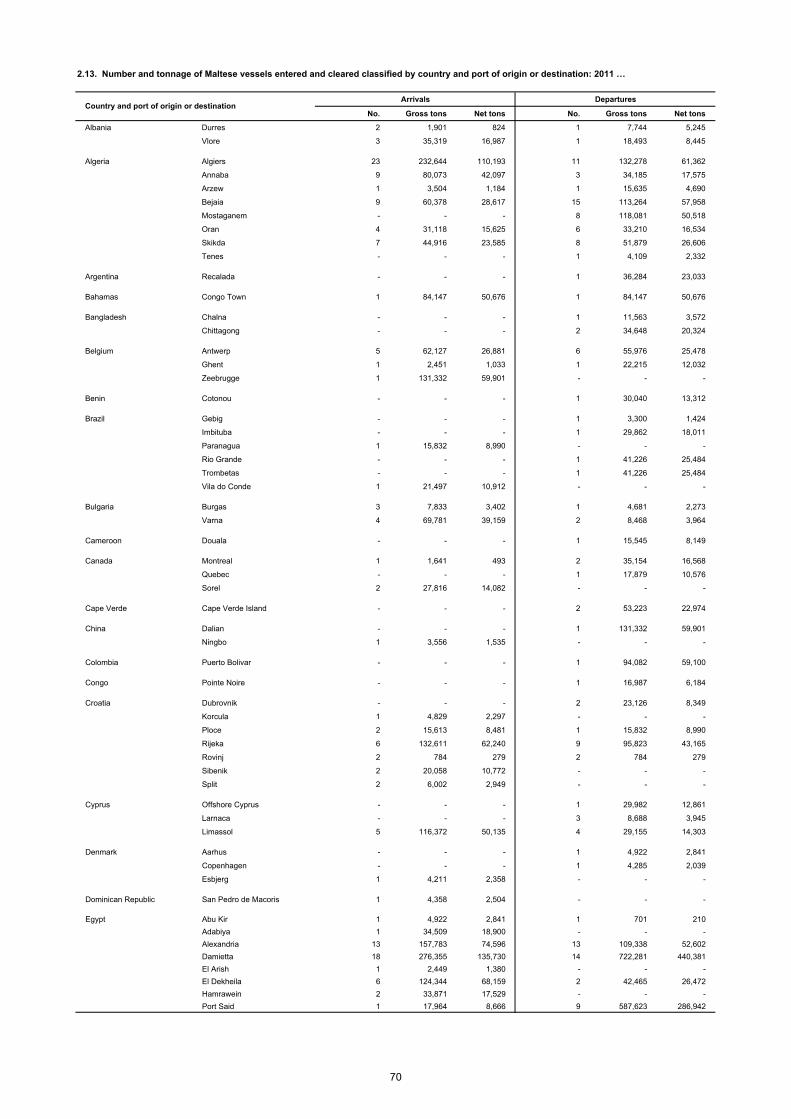
Arrivals Departures
No. Gross tons Net tons No. Gross tons Net tons
Albania Durres 2 1,901 824 1 7,744 5,245
Vlore 3 35,319 16,987 1 18,493 8,445
Algeria Algiers 23 232,644 110,193 11 132,278 61,362
Annaba 9 80,073 42,097 3 34,185 17,575
Arzew 1 3,504 1,184 1 15,635 4,690
Bejaia 9 60,378 28,617 15 113,264 57,958
Mostaganem - - - 8 118,081 50,518
Oran 4 31,118 15,625 6 33,210 16,534
Skikda 7 44,916 23,585 8 51,879 26,606
Tenes - - - 1 4,109 2,332
Argentina Recalada - - - 1 36,284 23,033
Bahamas Congo Town 1 84,147 50,676 1 84,147 50,676
Bangladesh Chalna - - - 1 11,563 3,572
Chittagong - - - 2 34,648 20,324
Belgium Antwerp 5 62,127 26,881 6 55,976 25,478
Ghent 1 2,451 1,033 1 22,215 12,032
Zeebrugge 1 131,332 59,901 - - -
Benin Cotonou - - - 1 30,040 13,312
Brazil Gebig - - - 1 3,300 1,424
Imbituba - - - 1 29,862 18,011
Paranagua 1 15,832 8,990 - - -
Rio Grande - - - 1 41,226 25,484
Trombetas - - - 1 41,226 25,484
Vila do Conde 1 21,497 10,912 - - -
Bulgaria Burgas 3 7,833 3,402 1 4,681 2,273
Varna 4 69,781 39,159 2 8,468 3,964
Cameroon Douala - - - 1 15,545 8,149
Canada Montreal 1 1,641 493 2 35,154 16,568
Quebec - - - 1 17,879 10,576
Sorel 2 27,816 14,082 - - -
Cape Verde Cape Verde Island - - - 2 53,223 22,974
China Dalian - - - 1 131,332 59,901
Ningbo 1 3,556 1,535 - - -
Colombia Puerto Bolivar - - - 1 94,082 59,100
Congo Pointe Noire - - - 1 16,987 6,184
Croatia Dubrovnik - - - 2 23,126 8,349
Korcula 1 4,829 2,297 - - -
Ploce 2 15,613 8,481 1 15,832 8,990
Rijeka 6 132,611 62,240 9 95,823 43,165
Rovinj 2 784 279 2 784 279
Sibenik 2 20,058 10,772 - - -
Split 2 6,002 2,949 - - -
Cyprus Offshore Cyprus - - - 1 29,982 12,861
Larnaca - - - 3 8,688 3,945
Limassol 5 116,372 50,135 4 29,155 14,303
Denmark Aarhus - - - 1 4,922 2,841
Copenhagen - - - 1 4,285 2,039
Esbjerg 1 4,211 2,358 - - -
Dominican Republic San Pedro de Macoris 1 4,358 2,504 - - -
Egypt Abu Kir 1 4,922 2,841 1 701 210
Adabiya 1 34,509 18,900 - - -
Alexandria 13 157,783 74,596 13 109,338 52,602
Damietta 18 276,355 135,730 14 722,281 440,381
El Arish 1 2,449 1,380 - - -
El Dekheila 6 124,344 68,159 2 42,465 26,472
Hamrawein 2 33,871 17,529 - - -
Port Said 1 17,964 8,666 9 587,623 286,942
2.13. Number and tonnage of Maltese vessels entered and cleared classified by country and port of origin or destination: 2011 …
Country and port of origin or destination
70
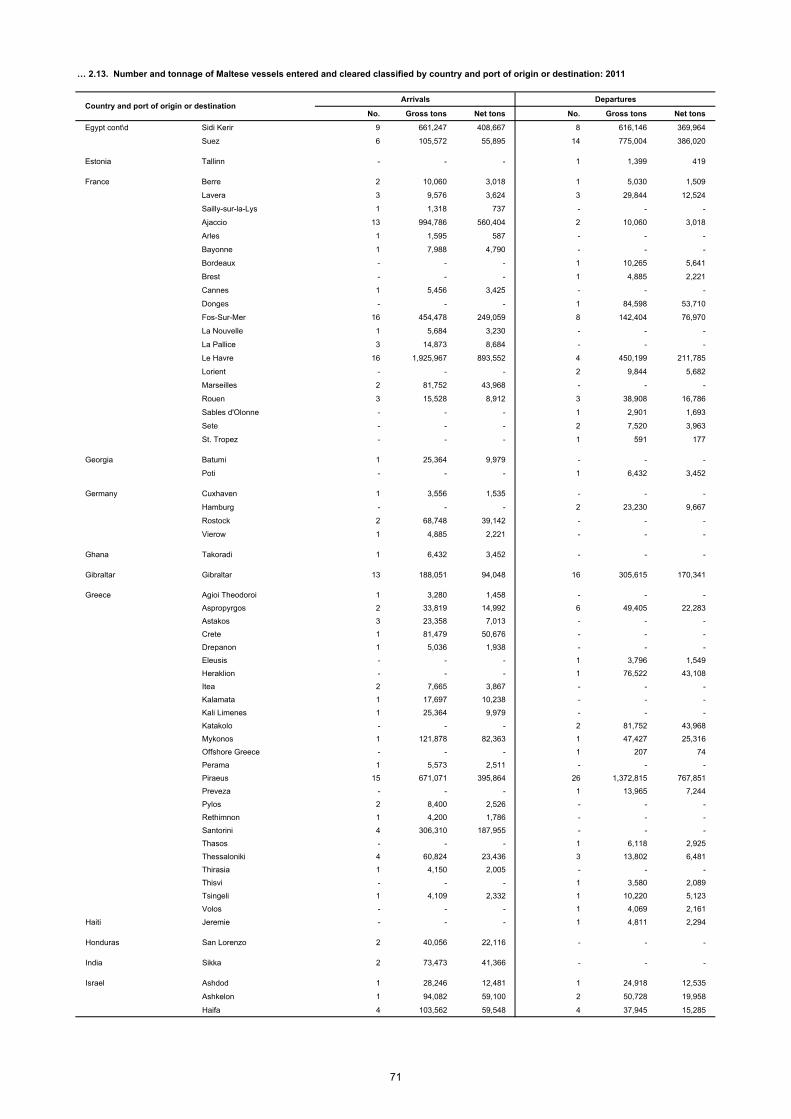
Arrivals Departures
No. Gross tons Net tons No. Gross tons Net tons
Egypt cont\d Sidi Kerir 9 661,247 408,667 8 616,146 369,964
Suez 6 105,572 55,895 14 775,004 386,020
Estonia Tallinn - - - 1 1,399 419
France Berre 2 10,060 3,018 1 5,030 1,509
Lavera 3 9,576 3,624 3 29,844 12,524
Sailly-sur-la-Lys 1 1,318 737 - - -
Ajaccio 13 994,786 560,404 2 10,060 3,018
Arles 1 1,595 587 - - -
Bayonne 1 7,988 4,790 - - -
Bordeaux - - - 1 10,265 5,641
Brest - - - 1 4,885 2,221
Cannes 1 5,456 3,425 - - -
Donges - - - 1 84,598 53,710
Fos-Sur-Mer 16 454,478 249,059 8 142,404 76,970
La Nouvelle 1 5,684 3,230 - - -
La Pallice 3 14,873 8,684 - - -
Le Havre 16 1,925,967 893,552 4 450,199 211,785
Lorient - - - 2 9,844 5,682
Marseilles 2 81,752 43,968 - - -
Rouen 3 15,528 8,912 3 38,908 16,786
Sables d'Olonne - - - 1 2,901 1,693
Sete - - - 2 7,520 3,963
St. Tropez - - - 1 591 177
Georgia Batumi 1 25,364 9,979 - - -
Poti - - - 1 6,432 3,452
Germany Cuxhaven 1 3,556 1,535 - - -
Hamburg - - - 2 23,230 9,667
Rostock 2 68,748 39,142 - - -
Vierow 1 4,885 2,221 - - -
Ghana Takoradi 1 6,432 3,452 - - -
Gibraltar Gibraltar 13 188,051 94,048 16 305,615 170,341
Greece Agioi Theodoroi 1 3,280 1,458 - - -
Aspropyrgos 2 33,819 14,992 6 49,405 22,283
Astakos 3 23,358 7,013 - - -
Crete 1 81,479 50,676 - - -
Drepanon 1 5,036 1,938 - - -
Eleusis - - - 1 3,796 1,549
Heraklion - - - 1 76,522 43,108
Itea 2 7,665 3,867 - - -
Kalamata 1 17,697 10,238 - - -
Kali Limenes 1 25,364 9,979 - - -
Katakolo - - - 2 81,752 43,968
Mykonos 1 121,878 82,363 1 47,427 25,316
Offshore Greece - - - 1 207 74
Perama 1 5,573 2,511 - - -
Piraeus 15 671,071 395,864 26 1,372,815 767,851
Preveza - - - 1 13,965 7,244
Pylos 2 8,400 2,526 - - -
Rethimnon 1 4,200 1,786 - - -
Santorini 4 306,310 187,955 - - -
Thasos - - - 1 6,118 2,925
Thessaloniki 4 60,824 23,436 3 13,802 6,481
Thirasia 1 4,150 2,005 - - -
Thisvi - - - 1 3,580 2,089
Tsingeli 1 4,109 2,332 1 10,220 5,123
Volos - - - 1 4,069 2,161
Haiti Jeremie - - - 1 4,811 2,294
Honduras San Lorenzo 2 40,056 22,116 - - -
India Sikka 2 73,473 41,366 - - -
Israel Ashdod 1 28,246 12,481 1 24,918 12,535
Ashkelon 1 94,082 59,100 2 50,728 19,958
Haifa 4 103,562 59,548 4 37,945 15,285
… 2.13. Number and tonnage of Maltese vessels entered and cleared classified by country and port of origin or destination: 2011
Country and port of origin or destination
71
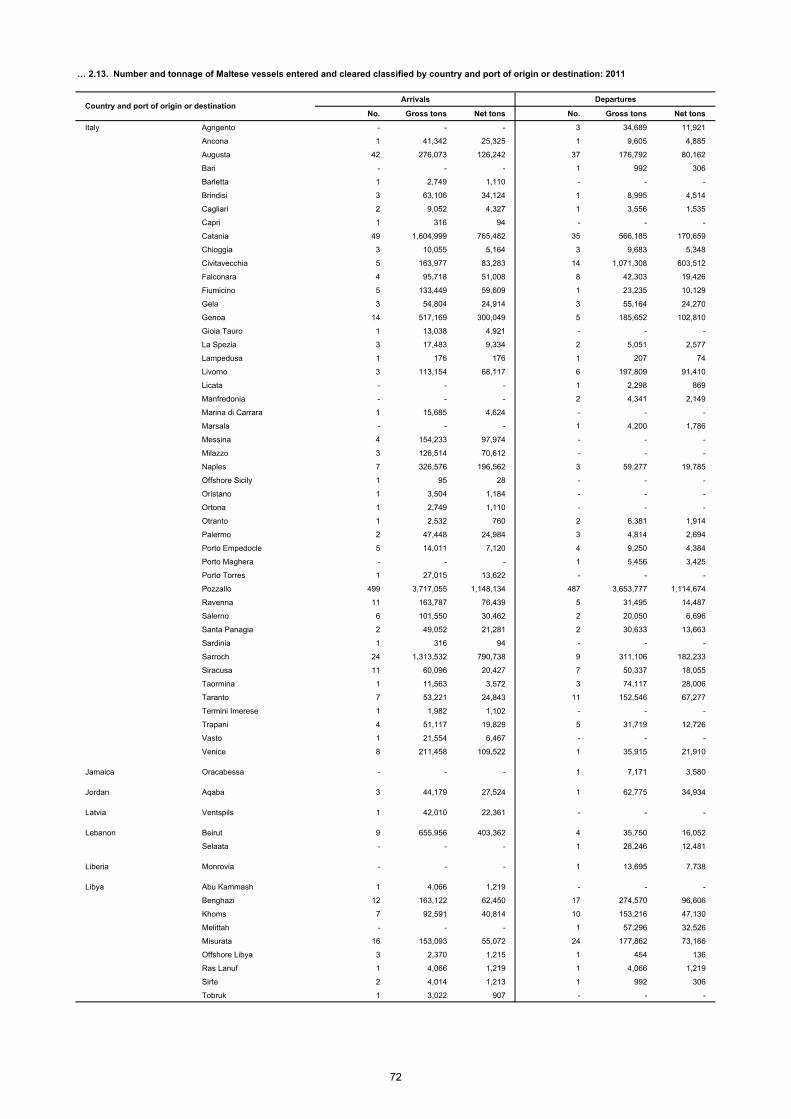
Arrivals Departures
No. Gross tons Net tons No. Gross tons Net tons
Italy Agrigento - - - 3 34,689 11,921
Ancona 1 41,342 25,325 1 9,605 4,885
Augusta 42 276,073 126,242 37 176,792 80,162
Bari - - - 1 992 306
Barletta 1 2,749 1,110 - - -
Brindisi 3 63,106 34,124 1 8,995 4,514
Cagliari 2 9,052 4,327 1 3,556 1,535
Capri 1 316 94 - - -
Catania 49 1,604,999 765,482 35 566,185 170,659
Chioggia 3 10,055 5,164 3 9,683 5,348
Civitavecchia 5 163,977 83,283 14 1,071,308 603,512
Falconara 4 95,718 51,008 8 42,303 19,426
Fiumicino 5 133,449 59,609 1 23,235 10,129
Gela 3 54,804 24,914 3 55,164 24,270
Genoa 14 517,169 300,049 5 185,652 102,810
Gioia Tauro 1 13,038 4,921 - - -
La Spezia 3 17,483 9,334 2 5,051 2,577
Lampedusa 1 176 176 1 207 74
Livorno 3 113,154 68,117 6 197,809 91,410
Licata - - - 1 2,298 869
Manfredonia - - - 2 4,341 2,149
Marina di Carrara 1 15,685 4,624 - - -
Marsala - - - 1 4,200 1,786
Messina 4 154,233 97,974 - - -
Milazzo 3 126,514 70,612 - - -
Naples 7 326,576 196,562 3 59,277 19,785
Offshore Sicily 1 95 28 - - -
Oristano 1 3,504 1,184 - - -
Ortona 1 2,749 1,110 - - -
Otranto 1 2,532 760 2 6,381 1,914
Palermo 2 47,448 24,984 3 4,814 2,694
Porto Empedocle 5 14,011 7,120 4 9,250 4,384
Porto Maghera - - - 1 5,456 3,425
Porto Torres 1 27,015 13,622 - - -
Pozzallo 499 3,717,055 1,148,134 487 3,653,777 1,114,674
Ravenna 11 163,787 76,439 5 31,495 14,487
Salerno 6 101,550 30,462 2 20,050 6,696
Santa Panagia 2 49,052 21,281 2 30,633 13,663
Sardinia 1 316 94 - - -
Sarroch 24 1,313,532 790,738 9 311,106 182,233
Siracusa 11 60,096 20,427 7 50,337 18,055
Taormina 1 11,563 3,572 3 74,117 28,006
Taranto 7 53,221 24,843 11 152,546 67,277
Termini Imerese 1 1,982 1,102 - - -
Trapani 4 51,117 19,829 5 31,719 12,726
Vasto 1 21,554 6,467 - - -
Venice 8 211,458 109,522 1 35,915 21,910
Jamaica Oracabessa - - - 1 7,171 3,580
Jordan Aqaba 3 44,179 27,524 1 62,775 34,934
Latvia Ventspils 1 42,010 22,361 - - -
Lebanon Beirut 9 655,956 403,362 4 35,750 16,052
Selaata - - - 1 28,246 12,481
Liberia Monrovia - - - 1 13,695 7,738
Libya Abu Kammash 1 4,066 1,219 - - -
Benghazi 12 163,122 62,450 17 274,570 96,606
Khoms 7 92,591 40,814 10 153,216 47,130
Melittah - - - 1 57,296 32,526
Misurata 16 153,093 55,072 24 177,862 73,166
Offshore Libya 3 2,370 1,215 1 454 136
Ras Lanuf 1 4,066 1,219 1 4,066 1,219
Sirte 2 4,014 1,213 1 992 306
Tobruk 1 3,022 907 - - -
… 2.13. Number and tonnage of Maltese vessels entered and cleared classified by country and port of origin or destination: 2011
Country and port of origin or destination
72
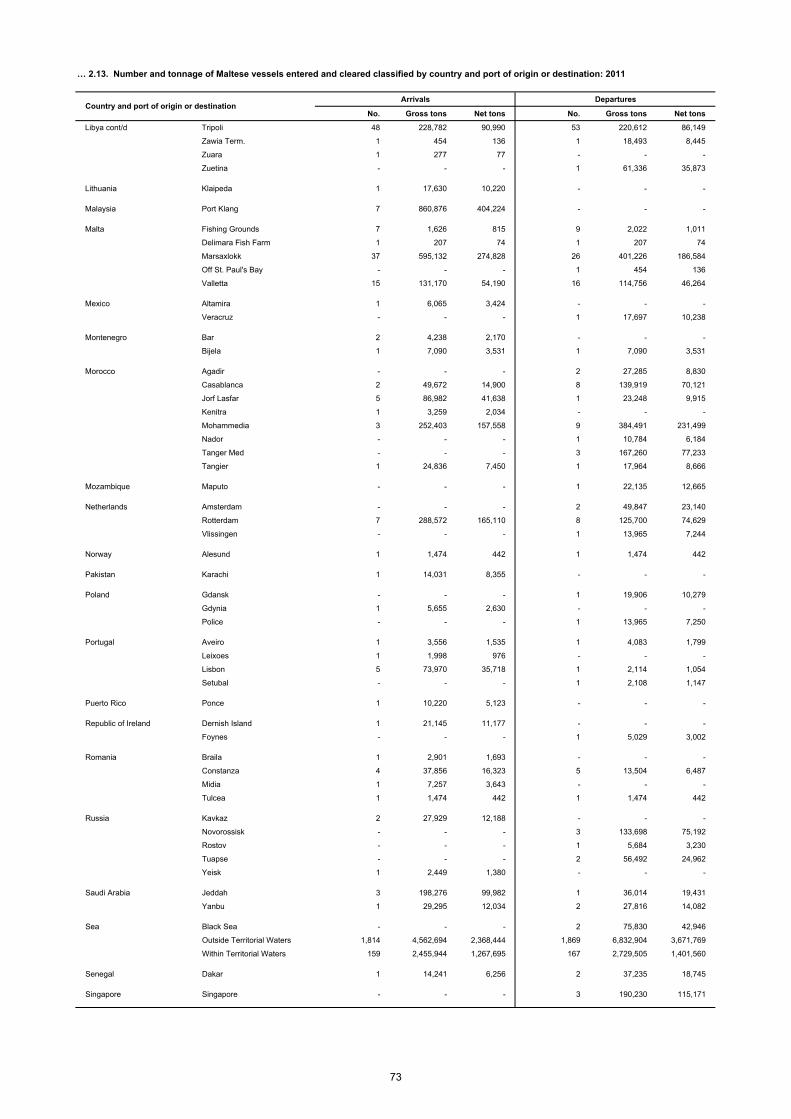
Arrivals Departures
No. Gross tons Net tons No. Gross tons Net tons
Libya cont/d Tripoli 48 228,782 90,990 53 220,612 86,149
Zawia Term. 1 454 136 1 18,493 8,445
Zuara 1 277 77 - - -
Zuetina - - - 1 61,336 35,873
Lithuania Klaipeda 1 17,630 10,220 - - -
Malaysia Port Klang 7 860,876 404,224 - - -
Malta Fishing Grounds 7 1,626 815 9 2,022 1,011
Delimara Fish Farm 1 207 74 1 207 74
Marsaxlokk 37 595,132 274,828 26 401,226 186,584
Off St. Paul's Bay - - - 1 454 136
Valletta 15 131,170 54,190 16 114,756 46,264
Mexico Altamira 1 6,065 3,424 - - -
Veracruz - - - 1 17,697 10,238
Montenegro Bar 2 4,238 2,170 - - -
Bijela 1 7,090 3,531 1 7,090 3,531
Morocco Agadir - - - 2 27,285 8,830
Casablanca 2 49,672 14,900 8 139,919 70,121
Jorf Lasfar 5 86,982 41,638 1 23,248 9,915
Kenitra 1 3,259 2,034 - - -
Mohammedia 3 252,403 157,558 9 384,491 231,499
Nador - - - 1 10,784 6,184
Tanger Med - - - 3 167,260 77,233
Tangier 1 24,836 7,450 1 17,964 8,666
Mozambique Maputo - - - 1 22,135 12,665
Netherlands Amsterdam - - - 2 49,847 23,140
Rotterdam 7 288,572 165,110 8 125,700 74,629
Vlissingen - - - 1 13,965 7,244
Norway Alesund 1 1,474 442 1 1,474 442
Pakistan Karachi 1 14,031 8,355 - - -
Poland Gdansk - - - 1 19,906 10,279
Gdynia 1 5,655 2,630 - - -
Police - - - 1 13,965 7,250
Portugal Aveiro 1 3,556 1,535 1 4,083 1,799
Leixoes 1 1,998 976 - - -
Lisbon 5 73,970 35,718 1 2,114 1,054
Setubal - - - 1 2,108 1,147
Puerto Rico Ponce 1 10,220 5,123 - - -
Republic of Ireland Dernish Island 1 21,145 11,177 - - -
Foynes - - - 1 5,029 3,002
Romania Braila 1 2,901 1,693 - - -
Constanza 4 37,856 16,323 5 13,504 6,487
Midia 1 7,257 3,643 - - -
Tulcea 1 1,474 442 1 1,474 442
Russia Kavkaz 2 27,929 12,188 - - -
Novorossisk - - - 3 133,698 75,192
Rostov - - - 1 5,684 3,230
Tuapse - - - 2 56,492 24,962
Yeisk 1 2,449 1,380 - - -
Saudi Arabia Jeddah 3 198,276 99,982 1 36,014 19,431
Yanbu 1 29,295 12,034 2 27,816 14,082
Sea Black Sea - - - 2 75,830 42,946
Outside Territorial Waters 1,814 4,562,694 2,368,444 1,869 6,832,904 3,671,769
Within Territorial Waters 159 2,455,944 1,267,695 167 2,729,505 1,401,560
Senegal Dakar 1 14,241 6,256 2 37,235 18,745
Singapore Singapore - - - 3 190,230 115,171
Country and port of origin or destination
… 2.13. Number and tonnage of Maltese vessels entered and cleared classified by country and port of origin or destination: 2011
73
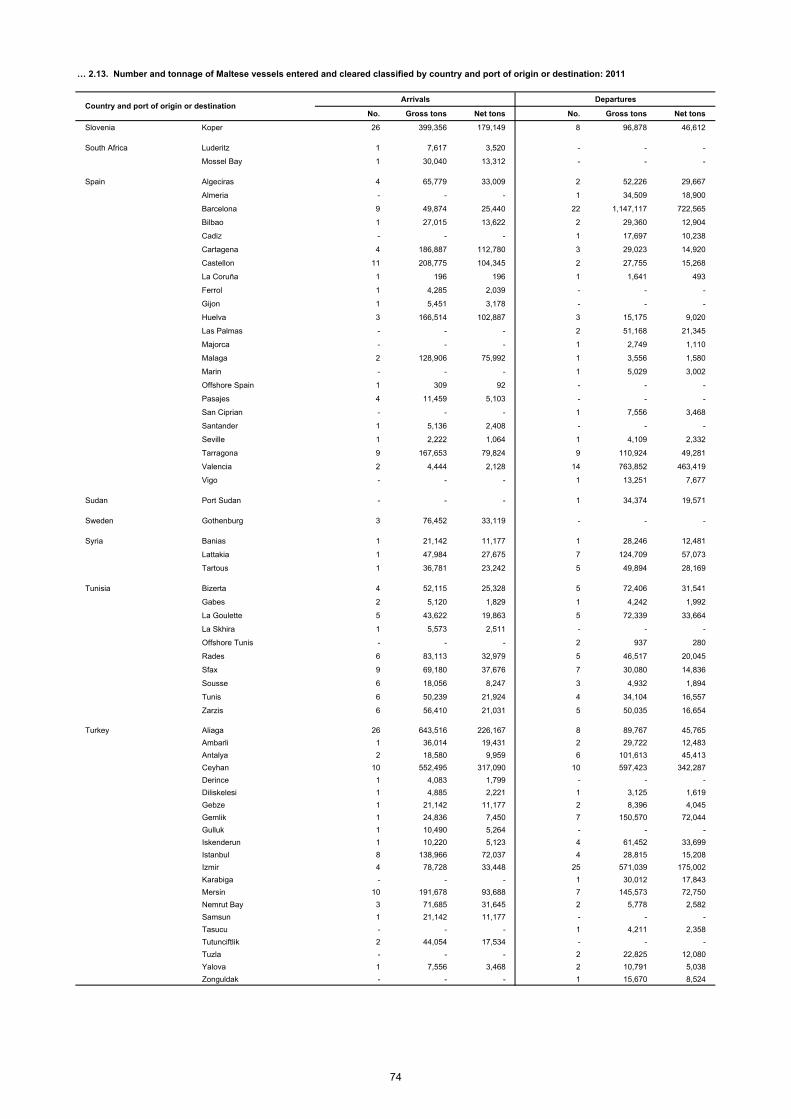
Arrivals Departures
No. Gross tons Net tons No. Gross tons Net tons
Slovenia Koper 26 399,356 179,149 8 96,878 46,612
South Africa Luderitz 1 7,617 3,520 - - -
Mossel Bay 1 30,040 13,312 - - -
Spain Algeciras 4 65,779 33,009 2 52,226 29,667
Almeria - - - 1 34,509 18,900
Barcelona 9 49,874 25,440 22 1,147,117 722,565
Bilbao 1 27,015 13,622 2 29,360 12,904
Cadiz - - - 1 17,697 10,238
Cartagena 4 186,887 112,780 3 29,023 14,920
Castellon 11 208,775 104,345 2 27,755 15,268
La Coruña 1 196 196 1 1,641 493
Ferrol 1 4,285 2,039 - - -
Gijon 1 5,451 3,178 - - -
Huelva 3 166,514 102,887 3 15,175 9,020
Las Palmas - - - 2 51,168 21,345
Majorca - - - 1 2,749 1,110
Malaga 2 128,906 75,992 1 3,556 1,580
Marin - - - 1 5,029 3,002
Offshore Spain 1 309 92 - - -
Pasajes 4 11,459 5,103 - - -
San Ciprian - - - 1 7,556 3,468
Santander 1 5,136 2,408 - - -
Seville 1 2,222 1,064 1 4,109 2,332
Tarragona 9 167,653 79,824 9 110,924 49,281
Valencia 2 4,444 2,128 14 763,852 463,419
Vigo - - - 1 13,251 7,677
Sudan Port Sudan - - - 1 34,374 19,571
Sweden Gothenburg 3 76,452 33,119 - - -
Syria Banias 1 21,142 11,177 1 28,246 12,481
Lattakia 1 47,984 27,675 7 124,709 57,073
Tartous 1 36,781 23,242 5 49,894 28,169
Tunisia Bizerta 4 52,115 25,328 5 72,406 31,541
Gabes 2 5,120 1,829 1 4,242 1,992
La Goulette 5 43,622 19,863 5 72,339 33,664
La Skhira 1 5,573 2,511 - - -
Offshore Tunis - - - 2 937 280
Rades 6 83,113 32,979 5 46,517 20,045
Sfax 9 69,180 37,676 7 30,080 14,836
Sousse 6 18,056 8,247 3 4,932 1,894
Tunis 6 50,239 21,924 4 34,104 16,557
Zarzis 6 56,410 21,031 5 50,035 16,654
Turkey Aliaga 26 643,516 226,167 8 89,767 45,765
Ambarli 1 36,014 19,431 2 29,722 12,483
Antalya 2 18,580 9,959 6 101,613 45,413
Ceyhan 10 552,495 317,090 10 597,423 342,287
Derince 1 4,083 1,799 - - -
Diliskelesi 1 4,885 2,221 1 3,125 1,619
Gebze 1 21,142 11,177 2 8,396 4,045
Gemlik 1 24,836 7,450 7 150,570 72,044
Gulluk 1 10,490 5,264 - - -
Iskenderun 1 10,220 5,123 4 61,452 33,699
Istanbul 8 138,966 72,037 4 28,815 15,208
Izmir 4 78,728 33,448 25 571,039 175,002
Karabiga - - - 1 30,012 17,843
Mersin 10 191,678 93,688 7 145,573 72,750
Nemrut Bay 3 71,685 31,645 2 5,778 2,582
Samsun 1 21,142 11,177 - - -
Tasucu - - - 1 4,211 2,358
Tutunciftlik 2 44,054 17,534 - - -
Tuzla - - - 2 22,825 12,080
Yalova 1 7,556 3,468 2 10,791 5,038
Zonguldak - - - 1 15,670 8,524
… 2.13. Number and tonnage of Maltese vessels entered and cleared classified by country and port of origin or destination: 2011
Country and port of origin or destination
74
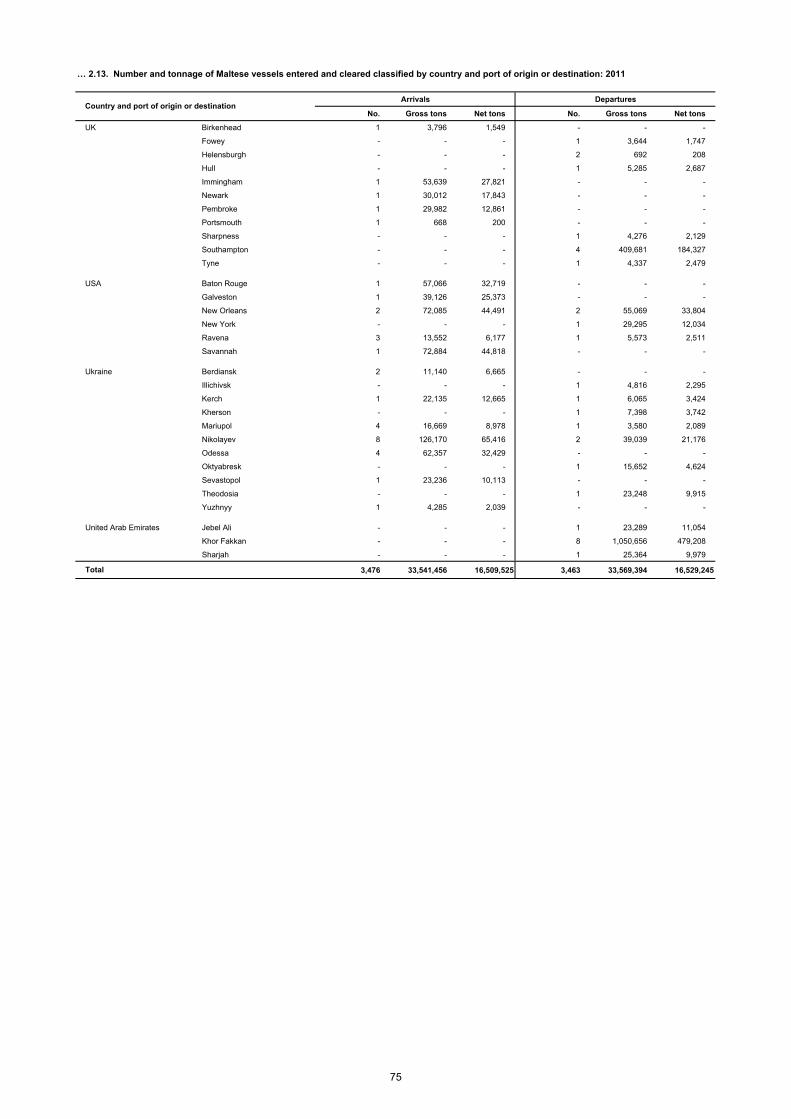
Arrivals Departures
No. Gross tons Net tons No. Gross tons Net tons
UK Birkenhead 1 3,796 1,549 - - -
Fowey - - - 1 3,644 1,747
Helensburgh - - - 2 692 208
Hull - - - 1 5,285 2,687
Immingham 1 53,639 27,821 - - -
Newark 1 30,012 17,843 - - -
Pembroke 1 29,982 12,861 - - -
Portsmouth 1 668 200 - - -
Sharpness - - - 1 4,276 2,129
Southampton - - - 4 409,681 184,327
Tyne - - - 1 4,337 2,479
USA Baton Rouge 1 57,066 32,719 - - -
Galveston 1 39,126 25,373 - - -
New Orleans 2 72,085 44,491 2 55,069 33,804
New York - - - 1 29,295 12,034
Ravena 3 13,552 6,177 1 5,573 2,511
Savannah 1 72,884 44,818 - - -
Ukraine Berdiansk 2 11,140 6,665 - - -
Illichivsk - - - 1 4,816 2,295
Kerch 1 22,135 12,665 1 6,065 3,424
Kherson - - - 1 7,398 3,742
Mariupol 4 16,669 8,978 1 3,580 2,089
Nikolayev 8 126,170 65,416 2 39,039 21,176
Odessa 4 62,357 32,429 - - -
Oktyabresk - - - 1 15,652 4,624
Sevastopol 1 23,236 10,113 - - -
Theodosia - - - 1 23,248 9,915
Yuzhnyy 1 4,285 2,039 - - -
United Arab Emirates Jebel Ali - - - 1 23,289 11,054
Khor Fakkan - - - 8 1,050,656 479,208
Sharjah - - - 1 25,364 9,979
3,476 33,541,456 16,509,525 3,463 33,569,394 16,529,245Total
… 2.13. Number and tonnage of Maltese vessels entered and cleared classified by country and port of origin or destination: 2011
Country and port of origin or destination
75
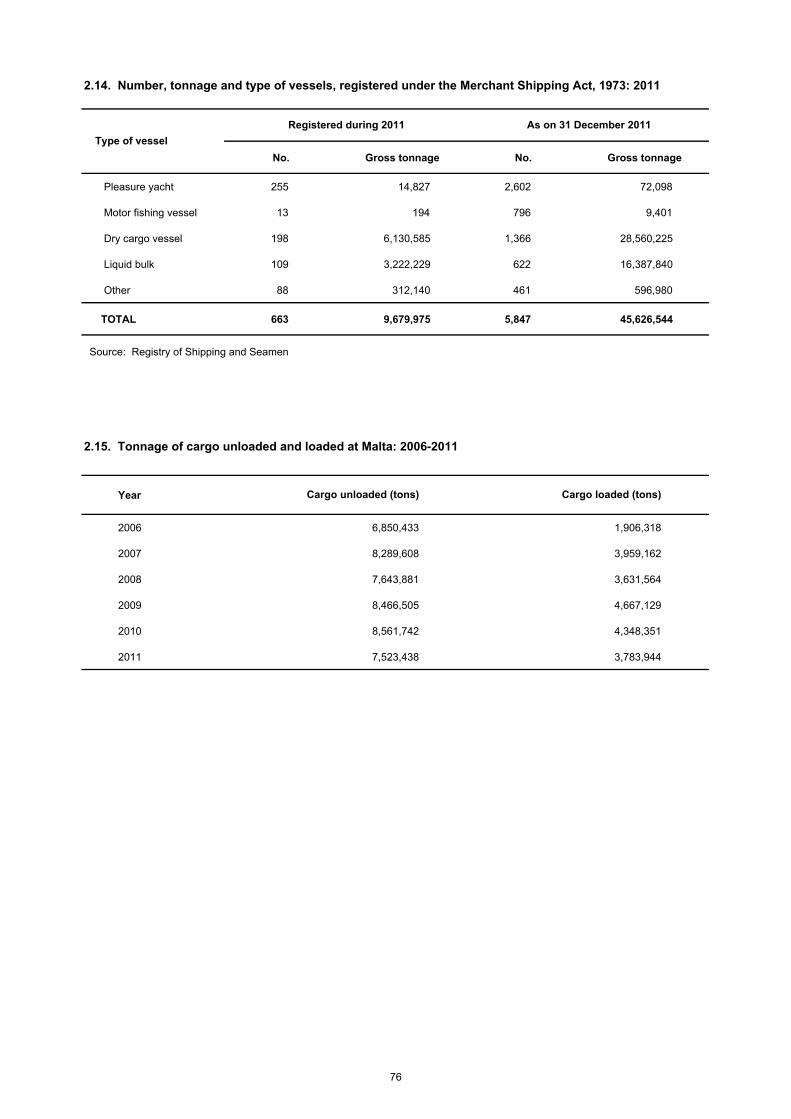
No. Gross tonnage No. Gross tonnage
Pleasure yacht 255 14,827 2,602 72,098
Motor fishing vessel 13 194 796 9,401
Dry cargo vessel 198 6,130,585 1,366 28,560,225
Liquid bulk 109 3,222,229 622 16,387,840
Other 88 312,140 461 596,980
TOTAL 663 9,679,975 5,847 45,626,544
Source: Registry of Shipping and Seamen
Year
2006 6,850,433 1,906,318
2007 8,289,608 3,959,162
2008 7,643,881 3,631,564
2009 8,466,505 4,667,129
2010 8,561,742 4,348,351
2011 7,523,438 3,783,944
2.15. Tonnage of cargo unloaded and loaded at Malta: 2006-2011
Cargo loaded (tons)Cargo unloaded (tons)
2.14. Number, tonnage and type of vessels, registered under the Merchant Shipping Act, 1973: 2011
Type of vessel
Registered during 2011 As on 31 December 2011
76
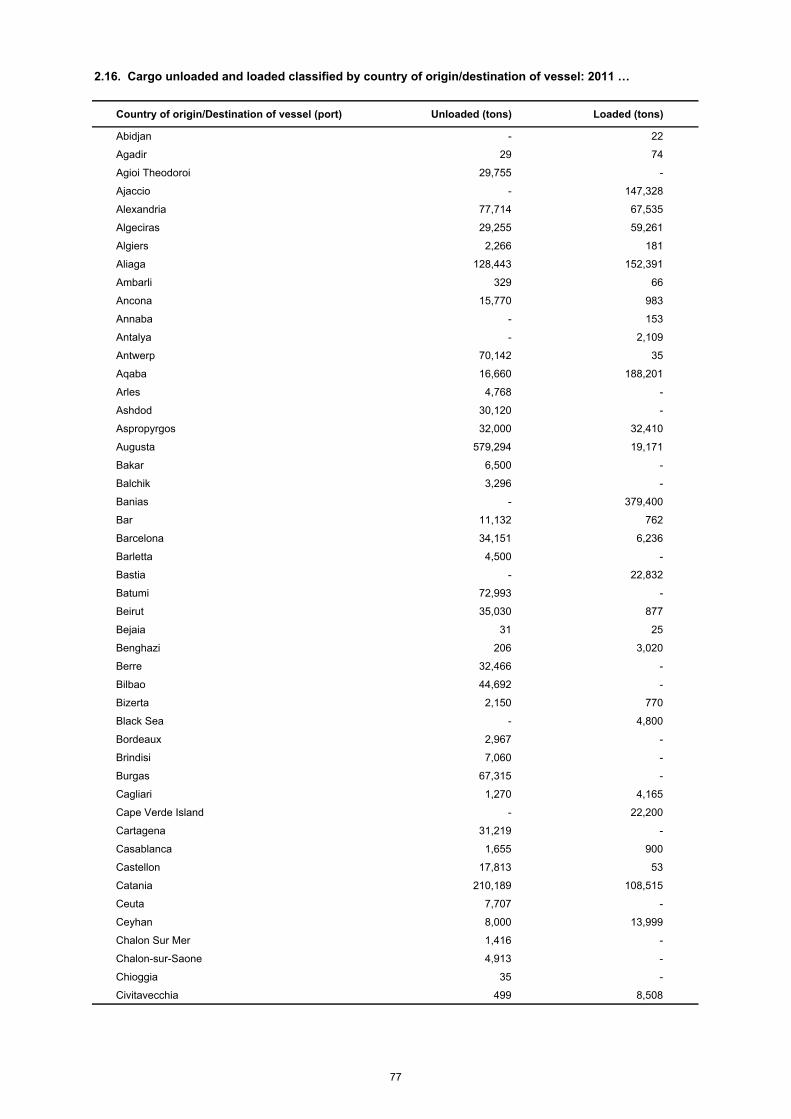
Country of origin/Destination of vessel (port) Unloaded (tons) Loaded (tons)
Abidjan - 22
Agadir 29 74
Agioi Theodoroi 29,755 -
Ajaccio - 147,328
Alexandria 77,714 67,535
Algeciras 29,255 59,261
Algiers 2,266 181
Aliaga 128,443 152,391
Ambarli 329 66
Ancona 15,770 983
Annaba - 153
Antalya - 2,109
Antwerp 70,142 35
Aqaba 16,660 188,201
Arles 4,768 -
Ashdod 30,120 -
Aspropyrgos 32,000 32,410
Augusta 579,294 19,171
Bakar 6,500 -
Balchik 3,296 -
Banias - 379,400
Bar 11,132 762
Barcelona 34,151 6,236
Barletta 4,500 -
Bastia - 22,832
Batumi 72,993 -
Beirut 35,030 877
Bejaia 31 25
Benghazi 206 3,020
Berre 32,466 -
Bilbao 44,692 -
Bizerta 2,150 770
Black Sea - 4,800
Bordeaux 2,967 -
Brindisi 7,060 -
Burgas 67,315 -
Cagliari 1,270 4,165
Cape Verde Island - 22,200
Cartagena 31,219 -
Casablanca 1,655 900
Castellon 17,813 53
Catania 210,189 108,515
Ceuta 7,707 -
Ceyhan 8,000 13,999
Chalon Sur Mer 1,416 -
Chalon-sur-Saone 4,913 -
Chioggia 35 -
Civitavecchia 499 8,508
2.16. Cargo unloaded and loaded classified by country of origin/destination of vessel: 2011 …
77
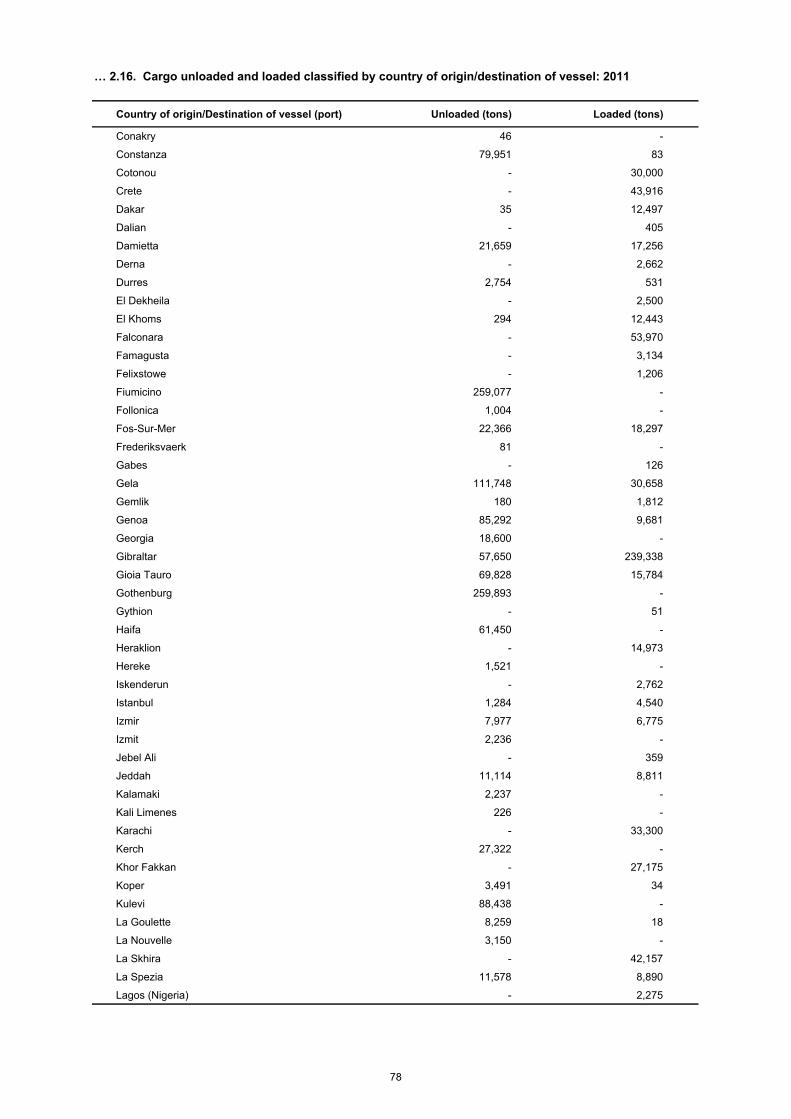
Country of origin/Destination of vessel (port) Unloaded (tons) Loaded (tons)
Conakry 46 -
Constanza 79,951 83
Cotonou - 30,000
Crete - 43,916
Dakar 35 12,497
Dalian - 405
Damietta 21,659 17,256
Derna - 2,662
Durres 2,754 531
El Dekheila - 2,500
El Khoms 294 12,443
Falconara - 53,970
Famagusta - 3,134
Felixstowe - 1,206
Fiumicino 259,077 -
Follonica 1,004 -
Fos-Sur-Mer 22,366 18,297
Frederiksvaerk 81 -
Gabes - 126
Gela 111,748 30,658
Gemlik 180 1,812
Genoa 85,292 9,681
Georgia 18,600 -
Gibraltar 57,650 239,338
Gioia Tauro 69,828 15,784
Gothenburg 259,893 -
Gythion - 51
Haifa 61,450 -
Heraklion - 14,973
Hereke 1,521 -
Iskenderun - 2,762
Istanbul 1,284 4,540
Izmir 7,977 6,775
Izmit 2,236 -
Jebel Ali - 359
Jeddah 11,114 8,811
Kalamaki 2,237 -
Kali Limenes 226 -
Karachi - 33,300
Kerch 27,322 -
Khor Fakkan - 27,175
Koper 3,491 34
Kulevi 88,438 -
La Goulette 8,259 18
La Nouvelle 3,150 -
La Skhira - 42,157
La Spezia 11,578 8,890
Lagos (Nigeria) - 2,275
… 2.16. Cargo unloaded and loaded classified by country of origin/destination of vessel: 2011
78
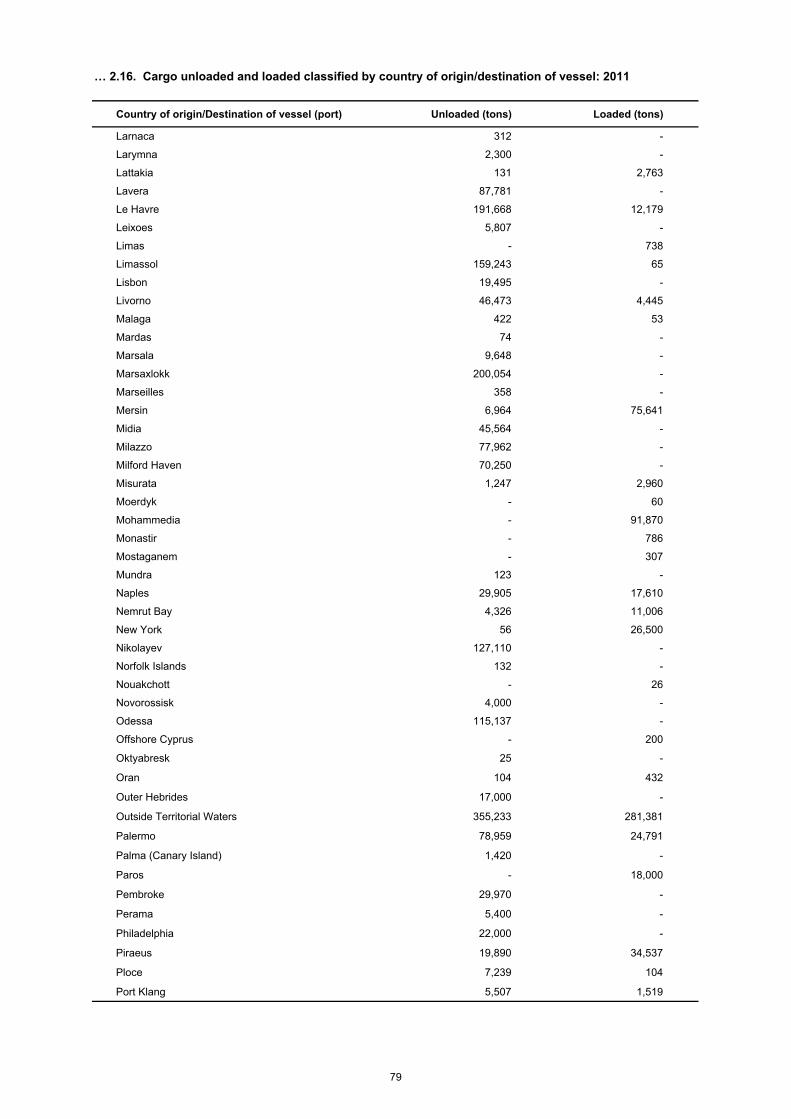
Country of origin/Destination of vessel (port) Unloaded (tons) Loaded (tons)
Larnaca 312 -
Larymna 2,300 -
Lattakia 131 2,763
Lavera 87,781 -
Le Havre 191,668 12,179
Leixoes 5,807 -
Limas - 738
Limassol 159,243 65
Lisbon 19,495 -
Livorno 46,473 4,445
Malaga 422 53
Mardas 74 -
Marsala 9,648 -
Marsaxlokk 200,054 -
Marseilles 358 -
Mersin 6,964 75,641
Midia 45,564 -
Milazzo 77,962 -
Milford Haven 70,250 -
Misurata 1,247 2,960
Moerdyk - 60
Mohammedia - 91,870
Monastir - 786
Mostaganem - 307
Mundra 123 -
Naples 29,905 17,610
Nemrut Bay 4,326 11,006
New York 56 26,500
Nikolayev 127,110 -
Norfolk Islands 132 -
Nouakchott - 26
Novorossisk 4,000 -
Odessa 115,137 -
Offshore Cyprus - 200
Oktyabresk 25 -
Oran 104 432
Outer Hebrides 17,000 -
Outside Territorial Waters 355,233 281,381
Palermo 78,959 24,791
Palma (Canary Island) 1,420 -
Paros - 18,000
Pembroke 29,970 -
Perama 5,400 -
Philadelphia 22,000 -
Piraeus 19,890 34,537
Ploce 7,239 104
Port Klang 5,507 1,519
… 2.16. Cargo unloaded and loaded classified by country of origin/destination of vessel: 2011
79
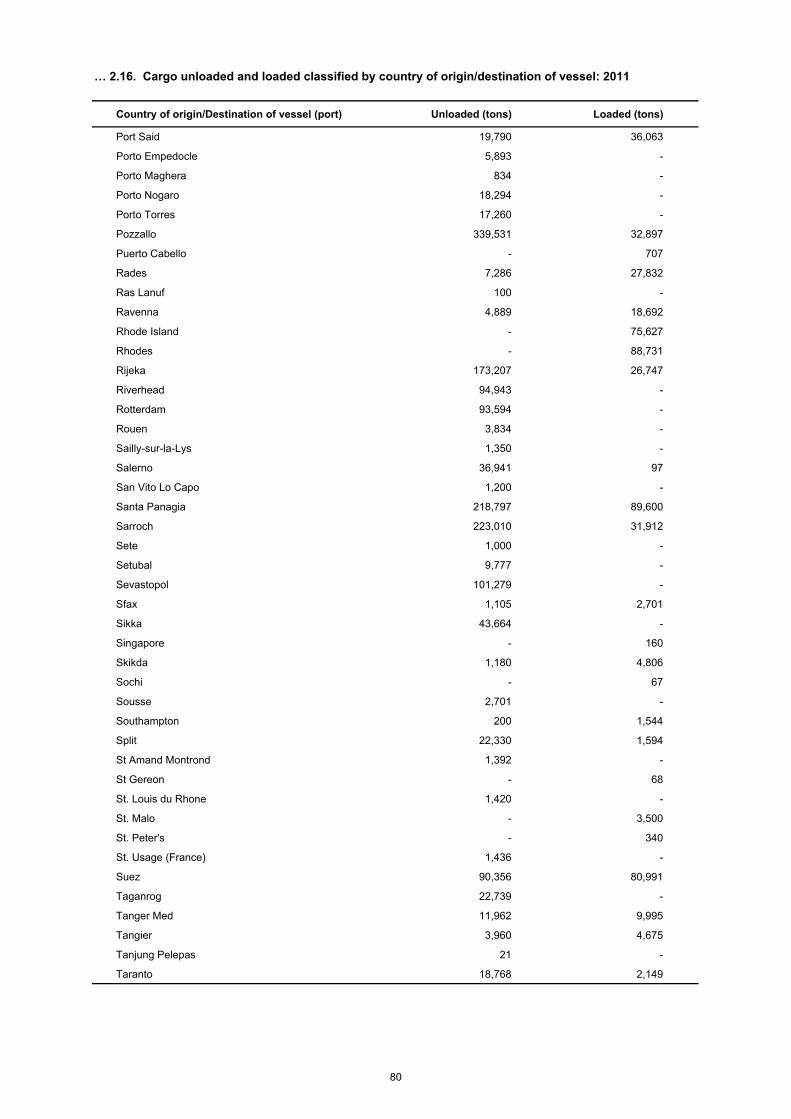
Country of origin/Destination of vessel (port) Unloaded (tons) Loaded (tons)
Port Said 19,790 36,063
Porto Empedocle 5,893 -
Porto Maghera 834 -
Porto Nogaro 18,294 -
Porto Torres 17,260 -
Pozzallo 339,531 32,897
Puerto Cabello - 707
Rades 7,286 27,832
Ras Lanuf 100 -
Ravenna 4,889 18,692
Rhode Island - 75,627
Rhodes - 88,731
Rijeka 173,207 26,747
Riverhead 94,943 -
Rotterdam 93,594 -
Rouen 3,834 -
Sailly-sur-la-Lys 1,350 -
Salerno 36,941 97
San Vito Lo Capo 1,200 -
Santa Panagia 218,797 89,600
Sarroch 223,010 31,912
Sete 1,000 -
Setubal 9,777 -
Sevastopol 101,279 -
Sfax 1,105 2,701
Sikka 43,664 -
Singapore - 160
Skikda 1,180 4,806
Sochi - 67
Sousse 2,701 -
Southampton 200 1,544
Split 22,330 1,594
St Amand Montrond 1,392 -
St Gereon - 68
St. Louis du Rhone 1,420 -
St. Malo - 3,500
St. Peter's - 340
St. Usage (France) 1,436 -
Suez 90,356 80,991
Taganrog 22,739 -
Tanger Med 11,962 9,995
Tangier 3,960 4,675
Tanjung Pelepas 21 -
Taranto 18,768 2,149
… 2.16. Cargo unloaded and loaded classified by country of origin/destination of vessel: 2011
80
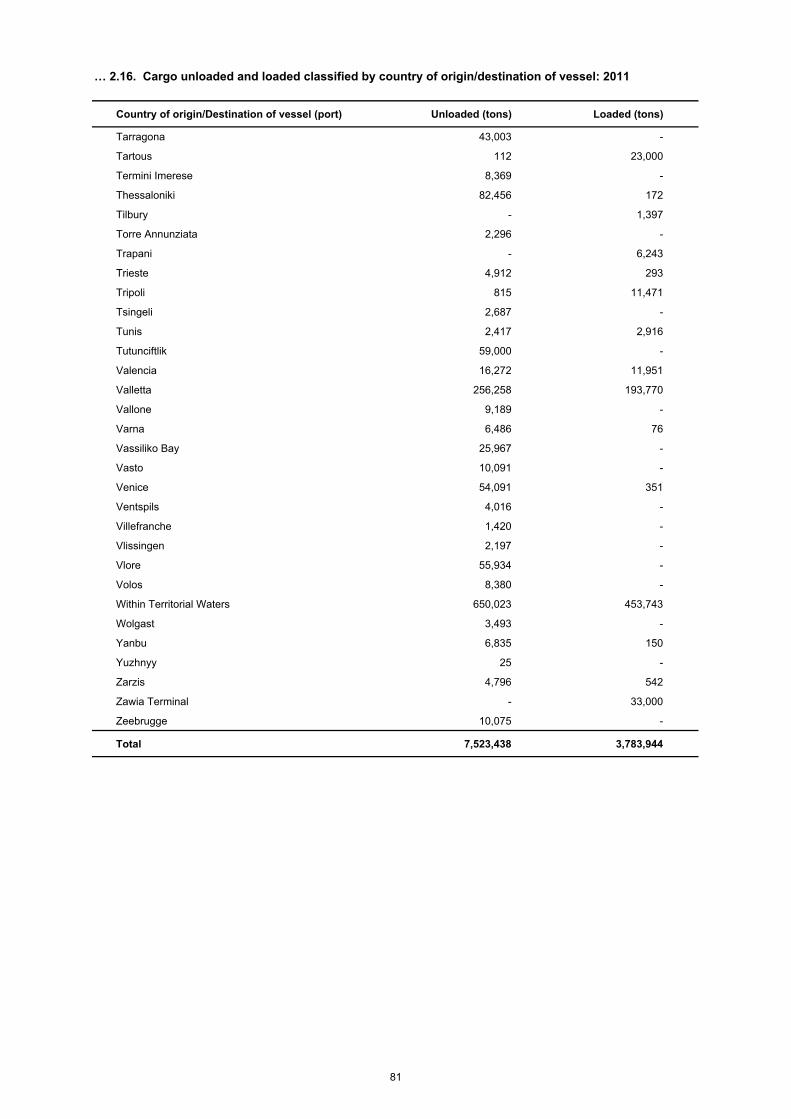
Country of origin/Destination of vessel (port) Unloaded (tons) Loaded (tons)
Tarragona 43,003 -
Tartous 112 23,000
Termini Imerese 8,369 -
Thessaloniki 82,456 172
Tilbury - 1,397
Torre Annunziata 2,296 -
Trapani - 6,243
Trieste 4,912 293
Tripoli 815 11,471
Tsingeli 2,687 -
Tunis 2,417 2,916
Tutunciftlik 59,000 -
Valencia 16,272 11,951
Valletta 256,258 193,770
Vallone 9,189 -
Varna 6,486 76
Vassiliko Bay 25,967 -
Vasto 10,091 -
Venice 54,091 351
Ventspils 4,016 -
Villefranche 1,420 -
Vlissingen 2,197 -
Vlore 55,934 -
Volos 8,380 -
Within Territorial Waters 650,023 453,743
Wolgast 3,493 -
Yanbu 6,835 150
Yuzhnyy 25 -
Zarzis 4,796 542
Zawia Terminal - 33,000
Zeebrugge 10,075 -
Total 7,523,438 3,783,944
… 2.16. Cargo unloaded and loaded classified by country of origin/destination of vessel: 2011
81
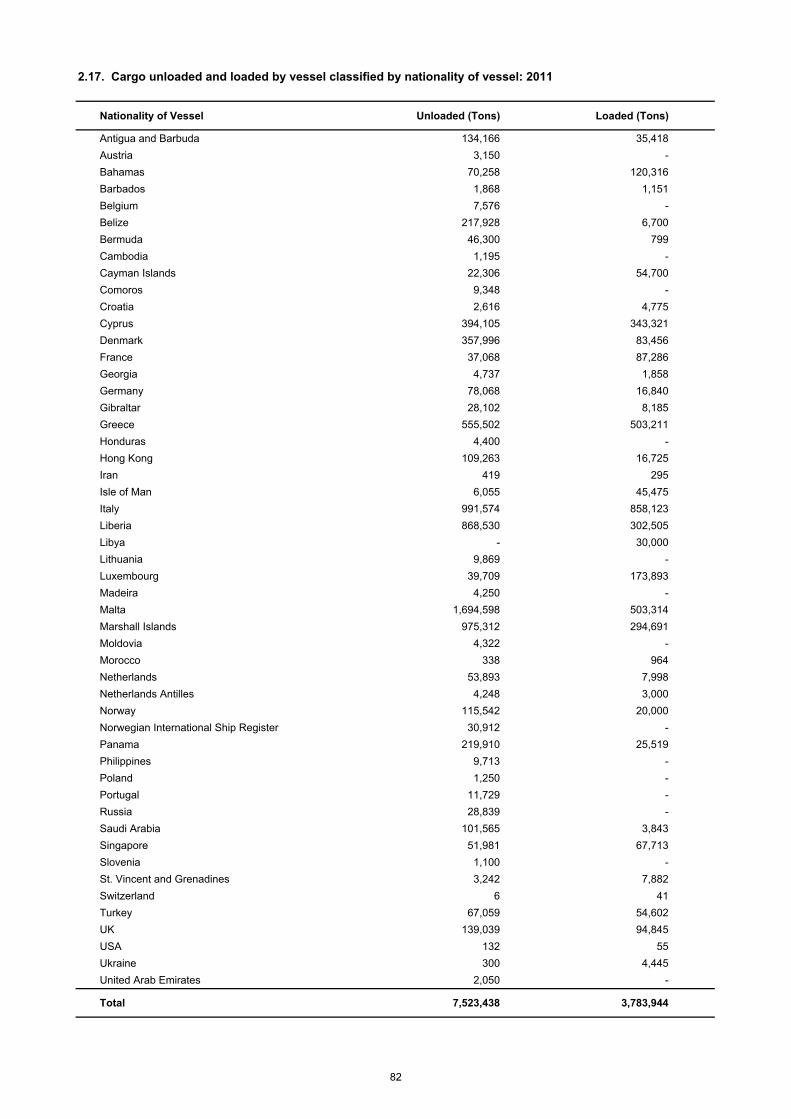
2.17. Cargo unloaded and loaded by vessel classified by nationality of vessel: 2011
Nationality of Vessel Unloaded (Tons) Loaded (Tons)
Antigua and Barbuda 134,166 35,418
Austria 3,150 -
Bahamas 70,258 120,316
Barbados 1,868 1,151
Belgium 7,576 -
Belize 217,928 6,700
Bermuda 46,300 799
Cambodia 1,195 -
Cayman Islands 22,306 54,700
Comoros 9,348 -
Croatia 2,616 4,775
Cyprus 394,105 343,321
Denmark 357,996 83,456
France 37,068 87,286
Georgia 4,737 1,858
Germany 78,068 16,840
Gibraltar 28,102 8,185
Greece 555,502 503,211
Honduras 4,400 -
Hong Kong 109,263 16,725
Iran 419 295
Isle of Man 6,055 45,475
Italy 991,574 858,123
Liberia 868,530 302,505
Libya - 30,000
Lithuania 9,869 -
Luxembourg 39,709 173,893
Madeira 4,250 -
Malta 1,694,598 503,314
Marshall Islands 975,312 294,691
Moldovia 4,322 -
Morocco 338 964
Netherlands 53,893 7,998
Netherlands Antilles 4,248 3,000
Norway 115,542 20,000
Norwegian International Ship Register 30,912 -
Panama 219,910 25,519
Philippines 9,713 -
Poland 1,250 -
Portugal 11,729 -
Russia 28,839 -
Saudi Arabia 101,565 3,843
Singapore 51,981 67,713
Slovenia 1,100 -
St. Vincent and Grenadines 3,242 7,882
Switzerland 6 41
Turkey 67,059 54,602
UK 139,039 94,845
USA 132 55
Ukraine 300 4,445
United Arab Emirates 2,050 -
Total 7,523,438 3,783,944
82
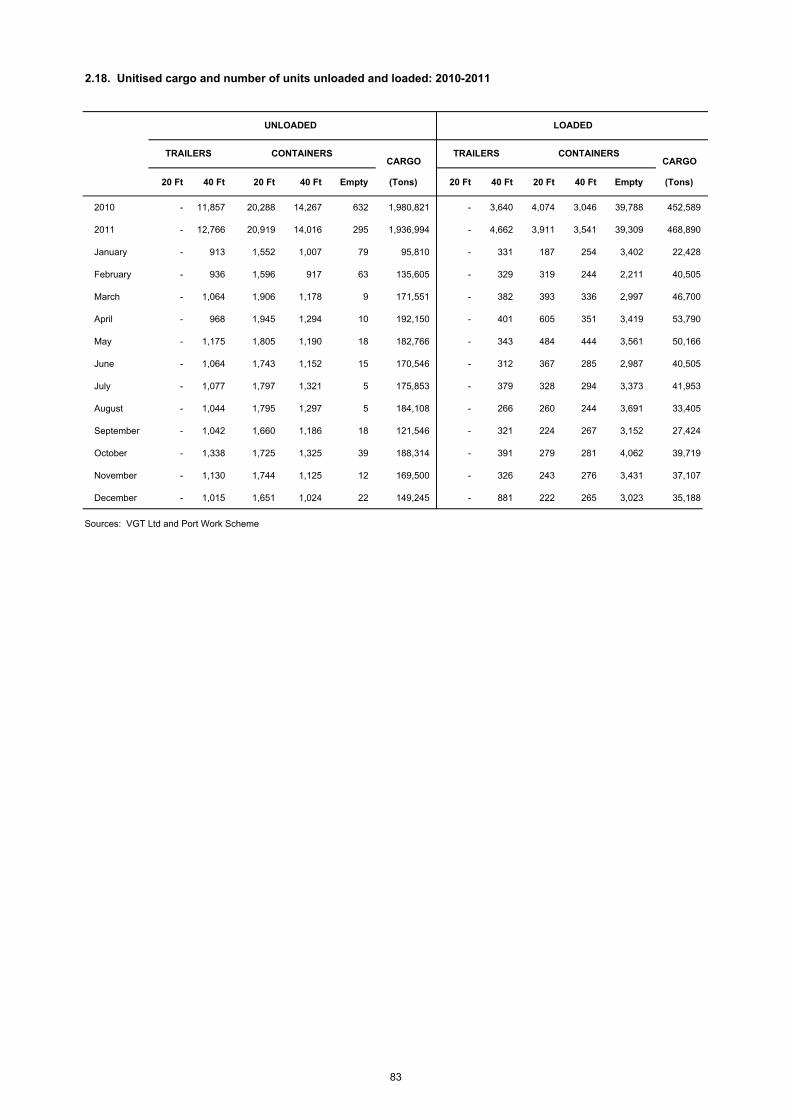
2.18. Unitised cargo and number of units unloaded and loaded: 2010-2011
CARGO CARGO
20 Ft 40 Ft 20 Ft 40 Ft Empty (Tons) 20 Ft 40 Ft 20 Ft 40 Ft Empty (Tons)
2010 - 11,857 20,288 14,267 632 1,980,821 - 3,640 4,074 3,046 39,788 452,589
2011 - 12,766 20,919 14,016 295 1,936,994 - 4,662 3,911 3,541 39,309 468,890
January - 913 1,552 1,007 79 95,810 - 331 187 254 3,402 22,428
February - 936 1,596 917 63 135,605 - 329 319 244 2,211 40,505
March - 1,064 1,906 1,178 9 171,551 - 382 393 336 2,997 46,700
April - 968 1,945 1,294 10 192,150 - 401 605 351 3,419 53,790
May - 1,175 1,805 1,190 18 182,766 - 343 484 444 3,561 50,166
June - 1,064 1,743 1,152 15 170,546 - 312 367 285 2,987 40,505
July - 1,077 1,797 1,321 5 175,853 - 379 328 294 3,373 41,953
August - 1,044 1,795 1,297 5 184,108 - 266 260 244 3,691 33,405
September - 1,042 1,660 1,186 18 121,546 - 321 224 267 3,152 27,424
October - 1,338 1,725 1,325 39 188,314 - 391 279 281 4,062 39,719
November - 1,130 1,744 1,125 12 169,500 - 326 243 276 3,431 37,107
December - 1,015 1,651 1,024 22 149,245 - 881 222 265 3,023 35,188
Sources: VGT Ltd and Port Work Scheme
UNLOADED LOADED
TRAILERS CONTAINERS TRAILERS CONTAINERS
83
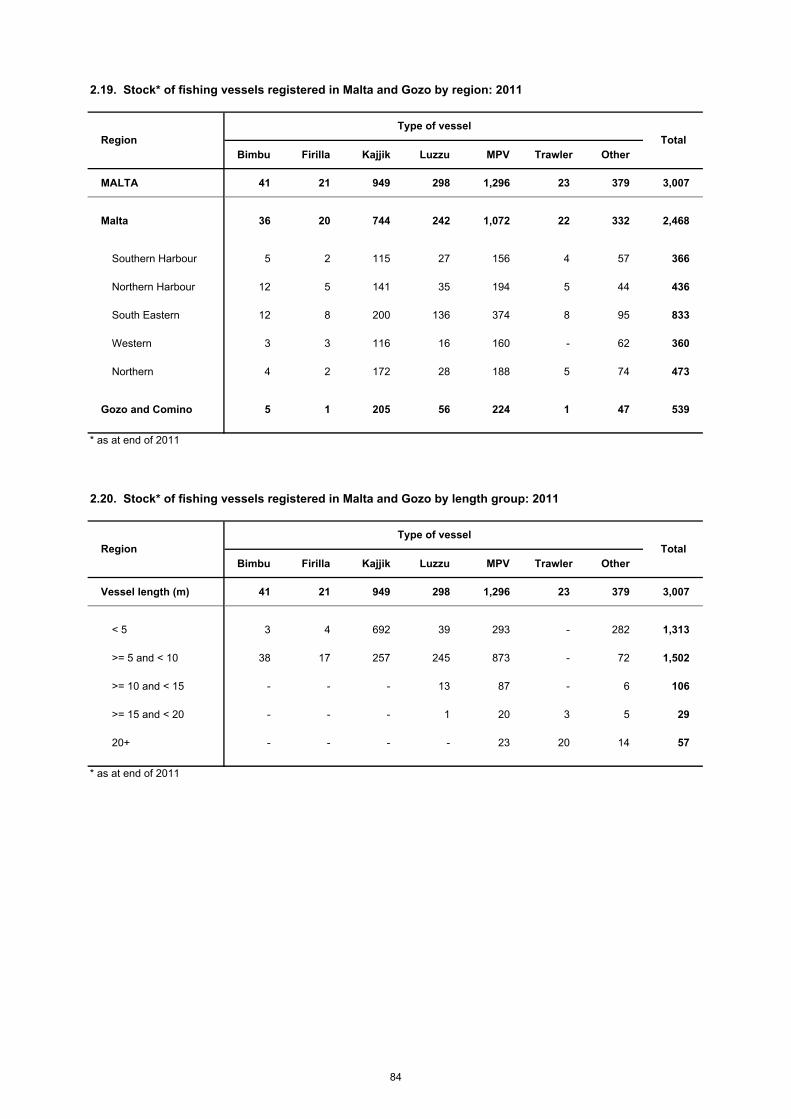
2.19. Stock* of fishing vessels registered in Malta and Gozo by region: 2011
Bimbu Firilla Kajjik Luzzu MPV Trawler Other
MALTA 41 21 949 298 1,296 23 379 3,007
Malta 36 20 744 242 1,072 22 332 2,468
Southern Harbour 5 2 115 27 156 4 57 366
Northern Harbour 12 5 141 35 194 5 44 436
South Eastern 12 8 200 136 374 8 95 833
Western 3 3 116 16 160 - 62 360
Northern 4 2 172 28 188 5 74 473
Gozo and Comino 5 1 205 56 224 1 47 539
* as at end of 2011
2.20. Stock* of fishing vessels registered in Malta and Gozo by length group: 2011
Bimbu Firilla Kajjik Luzzu MPV Trawler Other
Vessel length (m) 41 21 949 298 1,296 23 379 3,007
< 5 3 4 692 39 293 - 282 1,313
>= 5 and < 10 38 17 257 245 873 - 72 1,502
>= 10 and < 15 - - - 13 87 - 6 106
>= 15 and < 20 - - - 1 20 3 5 29
20+ - - - - 23 20 14 57
* as at end of 2011
Total
TotalRegionType of vessel
RegionType of vessel
84
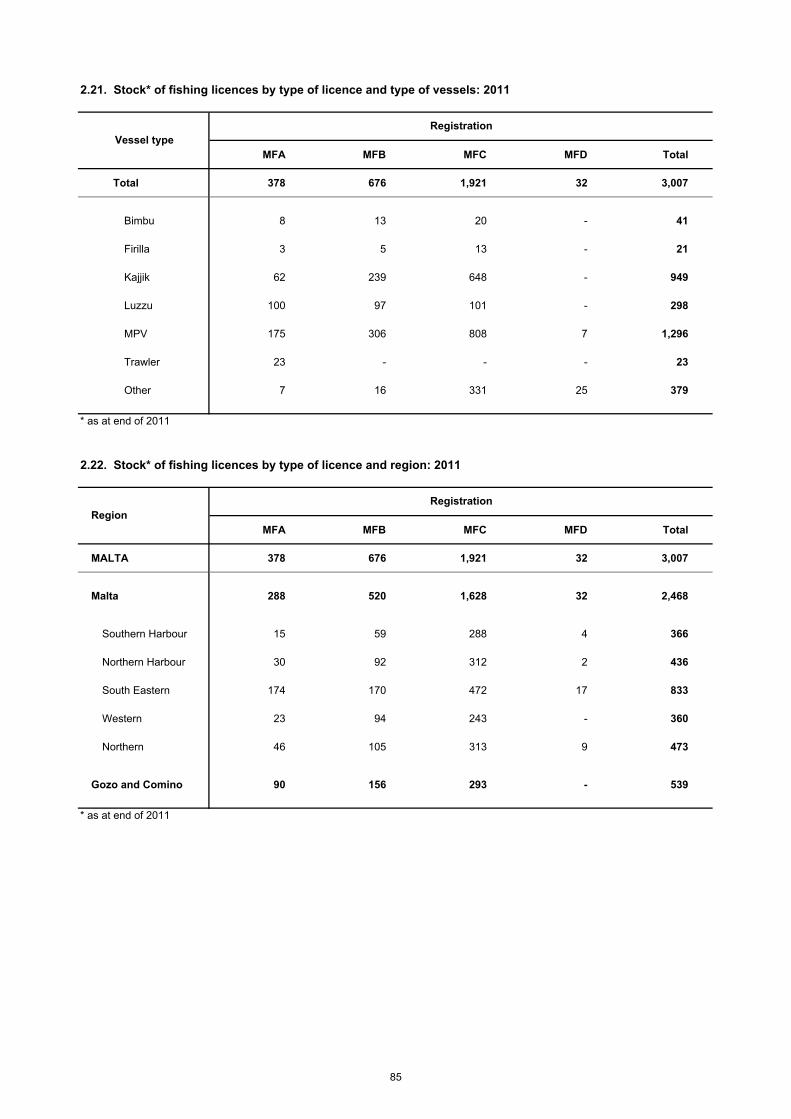
2.21. Stock* of fishing licences by type of licence and type of vessels: 2011
MFA MFB MFC MFD Total
Total 378 676 1,921 32 3,007
Bimbu 8 13 20 - 41
Firilla 3 5 13 - 21
Kajjik 62 239 648 - 949
Luzzu 100 97 101 - 298
MPV 175 306 808 7 1,296
Trawler 23 - - - 23
Other 7 16 331 25 379
* as at end of 2011
2.22. Stock* of fishing licences by type of licence and region: 2011
MFA MFB MFC MFD Total
MALTA 378 676 1,921 32 3,007
Malta 288 520 1,628 32 2,468
Southern Harbour 15 59 288 4 366
Northern Harbour 30 92 312 2 436
South Eastern 174 170 472 17 833
Western 23 94 243 - 360
Northern 46 105 313 9 473
Gozo and Comino 90 156 293 - 539
* as at end of 2011
Region
Vessel typeRegistration
Registration
85
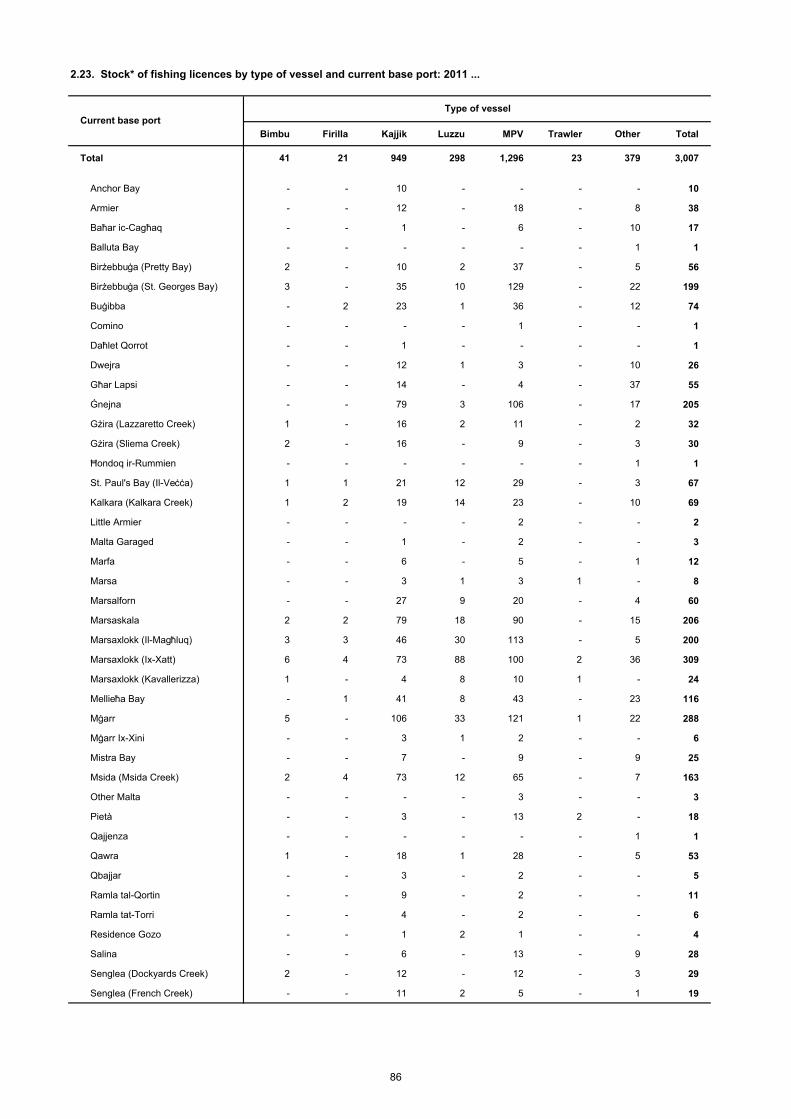
2.23. Stock* of fishing licences by type of vessel and current base port: 2011 ...
Bimbu Firilla Kajjik Luzzu MPV Trawler Other Total
Total 41 21 949 298 1,296 23 379 3,007
Anchor Bay - - 10 - - - - 10
Armier - - 12 - 18 - 8 38
Baħar ic-Cagħaq - - 1 - 6 - 10 17
Balluta Bay - - - - - - 1 1
Birżebbuġa (Pretty Bay) 2 - 10 2 37 - 5 56
Birżebbuġa (St. Georges Bay) 3 - 35 10 129 - 22 199
Buġibba - 2 23 1 36 - 12 74
Comino - - - - 1 - - 1
Daħlet Qorrot - - 1 - - - - 1
Dwejra - - 12 1 3 - 10 26
Għar Lapsi - - 14 - 4 - 37 55
Ġnejna - - 79 3 106 - 17 205
Gżira (Lazzaretto Creek) 1 - 16 2 11 - 2 32
Gżira (Sliema Creek) 2 - 16 - 9 - 3 30
Ħondoq ir-Rummien - - - - - - 1 1
St. Paul's Bay (Il-Veċċa) 1 1 21 12 29 - 3 67
Kalkara (Kalkara Creek) 1 2 19 14 23 - 10 69
Little Armier - - - - 2 - - 2
Malta Garaged - - 1 - 2 - - 3
Marfa - - 6 - 5 - 1 12
Marsa - - 3 1 3 1 - 8
Marsalforn - - 27 9 20 - 4 60
Marsaskala 2 2 79 18 90 - 15 206
Marsaxlokk (Il-Magħluq) 3 3 46 30 113 - 5 200
Marsaxlokk (Ix-Xatt) 6 4 73 88 100 2 36 309
Marsaxlokk (Kavallerizza) 1 - 4 8 10 1 - 24
Mellieħa Bay - 1 41 8 43 - 23 116
Mġarr 5 - 106 33 121 1 22 288
Mġarr Ix-Xini - - 3 1 2 - - 6
Mistra Bay - - 7 - 9 - 9 25
Msida (Msida Creek) 2 4 73 12 65 - 7 163
Other Malta - - - - 3 - - 3
Pietà - - 3 - 13 2 - 18
Qajjenza - - - - - - 1 1
Qawra 1 - 18 1 28 - 5 53
Qbajjar - - 3 - 2 - - 5
Ramla tal-Qortin - - 9 - 2 - - 11
Ramla tat-Torri - - 4 - 2 - - 6
Residence Gozo - - 1 2 1 - - 4
Salina - - 6 - 13 - 9 28
Senglea (Dockyards Creek) 2 - 12 - 12 - 3 29
Senglea (French Creek) - - 11 2 5 - 1 19
Current base portType of vessel
86
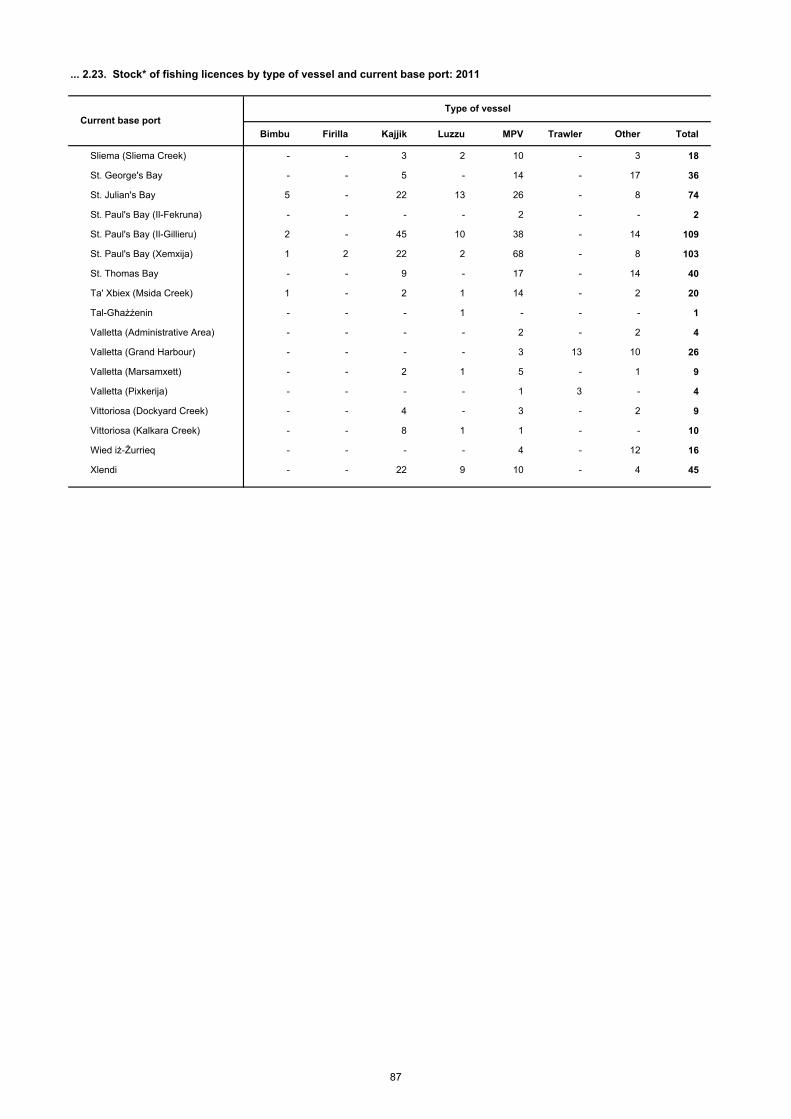
... 2.23. Stock* of fishing licences by type of vessel and current base port: 2011
Bimbu Firilla Kajjik Luzzu MPV Trawler Other Total
Sliema (Sliema Creek) - - 3 2 10 - 3 18
St. George's Bay - - 5 - 14 - 17 36
St. Julian's Bay 5 - 22 13 26 - 8 74
St. Paul's Bay (Il-Fekruna) - - - - 2 - - 2
St. Paul's Bay (Il-Gillieru) 2 - 45 10 38 - 14 109
St. Paul's Bay (Xemxija) 1 2 22 2 68 - 8 103
St. Thomas Bay - - 9 - 17 - 14 40
Ta' Xbiex (Msida Creek) 1 - 2 1 14 - 2 20
Tal-Għażżenin - - - 1 - - - 1
Valletta (Administrative Area) - - - - 2 - 2 4
Valletta (Grand Harbour) - - - - 3 13 10 26
Valletta (Marsamxett) - - 2 1 5 - 1 9
Valletta (Pixkerija) - - - - 1 3 - 4
Vittoriosa (Dockyard Creek) - - 4 - 3 - 2 9
Vittoriosa (Kalkara Creek) - - 8 1 1 - - 10
Wied iż-Żurrieq - - - - 4 - 12 16
Xlendi - - 22 9 10 - 4 45
Current base portType of vessel
87
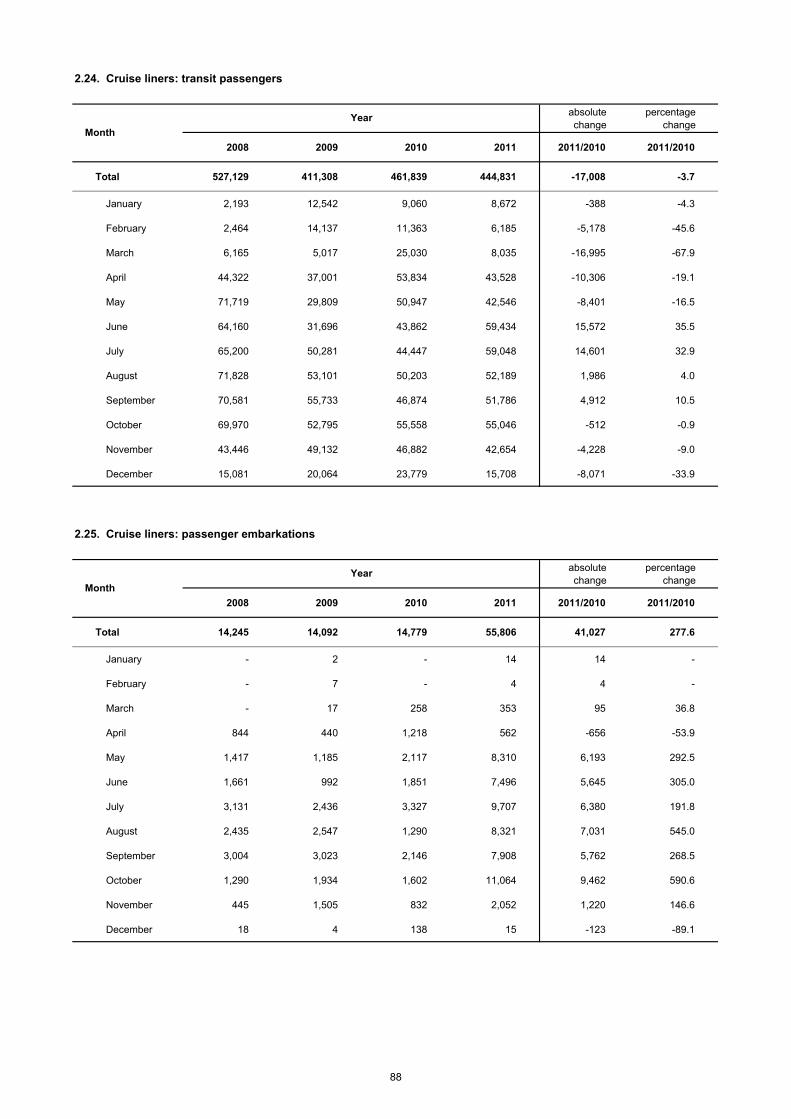
absolute change
percentage change
2008 2009 2010 2011 2011/2010 2011/2010
Total 527,129 411,308 461,839 444,831 -17,008 -3.7
January 2,193 12,542 9,060 8,672 -388 -4.3
February 2,464 14,137 11,363 6,185 -5,178 -45.6
March 6,165 5,017 25,030 8,035 -16,995 -67.9
April 44,322 37,001 53,834 43,528 -10,306 -19.1
May 71,719 29,809 50,947 42,546 -8,401 -16.5
June 64,160 31,696 43,862 59,434 15,572 35.5
July 65,200 50,281 44,447 59,048 14,601 32.9
August 71,828 53,101 50,203 52,189 1,986 4.0
September 70,581 55,733 46,874 51,786 4,912 10.5
October 69,970 52,795 55,558 55,046 -512 -0.9
November 43,446 49,132 46,882 42,654 -4,228 -9.0
December 15,081 20,064 23,779 15,708 -8,071 -33.9
absolute change
percentage change
2008 2009 2010 2011 2011/2010 2011/2010
Total 14,245 14,092 14,779 55,806 41,027 277.6
January - 2 - 14 14 -
February - 7 - 4 4 -
March - 17 258 353 95 36.8
April 844 440 1,218 562 -656 -53.9
May 1,417 1,185 2,117 8,310 6,193 292.5
June 1,661 992 1,851 7,496 5,645 305.0
July 3,131 2,436 3,327 9,707 6,380 191.8
August 2,435 2,547 1,290 8,321 7,031 545.0
September 3,004 3,023 2,146 7,908 5,762 268.5
October 1,290 1,934 1,602 11,064 9,462 590.6
November 445 1,505 832 2,052 1,220 146.6
December 18 4 138 15 -123 -89.1
Year
Year
2.24. Cruise liners: transit passengers
2.25. Cruise liners: passenger embarkations
Month
Month
88
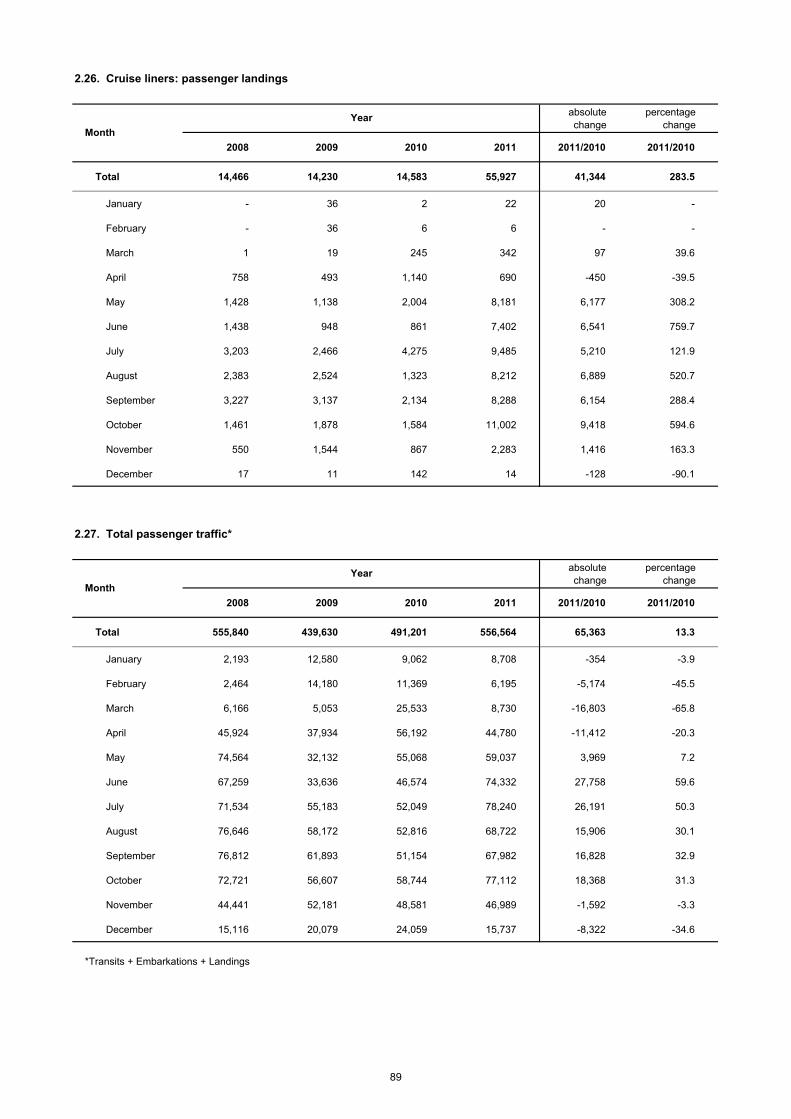
absolute change
percentage change
2008 2009 2010 2011 2011/2010 2011/2010
Total 14,466 14,230 14,583 55,927 41,344 283.5
January - 36 2 22 20 -
February - 36 6 6 - -
March 1 19 245 342 97 39.6
April 758 493 1,140 690 -450 -39.5
May 1,428 1,138 2,004 8,181 6,177 308.2
June 1,438 948 861 7,402 6,541 759.7
July 3,203 2,466 4,275 9,485 5,210 121.9
August 2,383 2,524 1,323 8,212 6,889 520.7
September 3,227 3,137 2,134 8,288 6,154 288.4
October 1,461 1,878 1,584 11,002 9,418 594.6
November 550 1,544 867 2,283 1,416 163.3
December 17 11 142 14 -128 -90.1
absolute change
percentage change
2008 2009 2010 2011 2011/2010 2011/2010
Total 555,840 439,630 491,201 556,564 65,363 13.3
January 2,193 12,580 9,062 8,708 -354 -3.9
February 2,464 14,180 11,369 6,195 -5,174 -45.5
March 6,166 5,053 25,533 8,730 -16,803 -65.8
April 45,924 37,934 56,192 44,780 -11,412 -20.3
May 74,564 32,132 55,068 59,037 3,969 7.2
June 67,259 33,636 46,574 74,332 27,758 59.6
July 71,534 55,183 52,049 78,240 26,191 50.3
August 76,646 58,172 52,816 68,722 15,906 30.1
September 76,812 61,893 51,154 67,982 16,828 32.9
October 72,721 56,607 58,744 77,112 18,368 31.3
November 44,441 52,181 48,581 46,989 -1,592 -3.3
December 15,116 20,079 24,059 15,737 -8,322 -34.6
*Transits + Embarkations + Landings
Month
Year
Year
2.26. Cruise liners: passenger landings
2.27. Total passenger traffic*
Month
89
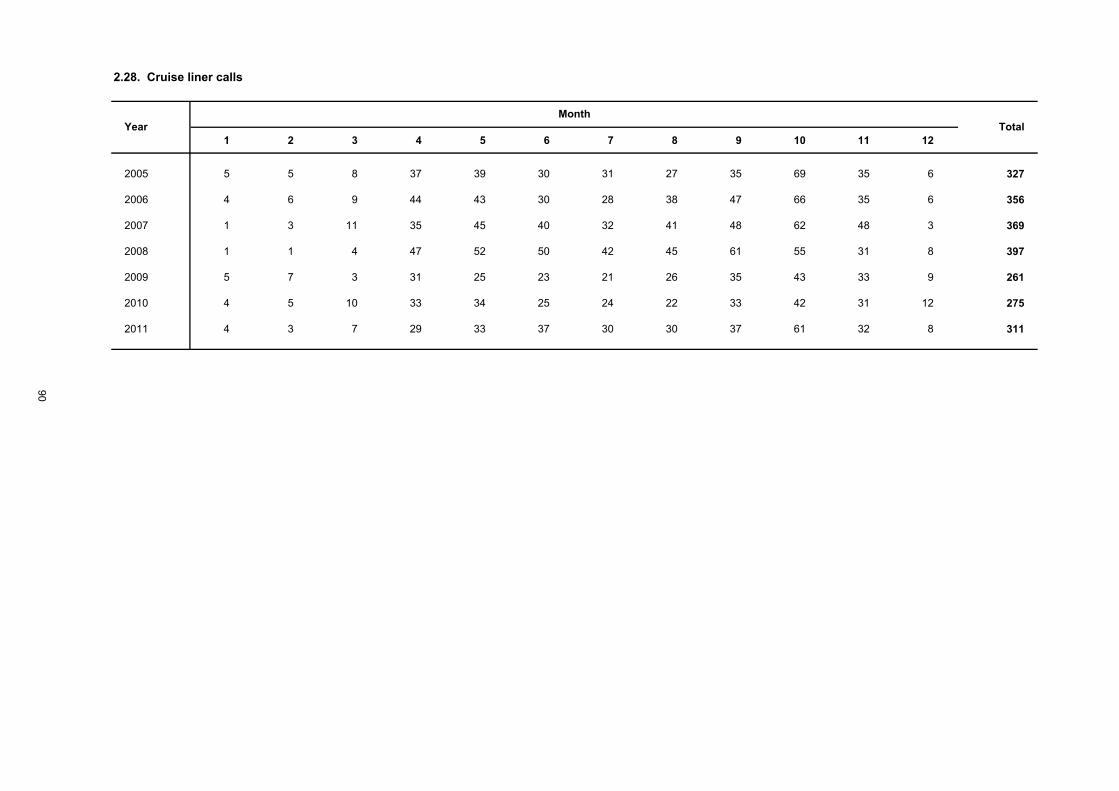
1 2 3 4 5 6 7 8 9 10 11 12
2005 5 5 8 37 39 30 31 27 35 69 35 6 327
2006 4 6 9 44 43 30 28 38 47 66 35 6 356
2007 1 3 11 35 45 40 32 41 48 62 48 3 369
2008 1 1 4 47 52 50 42 45 61 55 31 8 397
2009 5 7 3 31 25 23 21 26 35 43 33 9 261
2010 4 5 10 33 34 25 24 22 33 42 31 12 275
2011 4 3 7 29 33 37 30 30 37 61 32 8 311
2.28. Cruise liner calls
YearMonth
Total
90
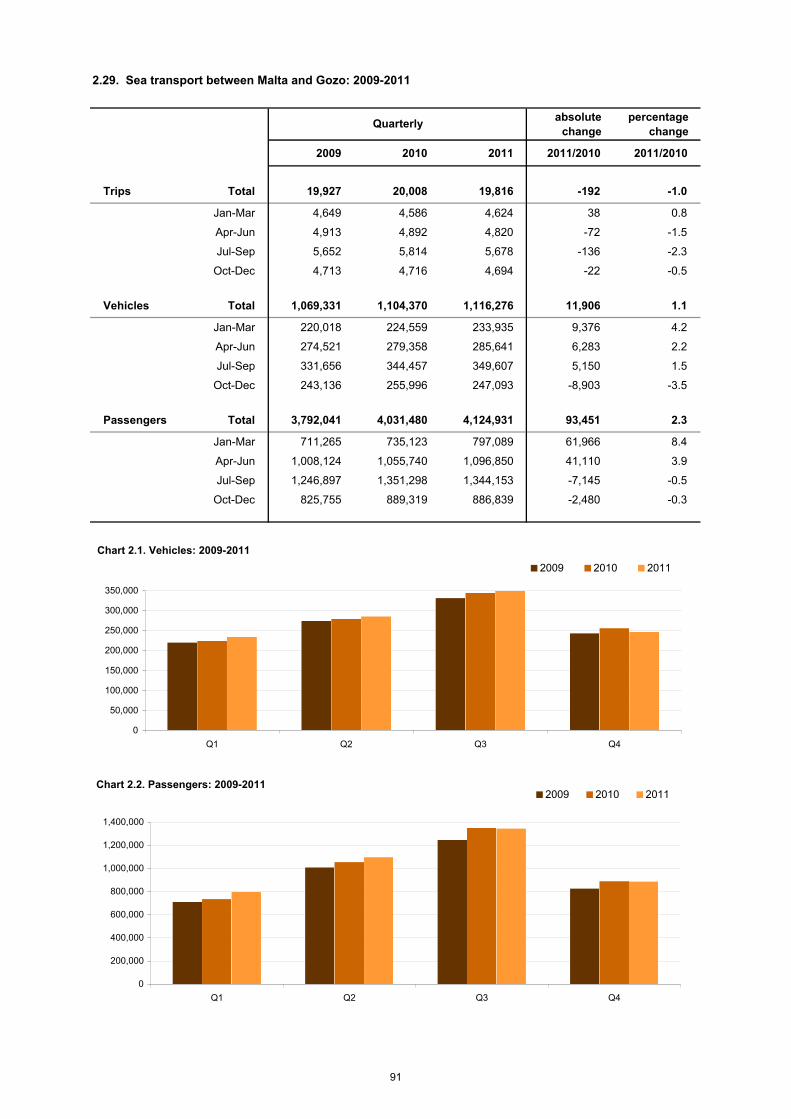
absolute change
percentage change
2009 2010 2011 2011/2010 2011/2010
Trips Total 19,927 20,008 19,816 -192 -1.0
Jan-Mar 4,649 4,586 4,624 38 0.8
Apr-Jun 4,913 4,892 4,820 -72 -1.5
Jul-Sep 5,652 5,814 5,678 -136 -2.3
Oct-Dec 4,713 4,716 4,694 -22 -0.5
Vehicles Total 1,069,331 1,104,370 1,116,276 11,906 1.1
Jan-Mar 220,018 224,559 233,935 9,376 4.2
Apr-Jun 274,521 279,358 285,641 6,283 2.2
Jul-Sep 331,656 344,457 349,607 5,150 1.5
Oct-Dec 243,136 255,996 247,093 -8,903 -3.5
Passengers Total 3,792,041 4,031,480 4,124,931 93,451 2.3
Jan-Mar 711,265 735,123 797,089 61,966 8.4
Apr-Jun 1,008,124 1,055,740 1,096,850 41,110 3.9
Jul-Sep 1,246,897 1,351,298 1,344,153 -7,145 -0.5
Oct-Dec 825,755 889,319 886,839 -2,480 -0.3
Quarterly
2.29. Sea transport between Malta and Gozo: 2009-2011
Chart 2.1. Vehicles: 2009-2011
0
50,000
100,000
150,000
200,000
250,000
300,000
350,000
Q1 Q2 Q3 Q4
2009 2010 2011
Chart 2.2. Passengers: 2009-2011
0
200,000
400,000
600,000
800,000
1,000,000
1,200,000
1,400,000
Q1 Q2 Q3 Q4
2009 2010 2011
91
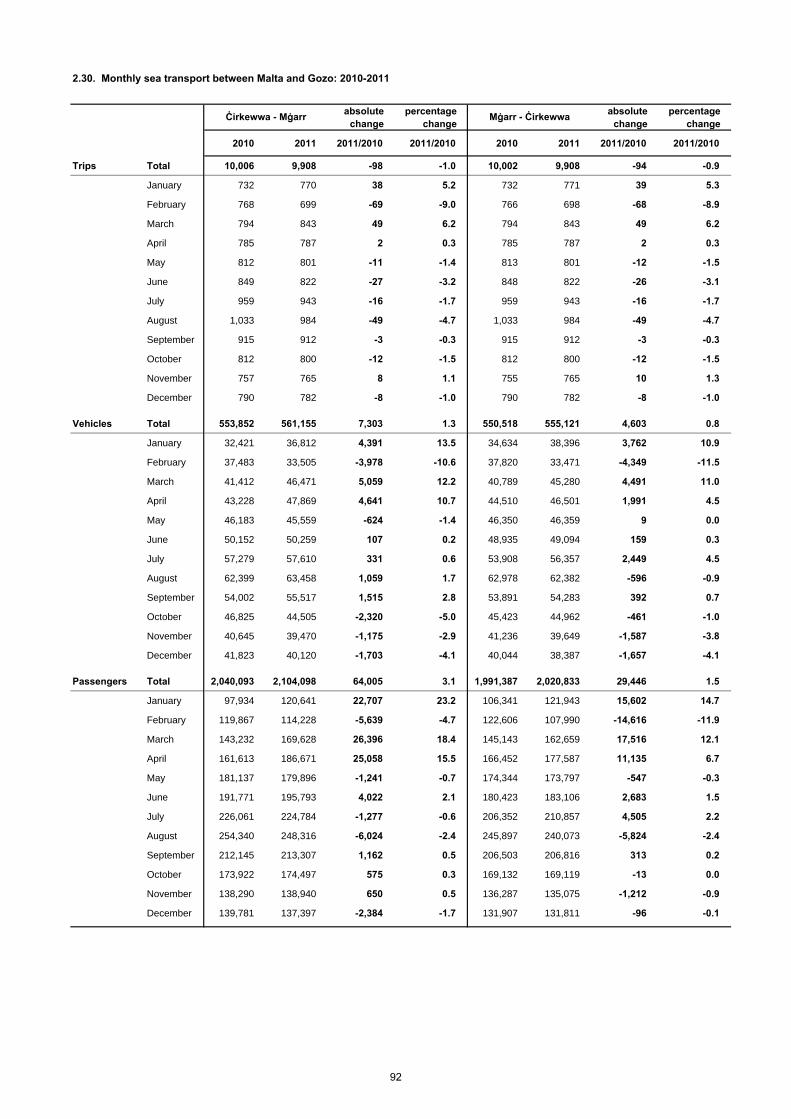
absolute change
percentage change
absolute change
percentage change
2010 2011 2011/2010 2011/2010 2010 2011 2011/2010 2011/2010
Trips Total 10,006 9,908 -98 -1.0 10,002 9,908 -94 -0.9
January 732 770 38 5.2 732 771 39 5.3
February 768 699 -69 -9.0 766 698 -68 -8.9
March 794 843 49 6.2 794 843 49 6.2
April 785 787 2 0.3 785 787 2 0.3
May 812 801 -11 -1.4 813 801 -12 -1.5
June 849 822 -27 -3.2 848 822 -26 -3.1
July 959 943 -16 -1.7 959 943 -16 -1.7
August 1,033 984 -49 -4.7 1,033 984 -49 -4.7
September 915 912 -3 -0.3 915 912 -3 -0.3
October 812 800 -12 -1.5 812 800 -12 -1.5
November 757 765 8 1.1 755 765 10 1.3
December 790 782 -8 -1.0 790 782 -8 -1.0
Vehicles Total 553,852 561,155 7,303 1.3 550,518 555,121 4,603 0.8
January 32,421 36,812 4,391 13.5 34,634 38,396 3,762 10.9
February 37,483 33,505 -3,978 -10.6 37,820 33,471 -4,349 -11.5
March 41,412 46,471 5,059 12.2 40,789 45,280 4,491 11.0
April 43,228 47,869 4,641 10.7 44,510 46,501 1,991 4.5
May 46,183 45,559 -624 -1.4 46,350 46,359 9 0.0
June 50,152 50,259 107 0.2 48,935 49,094 159 0.3
July 57,279 57,610 331 0.6 53,908 56,357 2,449 4.5
August 62,399 63,458 1,059 1.7 62,978 62,382 -596 -0.9
September 54,002 55,517 1,515 2.8 53,891 54,283 392 0.7
October 46,825 44,505 -2,320 -5.0 45,423 44,962 -461 -1.0
November 40,645 39,470 -1,175 -2.9 41,236 39,649 -1,587 -3.8
December 41,823 40,120 -1,703 -4.1 40,044 38,387 -1,657 -4.1
Passengers Total 2,040,093 2,104,098 64,005 3.1 1,991,387 2,020,833 29,446 1.5
January 97,934 120,641 22,707 23.2 106,341 121,943 15,602 14.7
February 119,867 114,228 -5,639 -4.7 122,606 107,990 -14,616 -11.9
March 143,232 169,628 26,396 18.4 145,143 162,659 17,516 12.1
April 161,613 186,671 25,058 15.5 166,452 177,587 11,135 6.7
May 181,137 179,896 -1,241 -0.7 174,344 173,797 -547 -0.3
June 191,771 195,793 4,022 2.1 180,423 183,106 2,683 1.5
July 226,061 224,784 -1,277 -0.6 206,352 210,857 4,505 2.2
August 254,340 248,316 -6,024 -2.4 245,897 240,073 -5,824 -2.4
September 212,145 213,307 1,162 0.5 206,503 206,816 313 0.2
October 173,922 174,497 575 0.3 169,132 169,119 -13 0.0
November 138,290 138,940 650 0.5 136,287 135,075 -1,212 -0.9
December 139,781 137,397 -2,384 -1.7 131,907 131,811 -96 -0.1
Ċirkewwa - Mġarr
2.30. Monthly sea transport between Malta and Gozo: 2010-2011
Mġarr - Ċirkewwa
92
ROAD TRANSPORT

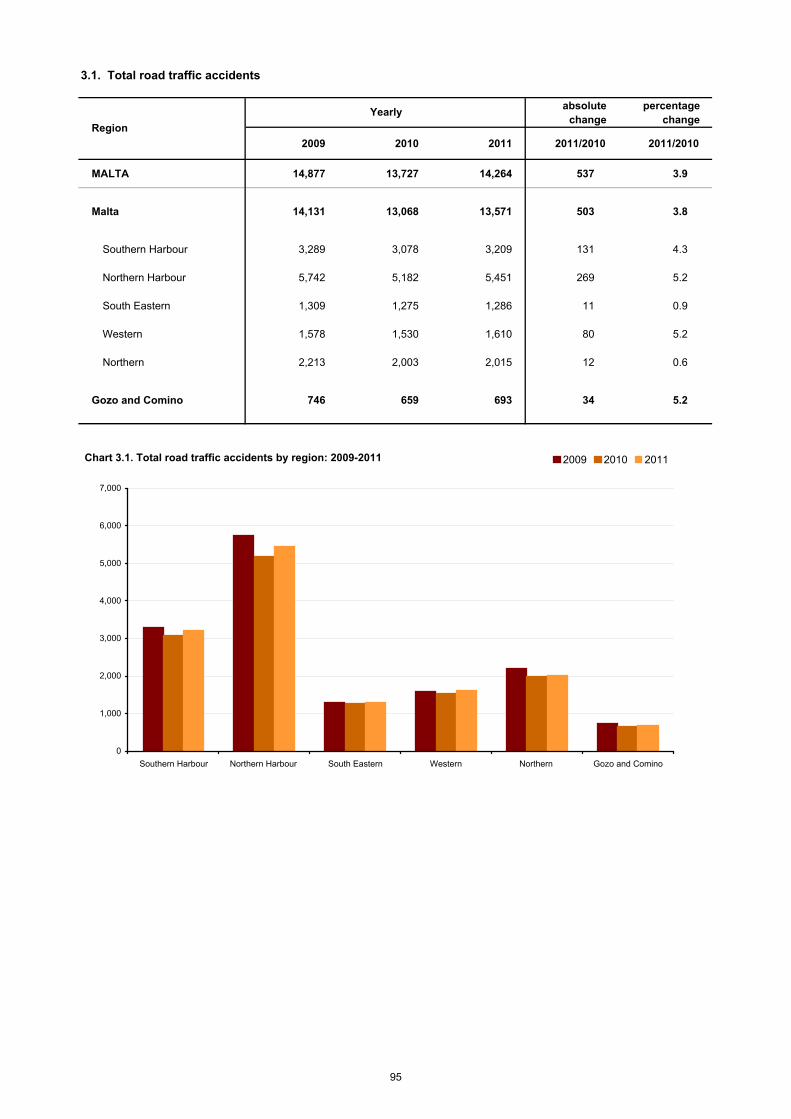
absolute change
percentage change
2009 2010 2011 2011/2010 2011/2010
MALTA 14,877 13,727 14,264 537 3.9
Malta 14,131 13,068 13,571 503 3.8
Southern Harbour 3,289 3,078 3,209 131 4.3
Northern Harbour 5,742 5,182 5,451 269 5.2
South Eastern 1,309 1,275 1,286 11 0.9
Western 1,578 1,530 1,610 80 5.2
Northern 2,213 2,003 2,015 12 0.6
Gozo and Comino 746 659 693 34 5.2
3.1. Total road traffic accidents
Region
Yearly
Chart 3.1. Total road traffic accidents by region: 2009-2011
0
1,000
2,000
3,000
4,000
5,000
6,000
7,000
Southern Harbour Northern Harbour South Eastern Western Northern Gozo and Comino
2009 2010 2011
95
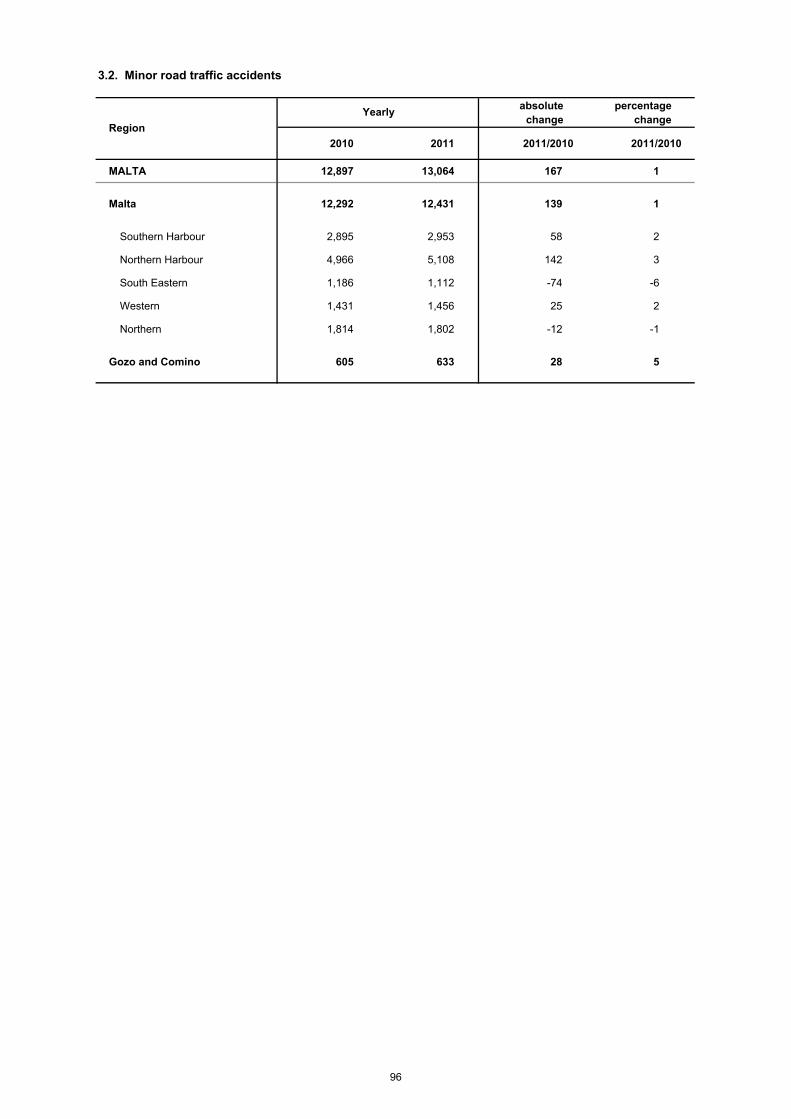
absolute change
percentage change
2010 2011 2011/2010 2011/2010
MALTA 12,897 13,064 167 1
Malta 12,292 12,431 139 1
Southern Harbour 2,895 2,953 58 2
Northern Harbour 4,966 5,108 142 3
South Eastern 1,186 1,112 -74 -6
Western 1,431 1,456 25 2
Northern 1,814 1,802 -12 -1
Gozo and Comino 605 633 28 5
3.2. Minor road traffic accidents
Region
Yearly
96
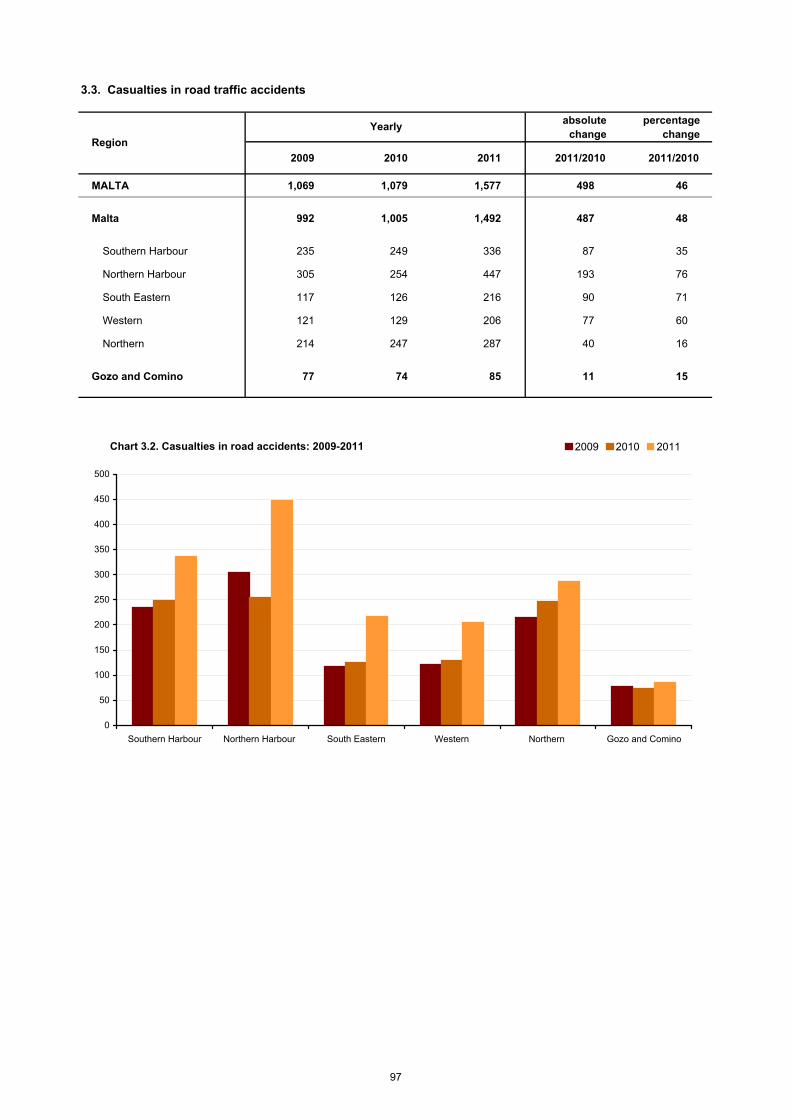
absolute change
percentage change
2009 2010 2011 2011/2010 2011/2010
MALTA 1,069 1,079 1,577 498 46
Malta 992 1,005 1,492 487 48
Southern Harbour 235 249 336 87 35
Northern Harbour 305 254 447 193 76
South Eastern 117 126 216 90 71
Western 121 129 206 77 60
Northern 214 247 287 40 16
Gozo and Comino 77 74 85 11 15
3.3. Casualties in road traffic accidents
Yearly
Region
Chart 3.2. Casualties in road accidents: 2009-2011
0
50
100
150
200
250
300
350
400
450
500
Southern Harbour Northern Harbour South Eastern Western Northern Gozo and Comino
2009 2010 2011
97
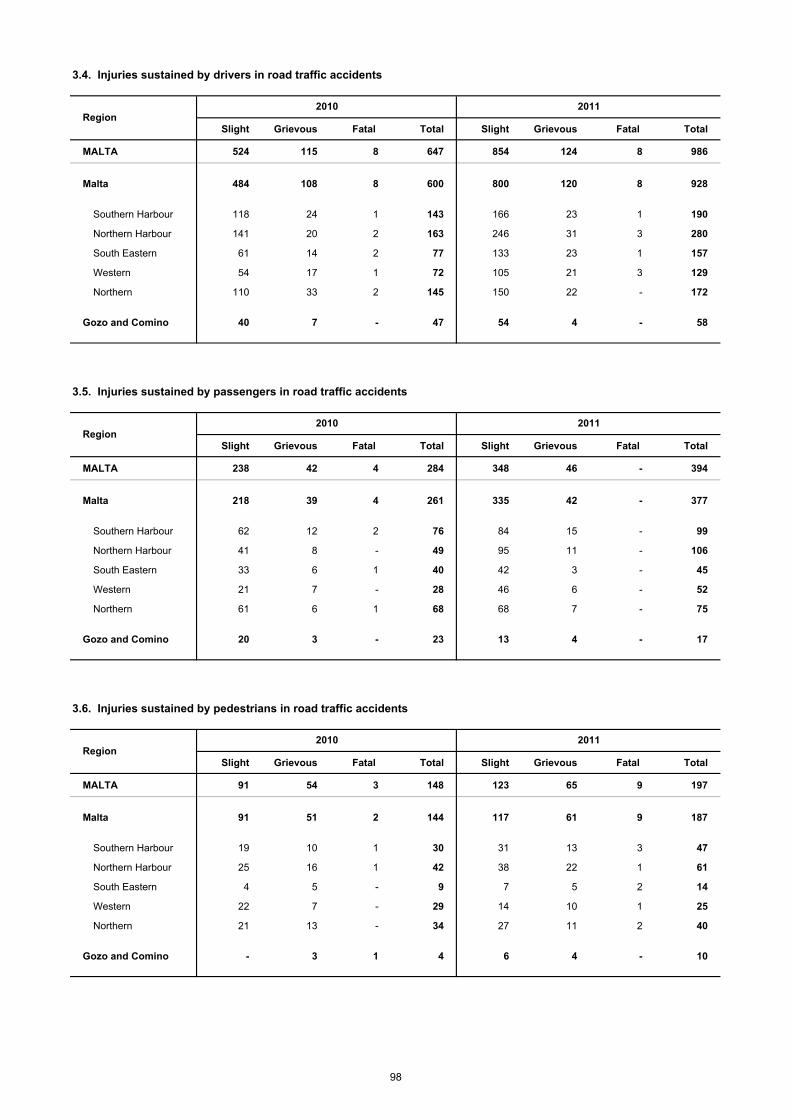
Slight Grievous Fatal Total Slight Grievous Fatal Total
MALTA 524 115 8 647 854 124 8 986
Malta 484 108 8 600 800 120 8 928
Southern Harbour 118 24 1 143 166 23 1 190
Northern Harbour 141 20 2 163 246 31 3 280
South Eastern 61 14 2 77 133 23 1 157
Western 54 17 1 72 105 21 3 129
Northern 110 33 2 145 150 22 - 172
Gozo and Comino 40 7 - 47 54 4 - 58
Slight Grievous Fatal Total Slight Grievous Fatal Total
MALTA 238 42 4 284 348 46 - 394
Malta 218 39 4 261 335 42 - 377
Southern Harbour 62 12 2 76 84 15 - 99
Northern Harbour 41 8 - 49 95 11 - 106
South Eastern 33 6 1 40 42 3 - 45
Western 21 7 - 28 46 6 - 52
Northern 61 6 1 68 68 7 - 75
Gozo and Comino 20 3 - 23 13 4 - 17
Slight Grievous Fatal Total Slight Grievous Fatal Total
MALTA 91 54 3 148 123 65 9 197
Malta 91 51 2 144 117 61 9 187
Southern Harbour 19 10 1 30 31 13 3 47
Northern Harbour 25 16 1 42 38 22 1 61
South Eastern 4 5 - 9 7 5 2 14
Western 22 7 - 29 14 10 1 25
Northern 21 13 - 34 27 11 2 40
Gozo and Comino - 3 1 4 6 4 - 10
2011
Region
Region
Region
3.4. Injuries sustained by drivers in road traffic accidents
2010 2011
3.5. Injuries sustained by passengers in road traffic accidents
2010 2011
3.6. Injuries sustained by pedestrians in road traffic accidents
2010
98
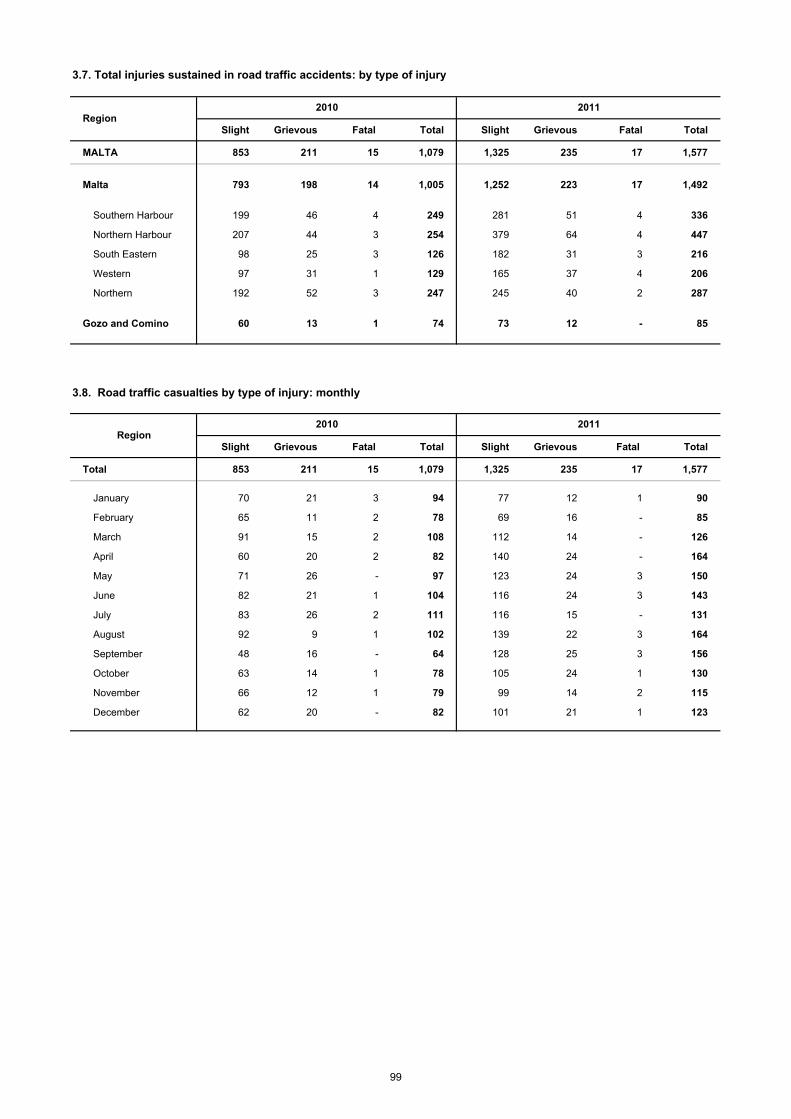
Slight Grievous Fatal Total Slight Grievous Fatal Total
MALTA 853 211 15 1,079 1,325 235 17 1,577
Malta 793 198 14 1,005 1,252 223 17 1,492
Southern Harbour 199 46 4 249 281 51 4 336
Northern Harbour 207 44 3 254 379 64 4 447
South Eastern 98 25 3 126 182 31 3 216
Western 97 31 1 129 165 37 4 206
Northern 192 52 3 247 245 40 2 287
Gozo and Comino 60 13 1 74 73 12 - 85
Slight Grievous Fatal Total Slight Grievous Fatal Total
Total 853 211 15 1,079 1,325 235 17 1,577
January 70 21 3 94 77 12 1 90
February 65 11 2 78 69 16 - 85
March 91 15 2 108 112 14 - 126
April 60 20 2 82 140 24 - 164
May 71 26 - 97 123 24 3 150
June 82 21 1 104 116 24 3 143
July 83 26 2 111 116 15 - 131
August 92 9 1 102 139 22 3 164
September 48 16 - 64 128 25 3 156
October 63 14 1 78 105 24 1 130
November 66 12 1 79 99 14 2 115
December 62 20 - 82 101 21 1 123
3.8. Road traffic casualties by type of injury: monthly
Region2010 2011
Region
3.7. Total injuries sustained in road traffic accidents: by type of injury
2010 2011
99
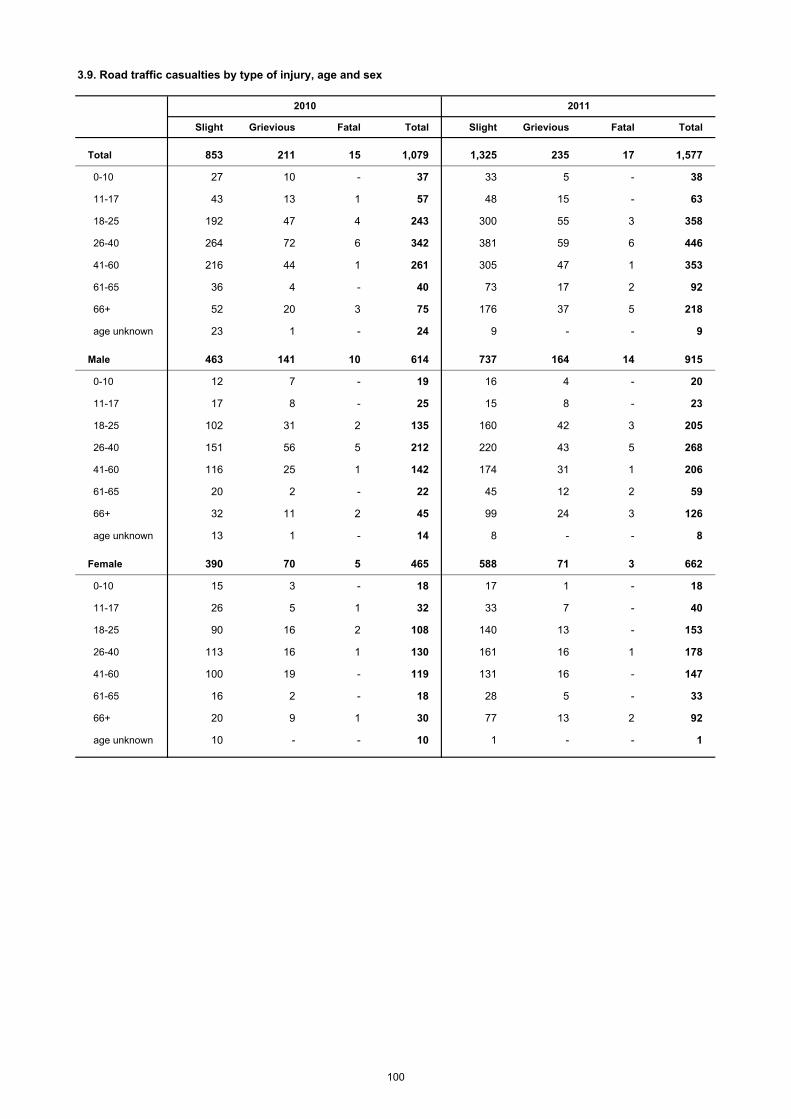
Slight Grievious Fatal Total Slight Grievious Fatal Total
Total 853 211 15 1,079 1,325 235 17 1,577
0-10 27 10 - 37 33 5 - 38
11-17 43 13 1 57 48 15 - 63
18-25 192 47 4 243 300 55 3 358
26-40 264 72 6 342 381 59 6 446
41-60 216 44 1 261 305 47 1 353
61-65 36 4 - 40 73 17 2 92
66+ 52 20 3 75 176 37 5 218
age unknown 23 1 - 24 9 - - 9
Male 463 141 10 614 737 164 14 915
0-10 12 7 - 19 16 4 - 20
11-17 17 8 - 25 15 8 - 23
18-25 102 31 2 135 160 42 3 205
26-40 151 56 5 212 220 43 5 268
41-60 116 25 1 142 174 31 1 206
61-65 20 2 - 22 45 12 2 59
66+ 32 11 2 45 99 24 3 126
age unknown 13 1 - 14 8 - - 8
Female 390 70 5 465 588 71 3 662
0-10 15 3 - 18 17 1 - 18
11-17 26 5 1 32 33 7 - 40
18-25 90 16 2 108 140 13 - 153
26-40 113 16 1 130 161 16 1 178
41-60 100 19 - 119 131 16 - 147
61-65 16 2 - 18 28 5 - 33
66+ 20 9 1 30 77 13 2 92
age unknown 10 - - 10 1 - - 1
2010 2011
3.9. Road traffic casualties by type of injury, age and sex
100
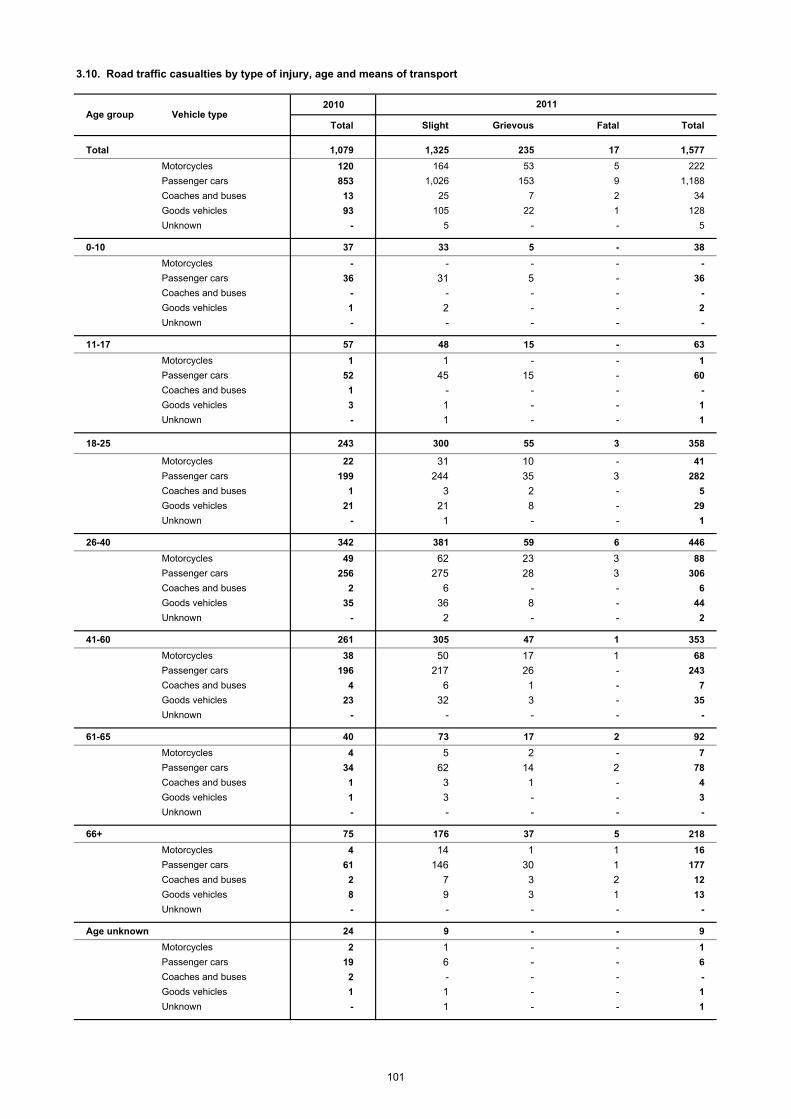
2010
Total Slight Grievous Fatal Total
Total 1,079 1,325 235 17 1,577
Motorcycles 120 164 53 5 222
Passenger cars 853 1,026 153 9 1,188
Coaches and buses 13 25 7 2 34
Goods vehicles 93 105 22 1 128
Unknown - 5 - - 5
0-10 37 33 5 - 38
Motorcycles - - - - -
Passenger cars 36 31 5 - 36
Coaches and buses - - - - -
Goods vehicles 1 2 - - 2
Unknown - - - - -
11-17 57 48 15 - 63
Motorcycles 1 1 - - 1
Passenger cars 52 45 15 - 60
Coaches and buses 1 - - - -
Goods vehicles 3 1 - - 1
Unknown - 1 - - 1
18-25 243 300 55 3 358
Motorcycles 22 31 10 - 41
Passenger cars 199 244 35 3 282
Coaches and buses 1 3 2 - 5
Goods vehicles 21 21 8 - 29
Unknown - 1 - - 1
26-40 342 381 59 6 446
Motorcycles 49 62 23 3 88
Passenger cars 256 275 28 3 306
Coaches and buses 2 6 - - 6
Goods vehicles 35 36 8 - 44
Unknown - 2 - - 2
41-60 261 305 47 1 353
Motorcycles 38 50 17 1 68
Passenger cars 196 217 26 - 243
Coaches and buses 4 6 1 - 7
Goods vehicles 23 32 3 - 35
Unknown - - - - -
61-65 40 73 17 2 92
Motorcycles 4 5 2 - 7
Passenger cars 34 62 14 2 78
Coaches and buses 1 3 1 - 4
Goods vehicles 1 3 - - 3
Unknown - - - - -
66+ 75 176 37 5 218
Motorcycles 4 14 1 1 16
Passenger cars 61 146 30 1 177
Coaches and buses 2 7 3 2 12
Goods vehicles 8 9 3 1 13
Unknown - - - - -
Age unknown 24 9 - - 9
Motorcycles 2 1 - - 1
Passenger cars 19 6 - - 6
Coaches and buses 2 - - - -
Goods vehicles 1 1 - - 1
Unknown - 1 - - 1
3.10. Road traffic casualties by type of injury, age and means of transport
2011Age group Vehicle type
101
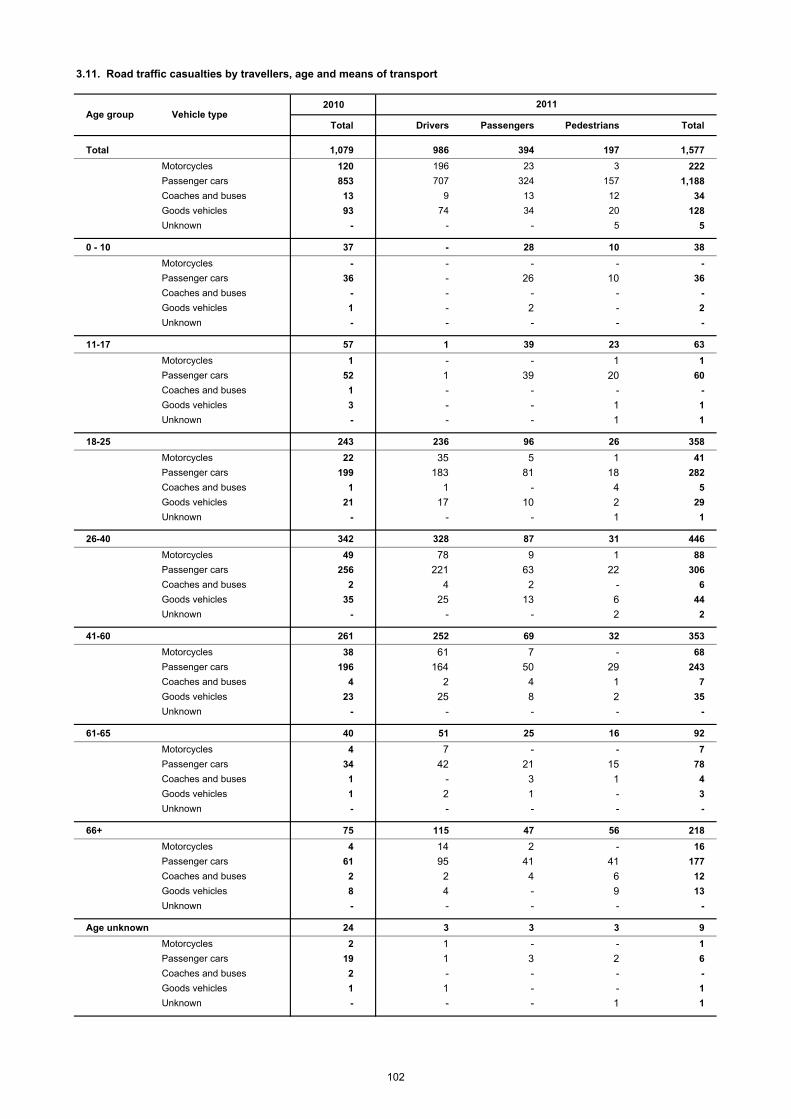
2010
Total Drivers Passengers Pedestrians Total
Total 1,079 986 394 197 1,577
Motorcycles 120 196 23 3 222
Passenger cars 853 707 324 157 1,188
Coaches and buses 13 9 13 12 34
Goods vehicles 93 74 34 20 128
Unknown - - - 5 5
0 - 10 37 - 28 10 38
Motorcycles - - - - -
Passenger cars 36 - 26 10 36
Coaches and buses - - - - -
Goods vehicles 1 - 2 - 2
Unknown - - - - -
11-17 57 1 39 23 63
Motorcycles 1 - - 1 1
Passenger cars 52 1 39 20 60
Coaches and buses 1 - - - -
Goods vehicles 3 - - 1 1
Unknown - - - 1 1
18-25 243 236 96 26 358
Motorcycles 22 35 5 1 41
Passenger cars 199 183 81 18 282
Coaches and buses 1 1 - 4 5
Goods vehicles 21 17 10 2 29
Unknown - - - 1 1
26-40 342 328 87 31 446
Motorcycles 49 78 9 1 88
Passenger cars 256 221 63 22 306
Coaches and buses 2 4 2 - 6
Goods vehicles 35 25 13 6 44
Unknown - - - 2 2
41-60 261 252 69 32 353
Motorcycles 38 61 7 - 68
Passenger cars 196 164 50 29 243
Coaches and buses 4 2 4 1 7
Goods vehicles 23 25 8 2 35
Unknown - - - - -
61-65 40 51 25 16 92
Motorcycles 4 7 - - 7
Passenger cars 34 42 21 15 78
Coaches and buses 1 - 3 1 4
Goods vehicles 1 2 1 - 3
Unknown - - - - -
66+ 75 115 47 56 218
Motorcycles 4 14 2 - 16
Passenger cars 61 95 41 41 177
Coaches and buses 2 2 4 6 12
Goods vehicles 8 4 - 9 13
Unknown - - - - -
Age unknown 24 3 3 3 9
Motorcycles 2 1 - - 1
Passenger cars 19 1 3 2 6
Coaches and buses 2 - - - -
Goods vehicles 1 1 - - 1
Unknown - - - 1 1
3.11. Road traffic casualties by travellers, age and means of transport
2011Age group Vehicle type
102
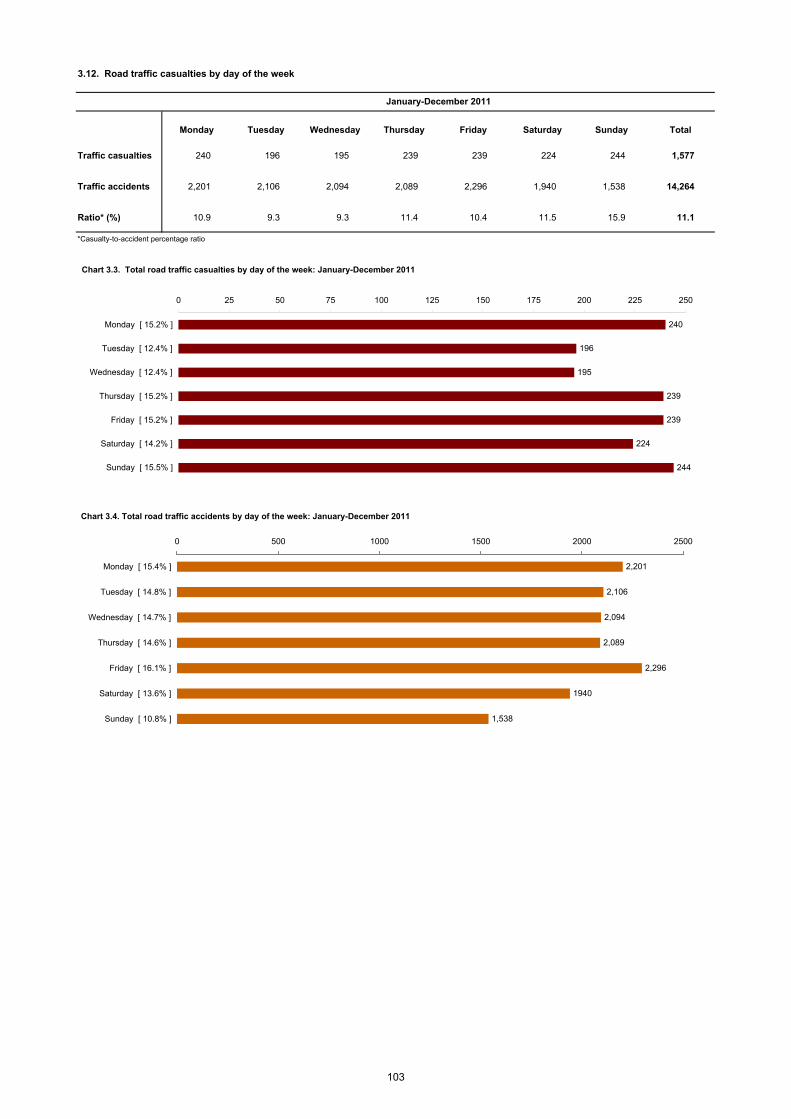
Monday Tuesday Wednesday Thursday Friday Saturday Sunday Total
Traffic casualties 240 196 195 239 239 224 244 1,577
Traffic accidents 2,201 2,106 2,094 2,089 2,296 1,940 1,538 14,264
Ratio* (%) 10.9 9.3 9.3 11.4 10.4 11.5 15.9 11.1
*Casualty-to-accident percentage ratio
3.12. Road traffic casualties by day of the week
January-December 2011
Chart 3.3. Total road traffic casualties by day of the week: January-December 2011
240
196
195
239
239
224
244
0 25 50 75 100 125 150 175 200 225 250
Monday [ 15.2% ]
Tuesday [ 12.4% ]
Wednesday [ 12.4% ]
Thursday [ 15.2% ]
Friday [ 15.2% ]
Saturday [ 14.2% ]
Sunday [ 15.5% ]
Chart 3.4. Total road traffic accidents by day of the week: January-December 2011
2,201
2,106
2,094
2,089
2,296
1940
1,538
0 500 1000 1500 2000 2500
Monday [ 15.4% ]
Tuesday [ 14.8% ]
Wednesday [ 14.7% ]
Thursday [ 14.6% ]
Friday [ 16.1% ]
Saturday [ 13.6% ]
Sunday [ 10.8% ]
103
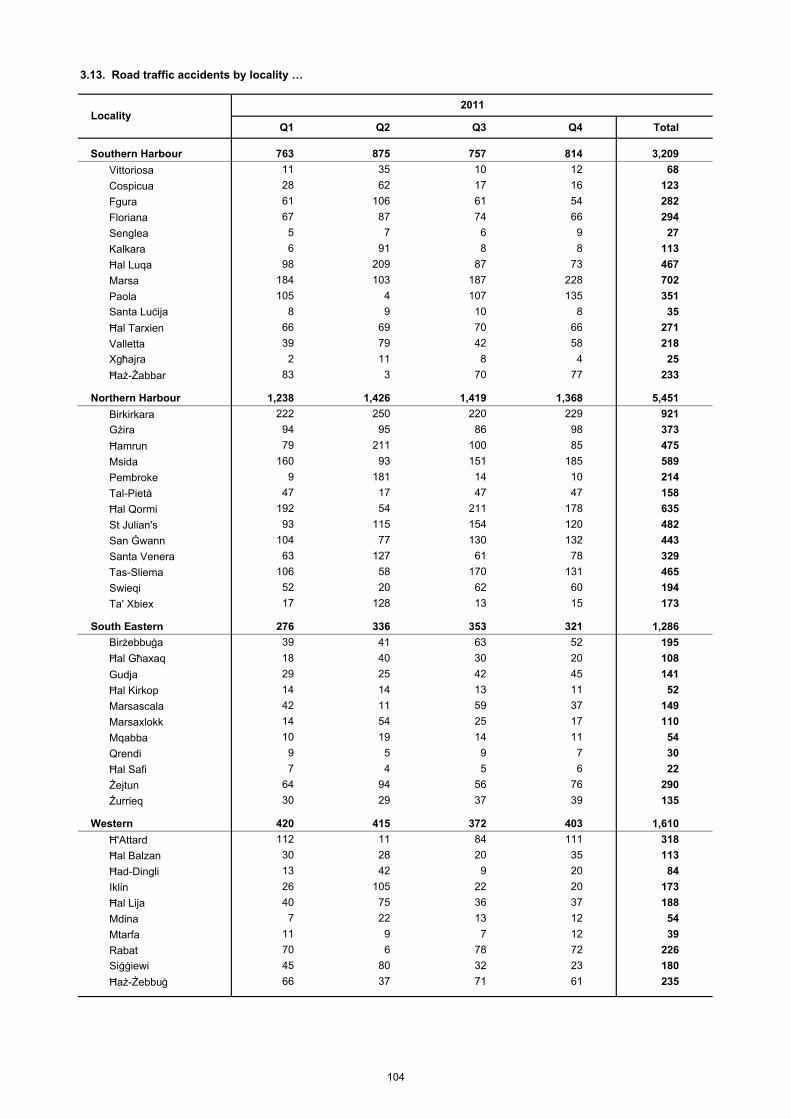
Q1 Q2 Q3 Q4 Total
Southern Harbour 763 875 757 814 3,209
Vittoriosa 11 35 10 12 68
Cospicua 28 62 17 16 123
Fgura 61 106 61 54 282
Floriana 67 87 74 66 294
Senglea 5 7 6 9 27
Kalkara 6 91 8 8 113
Ħal Luqa 98 209 87 73 467
Marsa 184 103 187 228 702
Paola 105 4 107 135 351
Santa Luċija 8 9 10 8 35
Ħal Tarxien 66 69 70 66 271
Valletta 39 79 42 58 218
Xgħajra 2 11 8 4 25
Ħaż-Żabbar 83 3 70 77 233
Northern Harbour 1,238 1,426 1,419 1,368 5,451
Birkirkara 222 250 220 229 921
Gżira 94 95 86 98 373
Ħamrun 79 211 100 85 475
Msida 160 93 151 185 589
Pembroke 9 181 14 10 214
Tal-Pietà 47 17 47 47 158
Ħal Qormi 192 54 211 178 635
St Julian's 93 115 154 120 482
San Ġwann 104 77 130 132 443
Santa Venera 63 127 61 78 329
Tas-Sliema 106 58 170 131 465
Swieqi 52 20 62 60 194
Ta' Xbiex 17 128 13 15 173
South Eastern 276 336 353 321 1,286
Birżebbuġa 39 41 63 52 195
Ħal Għaxaq 18 40 30 20 108
Gudja 29 25 42 45 141
Ħal Kirkop 14 14 13 11 52
Marsascala 42 11 59 37 149
Marsaxlokk 14 54 25 17 110
Mqabba 10 19 14 11 54
Qrendi 9 5 9 7 30
Ħal Safi 7 4 5 6 22
Żejtun 64 94 56 76 290
Żurrieq 30 29 37 39 135
Western 420 415 372 403 1,610
Ħ'Attard 112 11 84 111 318
Ħal Balzan 30 28 20 35 113
Ħad-Dingli 13 42 9 20 84
Iklin 26 105 22 20 173
Ħal Lija 40 75 36 37 188
Mdina 7 22 13 12 54
Mtarfa 11 9 7 12 39
Rabat 70 6 78 72 226
Siġġiewi 45 80 32 23 180
Ħaż-Żebbuġ 66 37 71 61 235
Locality
3.13. Road traffic accidents by locality …
2011
104
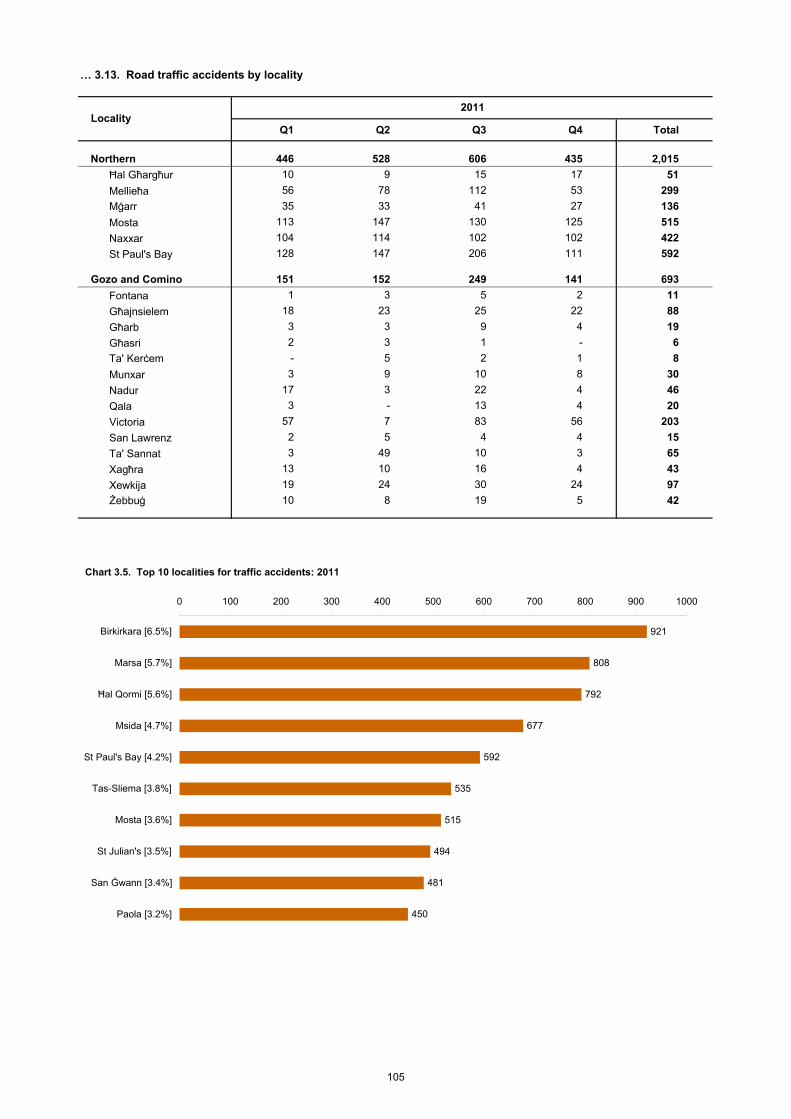
Q1 Q2 Q3 Q4 Total
Northern 446 528 606 435 2,015
Ħal Għargħur 10 9 15 17 51
Mellieħa 56 78 112 53 299
Mġarr 35 33 41 27 136
Mosta 113 147 130 125 515
Naxxar 104 114 102 102 422
St Paul's Bay 128 147 206 111 592
Gozo and Comino 151 152 249 141 693
Fontana 1 3 5 2 11
Għajnsielem 18 23 25 22 88
Għarb 3 3 9 4 19
Għasri 2 3 1 - 6
Ta' Kerċem - 5 2 1 8
Munxar 3 9 10 8 30
Nadur 17 3 22 4 46
Qala 3 - 13 4 20
Victoria 57 7 83 56 203
San Lawrenz 2 5 4 4 15
Ta' Sannat 3 49 10 3 65
Xagħra 13 10 16 4 43
Xewkija 19 24 30 24 97
Żebbuġ 10 8 19 5 42
Locality2011
… 3.13. Road traffic accidents by locality
921
808
792
677
592
535
515
494
481
450
0 100 200 300 400 500 600 700 800 900 1000
Birkirkara [6.5%]
Marsa [5.7%]
Ħal Qormi [5.6%]
Msida [4.7%]
St Paul's Bay [4.2%]
Tas-Sliema [3.8%]
Mosta [3.6%]
St Julian's [3.5%]
San Ġwann [3.4%]
Paola [3.2%]
Chart 3.5. Top 10 localities for traffic accidents: 2011
105
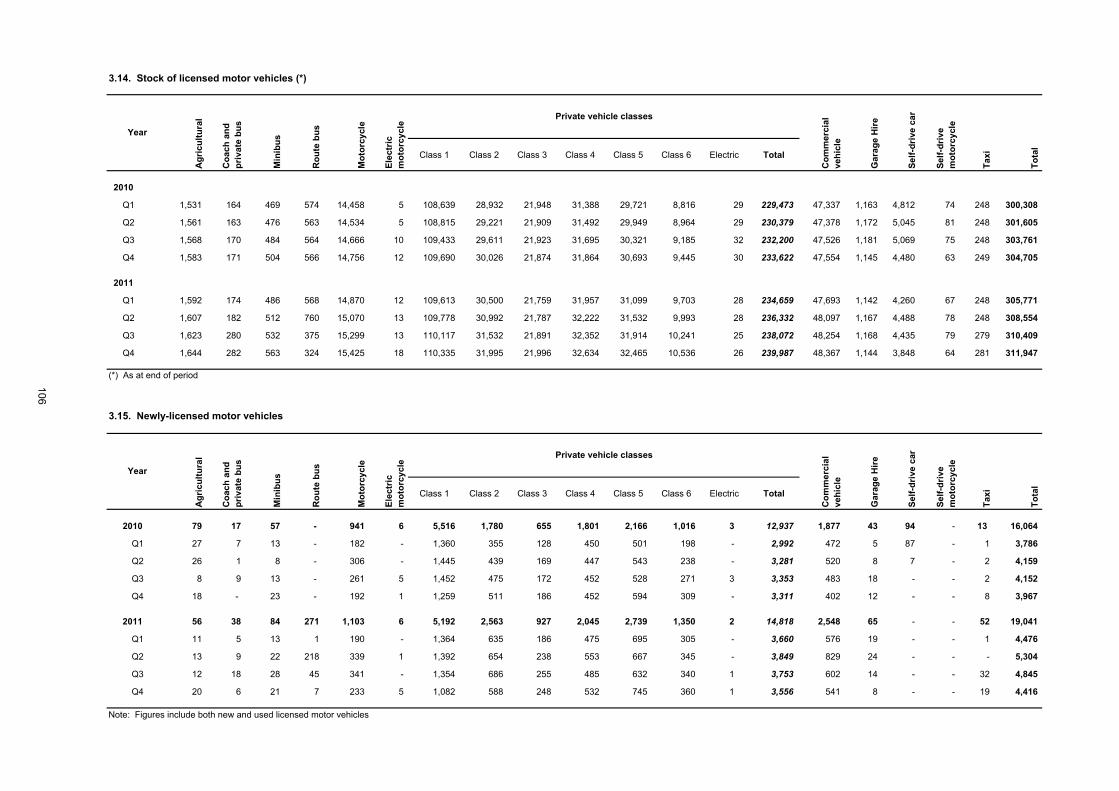
Class 1 Class 2 Class 3 Class 4 Class 5 Class 6 Electric Total
2010
Q1 1,531 164 469 574 14,458 5 108,639 28,932 21,948 31,388 29,721 8,816 29 229,473 47,337 1,163 4,812 74 248 300,308
Q2 1,561 163 476 563 14,534 5 108,815 29,221 21,909 31,492 29,949 8,964 29 230,379 47,378 1,172 5,045 81 248 301,605
Q3 1,568 170 484 564 14,666 10 109,433 29,611 21,923 31,695 30,321 9,185 32 232,200 47,526 1,181 5,069 75 248 303,761
Q4 1,583 171 504 566 14,756 12 109,690 30,026 21,874 31,864 30,693 9,445 30 233,622 47,554 1,145 4,480 63 249 304,705
2011
Q1 1,592 174 486 568 14,870 12 109,613 30,500 21,759 31,957 31,099 9,703 28 234,659 47,693 1,142 4,260 67 248 305,771
Q2 1,607 182 512 760 15,070 13 109,778 30,992 21,787 32,222 31,532 9,993 28 236,332 48,097 1,167 4,488 78 248 308,554
Q3 1,623 280 532 375 15,299 13 110,117 31,532 21,891 32,352 31,914 10,241 25 238,072 48,254 1,168 4,435 79 279 310,409
Q4 1,644 282 563 324 15,425 18 110,335 31,995 21,996 32,634 32,465 10,536 26 239,987 48,367 1,144 3,848 64 281 311,947
(*) As at end of period
Class 1 Class 2 Class 3 Class 4 Class 5 Class 6 Electric Total
2010 79 17 57 - 941 6 5,516 1,780 655 1,801 2,166 1,016 3 12,937 1,877 43 94 - 13 16,064
Q1 27 7 13 - 182 - 1,360 355 128 450 501 198 - 2,992 472 5 87 - 1 3,786
Q2 26 1 8 - 306 - 1,445 439 169 447 543 238 - 3,281 520 8 7 - 2 4,159
Q3 8 9 13 - 261 5 1,452 475 172 452 528 271 3 3,353 483 18 - - 2 4,152
Q4 18 - 23 - 192 1 1,259 511 186 452 594 309 - 3,311 402 12 - - 8 3,967
2011 56 38 84 271 1,103 6 5,192 2,563 927 2,045 2,739 1,350 2 14,818 2,548 65 - - 52 19,041
Q1 11 5 13 1 190 - 1,364 635 186 475 695 305 - 3,660 576 19 - - 1 4,476
Q2 13 9 22 218 339 1 1,392 654 238 553 667 345 - 3,849 829 24 - - - 5,304
Q3 12 18 28 45 341 - 1,354 686 255 485 632 340 1 3,753 602 14 - - 32 4,845
Q4 20 6 21 7 233 5 1,082 588 248 532 745 360 1 3,556 541 8 - - 19 4,416
Note: Figures include both new and used licensed motor vehicles
Co
mm
erci
al
veh
icle
3.15. Newly-licensed motor vehicles
To
tal
Sel
f-d
rive
car
Sel
f-d
rive
m
oto
rcyc
le
Tax
i
Year
Ag
ricu
ltu
ral
Co
ach
an
d
pri
vate
bu
s
Gar
age
Hir
ePrivate vehicle classes
Min
ibu
s
Ro
ute
bu
s
Mo
torc
ycle
Ele
ctri
c m
oto
rcyc
le
Ag
ricu
ltu
ral
Co
ach
an
d
pri
vate
bu
s
Gar
age
Hir
ePrivate vehicle classes
Co
mm
erci
al
veh
icle
3.14. Stock of licensed motor vehicles (*)
Min
ibu
s
Ro
ute
bu
s
Mo
torc
ycle
Ele
ctri
c m
oto
rcyc
le
To
tal
Sel
f-d
rive
car
Sel
f-d
rive
m
oto
rcyc
le
Tax
i
Year
106
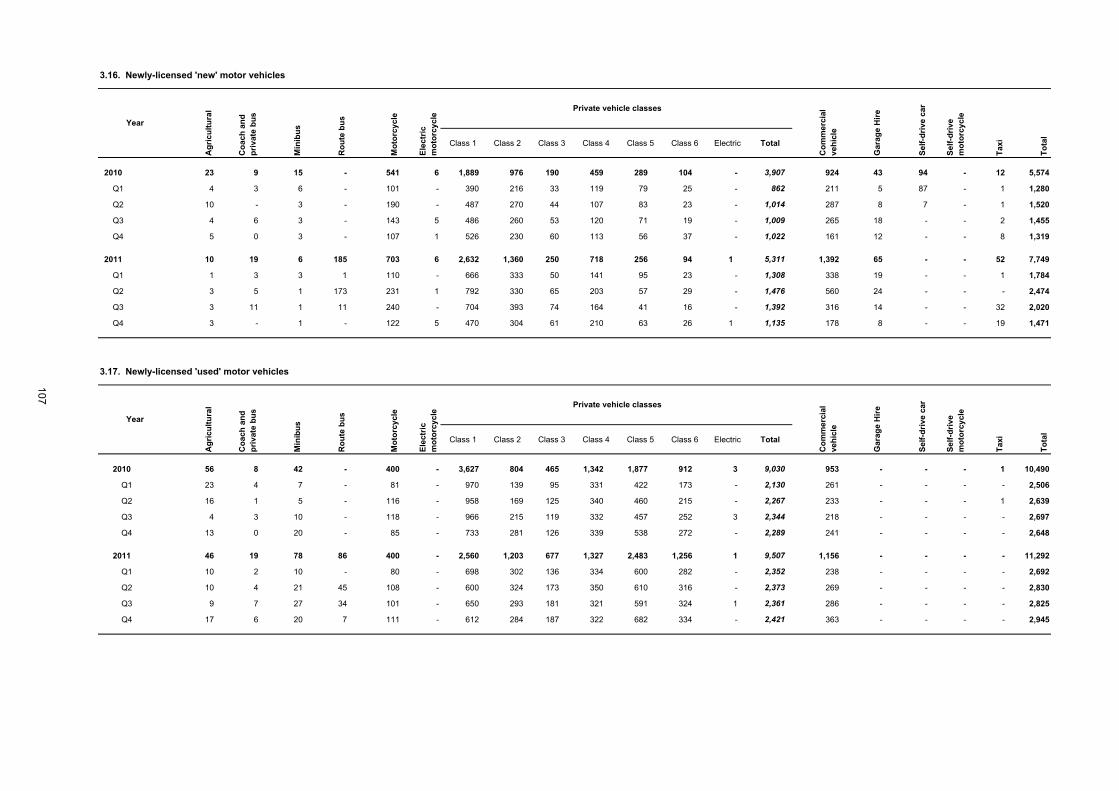
Class 1 Class 2 Class 3 Class 4 Class 5 Class 6 Electric Total
2010 23 9 15 - 541 6 1,889 976 190 459 289 104 - 3,907 924 43 94 - 12 5,574
Q1 4 3 6 - 101 - 390 216 33 119 79 25 - 862 211 5 87 - 1 1,280
Q2 10 - 3 - 190 - 487 270 44 107 83 23 - 1,014 287 8 7 - 1 1,520
Q3 4 6 3 - 143 5 486 260 53 120 71 19 - 1,009 265 18 - - 2 1,455
Q4 5 0 3 - 107 1 526 230 60 113 56 37 - 1,022 161 12 - - 8 1,319
2011 10 19 6 185 703 6 2,632 1,360 250 718 256 94 1 5,311 1,392 65 - - 52 7,749
Q1 1 3 3 1 110 - 666 333 50 141 95 23 - 1,308 338 19 - - 1 1,784
Q2 3 5 1 173 231 1 792 330 65 203 57 29 - 1,476 560 24 - - - 2,474
Q3 3 11 1 11 240 - 704 393 74 164 41 16 - 1,392 316 14 - - 32 2,020
Q4 3 - 1 - 122 5 470 304 61 210 63 26 1 1,135 178 8 - - 19 1,471
Class 1 Class 2 Class 3 Class 4 Class 5 Class 6 Electric Total
2010 56 8 42 - 400 - 3,627 804 465 1,342 1,877 912 3 9,030 953 - - - 1 10,490
Q1 23 4 7 - 81 - 970 139 95 331 422 173 - 2,130 261 - - - - 2,506
Q2 16 1 5 - 116 - 958 169 125 340 460 215 - 2,267 233 - - - 1 2,639
Q3 4 3 10 - 118 - 966 215 119 332 457 252 3 2,344 218 - - - - 2,697
Q4 13 0 20 - 85 - 733 281 126 339 538 272 - 2,289 241 - - - - 2,648
2011 46 19 78 86 400 - 2,560 1,203 677 1,327 2,483 1,256 1 9,507 1,156 - - - - 11,292
Q1 10 2 10 - 80 - 698 302 136 334 600 282 - 2,352 238 - - - - 2,692
Q2 10 4 21 45 108 - 600 324 173 350 610 316 - 2,373 269 - - - - 2,830
Q3 9 7 27 34 101 - 650 293 181 321 591 324 1 2,361 286 - - - - 2,825
Q4 17 6 20 7 111 - 612 284 187 322 682 334 - 2,421 363 - - - - 2,945
To
tal
Ele
ctri
c m
oto
rcyc
le
Private vehicle classes
Gar
age
Hir
e
Sel
f-d
rive
car
Co
mm
erci
al
veh
icle
To
tal
Sel
f-d
rive
m
oto
rcyc
le
Tax
i
3.16. Newly-licensed 'new' motor vehicles
Year
Ag
ricu
ltu
ral
Co
ach
an
d
pri
vate
bu
s
Min
ibu
s
Ro
ute
bu
s
Mo
torc
ycle
Tax
i
3.17. Newly-licensed 'used' motor vehicles
Year
Ag
ricu
ltu
ral
Co
ach
an
d
pri
vate
bu
s
Min
ibu
s
Ro
ute
bu
s
Mo
torc
ycle
Ele
ctri
c m
oto
rcyc
le
Private vehicle classes
Co
mm
erci
al
veh
icle
Gar
age
Hir
e
Sel
f-d
rive
car
Sel
f-d
rive
m
oto
rcyc
le
107
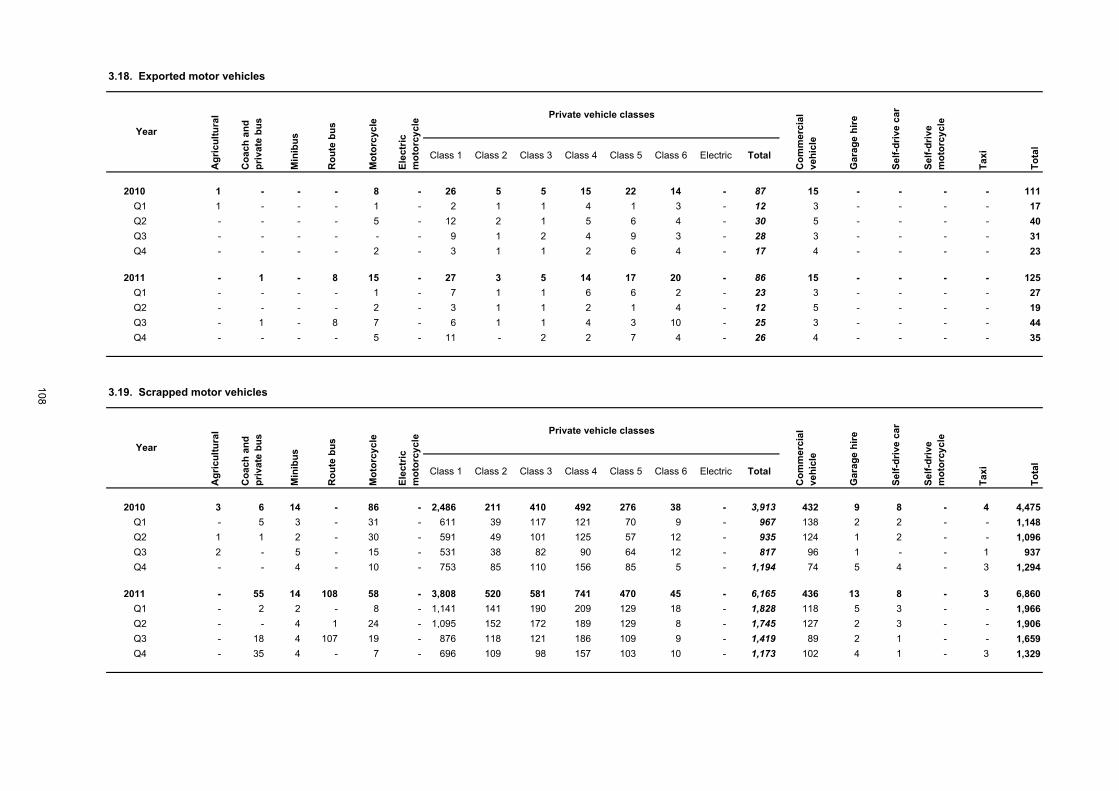
Class 1 Class 2 Class 3 Class 4 Class 5 Class 6 Electric Total
2010 1 - - - 8 - 26 5 5 15 22 14 - 87 15 - - - - 111
Q1 1 - - - 1 - 2 1 1 4 1 3 - 12 3 - - - - 17
Q2 - - - - 5 - 12 2 1 5 6 4 - 30 5 - - - - 40
Q3 - - - - - - 9 1 2 4 9 3 - 28 3 - - - - 31
Q4 - - - - 2 - 3 1 1 2 6 4 - 17 4 - - - - 23
2011 - 1 - 8 15 - 27 3 5 14 17 20 - 86 15 - - - - 125
Q1 - - - - 1 - 7 1 1 6 6 2 - 23 3 - - - - 27
Q2 - - - - 2 - 3 1 1 2 1 4 - 12 5 - - - - 19
Q3 - 1 - 8 7 - 6 1 1 4 3 10 - 25 3 - - - - 44
Q4 - - - - 5 - 11 - 2 2 7 4 - 26 4 - - - - 35
Class 1 Class 2 Class 3 Class 4 Class 5 Class 6 Electric Total
2010 3 6 14 - 86 - 2,486 211 410 492 276 38 - 3,913 432 9 8 - 4 4,475
Q1 - 5 3 - 31 - 611 39 117 121 70 9 - 967 138 2 2 - - 1,148
Q2 1 1 2 - 30 - 591 49 101 125 57 12 - 935 124 1 2 - - 1,096
Q3 2 - 5 - 15 - 531 38 82 90 64 12 - 817 96 1 - - 1 937
Q4 - - 4 - 10 - 753 85 110 156 85 5 - 1,194 74 5 4 - 3 1,294
2011 - 55 14 108 58 - 3,808 520 581 741 470 45 - 6,165 436 13 8 - 3 6,860
Q1 - 2 2 - 8 - 1,141 141 190 209 129 18 - 1,828 118 5 3 - - 1,966
Q2 - - 4 1 24 - 1,095 152 172 189 129 8 - 1,745 127 2 3 - - 1,906
Q3 - 18 4 107 19 - 876 118 121 186 109 9 - 1,419 89 2 1 - - 1,659
Q4 - 35 4 - 7 - 696 109 98 157 103 10 - 1,173 102 4 1 - 3 1,329
Gar
age
hir
e
Mo
torc
yc
leM
oto
rcy
cle
Ele
ctri
c m
oto
rcyc
leE
lect
ric
mo
torc
ycle
Co
mm
erci
al
veh
icle
Private vehicle classes
Year
Min
ibu
sM
inib
us
Ro
ute
bu
sR
ou
te b
us
Co
ach
an
d
pri
vate
bu
s
Ag
ricu
ltu
ral
3.19. Scrapped motor vehicles
Co
mm
erci
al
veh
icle
Private vehicle classes
To
tal
Sel
f-d
rive
m
oto
rcyc
le
Sel
f-d
rive
car
Tax
i
To
tal
3.18. Exported motor vehicles
Sel
f-d
rive
car
Sel
f-d
rive
m
oto
rcyc
le
Tax
i
Year
Ag
ricu
ltu
ral
Co
ach
an
d
pri
vate
bu
s
Gar
age
hir
e
108
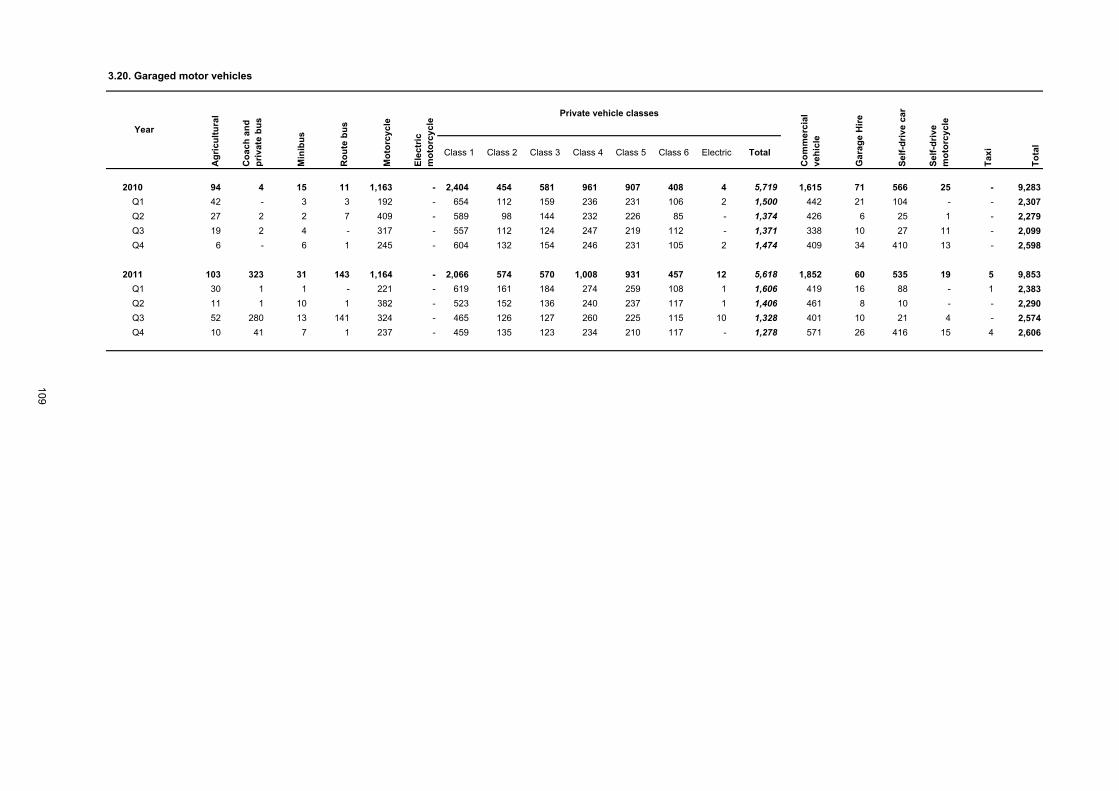
Class 1 Class 2 Class 3 Class 4 Class 5 Class 6 Electric Total
2010 94 4 15 11 1,163 - 2,404 454 581 961 907 408 4 5,719 1,615 71 566 25 - 9,283
Q1 42 - 3 3 192 - 654 112 159 236 231 106 2 1,500 442 21 104 - - 2,307
Q2 27 2 2 7 409 - 589 98 144 232 226 85 - 1,374 426 6 25 1 - 2,279
Q3 19 2 4 - 317 - 557 112 124 247 219 112 - 1,371 338 10 27 11 - 2,099
Q4 6 - 6 1 245 - 604 132 154 246 231 105 2 1,474 409 34 410 13 - 2,598
2011 103 323 31 143 1,164 - 2,066 574 570 1,008 931 457 12 5,618 1,852 60 535 19 5 9,853
Q1 30 1 1 - 221 - 619 161 184 274 259 108 1 1,606 419 16 88 - 1 2,383
Q2 11 1 10 1 382 - 523 152 136 240 237 117 1 1,406 461 8 10 - - 2,290
Q3 52 280 13 141 324 - 465 126 127 260 225 115 10 1,328 401 10 21 4 - 2,574
Q4 10 41 7 1 237 - 459 135 123 234 210 117 - 1,278 571 26 416 15 4 2,606
3.20. Garaged motor vehicles
Se
lf-d
riv
e c
ar
Se
lf-d
riv
e
mo
torc
yc
le
Ta
xi
Year
Ag
ric
ult
ura
l
Co
ac
h a
nd
p
riv
ate
bu
s
Ga
rag
e H
ire
Min
ibu
s
Co
mm
erc
ial
ve
hic
le
To
tal
Ro
ute
bu
s
Mo
torc
yc
le
Ele
ctr
ic
mo
torc
yc
le
Private vehicle classes
109
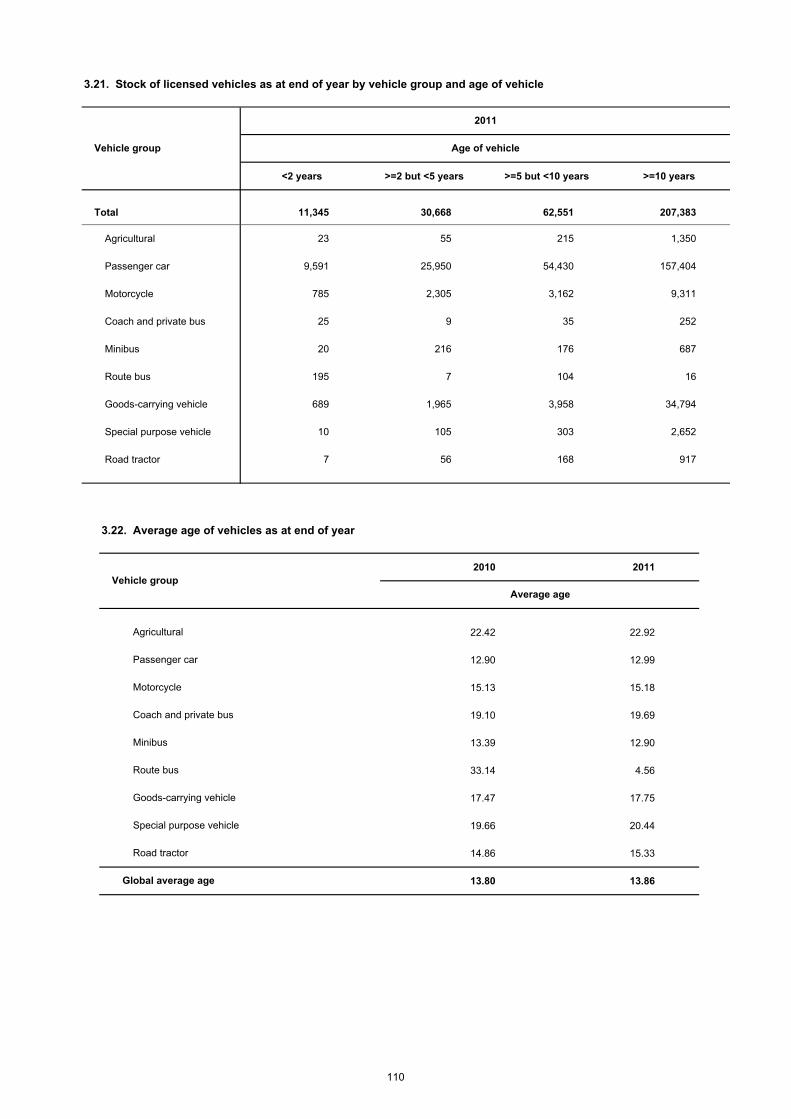
<2 years >=2 but <5 years >=5 but <10 years >=10 years
Total 11,345 30,668 62,551 207,383
Agricultural 23 55 215 1,350
Passenger car 9,591 25,950 54,430 157,404
Motorcycle 785 2,305 3,162 9,311
Coach and private bus 25 9 35 252
Minibus 20 216 176 687
Route bus 195 7 104 16
Goods-carrying vehicle 689 1,965 3,958 34,794
Special purpose vehicle 10 105 303 2,652
Road tractor 7 56 168 917
3.21. Stock of licensed vehicles as at end of year by vehicle group and age of vehicle
2011
Vehicle group Age of vehicle
2010 2011
22.42 22.92
12.90 12.99
15.13 15.18
19.10 19.69
13.39 12.90
33.14 4.56
17.47 17.75
19.66 20.44
14.86 15.33
13.80 13.86Global average age
3.22. Average age of vehicles as at end of year
Road tractor
Goods-carrying vehicle
Special purpose vehicle
Coach and private bus
Minibus
Route bus
Agricultural
Passenger car
Motorcycle
Vehicle group
Average age
110
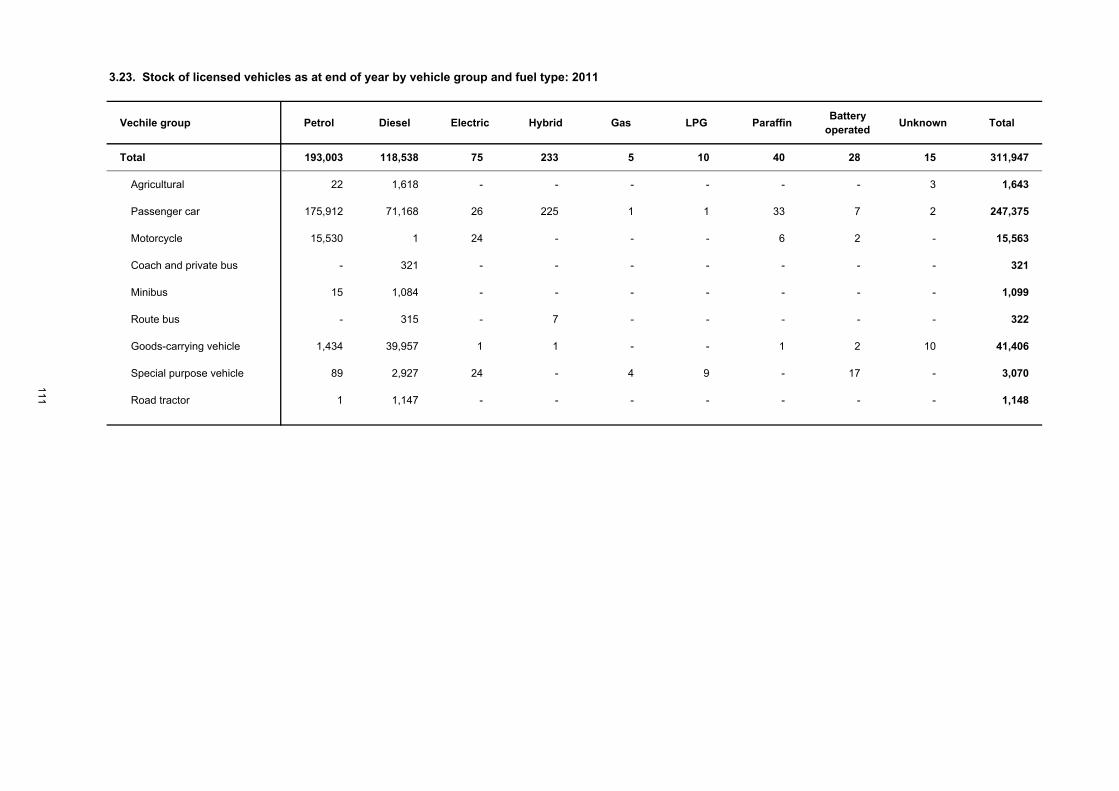
Vechile group Petrol Diesel Electric Hybrid Gas LPG ParaffinBattery
operatedUnknown Total
Total 193,003 118,538 75 233 5 10 40 28 15 311,947
Agricultural 22 1,618 - - - - - - 3 1,643
Passenger car 175,912 71,168 26 225 1 1 33 7 2 247,375
Motorcycle 15,530 1 24 - - - 6 2 - 15,563
Coach and private bus - 321 - - - - - - - 321
Minibus 15 1,084 - - - - - - - 1,099
Route bus - 315 - 7 - - - - - 322
Goods-carrying vehicle 1,434 39,957 1 1 - - 1 2 10 41,406
Special purpose vehicle 89 2,927 24 - 4 9 - 17 - 3,070
Road tractor 1 1,147 - - - - - - - 1,148
3.23. Stock of licensed vehicles as at end of year by vehicle group and fuel type: 2011
111
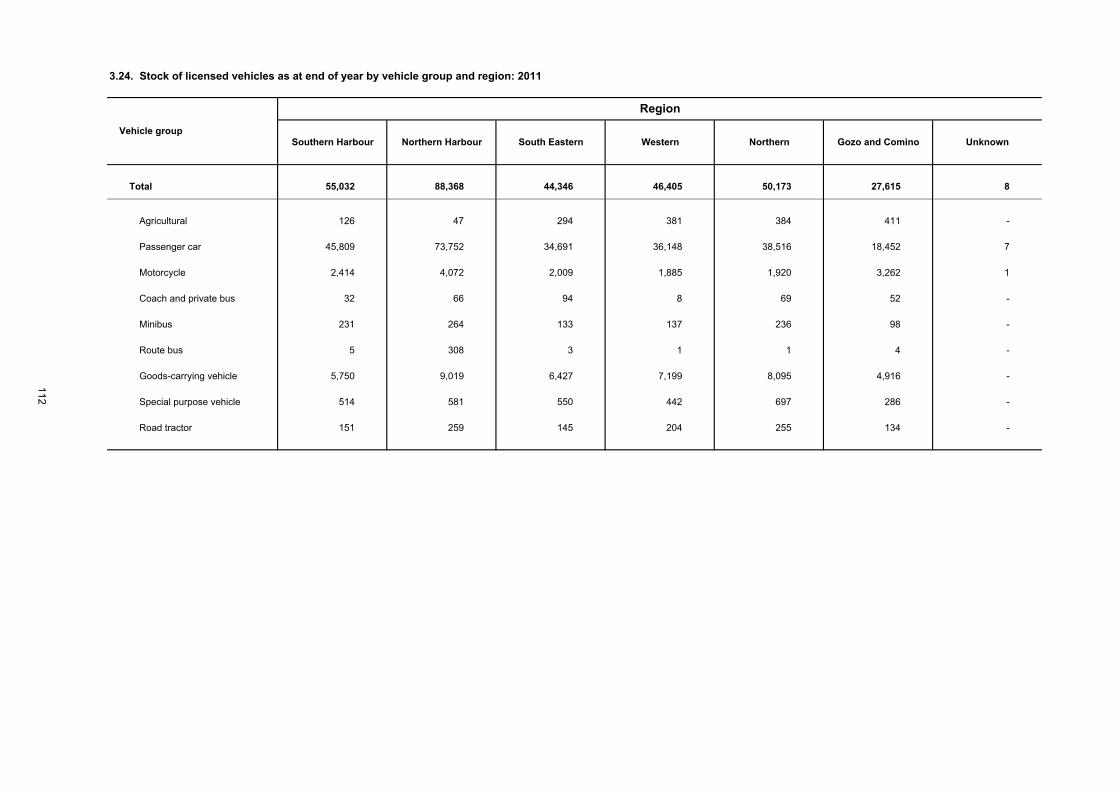
Total 55,032 88,368 44,346 46,405 50,173 27,615 8
Agricultural 126 47 294 381 384 411 -
Passenger car 45,809 73,752 34,691 36,148 38,516 18,452 7
Motorcycle 2,414 4,072 2,009 1,885 1,920 3,262 1
Coach and private bus 32 66 94 8 69 52 -
Minibus 231 264 133 137 236 98 -
Route bus 5 308 3 1 1 4 -
Goods-carrying vehicle 5,750 9,019 6,427 7,199 8,095 4,916 -
Special purpose vehicle 514 581 550 442 697 286 -
Road tractor 151 259 145 204 255 134 -
Vehicle group
Region
3.24. Stock of licensed vehicles as at end of year by vehicle group and region: 2011
Northern Gozo and Comino UnknownSouthern Harbour Northern Harbour South Eastern Western
112
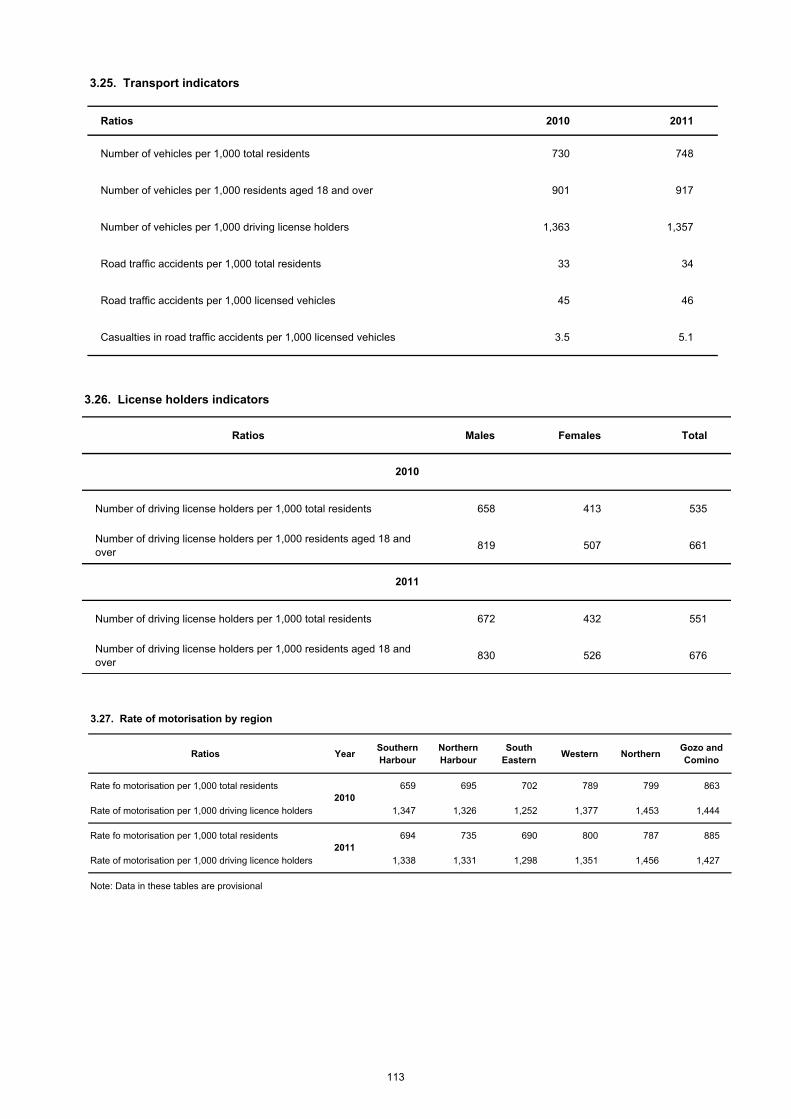
Ratios 2010 2011
Number of vehicles per 1,000 total residents 730 748
Number of vehicles per 1,000 residents aged 18 and over 901 917
Number of vehicles per 1,000 driving license holders 1,363 1,357
Road traffic accidents per 1,000 total residents 33 34
Road traffic accidents per 1,000 licensed vehicles 45 46
Casualties in road traffic accidents per 1,000 licensed vehicles 3.5 5.1
3.25. Transport indicators
Ratios Males Females Total
Number of driving license holders per 1,000 total residents 658 413 535
Number of driving license holders per 1,000 residents aged 18 and
over819 507 661
Number of driving license holders per 1,000 total residents 672 432 551
Number of driving license holders per 1,000 residents aged 18 and
over830 526 676
3.26. License holders indicators
2010
2011
Ratios YearSouthern
Harbour
Northern
Harbour
South
EasternWestern Northern
Gozo and
Comino
Rate fo motorisation per 1,000 total residents 659 695 702 789 799 863
Rate of motorisation per 1,000 driving licence holders 1,347 1,326 1,252 1,377 1,453 1,444
Rate fo motorisation per 1,000 total residents 694 735 690 800 787 885
Rate of motorisation per 1,000 driving licence holders 1,338 1,331 1,298 1,351 1,456 1,427
Note: Data in these tables are provisional
2011
3.27. Rate of motorisation by region
2010
113
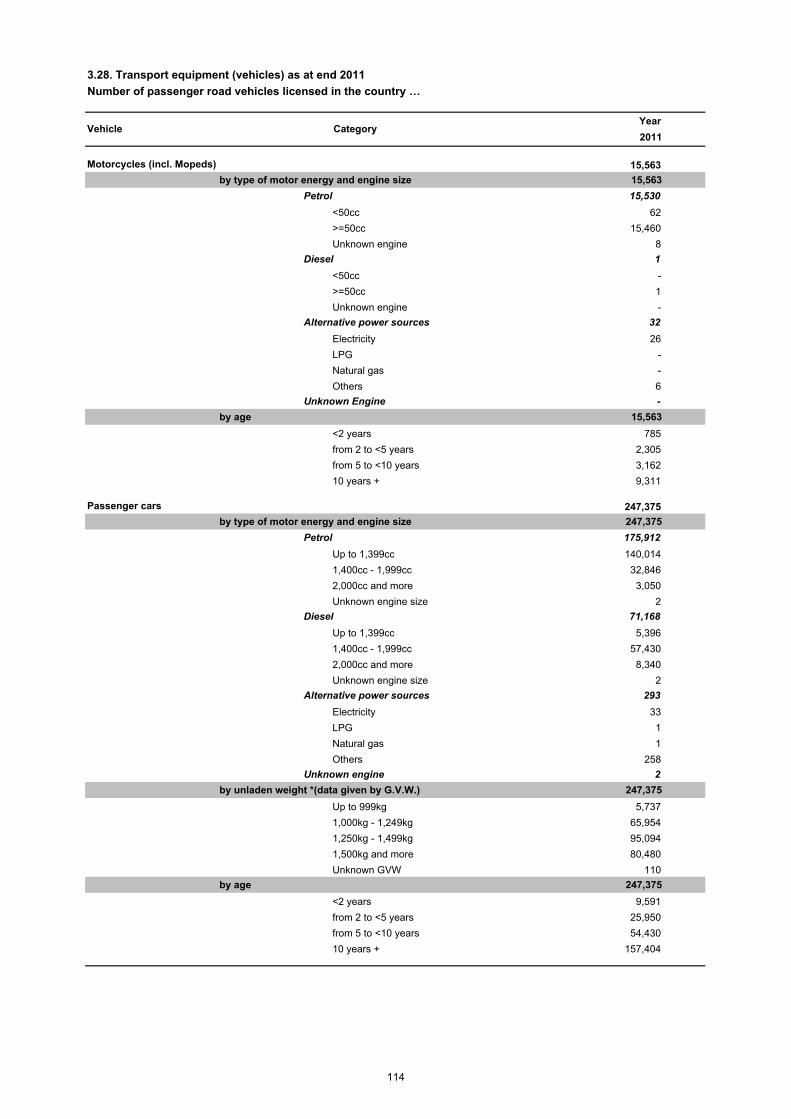
Year
2011
Motorcycles (incl. Mopeds) 15,563
by type of motor energy and engine size 15,563
Petrol 15,530
<50cc 62
>=50cc 15,460
Unknown engine 8
Diesel 1
<50cc -
>=50cc 1
Unknown engine -
Alternative power sources 32
Electricity 26
LPG -
Natural gas -
Others 6
Unknown Engine -
by age 15,563
<2 years 785
from 2 to <5 years 2,305
from 5 to <10 years 3,162
10 years + 9,311
Passenger cars 247,375
by type of motor energy and engine size 247,375
Petrol 175,912
Up to 1,399cc 140,014
1,400cc - 1,999cc 32,846
2,000cc and more 3,050
Unknown engine size 2
Diesel 71,168
Up to 1,399cc 5,396
1,400cc - 1,999cc 57,430
2,000cc and more 8,340
Unknown engine size 2
Alternative power sources 293
Electricity 33
LPG 1
Natural gas 1
Others 258
Unknown engine 2
by unladen weight *(data given by G.V.W.) 247,375
Up to 999kg 5,737
1,000kg - 1,249kg 65,954
1,250kg - 1,499kg 95,094
1,500kg and more 80,480
Unknown GVW 110
by age 247,375
<2 years 9,591
from 2 to <5 years 25,950
from 5 to <10 years 54,430
10 years + 157,404
3.28. Transport equipment (vehicles) as at end 2011
Vehicle Category
Number of passenger road vehicles licensed in the country …
114
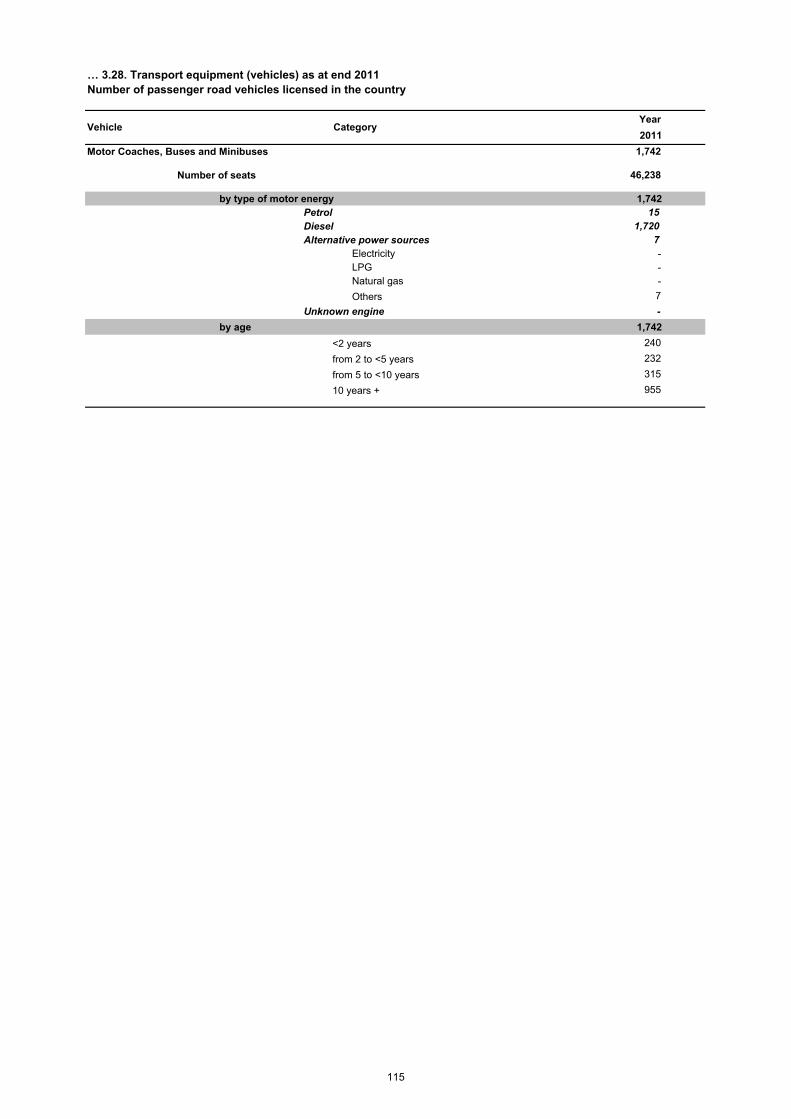
Year
2011
Motor Coaches, Buses and Minibuses 1,742
Number of seats 46,238
by type of motor energy 1,742 Petrol 15 Diesel 1,720 Alternative power sources 7
Electricity - LPG - Natural gas -
Others 7
Unknown engine -
by age 1,742
<2 years 240
from 2 to <5 years 232
from 5 to <10 years 315
10 years + 955
Vehicle Category
… 3.28. Transport equipment (vehicles) as at end 2011Number of passenger road vehicles licensed in the country
115
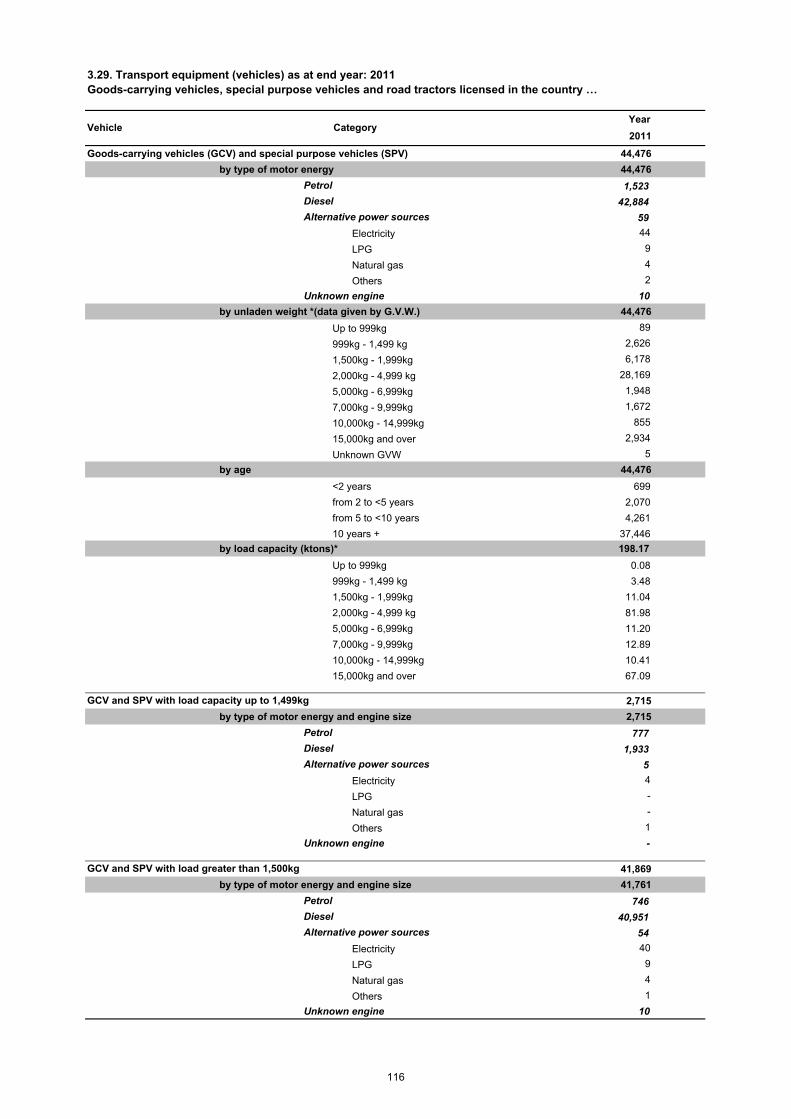
Year
2011
Goods-carrying vehicles (GCV) and special purpose vehicles (SPV) 44,476
by type of motor energy 44,476
Petrol 1,523
Diesel 42,884
Alternative power sources 59
Electricity 44
LPG 9
Natural gas 4
Others 2
Unknown engine 10
by unladen weight *(data given by G.V.W.) 44,476
Up to 999kg 89
999kg - 1,499 kg 2,626
1,500kg - 1,999kg 6,178
2,000kg - 4,999 kg 28,169
5,000kg - 6,999kg 1,948
7,000kg - 9,999kg 1,672
10,000kg - 14,999kg 855
15,000kg and over 2,934
Unknown GVW 5
by age 44,476
<2 years 699
from 2 to <5 years 2,070
from 5 to <10 years 4,261
10 years + 37,446
by load capacity (ktons)* 198.17
Up to 999kg 0.08
999kg - 1,499 kg 3.48
1,500kg - 1,999kg 11.04
2,000kg - 4,999 kg 81.98
5,000kg - 6,999kg 11.20
7,000kg - 9,999kg 12.89
10,000kg - 14,999kg 10.41
15,000kg and over 67.09
2,715
by type of motor energy and engine size 2,715
Petrol 777
Diesel 1,933
Alternative power sources 5
Electricity 4
LPG -
Natural gas -
Others 1
Unknown engine -
41,869
by type of motor energy and engine size 41,761
Petrol 746
Diesel 40,951
Alternative power sources 54
Electricity 40
LPG 9
Natural gas 4
Others 1
Unknown engine 10
3.29. Transport equipment (vehicles) as at end year: 2011Goods-carrying vehicles, special purpose vehicles and road tractors licensed in the country …
GCV and SPV with load capacity up to 1,499kg
GCV and SPV with load greater than 1,500kg
Vehicle Category
116
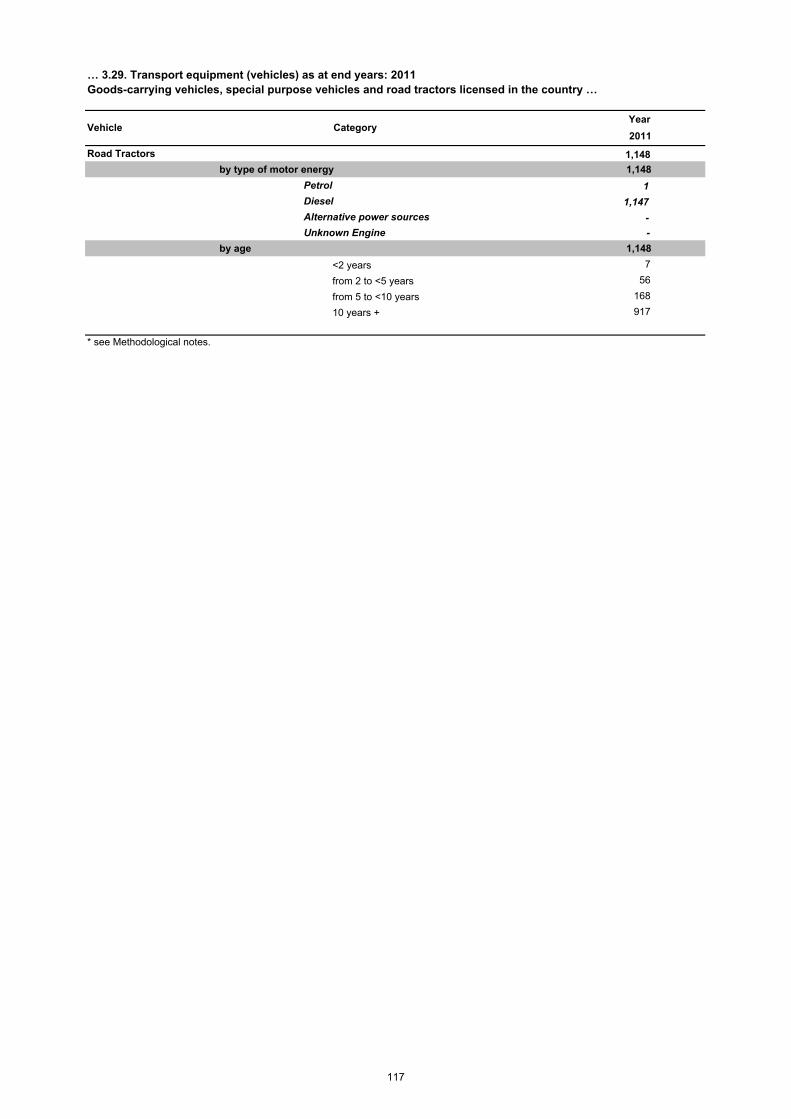
Year
2011
Road Tractors 1,148
by type of motor energy 1,148
Petrol 1
Diesel 1,147
Alternative power sources -
Unknown Engine -
by age 1,148
<2 years 7
from 2 to <5 years 56
from 5 to <10 years 168
10 years + 917
* see Methodological notes.
Vehicle Category
… 3.29. Transport equipment (vehicles) as at end years: 2011Goods-carrying vehicles, special purpose vehicles and road tractors licensed in the country …
117
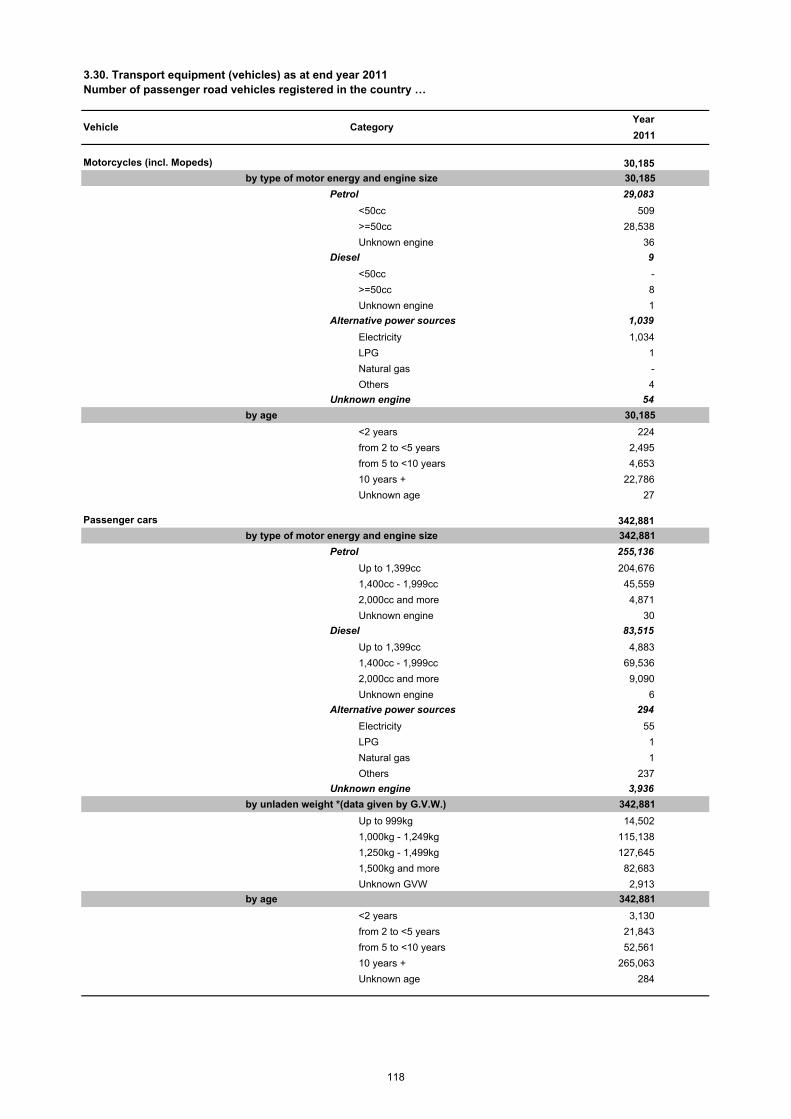
Year
2011
Motorcycles (incl. Mopeds) 30,185
by type of motor energy and engine size 30,185
Petrol 29,083
<50cc 509
>=50cc 28,538
Unknown engine 36
Diesel 9
<50cc -
>=50cc 8
Unknown engine 1
Alternative power sources 1,039
Electricity 1,034
LPG 1
Natural gas -
Others 4
Unknown engine 54
by age 30,185
<2 years 224
from 2 to <5 years 2,495
from 5 to <10 years 4,653
10 years + 22,786
Unknown age 27
Passenger cars 342,881
by type of motor energy and engine size 342,881
Petrol 255,136
Up to 1,399cc 204,676
1,400cc - 1,999cc 45,559
2,000cc and more 4,871
Unknown engine 30
Diesel 83,515
Up to 1,399cc 4,883
1,400cc - 1,999cc 69,536
2,000cc and more 9,090
Unknown engine 6
Alternative power sources 294
Electricity 55
LPG 1
Natural gas 1
Others 237
Unknown engine 3,936
by unladen weight *(data given by G.V.W.) 342,881
Up to 999kg 14,502
1,000kg - 1,249kg 115,138
1,250kg - 1,499kg 127,645
1,500kg and more 82,683
Unknown GVW 2,913
by age 342,881
<2 years 3,130
from 2 to <5 years 21,843
from 5 to <10 years 52,561
10 years + 265,063
Unknown age 284
3.30. Transport equipment (vehicles) as at end year 2011
Vehicle Category
Number of passenger road vehicles registered in the country …
118
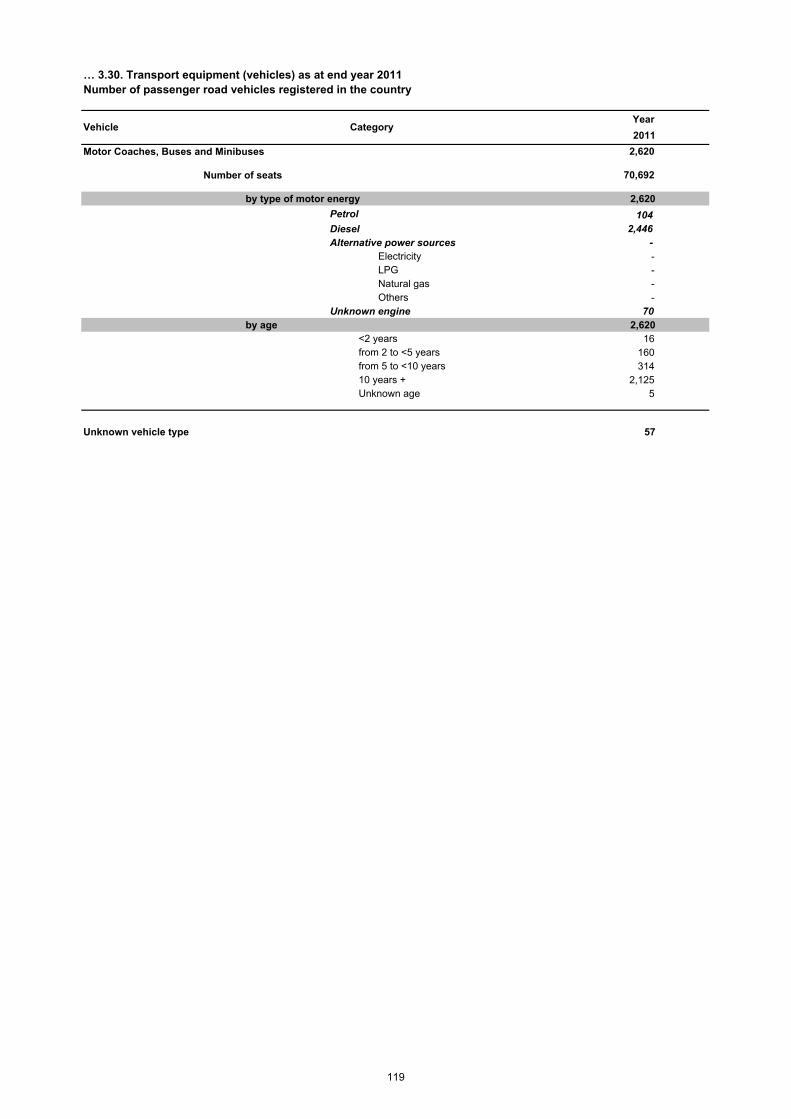
Year
2011
Motor Coaches, Buses and Minibuses 2,620
Number of seats 70,692
by type of motor energy 2,620
Petrol 104 Diesel 2,446 Alternative power sources -
Electricity - LPG - Natural gas - Others -
Unknown engine 70 by age 2,620
<2 years 16from 2 to <5 years 160from 5 to <10 years 31410 years + 2,125Unknown age 5
Unknown vehicle type 57
Vehicle Category
… 3.30. Transport equipment (vehicles) as at end year 2011Number of passenger road vehicles registered in the country
119
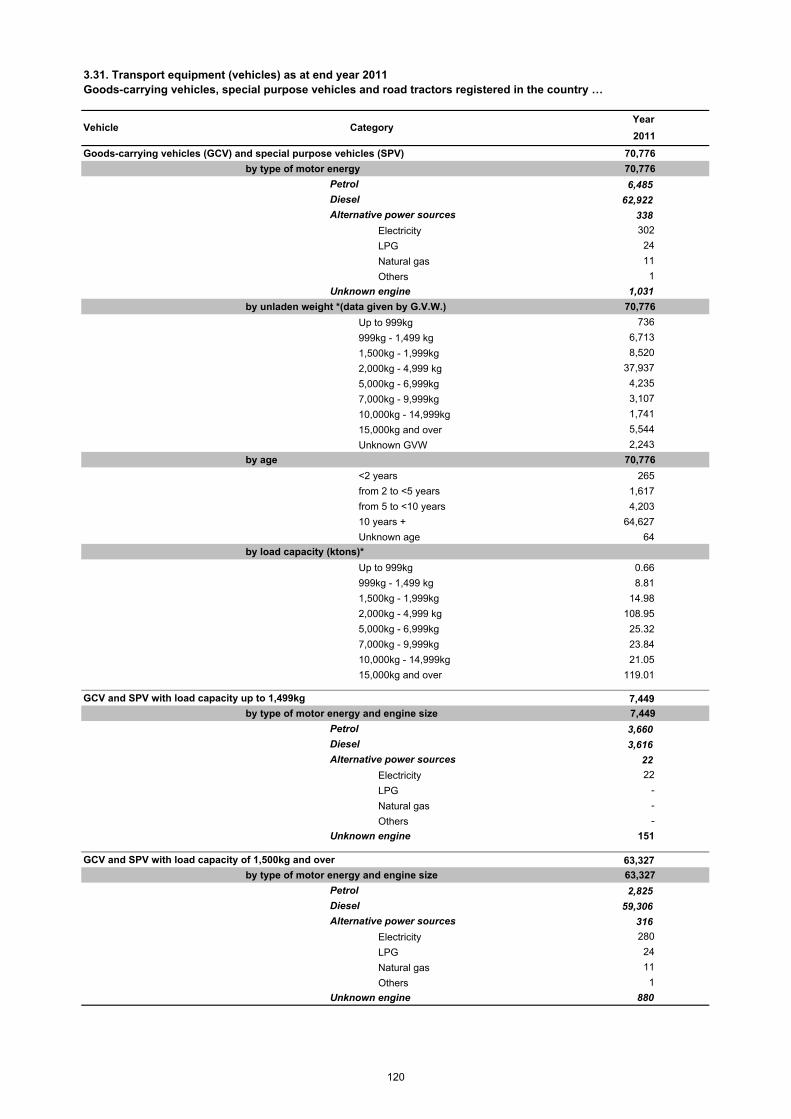
Year
2011
Goods-carrying vehicles (GCV) and special purpose vehicles (SPV) 70,776
by type of motor energy 70,776
Petrol 6,485
Diesel 62,922
Alternative power sources 338
Electricity 302
LPG 24
Natural gas 11
Others 1
Unknown engine 1,031
by unladen weight *(data given by G.V.W.) 70,776
Up to 999kg 736
999kg - 1,499 kg 6,713
1,500kg - 1,999kg 8,520
2,000kg - 4,999 kg 37,937
5,000kg - 6,999kg 4,235
7,000kg - 9,999kg 3,107
10,000kg - 14,999kg 1,741
15,000kg and over 5,544
Unknown GVW 2,243
by age 70,776
<2 years 265
from 2 to <5 years 1,617
from 5 to <10 years 4,203
10 years + 64,627
Unknown age 64
by load capacity (ktons)*
Up to 999kg 0.66
999kg - 1,499 kg 8.81
1,500kg - 1,999kg 14.98
2,000kg - 4,999 kg 108.95
5,000kg - 6,999kg 25.32
7,000kg - 9,999kg 23.84
10,000kg - 14,999kg 21.05
15,000kg and over 119.01
GCV and SPV with load capacity up to 1,499kg 7,449
by type of motor energy and engine size 7,449
Petrol 3,660
Diesel 3,616
Alternative power sources 22
Electricity 22
LPG -
Natural gas -
Others -
Unknown engine 151
GCV and SPV with load capacity of 1,500kg and over 63,327
by type of motor energy and engine size 63,327
Petrol 2,825
Diesel 59,306
Alternative power sources 316
Electricity 280
LPG 24
Natural gas 11
Others 1
Unknown engine 880
Vehicle Category
3.31. Transport equipment (vehicles) as at end year 2011Goods-carrying vehicles, special purpose vehicles and road tractors registered in the country …
120
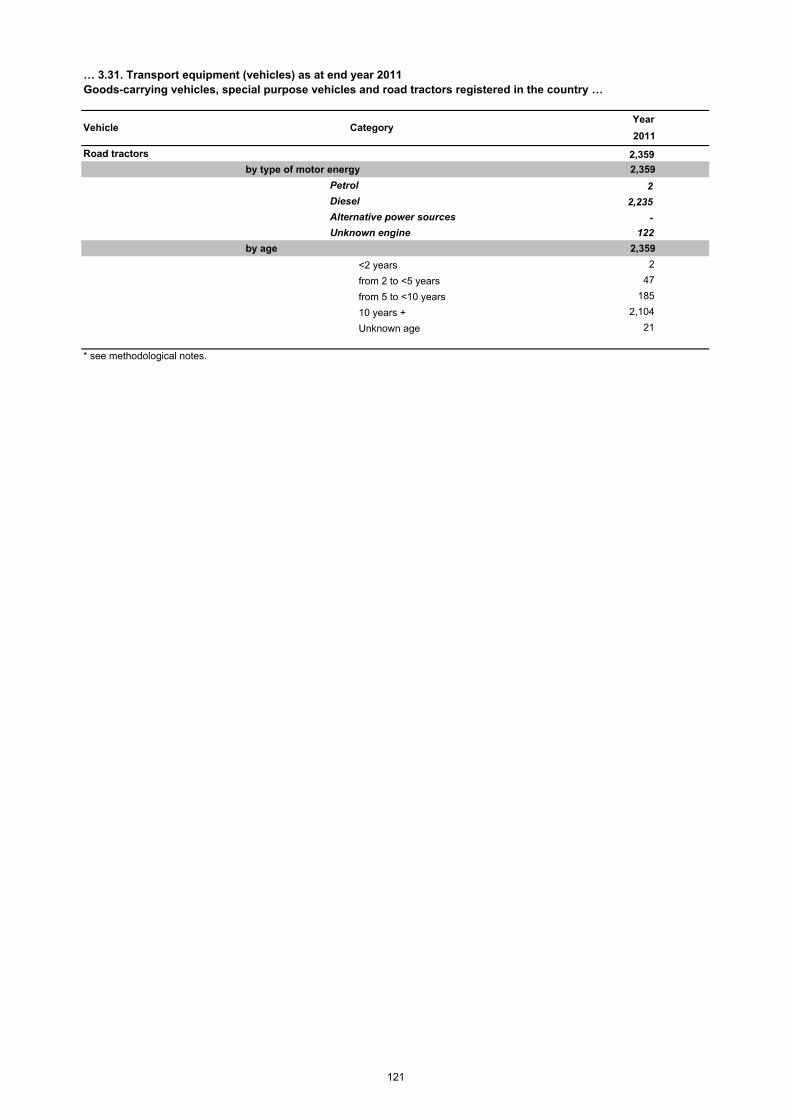
Year
2011
Road tractors 2,359
by type of motor energy 2,359
Petrol 2
Diesel 2,235
Alternative power sources -
Unknown engine 122
by age 2,359
<2 years 2
from 2 to <5 years 47
from 5 to <10 years 185
10 years + 2,104
Unknown age 21
* see methodological notes.
… 3.31. Transport equipment (vehicles) as at end year 2011Goods-carrying vehicles, special purpose vehicles and road tractors registered in the country …
Vehicle Category
121
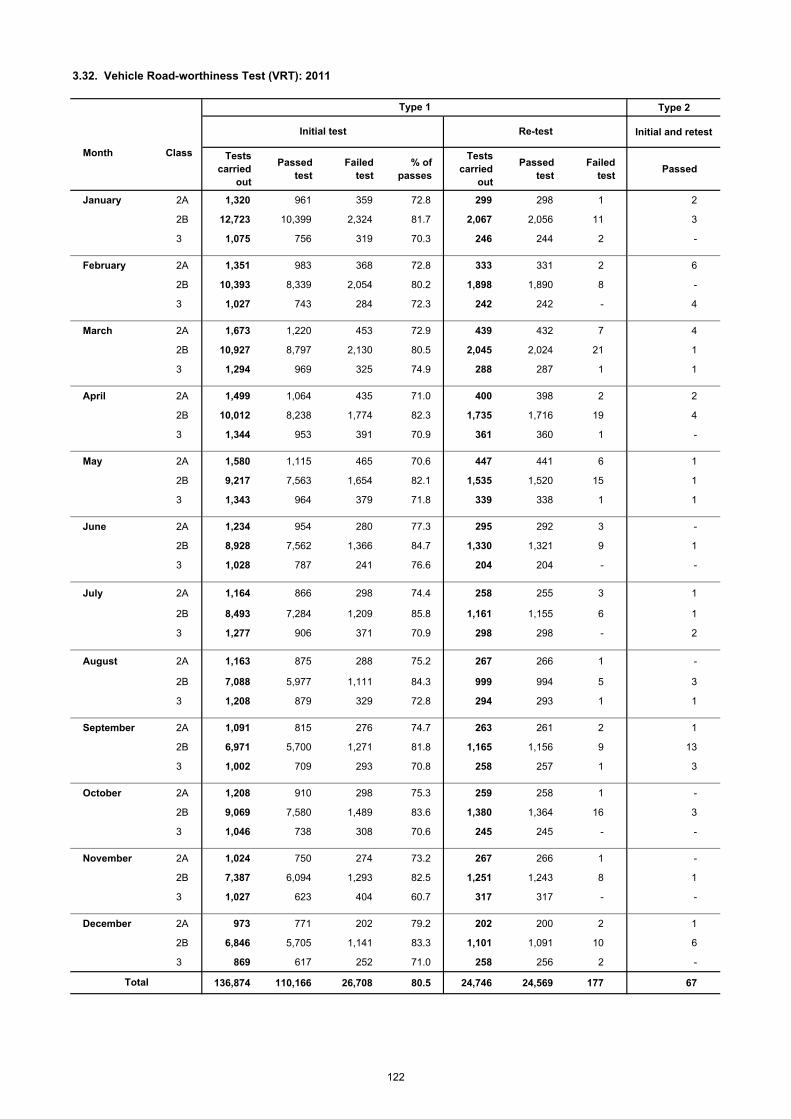
Type 2
Initial and retest
Tests carried
out
Passed test
Failed test
% of passes
Tests carried
out
Passed test
Failed test
Passed
January 2A 1,320 961 359 72.8 299 298 1 2
2B 12,723 10,399 2,324 81.7 2,067 2,056 11 3
3 1,075 756 319 70.3 246 244 2 -
February 2A 1,351 983 368 72.8 333 331 2 6
2B 10,393 8,339 2,054 80.2 1,898 1,890 8 -
3 1,027 743 284 72.3 242 242 - 4
March 2A 1,673 1,220 453 72.9 439 432 7 4
2B 10,927 8,797 2,130 80.5 2,045 2,024 21 1
3 1,294 969 325 74.9 288 287 1 1
April 2A 1,499 1,064 435 71.0 400 398 2 2
2B 10,012 8,238 1,774 82.3 1,735 1,716 19 4
3 1,344 953 391 70.9 361 360 1 -
May 2A 1,580 1,115 465 70.6 447 441 6 1
2B 9,217 7,563 1,654 82.1 1,535 1,520 15 1
3 1,343 964 379 71.8 339 338 1 1
June 2A 1,234 954 280 77.3 295 292 3 -
2B 8,928 7,562 1,366 84.7 1,330 1,321 9 1
3 1,028 787 241 76.6 204 204 - -
July 2A 1,164 866 298 74.4 258 255 3 1
2B 8,493 7,284 1,209 85.8 1,161 1,155 6 1
3 1,277 906 371 70.9 298 298 - 2
August 2A 1,163 875 288 75.2 267 266 1 -
2B 7,088 5,977 1,111 84.3 999 994 5 3
3 1,208 879 329 72.8 294 293 1 1
September 2A 1,091 815 276 74.7 263 261 2 1
2B 6,971 5,700 1,271 81.8 1,165 1,156 9 13
3 1,002 709 293 70.8 258 257 1 3
October 2A 1,208 910 298 75.3 259 258 1 -
2B 9,069 7,580 1,489 83.6 1,380 1,364 16 3
3 1,046 738 308 70.6 245 245 - -
November 2A 1,024 750 274 73.2 267 266 1 -
2B 7,387 6,094 1,293 82.5 1,251 1,243 8 1
3 1,027 623 404 60.7 317 317 - -
December 2A 973 771 202 79.2 202 200 2 1
2B 6,846 5,705 1,141 83.3 1,101 1,091 10 6
3 869 617 252 71.0 258 256 2 -
136,874 110,166 26,708 80.5 24,746 24,569 177 67Total
3.32. Vehicle Road-worthiness Test (VRT): 2011
Month Class
Initial test Re-test
Type 1
122
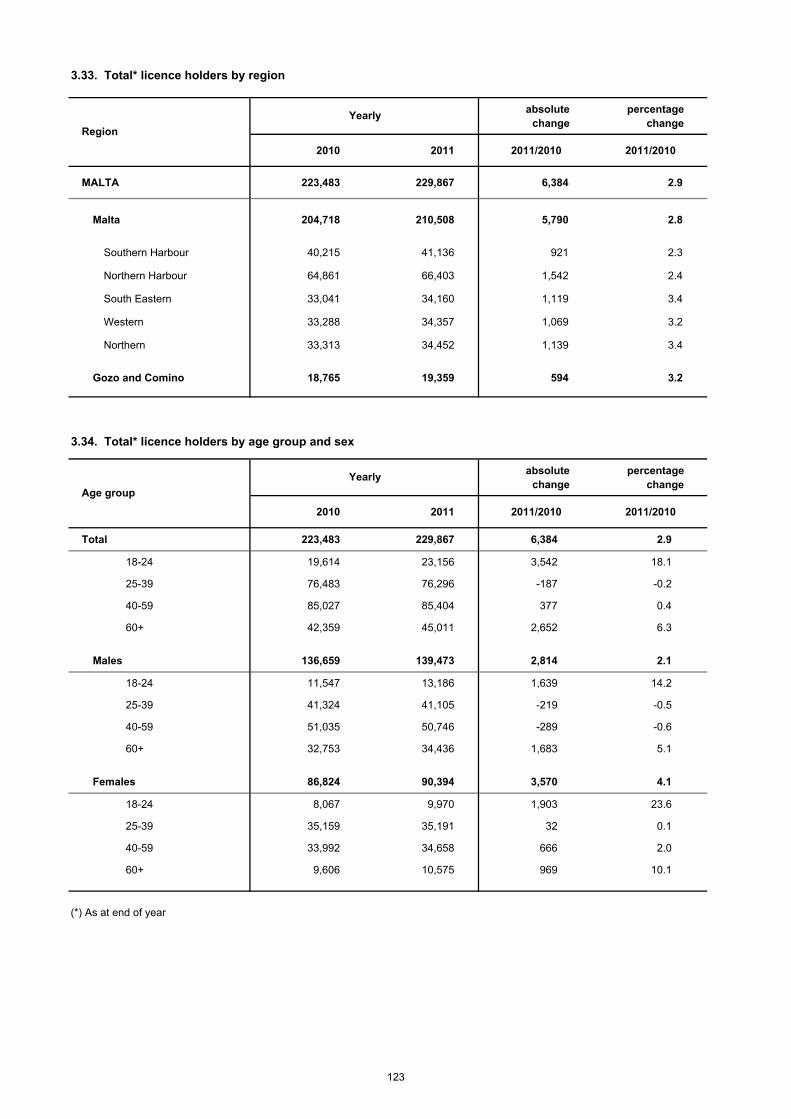
absolute change
percentage change
2010 2011 2011/2010 2011/2010
MALTA 223,483 229,867 6,384 2.9
Malta 204,718 210,508 5,790 2.8
Southern Harbour 40,215 41,136 921 2.3
Northern Harbour 64,861 66,403 1,542 2.4
South Eastern 33,041 34,160 1,119 3.4
Western 33,288 34,357 1,069 3.2
Northern 33,313 34,452 1,139 3.4
Gozo and Comino 18,765 19,359 594 3.2
absolute change
percentage change
2010 2011 2011/2010 2011/2010
Total 223,483 229,867 6,384 2.9
18-24 19,614 23,156 3,542 18.1
25-39 76,483 76,296 -187 -0.2
40-59 85,027 85,404 377 0.4
60+ 42,359 45,011 2,652 6.3
Males 136,659 139,473 2,814 2.1
18-24 11,547 13,186 1,639 14.2
25-39 41,324 41,105 -219 -0.5
40-59 51,035 50,746 -289 -0.6
60+ 32,753 34,436 1,683 5.1
Females 86,824 90,394 3,570 4.1
18-24 8,067 9,970 1,903 23.6
25-39 35,159 35,191 32 0.1
40-59 33,992 34,658 666 2.0
60+ 9,606 10,575 969 10.1
(*) As at end of year
Age group
Yearly
3.33. Total* licence holders by region
3.34. Total* licence holders by age group and sex
Region
Yearly
123
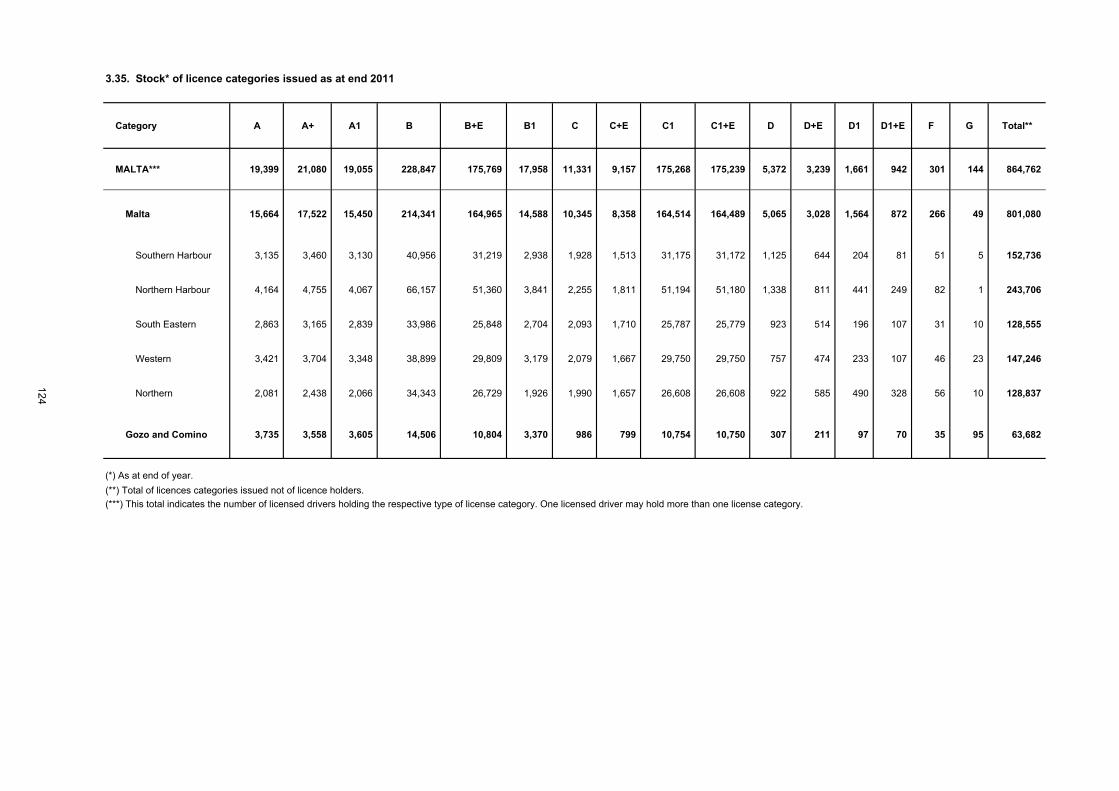
Category A A+ A1 B B+E B1 C C+E C1 C1+E D D+E D1 D1+E F G Total**
MALTA*** 19,399 21,080 19,055 228,847 175,769 17,958 11,331 9,157 175,268 175,239 5,372 3,239 1,661 942 301 144 864,762
Malta 15,664 17,522 15,450 214,341 164,965 14,588 10,345 8,358 164,514 164,489 5,065 3,028 1,564 872 266 49 801,080
Southern Harbour 3,135 3,460 3,130 40,956 31,219 2,938 1,928 1,513 31,175 31,172 1,125 644 204 81 51 5 152,736
Northern Harbour 4,164 4,755 4,067 66,157 51,360 3,841 2,255 1,811 51,194 51,180 1,338 811 441 249 82 1 243,706
South Eastern 2,863 3,165 2,839 33,986 25,848 2,704 2,093 1,710 25,787 25,779 923 514 196 107 31 10 128,555
Western 3,421 3,704 3,348 38,899 29,809 3,179 2,079 1,667 29,750 29,750 757 474 233 107 46 23 147,246
Northern 2,081 2,438 2,066 34,343 26,729 1,926 1,990 1,657 26,608 26,608 922 585 490 328 56 10 128,837
Gozo and Comino 3,735 3,558 3,605 14,506 10,804 3,370 986 799 10,754 10,750 307 211 97 70 35 95 63,682
(*) As at end of year.
(**) Total of licences categories issued not of licence holders. (***) This total indicates the number of licensed drivers holding the respective type of license category. One licensed driver may hold more than one license category.
3.35. Stock* of licence categories issued as at end 2011
124
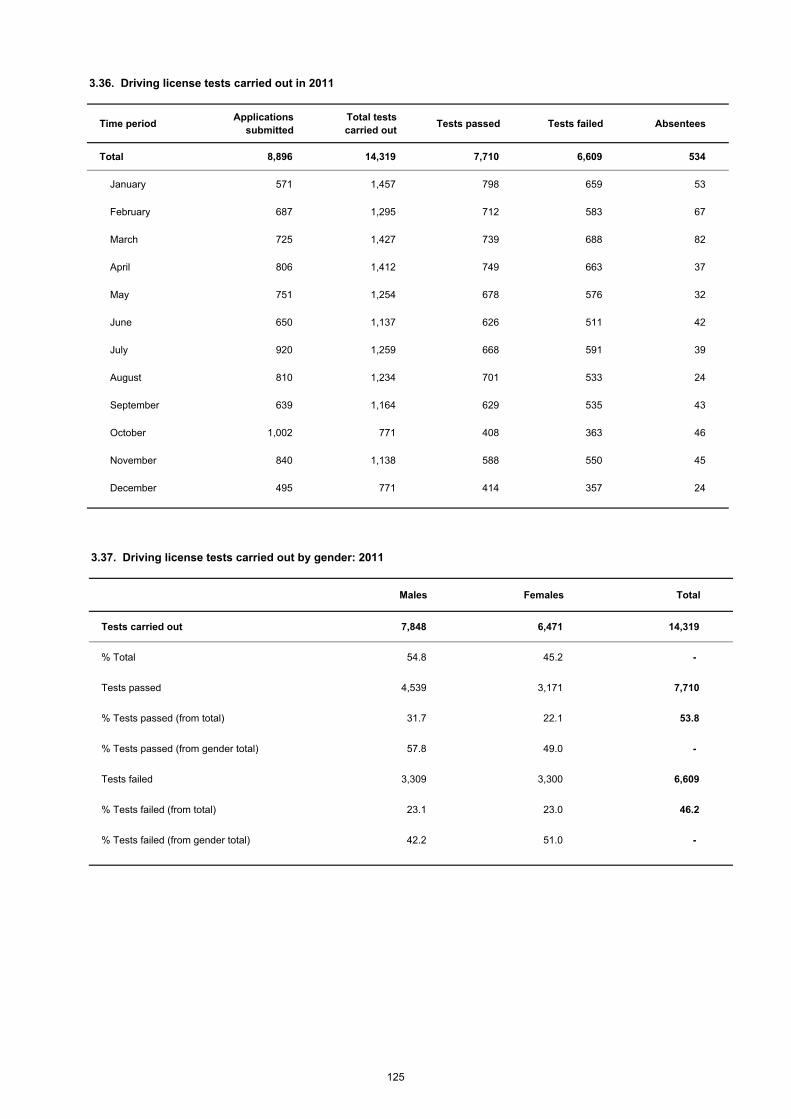
Time periodApplications
submitted
Total tests
carried outTests passed Tests failed Absentees
Total 8,896 14,319 7,710 6,609 534
January 571 1,457 798 659 53
February 687 1,295 712 583 67
March 725 1,427 739 688 82
April 806 1,412 749 663 37
May 751 1,254 678 576 32
June 650 1,137 626 511 42
July 920 1,259 668 591 39
August 810 1,234 701 533 24
September 639 1,164 629 535 43
October 1,002 771 408 363 46
November 840 1,138 588 550 45
December 495 771 414 357 24
3.36. Driving license tests carried out in 2011
Males Females Total
Tests carried out 7,848 6,471 14,319
% Total 54.8 45.2 -
Tests passed 4,539 3,171 7,710
% Tests passed (from total) 31.7 22.1 53.8
% Tests passed (from gender total) 57.8 49.0 -
Tests failed 3,309 3,300 6,609
% Tests failed (from total) 23.1 23.0 46.2
% Tests failed (from gender total) 42.2 51.0 -
3.37. Driving license tests carried out by gender: 2011
125
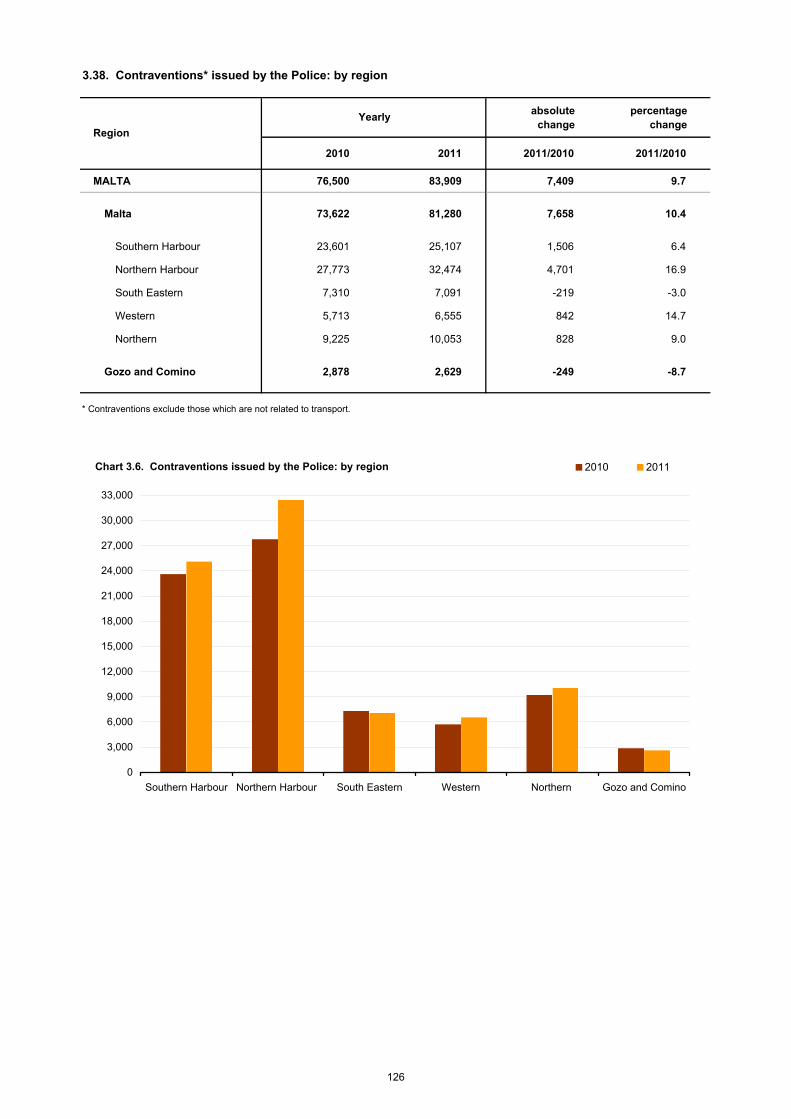
absolute change
percentage change
2010 2011 2011/2010 2011/2010
MALTA 76,500 83,909 7,409 9.7
Malta 73,622 81,280 7,658 10.4
Southern Harbour 23,601 25,107 1,506 6.4
Northern Harbour 27,773 32,474 4,701 16.9
South Eastern 7,310 7,091 -219 -3.0
Western 5,713 6,555 842 14.7
Northern 9,225 10,053 828 9.0
Gozo and Comino 2,878 2,629 -249 -8.7
* Contraventions exclude those which are not related to transport.
3.38. Contraventions* issued by the Police: by region
Yearly
Region
Chart 3.6. Contraventions issued by the Police: by region
0
3,000
6,000
9,000
12,000
15,000
18,000
21,000
24,000
27,000
30,000
33,000
Southern Harbour Northern Harbour South Eastern Western Northern Gozo and Comino
2010 2011
126
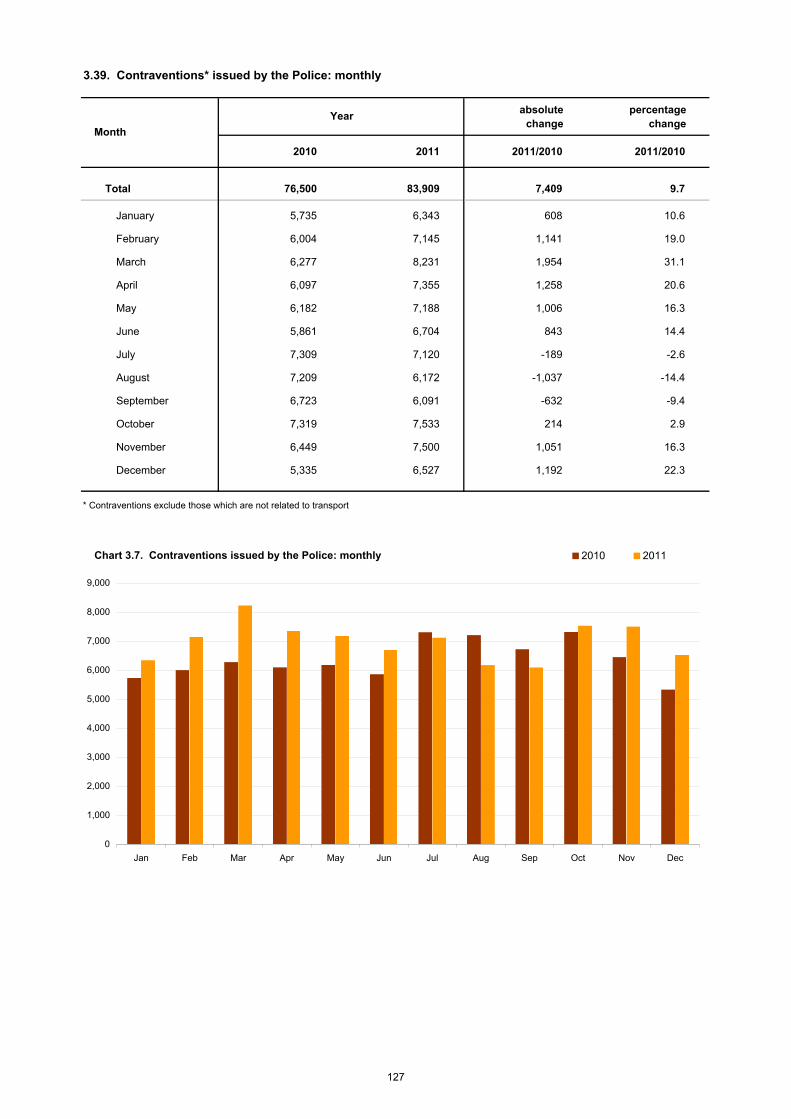
absolute change
percentage change
2010 2011 2011/2010 2011/2010
Total 76,500 83,909 7,409 9.7
January 5,735 6,343 608 10.6
February 6,004 7,145 1,141 19.0
March 6,277 8,231 1,954 31.1
April 6,097 7,355 1,258 20.6
May 6,182 7,188 1,006 16.3
June 5,861 6,704 843 14.4
July 7,309 7,120 -189 -2.6
August 7,209 6,172 -1,037 -14.4
September 6,723 6,091 -632 -9.4
October 7,319 7,533 214 2.9
November 6,449 7,500 1,051 16.3
December 5,335 6,527 1,192 22.3
* Contraventions exclude those which are not related to transport
3.39. Contraventions* issued by the Police: monthly
Year
Month
Chart 3.7. Contraventions issued by the Police: monthly
0
1,000
2,000
3,000
4,000
5,000
6,000
7,000
8,000
9,000
Jan Feb Mar Apr May Jun Jul Aug Sep Oct Nov Dec
2010 2011
127
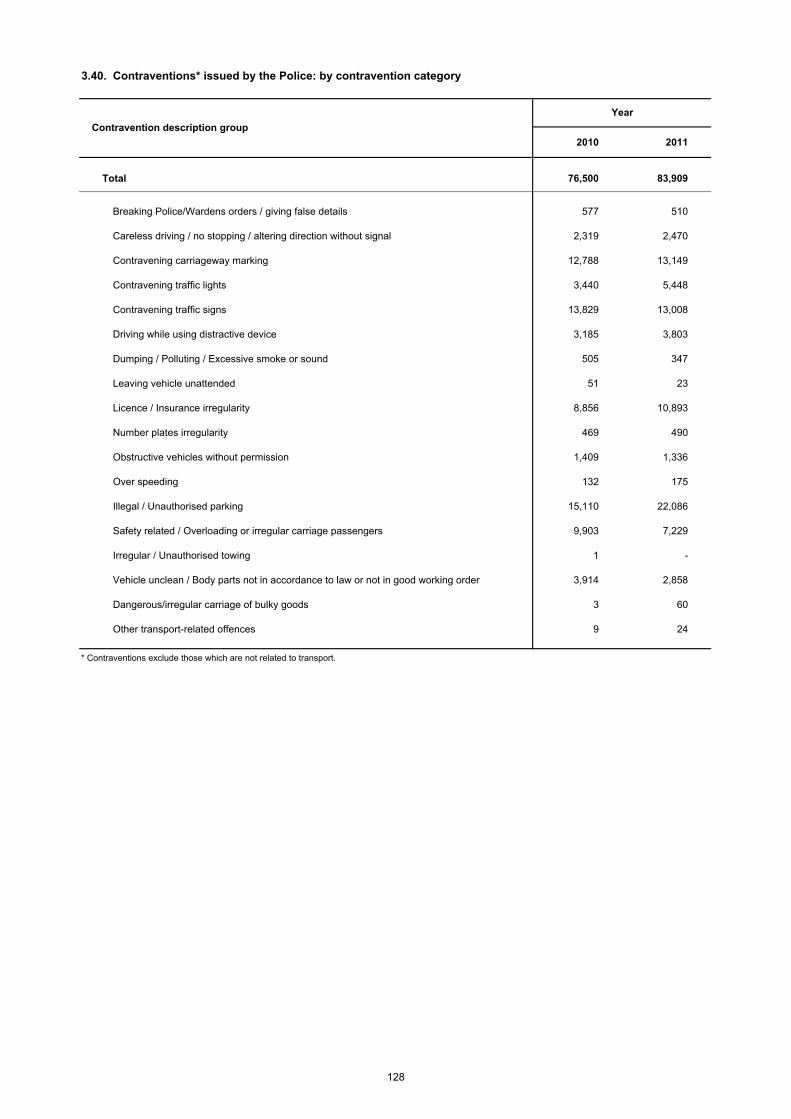
2010 2011
Total 76,500 83,909
Breaking Police/Wardens orders / giving false details 577 510
Careless driving / no stopping / altering direction without signal 2,319 2,470
Contravening carriageway marking 12,788 13,149
Contravening traffic lights 3,440 5,448
Contravening traffic signs 13,829 13,008
Driving while using distractive device 3,185 3,803
Dumping / Polluting / Excessive smoke or sound 505 347
Leaving vehicle unattended 51 23
Licence / Insurance irregularity 8,856 10,893
Number plates irregularity 469 490
Obstructive vehicles without permission 1,409 1,336
Over speeding 132 175
Illegal / Unauthorised parking 15,110 22,086
Safety related / Overloading or irregular carriage passengers 9,903 7,229
Irregular / Unauthorised towing 1 -
Vehicle unclean / Body parts not in accordance to law or not in good working order 3,914 2,858
Dangerous/irregular carriage of bulky goods 3 60
Other transport-related offences 9 24
* Contraventions exclude those which are not related to transport.
Contravention description group
Year
3.40. Contraventions* issued by the Police: by contravention category
128
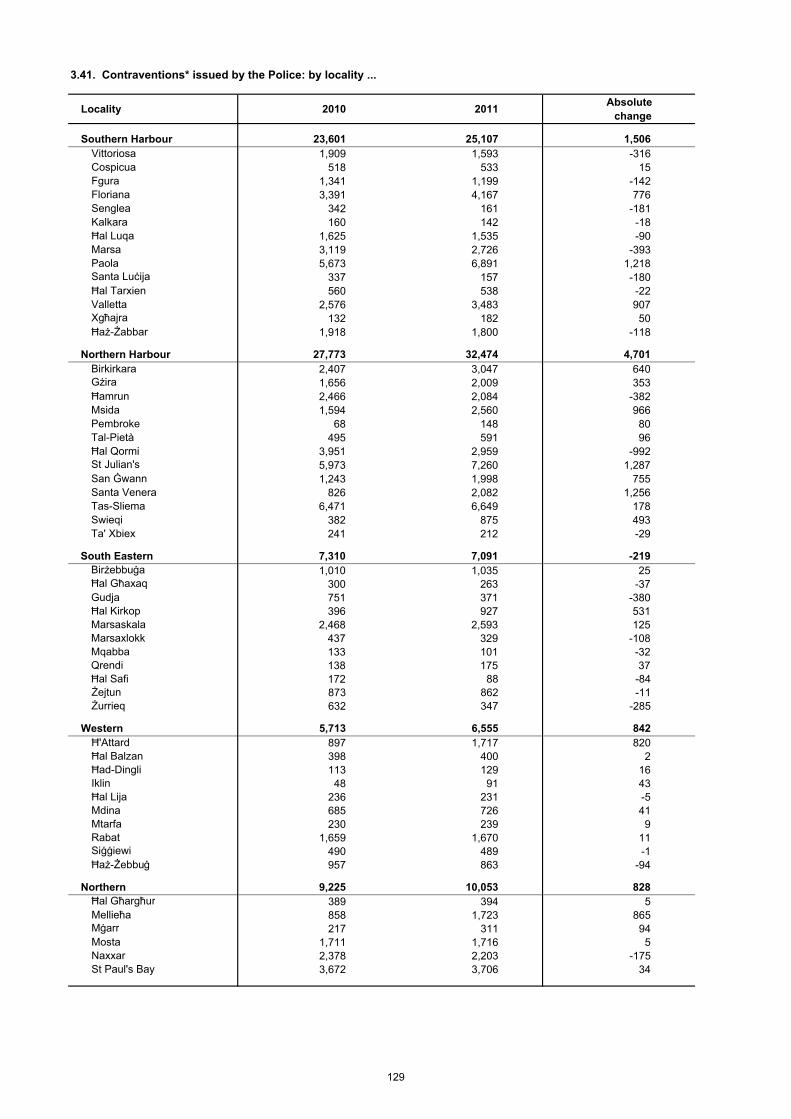
Locality 2010 2011Absolute
change
Southern Harbour 23,601 25,107 1,506Vittoriosa 1,909 1,593 -316Cospicua 518 533 15Fgura 1,341 1,199 -142Floriana 3,391 4,167 776Senglea 342 161 -181Kalkara 160 142 -18Ħal Luqa 1,625 1,535 -90Marsa 3,119 2,726 -393Paola 5,673 6,891 1,218Santa Luċija 337 157 -180Ħal Tarxien 560 538 -22Valletta 2,576 3,483 907Xgħajra 132 182 50Ħaż-Żabbar 1,918 1,800 -118
Northern Harbour 27,773 32,474 4,701Birkirkara 2,407 3,047 640Gżira 1,656 2,009 353Ħamrun 2,466 2,084 -382Msida 1,594 2,560 966Pembroke 68 148 80Tal-Pietà 495 591 96Ħal Qormi 3,951 2,959 -992St Julian's 5,973 7,260 1,287San Ġwann 1,243 1,998 755Santa Venera 826 2,082 1,256Tas-Sliema 6,471 6,649 178Swieqi 382 875 493Ta' Xbiex 241 212 -29
South Eastern 7,310 7,091 -219Birżebbuġa 1,010 1,035 25Ħal Għaxaq 300 263 -37Gudja 751 371 -380Ħal Kirkop 396 927 531Marsaskala 2,468 2,593 125Marsaxlokk 437 329 -108Mqabba 133 101 -32Qrendi 138 175 37Ħal Safi 172 88 -84Żejtun 873 862 -11Żurrieq 632 347 -285
Western 5,713 6,555 842Ħ'Attard 897 1,717 820Ħal Balzan 398 400 2Ħad-Dingli 113 129 16Iklin 48 91 43Ħal Lija 236 231 -5Mdina 685 726 41Mtarfa 230 239 9Rabat 1,659 1,670 11Siġġiewi 490 489 -1Ħaż-Żebbuġ 957 863 -94
Northern 9,225 10,053 828Ħal Għargħur 389 394 5Mellieħa 858 1,723 865Mġarr 217 311 94Mosta 1,711 1,716 5Naxxar 2,378 2,203 -175St Paul's Bay 3,672 3,706 34
3.41. Contraventions* issued by the Police: by locality ...
129
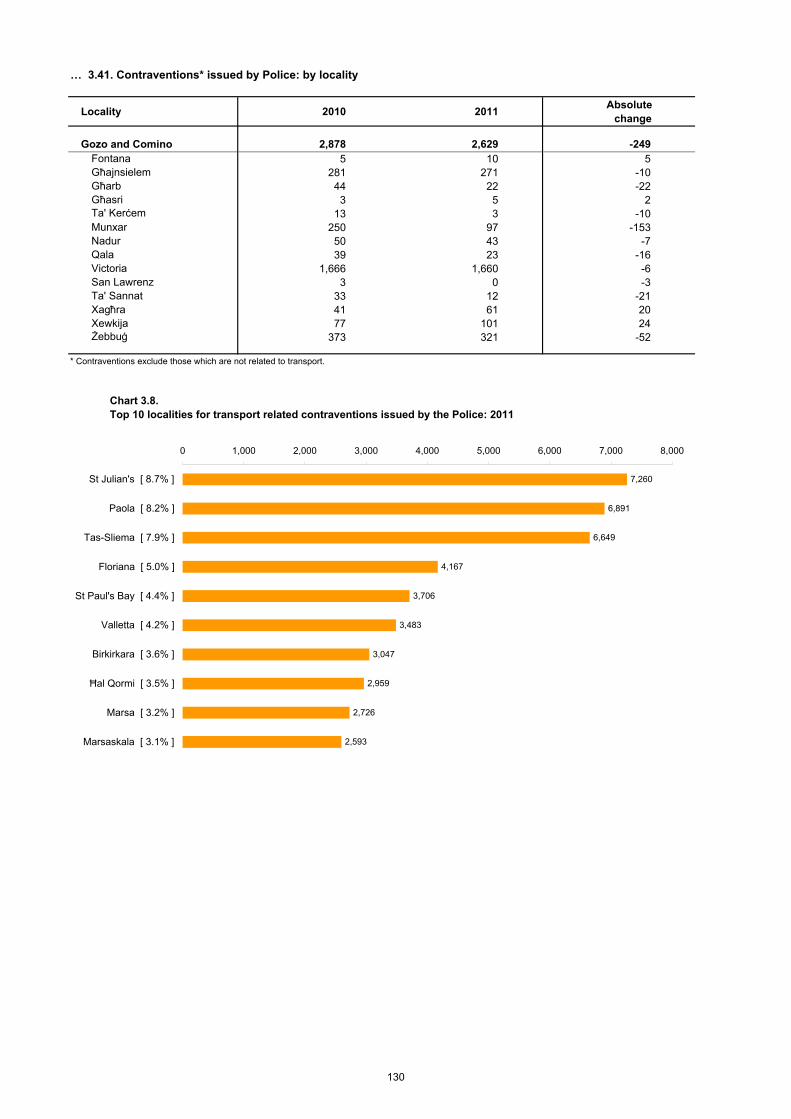
Locality 2010 2011Absolute
change
Gozo and Comino 2,878 2,629 -249Fontana 5 10 5Għajnsielem 281 271 -10Għarb 44 22 -22Għasri 3 5 2Ta' Kerċem 13 3 -10Munxar 250 97 -153Nadur 50 43 -7Qala 39 23 -16Victoria 1,666 1,660 -6San Lawrenz 3 0 -3Ta' Sannat 33 12 -21Xagħra 41 61 20Xewkija 77 101 24Żebbuġ 373 321 -52
* Contraventions exclude those which are not related to transport.
… 3.41. Contraventions* issued by Police: by locality
Chart 3.8. Top 10 localities for transport related contraventions issued by the Police: 2011
7,260
6,891
6,649
4,167
3,706
3,483
3,047
2,959
2,726
2,593
0 1,000 2,000 3,000 4,000 5,000 6,000 7,000 8,000
St Julian's [ 8.7% ]
Paola [ 8.2% ]
Tas-Sliema [ 7.9% ]
Floriana [ 5.0% ]
St Paul's Bay [ 4.4% ]
Valletta [ 4.2% ]
Birkirkara [ 3.6% ]
Ħal Qormi [ 3.5% ]
Marsa [ 3.2% ]
Marsaskala [ 3.1% ]
130
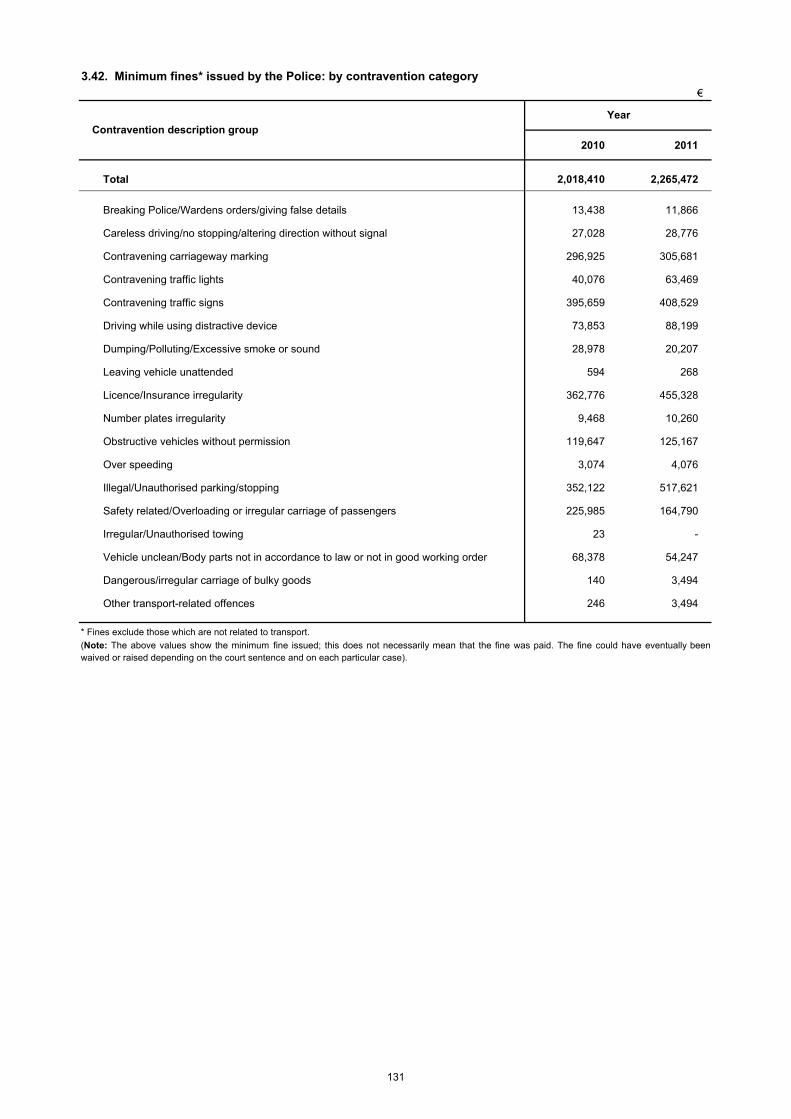
€
2010 2011
Total 2,018,410 2,265,472
Breaking Police/Wardens orders/giving false details 13,438 11,866
Careless driving/no stopping/altering direction without signal 27,028 28,776
Contravening carriageway marking 296,925 305,681
Contravening traffic lights 40,076 63,469
Contravening traffic signs 395,659 408,529
Driving while using distractive device 73,853 88,199
Dumping/Polluting/Excessive smoke or sound 28,978 20,207
Leaving vehicle unattended 594 268
Licence/Insurance irregularity 362,776 455,328
Number plates irregularity 9,468 10,260
Obstructive vehicles without permission 119,647 125,167
Over speeding 3,074 4,076
Illegal/Unauthorised parking/stopping 352,122 517,621
Safety related/Overloading or irregular carriage of passengers 225,985 164,790
Irregular/Unauthorised towing 23 -
Vehicle unclean/Body parts not in accordance to law or not in good working order 68,378 54,247
Dangerous/irregular carriage of bulky goods 140 3,494
Other transport-related offences 246 3,494
* Fines exclude those which are not related to transport.
(Note: The above values show the minimum fine issued; this does not necessarily mean that the fine was paid. The fine could have eventually beenwaived or raised depending on the court sentence and on each particular case).
Contravention description groupYear
3.42. Minimum fines* issued by the Police: by contravention category
131
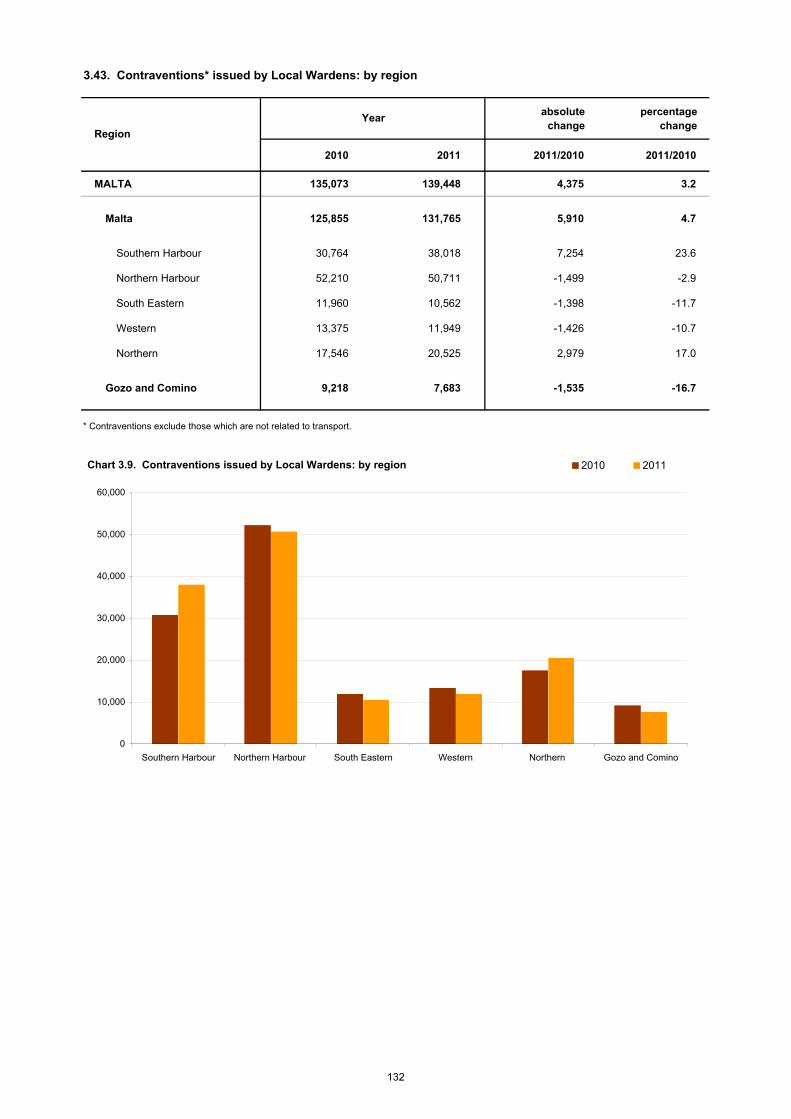
absolute change
percentage change
2010 2011 2011/2010 2011/2010
MALTA 135,073 139,448 4,375 3.2
Malta 125,855 131,765 5,910 4.7
Southern Harbour 30,764 38,018 7,254 23.6
Northern Harbour 52,210 50,711 -1,499 -2.9
South Eastern 11,960 10,562 -1,398 -11.7
Western 13,375 11,949 -1,426 -10.7
Northern 17,546 20,525 2,979 17.0
Gozo and Comino 9,218 7,683 -1,535 -16.7
* Contraventions exclude those which are not related to transport.
3.43. Contraventions* issued by Local Wardens: by region
Year
Region
Chart 3.9. Contraventions issued by Local Wardens: by region
0
10,000
20,000
30,000
40,000
50,000
60,000
Southern Harbour Northern Harbour South Eastern Western Northern Gozo and Comino
2010 2011
132
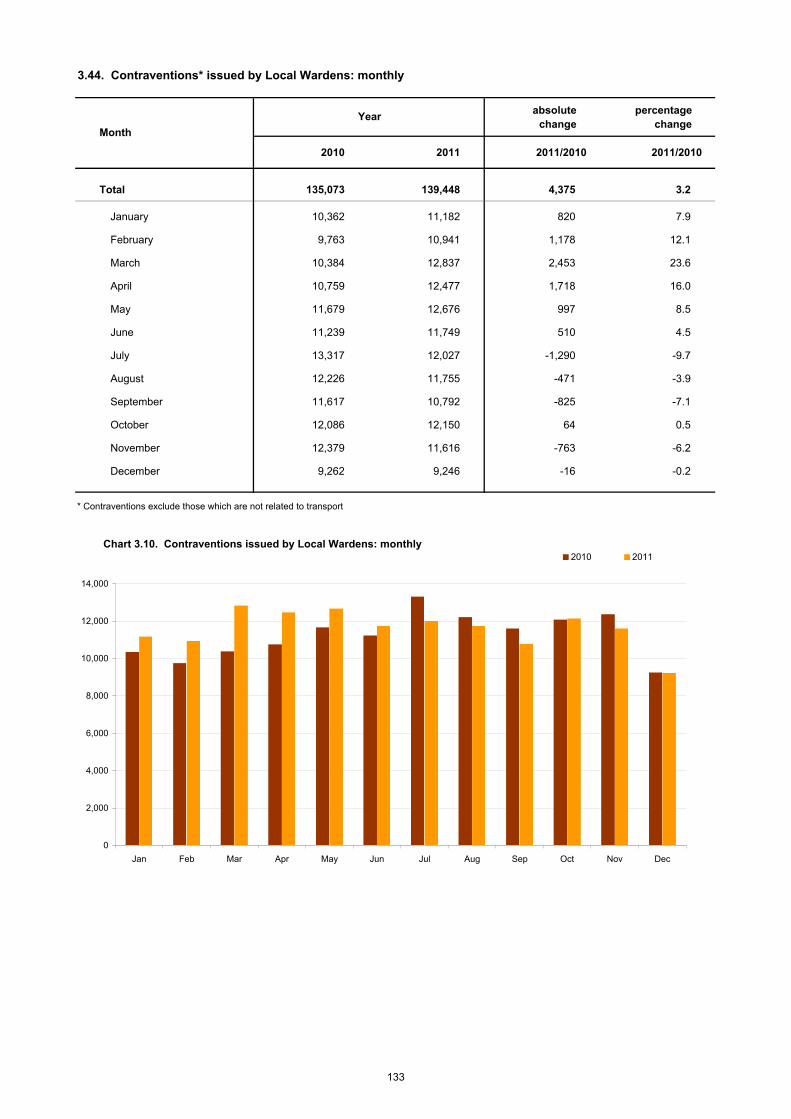
absolute change
percentage change
2010 2011 2011/2010 2011/2010
Total 135,073 139,448 4,375 3.2
January 10,362 11,182 820 7.9
February 9,763 10,941 1,178 12.1
March 10,384 12,837 2,453 23.6
April 10,759 12,477 1,718 16.0
May 11,679 12,676 997 8.5
June 11,239 11,749 510 4.5
July 13,317 12,027 -1,290 -9.7
August 12,226 11,755 -471 -3.9
September 11,617 10,792 -825 -7.1
October 12,086 12,150 64 0.5
November 12,379 11,616 -763 -6.2
December 9,262 9,246 -16 -0.2
* Contraventions exclude those which are not related to transport
3.44. Contraventions* issued by Local Wardens: monthly
Year
Month
Chart 3.10. Contraventions issued by Local Wardens: monthly
0
2,000
4,000
6,000
8,000
10,000
12,000
14,000
Jan Feb Mar Apr May Jun Jul Aug Sep Oct Nov Dec
2010 2011
133
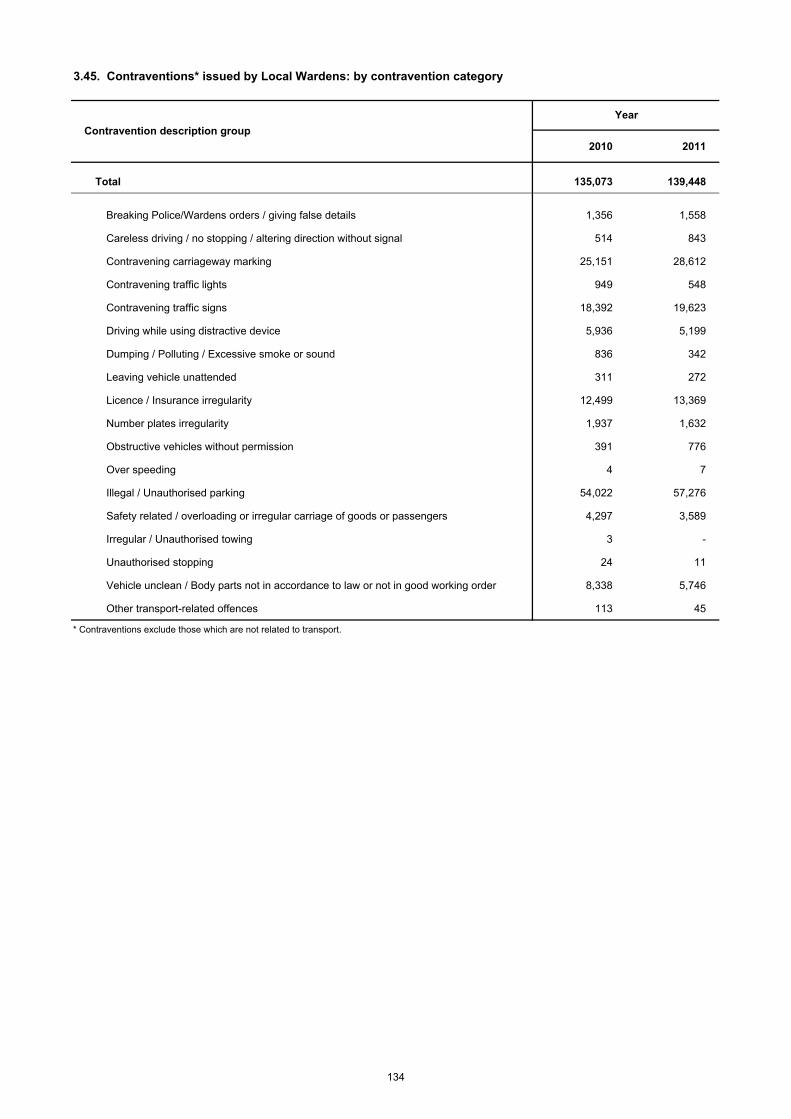
2010 2011
Total 135,073 139,448
Breaking Police/Wardens orders / giving false details 1,356 1,558
Careless driving / no stopping / altering direction without signal 514 843
Contravening carriageway marking 25,151 28,612
Contravening traffic lights 949 548
Contravening traffic signs 18,392 19,623
Driving while using distractive device 5,936 5,199
Dumping / Polluting / Excessive smoke or sound 836 342
Leaving vehicle unattended 311 272
Licence / Insurance irregularity 12,499 13,369
Number plates irregularity 1,937 1,632
Obstructive vehicles without permission 391 776
Over speeding 4 7
Illegal / Unauthorised parking 54,022 57,276
Safety related / overloading or irregular carriage of goods or passengers 4,297 3,589
Irregular / Unauthorised towing 3 -
Unauthorised stopping 24 11
Vehicle unclean / Body parts not in accordance to law or not in good working order 8,338 5,746
Other transport-related offences 113 45
* Contraventions exclude those which are not related to transport.
Contravention description group
Year
3.45. Contraventions* issued by Local Wardens: by contravention category
134
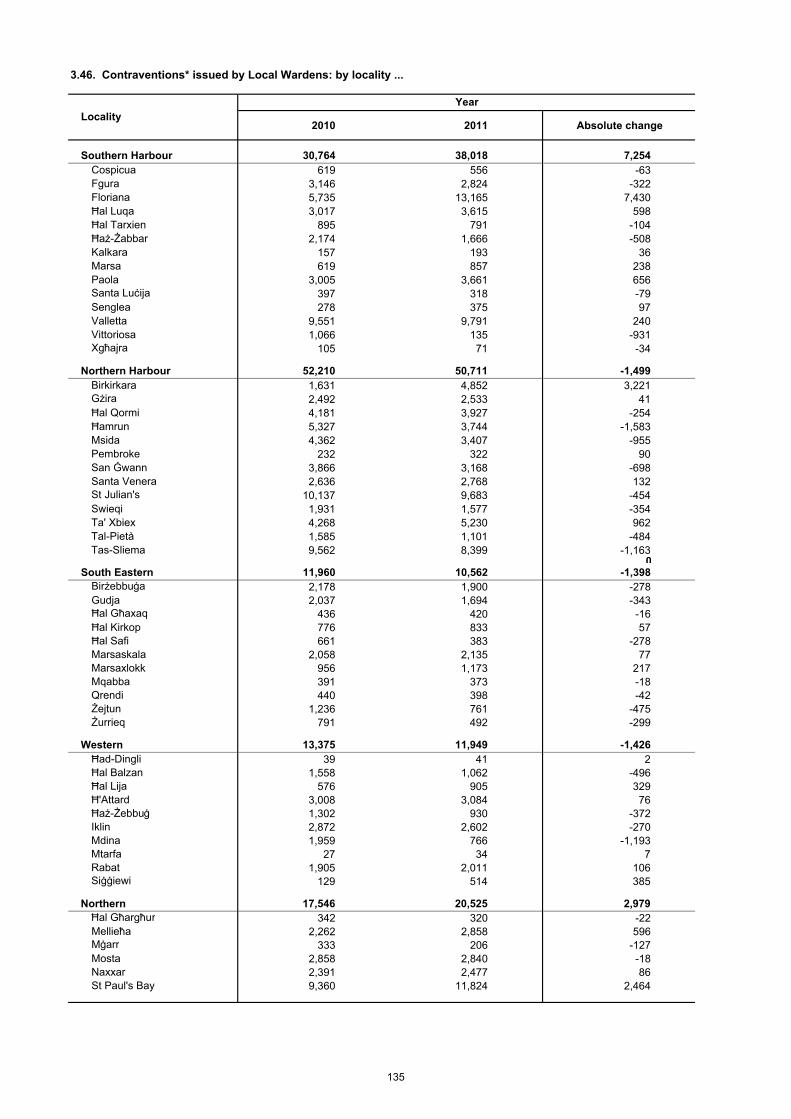
2010 2011 Absolute change
Southern Harbour 30,764 38,018 7,254Cospicua 619 556 -63Fgura 3,146 2,824 -322Floriana 5,735 13,165 7,430Ħal Luqa 3,017 3,615 598Ħal Tarxien 895 791 -104Ħaż-Żabbar 2,174 1,666 -508Kalkara 157 193 36Marsa 619 857 238Paola 3,005 3,661 656Santa Luċija 397 318 -79Senglea 278 375 97Valletta 9,551 9,791 240Vittoriosa 1,066 135 -931Xgħajra 105 71 -34
Northern Harbour 52,210 50,711 -1,499Birkirkara 1,631 4,852 3,221Gżira 2,492 2,533 41Ħal Qormi 4,181 3,927 -254Ħamrun 5,327 3,744 -1,583Msida 4,362 3,407 -955Pembroke 232 322 90San Ġwann 3,866 3,168 -698Santa Venera 2,636 2,768 132St Julian's 10,137 9,683 -454Swieqi 1,931 1,577 -354Ta' Xbiex 4,268 5,230 962Tal-Pietà 1,585 1,101 -484Tas-Sliema 9,562 8,399 -1,163
0South Eastern 11,960 10,562 -1,398
Birżebbuġa 2,178 1,900 -278Gudja 2,037 1,694 -343Ħal Għaxaq 436 420 -16Ħal Kirkop 776 833 57Ħal Safi 661 383 -278Marsaskala 2,058 2,135 77Marsaxlokk 956 1,173 217Mqabba 391 373 -18Qrendi 440 398 -42Żejtun 1,236 761 -475Żurrieq 791 492 -299
Western 13,375 11,949 -1,426Ħad-Dingli 39 41 2Ħal Balzan 1,558 1,062 -496Ħal Lija 576 905 329Ħ'Attard 3,008 3,084 76Ħaż-Żebbuġ 1,302 930 -372Iklin 2,872 2,602 -270Mdina 1,959 766 -1,193Mtarfa 27 34 7Rabat 1,905 2,011 106Siġġiewi 129 514 385
Northern 17,546 20,525 2,979Ħal Għargħur 342 320 -22Mellieħa 2,262 2,858 596Mġarr 333 206 -127Mosta 2,858 2,840 -18Naxxar 2,391 2,477 86St Paul's Bay 9,360 11,824 2,464
3.46. Contraventions* issued by Local Wardens: by locality ...
LocalityYear
135

2010 2011 Absolute change
Gozo and Comino 9,218 7,683 -1,535Fontana 113 162 49Għajnsielem 838 1,097 259Għarb 20 3 -17Għasri 9 1 -8Munxar 176 366 190Nadur 260 247 -13Qala 26 8 -18San Lawrenz 5 4 -1Ta' Kerċem 15 6 -9Ta' Sannat 55 50 -5Victoria 4,657 3,855 -802Xagħra 170 96 -74Xewkija 1,439 879 -560Żebbuġ 1,435 909 -526
* Localities are grouped under main Local Councils
LocalityYear
... 3.46. Contraventions* issued by Local Wardens: by locality
Chart 3.11.Top 10 localities for transport related contraventions issued by Local Wardens: 2011
13,165
11,824
9,791
9,683
8,399
5,230
4,852
3,927
3,855
3,744
0 2,000 4,000 6,000 8,000 10,000 12,000 14,000
Floriana [ 9.4% ]
St Paul's Bay [ 8.5% ]
Valletta [ 7.0% ]
St Julian's [ 6.9% ]
Tas-Sliema [ 6.0% ]
Ta' Xbiex [ 3.8% ]
Birkirkara [ 3.5% ]
Ħal Qormi [ 2.8% ]
Victoria [ 2.8% ]
Ħamrun [ 2.7% ]
136
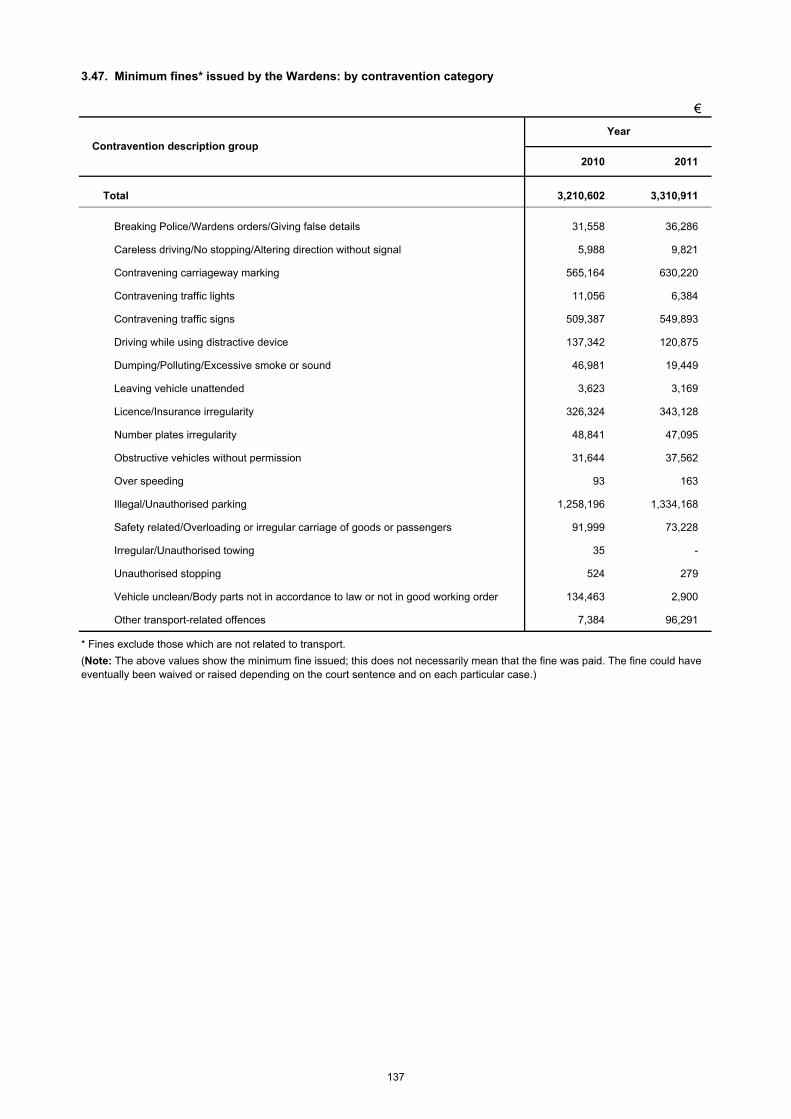
€
2010 2011
Total 3,210,602 3,310,911
Breaking Police/Wardens orders/Giving false details 31,558 36,286
Careless driving/No stopping/Altering direction without signal 5,988 9,821
Contravening carriageway marking 565,164 630,220
Contravening traffic lights 11,056 6,384
Contravening traffic signs 509,387 549,893
Driving while using distractive device 137,342 120,875
Dumping/Polluting/Excessive smoke or sound 46,981 19,449
Leaving vehicle unattended 3,623 3,169
Licence/Insurance irregularity 326,324 343,128
Number plates irregularity 48,841 47,095
Obstructive vehicles without permission 31,644 37,562
Over speeding 93 163
Illegal/Unauthorised parking 1,258,196 1,334,168
Safety related/Overloading or irregular carriage of goods or passengers 91,999 73,228
Irregular/Unauthorised towing 35 -
Unauthorised stopping 524 279
Vehicle unclean/Body parts not in accordance to law or not in good working order 134,463 2,900
Other transport-related offences 7,384 96,291
* Fines exclude those which are not related to transport.
(Note: The above values show the minimum fine issued; this does not necessarily mean that the fine was paid. The fine could have eventually been waived or raised depending on the court sentence and on each particular case.)
Contravention description groupYear
3.47. Minimum fines* issued by the Wardens: by contravention category
137
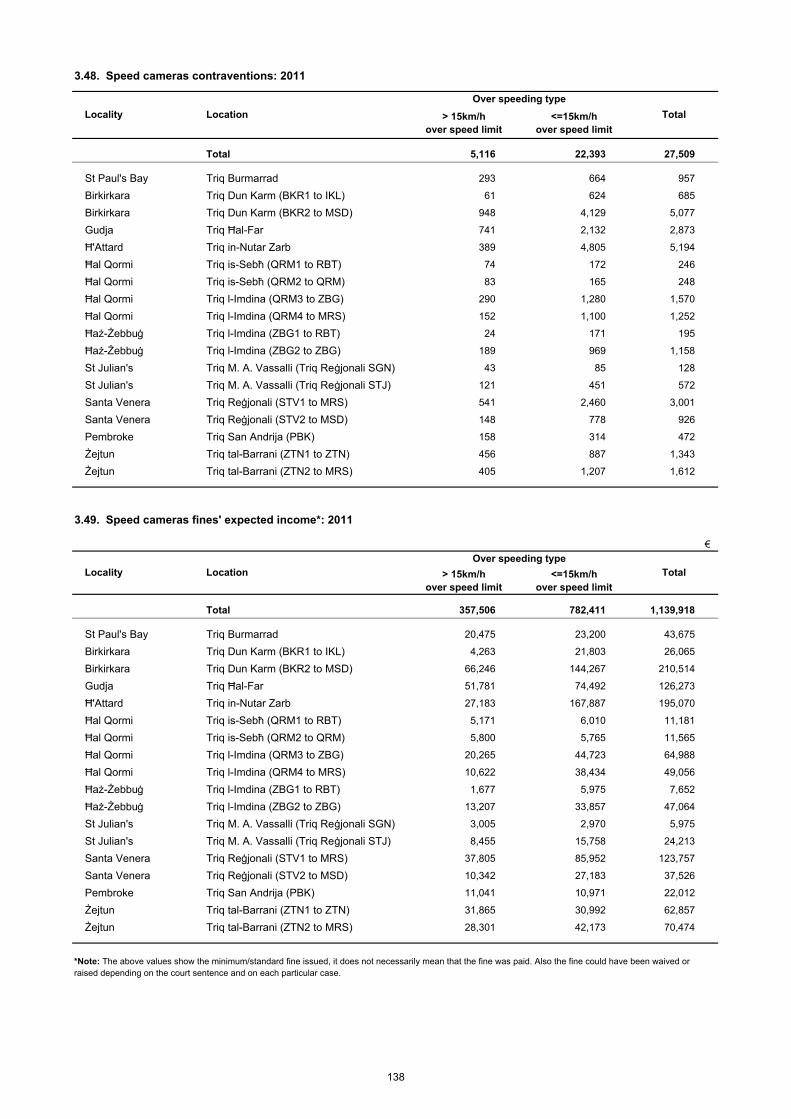
3.48. Speed cameras contraventions: 2011
> 15km/h over speed limit
<=15km/h over speed limit
Total 5,116 22,393 27,509
St Paul's Bay Triq Burmarrad 293 664 957
Birkirkara Triq Dun Karm (BKR1 to IKL) 61 624 685
Birkirkara Triq Dun Karm (BKR2 to MSD) 948 4,129 5,077
Gudja Triq Ħal-Far 741 2,132 2,873
Ħ'Attard Triq in-Nutar Zarb 389 4,805 5,194
Ħal Qormi Triq is-Sebħ (QRM1 to RBT) 74 172 246
Ħal Qormi Triq is-Sebħ (QRM2 to QRM) 83 165 248
Ħal Qormi Triq l-Imdina (QRM3 to ZBG) 290 1,280 1,570
Ħal Qormi Triq l-Imdina (QRM4 to MRS) 152 1,100 1,252
Ħaż-Żebbuġ Triq l-Imdina (ZBG1 to RBT) 24 171 195
Ħaż-Żebbuġ Triq l-Imdina (ZBG2 to ZBG) 189 969 1,158
St Julian's Triq M. A. Vassalli (Triq Reġjonali SGN) 43 85 128
St Julian's Triq M. A. Vassalli (Triq Reġjonali STJ) 121 451 572
Santa Venera Triq Reġjonali (STV1 to MRS) 541 2,460 3,001
Santa Venera Triq Reġjonali (STV2 to MSD) 148 778 926
Pembroke Triq San Andrija (PBK) 158 314 472
Żejtun Triq tal-Barrani (ZTN1 to ZTN) 456 887 1,343
Żejtun Triq tal-Barrani (ZTN2 to MRS) 405 1,207 1,612
3.49. Speed cameras fines' expected income*: 2011
€
> 15km/h over speed limit
<=15km/h over speed limit
Total 357,506 782,411 1,139,918
St Paul's Bay Triq Burmarrad 20,475 23,200 43,675
Birkirkara Triq Dun Karm (BKR1 to IKL) 4,263 21,803 26,065
Birkirkara Triq Dun Karm (BKR2 to MSD) 66,246 144,267 210,514
Gudja Triq Ħal-Far 51,781 74,492 126,273
Ħ'Attard Triq in-Nutar Zarb 27,183 167,887 195,070
Ħal Qormi Triq is-Sebħ (QRM1 to RBT) 5,171 6,010 11,181
Ħal Qormi Triq is-Sebħ (QRM2 to QRM) 5,800 5,765 11,565
Ħal Qormi Triq l-Imdina (QRM3 to ZBG) 20,265 44,723 64,988
Ħal Qormi Triq l-Imdina (QRM4 to MRS) 10,622 38,434 49,056
Ħaż-Żebbuġ Triq l-Imdina (ZBG1 to RBT) 1,677 5,975 7,652
Ħaż-Żebbuġ Triq l-Imdina (ZBG2 to ZBG) 13,207 33,857 47,064
St Julian's Triq M. A. Vassalli (Triq Reġjonali SGN) 3,005 2,970 5,975
St Julian's Triq M. A. Vassalli (Triq Reġjonali STJ) 8,455 15,758 24,213
Santa Venera Triq Reġjonali (STV1 to MRS) 37,805 85,952 123,757
Santa Venera Triq Reġjonali (STV2 to MSD) 10,342 27,183 37,526
Pembroke Triq San Andrija (PBK) 11,041 10,971 22,012
Żejtun Triq tal-Barrani (ZTN1 to ZTN) 31,865 30,992 62,857
Żejtun Triq tal-Barrani (ZTN2 to MRS) 28,301 42,173 70,474
*Note: The above values show the minimum/standard fine issued, it does not necessarily mean that the fine was paid. Also the fine could have been waived or raised depending on the court sentence and on each particular case.
Locality LocationOver speeding type
Total
Locality Location Total
Over speeding type
138
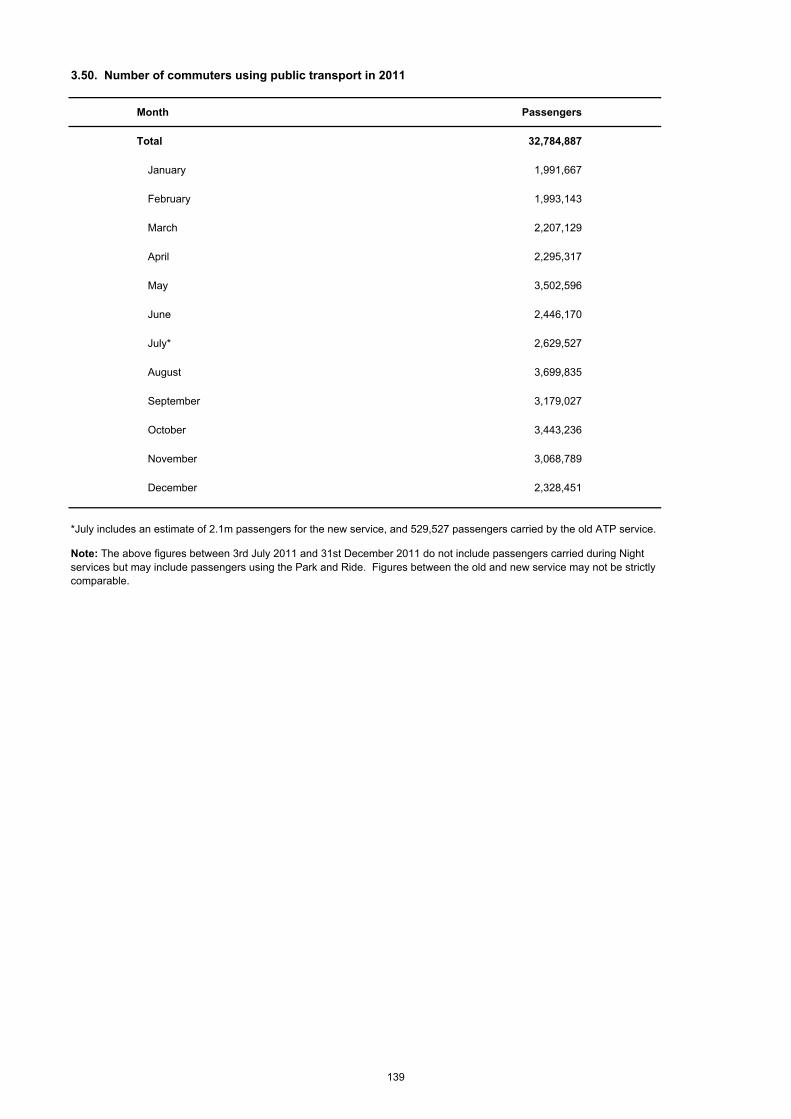
3.50. Number of commuters using public transport in 2011
Month Passengers
Total 32,784,887
January 1,991,667
February 1,993,143
March 2,207,129
April 2,295,317
May 3,502,596
June 2,446,170
July* 2,629,527
August 3,699,835
September 3,179,027
October 3,443,236
November 3,068,789
December 2,328,451
*July includes an estimate of 2.1m passengers for the new service, and 529,527 passengers carried by the old ATP service.
Note: The above figures between 3rd July 2011 and 31st December 2011 do not include passengers carried during Night services but may include passengers using the Park and Ride. Figures between the old and new service may not be strictly comparable.
139
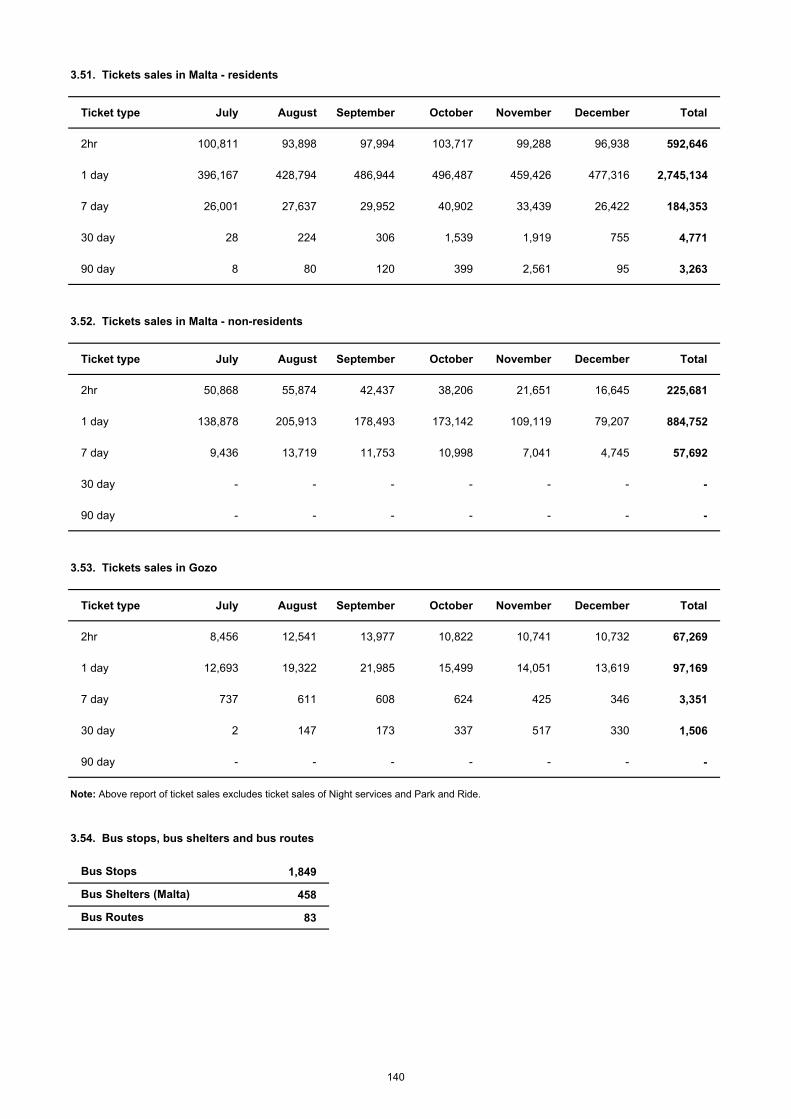
3.51. Tickets sales in Malta - residents
Ticket type July August September October November December Total
2hr 100,811 93,898 97,994 103,717 99,288 96,938 592,646
1 day 396,167 428,794 486,944 496,487 459,426 477,316 2,745,134
7 day 26,001 27,637 29,952 40,902 33,439 26,422 184,353
30 day 28 224 306 1,539 1,919 755 4,771
90 day 8 80 120 399 2,561 95 3,263
3.52. Tickets sales in Malta - non-residents
Ticket type July August September October November December Total
2hr 50,868 55,874 42,437 38,206 21,651 16,645 225,681
1 day 138,878 205,913 178,493 173,142 109,119 79,207 884,752
7 day 9,436 13,719 11,753 10,998 7,041 4,745 57,692
30 day - - - - - - -
90 day - - - - - - -
3.53. Tickets sales in Gozo
Ticket type July August September October November December Total
2hr 8,456 12,541 13,977 10,822 10,741 10,732 67,269
1 day 12,693 19,322 21,985 15,499 14,051 13,619 97,169
7 day 737 611 608 624 425 346 3,351
30 day 2 147 173 337 517 330 1,506
90 day - - - - - - -
Note: Above report of ticket sales excludes ticket sales of Night services and Park and Ride.
3.54. Bus stops, bus shelters and bus routes
1,849
458
83
Bus Stops
Bus Routes
Bus Shelters (Malta)
140
TRANSPORT ACCOUNTS

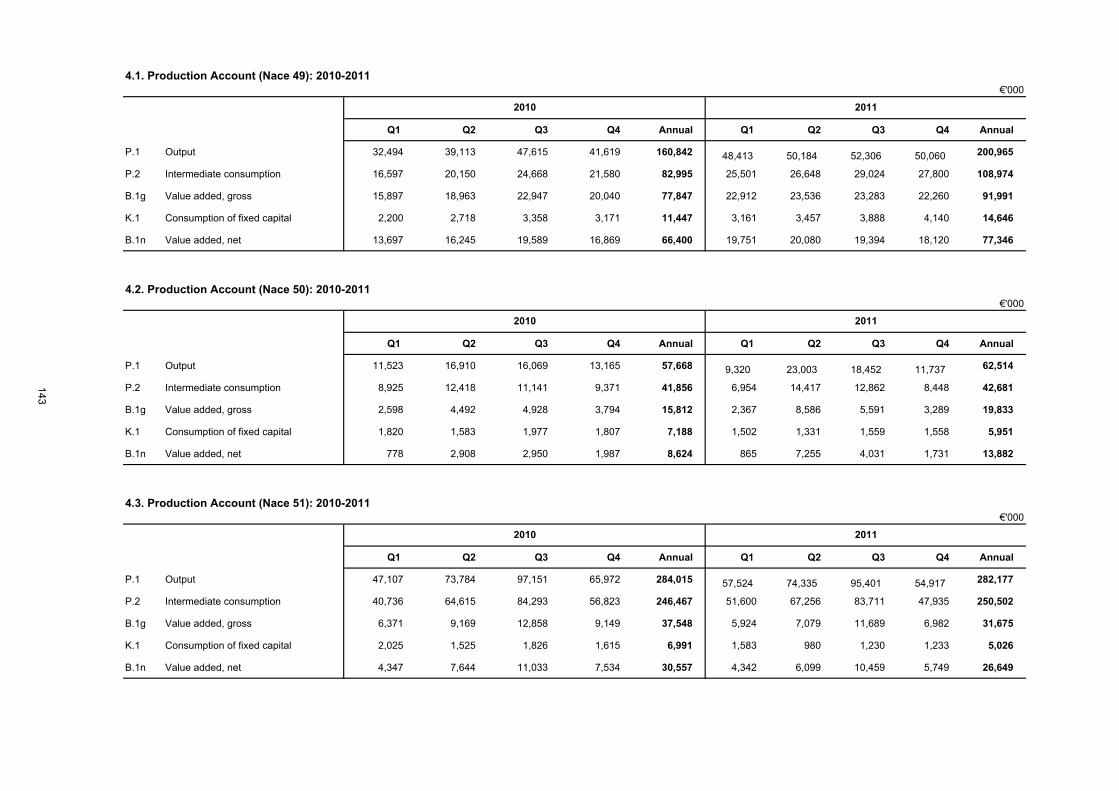
4.1. Production Account (Nace 49): 2010-2011
Q1 Q2 Q3 Q4 Annual Q1 Q2 Q3 Q4 Annual
P.1 Output 32,494 39,113 47,615 41,619 160,842 48,413 50,184 52,306 50,060 200,965
P.2 Intermediate consumption 16,597 20,150 24,668 21,580 82,995 25,501 26,648 29,024 27,800 108,974
B.1g Value added, gross 15,897 18,963 22,947 20,040 77,847 22,912 23,536 23,283 22,260 91,991
K.1 Consumption of fixed capital 2,200 2,718 3,358 3,171 11,447 3,161 3,457 3,888 4,140 14,646
B.1n Value added, net 13,697 16,245 19,589 16,869 66,400 19,751 20,080 19,394 18,120 77,346
4.2. Production Account (Nace 50): 2010-2011
Q1 Q2 Q3 Q4 Annual Q1 Q2 Q3 Q4 Annual
P.1 Output 11,523 16,910 16,069 13,165 57,668 9,320 23,003 18,452 11,737 62,514
P.2 Intermediate consumption 8,925 12,418 11,141 9,371 41,856 6,954 14,417 12,862 8,448 42,681
B.1g Value added, gross 2,598 4,492 4,928 3,794 15,812 2,367 8,586 5,591 3,289 19,833
K.1 Consumption of fixed capital 1,820 1,583 1,977 1,807 7,188 1,502 1,331 1,559 1,558 5,951
B.1n Value added, net 778 2,908 2,950 1,987 8,624 865 7,255 4,031 1,731 13,882
4.3. Production Account (Nace 51): 2010-2011
Q1 Q2 Q3 Q4 Annual Q1 Q2 Q3 Q4 Annual
P.1 Output 47,107 73,784 97,151 65,972 284,015 57,524 74,335 95,401 54,917 282,177
P.2 Intermediate consumption 40,736 64,615 84,293 56,823 246,467 51,600 67,256 83,711 47,935 250,502
B.1g Value added, gross 6,371 9,169 12,858 9,149 37,548 5,924 7,079 11,689 6,982 31,675
K.1 Consumption of fixed capital 2,025 1,525 1,826 1,615 6,991 1,583 980 1,230 1,233 5,026
B.1n Value added, net 4,347 7,644 11,033 7,534 30,557 4,342 6,099 10,459 5,749 26,649
2010
2011
€'000
2011
€'000
2010
2011
€'000
2010
143
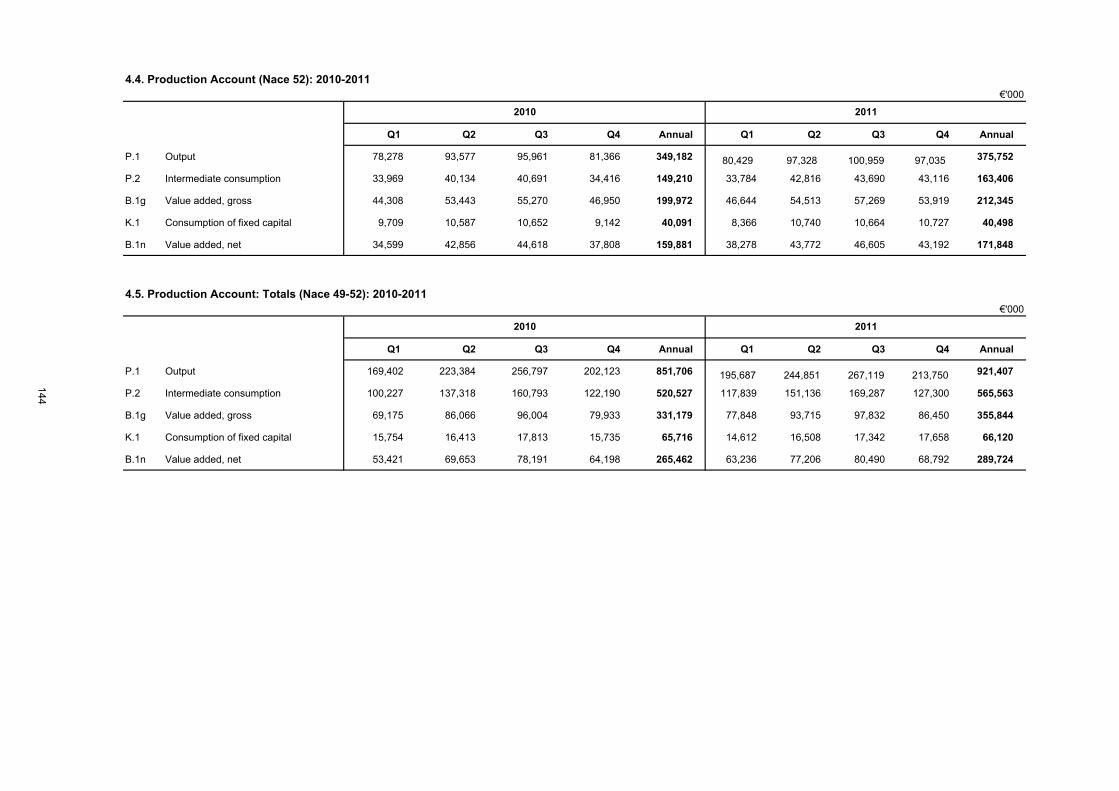
4.4. Production Account (Nace 52): 2010-2011
Q1 Q2 Q3 Q4 Annual Q1 Q2 Q3 Q4 Annual
P.1 Output 78,278 93,577 95,961 81,366 349,182 80,429 97,328 100,959 97,035 375,752
P.2 Intermediate consumption 33,969 40,134 40,691 34,416 149,210 33,784 42,816 43,690 43,116 163,406
B.1g Value added, gross 44,308 53,443 55,270 46,950 199,972 46,644 54,513 57,269 53,919 212,345
K.1 Consumption of fixed capital 9,709 10,587 10,652 9,142 40,091 8,366 10,740 10,664 10,727 40,498
B.1n Value added, net 34,599 42,856 44,618 37,808 159,881 38,278 43,772 46,605 43,192 171,848
4.5. Production Account: Totals (Nace 49-52): 2010-2011
Q1 Q2 Q3 Q4 Annual Q1 Q2 Q3 Q4 Annual
P.1 Output 169,402 223,384 256,797 202,123 851,706 195,687 244,851 267,119 213,750 921,407
P.2 Intermediate consumption 100,227 137,318 160,793 122,190 520,527 117,839 151,136 169,287 127,300 565,563
B.1g Value added, gross 69,175 86,066 96,004 79,933 331,179 77,848 93,715 97,832 86,450 355,844
K.1 Consumption of fixed capital 15,754 16,413 17,813 15,735 65,716 14,612 16,508 17,342 17,658 66,120
B.1n Value added, net 53,421 69,653 78,191 64,198 265,462 63,236 77,206 80,490 68,792 289,724
2011
2011
€'000
€'000
2010
2010
144
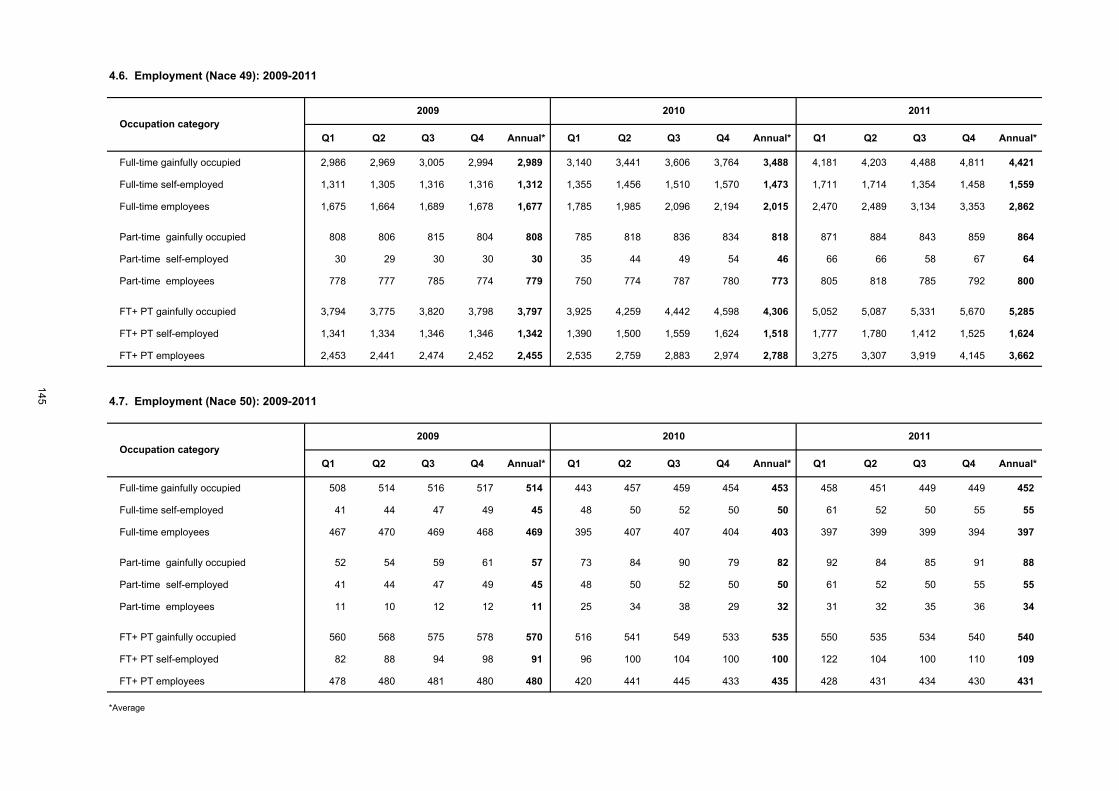
4.6. Employment (Nace 49): 2009-2011
Q1 Q2 Q3 Q4 Annual* Q1 Q2 Q3 Q4 Annual* Q1 Q2 Q3 Q4 Annual*
Full-time gainfully occupied 2,986 2,969 3,005 2,994 2,989 3,140 3,441 3,606 3,764 3,488 4,181 4,203 4,488 4,811 4,421
Full-time self-employed 1,311 1,305 1,316 1,316 1,312 1,355 1,456 1,510 1,570 1,473 1,711 1,714 1,354 1,458 1,559
Full-time employees 1,675 1,664 1,689 1,678 1,677 1,785 1,985 2,096 2,194 2,015 2,470 2,489 3,134 3,353 2,862
Part-time gainfully occupied 808 806 815 804 808 785 818 836 834 818 871 884 843 859 864
Part-time self-employed 30 29 30 30 30 35 44 49 54 46 66 66 58 67 64
Part-time employees 778 777 785 774 779 750 774 787 780 773 805 818 785 792 800
FT+ PT gainfully occupied 3,794 3,775 3,820 3,798 3,797 3,925 4,259 4,442 4,598 4,306 5,052 5,087 5,331 5,670 5,285
FT+ PT self-employed 1,341 1,334 1,346 1,346 1,342 1,390 1,500 1,559 1,624 1,518 1,777 1,780 1,412 1,525 1,624
FT+ PT employees 2,453 2,441 2,474 2,452 2,455 2,535 2,759 2,883 2,974 2,788 3,275 3,307 3,919 4,145 3,662
4.7. Employment (Nace 50): 2009-2011
Q1 Q2 Q3 Q4 Annual* Q1 Q2 Q3 Q4 Annual* Q1 Q2 Q3 Q4 Annual*
Full-time gainfully occupied 508 514 516 517 514 443 457 459 454 453 458 451 449 449 452
Full-time self-employed 41 44 47 49 45 48 50 52 50 50 61 52 50 55 55
Full-time employees 467 470 469 468 469 395 407 407 404 403 397 399 399 394 397
Part-time gainfully occupied 52 54 59 61 57 73 84 90 79 82 92 84 85 91 88
Part-time self-employed 41 44 47 49 45 48 50 52 50 50 61 52 50 55 55
Part-time employees 11 10 12 12 11 25 34 38 29 32 31 32 35 36 34
FT+ PT gainfully occupied 560 568 575 578 570 516 541 549 533 535 550 535 534 540 540
FT+ PT self-employed 82 88 94 98 91 96 100 104 100 100 122 104 100 110 109
FT+ PT employees 478 480 481 480 480 420 441 445 433 435 428 431 434 430 431
*Average
Occupation category2009
Occupation category2009
2010
2010
2011
2011
145
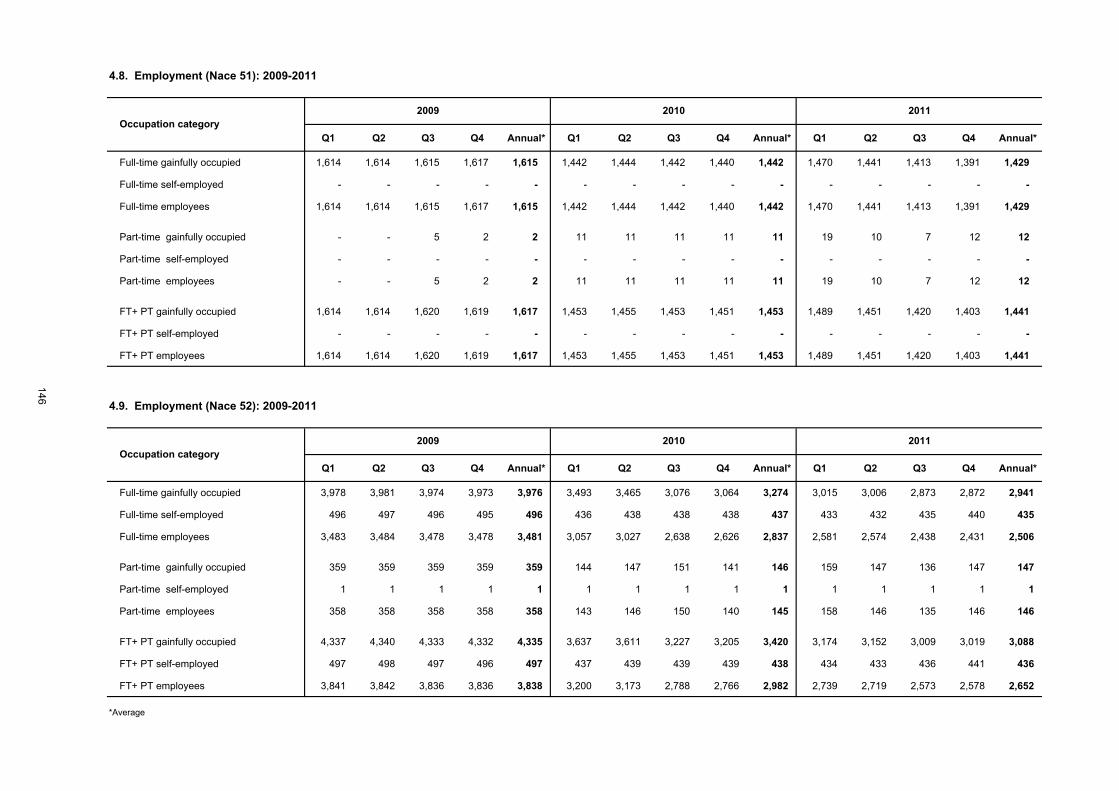
4.8. Employment (Nace 51): 2009-2011
Q1 Q2 Q3 Q4 Annual* Q1 Q2 Q3 Q4 Annual* Q1 Q2 Q3 Q4 Annual*
Full-time gainfully occupied 1,614 1,614 1,615 1,617 1,615 1,442 1,444 1,442 1,440 1,442 1,470 1,441 1,413 1,391 1,429
Full-time self-employed - - - - - - - - - - - - - - -
Full-time employees 1,614 1,614 1,615 1,617 1,615 1,442 1,444 1,442 1,440 1,442 1,470 1,441 1,413 1,391 1,429
Part-time gainfully occupied - - 5 2 2 11 11 11 11 11 19 10 7 12 12
Part-time self-employed - - - - - - - - - - - - - - -
Part-time employees - - 5 2 2 11 11 11 11 11 19 10 7 12 12
FT+ PT gainfully occupied 1,614 1,614 1,620 1,619 1,617 1,453 1,455 1,453 1,451 1,453 1,489 1,451 1,420 1,403 1,441
FT+ PT self-employed - - - - - - - - - - - - - - -
FT+ PT employees 1,614 1,614 1,620 1,619 1,617 1,453 1,455 1,453 1,451 1,453 1,489 1,451 1,420 1,403 1,441
4.9. Employment (Nace 52): 2009-2011
Q1 Q2 Q3 Q4 Annual* Q1 Q2 Q3 Q4 Annual* Q1 Q2 Q3 Q4 Annual*
Full-time gainfully occupied 3,978 3,981 3,974 3,973 3,976 3,493 3,465 3,076 3,064 3,274 3,015 3,006 2,873 2,872 2,941
Full-time self-employed 496 497 496 495 496 436 438 438 438 437 433 432 435 440 435
Full-time employees 3,483 3,484 3,478 3,478 3,481 3,057 3,027 2,638 2,626 2,837 2,581 2,574 2,438 2,431 2,506
Part-time gainfully occupied 359 359 359 359 359 144 147 151 141 146 159 147 136 147 147
Part-time self-employed 1 1 1 1 1 1 1 1 1 1 1 1 1 1 1
Part-time employees 358 358 358 358 358 143 146 150 140 145 158 146 135 146 146
FT+ PT gainfully occupied 4,337 4,340 4,333 4,332 4,335 3,637 3,611 3,227 3,205 3,420 3,174 3,152 3,009 3,019 3,088
FT+ PT self-employed 497 498 497 496 497 437 439 439 439 438 434 433 436 441 436
FT+ PT employees 3,841 3,842 3,836 3,836 3,838 3,200 3,173 2,788 2,766 2,982 2,739 2,719 2,573 2,578 2,652
*Average
Occupation category2009
Occupation category2009 2010
2010
2011
2011
146
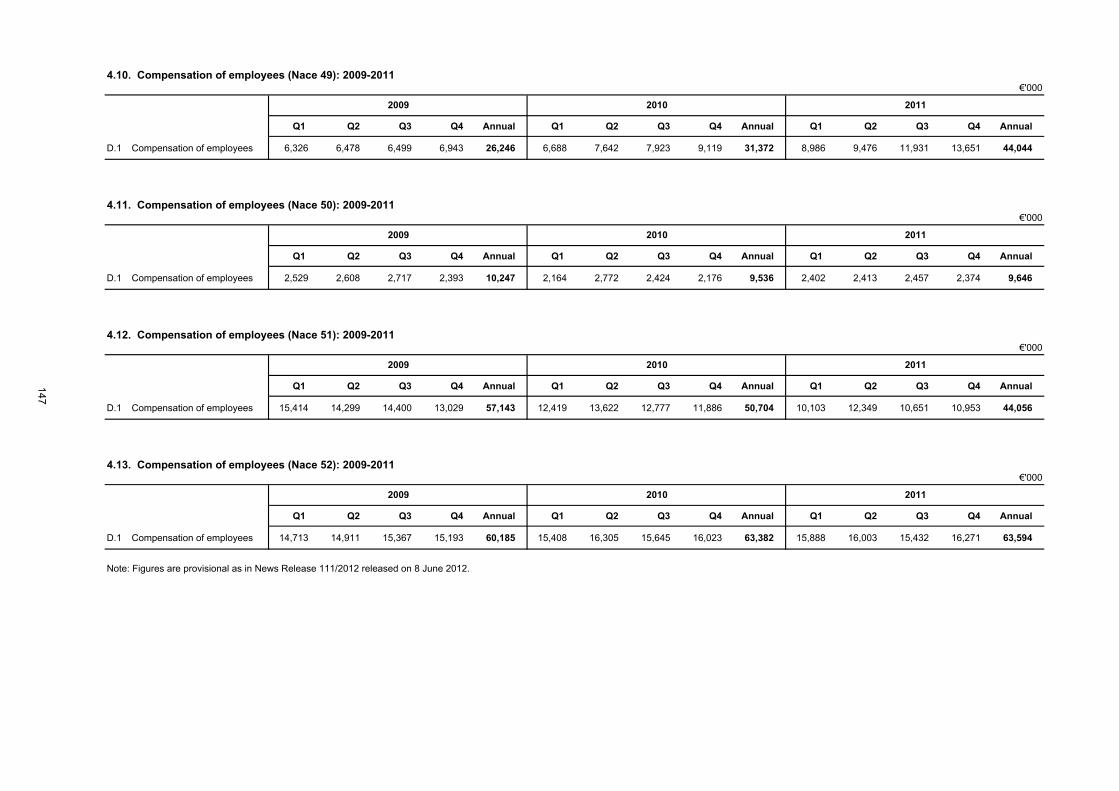
€'000
Q1 Q2 Q3 Q4 Annual Q1 Q2 Q3 Q4 Annual Q1 Q2 Q3 Q4 Annual
D.1 Compensation of employees 6,326 6,478 6,499 6,943 26,246 6,688 7,642 7,923 9,119 31,372 8,986 9,476 11,931 13,651 44,044
€'000
Q1 Q2 Q3 Q4 Annual Q1 Q2 Q3 Q4 Annual Q1 Q2 Q3 Q4 Annual
D.1 Compensation of employees 2,529 2,608 2,717 2,393 10,247 2,164 2,772 2,424 2,176 9,536 2,402 2,413 2,457 2,374 9,646
4.12. Compensation of employees (Nace 51): 2009-2011€'000
Q1 Q2 Q3 Q4 Annual Q1 Q2 Q3 Q4 Annual Q1 Q2 Q3 Q4 Annual
D.1 Compensation of employees 15,414 14,299 14,400 13,029 57,143 12,419 13,622 12,777 11,886 50,704 10,103 12,349 10,651 10,953 44,056
4.13. Compensation of employees (Nace 52): 2009-2011€'000
Q1 Q2 Q3 Q4 Annual Q1 Q2 Q3 Q4 Annual Q1 Q2 Q3 Q4 Annual
D.1 Compensation of employees 14,713 14,911 15,367 15,193 60,185 15,408 16,305 15,645 16,023 63,382 15,888 16,003 15,432 16,271 63,594
Note: Figures are provisional as in News Release 111/2012 released on 8 June 2012.
2011
2011
20112009
4.10. Compensation of employees (Nace 49): 2009-2011
2010
2009 2010
2009
2010
4.11. Compensation of employees (Nace 50): 2009-2011
2009 2010 2011
147


APPENDICES

Appendix A
Methodological Notes
1. Any vehicle-related data is based on data provided by Transport Malta.
2. These data may be subject to revision.
3. Definitions on road vehicles:
Stock of road vehicles
Road vehicle
Agricultural
Commercial vehicle
Garage/Hire
Minibus
Private vehicle
Class 1: < 1300 cc
Class 2: 1301 - 1449 cc
Class 3: 1450 - 1500 cc
Class 4: 1501 - 1800 cc
Class 5: 1801 - 2000 cc
Class 6: > 2000 cc
Electric car
Electric motorcycle
Route bus
Self drive car
Self drive motorcycle
Taxi
Semi-trailer
Garaged
Trolleybus
Passenger road vehicle
Moped
Motorcycle
Passenger car
Caravans
Coach and private bus
Minibus / mini-coach
Licensed passenger car for hire with driver withou predetermined routes. The method of hire is normally: (a) flagging down thestreet; (b) picking up at a designated taxi mark; (c) telephoning for collection.
Goods road vehicle with no front axle which is designed to be hauled by a road motor tractor, which also carries a substantialpart of the loaded weight. Semi-trailers are excluded from the total in the accompanying tables as these are not self-propelled.
Vehicles no longer licensed for use on the road, but exclude vehicles which have been scrapped or exported.
Passenger road vehicle designed to seat more than 9 persons (including the driver), which is connected to electric conductorsand which is not rail-borne. This term covers vehicles which are sometimes used as trolleybuses and sometimes as buses(since they have an independent motor).
Electrically operated motorcycle, totally independent of fuel-driven engine.
Bus licensed to operate on established bus routes.
Passenger road motor vehicle available for hire (without chauffeur).
Same as motorcycle above, available for hire.
A vehicle running on wheels and intended for use on roads.
Number of road vehicles registered at a given date in a country and licensed to use roads open to public traffic.
A road vehicle designed, exclusively or primarily, to carry one or more persons. Included are: motorcycles, mopeds, passengercars, vans designed and used primarily for transport of passengers, taxis, hire cars, ambulances, buses, coaches andminibuses, motor homes.
Two, three or four-wheeled road motor vehicle which is fi tted with an engine having a cylinder capacity of less than 50cc (3.05cu.in) and a maximum authorised design speed in accordance with national regulations.
Motor vehicle, normally a tractor, designed exclusively or primarily for agricultural purposes; licensed to use roads open topublic traffic.
Road vehicle designed, exclusively or primarily, to carry goods. This category also includes leased motor vehicles.
Chauffeur-driven car for hire.
Passenger road motor vehicle designed to seat up to 18 persons (including the driver).
Road motor vehicle, other than a motorcycle, intended for the carriage of passengers and designed to seat up to 9 persons for private use only. This category is sub-divided into further classes according to engine capacity:
Electrically operated car, totally independent of fuel-driven engine.
Passenger road moto vehicle designed to carry 10-23 seated or standing persons (including the driver).
Two-, three- or four-wheeled road motor vehicle not exceeding 400 kg (900 lb) of unladen weight. All such vehicles with acylinder capacity of 50 cc or over are included, as are those under 50 cc which do not meet the definition of moped.
Road motor vehicle, other than a moped or a motorcycle, intended for the carriage of passengers and designed to seat nomore than 9 persons (including the driver). Included are: passenger cars, vans designed and iused primarily for transport ofpassengers, taxis, hire cars, ambulances, motor homes (not caravans), hearses, microcars (needing no permit to be driven).
Road vehicle designed as living accommodation for haulage by a motor vehicle.
Passenger road motor vehicle designed to carry more than 24 persons (including driver), and with provision to carry seated aswell as standing passengers.
151
Goods road vehicle
Light goods road vehicle
Heavy goods road vehicle
Road tractor
Articulated vehicle
Special purpose road motor vehicle
VRT
Type 1
Type 2
Class 2
Class 2A
Class 2B
Class 3
4.
5.
6.
7. Scheduled Sea Transport between Malta and Gozo refers to the services of the Gozo Channel Co. Ltd.
8. The table below illustrates the passengers and vehicles capacity by each Gozo Channel vessel:
Carrying capacity
Vessel Vehicles Passengers
Gaudos 72 900
Malita 138 900
Ta' Pinu 72 900
9. Transport Accounts: Definitions as per ESA 95
Represents manual and online tests carried out on vehicles
Represents tests carried out manually and later inputted online (showing passed only for both initial and retest)
Midi buses, mini buses and vans
Taxis
Midi buses, mini buses and vans with a seating capacity more than 8 seats excluding driver
Motor vehicles used for the road carriage of goods
Trailers, semi-trailers and other towed vehicles
Ambulances
Output (P.1): Output consists of the products created during the accounting period.
Motor vehicles used for the road carriage of goods
The type of casualty (slight or grievous) is determined by the Health Department. The definitions for deaths caused by road accidents refer to the European Conference for Ministers of Transport (ECMT) and United Nations Economic Commission for Europe (UNECE).
UNECE definition of fatal injury: "Any person who was killed outright or who died within 30 days as a result of the accident".
Trailers, semi-trailers and other towed vehicles
Vehicle Road-Worthiness Test
Motor Vehicles whose gross vehicle weight is less than 3,500 kgs
Motor Vehicles whose gross vehicle weight is greater than or equal to 3,500 kgs
Traffic accidents data are compiled from administrative information provided by the Police Department, the Guard and Warden Services Limited and the Malta Insurance Association.
Chauffeur driven vehicles
Self-drive vehicles
Other light passenger vehicles
Midi buses, mini buses and vans with a seating capacity not more than 8 seats excluding driver
Route buses, coaches, private buses, midi buses, minibuses and vans
Road vehicle designed, exclusively or primarily, to carry goods. Included are: (a) light goods vehicles with a gross vehicleweight of not more than 3,500kg, designed exclusively or primarily to carry goods, e.g. vans and pick-ups; (b) Heavy goodsroad vehicles with a gross vehicle weight above 3,500kg, designed exclusively and primarily, to carry goods; (c) road tractors;(d) agricultural tractorspermitted to use roads open to public traffic.
Goods road vehicle with a gross vehicle weight of not more than 3,500kg designed, exclusively or primarily, to carry goods.
Goods road vehicle with a gross vehicle weight above 3,500kg designed, exclusively or primarily, to carry goods.
Road motor vehicle designed, exclusively or primarily, to haul other road vehicles which are not power driven (mainly semi-trailers).
Road tractor coupled to a semi-trailer.
Road motor vehicle for purposes other than the carriage of passengers or goods. This category includes: fire brigade vehicles;mobile cranes; self-propelled rollers; bulldozers with metallic wheels or track; vehicles for recording film, radio and TVbroadcasting; mobile library vehicles; mobile kiosks; towing vehicles for vehicles in need of repair; other special purpose roadmotor vehicles.
152
10. http://circa.europa.eu/irc/dsis/nfaccount/info/data/ESA95/ESA95-new.htm
11.
12.
13.
14. NACE Rev 2 NACE Rev 1
NACE 49 - Land Transport NACE 60 - Land TransportNACE 50 - Water Transport NACE 61 - Water TransportNACE 51 - Air Transport NACE 62 - Air Transport
15. Definition of Driving Licences categories:
A
A1
A+
B
B1
B automatic
B+E
C
C1
C1+E
C+E
D
All data in this News Release are in line with the European System of National and Regional Accounts (ESA 95) Manual (ISBN 92-827-7954-8). TheEuropean System of National and Regional Accounts (ESA) is an internationally compatible accounting framework for a systematic and detailed descriptionof a total economy (whether this is a region, a country, or a group of countries), its components, and its relations with other total economies. The ESA istherefore not restricted to annual national accounting, but applies also to regional accounts. Regional accounts are a regional specification of thecorresponding accounts of the total economy. The regional accounts make use of the concepts used for the accounts of the total economy.
The nomenclature of territorial units for statistics (NUTS) provides a single, uniform breakdown of the economic territory of the European Union. The NUTSis the territorial classification for the compilation of regional accounts. The economic territory of a country can be divided into regional territories and theextra-region territory. The regional territory includes the region that is part of the geographic territory of a country and any free zones, including bondedwarehouses and factories under customs control in the region. The extra region territory is made up of parts of the economic territory of a country thatcannot be attached directly to a single region.
Intermediate consumption (P.2): Intermediate consumption consists of the value of the goods and services consumed as inputs by a process ofproduction, excluding fixed assets whose consumption is recorded as consumption of fixed capital. The goods and services may be either transformed orused up by the production process.
Consumption of fixed capital (K.1): Consumption of fixed capital represents the amount of fixed assets used up, during the period under consideration, asa result of normal wear and tear and foreseen obsolescence, including a provision for losses of fixed assets as a result of accidental damage which can beinsured against.
Compensation of employees (D.1): Compensation of employees is defined as the total remuneration, in cash or in kind, payable by an employer to anemployee in return of work done by the latter during the accounting period.
Combination of vehicles where a tractor vehicle is in sub-category C1 and its trailer has a g.v.w. of over 750kg, provided theg.v.w. of the trailer does not exceed the unladen mass of the tractor vehicle.
Combinations of vehicles where the tractor is in category C and its trailer has a g.v.w. over 7500kg.
Motor vehicles used for carriage of persons and having more than 8 seats in addition to the driver's seat; motor vehicles in thiscategory may be combined with a trailer having a g.v.w. which does not exceed 750kg.
Motor tricycles/quadricycles, 3 or 4 wheeled vehicles with an unladen weight not exceeding 550kg.
Same as in category B, but with automatic transmission.
Combination of vehicles consisting of a vehicle in category B and a trailer, where the combination does not come withincategory B.
Motor vehicles other than those in category D and whose g.v.w. is over 3500kg; motor vehicles in this category may becombined with a trailer having a g.v.w. which does not exceed 750kg.
Employment (Table 3) includes full-time employees, part-time employees and self-employed translated into full-time equivalent. Data based onadministrative records of ETC.
Motor vehicles other than those in category D and whose g.v.w. is over 3500kg but not more than 7500kg; motor vehicles inthis sub-category may be combined with a trailer having a g.v.w. which does not exceed 750kg.
Motorcycles up to 25kW (33bhp) and a power to weight ratio not exceeding 0.16kW/kg. Motorcycle combination with a power to weight ratio not exceeding 0.16kW/kg.
Light motorcycles with a cubic capacity not exceeding 125cc and of a power not exceeding 11kW.
Motorcycles with a power exceeding 25kW (33bhp) or a power to weight ratio exceeding 0.16kW/kg or motorcycles withsidecars with a power to weight ratio exceeding 0.16kW/kg.
Motor vehicles with a gross vehicle weight (g.v.w.) not exceeding 3500kg and not more than 8 passenger seats in addition tothe driver's seat; motor vehicles in this category may be combined with a trailer having a g.v.w. which does not exceed 750kg.Combinations of a tractor vehicle in category B and a trailer, where the g.v.w. of the combination does not exceed 3500kg andthe g.v.w. of the trailer does not exceed the unladen mass of the tractor vehicle.
NACE 63 - Supporting and auxiliary transport activities (excluding Tourist Agents and Tourist Guides) NACE 63.3 (NACE Rev 1) - NACE 79.1 (NACE Rev 2)
NACE 52 - Warehousing and support activities for transportation
153
D1
D1+E
D+E
f
g
16. A driving licence issued to a person can have multiple categories, which means that the holder can drive more than one vehicle type.
17.
18.
19.
20.
(i) As stated in SL 425.07 – Fishing Vessels RegulationsMFA Professional Fishing Vessels - Full-time
MFB Professional Fishing Vessels - Part-time
MFC Non-Commercial Fishing Vessels i.e. recreational
MFD Auxiliary Vessels (work boats) used in fishing operations
(ii) As stated in the report entitled “The Maltese Fishing Industry - year 2000” drafted by Michael Darmanin, Senior Fisheries Officer,Luzzu The most traditional fishing vessel. It is pointed at both ends, and is painted in folkloristic bright colours.
Kajjik
(iii) As stated from "The Fishing Industry in Malta Past-Present-Future" - Stanley Farrrugia RandonFirilla
Bimbu
Other
21. The data in regarding the Cruise Liners are compiled on the basis of administrative records held by the Transport Malta.
22. Cruise liners calling at both Malta and Gozo during a single voyage are recorded as one cruise liner call.
23. Definitions regarding Cruise Liners:
(i)
(ii)
(iii)
(iv)
(v)
(vi) Overnight visitors (tourists) comprise visitors to Malta who spend at least one night in collective or private accommodation.
Embarkations comprise all cruise passengers who are either Maltese who leave Malta on a cruise ship, or alternatively, foreigners who come to Malta by other means of transport and leave on a cruise ship.
Cruise passenger traffic comprises embarkations from Malta, transit passengers and passengers landing in Malta.
Transit passengers comprise all cruise passengers who arrive in and leave Malta on the same cruise ship.
Landings comprise all cruise passengers who arrive in Malta on a cruise ship and leave by other means of transport, or alternatively, stay in Malta.
Same-day visitors comprise visitors to Malta who do not spend at least one night in collective or private accommodation.
Sea is not a port name. We have common situations were a vessel reports its last activity such as from Outside Territorial Waters (OTW) or Within Territorial Waters (WTW), depends upon activity.
Norway International Ship Register (NISR) is included separately due to the fact that Norway has two different registers, known as Norway and NISR.
Agricultural tractors.
Motor vehicles used for carriage of persons and having more than 8 seats but not more than 16 seats in addition to the driver'sseat; motor vehicles in this sub-category may be combined with a trailer having a g.v.w. which does not exceed 750kg.
Combinations of vehicles where the tractor vehicle is in sub-category D1 and its trailer (which cannot be used for the transportof persons) has a g.v.w. of more than 750kg, provided that the g.v.w. of the combination thus formed does not exceed12,000kg and the g.v.w. of the trailer does not exceed the unladen mass of the tractor vehicle.
Combinations of vehicles where the tractor vehicle is in category D and its trailer has a g.v.w. of over 750kg.
Vehicles for the carriage of persons having more than 16 seats, but not more than 18 seats, in addition to that of the driver.
The data in the Maritime Statistics section are compiled from administrative information provided by the Transport Malta.
Any vessel that is not listed above an MPV, Luzzu, Kajjik, Trawler, Firilla or Bimbu, i.e. that is not a dinghy, barge or frejgatina are typical examples.
Definitions of fishing vessels:-
Differs from the luzzu in being generally smaller (average length 4.6metres) and being flat ended at the stern. Previously, they were made of wood, but in recent years, fibre-glass has been the hull material of choice.
Almost identical in design to the luzzu but, the bulwark ( tappiera ) is secured to the outside of the kontrarota . The stem posts found at each end of this boat are also much higher than those of the luzzu and it has a wider appearance.
Has a pruwa resembling that of a lanca while its poppa resembles that of a luzzu .
154
24. Definitions regarding transport equipment:
In the absence of certain administrative data, the load capacity is approximated by:
load capacity
(ktons)
whereas the actual working should be as follows:
load capacity
(ktons)
= no. of vehicles x GVW (kg)
= no. of vehicles x max. permissible carriage weight (kg)
106
106
155
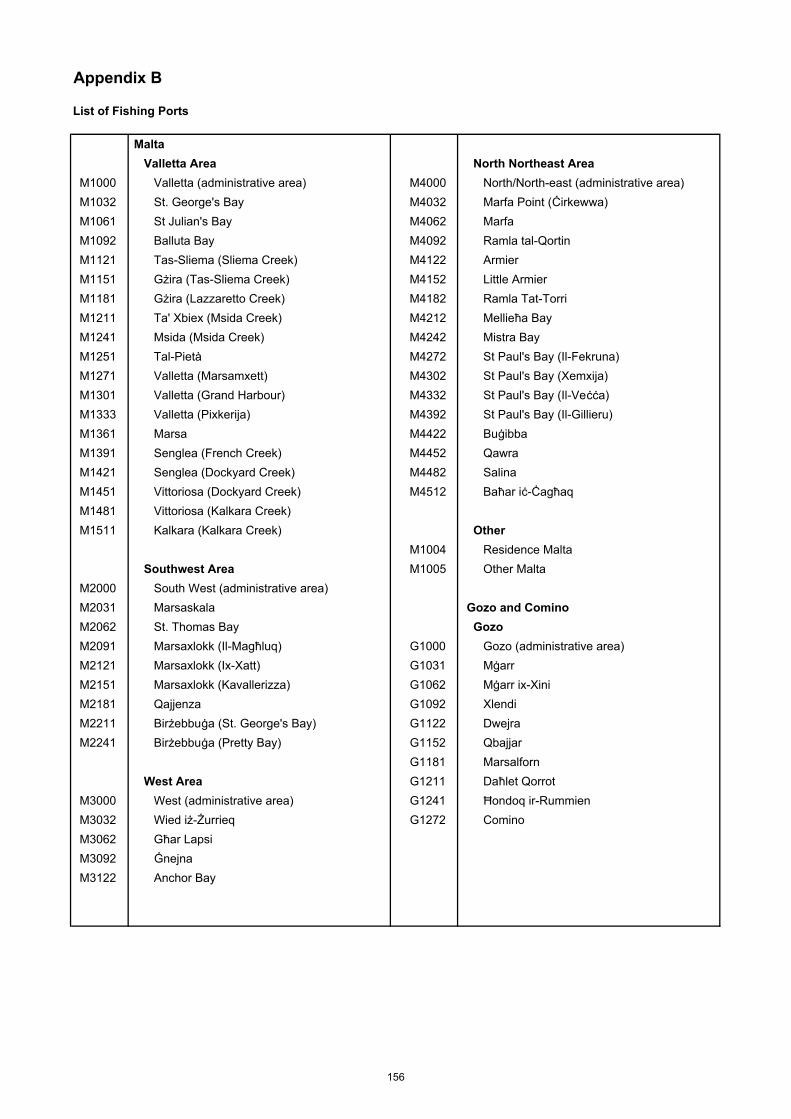
Appendix B
List of Fishing Ports
Malta
Valletta Area North Northeast Area
M1000 Valletta (administrative area) M4000 North/North-east (administrative area)
M1032 St. George's Bay M4032 Marfa Point (Ċirkewwa)
M1061 St Julian's Bay M4062 Marfa
M1092 Balluta Bay M4092 Ramla tal-Qortin
M1121 Tas-Sliema (Sliema Creek) M4122 Armier
M1151 Gżira (Tas-Sliema Creek) M4152 Little Armier
M1181 Gżira (Lazzaretto Creek) M4182 Ramla Tat-Torri
M1211 Ta' Xbiex (Msida Creek) M4212 Mellieħa Bay
M1241 Msida (Msida Creek) M4242 Mistra Bay
M1251 Tal-Pietà M4272 St Paul's Bay (Il-Fekruna)
M1271 Valletta (Marsamxett) M4302 St Paul's Bay (Xemxija)
M1301 Valletta (Grand Harbour) M4332 St Paul's Bay (Il-Veċċa)
M1333 Valletta (Pixkerija) M4392 St Paul's Bay (Il-Gillieru)
M1361 Marsa M4422 Buġibba
M1391 Senglea (French Creek) M4452 Qawra
M1421 Senglea (Dockyard Creek) M4482 Salina
M1451 Vittoriosa (Dockyard Creek) M4512 Baħar iċ-Ċagħaq
M1481 Vittoriosa (Kalkara Creek)
M1511 Kalkara (Kalkara Creek) Other
M1004 Residence Malta
Southwest Area M1005 Other Malta
M2000 South West (administrative area)
M2031 Marsaskala Gozo and Comino
M2062 St. Thomas Bay Gozo
M2091 Marsaxlokk (Il-Magħluq) G1000 Gozo (administrative area)
M2121 Marsaxlokk (Ix-Xatt) G1031 Mġarr
M2151 Marsaxlokk (Kavallerizza) G1062 Mġarr ix-Xini
M2181 Qajjenza G1092 Xlendi
M2211 Birżebbuġa (St. George's Bay) G1122 Dwejra
M2241 Birżebbuġa (Pretty Bay) G1152 Qbajjar
G1181 Marsalforn
West Area G1211 Daħlet Qorrot
M3000 West (administrative area) G1241 Ħondoq ir-Rummien
M3032 Wied iż-Żurrieq G1272 Comino
M3062 Għar Lapsi
M3092 Ġnejna
M3122 Anchor Bay
156


![SINGAPORE LAND TRANSPORT LAND TRANSPORT STATISTICS IN BRIEF 2012 PUBLIC TRANSPORT JOURNEYS 2010 2011 [9] Average Daily Passenger-Journeys ('000) 3,8413,988 Average Journey Distance](https://img.pdfslide.net/doc/110x75/5b03ee037f8b9a41528bb8cb/singapore-land-land-transport-statistics-in-brief-2012-public-transport-journeys.jpg)