Embed Size (px)
Citation preview
1
Regional Transport Statistics
Department for Transport, LocalGovernment and the Regions
Statistics Bulletin (01) 21
This bulletin was compiled by José Espiñeira and Mike Haslam. Enquiries about thecontents of this bulletin or further information should be made to:
José EspiñeiraDepartment for TransportTSPT3 BranchZone 2/15Great Minster House76 Marsham StreetLondon SW1P 4DR
Telephone 020 7944 3096 e-mail: [email protected]
November 2001

2

3
Introduction
Welcome to the first edition of Regional Transport Statistics. It is intended that thisbulletin will be published annually.
Regional Transport Statistics replaces Transport Statistics for Metropolitan Areaswhich was last published in 2000. It contains over 60 tables bringing together a widerange of GB transport statistics which are available at Government Office Region andcountry level. Data for Metropolitan Areas are included where these are available.
The information in this Bulletin is intended to complement Transport Statistics GreatBritain which was published on 11 October. The majority of the information isalready available in the public domain or has been available on request. The value ofthe publication is in the availability for users of a single comprehensive source ofregional transport statistics.
The information in this bulletin will shortly be available on the DTLR TransportStatistics website (www.transtat.dft.gov.uk).
I hope that you will find this bulletin useful. I would be interested to receivecomments on the content of the bulletin and any suggestions for improvements.
Mike Haslame-mail: [email protected] 2001

4

5
CONTENTSPage
Introduction
1. Personal Travel
1.1 Trips by main mode of travel - GOR and Country: 1998/2000 131.2 Average distance travelled by mode of travel - GOR and Country: 1998/2000 131.3 Trips by purpose - GOR and Country: 1998/2000 131.4 Travel to work by main mode and residence - GOR and Country: 1998/2000 141.5 Trips to and from school by main mode - GOR and Country: 1998/2000 141.6 Bus accessibility - GOR and Country: 1992/94, 1995/97 & 1998/2000 141.7 Household car ownership - GOR and Country: 1992/94, 1995/97 & 1998/2000 151.8 Full car driving licence holders by sex - GOR and Country: 1998/2000 161.9 Main mode of transport to work by workplace - GOR, MC and Country: 16
Autumn 20001.10 Time taken to travel to work by workplace - GOR, MC and Country: 17
Autumn 20001.11 Main mode of travel to work to main job area - London and Country: Autumn 1999 171.12 Main mode of travel of people entering Central London during the morning peak 18
7-10am: 19991.13 Household expenditure on transport - GOR and Country: 1997/2000 181.14 Percentage of journeys by origin and destination - GOR and country: 1998/2000 19
2. Public Transport
2.1 Bus passenger journeys - GOR, MC and Country: 1990-2000 232.2 Bus vehicle kilometres - GOR, MC and Country: 1990-2000 232.3 Bus passenger receipts - GOR, MC and Country: 1990-2000 242.4 Bus traffic - London: 1989/90-1999/2000 242.5 Bus passenger satisfaction - GOR and Country: 2000/01 252.6 Underground traffic - London: 1989/90-2000/01 262.7 London Underground customer satisfaction: 1995/96-1999/2000 262.8 London Underground and London Bus service reliability: 1989/90-1999/2000 272.9 Passenger journeys by rail- origin by destination – SRA Regions and Country: 2000/01 27
3. Road Vehicles
3.1 Motor vehicles licensed by taxation class - GOR, MC and Country: 2000 313.2 Motor vehicles registered for the first time with related stock and ownership 31
information - GOR, MC and Country: 2000

6
4. Road Traffic
4.1 Motor vehicle traffic by road class - GOR and Country: 1999 354.2 Motor vehicle traffic by road class - GOR and Country: 2000 354.3 Average daily motor vehicle flows by road class - GOR and Country: 1999 354.4 Average daily motor vehicle flows by road class - GOR and Country: 2000 364.5 Average trunk road traffic speed by time period - GOR and Country: 1998 364.6 Distribution of trunk road speeds (morning peak) - GOR and Country: 1998 364.7 Distribution of trunk road speeds (off-peak) - GOR and Country: 1998 374.8 Distribution of trunk road speeds (evening peak) - GOR and Country: 1998 374.9 Comparison of trunk road average speeds by time period - GOR and Country: 37 1995 & 1998
5. Roads
5.1 Road lengths - GOR and Country: 1999 415.2 Road lengths - GOR and Country: 2000 415.3 Comparison of road condition - GOR and Country: 1998/2000 425.4 Defects indices - GOR and Country: 1992-2000 425.5 Regional expenditure on roads - GOR and Country: 1999/2000 43
6. Safety
6.1 Casualties - GOR, MC and Country: 1990-2000 476.2 Killed or seriously injured casualties - GOR, MC and Country: 1990-2000 476.3 Casualties on pedal cycles - GOR, MC and Country: 1990-2000 486.4 Killed or seriously injured casualties on pedal cycles - GOR, MC and Country: 48
1990-20006.5 Child casualties - GOR, MC and Country: 1990-2000 496.6 Killed or seriously injured child casualties - GOR, MC and Country: 1990-2000 496.7 Car user casualties - GOR, MC and Country: 1990-2000 506.8 Killed or seriously injured car user casualties - GOR, MC and Country: 1990-2000 506.9 Two wheeled motor vehicle user casualties - GOR, MC and Country: 1990-2000 516.10 Killed or seriously injured two wheeled motor vehicle user casualties - GOR, MC 51
and Country: 1990-2000
7. Road Freight
7.1 Goods lifted by origin of goods - GOR and Country: 1990-2000 557.2 Goods lifted by origin and destination of goods - GOR and Country: 2000 557.3 Goods moved by origin of goods - GOR and Country: 1990-2000 557.4 Goods moved by origin and destination of goods - GOR and Country: 2000 56

7
8. Air
8.1 Air transport movements at GB airports - GOR and Country: 1990 & 1995-2000 598.2 Terminal passengers at GB airports - GOR and Country: 1990 & 1995-2000 598.3 Freight lifted at GB airports - GOR and Country: 1990 & 1995-2000 598.4 Final mode of transport to or from GB airports - GOR and Country: 2000 60
9. General
9.1 Estimated resident population mid-year based on the 1991 census - GOR, MC and 63Country: 1990-2000
9.2 Household numbers - GOR, MC and Country: 1991 & 1996-1999 639.3 GDP (£ million) - GOR and Country: 1990-1999 649.4 Average gross weekly earnings - GOR, MC and Country: 1990-2000 649.5 Vehicle crime - GOR and Country- 1990-2000/01 65
Bibliography
Civil Aviation Authority, UK Airports: Annual Statement of Movements, Passengers and Cargo
Labour Force Survey
National Travel Survey 1992/94, 1995/97 & 1998/2000
Office of National Statistics, Family Expenditure Survey
Office of National Statistics, New Earnings Survey
Office of National Statistics, Population Estimates Unit
Office of National Statistics, Regional Trends 36
Transport for London 2000
Department of the Environment, Transport and the Regions, Trunk Road Speeds Survey (ISBN: 1-85112-180-3)
Department of the Environment, Transport and the Regions, Road Traffic Statistics 1999-SB (00) 20
Department for Transport, Local Government and the Regions, Traffic in Great Britain: Q2 2001 -SB (01) 7
Department for Transport, Local Government and the Regions, Bus Quality Indicators: England Q4 2000/01 Data -SB (01) 11
8
Department of the Environment, Transport and the Regions, National Road Maintenance Condition Survey: 2000 Data -SB (01) 13
Department of the Environment, Transport and the Regions, Transport of Goods by Road in Great Britain: 2000 Data -SB (01) 14
Department of the Environment, Transport and the Regions, Vehicle Licensing Statistics: 2000 Data -SB (01) 15
Department for Transport, Local Government and the Regions, National Travel Survey: 1998/2000 Update -SB (01) 17
Department for Transport, Local Government and the Regions, Road Traffic Statistics: 2000- SB (01) 19
Abbreviations and acronyms used in tables
BR British RailCAA Civil Aviation AuthorityCSRGT Continuing Survey of Road Goods TransportDBFO Design, Build, Finance and Operate (schemes)DLR Docklands Light RailwayDTLR Department for Transport, Local Government RegionsEx ExcludingGB Great BritainGDP Gross Domestic ProductGOE Government Office EastGONE Government Office North EastGONW Government Office North WestGOR Government Office RegionGOSE Government Office South EastGtr GreaterLFS Labour Force SurveyLT London TransportLUL London Underground LimitedMC Metropolitan CountyNRMCS National Road Maintenance Condition SurveyNTS National Travel SurveyONS Office of National Statisticsow Of whichPSV Public Service Vehicle

9
Sources and Enquiries
Sources of data are indicated on each table. Further information may be available from José Espiñeiraon 020 7944 3096 or from the enquiry number shown on each table.
Symbols
The following symbols have been used throughout:
.. = not available - = negligible (less than half the final digit shown)
. = not applicable 0 = nil* = sample size too small

10

11
1. Personal Travel

12

13
1.1 Trips by main mode of travel - GOR and Country: 1998/2000
Region Walk Bicycle Car Car Other Local Rail Taxi/ Other Alldriver passenger private bus minicab public modes
North East 312 * 365 223 * 92 * 15 * 1,035North West 244 12 413 230 10 66 9 18 * 1,006Yorkshire & the humber 307 19 394 214 8 67 8 13 * 1,032East Midlands 249 29 416 221 12 54 * 10 * 998West Midlands 278 13 417 233 8 70 * 9 * 1,039East of England 246 21 476 254 11 22 19 7 * 1,058London 298 11 306 190 10 94 83 15 * 1,012South East (ex. London) 251 20 478 262 13 31 17 10 * 1,084South West 255 19 422 239 15 39 * * * 1,001
England 269 17 412 230 11 57 20 11 3 1,031Wales 256 * 401 224 15 37 * 13 * 957Scotland 302 14 407 210 11 78 13 18 * 1,058GB 271 16 411 228 11 58 19 12 3 1,030
* = Sample size too small for reliable estimates. Source: National Travel SurveyEnquiries: 020 7944 3097
Trips per person per year
1.2 Average distance travelled by mode of travel - GOR and Country: 1998/2000
Region Walk Bicycle Car Car pass- Other Local bus Rail Taxi/ Other AllDriver enger private minicab public Modes
North East 195 * 2,907 1,965 * 389 * 65 * 5,994North West 172 27 3,138 1,777 164 254 238 74 * 5,985Yorkshire & the Humber 192 43 3,354 1,929 174 304 363 95 * 6,553East Midlands 178 57 3,588 1,964 199 249 * 59 * 6,791West Midlands 172 31 3,391 1,966 90 274 * 39 * 6,336East of England 170 46 4,572 2,338 152 98 676 38 * 8,184London 225 38 2,177 1,421 148 325 955 83 * 5,462South East (ex. London) 188 46 4,583 2,335 152 139 512 62 * 8,144South West 173 48 3,943 2,553 283 164 * * * 7,592
England 186 41 3,563 2,021 166 232 445 61 127 6,842Wales 163 * 3,538 1,998 129 166 * 32 * 6,278Scotland 205 31 3,534 1,952 184 426 454 84 * 7,210GB 186 38 3,559 2,014 165 246 428 62 145 6,843
* = Sample size too small for reliable estimates.Enquiries: 020 7944 3097
Source: National Travel Survey
Miles per person per year
1.3 Trips by purpose - GOR and Country: 1998/2000
OtherRegion Commuting Business Education Shopping Personal Escort Visiting Sport & Holidays & including All
business friends entertainment day trips just walk purposes
North East 163 24 78 236 73 116 214 57 27 46 1,035North West 159 30 72 212 98 135 188 58 26 28 1,006Yorkshire & the Humber 159 29 68 233 98 117 198 58 33 38 1,032East Midlands 175 31 65 203 98 125 165 63 26 47 998West Midlands 170 27 82 219 106 119 191 52 24 48 1,039East of England 167 43 64 213 110 148 169 70 28 46 1,058London 145 43 75 205 112 135 172 55 28 41 1,012South East (ex. London) 163 45 64 218 108 161 182 68 31 44 1,084South West 159 41 53 207 107 105 162 64 46 56 1,001
England 162 36 69 215 103 132 181 61 30 43 1,031Wales 142 30 55 204 96 102 195 58 26 50 957Scotland 167 31 70 234 110 103 172 74 28 68 1,058GB 161 36 68 216 103 128 181 62 29 46 1,030
Source: National Travel SurveyEnquiries: 020 7944 3097
Trips per person per year

14
1.4 Travel to work by main mode and residence - GOR and Country: 1998/2000
Region Walk Bicycle Car Car pass- Other Local Rail Other Alldriver enger private bus public modes
North East 14 * 53 17 * 10 * * 100North West 12 * 61 12 * 7 * * 100Yorkshire & the Humber 12 * 58 11 * 9 * * 100East Midlands 12 6 61 11 * 6 * * 100West Midlands 12 * 61 12 * 8 * * 100East of England 9 5 65 12 * * 6 * 100London 8 * 40 6 * 12 27 * 100South East (ex. London) 11 4 64 10 * 4 5 * 100South West 14 * 62 10 * 5 * * 100
England 11 4 59 11 2 7 6 1 100Wales 10 * 68 15 * * * * 100Scotland 11 * 56 13 * 10 * * 100GB 11 4 59 11 2 7 5 1 100
* = Sample size too small for reliable estimates. Source: National Travel Survey
Percentage of trips
Enquiries: 020 7944 3097
1.5 Trips to and from school by main mode - GOR and Country: 1998/2000
Age 5-16 Average length (miles)
Region Walk Car Bus1 Other All modes Age 5-10 Age 11-16
North East 59 20 20 - 100 0.8 2.4 North West 46 29 23 - 100 1.4 2.7 Yorkshire & the Humber 60 20 17 - 100 0.8 3.3 East Midlands 48 30 19 - 100 1.6 3.0 West Midlands 61 23 15 - 100 1.4 2.0 East of England 44 36 13 - 100 1.8 3.9 London 49 25 19 - 100 1.4 3.1 South East (ex. London) 43 37 16 - 100 1.9 3.1 South West 41 29 24 - 100 1.7 4.7
England 50 28 18 4 100 1.5 3.1 Wales 39 29 30 - 100 1.7 3.1 Scotland 53 20 26 - 100 1.2 2.8 GB 49 27 19 4 100 1.5 3.0
1 Including school buses Source: National Travel SurveyEnquiries: 020 7944 3097
Percentage/miles
1.6 Bus accessibility1 - GOR and Country: 1992/94, 1995/97 & 1998/2000
PercentagesRegion 1992/1994 1995/1997 1998/2000
North East 87 100 96North West 87 94 96Yorkshire & the Humber 80 91 91East Midlands 71 79 79West Midlands 76 92 93East of England 66 75 75London 89 98 98South East (ex. London) 68 86 87South West 65 76 74
England 77 88 88Wales 69 78 82Scotland 82 90 91GB 77 88 88
1 Households within 13 mins of a bus stop with a service at least once an hour.
Source: National Travel SurveyEnquiries: 020 7944 3097

15
1.7 Household car ownership - GOR and Country: 1992/94, 1995/97 & 1998/2000
percentages/number
Region No car One car Two or All house- Cars/more cars holds household
North East 45 42 12 100 0.7 North West 39 41 20 100 0.9 Yorkshire & the Humber 37 44 19 100 0.9 East Midlands 30 45 25 100 1.0 West Midlands 31 44 25 100 1.0 East of England 23 47 30 100 1.2 London 39 43 19 100 0.8 South East (ex. London) 22 46 32 100 1.2 South West 26 48 26 100 1.1
England 32 44 24 100 1.0 Wales 33 47 20 100 0.9 Scotland 43 43 15 100 0.7 GB 33 44 23 100 1.0
1992/1994
percentages/number
Region No car One car Two or All house- Cars/more cars holds household
North East 47 41 12 100 0.7 North West 32 44 24 100 1.0 Yorkshire & the Humber 34 46 20 100 0.9 East Midlands 27 41 32 100 1.1 West Midlands 29 44 27 100 1.0 East of England 23 49 28 100 1.1 London 39 44 17 100 0.8 South East (ex. London) 21 46 33 100 1.2 South West 23 49 28 100 1.1
England 30 45 25 100 1.0 Wales 33 43 24 100 1.0 Scotland 38 44 18 100 0.8 GB 31 45 25 100 1.0
1995/1997
percentages/number
Region No car One car Two or All house- Cars/more cars holds household
North East 36 47 17 100 0.8 North West 31 46 24 100 1.0 Yorkshire & the Humber 33 45 23 100 0.9 East Midlands 30 44 27 100 1.0 West Midlands 28 44 27 100 1.1 East of England 20 46 34 100 1.2 London 36 45 19 100 0.9 South East (ex. London) 20 48 32 100 1.2 South West 22 46 32 100 1.2
England 28 46 26 100 1.1 Wales 29 43 28 100 1.1 Scotland 35 41 24 100 0.9 GB 28 45 26 100 1.0
1998/2000
Source: National travel SurveyEnquiries: 020 7944 3097

16
1.8 Full car driving licence holders by sex - GOR and Country: 1998/2000
Percentage
Region Males Females All Adults
North East 75 48 61 North West 81 60 70 Yorkshire & the Humber 77 53 65 East Midlands 83 57 70 West Midlands 82 56 68 East of England 91 68 79 London 78 58 67 South East (ex. London) 87 70 78 South West 86 66 76
England 83 61 71 Wales 80 58 68 Scotland 78 58 67 GB 82 60 71
Source: National Travel SurveyEnquiries: 020 7944 3097
1.9 Main mode of transport to work by workplace - GOR, MC and Country: Autumn 2000
Rail
Car, van Motor- Bus, ow: National ow: Other Number in Area of workplace minibus cycle Bicycle coach Rail Rail1 All Rail Walk employment
North East 71 * 2 12 * 2 2 12 999 Tyne & Wear MC 66 * * 17 * 3 4 10 465 Rest 76 * 3 7 * * * 13 534
North West 76 1 3 8 2 * 2 10 2,908 Gtr Manchester MC 74 * 2 10 2 * 3 10 1,130 Merseyside MC 72 * 3 10 4 * 4 9 484 Rest 78 1 3 6 1 * 1 11 1,293
Yorkshire & the Humber 70 1 4 11 2 * 2 12 2,163 South Yorkshire MC 69 * * 14 * * * 12 517 West Yorkshire MC 69 1 2 14 3 * 3 11 971 Rest 71 2 8 5 * * * 13 675
East Midlands 74 1 5 7 * * * 12 1,756West Midlands 76 1 3 8 1 * 1 10 2,206 West Midlands MC 74 * 2 12 2 * 2 9 1,108 Rest 78 1 4 4 * * * 12 1,098
East of England 76 1 5 4 1 * 2 11 2,316London 43 1 2 10 17 16 33 9 3,428South East 76 1 4 4 3 * 3 11 3,509South West 75 2 4 4 1 * 1 13 2,180
England 70 1 4 7 4 3 7 11 21,465Wales 79 * 2 5 1 * 1 12 1,102Scotland 67 1 2 13 3 1 4 13 2,214GB 70 1 3 8 4 2 6 11 24,781
1 Includes underground, light railway systems and trams Source: Labour Force SurveyEnquiries: 020 7944 3097
Percentage/thousands
17
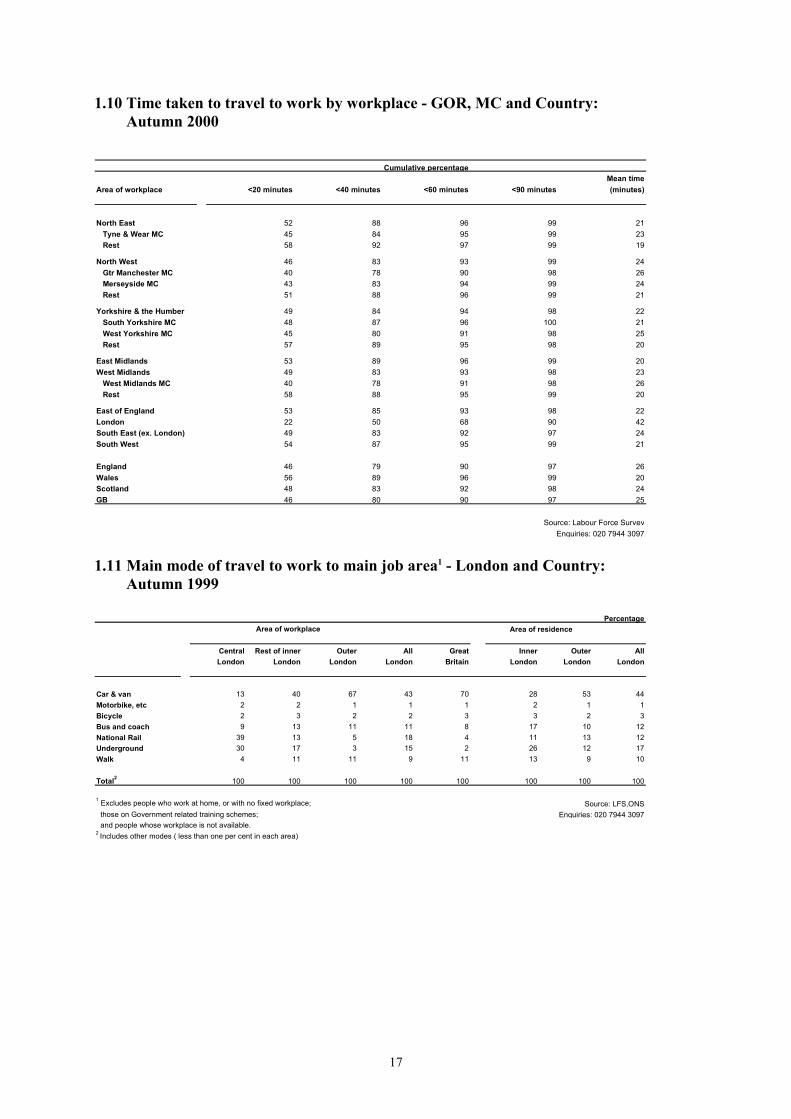
1.10 Time taken to travel to work by workplace - GOR, MC and Country: Autumn 2000
Mean timeArea of workplace <20 minutes <40 minutes <60 minutes <90 minutes (minutes)
North East 52 88 96 99 21 Tyne & Wear MC 45 84 95 99 23 Rest 58 92 97 99 19
North West 46 83 93 99 24 Gtr Manchester MC 40 78 90 98 26 Merseyside MC 43 83 94 99 24 Rest 51 88 96 99 21
Yorkshire & the Humber 49 84 94 98 22 South Yorkshire MC 48 87 96 100 21 West Yorkshire MC 45 80 91 98 25 Rest 57 89 95 98 20
East Midlands 53 89 96 99 20West Midlands 49 83 93 98 23 West Midlands MC 40 78 91 98 26 Rest 58 88 95 99 20
East of England 53 85 93 98 22London 22 50 68 90 42South East (ex. London) 49 83 92 97 24South West 54 87 95 99 21
England 46 79 90 97 26Wales 56 89 96 99 20Scotland 48 83 92 98 24GB 46 80 90 97 25
Source: Labour Force SurveyEnquiries: 020 7944 3097
Cumulative percentage
1.11 Main mode of travel to work to main job area1 - London and Country: Autumn 1999
Percentage Area of workplace Area of residence
Central Rest of inner Outer All Great Inner Outer AllLondon London London London Britain London London London
Car & van 13 40 67 43 70 28 53 44Motorbike, etc 2 2 1 1 1 2 1 1Bicycle 2 3 2 2 3 3 2 3Bus and coach 9 13 11 11 8 17 10 12National Rail 39 13 5 18 4 11 13 12Underground 30 17 3 15 2 26 12 17Walk 4 11 11 9 11 13 9 10
Total2 100 100 100 100 100 100 100 100
1 Excludes people who work at home, or with no fixed workplace; those on Government related training schemes; and people whose workplace is not available.2 Includes other modes ( less than one per cent in each area)
Source: LFS,ONSEnquiries: 020 7944 3097

18
1.12 Main mode of travel of people entering Central London during the morning peak 7-10 am1: 1999
Thousands UnitsAll LUL LT Coach/ Private Taxi3 Motor- Pedal Average vehicle
Modes and bus minibus2 car cycle cycle occupancyYear Total Transfers to DLR LT bus Car
LU/DLR only
1989 1,142 473 179 390 73 23 161 .. 13 10 30 1.301990 1,094 458 188 368 70 20 158 .. 11 9 29 1.311991 1,042 426 168 347 74 20 155 .. 12 9 32 1.321992 992 401 156 337 61 24 150 .. 11 9 27 1.321993 977 382 168 340 64 20 150 .. 11 9 28 1.321994 989 392 171 346 63 23 145 .. 11 9 28 1.311995 993 395 174 348 63 21 145 .. 11 10 28 1.321996 1,020 399 176 361 68 20 143 9 11 10 29 1.311997 1,068 435 195 373 68 20 142 9 12 10 29 1.341998 1,097 448 196 394 68 17 141 8 13 10 30 1.341999 1,108 460 202 396 68 15 135 8 15 12 30 1.36
1 In addition to journeys terminating in Central London, all journeys passing through Central London are included, except those entirely on London Underground2 Includes commuter and tourist coaches3 Unrecorded prior to 1996
Enquiries: 020 7941 4266
The figures in this table are outside the scope of
National Rail
Source: Transport for London
National Statistics.
1.13 Household expenditure on transport - GOR and Country: 1997/20001
Fares and other travel costs
Cars, vans & Motor Petrol, Totalmotorcycles Spares & vehicle diesel & Other Rail & Bus & Other expenditure Motoring
purchase access- insurance other motoring tube coach travel per expenditure Region and repairs ories & taxation motor oils costs fares fares costs2 household per car/van
North East 14.80 1.30 5.40 10.60 1.10 0.90 1.80 3.30 285.40 36.80North West 23.70 2.20 6.80 13.20 1.60 0.80 1.50 4.00 334.60 50.00Yorkshire & the Humber 22.50 2.10 6.50 12.30 1.60 0.80 1.70 4.60 329.60 47.20East Midlands 24.00 1.90 6.90 14.10 2.00 0.70 1.10 5.10 338.70 50.60West Midlands 21.90 2.30 7.40 14.50 1.90 0.70 1.40 3.80 336.20 49.10East of England 25.00 1.70 7.60 14.90 2.20 2.90 0.80 5.50 357.90 50.50London 19.20 1.60 6.70 10.40 2.00 4.30 1.80 11.80 403.90 45.40South East (ex. London) 26.40 2.40 8.00 15.70 2.30 3.00 1.00 6.50 392.50 55.30South West 22.10 2.10 6.90 14.40 2.10 0.60 1.10 3.90 332.50 48.80
England 22.70 2.00 7.10 13.50 1.90 1.90 1.30 5.80 354.30 49.30Wales 16.50 2.20 6.00 13.00 1.50 0.70 1.20 3.60 315.60 41.10Scotland 21.00 1.20 5.40 11.70 1.40 1.10 2.00 4.50 317.30 44.70
1 Combined data from the 1997-1998, 1998-1999 and 1999-2000 surveys.2 Other travel costs include taxis, air and other travel, and bicycles and boats: purchase and repair.
Motoring
Enquiries: 020 7944 3096
Average weekly household expenditure (£)
Source: Family Expenditure Survey, ONS
19
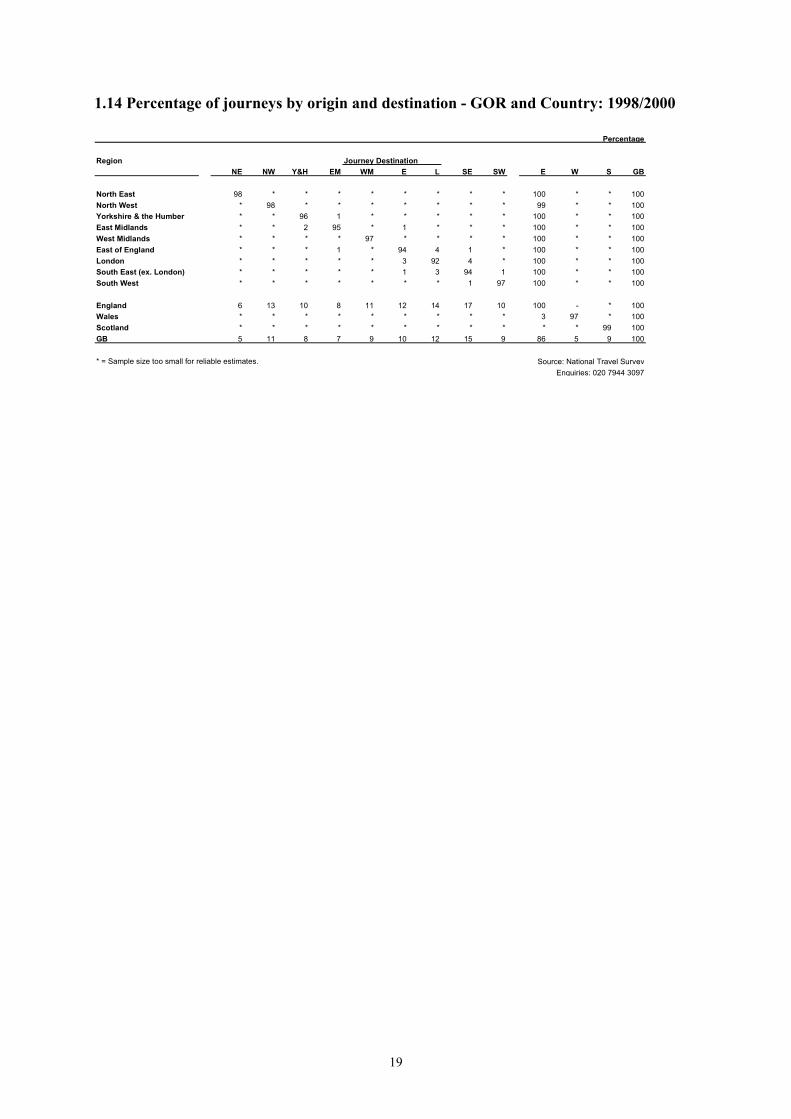
1.14 Percentage of journeys by origin and destination - GOR and Country: 1998/2000
Region Journey DestinationNE NW Y&H EM WM E L SE SW E W S GB
North East 98 * * * * * * * * 100 * * 100North West * 98 * * * * * * * 99 * * 100Yorkshire & the Humber * * 96 1 * * * * * 100 * * 100East Midlands * * 2 95 * 1 * * * 100 * * 100West Midlands * * * * 97 * * * * 100 * * 100East of England * * * 1 * 94 4 1 * 100 * * 100London * * * * * 3 92 4 * 100 * * 100South East (ex. London) * * * * * 1 3 94 1 100 * * 100South West * * * * * * * 1 97 100 * * 100
England 6 13 10 8 11 12 14 17 10 100 - * 100Wales * * * * * * * * * 3 97 * 100Scotland * * * * * * * * * * * 99 100GB 5 11 8 7 9 10 12 15 9 86 5 9 100
* = Sample size too small for reliable estimates.
Percentage
Source: National Travel SurveyEnquiries: 020 7944 3097

20

21
2. Public Transport

22
23
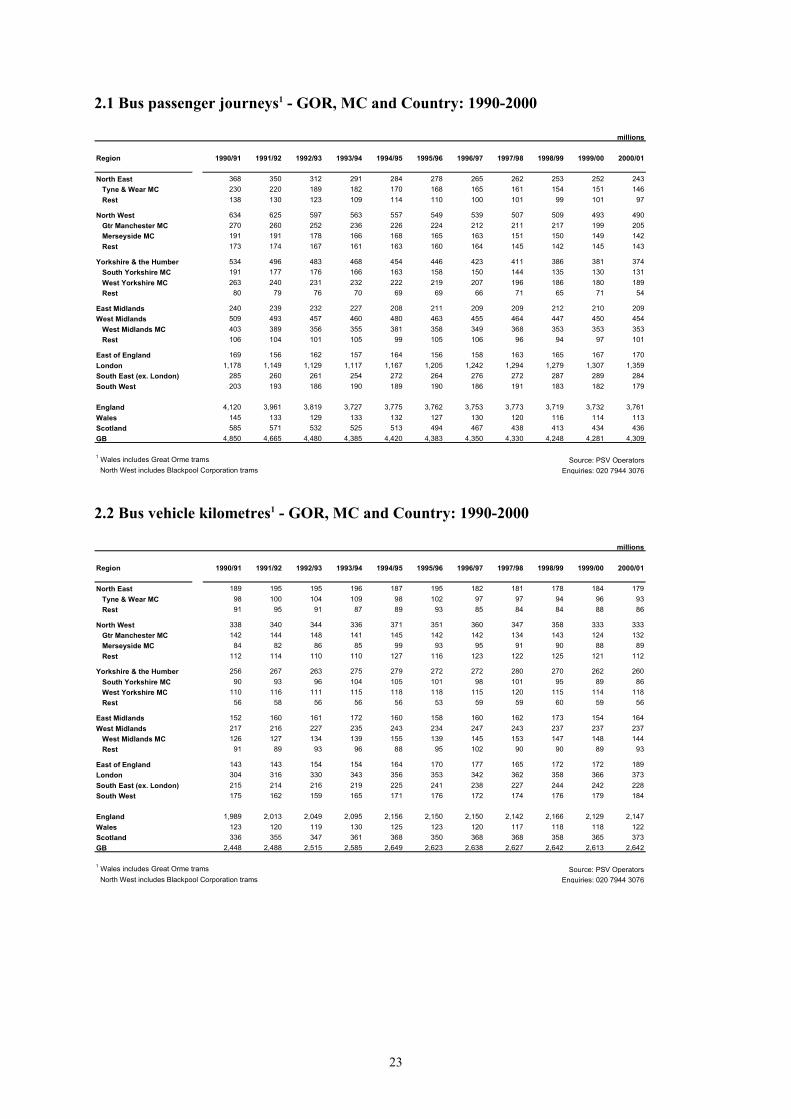
2.1 Bus passenger journeys1 - GOR, MC and Country: 1990-2000
millions
Region 1990/91 1991/92 1992/93 1993/94 1994/95 1995/96 1996/97 1997/98 1998/99 1999/00 2000/01
North East 368 350 312 291 284 278 265 262 253 252 243 Tyne & Wear MC 230 220 189 182 170 168 165 161 154 151 146 Rest 138 130 123 109 114 110 100 101 99 101 97
North West 634 625 597 563 557 549 539 507 509 493 490 Gtr Manchester MC 270 260 252 236 226 224 212 211 217 199 205 Merseyside MC 191 191 178 166 168 165 163 151 150 149 142 Rest 173 174 167 161 163 160 164 145 142 145 143
Yorkshire & the Humber 534 496 483 468 454 446 423 411 386 381 374 South Yorkshire MC 191 177 176 166 163 158 150 144 135 130 131 West Yorkshire MC 263 240 231 232 222 219 207 196 186 180 189 Rest 80 79 76 70 69 69 66 71 65 71 54
East Midlands 240 239 232 227 208 211 209 209 212 210 209West Midlands 509 493 457 460 480 463 455 464 447 450 454 West Midlands MC 403 389 356 355 381 358 349 368 353 353 353 Rest 106 104 101 105 99 105 106 96 94 97 101
East of England 169 156 162 157 164 156 158 163 165 167 170London 1,178 1,149 1,129 1,117 1,167 1,205 1,242 1,294 1,279 1,307 1,359South East (ex. London) 285 260 261 254 272 264 276 272 287 289 284South West 203 193 186 190 189 190 186 191 183 182 179
England 4,120 3,961 3,819 3,727 3,775 3,762 3,753 3,773 3,719 3,732 3,761Wales 145 133 129 133 132 127 130 120 116 114 113Scotland 585 571 532 525 513 494 467 438 413 434 436GB 4,850 4,665 4,480 4,385 4,420 4,383 4,350 4,330 4,248 4,281 4,309
1 Wales includes Great Orme trams North West includes Blackpool Corporation trams
Source: PSV OperatorsEnquiries: 020 7944 3076
2.2 Bus vehicle kilometres1 - GOR, MC and Country: 1990-2000
millions
Region 1990/91 1991/92 1992/93 1993/94 1994/95 1995/96 1996/97 1997/98 1998/99 1999/00 2000/01
North East 189 195 195 196 187 195 182 181 178 184 179 Tyne & Wear MC 98 100 104 109 98 102 97 97 94 96 93 Rest 91 95 91 87 89 93 85 84 84 88 86
North West 338 340 344 336 371 351 360 347 358 333 333 Gtr Manchester MC 142 144 148 141 145 142 142 134 143 124 132 Merseyside MC 84 82 86 85 99 93 95 91 90 88 89 Rest 112 114 110 110 127 116 123 122 125 121 112
Yorkshire & the Humber 256 267 263 275 279 272 272 280 270 262 260 South Yorkshire MC 90 93 96 104 105 101 98 101 95 89 86 West Yorkshire MC 110 116 111 115 118 118 115 120 115 114 118 Rest 56 58 56 56 56 53 59 59 60 59 56
East Midlands 152 160 161 172 160 158 160 162 173 154 164West Midlands 217 216 227 235 243 234 247 243 237 237 237 West Midlands MC 126 127 134 139 155 139 145 153 147 148 144 Rest 91 89 93 96 88 95 102 90 90 89 93
East of England 143 143 154 154 164 170 177 165 172 172 189London 304 316 330 343 356 353 342 362 358 366 373South East (ex. London) 215 214 216 219 225 241 238 227 244 242 228South West 175 162 159 165 171 176 172 174 176 179 184
England 1,989 2,013 2,049 2,095 2,156 2,150 2,150 2,142 2,166 2,129 2,147Wales 123 120 119 130 125 123 120 117 118 118 122Scotland 336 355 347 361 368 350 368 368 358 365 373GB 2,448 2,488 2,515 2,585 2,649 2,623 2,638 2,627 2,642 2,613 2,642
1 Wales includes Great Orme trams North West includes Blackpool Corporation trams
Source: PSV OperatorsEnquiries: 020 7944 3076
24
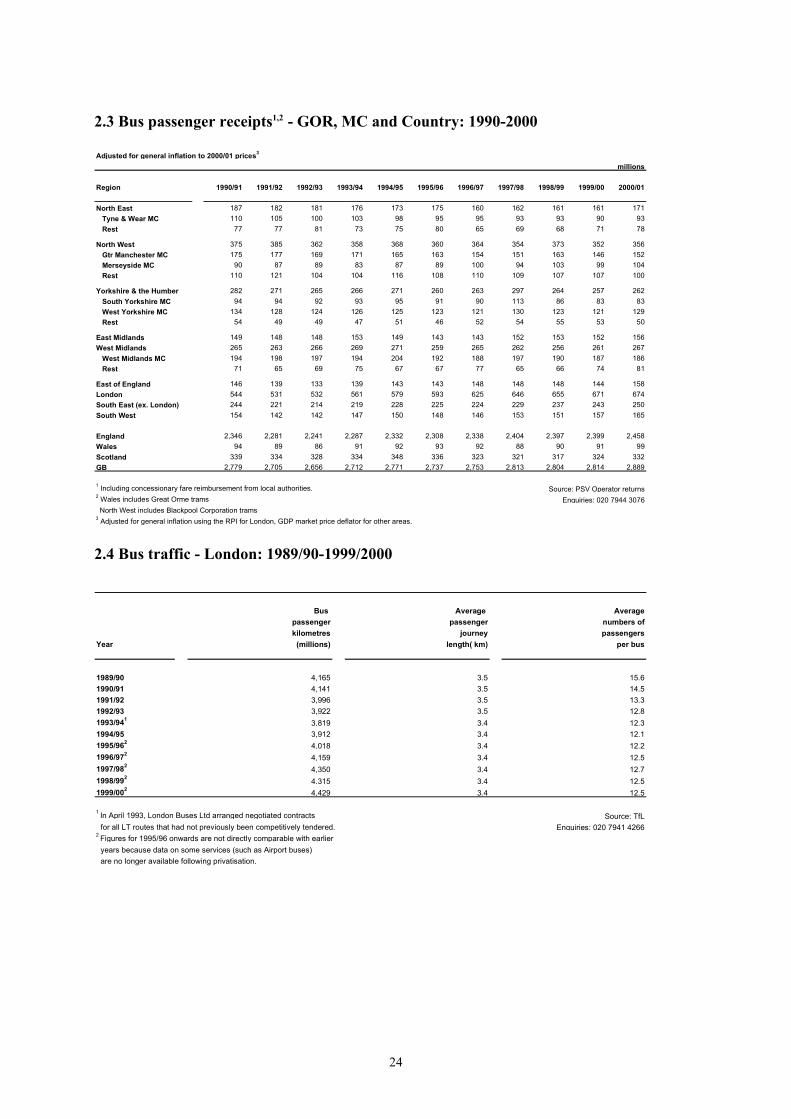
2.3 Bus passenger receipts1,2 - GOR, MC and Country: 1990-2000
Adjusted for general inflation to 2000/01 prices3
millions
Region 1990/91 1991/92 1992/93 1993/94 1994/95 1995/96 1996/97 1997/98 1998/99 1999/00 2000/01
North East 187 182 181 176 173 175 160 162 161 161 171 Tyne & Wear MC 110 105 100 103 98 95 95 93 93 90 93 Rest 77 77 81 73 75 80 65 69 68 71 78
North West 375 385 362 358 368 360 364 354 373 352 356 Gtr Manchester MC 175 177 169 171 165 163 154 151 163 146 152 Merseyside MC 90 87 89 83 87 89 100 94 103 99 104 Rest 110 121 104 104 116 108 110 109 107 107 100
Yorkshire & the Humber 282 271 265 266 271 260 263 297 264 257 262 South Yorkshire MC 94 94 92 93 95 91 90 113 86 83 83 West Yorkshire MC 134 128 124 126 125 123 121 130 123 121 129 Rest 54 49 49 47 51 46 52 54 55 53 50
East Midlands 149 148 148 153 149 143 143 152 153 152 156West Midlands 265 263 266 269 271 259 265 262 256 261 267 West Midlands MC 194 198 197 194 204 192 188 197 190 187 186 Rest 71 65 69 75 67 67 77 65 66 74 81
East of England 146 139 133 139 143 143 148 148 148 144 158London 544 531 532 561 579 593 625 646 655 671 674South East (ex. London) 244 221 214 219 228 225 224 229 237 243 250South West 154 142 142 147 150 148 146 153 151 157 165
England 2,346 2,281 2,241 2,287 2,332 2,308 2,338 2,404 2,397 2,399 2,458Wales 94 89 86 91 92 93 92 88 90 91 99Scotland 339 334 328 334 348 336 323 321 317 324 332GB 2,779 2,705 2,656 2,712 2,771 2,737 2,753 2,813 2,804 2,814 2,889
1 Including concessionary fare reimbursement from local authorities.2 Wales includes Great Orme trams North West includes Blackpool Corporation trams3 Adjusted for general inflation using the RPI for London, GDP market price deflator for other areas.
Source: PSV Operator returnsEnquiries: 020 7944 3076
2.4 Bus traffic - London: 1989/90-1999/2000
Bus Average Averagepassenger passenger numbers ofkilometres journey passengers
Year (millions) length( km) per bus
1989/90 4,165 3.5 15.61990/91 4,141 3.5 14.51991/92 3,996 3.5 13.31992/93 3,922 3.5 12.81993/941 3,819 3.4 12.31994/95 3,912 3.4 12.11995/962 4,018 3.4 12.21996/972 4,159 3.4 12.51997/982 4,350 3.4 12.71998/992 4,315 3.4 12.51999/002 4,429 3.4 12.5
1 In April 1993, London Buses Ltd arranged negotiated contracts for all LT routes that had not previously been competitively tendered.2 Figures for 1995/96 onwards are not directly comparable with earlier years because data on some services (such as Airport buses) are no longer available following privatisation.
Source: TfLEnquiries: 020 7941 4266

25
2.5 Bus passenger satisfaction - GOR and Country: 2000/01
Apr- Jul- Oct- Jan- Apr- Apr- Jul- Oct- Jan- Apr- Apr- Jul- Oct- Jan- Apr-Region Jun Sep Dec Mar Jun Jun Sep Dec Mar Jun Jun Sep Dec Mar Jun
2000 2000 2000 2001 2001 2000 2000 2000 2001 2001 2000 2000 2000 2001 2001
North East 82 84 81 81 85 65 67 62 61 66 .. .. 71 72 75North West 83 83 82 83 84 64 64 63 65 67 .. .. 75 78 76Yorkshire & the Humber 83 85 82 83 84 65 69 65 66 66 .. .. 70 72 74East Midlands 84 83 82 81 81 68 68 66 63 64 .. .. 75 71 70West Midlands 80 81 81 81 81 64 61 61 63 62 .. .. 74 73 72East of England 82 82 81 83 83 62 62 57 57 58 .. .. 69 69 67South East (ex. London) 81 82 80 81 80 61 60 59 61 63 .. .. 71 67 70South West 80 83 82 80 82 66 66 65 64 58 .. .. 69 69 68
London 74 75 73 74 75 66 67 64 64 65 .. .. 72 73 75
England 79 80 78 79 80 65 65 63 63 64 .. .. 72 72 73
Value for Money Overall Service Reliability
Apr- Jul- Oct- Jan- Apr- Apr- Jul- Oct- Jan- Apr-Region Jun Sep Dec Mar Jun Jun Sep Dec Mar Jun
2000 2000 2000 2001 2001 2000 2000 2000 2001 2001
North East 79 82 79 78 81 50 49 48 53 55North West 82 82 81 82 83 55 57 53 57 55Yorkshire & the Humber 82 84 83 82 83 58 65 65 61 61East Midlands 80 81 82 81 81 59 56 55 53 54West Midlands 77 78 77 77 77 44 43 41 45 46East of England 80 81 79 79 80 58 57 55 57 54South East (ex. London) 80 80 80 79 80 61 60 61 59 58South West 81 82 82 81 81 63 62 60 54 59
London 77 77 76 76 77 73 73 71 72 72
England 79 80 79 79 79 61 61 59 60 60
Source: DTLR &TfLEnquiries: 020 7944 3076
Composite average of 19 questions
of which Bus stop information
26
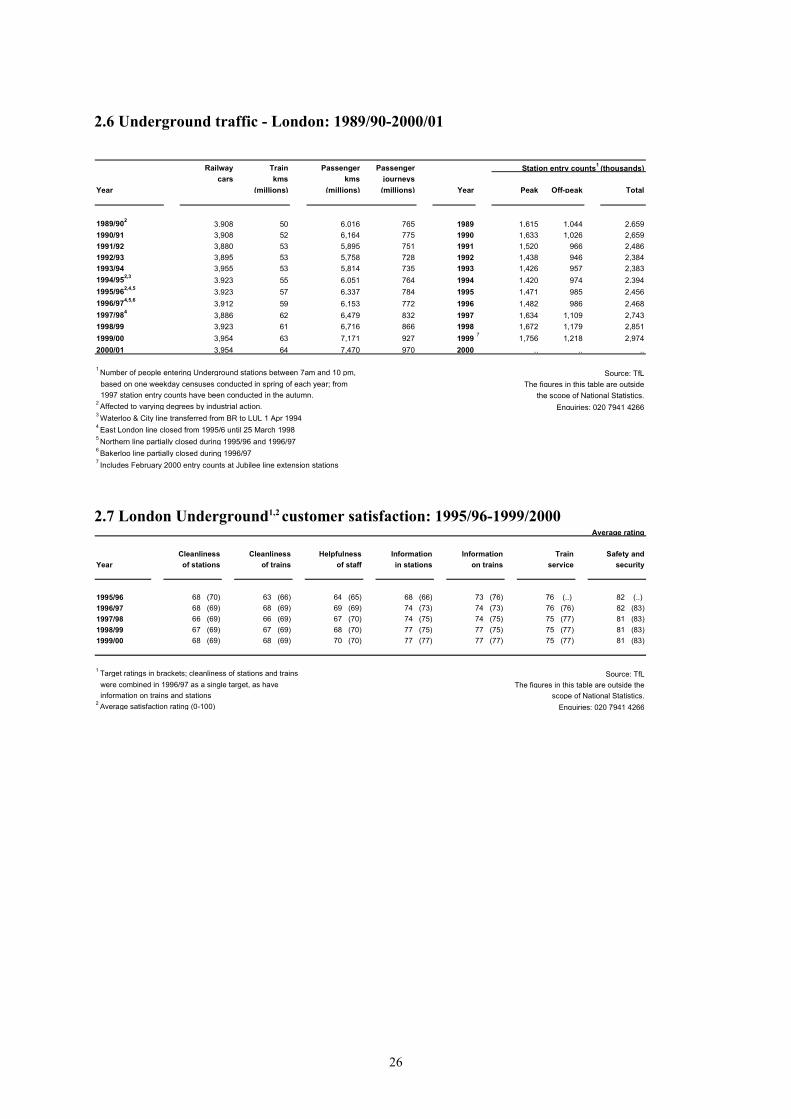
2.6 Underground traffic - London: 1989/90-2000/01
Railway Train Passenger Passengercars kms kms journeys
Year (millions) (millions) (millions) Year Peak Off-peak Total
1989/902 3,908 50 6,016 765 1989 1,615 1,044 2,6591990/91 3,908 52 6,164 775 1990 1,633 1,026 2,6591991/92 3,880 53 5,895 751 1991 1,520 966 2,4861992/93 3,895 53 5,758 728 1992 1,438 946 2,3841993/94 3,955 53 5,814 735 1993 1,426 957 2,3831994/952,3 3,923 55 6,051 764 1994 1,420 974 2,3941995/962,4,5 3,923 57 6,337 784 1995 1,471 985 2,4561996/974,5,6 3,912 59 6,153 772 1996 1,482 986 2,4681997/984 3,886 62 6,479 832 1997 1,634 1,109 2,7431998/99 3,923 61 6,716 866 1998 1,672 1,179 2,8511999/00 3,954 63 7,171 927 1999 7 1,756 1,218 2,9742000/01 3,954 64 7,470 970 2000 .. .. ..
1 Number of people entering Underground stations between 7am and 10 pm, based on one weekday censuses conducted in spring of each year; from 1997 station entry counts have been conducted in the autumn.2 Affected to varying degrees by industrial action.3 Waterloo & City line transferred from BR to LUL 1 Apr 19944 East London line closed from 1995/6 until 25 March 19985 Northern line partially closed during 1995/96 and 1996/976 Bakerloo line partially closed during 1996/977 Includes February 2000 entry counts at Jubilee line extension stations
Station entry counts1 (thousands)
Source: TfL
the scope of National Statistics.The figures in this table are outside
Enquiries: 020 7941 4266
2.7 London Underground1,2 customer satisfaction: 1995/96-1999/2000
Cleanliness Cleanliness Helpfulness Information Information Train Safety andYear of stations of trains of staff in stations on trains service security
1995/96 68 (70) 63 (66) 64 (65) 68 (66) 73 (76) 76 (..) 82 (..)1996/97 68 (69) 68 (69) 69 (69) 74 (73) 74 (73) 76 (76) 82 (83)1997/98 66 (69) 66 (69) 67 (70) 74 (75) 74 (75) 75 (77) 81 (83)1998/99 67 (69) 67 (69) 68 (70) 77 (75) 77 (75) 75 (77) 81 (83)1999/00 68 (69) 68 (69) 70 (70) 77 (77) 77 (77) 75 (77) 81 (83)
1 Target ratings in brackets; cleanliness of stations and trains were combined in 1996/97 as a single target, as have information on trains and stations2 Average satisfaction rating (0-100)
scope of National Statistics.Enquiries: 020 7941 4266
The figures in this table are outside the
Average rating
Source: TfL

27
2.8 London Underground and London Bus service reliability: 1989/90-1999/2000
Scheduled Timetabled ExcessKms operated services journey times2
(%) on time1 (%) (minutes)
Year Underground Bus Underground Actual Excess4
1989/905 91.5 61.0 .. 7.1 2.61990/91 95.0 62.9 .. 6.8 2.21991/92 97.2 66.4 .. 6.4 1.81992/93 97.5 68.7 .. 6.3 1.71993/94 96.5 66.7 .. 6.6 1.91994/95 96.8 69.7 .. 6.5 1.81995/965 96.2 71.4 .. 6.5 1.71996/97 94.5 70.3 .. 6.4 1.81997/98 95.5 70.0 .. 6.4 1.81998/99 93.6 69.0 3.2 6.6 2.01999/00 94.3 67.8 3.2 6.7 2.1
1 Applies to low frequency services; for buses between 2 mins early and 5 mins late2 Difference between actual and scheduled average journey times (unweighed) Excess journey times on the current basis are not available prior to 1998/993 Applies to high frequency services4 Excess = difference between actual and scheduled wait times5 Strike affected
Average bus wait time3 (minutes)
Enquiries: 020 7941 4266
Source: TFLThe figures in this table are
outside the scope ofNational Statistics.
2.9 Passenger journeys by rail - origin by destination - SRA Regions and Country: 2000/01
(a) by destination
North North Yorkshire & East West East South SouthOrigin West the Humber Midlands Midlands Anglia London East West England Wales Scotland GB
North1 56% 7% 11% 1% 2% 1% 10% 2% 1% 92% 0% 8% 100%North West2 1% 79% 5% 2% 3% 0% 6% 1% 1% 97% 1% 1% 100%Yorkshire & the Humber 3% 7% 73% 4% 1% 1% 7% 1% 1% 98% 0% 1% 100%East Midlands 1% 6% 7% 50% 8% 2% 21% 4% 1% 99% 0% 1% 100%West Midlands 1% 5% 1% 5% 68% 0% 12% 4% 2% 98% 2% 1% 100%East Anglia3 1% 1% 1% 3% 1% 36% 45% 11% 1% 99% 0% 1% 100%London 0% 1% 0% 1% 1% 1% 67% 27% 1% 100% 0% 0% 100%South East4 0% 0% 0% 0% 1% 1% 57% 39% 1% 100% 0% 0% 100%South West 1% 1% 1% 1% 2% 0% 21% 12% 57% 96% 3% 0% 100%
England 1% 6% 4% 2% 3% 1% 54% 25% 3% 99% 0% 0% 100%Wales 0% 4% 0% 0% 3% 0% 6% 2% 4% 20% 79% 0% 100%Scotland 1% 1% 1% 0% 0% 0% 1% 0% 0% 5% 0% 95% 100%GB 1% 5% 3% 2% 3% 1% 49% 23% 2% 91% 2% 7% 100%
1 Comprises GONE plus Cumbria.2 Comprises GONW less Cumbria.3 Comprises GOE less Beds, Herts and Essex.4 Comprises GOSE plus Beds, Herts and Essex.
Destination
Source: Strategic Rail AuthorityThe figures in this table are
outside the scope of National StatisticsEnquiries: 020 7944 3096

28
(b) by origin
North North Yorkshire & East West East South SouthOrigin West the Humber Midlands Midlands Anglia London East West England Wales Scotland GB
North1 57% 1% 3% 1% 1% 1% 0% 0% 1% 1% 0% 1% 1%North West2 6% 79% 7% 6% 5% 1% 1% 0% 1% 6% 4% 1% 5%Yorkshire & the Humber 11% 5% 73% 7% 1% 1% 0% 0% 1% 4% 0% 1% 3%East Midlands 1% 2% 4% 50% 5% 3% 1% 0% 1% 2% 0% 0% 2%West Midlands 2% 3% 1% 8% 68% 1% 1% 1% 2% 3% 3% 0% 3%East Anglia3 1% 0% 1% 2% 0% 36% 1% 1% 0% 1% 0% 0% 1%London 10% 6% 7% 21% 12% 45% 68% 57% 21% 54% 6% 1% 49%South East4 3% 1% 1% 4% 4% 11% 27% 39% 12% 25% 2% 0% 23%South West 1% 1% 1% 1% 2% 1% 1% 1% 57% 3% 4% 0% 2%
England 92% 98% 98% 99% 98% 99% 100% 100% 96% 99% 20% 5% 91%Wales 0% 1% 0% 0% 2% 0% 0% 0% 3% 0% 79% 0% 2%Scotland 8% 1% 1% 1% 1% 1% 0% 0% 0% 0% 0% 95% 7%GB 100% 100% 100% 100% 100% 100% 100% 100% 100% 100% 100% 100% 100%
1 Comprises GONE plus Cumbria.2 Comprises GONW less Cumbria.3 Comprises GOE less Beds, Herts and Essex.4 Comprises GOSE plus Beds, Herts and Essex.
outside the scope of National StatisticsEnquiries: 020 7944 3096
Source: Strategic Rail AuthorityThe figures in this table are
Destination
29
3. Road Vehicles

30
31
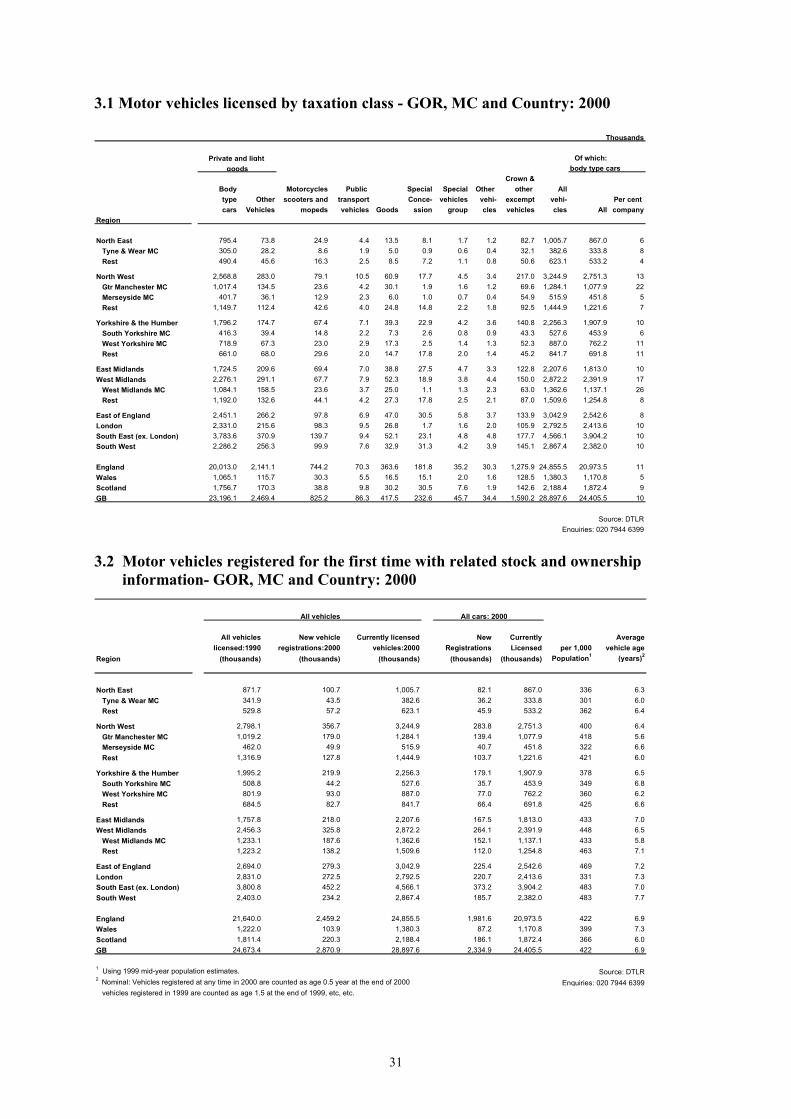
3.1 Motor vehicles licensed by taxation class - GOR, MC and Country: 2000
Of which:body type cars
Crown &Body Motorcycles Public Special Special Other other All type Other scooters and transport Conce- vehicles vehi- excempt vehi- Per cent cars Vehicles mopeds vehicles Goods ssion group cles vehicles cles All company
Region
North East 795.4 73.8 24.9 4.4 13.5 8.1 1.7 1.2 82.7 1,005.7 867.0 6 Tyne & Wear MC 305.0 28.2 8.6 1.9 5.0 0.9 0.6 0.4 32.1 382.6 333.8 8 Rest 490.4 45.6 16.3 2.5 8.5 7.2 1.1 0.8 50.6 623.1 533.2 4
North West 2,568.8 283.0 79.1 10.5 60.9 17.7 4.5 3.4 217.0 3,244.9 2,751.3 13 Gtr Manchester MC 1,017.4 134.5 23.6 4.2 30.1 1.9 1.6 1.2 69.6 1,284.1 1,077.9 22 Merseyside MC 401.7 36.1 12.9 2.3 6.0 1.0 0.7 0.4 54.9 515.9 451.8 5 Rest 1,149.7 112.4 42.6 4.0 24.8 14.8 2.2 1.8 92.5 1,444.9 1,221.6 7
Yorkshire & the Humber 1,796.2 174.7 67.4 7.1 39.3 22.9 4.2 3.6 140.8 2,256.3 1,907.9 10 South Yorkshire MC 416.3 39.4 14.8 2.2 7.3 2.6 0.8 0.9 43.3 527.6 453.9 6 West Yorkshire MC 718.9 67.3 23.0 2.9 17.3 2.5 1.4 1.3 52.3 887.0 762.2 11 Rest 661.0 68.0 29.6 2.0 14.7 17.8 2.0 1.4 45.2 841.7 691.8 11
East Midlands 1,724.5 209.6 69.4 7.0 38.8 27.5 4.7 3.3 122.8 2,207.6 1,813.0 10West Midlands 2,276.1 291.1 67.7 7.9 52.3 18.9 3.8 4.4 150.0 2,872.2 2,391.9 17 West Midlands MC 1,084.1 158.5 23.6 3.7 25.0 1.1 1.3 2.3 63.0 1,362.6 1,137.1 26 Rest 1,192.0 132.6 44.1 4.2 27.3 17.8 2.5 2.1 87.0 1,509.6 1,254.8 8
East of England 2,451.1 266.2 97.8 6.9 47.0 30.5 5.8 3.7 133.9 3,042.9 2,542.6 8London 2,331.0 215.6 98.3 9.5 26.8 1.7 1.6 2.0 105.9 2,792.5 2,413.6 10South East (ex. London) 3,783.6 370.9 139.7 9.4 52.1 23.1 4.8 4.8 177.7 4,566.1 3,904.2 10South West 2,286.2 256.3 99.9 7.6 32.9 31.3 4.2 3.9 145.1 2,867.4 2,382.0 10
England 20,013.0 2,141.1 744.2 70.3 363.6 181.8 35.2 30.3 1,275.9 24,855.5 20,973.5 11Wales 1,065.1 115.7 30.3 5.5 16.5 15.1 2.0 1.6 128.5 1,380.3 1,170.8 5Scotland 1,756.7 170.3 38.8 9.8 30.2 30.5 7.6 1.9 142.6 2,188.4 1,872.4 9GB 23,196.1 2,469.4 825.2 86.3 417.5 232.6 45.7 34.4 1,590.2 28,897.6 24,405.5 10
Thousands
Enquiries: 020 7944 6399Source: DTLR
goodsPrivate and light
3.2 Motor vehicles registered for the first time with related stock and ownership information- GOR, MC and Country: 2000
All vehicles All cars: 2000
All vehicles New vehicle Currently licensed New Currently Averagelicensed:1990 registrations:2000 vehicles:2000 Registrations Licensed per 1,000 vehicle age
Region (thousands) (thousands) (thousands) (thousands) (thousands) Population1 (years)2
North East 871.7 100.7 1,005.7 82.1 867.0 336 6.3 Tyne & Wear MC 341.9 43.5 382.6 36.2 333.8 301 6.0 Rest 529.8 57.2 623.1 45.9 533.2 362 6.4
North West 2,798.1 356.7 3,244.9 283.8 2,751.3 400 6.4 Gtr Manchester MC 1,019.2 179.0 1,284.1 139.4 1,077.9 418 5.6 Merseyside MC 462.0 49.9 515.9 40.7 451.8 322 6.6 Rest 1,316.9 127.8 1,444.9 103.7 1,221.6 421 6.0
Yorkshire & the Humber 1,995.2 219.9 2,256.3 179.1 1,907.9 378 6.5 South Yorkshire MC 508.8 44.2 527.6 35.7 453.9 349 6.8 West Yorkshire MC 801.9 93.0 887.0 77.0 762.2 360 6.2 Rest 684.5 82.7 841.7 66.4 691.8 425 6.6
East Midlands 1,757.8 218.0 2,207.6 167.5 1,813.0 433 7.0West Midlands 2,456.3 325.8 2,872.2 264.1 2,391.9 448 6.5 West Midlands MC 1,233.1 187.6 1,362.6 152.1 1,137.1 433 5.8 Rest 1,223.2 138.2 1,509.6 112.0 1,254.8 463 7.1
East of England 2,694.0 279.3 3,042.9 225.4 2,542.6 469 7.2London 2,831.0 272.5 2,792.5 220.7 2,413.6 331 7.3South East (ex. London) 3,800.8 452.2 4,566.1 373.2 3,904.2 483 7.0South West 2,403.0 234.2 2,867.4 185.7 2,382.0 483 7.7
England 21,640.0 2,459.2 24,855.5 1,981.6 20,973.5 422 6.9Wales 1,222.0 103.9 1,380.3 87.2 1,170.8 399 7.3Scotland 1,811.4 220.3 2,188.4 186.1 1,872.4 366 6.0GB 24,673.4 2,870.9 28,897.6 2,334.9 24,405.5 422 6.9
1 Using 1999 mid-year population estimates.2 Nominal: Vehicles registered at any time in 2000 are counted as age 0.5 year at the end of 2000 vehicles registered in 1999 are counted as age 1.5 at the end of 1999, etc, etc.
Enquiries: 020 7944 6399Source: DTLR

32

33
4. Road Traffic

34

35
4.1 Motor vehicle traffic by road class - GOR and Country: 1999
Non built-up major Built-up major Minor roadsNon All
Region Motorway Trunk Principal Total Trunk Principal Total Built-up Built-up Roads
North East 1.1 3.5 3.1 6.6 0.1 2.3 2.4 1.3 6.7 18.1North West 15.4 3.7 4.5 8.3 1.0 9.6 10.6 3.0 13.5 50.8Yorkshire & the Humber 8.3 4.5 4.4 8.9 0.8 6.4 7.2 3.7 10.7 38.9East Midlands 6.8 8.1 5.5 13.6 1.0 3.9 4.8 4.4 7.0 36.7West Midlands 12.2 4.9 4.6 9.5 1.0 6.6 7.5 4.3 12.3 45.8East of England 8.8 10.2 7.6 17.8 0.5 5.1 5.6 6.6 12.7 51.4London 2.7 3.2 0.5 3.7 2.9 10.6 13.5 0.0 9.6 29.4South East (ex. London) 22.9 9.8 12.4 22.2 0.6 9.4 10.0 8.6 18.9 82.6South West 7.4 5.9 8.1 14.0 0.3 5.4 5.7 6.7 10.3 44.1
England 85.5 53.6 50.8 104.5 8.2 59.2 67.4 38.6 101.7 397.8Wales 2.9 5.0 4.0 9.0 0.5 2.9 3.4 3.9 6.0 25.2Scotland 5.0 8.4 7.0 15.4 0.7 4.2 4.9 5.7 12.0 43.1GB 93.4 67.0 61.8 128.9 9.4 66.3 75.7 48.2 119.8 466.0
Source:DTLREnquiries: 020 7944 3095
Billion Vehicle Kilometres
4.2 Motor vehicle traffic by road class - GOR and Country: 2000
Non built-up major Built-up major Minor roadsNon All
Region Motorway Trunk Principal Total Trunk Principal Total Built-up Built-up Roads
North East 1.0 3.4 3.1 6.5 0.1 2.3 2.4 1.3 6.7 18.0North West 15.5 3.7 4.5 8.2 1.0 9.5 10.6 3.1 13.8 51.2Yorkshire & the Humber 8.5 4.5 4.4 8.8 0.8 6.4 7.2 4.0 10.8 39.3East Midlands 6.8 8.1 5.6 13.7 1.0 3.9 4.8 4.2 7.1 36.6West Midlands 12.4 4.8 4.7 9.5 1.0 6.5 7.5 4.3 12.6 46.3East of England 8.6 10.3 7.6 17.9 0.5 5.1 5.6 6.6 12.8 51.5London 2.5 3.2 0.6 3.8 3.0 10.6 13.6 0.0 9.3 29.2South East (ex. London) 23.3 9.8 12.8 22.5 0.5 9.4 10.0 8.4 19.1 83.3South West 7.4 5.9 8.1 14.0 0.3 5.4 5.7 6.6 10.5 44.2
England 85.9 53.7 51.3 105.0 8.2 59.2 67.4 38.5 102.9 399.7Wales 2.9 5.0 4.0 9.0 0.5 2.9 3.4 3.9 6.0 25.0Scotland 5.3 8.0 6.9 14.9 0.7 4.2 4.9 5.7 12.1 43.0GB 94.1 66.7 62.1 128.8 9.4 66.3 75.7 48.1 121.0 467.7
Source:DTLREnquiries: 020 7944 3095
Billion Vehicle Kilometres
4.3 Average daily motor vehicle flows1 by road class - GOR and Country: 1999
Major roads Minor roadsNon Non All
Region Motorway Built-up Built-up Built-up Built-up Roads
North East 49.6 14.4 13.0 0.7 2.2 3.1North West 67.2 10.7 15.3 0.8 1.7 3.7Yorkshire & the Humber 62.5 12.1 15.5 0.9 1.8 3.3East Midlands 96.9 13.2 13.4 0.8 1.5 3.3West Midlands 86.6 11.5 16.4 0.8 2.3 3.9East of England 90.8 17.5 13.8 1.0 2.0 3.6London 102.5 58.3 24.1 0.0 2.1 5.6South East (ex. London) 95.7 18.2 15.0 1.3 2.2 4.8South West 61.4 10.5 12.4 0.6 1.9 2.4
England 79.4 14.0 15.8 0.9 2.0 3.7Wales 57.7 7.8 9.5 0.6 1.8 2.1Scotland 38.1 4.6 11.6 0.5 1.8 2.0GB 74.2 10.8 15.0 0.8 1.9 3.3
1 Average daily flow is annual traffic divided by road length x365 Source:DTLREnquiries: 020 7944 3095
Thousand vehicles per day
36
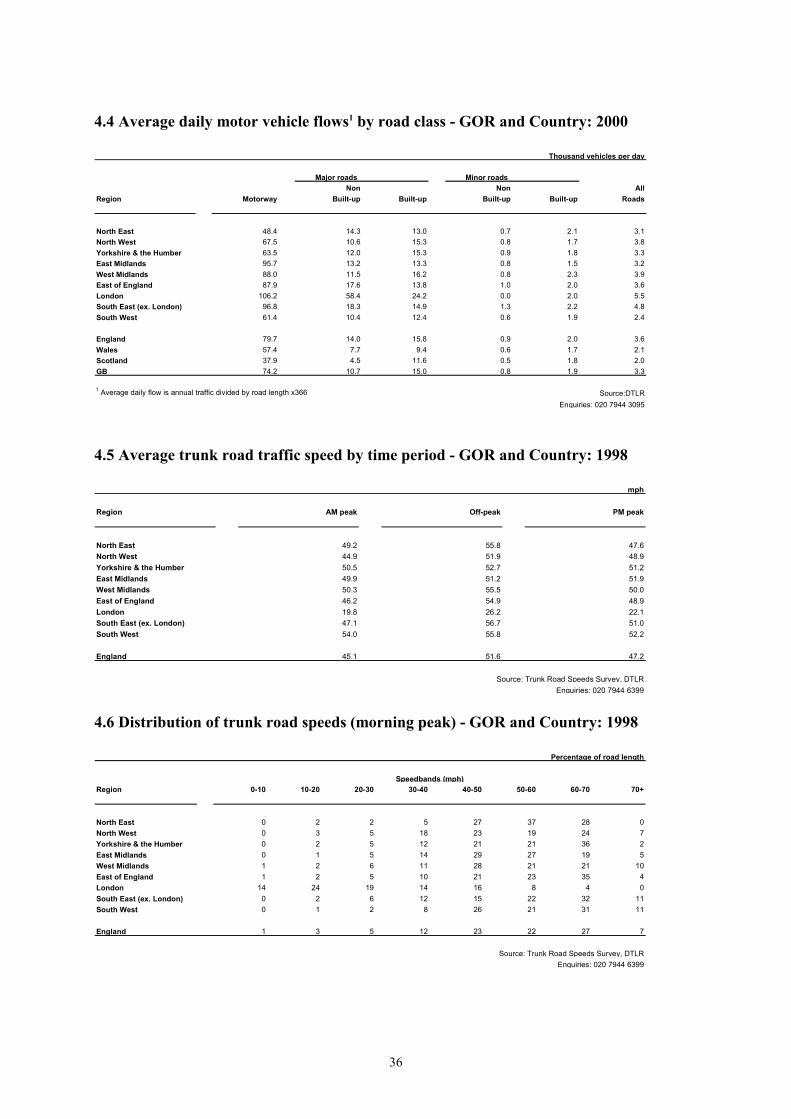
4.4 Average daily motor vehicle flows1 by road class - GOR and Country: 2000
4.5 Average trunk road traffic speed by time period - GOR and Country: 1998
mph
Region AM peak Off-peak PM peak
North East 49.2 55.8 47.6North West 44.9 51.9 48.9Yorkshire & the Humber 50.5 52.7 51.2East Midlands 49.9 51.2 51.9West Midlands 50.3 55.5 50.0East of England 46.2 54.9 48.9London 19.8 26.2 22.1South East (ex. London) 47.1 56.7 51.0South West 54.0 55.8 52.2
England 45.1 51.6 47.2
Source: Trunk Road Speeds Survey, DTLREnquiries: 020 7944 6399
4.6 Distribution of trunk road speeds (morning peak) - GOR and Country: 1998
Region 0-10 10-20 20-30 30-40 40-50 50-60 60-70 70+
North East 0 2 2 5 27 37 28 0North West 0 3 5 18 23 19 24 7Yorkshire & the Humber 0 2 5 12 21 21 36 2East Midlands 0 1 5 14 29 27 19 5West Midlands 1 2 6 11 28 21 21 10East of England 1 2 5 10 21 23 35 4London 14 24 19 14 16 8 4 0South East (ex. London) 0 2 6 12 15 22 32 11South West 0 1 2 8 26 21 31 11
England 1 3 5 12 23 22 27 7
Percentage of road length
Source: Trunk Road Speeds Survey, DTLREnquiries: 020 7944 6399
Speedbands (mph)
Major roads Minor roadsNon Non All
Region Motorway Built-up Built-up Built-up Built-up Roads
North East 48.4 14.3 13.0 0.7 2.1 3.1North West 67.5 10.6 15.3 0.8 1.7 3.8Yorkshire & the Humber 63.5 12.0 15.3 0.9 1.8 3.3East Midlands 95.7 13.2 13.3 0.8 1.5 3.2West Midlands 88.0 11.5 16.2 0.8 2.3 3.9East of England 87.9 17.6 13.8 1.0 2.0 3.6London 106.2 58.4 24.2 0.0 2.0 5.5South East (ex. London) 96.8 18.3 14.9 1.3 2.2 4.8South West 61.4 10.4 12.4 0.6 1.9 2.4
England 79.7 14.0 15.8 0.9 2.0 3.6Wales 57.4 7.7 9.4 0.6 1.7 2.1Scotland 37.9 4.5 11.6 0.5 1.8 2.0GB 74.2 10.7 15.0 0.8 1.9 3.3
1 Average daily flow is annual traffic divided by road length x366 Source:DTLREnquiries: 020 7944 3095
Thousand vehicles per day

37
4.7 Distribution of trunk road speeds (off-peak) - GOR and Country: 1998
Region 0-10 10-20 20-30 30-40 40-50 50-60 60-70 70+
North East 0 0 1 5 28 35 31 0North West 0 1 4 18 24 19 26 7Yorkshire & the Humber 0 1 5 11 25 20 34 3East Midlands 0 1 5 14 30 25 20 6West Midlands 0 1 4 12 28 22 23 10East of England 0 1 3 6 23 27 37 3London 5 19 25 18 17 8 8 0South East (ex. London) 0 1 3 8 17 21 43 7South West 0 0 2 9 25 20 31 13
England 0 2 4 11 24 22 30 6
Percentage of road length
Source: Trunk Road Speeds Survey, DTLREnquiries: 020 7944 6399
Speedbands (mph)
4.8 Distribution of trunk road speeds (evening peak) - GOR and Country: 1998
Region 0-10 10-20 20-30 30-40 40-50 50-60 60-70 70+
North East 0 1 3 6 23 36 31 0North West 0 2 4 19 25 21 24 7Yorkshire & the Humber 0 2 5 13 21 22 31 6East Midlands 0 2 4 12 25 30 23 5West Midlands 0 3 5 12 27 23 22 8East of England 1 1 4 7 20 28 35 5London 10 24 22 15 13 8 6 1South East (ex. London) 1 2 5 11 18 25 30 8South West 1 1 3 12 24 19 31 10
England 1 2 5 12 22 24 27 7
Percentage of road length
Source: Trunk Road Speeds Survey, DTLREnquiries: 020 7944 6399
Speedbands (mph)
4.9 Comparison of trunk road average speeds by time period - GOR and Country: 1995 & 1998
mph
Region 1995 1998 Change 1995 1998 Change 1995 1998 Change
North East 58.3 49.4 -8.9 56.6 56.0 -0.5 51.5 47.5 -4.0North West 53.5 45.1 -8.3 54.6 52.0 -2.6 54.6 49.4 -5.2Yorkshire & the Humber 50.0 50.9 0.9 52.2 53.2 1.0 53.6 51.8 -1.8East Midlands 48.3 49.4 1.1 49.3 50.8 1.4 52.2 51.4 -0.9West Midlands 55.2 51.0 -4.2 55.7 55.2 -0.5 52.8 50.4 -2.5East of England 51.0 46.0 -5.1 56.9 55.5 -1.4 56.6 49.1 -7.5London 28.1 19.8 -8.3 30.6 25.4 -5.1 26.3 22.2 -4.1South East (ex. London) 58.9 47.4 -11.4 60.5 56.8 -3.7 58.6 51.5 -7.1South West 56.0 54.8 -1.3 57.8 56.4 -1.5 59.3 53.3 -6.0
England 51.3 45.4 -5.9 53.3 51.8 -1.6 52.2 47.8 -4.4
AM peak
Enquiries: 020 7944 6399
Off-peak PM peak
Source: Trunk Road Speeds Survey, DTLR

38

39
5. Roads

40

41
5.1 Road lengths - GOR and Country: 1999
Non built-up major Built-up major Minor roads AllNon
Region Motorway Trunk Principal Total Trunk Principal Total Built-up Built-up Total
North East 58 424 825 1,249 12 492 504 5,544 8,476 14,021 15,832North West 627 686 1,421 2,107 164 1,729 1,893 10,670 21,800 32,470 37,096Yorkshire & the Humber 364 603 1,398 2,002 98 1,184 1,283 11,943 16,539 28,482 32,130East Midlands 193 1,073 1,763 2,836 146 845 991 14,495 12,373 26,867 30,887West Midlands 385 710 1,553 2,263 130 1,129 1,259 13,976 14,661 28,637 32,544East of England 267 1,054 1,723 2,777 85 1,025 1,110 17,838 17,062 34,900 39,053London 71 128 44 172 180 1,353 1,534 189 12,449 12,638 14,415South East (ex. London) 656 766 2,583 3,348 86 1,745 1,831 17,697 23,455 41,152 46,987South West 329 941 2,720 3,661 59 1,206 1,266 29,116 15,066 44,181 49,436
England 2,950 6,385 14,029 20,414 960 10,709 11,670 121,468 141,880 263,348 298,381Wales 137 1,368 1,787 3,155 172 799 971 19,054 9,305 28,359 32,622Scotland 361 2,729 6,428 9,157 154 1,006 1,160 29,731 18,229 47,959 58,638GB 3,448 10,482 22,244 32,726 1,287 12,514 13,801 170,253 169,414 339,667 389,641
Source:DTLREnquiries: 020 7944 3095
Kilometres
5.2 Road lengths - GOR and Country: 2000
Non built-up major Built-up major Minor roads AllNon
Region Motorway Trunk Principal Total Trunk Principal Total Built-up Built-up Total
North East 58 424 825 1,249 12 494 506 5,528 8,648 14,176 15,989North West 627 686 1,421 2,107 166 1,728 1,894 10,656 21,969 32,625 37,252Yorkshire & the Humber 364 603 1,406 2,009 98 1,187 1,286 11,881 16,674 28,555 32,214East Midlands 193 1,073 1,771 2,844 146 846 993 14,448 12,534 26,982 31,012West Midlands 385 710 1,553 2,263 130 1,132 1,261 13,886 14,820 28,707 32,616East of England 267 1,054 1,724 2,778 85 1,025 1,109 17,575 17,416 34,990 39,144London 66 125 51 176 177 1,357 1,534 190 12,623 12,812 14,587South East (ex. London) 656 766 2,606 3,372 86 1,746 1,832 17,474 23,963 41,437 47,297South West 329 941 2,725 3,666 59 1,206 1,266 29,069 15,372 44,440 49,700
England 2,944 6,382 14,081 20,463 958 10,721 11,679 120,705 144,019 264,724 299,810Wales 137 1,371 1,790 3,162 172 804 976 19,185 9,480 28,664 32,939Scotland 384 2,704 6,416 9,119 154 1,005 1,159 29,812 18,478 48,290 58,952GB 3,465 10,457 22,288 32,744 1,285 12,530 13,814 169,702 171,976 341,678 391,701
Source:DTLREnquiries: 020 7944 3095
Kilometres

42
5.3 Comparison of road condition - GOR and Country: 1998/2000
Three year average (1998-2000) England=100
Region1 Principal Non-Principal All Non-Trunk
North East Average 119.1 138.0 134.9Upper bound 137.7 148.4 144.5Lower bound 100.5 127.6 125.3
North West Average 103.4 98.7 99.5Upper bound 112.8 105.2 105.5Lower bound 94.0 92.1 93.5
Yorkshire & the Humber Average 107.4 103.3 104.1Upper bound 119.9 109.9 110.1Lower bound 94.9 96.8 98.0
East Midlands Average 90.4 94.3 93.7Upper bound 108.2 103.0 101.8Lower bound 72.6 85.6 85.7
West Midlands Average 114.4 112.3 112.7Upper bound 129.4 120.7 120.5Lower bound 99.4 103.9 104.9
East of England Average 97.1 105.8 104.4Upper bound 107.4 114.9 112.7Lower bound 86.8 96.6 96.1
South East (ex. London) Average 99.3 96.7 97.2Upper bound 111.0 103.3 103.3Lower bound 87.5 90.1 91.1
South West Average 85.3 80.7 81.5Upper bound 94.8 86.3 86.6Lower bound 75.8 75.1 76.3
Wales Average 88.9 101.3 99.3Upper bound 105.5 108.6 106.1Lower bound 72.2 94.0 92.5
1 London has been excluded because of its small sample size. Source: NRMCS, DTLREnquiries: 020 7944 3092

43
5.4 Defects indices - GOR and Country: 1992-2000
Region2 All Non-Trunk3
1992 1993 1994 1995 1996 1997 1998 1999 2000
North East Average 162.1 157.8 141.3 141.0 144.4 148.8 137.0 124.0 172.7Upper bound 172.8 169.0 151.6 150.6 153.4 158.3 145.7 130.4 182.4Lower bound 151.3 146.6 131.0 131.4 135.3 139.2 128.3 117.6 161.7
North West Average 98.1 95.9 110.3 110.0 101.2 109.3 107.6 115.8 104.2Upper bound 104.7 101.7 116.9 116.0 107.0 115.3 113.4 120.8 110.3Lower bound 91.4 90.0 103.6 104.0 95.4 103.3 101.8 110.8 98.0
Yorkshire & the Humber Average 92.9 92.5 96.6 95.2 98.0 110.6 105.8 104.2 120.8Upper bound 99.2 97.8 102.1 101.2 104.5 117.3 111.8 109.1 127.9Lower bound 86.5 87.1 91.0 89.2 91.4 103.9 99.8 99.2 113.8
East Midlands Average 80.9 88.4 101.4 104.5 103.2 93.5 87.1 118.2 97.6Upper bound 87.9 96.0 109.4 112.1 110.5 101.6 94.3 125.1 103.8Lower bound 73.8 80.7 93.4 96.8 95.8 85.3 79.9 111.4 91.4
West Midlands Average 84.1 79.2 86.7 101.4 95.9 125.4 119.8 137.3 106.2Upper bound 90.2 84.8 92.1 107.9 101.5 132.1 127.7 144.3 113.6Lower bound 78.0 73.6 81.3 94.9 90.3 118.6 111.9 130.3 98.8
East of England Average 102.3 104.1 106.8 103.7 100.0 104.1 112.5 116.8 111.3Upper bound 107.6 110.3 113.2 110.3 106.0 110.2 122.5 125.9 119.5Lower bound 97.0 97.9 100.3 97.1 94.0 97.9 102.5 107.6 103.1
South East (ex. London) Average 97.0 88.1 86.2 82.7 91.4 104.9 111.7 87.4 113.3Upper bound 102.4 93.2 91.4 87.5 96.6 110.9 118.3 91.6 119.5Lower bound 91.5 82.9 81.0 77.9 86.2 98.9 105.1 83.1 107.2
South West Average 101.4 107.9 90.9 91.5 92.6 82.7 88.0 86.9 86.5Upper bound 106.3 113.1 96.0 96.2 97.6 87.1 92.6 90.7 91.2Lower bound 96.5 102.6 85.8 86.8 87.6 78.3 83.4 83.1 81.9
Wales Average 104.6 109.7 97.4 92.6 95.7 98.8 99.2 107.9 86.9Upper bound 110.8 116.7 103.1 97.6 101.3 105.2 104.8 113.9 93.6Lower bound 98.4 102.7 91.7 87.5 90.0 92.4 93.5 101.6 80.1
England & Wales Average 100.2 102.0 101.5 100.8 101.9 106.5 107.6 108.8 111.3Upper bound 102.4 104.3 103.8 102.9 104.0 108.8 110.1 111.3 113.9Lower bound 98.0 99.8 99.3 98.7 99.7 104.2 105.1 106.2 108.7
1 The national average is 1977=100. Hence the values shown represent increases or decreases relative tothat national average. For example the mean value of 172.7 for all non-trunk roads in 2000 roadsthe North East Region implies that defects on these roads were on average 72.7% greater than on urban principalroads nationally in 1977.2 London has been excluded because of its small sample size.3 This is a weighted average which reflects the distribution of road lengths in each region. As this will differ from the national distribution, the regional figure for all non-trunk will differ from the national even if for each roadclass the regional index is equal to the corresponding national index.
Source: NRMCS, DTLREnquiries: 020 7944 3092
1977=1001

44
5.5 Regional expenditure on roads - GOR and Country: 1999/2000

45
46
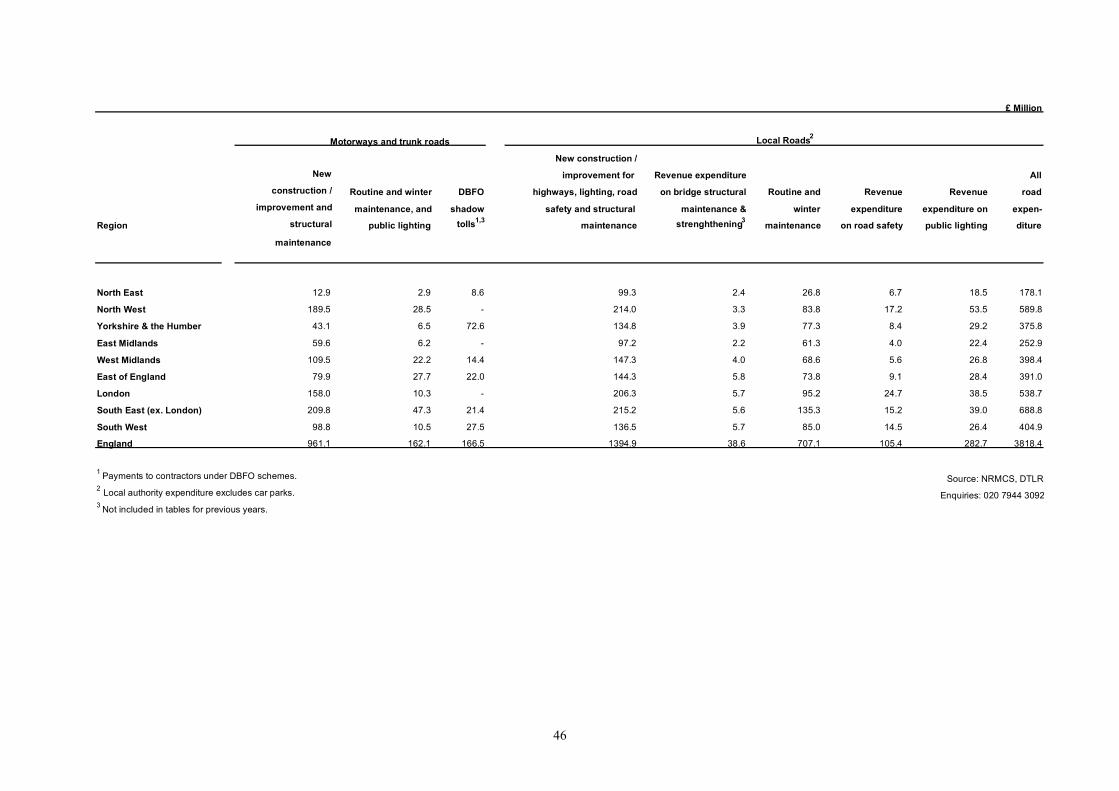
£ Million
Motorways and trunk roads Local Roads2
New construction /New improvement for Revenue expenditure All
construction / Routine and winter DBFO highways, lighting, road on bridge structural Routine and Revenue Revenue roadimprovement and maintenance, and shadow safety and structural maintenance & winter expenditure expenditure on expen-
Region structural public lighting tolls1,3 maintenance strenghthening3 maintenance on road safety public lighting diture
maintenance
North East 12.9 2.9 8.6 99.3 2.4 26.8 6.7 18.5 178.1
North West 189.5 28.5 - 214.0 3.3 83.8 17.2 53.5 589.8
Yorkshire & the Humber 43.1 6.5 72.6 134.8 3.9 77.3 8.4 29.2 375.8
East Midlands 59.6 6.2 - 97.2 2.2 61.3 4.0 22.4 252.9
West Midlands 109.5 22.2 14.4 147.3 4.0 68.6 5.6 26.8 398.4
East of England 79.9 27.7 22.0 144.3 5.8 73.8 9.1 28.4 391.0
London 158.0 10.3 - 206.3 5.7 95.2 24.7 38.5 538.7
South East (ex. London) 209.8 47.3 21.4 215.2 5.6 135.3 15.2 39.0 688.8
South West 98.8 10.5 27.5 136.5 5.7 85.0 14.5 26.4 404.9
England 961.1 162.1 166.5 1394.9 38.6 707.1 105.4 282.7 3818.4
1 Payments to contractors under DBFO schemes.2 Local authority expenditure excludes car parks.3 Not included in tables for previous years.
Source: NRMCS, DTLR
Enquiries: 020 7944 3092
47
6. Safety

48

49
6.1 Casualties - GOR, MC and Country: 1990-2000
Cases
Region 1990 1991 1992 1993 1994 1995 1996 1997 1998 1999 2000
North East 13,001 12,241 11,935 11,262 11,491 11,514 12,351 12,667 12,310 11,536 11,760 Tyne & Wear MC 5,077 4,977 4,818 4,342 4,748 4,703 5,080 5,285 5,110 5,043 5,243 Rest 7,924 7,264 7,117 6,920 6,743 6,811 7,271 7,382 7,200 6,493 6,517
North West 43,749 41,621 42,978 43,128 45,236 43,620 44,817 46,512 45,815 44,750 44,514 Gtr Manchester MC 17,197 16,074 16,500 16,192 16,872 16,189 16,472 16,947 17,007 16,488 16,993 Merseyside MC 9,511 9,816 10,141 10,437 10,151 9,173 9,651 9,981 9,814 9,959 9,898 Rest 17,041 15,731 16,337 16,499 18,213 18,258 18,694 19,584 18,994 18,303 17,623
Yorkshire & the Humber 28,455 26,086 26,599 26,031 27,310 27,279 28,892 29,918 30,639 29,759 29,564 South Yorkshire MC 6,379 5,712 5,858 6,003 6,185 5,926 6,429 6,434 6,576 6,761 6,665 West Yorkshire MC 11,551 11,001 11,111 10,763 11,528 11,923 12,861 13,574 14,487 13,641 13,725 Rest 10,525 9,373 9,630 9,265 9,597 9,430 9,602 9,910 9,576 9,357 9,174
East Midlands 24,852 22,397 22,175 22,207 22,375 22,331 22,845 23,943 24,087 23,597 23,582West Midlands 30,219 27,425 27,089 26,599 28,114 27,473 28,717 29,889 28,766 29,037 29,520 West Midlands MC 12,538 11,976 11,866 11,743 12,140 11,962 12,366 13,174 13,212 13,559 14,326 Rest 17,681 15,449 15,223 14,856 15,974 15,511 16,351 16,715 15,554 15,478 15,194
East of England 33,973 30,119 29,537 29,510 29,749 29,253 30,370 30,659 30,821 30,186 31,350London 51,995 46,677 46,497 46,042 46,007 45,176 45,733 46,432 45,679 45,978 46,003South East (ex. London) 46,198 41,860 42,727 41,895 43,976 43,408 46,428 45,642 45,135 45,070 44,565South West 25,034 22,515 22,302 22,728 23,413 23,500 23,876 24,706 24,964 25,213 24,863
England 297,476 270,941 271,839 269,402 277,671 273,554 284,029 290,368 288,216 285,126 285,721Wales 16,432 15,074 14,732 14,331 15,105 14,950 14,853 14,832 14,540 14,347 14,087Scotland 27,233 25,353 24,182 22,402 22,583 22,183 21,696 22,603 22,456 20,837 20,475GB 341,141 311,368 310,753 306,135 315,359 310,687 320,578 327,803 325,212 320,310 320,283
Source: DTLREnquiries: 020 7944 3078
6.2 Killed or seriously injured casualties - GOR, MC and Country: 1990-2000
Cases
Region 1990 1991 1992 1993 1994 1995 1996 1997 1998 1999 2000
North East 2,271 2,043 1,910 1,690 1,673 1,516 1,573 1,347 1,244 1,275 1,188 Tyne & Wear MC 1,006 928 827 713 744 634 644 535 453 516 438 Rest 1,265 1,115 1,083 977 929 882 929 812 791 759 750
North West 6,249 5,580 5,376 5,193 5,815 5,698 5,499 5,251 4,592 4,405 4,301 Gtr Manchester MC 2,075 1,940 1,752 1,605 1,526 1,334 1,310 1,225 1,006 1,124 1,124 Merseyside MC 1,094 1,128 1,070 998 923 823 858 838 763 688 759 Rest 3,080 2,512 2,554 2,590 3,366 3,541 3,331 3,188 2,823 2,593 2,418
Yorkshire & the Humber 5,978 5,202 5,110 4,603 4,357 4,444 4,180 4,157 3,894 3,803 3,606 South Yorkshire MC 1,002 909 845 696 715 746 742 731 725 733 686 West Yorkshire MC 2,235 1,966 1,923 1,614 1,526 1,622 1,503 1,413 1,356 1,300 1,298 Rest 2,741 2,327 2,342 2,293 2,116 2,076 1,935 2,013 1,813 1,770 1,622
East Midlands 5,045 4,173 4,145 3,940 3,905 4,140 4,134 4,019 3,900 3,739 3,483West Midlands 6,136 5,298 4,913 4,514 5,303 4,713 4,765 4,680 4,333 3,794 3,685 West Midlands MC 2,702 2,459 2,205 2,120 2,238 2,057 2,039 2,065 2,062 1,753 1,593 Rest 3,434 2,839 2,708 2,394 3,065 2,656 2,726 2,615 2,271 2,041 2,092
East of England 7,026 5,846 5,648 5,242 5,242 5,040 5,085 4,886 4,703 4,518 4,552London 8,923 7,891 7,244 6,430 6,204 6,520 6,852 7,035 6,870 5,961 6,106South East (ex. London) 8,769 6,829 6,809 6,273 6,305 6,160 6,283 5,814 5,632 6,086 5,924South West 5,424 4,555 4,153 3,916 3,608 3,455 3,206 3,064 2,977 3,051 3,021
England 55,821 47,417 45,308 41,801 42,412 41,686 41,577 40,253 38,145 36,632 35,866Wales 3,037 2,638 2,537 2,189 2,208 2,133 2,130 1,910 1,661 1,869 1,821Scotland 6,800 6,131 5,640 4,844 5,570 5,335 4,390 4,420 4,449 4,044 3,877GB 65,658 56,186 53,485 48,834 50,190 49,154 48,097 46,583 44,255 42,545 41,564
Source: DTLREnquiries: 020 7944 3078
50
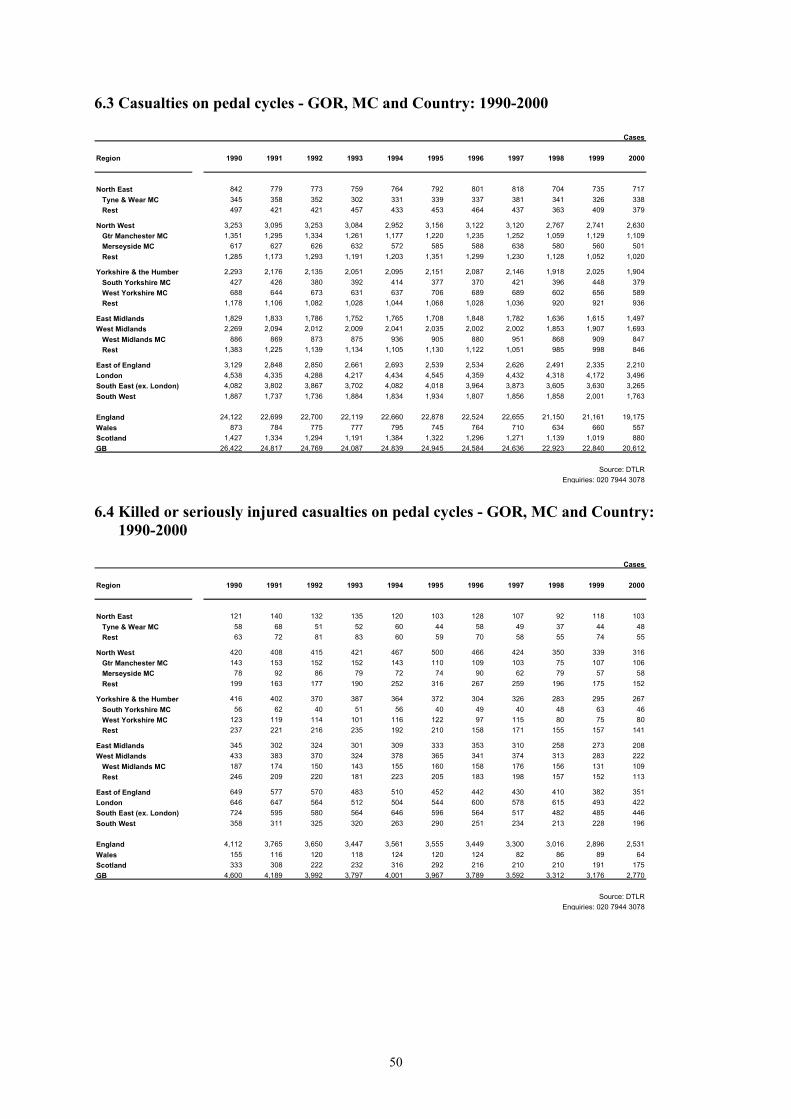
6.3 Casualties on pedal cycles - GOR, MC and Country: 1990-2000
Cases
Region 1990 1991 1992 1993 1994 1995 1996 1997 1998 1999 2000
North East 842 779 773 759 764 792 801 818 704 735 717 Tyne & Wear MC 345 358 352 302 331 339 337 381 341 326 338 Rest 497 421 421 457 433 453 464 437 363 409 379
North West 3,253 3,095 3,253 3,084 2,952 3,156 3,122 3,120 2,767 2,741 2,630 Gtr Manchester MC 1,351 1,295 1,334 1,261 1,177 1,220 1,235 1,252 1,059 1,129 1,109 Merseyside MC 617 627 626 632 572 585 588 638 580 560 501 Rest 1,285 1,173 1,293 1,191 1,203 1,351 1,299 1,230 1,128 1,052 1,020
Yorkshire & the Humber 2,293 2,176 2,135 2,051 2,095 2,151 2,087 2,146 1,918 2,025 1,904 South Yorkshire MC 427 426 380 392 414 377 370 421 396 448 379 West Yorkshire MC 688 644 673 631 637 706 689 689 602 656 589 Rest 1,178 1,106 1,082 1,028 1,044 1,068 1,028 1,036 920 921 936
East Midlands 1,829 1,833 1,786 1,752 1,765 1,708 1,848 1,782 1,636 1,615 1,497West Midlands 2,269 2,094 2,012 2,009 2,041 2,035 2,002 2,002 1,853 1,907 1,693 West Midlands MC 886 869 873 875 936 905 880 951 868 909 847 Rest 1,383 1,225 1,139 1,134 1,105 1,130 1,122 1,051 985 998 846
East of England 3,129 2,848 2,850 2,661 2,693 2,539 2,534 2,626 2,491 2,335 2,210London 4,538 4,335 4,288 4,217 4,434 4,545 4,359 4,432 4,318 4,172 3,496South East (ex. London) 4,082 3,802 3,867 3,702 4,082 4,018 3,964 3,873 3,605 3,630 3,265South West 1,887 1,737 1,736 1,884 1,834 1,934 1,807 1,856 1,858 2,001 1,763
England 24,122 22,699 22,700 22,119 22,660 22,878 22,524 22,655 21,150 21,161 19,175Wales 873 784 775 777 795 745 764 710 634 660 557Scotland 1,427 1,334 1,294 1,191 1,384 1,322 1,296 1,271 1,139 1,019 880GB 26,422 24,817 24,769 24,087 24,839 24,945 24,584 24,636 22,923 22,840 20,612
Source: DTLREnquiries: 020 7944 3078
6.4 Killed or seriously injured casualties on pedal cycles - GOR, MC and Country: 1990-2000
Cases
Region 1990 1991 1992 1993 1994 1995 1996 1997 1998 1999 2000
North East 121 140 132 135 120 103 128 107 92 118 103 Tyne & Wear MC 58 68 51 52 60 44 58 49 37 44 48 Rest 63 72 81 83 60 59 70 58 55 74 55
North West 420 408 415 421 467 500 466 424 350 339 316 Gtr Manchester MC 143 153 152 152 143 110 109 103 75 107 106 Merseyside MC 78 92 86 79 72 74 90 62 79 57 58 Rest 199 163 177 190 252 316 267 259 196 175 152
Yorkshire & the Humber 416 402 370 387 364 372 304 326 283 295 267 South Yorkshire MC 56 62 40 51 56 40 49 40 48 63 46 West Yorkshire MC 123 119 114 101 116 122 97 115 80 75 80 Rest 237 221 216 235 192 210 158 171 155 157 141
East Midlands 345 302 324 301 309 333 353 310 258 273 208West Midlands 433 383 370 324 378 365 341 374 313 283 222 West Midlands MC 187 174 150 143 155 160 158 176 156 131 109 Rest 246 209 220 181 223 205 183 198 157 152 113
East of England 649 577 570 483 510 452 442 430 410 382 351London 646 647 564 512 504 544 600 578 615 493 422South East (ex. London) 724 595 580 564 646 596 564 517 482 485 446South West 358 311 325 320 263 290 251 234 213 228 196
England 4,112 3,765 3,650 3,447 3,561 3,555 3,449 3,300 3,016 2,896 2,531Wales 155 116 120 118 124 120 124 82 86 89 64Scotland 333 308 222 232 316 292 216 210 210 191 175GB 4,600 4,189 3,992 3,797 4,001 3,967 3,789 3,592 3,312 3,176 2,770
Source: DTLREnquiries: 020 7944 3078

51
6.5 Child casualties - GOR, MC and Country: 1990-2000
Cases
Region 1990 1991 1992 1993 1994 1995 1996 1997 1998 1999 2000
North East 2,328 2,259 2,145 2,058 2,123 2,010 2,170 2,172 2,058 1,766 1,696 Tyne & Wear MC 1,021 975 920 853 921 864 893 954 853 750 770 Rest 1,307 1,284 1,225 1,205 1,202 1,146 1,277 1,218 1,205 1,016 926
North West 7,499 6,886 7,247 6,714 7,154 6,903 7,134 7,292 6,994 6,699 6,357 Gtr Manchester MC 3,194 2,911 3,013 2,705 2,906 2,717 2,753 2,871 2,762 2,694 2,626 Merseyside MC 1,735 1,631 1,735 1,692 1,675 1,515 1,596 1,702 1,647 1,599 1,507 Rest 2,570 2,344 2,499 2,317 2,573 2,671 2,785 2,719 2,585 2,406 2,224
Yorkshire & the Humber 4,617 4,230 4,273 4,013 4,487 4,365 4,570 4,618 4,543 4,348 4,245 South Yorkshire MC 1,106 1,024 1,000 962 1,172 1,035 1,092 1,158 1,116 1,129 1,022 West Yorkshire MC 2,038 1,889 1,920 1,766 1,903 1,957 2,104 1,961 2,094 1,939 1,930 Rest 1,473 1,317 1,353 1,285 1,412 1,373 1,374 1,499 1,333 1,280 1,293
East Midlands 3,434 3,205 3,000 3,134 3,105 3,101 3,168 3,121 3,223 3,035 2,930West Midlands 4,701 4,303 4,124 4,002 4,329 4,142 4,432 4,291 4,184 4,250 3,980 West Midlands MC 2,464 2,301 2,243 2,223 2,253 2,209 2,276 2,246 2,282 2,306 2,272 Rest 2,237 2,002 1,881 1,779 2,076 1,933 2,156 2,045 1,902 1,944 1,708
East of England 4,124 3,684 3,514 3,489 3,642 3,619 3,650 3,498 3,521 3,334 3,335London 6,305 5,656 5,657 5,375 5,431 5,219 5,014 5,090 5,029 4,932 4,593South East (ex. London) 5,573 5,016 5,162 4,987 5,486 5,314 5,607 5,333 5,145 5,178 4,744South West 2,990 2,672 2,691 2,802 2,870 2,925 2,971 3,133 3,032 3,195 2,829
England 41,571 37,911 37,813 36,574 38,627 37,598 38,716 38,548 37,729 36,737 34,709Wales 2,460 2,343 2,323 2,334 2,359 2,257 2,296 2,205 2,185 2,135 2,006Scotland 4,609 4,156 4,051 3,685 4,166 3,934 3,825 3,793 3,531 3,179 3,000GB 48,640 44,410 44,187 42,593 45,152 43,789 44,837 44,546 43,445 42,051 39,715
Source: DTLREnquiries: 020 7944 3078
6.6 Killed or seriously injured child casualties - GOR, MC and Country: 1990-2000
Cases
Region 1990 1991 1992 1993 1994 1995 1996 1997 1998 1999 2000
North East 440 439 400 404 400 286 313 295 242 271 210 Tyne & Wear MC 234 232 194 200 203 137 148 147 98 133 94 Rest 206 207 206 204 197 149 165 148 144 138 116
North West 1,205 1,100 1,110 945 1,077 1,030 984 998 830 767 703 Gtr Manchester MC 478 457 454 346 353 309 298 312 248 270 236 Merseyside MC 278 265 244 223 224 178 199 203 191 153 154 Rest 449 378 412 376 500 543 487 483 391 344 313
Yorkshire & the Humber 862 834 781 726 733 729 700 618 616 587 550 South Yorkshire MC 176 170 129 112 159 132 170 127 140 151 122 West Yorkshire MC 379 361 339 302 289 320 263 237 253 243 230 Rest 307 303 313 312 285 277 267 254 223 193 198
East Midlands 705 522 558 537 517 562 556 501 532 457 429West Midlands 913 810 748 693 802 754 715 646 621 588 472 West Midlands MC 548 502 443 430 443 429 419 398 384 368 285 Rest 365 308 305 263 359 325 296 248 237 220 187
East of England 769 597 624 602 623 599 600 513 494 461 471London 1,309 1,166 1,084 858 882 958 921 957 962 764 724South East (ex. London) 994 730 750 680 731 718 701 598 577 616 584South West 527 495 438 439 395 369 373 332 286 318 274
England 7,724 6,693 6,493 5,884 6,160 6,005 5,863 5,458 5,160 4,829 4,417Wales 432 347 354 319 336 298 336 250 222 244 224Scotland 1,131 1,021 897 773 1,029 950 790 744 697 626 561GB 9,287 8,061 7,744 6,976 7,525 7,253 6,989 6,452 6,079 5,699 5,202
Source: DTLREnquiries: 020 7944 3078
52
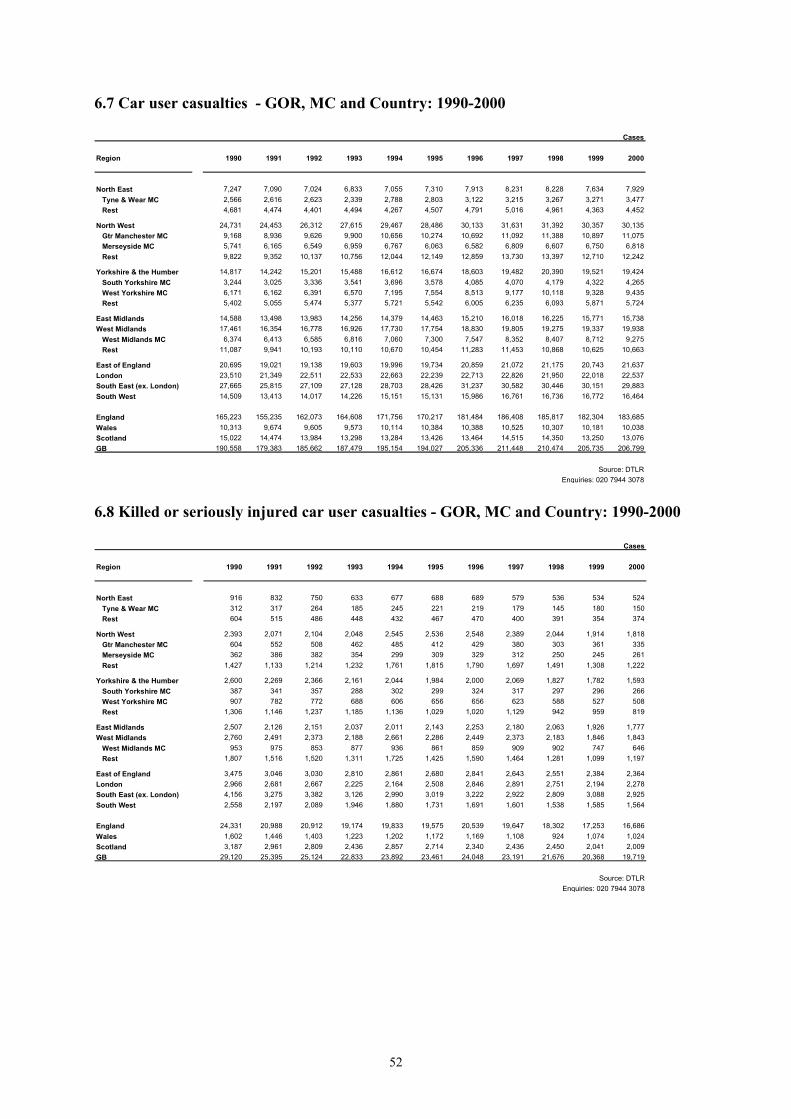
6.7 Car user casualties - GOR, MC and Country: 1990-2000
Cases
Region 1990 1991 1992 1993 1994 1995 1996 1997 1998 1999 2000
North East 7,247 7,090 7,024 6,833 7,055 7,310 7,913 8,231 8,228 7,634 7,929 Tyne & Wear MC 2,566 2,616 2,623 2,339 2,788 2,803 3,122 3,215 3,267 3,271 3,477 Rest 4,681 4,474 4,401 4,494 4,267 4,507 4,791 5,016 4,961 4,363 4,452
North West 24,731 24,453 26,312 27,615 29,467 28,486 30,133 31,631 31,392 30,357 30,135 Gtr Manchester MC 9,168 8,936 9,626 9,900 10,656 10,274 10,692 11,092 11,388 10,897 11,075 Merseyside MC 5,741 6,165 6,549 6,959 6,767 6,063 6,582 6,809 6,607 6,750 6,818 Rest 9,822 9,352 10,137 10,756 12,044 12,149 12,859 13,730 13,397 12,710 12,242
Yorkshire & the Humber 14,817 14,242 15,201 15,488 16,612 16,674 18,603 19,482 20,390 19,521 19,424 South Yorkshire MC 3,244 3,025 3,336 3,541 3,696 3,578 4,085 4,070 4,179 4,322 4,265 West Yorkshire MC 6,171 6,162 6,391 6,570 7,195 7,554 8,513 9,177 10,118 9,328 9,435 Rest 5,402 5,055 5,474 5,377 5,721 5,542 6,005 6,235 6,093 5,871 5,724
East Midlands 14,588 13,498 13,983 14,256 14,379 14,463 15,210 16,018 16,225 15,771 15,738West Midlands 17,461 16,354 16,778 16,926 17,730 17,754 18,830 19,805 19,275 19,337 19,938 West Midlands MC 6,374 6,413 6,585 6,816 7,060 7,300 7,547 8,352 8,407 8,712 9,275 Rest 11,087 9,941 10,193 10,110 10,670 10,454 11,283 11,453 10,868 10,625 10,663
East of England 20,695 19,021 19,138 19,603 19,996 19,734 20,859 21,072 21,175 20,743 21,637London 23,510 21,349 22,511 22,533 22,663 22,239 22,713 22,826 21,950 22,018 22,537South East (ex. London) 27,665 25,815 27,109 27,128 28,703 28,426 31,237 30,582 30,446 30,151 29,883South West 14,509 13,413 14,017 14,226 15,151 15,131 15,986 16,761 16,736 16,772 16,464
England 165,223 155,235 162,073 164,608 171,756 170,217 181,484 186,408 185,817 182,304 183,685Wales 10,313 9,674 9,605 9,573 10,114 10,384 10,388 10,525 10,307 10,181 10,038Scotland 15,022 14,474 13,984 13,298 13,284 13,426 13,464 14,515 14,350 13,250 13,076GB 190,558 179,383 185,662 187,479 195,154 194,027 205,336 211,448 210,474 205,735 206,799
Source: DTLREnquiries: 020 7944 3078
6.8 Killed or seriously injured car user casualties - GOR, MC and Country: 1990-2000
Cases
Region 1990 1991 1992 1993 1994 1995 1996 1997 1998 1999 2000
North East 916 832 750 633 677 688 689 579 536 534 524 Tyne & Wear MC 312 317 264 185 245 221 219 179 145 180 150 Rest 604 515 486 448 432 467 470 400 391 354 374
North West 2,393 2,071 2,104 2,048 2,545 2,536 2,548 2,389 2,044 1,914 1,818 Gtr Manchester MC 604 552 508 462 485 412 429 380 303 361 335 Merseyside MC 362 386 382 354 299 309 329 312 250 245 261 Rest 1,427 1,133 1,214 1,232 1,761 1,815 1,790 1,697 1,491 1,308 1,222
Yorkshire & the Humber 2,600 2,269 2,366 2,161 2,044 1,984 2,000 2,069 1,827 1,782 1,593 South Yorkshire MC 387 341 357 288 302 299 324 317 297 296 266 West Yorkshire MC 907 782 772 688 606 656 656 623 588 527 508 Rest 1,306 1,146 1,237 1,185 1,136 1,029 1,020 1,129 942 959 819
East Midlands 2,507 2,126 2,151 2,037 2,011 2,143 2,253 2,180 2,063 1,926 1,777West Midlands 2,760 2,491 2,373 2,188 2,661 2,286 2,449 2,373 2,183 1,846 1,843 West Midlands MC 953 975 853 877 936 861 859 909 902 747 646 Rest 1,807 1,516 1,520 1,311 1,725 1,425 1,590 1,464 1,281 1,099 1,197
East of England 3,475 3,046 3,030 2,810 2,861 2,680 2,841 2,643 2,551 2,384 2,364London 2,966 2,681 2,667 2,225 2,164 2,508 2,846 2,891 2,751 2,194 2,278South East (ex. London) 4,156 3,275 3,382 3,126 2,990 3,019 3,222 2,922 2,809 3,088 2,925South West 2,558 2,197 2,089 1,946 1,880 1,731 1,691 1,601 1,538 1,585 1,564
England 24,331 20,988 20,912 19,174 19,833 19,575 20,539 19,647 18,302 17,253 16,686Wales 1,602 1,446 1,403 1,223 1,202 1,172 1,169 1,108 924 1,074 1,024Scotland 3,187 2,961 2,809 2,436 2,857 2,714 2,340 2,436 2,450 2,041 2,009GB 29,120 25,395 25,124 22,833 23,892 23,461 24,048 23,191 21,676 20,368 19,719
Source: DTLREnquiries: 020 7944 3078

53
6.9 Two wheeled motor vehicle user casualties - GOR, MC and Country: 1990-2000
Cases
Region 1990 1991 1992 1993 1994 1995 1996 1997 1998 1999 2000
North East 814 601 543 453 454 361 378 392 421 482 549 Tyne & Wear MC 262 195 186 162 149 107 141 130 159 186 205 Rest 552 406 357 291 305 254 237 262 262 296 344
North West 3,665 3,038 2,519 2,267 2,138 2,033 1,871 2,003 1,989 2,252 2,642 Gtr Manchester MC 1,366 1,077 824 762 625 601 511 605 562 633 854 Merseyside MC 451 445 399 357 347 305 316 320 334 415 504 Rest 1,848 1,516 1,296 1,148 1,166 1,127 1,044 1,078 1,093 1,204 1,284
Yorkshire & the Humber 3,434 2,587 2,179 1,854 1,807 1,769 1,684 1,625 1,716 1,859 2,017 South Yorkshire MC 577 473 369 333 359 286 306 268 294 349 423 West Yorkshire MC 1,133 845 727 545 561 549 529 539 618 677 754 Rest 1,724 1,269 1,083 976 887 934 849 818 804 833 840
East Midlands 3,145 2,341 2,106 1,894 1,843 1,728 1,618 1,705 1,673 1,883 1,900West Midlands 3,179 2,367 2,086 1,908 1,872 1,815 1,754 1,804 1,699 1,743 1,957 West Midlands MC 1,136 842 765 699 648 599 612 627 634 645 764 Rest 2,043 1,525 1,321 1,209 1,224 1,216 1,142 1,177 1,065 1,098 1,193
East of England 4,242 3,285 2,749 2,698 2,481 2,377 2,302 2,430 2,418 2,537 2,773London 7,324 6,050 5,612 5,560 5,540 5,487 5,975 6,559 6,855 7,300 7,698South East (ex. London) 6,246 4,888 4,320 4,028 4,067 3,908 3,940 4,099 3,940 4,102 4,279South West 3,846 3,016 2,529 2,477 2,362 2,263 2,045 2,149 2,179 2,225 2,459
England 35,895 28,173 24,643 23,139 22,564 21,741 21,567 22,766 22,890 24,383 26,274Wales 1,471 1,173 1,012 850 860 812 716 778 745 794 812Scotland 1,682 1,405 1,236 1,105 930 971 850 948 975 1,015 1,126GB 39,048 30,751 26,891 25,094 24,354 23,524 23,133 24,492 24,610 26,192 28,212
Source: DTLREnquiries: 020 7944 3078
6.10 Killed or seriously injured two wheeled motor vehicle user casualties - GOR, MC and Country: 1990-2000
Cases
Region 1990 1991 1992 1993 1994 1995 1996 1997 1998 1999 2000
North East 257 189 179 136 149 112 145 122 134 146 159 Tyne & Wear MC 103 66 72 54 51 26 52 29 48 47 49 Rest 154 123 107 82 98 86 93 93 86 99 110
North West 893 792 670 656 637 673 582 619 588 654 704 Gtr Manchester MC 257 264 187 180 138 139 113 138 107 130 161 Merseyside MC 102 109 120 109 75 76 75 86 89 92 121 Rest 534 419 363 367 424 458 394 395 392 432 422
Yorkshire & the Humber 1,061 818 708 583 551 607 554 535 541 634 636 South Yorkshire MC 139 134 106 76 96 87 74 88 87 111 134 West Yorkshire MC 330 259 238 162 149 180 157 145 160 205 207 Rest 592 425 364 345 306 340 323 302 294 318 295
East Midlands 955 652 624 614 612 597 567 568 604 674 633West Midlands 1,023 729 610 612 632 617 586 595 566 512 562 West Midlands MC 371 268 221 223 220 204 192 188 203 188 191 Rest 652 461 389 389 412 413 394 407 363 324 371
East of England 1,399 992 840 835 777 788 698 771 765 806 894London 1,423 1,198 974 949 879 848 926 994 1,021 1,065 1,195South East (ex. London) 1,822 1,310 1,127 1,098 1,151 1,091 1,049 1,083 1,080 1,138 1,214South West 1,247 986 794 742 660 616 543 553 548 580 611
England 10,080 7,666 6,526 6,225 6,048 5,949 5,650 5,840 5,847 6,209 6,608Wales 432 350 321 257 265 271 258 248 225 274 295Scotland 609 486 491 400 353 395 300 358 370 425 471GB 11,121 8,502 7,338 6,882 6,666 6,615 6,208 6,446 6,442 6,908 7,374
Source: DTLREnquiries: 020 7944 3078

54
55
7. Road Freight

56
57
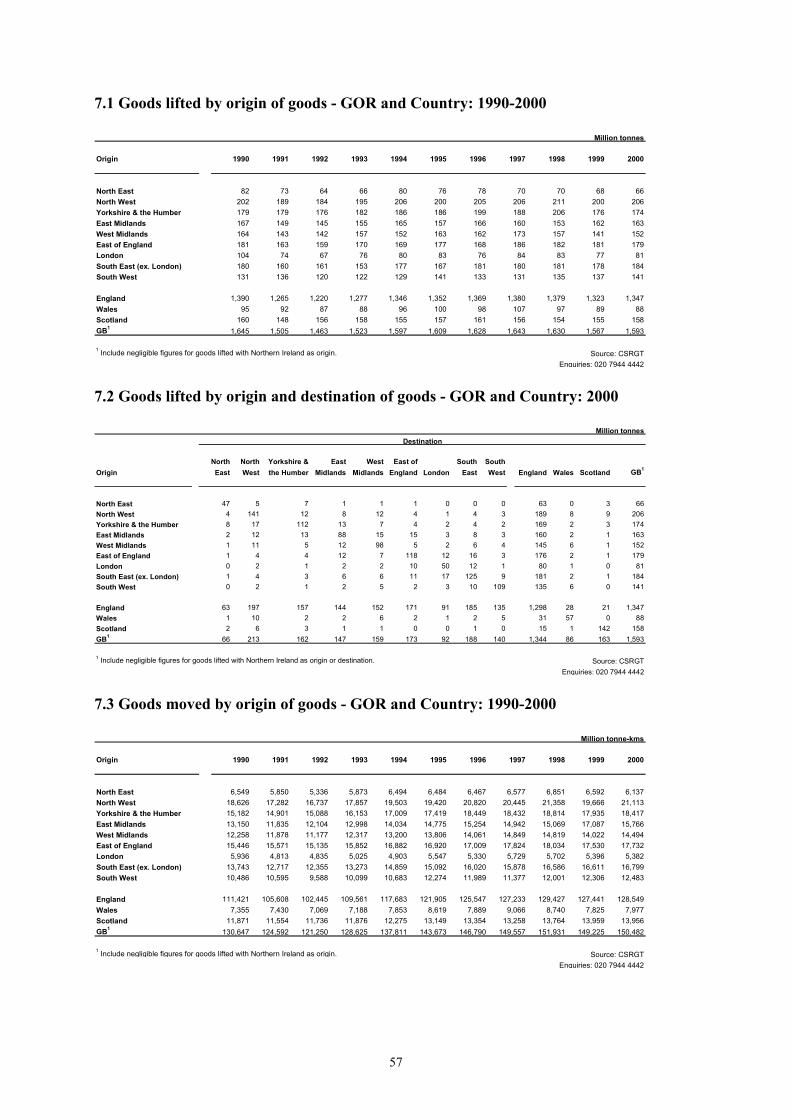
7.1 Goods lifted by origin of goods - GOR and Country: 1990-2000
Origin 1990 1991 1992 1993 1994 1995 1996 1997 1998 1999 2000
North East 82 73 64 66 80 76 78 70 70 68 66North West 202 189 184 195 206 200 205 206 211 200 206Yorkshire & the Humber 179 179 176 182 186 186 199 188 206 176 174East Midlands 167 149 145 155 165 157 166 160 153 162 163West Midlands 164 143 142 157 152 163 162 173 157 141 152East of England 181 163 159 170 169 177 168 186 182 181 179London 104 74 67 76 80 83 76 84 83 77 81South East (ex. London) 180 160 161 153 177 167 181 180 181 178 184South West 131 136 120 122 129 141 133 131 135 137 141
England 1,390 1,265 1,220 1,277 1,346 1,352 1,369 1,380 1,379 1,323 1,347Wales 95 92 87 88 96 100 98 107 97 89 88Scotland 160 148 156 158 155 157 161 156 154 155 158GB1 1,645 1,505 1,463 1,523 1,597 1,609 1,628 1,643 1,630 1,567 1,593
1 Include negligible figures for goods lifted with Northern Ireland as origin. Source: CSRGTEnquiries: 020 7944 4442
Million tonnes
7.2 Goods lifted by origin and destination of goods - GOR and Country: 2000
North North Yorkshire & East West East of South SouthOrigin East West the Humber Midlands Midlands England London East West England Wales Scotland GB1
North East 47 5 7 1 1 1 0 0 0 63 0 3 66North West 4 141 12 8 12 4 1 4 3 189 8 9 206Yorkshire & the Humber 8 17 112 13 7 4 2 4 2 169 2 3 174East Midlands 2 12 13 88 15 15 3 8 3 160 2 1 163West Midlands 1 11 5 12 98 5 2 6 4 145 6 1 152East of England 1 4 4 12 7 118 12 16 3 176 2 1 179London 0 2 1 2 2 10 50 12 1 80 1 0 81South East (ex. London) 1 4 3 6 6 11 17 125 9 181 2 1 184South West 0 2 1 2 5 2 3 10 109 135 6 0 141
England 63 197 157 144 152 171 91 185 135 1,298 28 21 1,347Wales 1 10 2 2 6 2 1 2 5 31 57 0 88Scotland 2 6 3 1 1 0 0 1 0 15 1 142 158GB1 66 213 162 147 159 173 92 188 140 1,344 86 163 1,593
1 Include negligible figures for goods lifted with Northern Ireland as origin or destination.Enquiries: 020 7944 4442
Source: CSRGT
Million tonnesDestination
7.3 Goods moved by origin of goods - GOR and Country: 1990-2000
Origin 1990 1991 1992 1993 1994 1995 1996 1997 1998 1999 2000
North East 6,549 5,850 5,336 5,873 6,494 6,484 6,467 6,577 6,851 6,592 6,137North West 18,626 17,282 16,737 17,857 19,503 19,420 20,820 20,445 21,358 19,666 21,113Yorkshire & the Humber 15,182 14,901 15,088 16,153 17,009 17,419 18,449 18,432 18,814 17,935 18,417East Midlands 13,150 11,835 12,104 12,998 14,034 14,775 15,254 14,942 15,069 17,087 15,766West Midlands 12,258 11,878 11,177 12,317 13,200 13,806 14,061 14,849 14,819 14,022 14,494East of England 15,446 15,571 15,135 15,852 16,882 16,920 17,009 17,824 18,034 17,530 17,732London 5,936 4,813 4,835 5,025 4,903 5,547 5,330 5,729 5,702 5,396 5,382South East (ex. London) 13,743 12,717 12,355 13,273 14,859 15,092 16,020 15,878 16,586 16,611 16,799South West 10,486 10,595 9,588 10,099 10,683 12,274 11,989 11,377 12,001 12,306 12,483
England 111,421 105,608 102,445 109,561 117,683 121,905 125,547 127,233 129,427 127,441 128,549Wales 7,355 7,430 7,069 7,188 7,853 8,619 7,889 9,066 8,740 7,825 7,977Scotland 11,871 11,554 11,736 11,876 12,275 13,149 13,354 13,258 13,764 13,959 13,956GB1 130,647 124,592 121,250 128,625 137,811 143,673 146,790 149,557 151,931 149,225 150,482
1 Include negligible figures for goods lifted with Northern Ireland as origin. Source: CSRGTEnquiries: 020 7944 4442
Million tonne-kms

58
7.4 Goods moved by origin and destination of goods - GOR and Country: 2000
North North Yorkshire & East West East of South SouthOrigin East West the Humber Midlands Midlands England London East West England Wales Scotland GB1
North East 1,727 956 975 359 444 285 149 186 103 5,196 176 765 6,137North West 838 7,742 1,648 1,325 1,804 1,215 483 1,520 908 17,514 1,148 2,451 21,113Yorkshire & the Humber 1,140 2,345 6,245 1,536 1,321 1,135 557 1,354 725 16,393 701 1,323 18,417East Midlands 400 1,677 1,348 4,786 1,241 2,053 594 1,572 816 14,493 556 717 15,766West Midlands 305 1,698 919 1,060 5,140 1,144 507 1,468 755 13,016 928 550 14,494East of England 313 1,382 1,073 1,871 1,530 6,688 966 2,011 936 16,772 574 386 17,732London 68 626 196 371 410 740 1,418 916 312 5,064 188 130 5,382South East (ex. London) 271 1,423 1,037 1,177 1,316 1,511 1,221 6,604 1,203 15,764 576 459 16,799South West 158 738 457 493 855 655 587 1,498 6,034 11,489 712 282 12,483
England 5,228 18,600 13,900 12,978 14,069 15,426 6,498 17,132 11,792 115,900 5,562 7,087 128,549Wales 198 999 589 395 813 601 277 664 726 5,274 2,560 143 7,977Scotland 522 1,718 1,210 476 484 274 156 507 178 5,572 301 8,083 13,956GB1 5,948 21,317 15,699 13,849 15,366 16,301 6,931 18,303 12,696 126,746 8,423 15,313 150,482
1 Include negligible figures for goods moved with Northern Ireland as origin or destination. Source: CSRGTEnquiries: 020 7944 4442
Million tonne-kmsDestination

59
8. Air

60

61
8.1 Air transport movements1 at GB airports - GOR and Country: 1990 & 1995-2000 (aircraft landing or take-offs)
Thousands
Region 1990 1995 1997 1998 1999 2000
North East 27.3 36.8 42.4 43.0 43.6 43.8North West 182.6 207.0 215.4 234.7 245.5 260.9Yorkshire & the Humber 37.0 35.8 36.1 38.0 43.5 48.2East Midlands 29.0 37.5 41.0 43.0 42.7 43.5West Midlands 67.7 82.5 86.2 94.7 104.1 114.8East of England 11.6 15.1 16.7 16.7 16.1 18.6London 384.1 441.0 465.1 481.5 494.7 512.8South East (ex. London) 285.4 309.2 385.4 426.6 467.3 491.6South West 56.3 65.1 71.1 75.5 78.2 78.0
England 1080.9 1230.2 1359.2 1453.6 1535.6 1612.2Wales 9.3 16.5 18.2 17.5 17.7 20.2Scotland 270.7 288.4 314.7 323.1 325.0 333.5Great Britain 1360.9 1535.1 1692.1 1794.3 1878.3 1965.9
1. Figures include some double counting because domestic traffic is counted at airport of arrival and departure.
Source: CAAEnquiries: 020 7944 3088
8.2 Terminal passengers1 at GB airports - GOR and Country: 1990 & 1995-2000
(arrivals or departures)Millions
Region 1990 1995 1997 1998 1999 2000
North East 1.6 2.5 2.6 2.9 2.9 3.1North West 11.6 16.1 17.7 19.5 20.2 21.9Yorkshire & the Humber 1.0 1.2 1.6 1.8 1.9 2.1East Midlands 1.3 1.9 1.9 2.1 2.2 2.2West Midlands 3.5 5.2 5.9 6.6 6.9 7.5East of England 0.2 0.3 0.3 0.3 0.4 0.4London 42.9 54.7 59.0 61.7 63.4 65.9South East (ex. London) 25.5 28.6 36.0 40.7 45.8 50.9South West 1.5 2.0 2.4 2.8 2.9 3.1
England 89.1 112.5 127.5 138.5 146.8 157.1Wales 0.6 1.0 1.1 1.2 1.3 1.5Scotland 9.9 12.4 14.4 15.2 16.0 16.8Great Britain 99.5 125.9 143.0 155.0 164.1 175.4
1. Figures include some double counting because domestic traffic is counted at airport of arrival and departure.
Source: CAAEnquiries: 020 7944 3088
8.3 Freight lifted1 at GB airports - GOR and Country: 1990 & 1995-2000
(excluding mail and passengers' luggage)
Region 1990 1995 1997 1998 1999 2000
North East 0.8 1.2 1.2 0.7 0.8 0.5North West 90.0 116.0 124.9 132.5 138.8 152.0Yorkshire & the Humber 0.7 0.7 0.6 0.6 0.5 0.9East Midlands 11.1 82.7 126.3 123.5 128.6 178.8West Midlands 22.0 53.4 28.1 29.5 35.3 14.6East of England 0.3 0.3 0.2 0.2 0.2 0.2London 695.4 1031.6 1156.1 1208.9 1265.5 1306.9South East (ex. London) 289.2 344.7 421.8 491.6 520.9 556.2South West 10.0 6.6 6.3 6.0 6.0 6.1
England 1119.5 1637.2 1865.6 1993.4 2096.5 2216.2Wales 2.4 0.8 0.5 0.3 0.4 1.0Scotland 43.6 47.6 63.1 72.3 77.2 77.6Great Britain 1165.5 1685.6 1929.2 2065.9 2174.1 2294.7
1. Figures include some double counting because domestic traffic is counted at airport of arrival and departure.
Thousand tonnes
Source: CAAEnquiries: 020 7944 3088

62
8.4 Final mode of transport to or from GB1 airports - GOR and Country: 2000
Millions
All terminatingRegion Private Car Hire Car Taxi/Minicab Bus/Coach Underground Rail passengers2
North East 0.3 0.0 0.1 0.0 0.0 0.1 0.5North West 5.8 0.3 3.5 0.3 0.1 0.5 10.6Yorkshire & the Humber 2.6 0.1 1.0 0.3 0.1 0.6 4.7East Midlands 2.2 0.1 0.3 0.3 0.1 0.3 3.3West Midlands 2.0 0.1 0.3 0.5 0.0 0.2 3.3East of England 7.3 0.5 1.8 0.9 0.3 0.7 11.5London 10.1 0.4 10.0 3.7 5.1 9.7 39.3South East (ex. London) 13.0 1.0 5.2 3.0 0.2 1.3 23.7South West 4.5 0.6 1.0 1.3 0.0 0.3 7.7
England 47.8 3.2 23.2 10.4 6.0 13.6 104.5Wales 2.2 0.2 0.4 0.6 0.0 0.1 3.5Scotland 0.2 0.0 0.0 0.1 0.0 0.1 0.5Great Britain 50.2 3.4 23.6 11.2 6.0 13.9 108.5
Percentage
All terminatingRegion Private Car Hire Car Taxi/Minicab Bus/Coach Underground Rail passengers2
North East 1 - - - - 1 -North West 12 8 15 3 1 3 10Yorkshire & the Humber 5 3 4 3 1 4 4East Midlands 4 4 1 3 1 2 3West Midlands 4 4 1 5 1 1 3East of England 15 15 8 8 4 5 11 London 20 12 42 33 85 70 36South East (ex. London) 26 30 22 26 4 9 22South West 9 17 4 12 1 2 7
England 95 95 98 94 99 98 96Wales 4 5 2 6 - 1 3Scotland - 1 - 1 1 1 -Great Britain 100 100 100 100 100 100 100
Percentage
All terminatingRegion Private Car Hire Car Taxi/Minicab Bus/Coach Underground Rail passengers2
North East 53 3 11 10 4 18 100North West 55 3 33 3 1 4 100Yorkshire & the Humber 55 2 21 6 2 13 100East Midlands 65 4 10 10 2 8 100West Midlands 62 5 10 17 1 6 100East of England 64 4 16 8 2 6 100London 26 1 25 10 13 25 100South East (ex. London) 55 4 22 12 1 5 100South West 58 7 13 17 - 4 100
England 46 3 22 10 6 13 100Wales 62 4 11 18 - 4 100Scotland 47 4 3 18 10 18 100Great Britain 46 3 22 10 6 13 100
1. The airports surveyed by the Civil Aviation Authority during 2000 were Gatwick, Heathrow, London City, Luton, Stansted, Manchester, Bristol, Cardiff, Bournemouth, Exeter and Southampton.2. Includes passengers travelling by 'other modes'.
Source: CAAEnquiries: 020 7944 3088

63
9. General

64
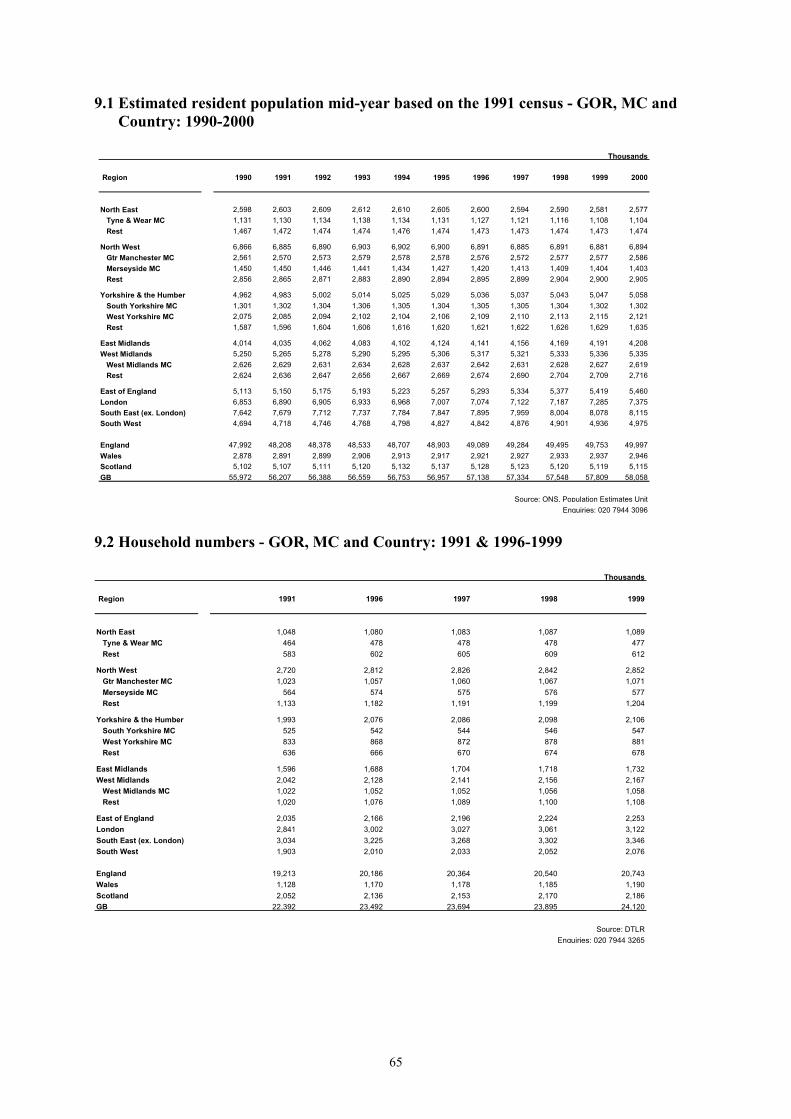
65
9.1 Estimated resident population mid-year based on the 1991 census - GOR, MC and Country: 1990-2000
Region 1990 1991 1992 1993 1994 1995 1996 1997 1998 1999 2000
North East 2,598 2,603 2,609 2,612 2,610 2,605 2,600 2,594 2,590 2,581 2,577 Tyne & Wear MC 1,131 1,130 1,134 1,138 1,134 1,131 1,127 1,121 1,116 1,108 1,104 Rest 1,467 1,472 1,474 1,474 1,476 1,474 1,473 1,473 1,474 1,473 1,474
North West 6,866 6,885 6,890 6,903 6,902 6,900 6,891 6,885 6,891 6,881 6,894 Gtr Manchester MC 2,561 2,570 2,573 2,579 2,578 2,578 2,576 2,572 2,577 2,577 2,586 Merseyside MC 1,450 1,450 1,446 1,441 1,434 1,427 1,420 1,413 1,409 1,404 1,403 Rest 2,856 2,865 2,871 2,883 2,890 2,894 2,895 2,899 2,904 2,900 2,905
Yorkshire & the Humber 4,962 4,983 5,002 5,014 5,025 5,029 5,036 5,037 5,043 5,047 5,058 South Yorkshire MC 1,301 1,302 1,304 1,306 1,305 1,304 1,305 1,305 1,304 1,302 1,302 West Yorkshire MC 2,075 2,085 2,094 2,102 2,104 2,106 2,109 2,110 2,113 2,115 2,121 Rest 1,587 1,596 1,604 1,606 1,616 1,620 1,621 1,622 1,626 1,629 1,635
East Midlands 4,014 4,035 4,062 4,083 4,102 4,124 4,141 4,156 4,169 4,191 4,208West Midlands 5,250 5,265 5,278 5,290 5,295 5,306 5,317 5,321 5,333 5,336 5,335 West Midlands MC 2,626 2,629 2,631 2,634 2,628 2,637 2,642 2,631 2,628 2,627 2,619 Rest 2,624 2,636 2,647 2,656 2,667 2,669 2,674 2,690 2,704 2,709 2,716
East of England 5,113 5,150 5,175 5,193 5,223 5,257 5,293 5,334 5,377 5,419 5,460London 6,853 6,890 6,905 6,933 6,968 7,007 7,074 7,122 7,187 7,285 7,375South East (ex. London) 7,642 7,679 7,712 7,737 7,784 7,847 7,895 7,959 8,004 8,078 8,115South West 4,694 4,718 4,746 4,768 4,798 4,827 4,842 4,876 4,901 4,936 4,975
England 47,992 48,208 48,378 48,533 48,707 48,903 49,089 49,284 49,495 49,753 49,997Wales 2,878 2,891 2,899 2,906 2,913 2,917 2,921 2,927 2,933 2,937 2,946Scotland 5,102 5,107 5,111 5,120 5,132 5,137 5,128 5,123 5,120 5,119 5,115GB 55,972 56,207 56,388 56,559 56,753 56,957 57,138 57,334 57,548 57,809 58,058
Source: ONS, Population Estimates UnitEnquiries: 020 7944 3096
Thousands
9.2 Household numbers - GOR, MC and Country: 1991 & 1996-1999
Region 1991 1996 1997 1998 1999
North East 1,048 1,080 1,083 1,087 1,089 Tyne & Wear MC 464 478 478 478 477 Rest 583 602 605 609 612
North West 2,720 2,812 2,826 2,842 2,852 Gtr Manchester MC 1,023 1,057 1,060 1,067 1,071 Merseyside MC 564 574 575 576 577 Rest 1,133 1,182 1,191 1,199 1,204
Yorkshire & the Humber 1,993 2,076 2,086 2,098 2,106 South Yorkshire MC 525 542 544 546 547 West Yorkshire MC 833 868 872 878 881 Rest 636 666 670 674 678
East Midlands 1,596 1,688 1,704 1,718 1,732West Midlands 2,042 2,128 2,141 2,156 2,167 West Midlands MC 1,022 1,052 1,052 1,056 1,058 Rest 1,020 1,076 1,089 1,100 1,108
East of England 2,035 2,166 2,196 2,224 2,253London 2,841 3,002 3,027 3,061 3,122South East (ex. London) 3,034 3,225 3,268 3,302 3,346South West 1,903 2,010 2,033 2,052 2,076
England 19,213 20,186 20,364 20,540 20,743Wales 1,128 1,170 1,178 1,185 1,190Scotland 2,052 2,136 2,153 2,170 2,186GB 22,392 23,492 23,694 23,895 24,120
Thousands
Enquiries: 020 7944 3265Source: DTLR

66
9.3 Gross Domestic Product1 (£ million) - GOR and Country: 1990-19992
£ Million
Region 1990 1991 1992 1993 1994 1995 1996 1997 1998 1999
North East 18,271 19,365 20,383 21,480 22,074 22,975 23,755 24,202 25,294 25,875North West 53,260 55,775 57,803 60,664 63,938 66,007 68,937 72,414 75,275 77,562Yorkshire & the Humber 37,863 39,872 40,977 42,952 44,752 47,108 50,043 53,182 55,457 57,554East Midlands 32,708 34,131 35,368 37,124 39,023 40,976 44,184 47,261 49,413 50,906West Midlands 41,344 42,716 44,610 46,859 49,577 52,407 54,851 57,783 61,130 63,495East of England 49,652 50,968 53,852 50,052 53,631 55,989 60,070 64,982 69,607 81,793London 74,933 78,641 82,409 97,769 103,021 106,759 112,033 122,014 133,081 122,816South East (ex. London) 73,254 75,730 78,939 78,498 83,227 86,831 94,484 102,536 109,797 121,956South West 37,160 38,584 40,507 42,529 44,607 47,385 50,128 53,580 56,064 58,151
England3 418,445 435,784 454,848 477,927 503,851 526,437 558,483 597,956 635,117 660,108Wales 20,376 21,533 22,129 23,191 24,463 25,989 27,017 28,010 29,541 30,689Scotland 42,458 45,103 47,183 49,302 52,273 55,667 57,338 58,650 62,153 64,050GB 481,279 502,420 524,160 550,420 580,587 608,093 642,838 684,616 726,811 754,847
1 Estimates of regional GDP in this table are on a residence basis, where income of commuters is allocated to where they live rather than their place of work.2 Figures for 1997, 1998 and 1999 are provisional.3 Components may not sum to totals as a result of rounding.
Source: ONSEnquiries: 020 7944 3096
9.4 Average gross weekly earnings - GOR, MC and Country: 1990-2000
Pounds
Region 1990 1991 1992 1993 1994 1995 1996 1997 1998 1999 2000
North East 234.5 255.5 281.6 286.2 294.6 299.2 315.2 327.4 338.7 349.3 365.7 Tyne & Wear MC 234.3 257.4 282.3 287.2 292.9 299.9 316.9 326.1 341.5 352.9 372.3 Rest 234.8 253.6 280.9 285.3 296.1 298.6 313.5 328.6 336.2 345.9 359.1
North West 244.7 267.3 285.7 299.1 307.7 317.7 329.5 345.6 363.3 373.5 385.7 Gtr Manchester MC 242.9 267.1 285.9 297.6 308.0 316.4 329.0 346.4 359.4 377.4 386.8 Merseyside MC 242.7 265.0 281.7 297.7 303.2 319.0 325.1 342.2 363.5 372.9 387.4 Rest 247.2 268.5 287.2 301.2 309.2 318.4 331.8 346.4 367.0 370.1 384.0 Yorkshire & the Humber 239.4 257.9 277.3 287.6 297.0 306.0 316.8 330.6 345.2 360.5 373.7 South Yorkshire MC 242.5 263.6 280.5 287.6 292.4 301.0 309.1 326.1 338.1 348.7 361.4 West Yorkshire MC 241.0 257.9 278.2 289.0 302.4 308.9 321.4 332.6 348.6 367.9 382.4 Rest 234.4 252.8 273.2 285.5 292.5 305.6 315.8 331.2 345.4 357.6 369.4
East Midlands 241.8 261.3 276.2 285.5 292.5 306.4 318.5 333.1 350.3 361.7 371.4West Midlands 240.4 261.1 279.8 292.6 300.1 311.3 323.9 337.3 359.8 375.5 385.9 West Midlands MC 247.5 268.1 287.9 301.2 309.4 320.4 332.6 346.3 367.0 387.1 394.7 Rest 231.6 252.5 270.2 282.4 289.5 300.8 313.7 326.5 351.3 362.5 376.4
East of England 265.3 285.1 303.6 312.2 322.8 331.5 347.7 362.2 380.3 397.2 412.7London 336.5 361.1 385.4 408.8 420.6 441.5 455.0 480.1 504.5 524.7 529.8South East (ex. London) 272.9 294.6 315.7 328.9 339.4 348.1 367.1 382.6 406.3 423.4 434.2South West 246.5 265.6 283.2 298.8 306.9 313.9 325.3 342.6 354.6 365.3 379.1
England 266.6 288.3 308.1 321.2 330.6 342.0 356.2 372.5 391.5 406.8 416.3Wales 232.1 252.2 270.9 281.5 290.5 302.1 313.3 330.2 342.8 353.9 368.1Scotland 244.0 265.3 286.7 297.6 301.9 313.4 325.2 336.9 350.0 369.6 379.8GB 263.1 284.7 304.6 317.3 326.1 337.6 351.6 367.6 385.8 401.3 410.6
Note: Earnings based on full time employees on adult rates whose pay forthe survey pay period was unaffected by absence.The data for 2000 is provisional and will be revised in December 2001.
Source: New Earnings Survey, ONSEnquiries: 020 7944 3096

67
9.5 Vehicle crime - GOR and Country: 1990-2000/01
Offences
Region 1990 1991 1992 1993 1994 1995 1996 1997 1997/1998 1998/1999 1999/2000 2000/2001
North EastTotal vehicle crime 100,313 105,810 99,991 94,285 88,052 79,757 72,407 59,455 58,259 53,773 48,355 44,068Theft from vehicle 55,169 55,102 49,853 43,201 43,048 41,820 39,920 34,814 34,212 32,223 29,953 27,888Theft of a motor vehicle 45,144 50,708 50,138 51,084 45,004 37,937 32,487 24,641 24,047 21,550 18,402 16,180
North WestTotal vehicle crime 192,308 215,700 223,851 214,503 193,925 191,889 183,484 159,252 159,862 159,914 160,069 147,853Theft from vehicle 107,506 120,416 125,462 116,777 108,912 109,768 100,775 89,170 89,574 89,427 88,330 82,465Theft of a motor vehicle 84,802 95,284 98,389 97,726 85,013 82,121 82,709 70,082 70,288 70,487 71,739 65,388
Yorkshire & the HumberTotal vehicle crime 139,474 173,557 172,254 182,485 175,218 166,973 157,932 132,701 130,694 132,420 118,297 111,397Theft from vehicle 86,422 103,494 104,401 103,276 98,351 95,559 92,140 83,869 83,133 83,847 75,748 73,752Theft of a motor vehicle 53,052 70,063 67,853 79,209 76,867 71,414 65,792 48,832 47,561 48,573 42,549 37,645
East MidlandsTotal vehicle crime 99,363 118,090 125,940 121,188 110,608 108,319 107,200 90,006 88,773 88,779 80,903 75,613Theft from vehicle 61,963 73,033 78,524 72,767 65,368 63,130 64,621 56,601 56,398 60,206 56,425 54,048Theft of a motor vehicle 37,400 45,057 47,416 48,421 45,240 45,189 42,579 33,405 32,375 28,573 24,478 21,565
West MidlandsTotal vehicle crime 129,892 153,980 159,082 159,996 151,510 152,377 151,489 128,961 126,610 118,741 118,996 104,075Theft from vehicle 78,696 89,923 95,148 95,153 88,263 87,598 86,182 76,645 75,285 69,699 72,554 64,504Theft of a motor vehicle 51,196 64,057 63,934 64,843 63,247 64,779 65,307 52,316 51,325 49,042 46,442 39,571
East of EnglandTotal vehicle crime 94,472 109,712 113,923 113,526 98,878 99,876 100,558 85,020 82,437 78,863 76,821 74,691Theft from vehicle 59,098 71,008 74,616 74,162 66,499 66,785 67,789 58,253 56,400 54,307 53,343 52,935Theft of a motor vehicle 35,374 38,704 39,307 39,364 32,379 33,091 32,769 26,767 26,037 24,556 23,478 21,756
LondonTotal vehicle crime 210,386 236,704 242,556 230,390 192,794 172,011 176,724 160,885 157,899 163,522 175,608 168,816Theft from vehicle 136,250 155,292 162,953 153,964 126,790 112,614 116,133 105,282 101,997 103,974 112,605 106,112Theft of a motor vehicle 74,136 81,412 79,603 76,426 66,004 59,397 60,591 55,603 55,902 59,548 63,003 62,704
South East (ex. London)Total vehicle crime 140,286 187,999 196,489 193,625 173,130 170,101 165,794 143,769 138,713 135,207 128,887 122,396Theft from vehicle 87,163 121,451 130,533 129,515 116,951 117,162 114,357 100,303 96,287 94,241 89,176 86,351Theft of a motor vehicle 53,123 66,548 65,956 64,110 56,179 52,939 51,437 43,466 42,426 40,966 39,711 36,045
South WestTotal vehicle crime 93,968 114,937 134,627 135,875 125,495 112,453 111,780 97,738 94,503 90,346 84,118 75,886Theft from vehicle 60,529 75,657 90,910 90,891 86,193 80,188 79,524 71,834 69,969 67,105 61,655 55,801Theft of a motor vehicle 33,439 39,280 43,717 44,984 39,302 32,265 32,256 25,904 24,534 23,241 22,463 20,085
EnglandTotal vehicle crime 1,200,462 1,416,489 1,468,713 1,445,873 1,309,610 1,253,756 1,227,368 1,057,787 1,037,750 1,021,565 992,054 924,795Theft from vehicle 732,796 865,376 912,400 879,706 800,375 774,624 761,441 676,771 663,255 655,029 639,789 603,856Theft of a motor vehicle 467,666 551,113 556,313 566,167 509,235 479,132 465,927 381,016 374,495 366,536 352,265 320,939
WalesTotal vehicle crime 66,826 78,688 80,483 77,465 74,819 67,788 65,673 59,785 58,272 56,161 51,864 43,652Theft from vehicle 40,283 47,900 48,940 46,113 42,305 38,470 38,111 33,562 32,243 30,890 29,443 25,795Theft of a motor vehicle 26,543 30,788 31,543 31,352 32,514 29,318 27,562 26,223 26,029 25,271 22,421 17,857
Note:Theft of a motor vehicle includes offence classes "theft or unauthorised taking of a motor vehicle"and "aggravated vehicle taking".
Source: Home OfficeEnquiries: 020 7944 3096