Embed Size (px)
Citation preview

Transportation as a Social
Determinant of HealthMarch 30, 2017
Co-sponsored by:
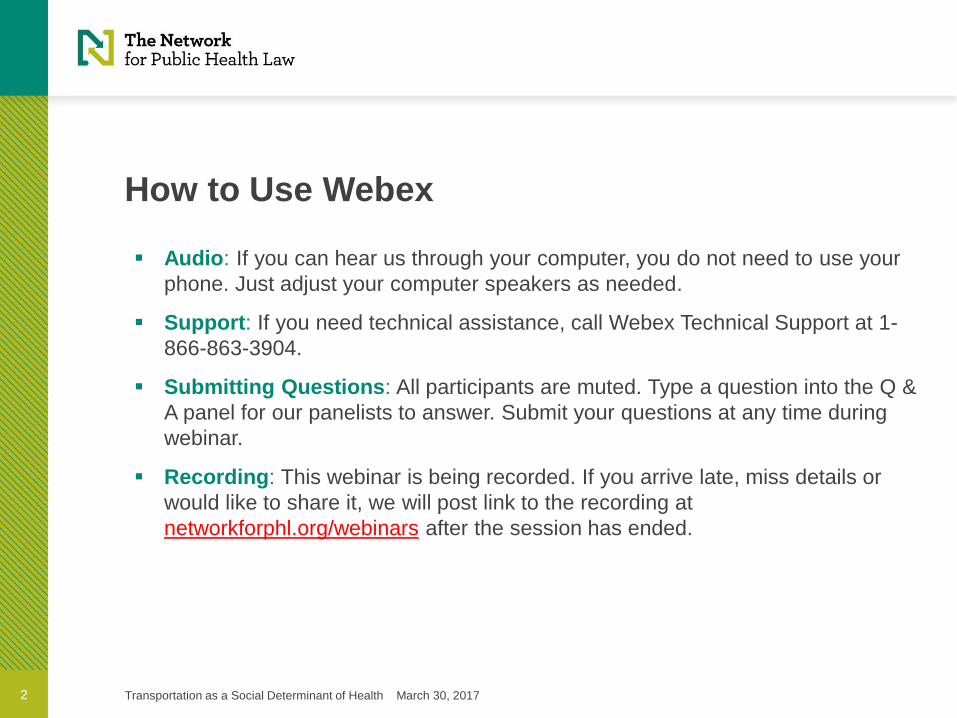
How to Use Webex
Transportation as a Social Determinant of Health March 30, 2017 2
Audio: If you can hear us through your computer, you do not need to use your
phone. Just adjust your computer speakers as needed.
Support: If you need technical assistance, call Webex Technical Support at 1-
866-863-3904.
Submitting Questions: All participants are muted. Type a question into the Q &
A panel for our panelists to answer. Submit your questions at any time during
webinar.
Recording: This webinar is being recorded. If you arrive late, miss details or
would like to share it, we will post link to the recording at
networkforphl.org/webinars after the session has ended.

How to Use Webex
3
Accessing Network webinars from your mobile device
You can now access and fully participate in Network webinars
on the go using the WebEx app for Apple or Android.
1. Download the app.
2. Register for a webinar on the Network website.
3. Use the event number provided in your attendee email to
connect via the mobile app.
Transportation as a Social Determinant of Health March 30, 2017

About the Network for Public Health Law
The Network is a national initiative of the Robert Wood Johnson Foundation
launched in 2010 to advance law as a tool to improve public health.
4
Experts in public health law, our leadership team comprises a National Director
and five Regional Office Directors who lead teams of Network attorneys across
the U.S.
Transportation as a Social Determinant of Health March 30, 2017

Legal Technical Assistance
Network attorneys in your region can answer questions on a wide range of
public health legal issues at no cost, and can assist you in using law to
advance your public health initiatives.
Visit networkforphl.org.
5
Eastern Region
Mid-States Region
Northern Region
Southeastern Region
Western Region
Transportation as a Social Determinant of Health March 30, 2017

Transportation as a Social
Determinant of HealthMarch 30, 2017
Co-sponsored by:

Moderator
7
Margaret Power, Extern, Public Health Law Program,
Centers for Disease Control and Prevention
M.P.H., West Virginia University
Research interests/areas of expertise:
Rural health
Health systems
Transportation as a Social Determinant of Health March 30, 2017

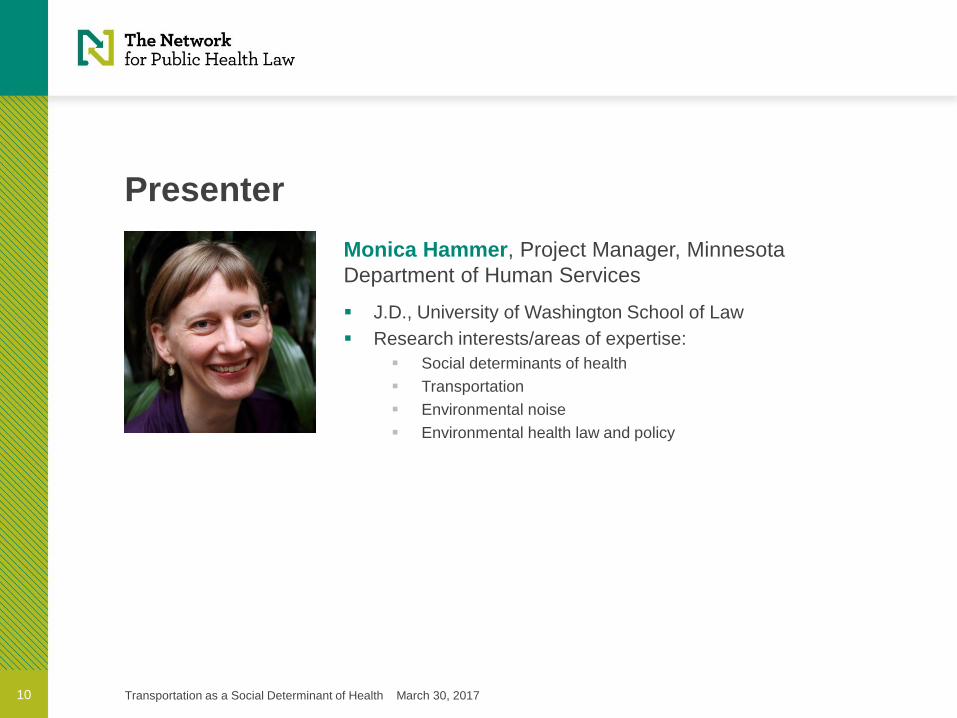
Presenter
8
Elizabeth Skillen, Senior Advisor, Policy, Research,
Development and Analysis Office, Office of the
Associate Director for Policy, Centers for Disease
Control and Prevention
Ph.D., University of Georgia
Research interests/areas of expertise:
Social determinants of health
Evidence-based approaches
Transportation
Environmental health
Transportation as a Social Determinant of Health March 30, 2017

Presenter
9
Captain Holly Billie, Injury Prevention Specialist,
Transportation Safety Team, Division of Unintentional
Injury Prevention, National Center for Injury
Prevention and Control, Centers for Disease Control
and Prevention
M.P.H., University of Texas Health Sciences Center
Research interests/areas of expertise:
Social determinants of health
Transportation safety for American Indians and Alaska
Natives
Tribal environmental health issues
Intentional/unintentional injury prevention
Transportation as a Social Determinant of Health March 30, 2017
Presenter
10
Monica Hammer, Project Manager, Minnesota
Department of Human Services
J.D., University of Washington School of Law
Research interests/areas of expertise:
Social determinants of health
Transportation
Environmental noise
Environmental health law and policy
Transportation as a Social Determinant of Health March 30, 2017

Centers for Disease Control and Prevention
CDC’s population health initiative to improve health in 5 years or less
Elizabeth L. Skillen PhD, MSOffice of the Associate Director for Policy
Centers for Disease Control and Prevention
March 30, 2017

• Shift from “Volume-Based” Payment Model to “Value-Based” Payment Model Opportunities to improve population
health and address health equity
Increased focus on prevention and wellness
• Emerging clinical care modelsContinued need for more collaboration
between clinical care and public health
The Changing Health System

The “Buckets” of Prevention Framework

Buckets 1 and 2traditional clinical | innovative clinical
www.cdc.gov/sixeighteen

Bucket 3Community-Wide Prevention
• How do we improve population health in our states and communities?
• What is the best evidence of health and cost impact?
• What can we do that will begin to show results soon?

Questions we have heardI lead a small
health department. How do I address
the social determinants of
health?
How do I make the business case for my
community-wide health strategies to a
hospital board?
I work for a governor who only wants health initiatives that will lead
to positive results before she runs for re-election?
Got any of those?

14 evidence-based, community-wide, population health
interventions:
• Improve health of community (not clinical/patient-oriented)
• Demonstrate positive health impact in 5 yrs. or less & cost effectiveness &/or savings over time
www.cdc.gov/hi5


Step 1
Earned the highest evidence rating from:
• The Guide to Community Preventive Services (n=120 “Recommended”)
• Robert Wood Johnson Foundation/ U of Wisconsin County Health Rankings/ Roadmaps What Works for Health site (n=144 “Scientifically Supported”)
• CDC Experts
Step 2
Excluded Bucket 1 & 2 interventions and those with evidence of potential harm
Step 3
Excluded those without evidence reporting:
• measurable impact on health in five years
• cost effectiveness and/or savings over the lifetime of the population or earlier
• those not implemented in more than 85% of states
Step 4
Excluded those not implemented at policy level
How was the HI-5 List Developed?

14 Evidence-Based, Community-Wide Interventions
Address the Social Determinants of Health
• Early Childhood Education
• Clean Diesel Bus Fleets
• Public Transportation System Introduction or Expansion
• Home Improvement Loans and Grants
• Earned Income Tax Credits
• Water Fluoridation
Change the Context: Making the Healthy Choice the Easy Choice
• School-Based Programs to Increase Physical Activity
• School-Based Violence Prevention
• Safe Routes to School (SRTS)
• Motorcycle Injury Prevention
• Tobacco Control Interventions
• Access to Clean Syringes
• Pricing Strategies for Alcohol Products
• Multi-Component Worksite Obesity Prevention


Public Transportation System Introduction or Expansion
Description
– Includes a variety of transit options such as buses, light rail, and subways
– Increases both access and use of public transit and to reduce traffic
Health Impact
– Reductions in health risk factors such as motor vehicle crashes, air pollution, and physical inactivity
– Increases in 8 to 33 minutes of walking per day
Economic Impact
– Typical American public transit service improved to high quality urban rail or bus rapid transit service would result in per capita annual health benefits of $354.86

CDCTransportation Health Impact
Assessment Toolkit
• How can public officials, community members, and planners ensure that future transportation policies consider health?• Health Impact Assessments (HIA)
• The Transportation HIA Toolkit provides a framework • Addresses future health effects of proposed projects, plan, or policy before it is built to
avoid negative impacts• Considers how people of all ages and abilities are able to move about their community
easily and safely• Identifies the health value of proposals• Promotes multisector partnerships
• https://www.cdc.gov/healthyplaces/transportation/hia_toolkit.htm

Where we are now
• Roads to transportation • Emergency preparedness and response (ex: evacuation )
• Innovation (ex: TSPLOST, selling naming rights)
• Urban revitalization
• Employers
• Active transportation

WebinarApril 26th 1:00-2:00 pm EST
Health Impact in 5 Years (HI-5) Webinar Series:
An In-depth Look at Public Transportation Expansion
• Therese McMillan. Chief Planning Officer for the Los Angeles County Metropolitan Transportation Authority (“LA Metro”).
• Joseph Calabrese. Chief Executive Officer & General Manager of the Greater Cleveland Regional Transit Authority

Holly Billie, MPH
Injury Prevention Specialist
CDC National Center for Injury Prevention and Control
Transportation as a Social Determinant of Health Webinar
March 30, 2017
Motor Vehicle Injury Prevention:
Evidence Based Strategies and Using the Community Guide
Division of Unintentional Injury Prevention
National Center for Injury Prevention and Control
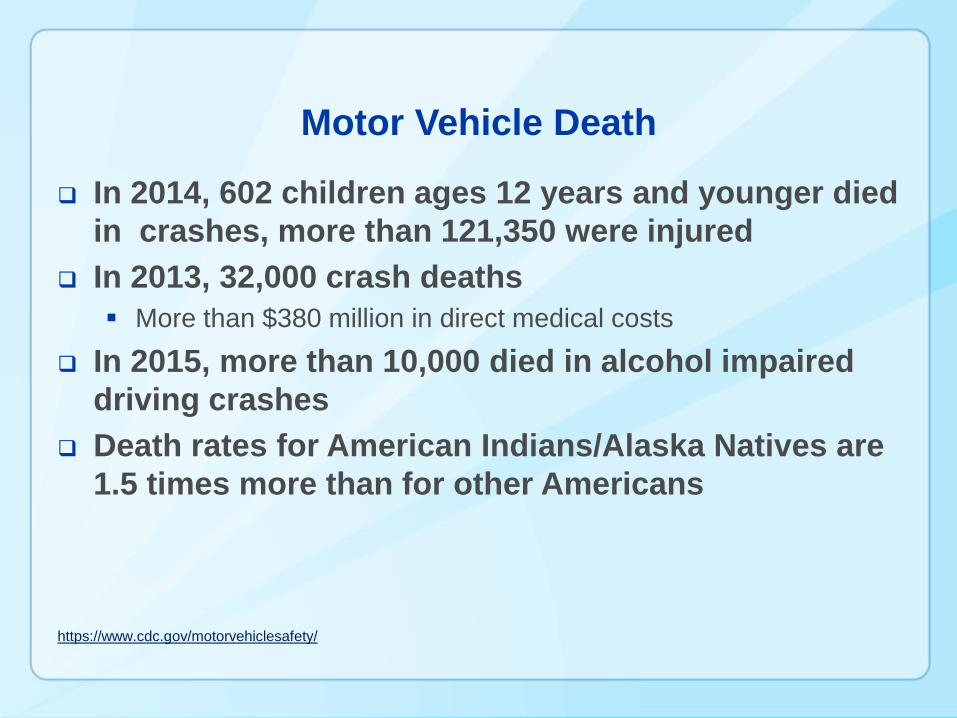
Motor Vehicle Death
In 2014, 602 children ages 12 years and younger died
in crashes, more than 121,350 were injured
In 2013, 32,000 crash deaths
More than $380 million in direct medical costs
In 2015, more than 10,000 died in alcohol impaired
driving crashes
Death rates for American Indians/Alaska Natives are
1.5 times more than for other Americans
https://www.cdc.gov/motorvehiclesafety/

Seat Belt Use by Law Type
NHTSA Seat Belt Use in 2016—Overall Results DOT HS 812 351
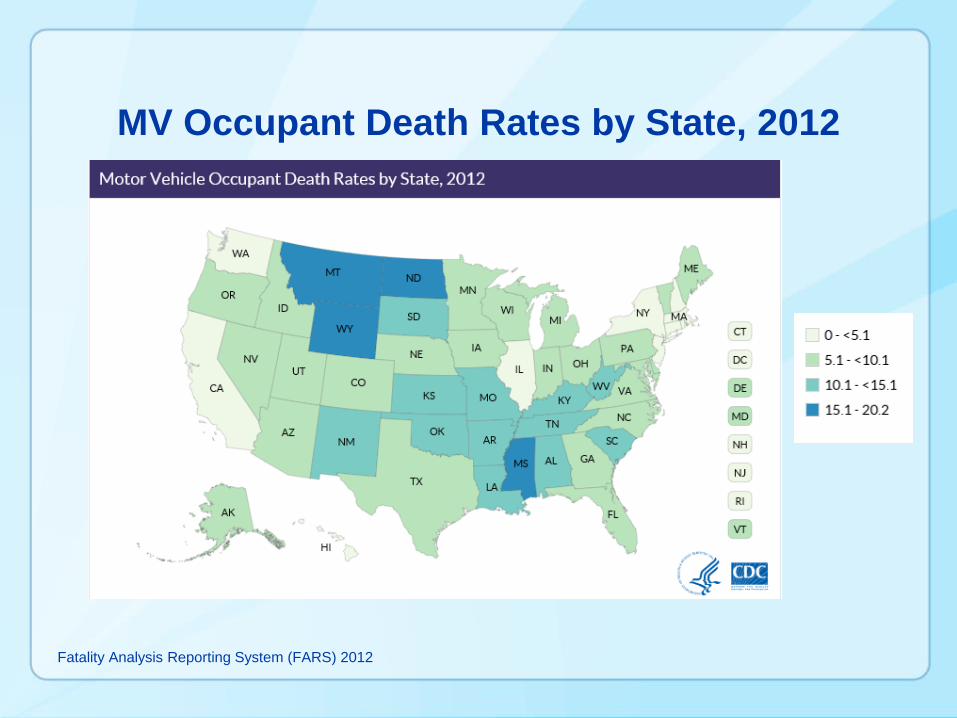
MV Occupant Death Rates by State, 2012
Fatality Analysis Reporting System (FARS) 2012

State Fact Sheets
CDC.gov/motorvehiclesafety
Costs of crash deaths
Seat belts
Impaired driving
https://www.cdc.gov/motorvehiclesafety/states/occupant_death_rate.html


Task Force Findings

Child Safety Seats
Reduces Death Risk
71% infants, 54% toddlers
What works:
Laws mandating use
• Primary
• All children through age 8
• Age and size appropriate seats
Education and enhanced enforcement
Seat distribution with education
• Provides seats to parents/caregivers and includes education
Incentive and education
• Incentives for child safety seat use
The Community Guide Motor Vehicle-related Injury Prevention

Seat Belts
Reduces risk of death and serious injury
by about half
What works
Laws mandating use
• All occupants
Primary Enforcement Laws
• VS. secondary enforcement
CDC Study – Primary laws increase use by 14 percentage
points, secondary by 8 percentage points
Driver death rates drop by 7% when states changed from
secondary to primary
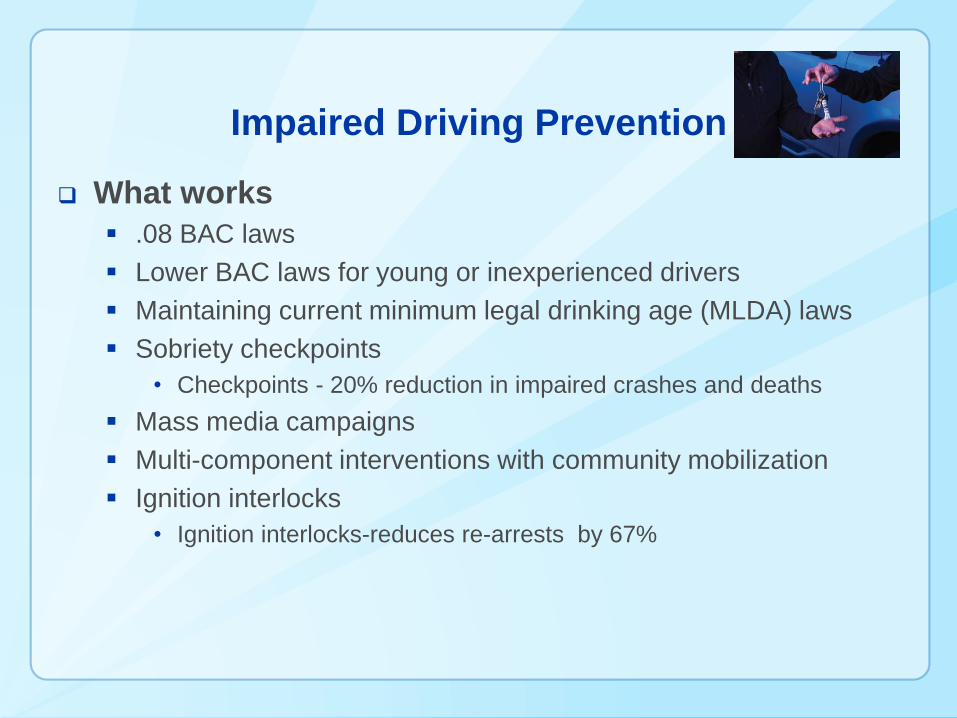
Impaired Driving Prevention
What works
.08 BAC laws
Lower BAC laws for young or inexperienced drivers
Maintaining current minimum legal drinking age (MLDA) laws
Sobriety checkpoints
• Checkpoints - 20% reduction in impaired crashes and deaths
Mass media campaigns
Multi-component interventions with community mobilization
Ignition interlocks
• Ignition interlocks-reduces re-arrests by 67%
Motorcycle Helmets
What works
Universal helmet laws
Helmets reduce the risk of death by 37%
Helmets reduce the risk of head injury by 69%.

Motor Vehicle Death Rates by Race
Source: CDC WISQARS 2016; www.cdc.gov/ncipc/wisqars
0
5
10
15
20
25
30
2000 2001 2002 2003 2004 2005 2006 2007 2008 2009 2010 2011 2012 2013 2014
Rate
pe
r 10
0,0
00
Year
AI/AN
White
Black
Asian/Pacific Islander

American Indians/Alaska Natives
2016 Safety Belt Use Estimate for the Indian Nations, Final Report April - August 2016, Bureau of Indian Affairs Indian Highway
Safety Program
Sovereign Nations
567 federally-recognized tribes
State traffic laws do not always apply on tribal lands
Seat belt use varies widely
2016, on 17 reservations overall seat belt use was 77.7%
12 reservations with primary laws, seat belt use was 80.2%
3 reservations with secondary laws, seat belt use was 71.6%
2 reservations with no law, seat belt use was 64.6%
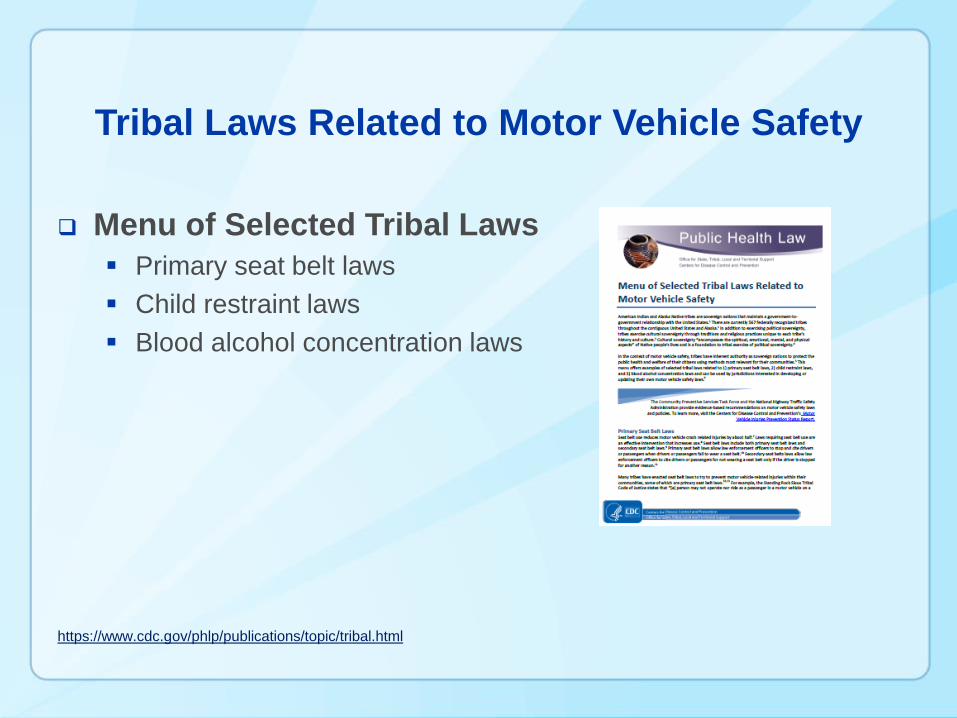
Tribal Laws Related to Motor Vehicle Safety
Menu of Selected Tribal Laws
Primary seat belt laws
Child restraint laws
Blood alcohol concentration laws
https://www.cdc.gov/phlp/publications/topic/tribal.html
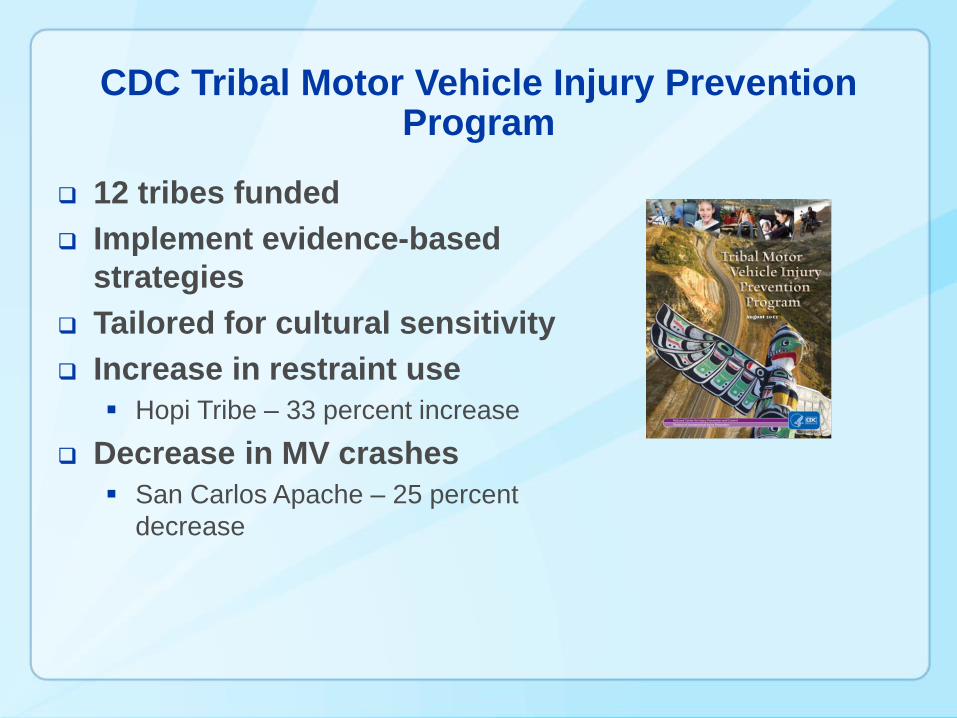
CDC Tribal Motor Vehicle Injury Prevention Program
12 tribes funded
Implement evidence-based
strategies
Tailored for cultural sensitivity
Increase in restraint use
Hopi Tribe – 33 percent increase
Decrease in MV crashes
San Carlos Apache – 25 percent
decrease

The Community Guide in Action
https://www.thecommunityguide.org/stories/buckle-yurok
CA Rural Indian Health Board
CDC Tribal Motor Vehicle Injury
Prevention Program
Partner: Yurok Tribe
Child safety seat distribution
Traffic code proposed
• Adopt CA primary restraint laws
Code passed October 2012
Child safety seat use increased by 34
percent

For more information please contact Centers for Disease Control and
Prevention1600 Clifton Road NE, Atlanta, GA 30333
Telephone, 1-800-CDC-INFO (232-4636)/TTY: 1-888-232-6348
E-mail: [email protected] Web: www.cdc.gov
Holly Billie
770-488-4712
National Center for Injury Prevention and Control
Division of Unintentional Injury Prevention
The findings and conclusions in this report are those of the authors and do not necessarily represent the official
position of the Centers for Disease Control and Prevention.

Quiet Luxury“Calling noise a nuisance is like calling smog an inconvenience.” Former US Surgeon General William H. Stewart
MONICA S. HAMMER, J.D.

Socioeconomic implications of noise
Noise as Stressor
Source of
danger
Hinderer of
healthy behavior

A biopsychosocial model of disease
Long Term Risks
Chronic Effects
Acute Effects
Primary Exposure
Noise
Decreased Sleep Quality and Quantity
Hypertension
Reduced learning and productivity
Sensory and neural
hearing damage
Temporary change in
hearing threshold
Permanent hearing
loss
Increased Stress, and Distraction
Endocrine disruption
Heart Disease
Reduced learning and productivity
Hammer, Swinburn, Neitzel2014

Noise as a public health threat
Over 104 Million Americans are at
risk of heart disease, hearing loss,
and other health effects due to
noise
Hammer, Swinburn, Neitzel 2014

How loud is loud?
The decibel scale
25 50 75
Wind SubwayBirds
singing
0 100
I-pod
Max
Rustling
leaves

Road traffic noise isn’t going to kill
you, right?
7 % increase in risk of hypertension per 10 dB(A) of noise starting at
48 dB(A)
8% increase risk in heart disease per 10 dB(A)
of noise starting at 53 dB(A)
Attributed mortality in EU due to noise in
2004: 102,907 in a population of 407 million

Estimated source exposures >65 dBA LDN in US
0.5
8
2.1 2.5
19.3
0.7 0.53.3 3.9
30.4
0
5
10
15
20
25
30
35
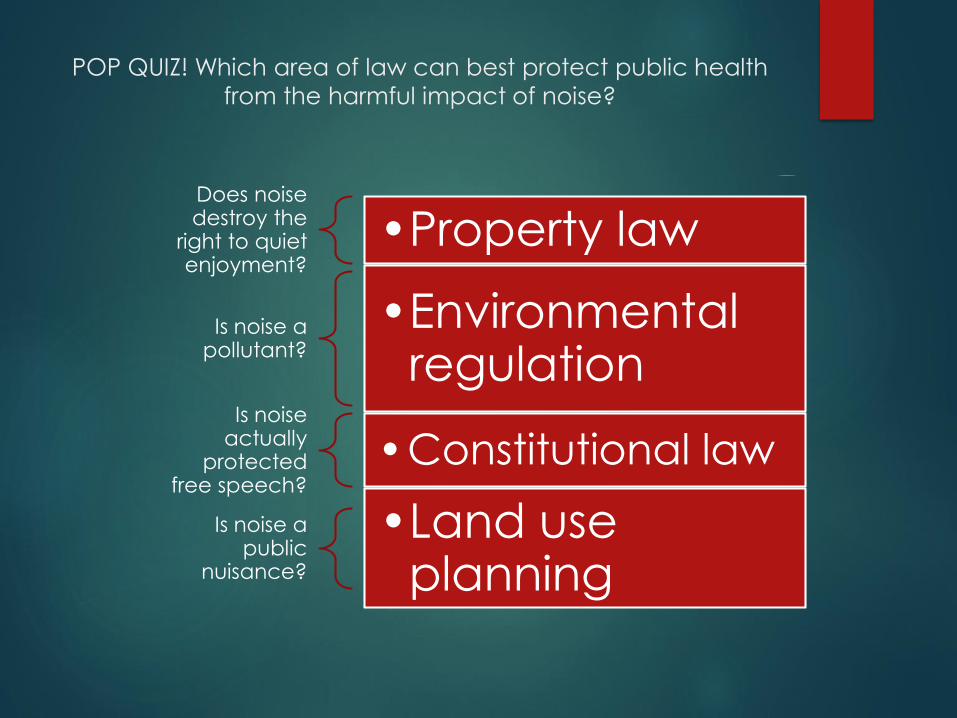
POP QUIZ! Which area of law can best protect public health
from the harmful impact of noise?
Does noise destroy the
right to quiet enjoyment?
•Property law
Is noise a pollutant?
•Environmental regulation
Is noise actually
protected free speech?
•Constitutional law
Is noise a public
nuisance?
•Land use planning

How can the law address noise as a
social determinant of health?
1.
Direct regulation
2.Procurement3. Altering the informational environment
4. Altering the built
environment
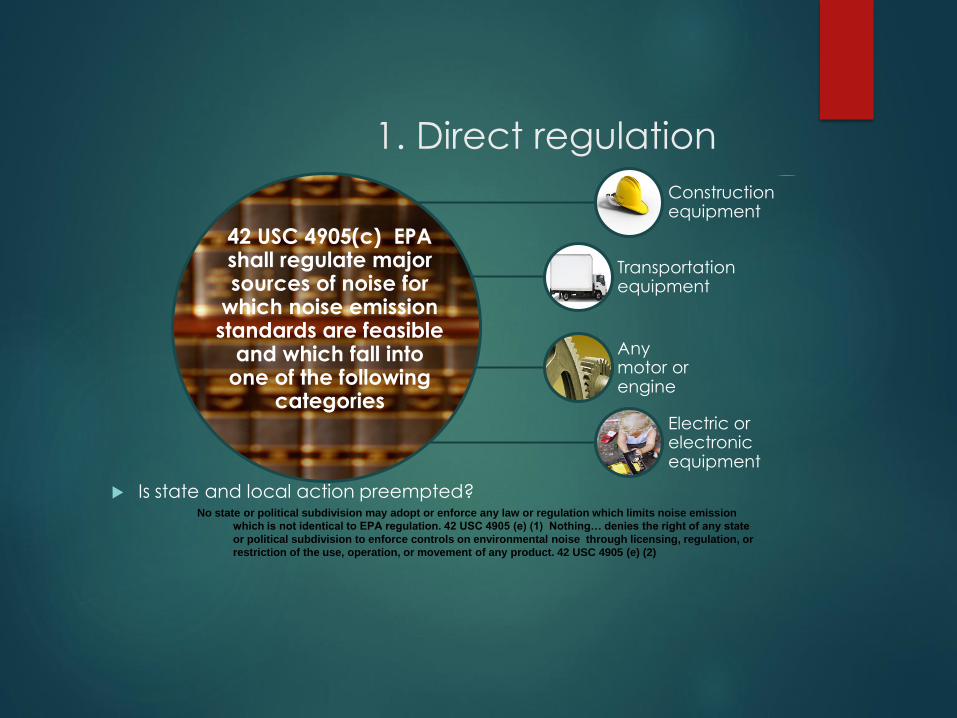
1. Direct regulation
Is state and local action preempted?
42 USC 4905(c) EPA shall regulate major sources of noise for
which noise emission standards are feasible
and which fall into one of the following
categories
Construction equipment
Transportation equipment
Any motor or engine
Electric or electronic equipment
No state or political subdivision may adopt or enforce any law or regulation which limits noise emission
which is not identical to EPA regulation. 42 USC 4905 (e) (1) Nothing… denies the right of any state
or political subdivision to enforce controls on environmental noise through licensing, regulation, or
restriction of the use, operation, or movement of any product. 42 USC 4905 (e) (2)

3. Altering the Informational
Environment

4. Altering the Built Environment for
highway projects involving federal funds
23 USC 109 (excerpt): The Secretary of Transportation shall
promulgate guidelines … and… final decisions ….taking
into consideration the need for fast and efficient
transportation, … and the costs of eliminating or minimizing
such adverse effects such as air, noise, and water
pollution…
Translation: Public health impacts are not calculated or
disclosed
Instead, calculation considers whether a 7-10 dBA can be
achieved for a significant population size at a reasonable
cost for projects that approach or exceed an anticipated
69 dBA for residential areas or anticipated 5 dBA increase.
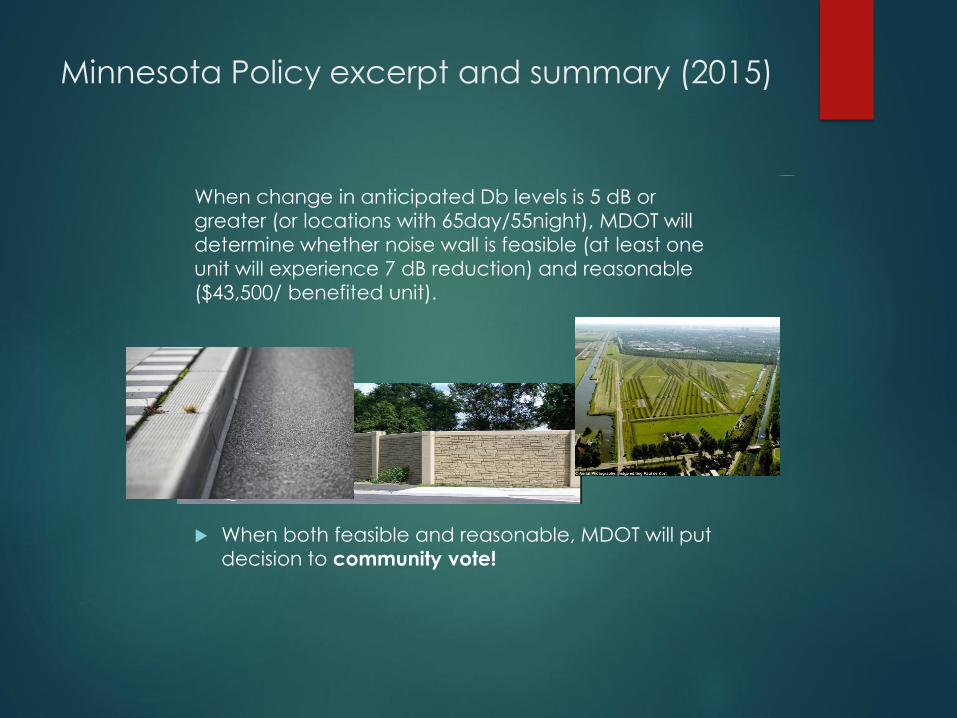
Minnesota Policy excerpt and summary (2015)
When change in anticipated Db levels is 5 dB or
greater (or locations with 65day/55night), MDOT will
determine whether noise wall is feasible (at least one
unit will experience 7 dB reduction) and reasonable
($43,500/ benefited unit).
When both feasible and reasonable, MDOT will put
decision to community vote!
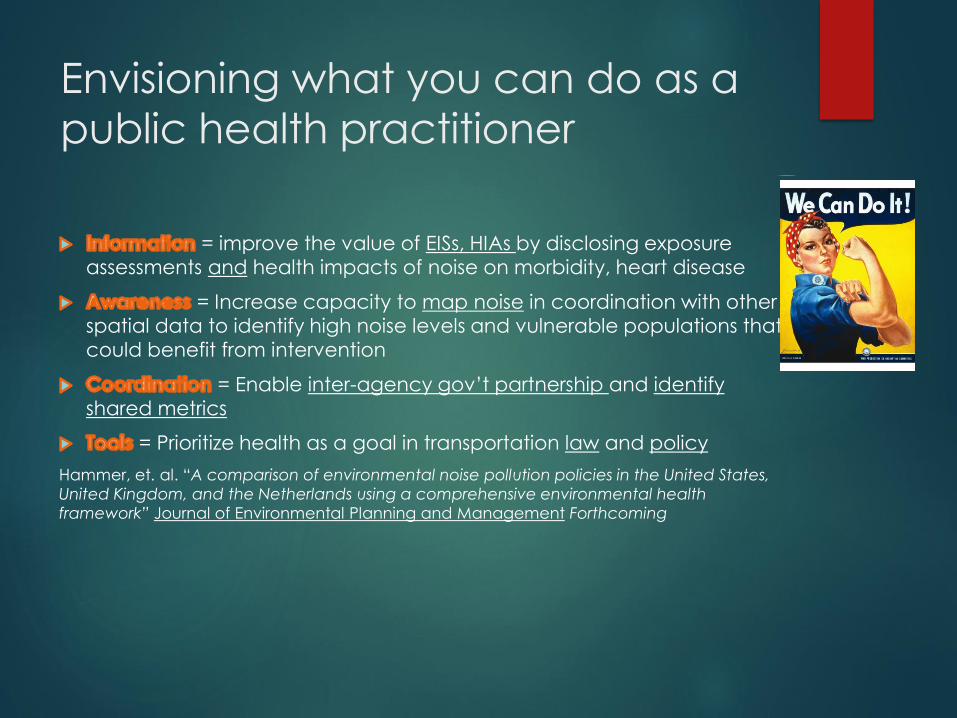
Envisioning what you can do as a
public health practitioner
= improve the value of EISs, HIAs by disclosing exposure
assessments and health impacts of noise on morbidity, heart disease
= Increase capacity to map noise in coordination with other
spatial data to identify high noise levels and vulnerable populations that
could benefit from intervention
= Enable inter-agency gov’t partnership and identify
shared metrics
= Prioritize health as a goal in transportation law and policy
Hammer, et. al. “A comparison of environmental noise pollution policies in the United States,
United Kingdom, and the Netherlands using a comprehensive environmental health
framework” Journal of Environmental Planning and Management Forthcoming

Minnesota DOT standards (2003)
Db standards for when noise wall or bern should be considered _were_ written with the intention of protecting public health (M.A.R. 7030.0040)

23 CFR Part 772 (2011)

Q&A
62
Please type your questions in the Q&A panel.
Expanding Contraceptive Access: Developing and implementing State-based Approaches March 16, 2017

Thank you for attending
63
For a recording of this webinar and information about future
webinars, please visit networkforphl.org/webinars
Expanding Contraceptive Access: Developing and implementing State-based Approaches March 16, 2017