Embed Size (px)
Citation preview
April 2009
13601 Forest Park Drive Grand Haven, MI 49417 (616) 844-6322 www.atlasergo.com
Transportation Ergonomics: Relationship between Demographics and Discomfort
In the Trucking Industry
An Atlas Ergonomics White Paper
Contents Introduction 1
Data Collection 3 Definitions 5
Participants 6
Demographics and Discomfort 10 Conclusions 25 Bibliography 27
Introduction How well do we understand the link between the person, the job, and the onset of discomfort? Objective data can be used to provide clarity.
Data Collection The process used to collect data from truck drivers across North America.
Definitions A review of the terms used during the analysis and development of graphs.
Participants 28301 drivers were evaluated for the study. The characteristics of the population and companies involved in this project are presented.
Demographics vs. Discomfort The relationship between individual driver demographic data and reported levels of discomfort are presented.
Conclusions A review of the relationships learned and recommendations.
Bibliography A list of the research articles referenced throughout the paper.
1 | P a g e
INTRODUCTION
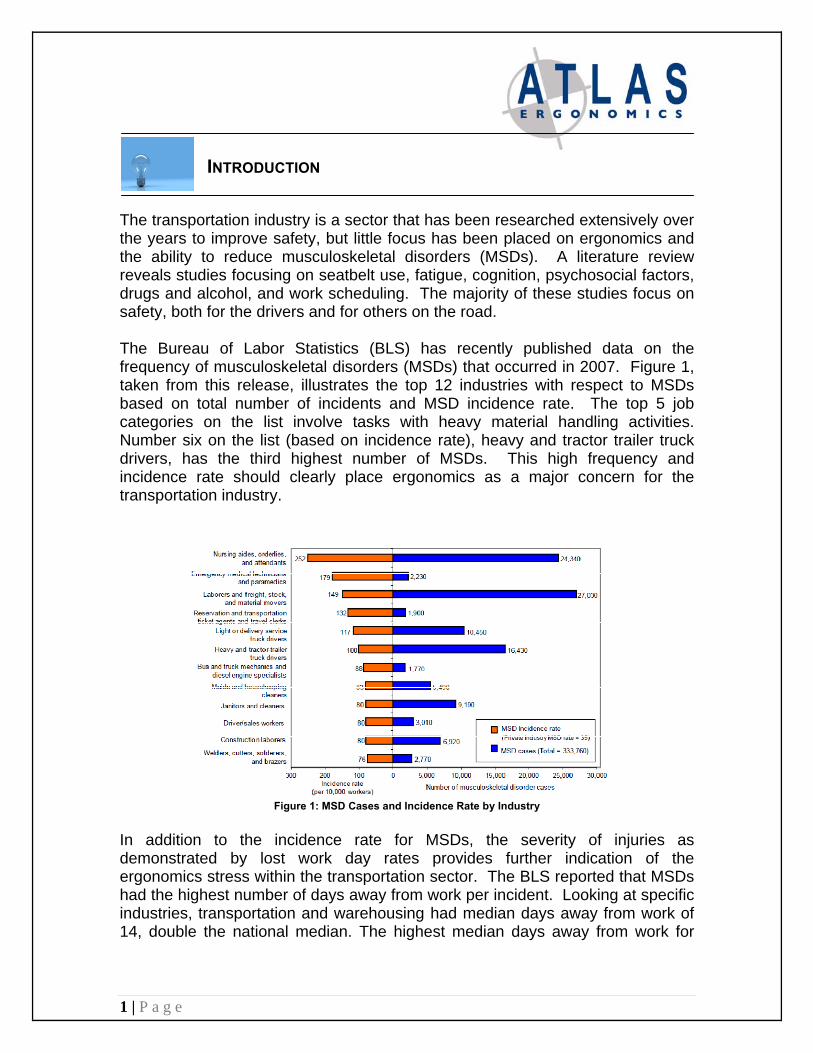
The transportation industry is a sector that has been researched extensively over the years to improve safety, but little focus has been placed on ergonomics and the ability to reduce musculoskeletal disorders (MSDs). A literature review reveals studies focusing on seatbelt use, fatigue, cognition, psychosocial factors, drugs and alcohol, and work scheduling. The majority of these studies focus on safety, both for the drivers and for others on the road. The Bureau of Labor Statistics (BLS) has recently published data on the frequency of musculoskeletal disorders (MSDs) that occurred in 2007. Figure 1, taken from this release, illustrates the top 12 industries with respect to MSDs based on total number of incidents and MSD incidence rate. The top 5 job categories on the list involve tasks with heavy material handling activities. Number six on the list (based on incidence rate), heavy and tractor trailer truck drivers, has the third highest number of MSDs. This high frequency and incidence rate should clearly place ergonomics as a major concern for the transportation industry.
Figure 1: MSD Cases and Incidence Rate by Industry
In addition to the incidence rate for MSDs, the severity of injuries as demonstrated by lost work day rates provides further indication of the ergonomics stress within the transportation sector. The BLS reported that MSDs had the highest number of days away from work per incident. Looking at specific industries, transportation and warehousing had median days away from work of 14, double the national median. The highest median days away from work for

2 | P a g e
heavy and tractor-trailer truck drivers and light and delivery service truck drivers, were 15 days each, followed by carpenters and construction laborers with 10 days. Therefore, while not a topic typically researched within the industry, ergonomics research and application should have a direct and significant impact on the financial performance of the industry. In an effort to understand the potential impact that ergonomics factors may have on the commercial trucking industry, this paper presents a review of over 28,000 surveys of drivers collected between 2005 and 2008. Surveys were distributed to drivers at the beginning of a project that focused on improving driver postures in the cab, and follow-up surveys were administered biannually to track changes in health status. The content of the surveys included employee demographic data, job-related information, and discomfort ratings. The review of this data will be provided over the course of two papers. The primary objective of this initial paper is to review the demographic data provided by the drivers to determine if any trends exist that can guide efforts to help the transportation industry. Through this review, a person in charge of a transportation safety and ergonomics process will be better prepared to:
1. Prioritize efforts to meet the needs of high risk employees; 2. Ensure that solutions are available for employees with special needs; and 3. Justify recommendations with the data provided.
The second paper in this series will review the impact of the ergonomics program over time, and present the results of the follow-up surveys collected over the course of this 4-year project.
3 | P a g e
DATA COLLECTION
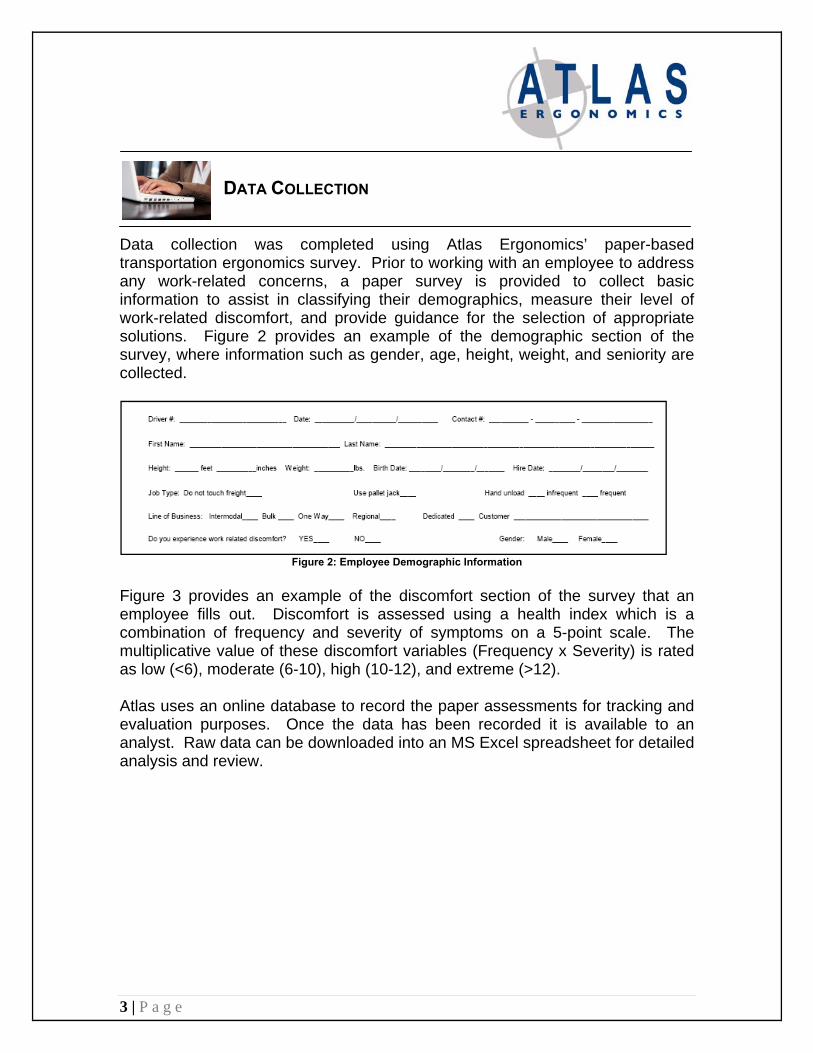
Data collection was completed using Atlas Ergonomics’ paper-based transportation ergonomics survey. Prior to working with an employee to address any work-related concerns, a paper survey is provided to collect basic information to assist in classifying their demographics, measure their level of work-related discomfort, and provide guidance for the selection of appropriate solutions. Figure 2 provides an example of the demographic section of the survey, where information such as gender, age, height, weight, and seniority are collected.
Figure 2: Employee Demographic Information
Figure 3 provides an example of the discomfort section of the survey that an employee fills out. Discomfort is assessed using a health index which is a combination of frequency and severity of symptoms on a 5-point scale. The multiplicative value of these discomfort variables (Frequency x Severity) is rated as low (<6), moderate (6-10), high (10-12), and extreme (>12). Atlas uses an online database to record the paper assessments for tracking and evaluation purposes. Once the data has been recorded it is available to an analyst. Raw data can be downloaded into an MS Excel spreadsheet for detailed analysis and review.

4 | P a g e
Figure 3: Location, Frequency, and Severity of Discomfort

5 | P a g e
DEFINITIONS
In order to compare discomfort to various variables it was necessary to process the discomfort data and present it in formats that aided in viewing the potential relationships. Six key measures of discomfort were used to illustrate the interaction between demographics and discomfort: Discomfort Prevalence: At the time of the survey an employee is asked
whether they are experiencing discomfort related to work activities. This Yes/No question provides a measure of the percentage of employees that are experiencing discomfort at the time of the survey.
Raw Discomfort Scores: The frequency and severity scores are measured on
a 5-point scale. The answers provided by the employee are multiplied together to provide a score termed the health index. This raw score provides a measure of the discomfort for a single body part.
Total Discomfort: Adding all health indices for a single employee (i.e.
scores for all body parts) provides a measure of the total discomfort for the employee.
Average Total Discomfort: For comparing differences between groups, an
average of the total discomfort scores across all employees in the group is calculated.
Maximum (Max) Discomfort: The maximum health index for a single employee
(i.e. highest health index for all body parts) provides a measure of discomfort severity for the employee.
Average Max Discomfort: For comparing differences between groups, an
average of the maximum discomfort scores across all employees in the group is calculated.
In addition to these measures of discomfort, the data within this paper has been formatted to provide the most effective means of conveying a message. Additional descriptions of the methods used to create the graphs and format the data will be described as necessary.
6 | P a g e
PARTICIPANTS
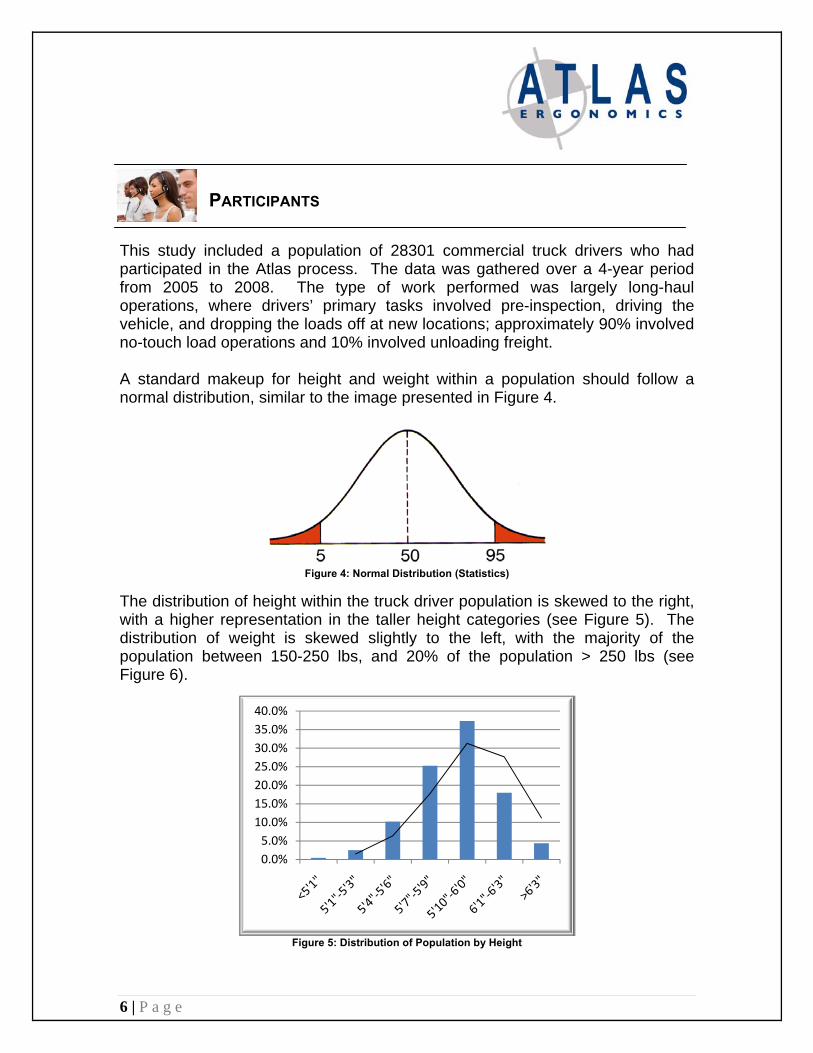
This study included a population of 28301 commercial truck drivers who had participated in the Atlas process. The data was gathered over a 4-year period from 2005 to 2008. The type of work performed was largely long-haul operations, where drivers’ primary tasks involved pre-inspection, driving the vehicle, and dropping the loads off at new locations; approximately 90% involved no-touch load operations and 10% involved unloading freight. A standard makeup for height and weight within a population should follow a normal distribution, similar to the image presented in Figure 4.
Figure 4: Normal Distribution (Statistics)
The distribution of height within the truck driver population is skewed to the right, with a higher representation in the taller height categories (see Figure 5). The distribution of weight is skewed slightly to the left, with the majority of the population between 150-250 lbs, and 20% of the population > 250 lbs (see Figure 6).
Figure 5: Distribution of Population by Height
0.0%
5.0%
10.0%
15.0%
20.0%
25.0%
30.0%
35.0%
40.0%

7 | P a g e
Figure 6: Distribution of Population by Weight
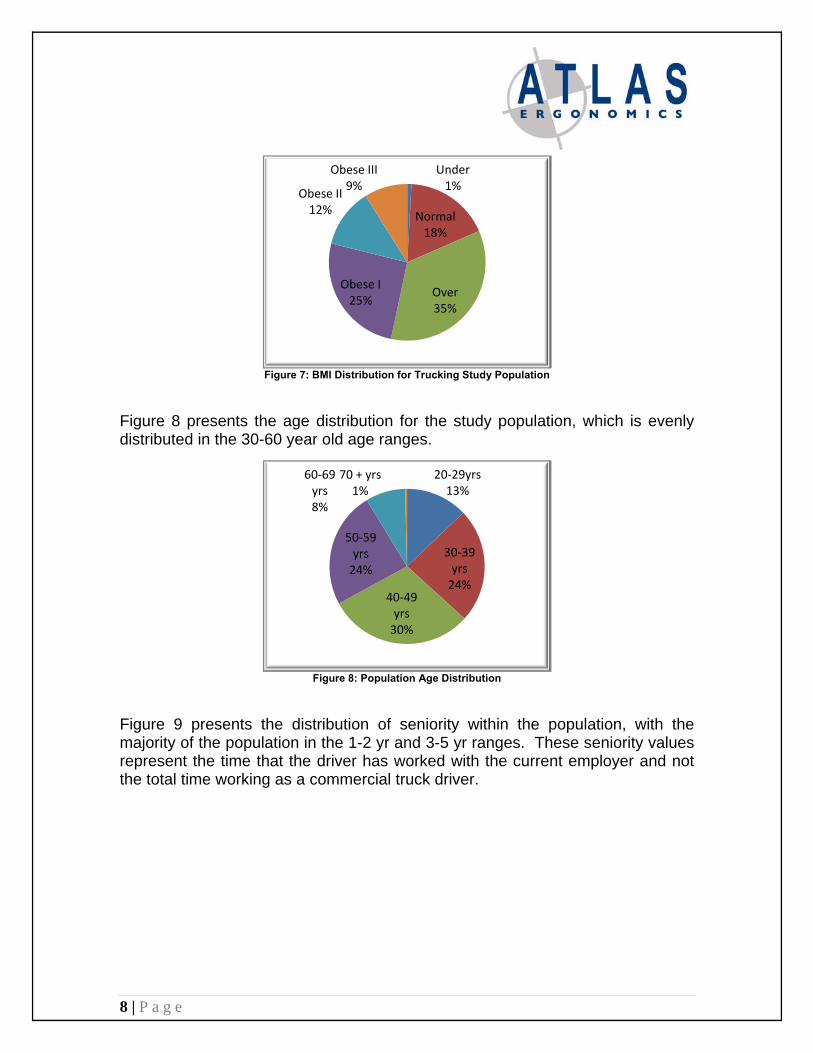
The body mass index is a measure that has been used extensively to approximate the body composition of an individual using a calculation based on height and weight. The index has been categorized based on research to indicate when an individual is normal weight, under or over weight, or obese. The measure has known biases, and can provide inaccurate measures for athletes (i.e. muscle mass) an elderly individuals. Overall, the measure provides a reasonable estimate of the fitness of an individual with respect to body composition. The latest estimates by the Center for Disease control (CDC) have indicated that nearly 31% of U.S. adults aged 20 and older (approximately 59 million people) were obese, defined as having a Body Mass Index (BMI) of 30 or more (Gallagher et al., 2000, Flegal et al., 2002; CDC, 2000). In this study, the population distribution indicated 46% of the population was obese, which represents a 48% increase in the level of obesity for the commercial driving population (see Figure 7). Similarly, the CDC study indicated that 36% of the population is classified as normal weight; this study population has 18% of its population at normal weight – a 100% difference.
1%
7%
39%
34%
14%
4% 2%
0%5%10%15%20%25%30%35%40%45%
8 | P a g e
Figure 7: BMI Distribution for Trucking Study Population
Figure 8 presents the age distribution for the study population, which is evenly distributed in the 30-60 year old age ranges.
Figure 8: Population Age Distribution
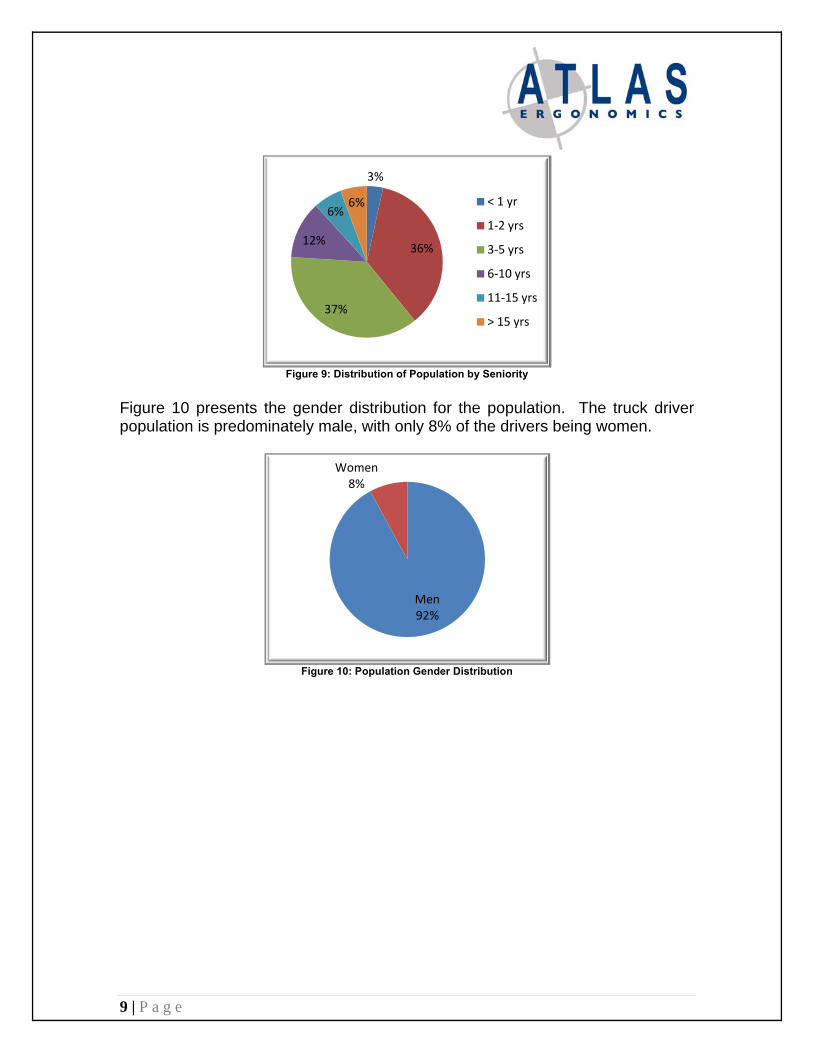
Figure 9 presents the distribution of seniority within the population, with the majority of the population in the 1-2 yr and 3-5 yr ranges. These seniority values represent the time that the driver has worked with the current employer and not the total time working as a commercial truck driver.
Under1%
Normal18%
Over35%
Obese I25%
Obese II12%
Obese III9%
20‐29yrs13%
30‐39 yrs24%
40‐49 yrs30%
50‐59 yrs24%
60‐69 yrs8%
70 + yrs1%
9 | P a g e
Figure 9: Distribution of Population by Seniority
Figure 10 presents the gender distribution for the population. The truck driver population is predominately male, with only 8% of the drivers being women.
Figure 10: Population Gender Distribution
3%
36%
37%
12%
6%6% < 1 yr
1‐2 yrs
3‐5 yrs
6‐10 yrs
11‐15 yrs
> 15 yrs
Men92%
Women8%
10 | P a g e
DEMOGRAPHICS VS. DISCOMFORT
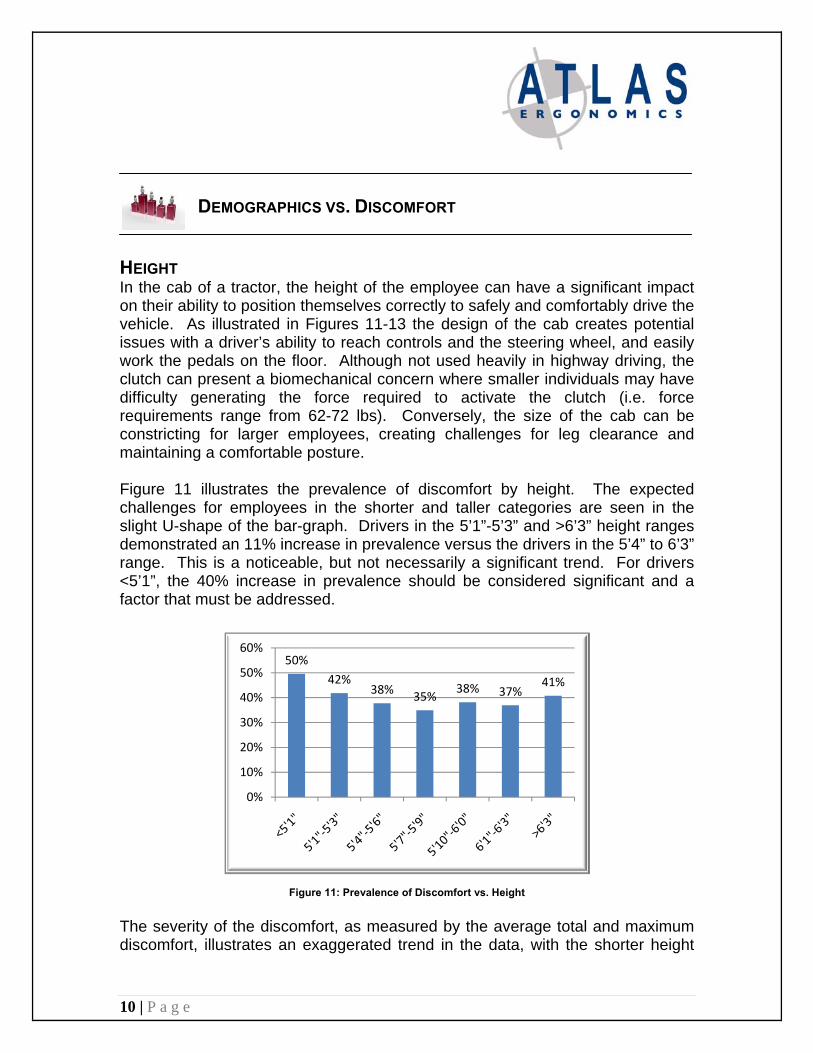
HEIGHT In the cab of a tractor, the height of the employee can have a significant impact on their ability to position themselves correctly to safely and comfortably drive the vehicle. As illustrated in Figures 11-13 the design of the cab creates potential issues with a driver’s ability to reach controls and the steering wheel, and easily work the pedals on the floor. Although not used heavily in highway driving, the clutch can present a biomechanical concern where smaller individuals may have difficulty generating the force required to activate the clutch (i.e. force requirements range from 62-72 lbs). Conversely, the size of the cab can be constricting for larger employees, creating challenges for leg clearance and maintaining a comfortable posture. Figure 11 illustrates the prevalence of discomfort by height. The expected challenges for employees in the shorter and taller categories are seen in the slight U-shape of the bar-graph. Drivers in the 5’1”-5’3” and >6’3” height ranges demonstrated an 11% increase in prevalence versus the drivers in the 5’4” to 6’3” range. This is a noticeable, but not necessarily a significant trend. For drivers <5’1”, the 40% increase in prevalence should be considered significant and a factor that must be addressed.
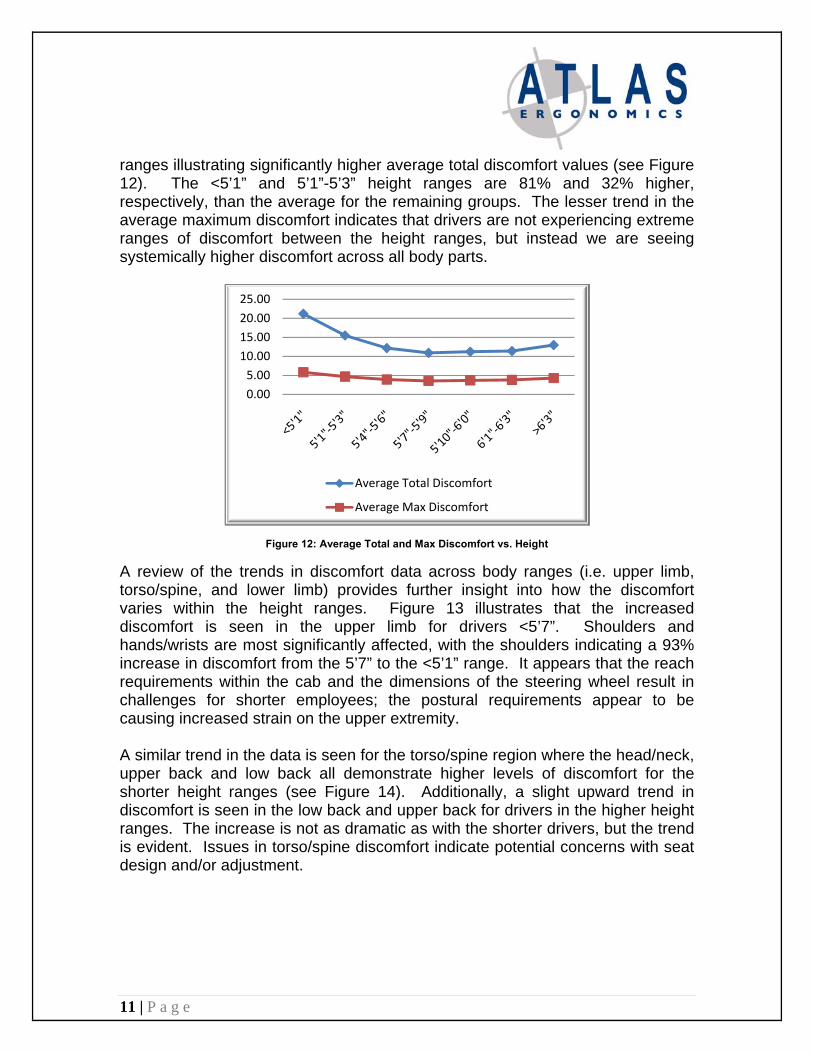
Figure 11: Prevalence of Discomfort vs. Height The severity of the discomfort, as measured by the average total and maximum discomfort, illustrates an exaggerated trend in the data, with the shorter height
50%
42%38%
35%38% 37%
41%
0%
10%
20%
30%
40%
50%
60%
11 | P a g e
ranges illustrating significantly higher average total discomfort values (see Figure 12). The <5’1” and 5’1”-5’3” height ranges are 81% and 32% higher, respectively, than the average for the remaining groups. The lesser trend in the average maximum discomfort indicates that drivers are not experiencing extreme ranges of discomfort between the height ranges, but instead we are seeing systemically higher discomfort across all body parts.
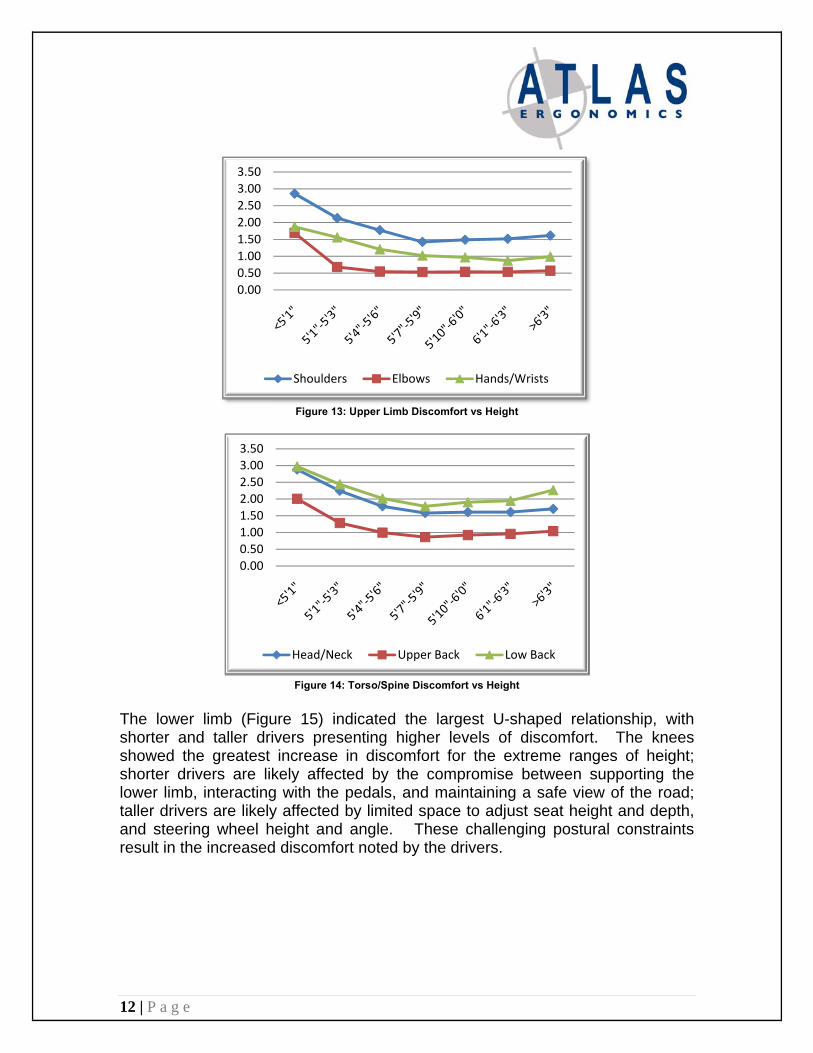
Figure 12: Average Total and Max Discomfort vs. Height A review of the trends in discomfort data across body ranges (i.e. upper limb, torso/spine, and lower limb) provides further insight into how the discomfort varies within the height ranges. Figure 13 illustrates that the increased discomfort is seen in the upper limb for drivers <5’7”. Shoulders and hands/wrists are most significantly affected, with the shoulders indicating a 93% increase in discomfort from the 5’7” to the <5’1” range. It appears that the reach requirements within the cab and the dimensions of the steering wheel result in challenges for shorter employees; the postural requirements appear to be causing increased strain on the upper extremity. A similar trend in the data is seen for the torso/spine region where the head/neck, upper back and low back all demonstrate higher levels of discomfort for the shorter height ranges (see Figure 14). Additionally, a slight upward trend in discomfort is seen in the low back and upper back for drivers in the higher height ranges. The increase is not as dramatic as with the shorter drivers, but the trend is evident. Issues in torso/spine discomfort indicate potential concerns with seat design and/or adjustment.
0.00
5.00
10.00
15.00
20.00
25.00
Average Total Discomfort
Average Max Discomfort
12 | P a g e
Figure 13: Upper Limb Discomfort vs Height
Figure 14: Torso/Spine Discomfort vs Height
The lower limb (Figure 15) indicated the largest U-shaped relationship, with shorter and taller drivers presenting higher levels of discomfort. The knees showed the greatest increase in discomfort for the extreme ranges of height; shorter drivers are likely affected by the compromise between supporting the lower limb, interacting with the pedals, and maintaining a safe view of the road; taller drivers are likely affected by limited space to adjust seat height and depth, and steering wheel height and angle. These challenging postural constraints result in the increased discomfort noted by the drivers.
0.00
0.50
1.00
1.50
2.00
2.50
3.00
3.50
Shoulders Elbows Hands/Wrists
0.00
0.50
1.00
1.50
2.00
2.50
3.00
3.50
Head/Neck Upper Back Low Back

13 | P a g e
Figure 15: Lower Limb Discomfort vs Height
WEIGHT One of the major challenges for a truck driver is related to diet, exercise, and weight control. The constant travel and sedentary nature of driving can result in weight related issues. As noted in Figure 6, the study population has 20% of drivers >250 lbs. An obvious question to consider is whether weight is a factor that is influencing the discomfort felt by drivers. Figure 16 presents the prevalence of discomfort by categories of weight. A skewed U-shape trend is seen in the data, with drivers <125 lbs and those >250lbs experiencing a 14-28% higher prevalence of discomfort.
Figure 16: Weight vs. Prevalence of Discomfort
A very similar trend is seen for the severity of the discomfort (see Figure 17). The wave-shaped line graphs illustrate a higher level of discomfort at the extreme ranges of weight. The increase in discomfort is approximately 30-40%
0.00
0.50
1.00
1.50
2.00
2.50
3.00
Hips/Thighs Knees Ankles/Feet
40%
35% 34%37%
40%45% 44%
0%5%
10%15%20%25%30%35%40%45%50%
14 | P a g e
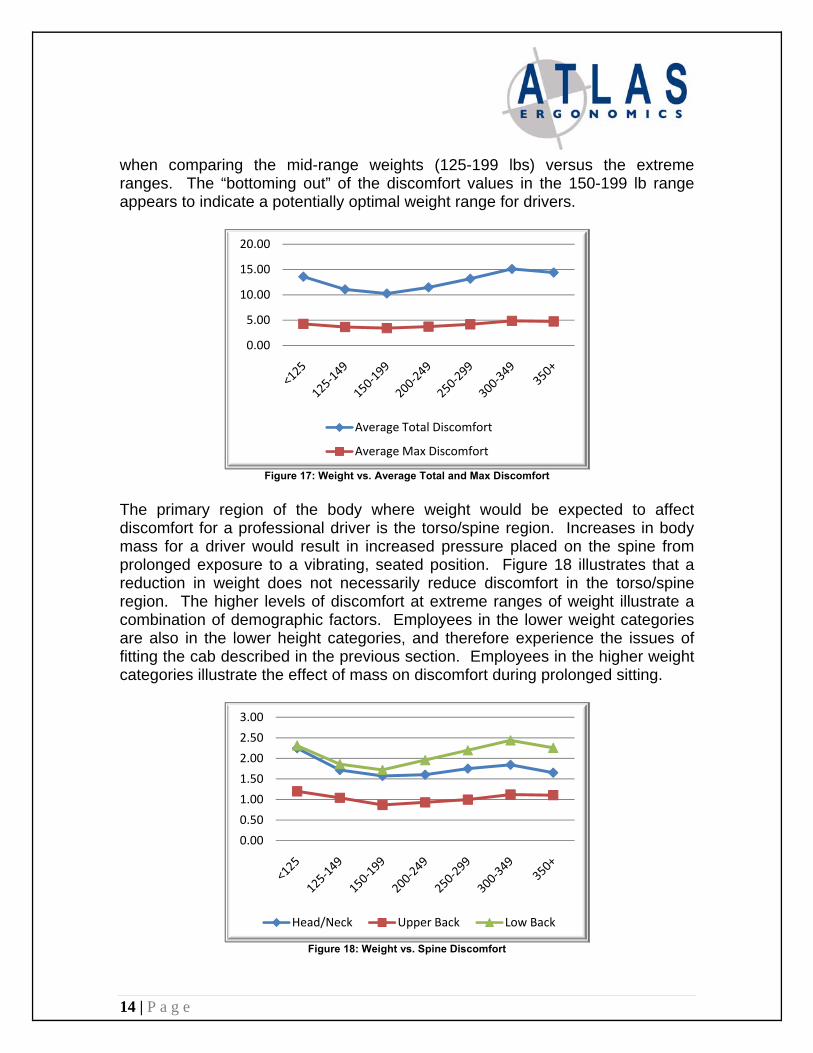
when comparing the mid-range weights (125-199 lbs) versus the extreme ranges. The “bottoming out” of the discomfort values in the 150-199 lb range appears to indicate a potentially optimal weight range for drivers.
Figure 17: Weight vs. Average Total and Max Discomfort
The primary region of the body where weight would be expected to affect discomfort for a professional driver is the torso/spine region. Increases in body mass for a driver would result in increased pressure placed on the spine from prolonged exposure to a vibrating, seated position. Figure 18 illustrates that a reduction in weight does not necessarily reduce discomfort in the torso/spine region. The higher levels of discomfort at extreme ranges of weight illustrate a combination of demographic factors. Employees in the lower weight categories are also in the lower height categories, and therefore experience the issues of fitting the cab described in the previous section. Employees in the higher weight categories illustrate the effect of mass on discomfort during prolonged sitting.
Figure 18: Weight vs. Spine Discomfort
0.00
5.00
10.00
15.00
20.00
Average Total Discomfort
Average Max Discomfort
0.00
0.50
1.00
1.50
2.00
2.50
3.00
Head/Neck Upper Back Low Back
15 | P a g e
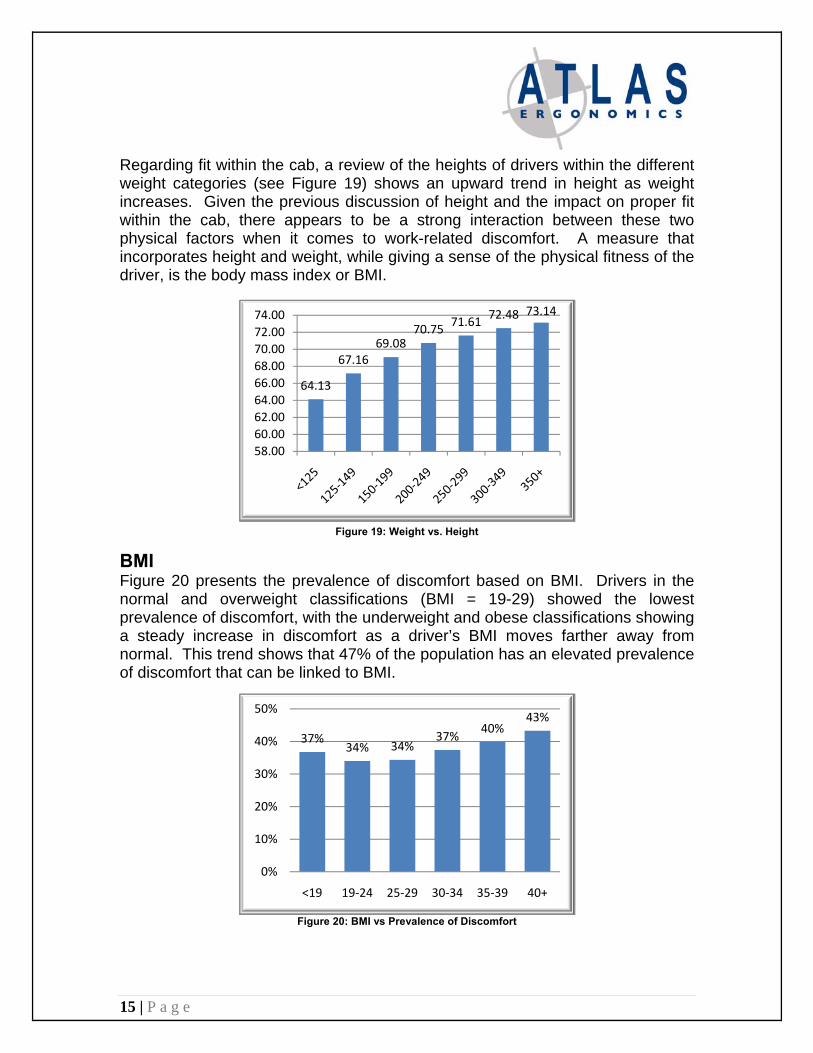
Regarding fit within the cab, a review of the heights of drivers within the different weight categories (see Figure 19) shows an upward trend in height as weight increases. Given the previous discussion of height and the impact on proper fit within the cab, there appears to be a strong interaction between these two physical factors when it comes to work-related discomfort. A measure that incorporates height and weight, while giving a sense of the physical fitness of the driver, is the body mass index or BMI.
Figure 19: Weight vs. Height
BMI Figure 20 presents the prevalence of discomfort based on BMI. Drivers in the normal and overweight classifications (BMI = 19-29) showed the lowest prevalence of discomfort, with the underweight and obese classifications showing a steady increase in discomfort as a driver’s BMI moves farther away from normal. This trend shows that 47% of the population has an elevated prevalence of discomfort that can be linked to BMI.
Figure 20: BMI vs Prevalence of Discomfort
64.13
67.1669.08
70.7571.61
72.48 73.14
58.00
60.00
62.00
64.00
66.00
68.00
70.00
72.00
74.00
37%34% 34%
37%40%
43%
0%
10%
20%
30%
40%
50%
<19 19‐24 25‐29 30‐34 35‐39 40+

16 | P a g e
Figures 21-23 present the discomfort values for the upper limb, torso/spine, and lower limb areas of the body. Each of these graphs illustrates a very similar trend – a slight increase in discomfort for underweight individuals, and a steady increase in discomfort for overweight through obese individuals. The head/neck and upper back appear to be the only areas of the body that have a limited impact based on BMI. Conversely, all three body parts for the lower limb (Figure 23) show the most dramatic upward trend in discomfort as BMI increases. It is clear from the data that fitness, as measured by the body composition of the driver, is a factor that should be used to prioritize interventions.
Figure 21: BMI vs. Upper Extremity Discomfort
Figure 22: BMI vs. Neck & Torso Discomfort
0.00
0.50
1.00
1.50
2.00
<19 19‐24 25‐29 30‐34 35‐39 40+
Shoulders Elbows Wrists/Hands
0.00
0.50
1.00
1.50
2.00
2.50
3.00
<19 19‐24 25‐29 30‐34 35‐39 40+
Head/Neck Upper Back Low Back
17 | P a g e
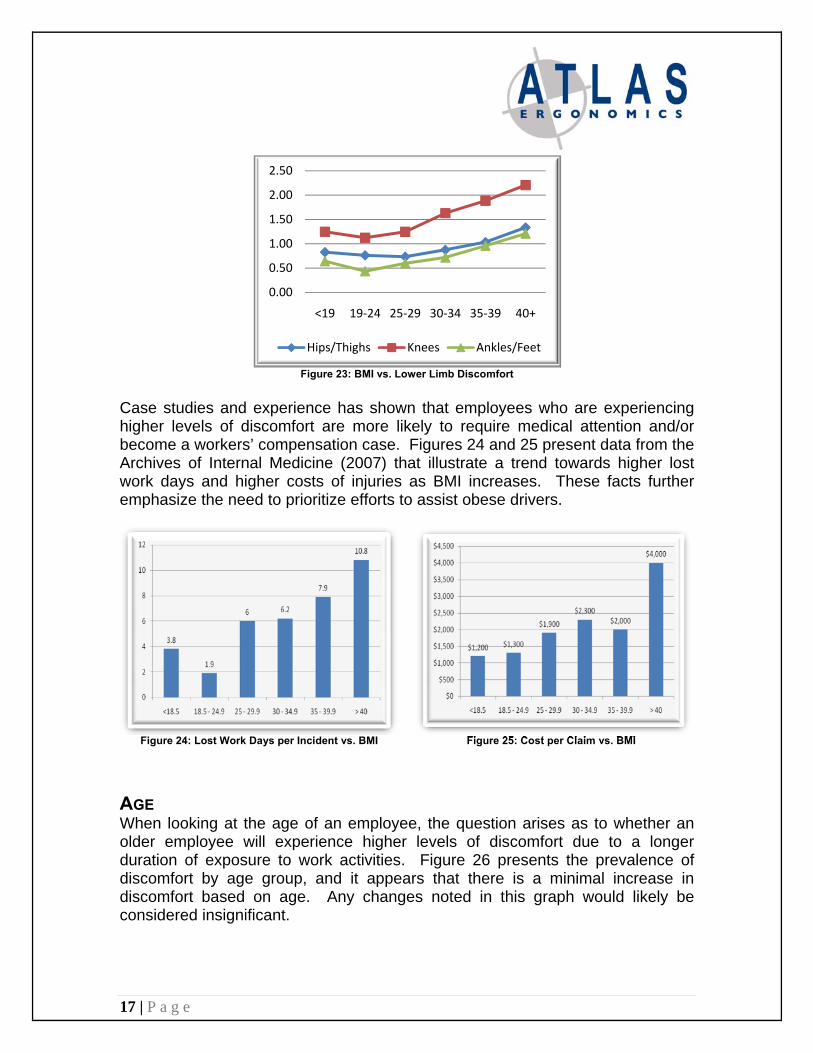
Figure 23: BMI vs. Lower Limb Discomfort
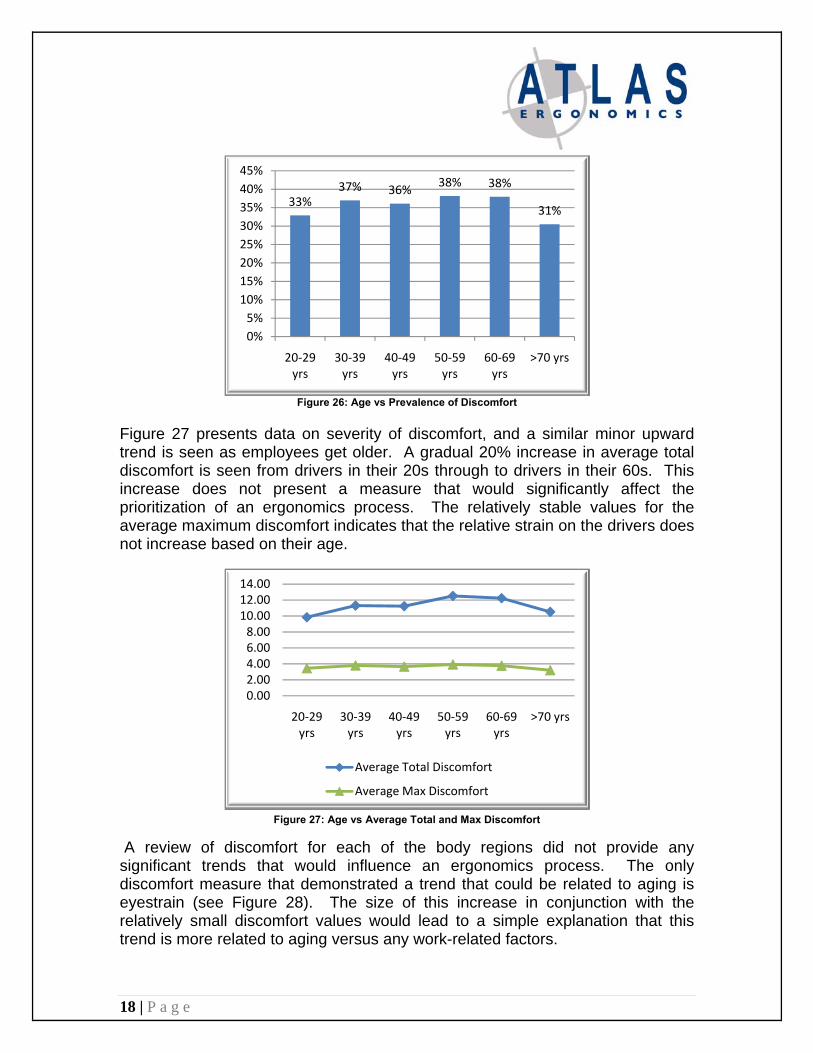
Case studies and experience has shown that employees who are experiencing higher levels of discomfort are more likely to require medical attention and/or become a workers’ compensation case. Figures 24 and 25 present data from the Archives of Internal Medicine (2007) that illustrate a trend towards higher lost work days and higher costs of injuries as BMI increases. These facts further emphasize the need to prioritize efforts to assist obese drivers.
Figure 24: Lost Work Days per Incident vs. BMI Figure 25: Cost per Claim vs. BMI
AGE When looking at the age of an employee, the question arises as to whether an older employee will experience higher levels of discomfort due to a longer duration of exposure to work activities. Figure 26 presents the prevalence of discomfort by age group, and it appears that there is a minimal increase in discomfort based on age. Any changes noted in this graph would likely be considered insignificant.
0.00
0.50
1.00
1.50
2.00
2.50
<19 19‐24 25‐29 30‐34 35‐39 40+
Hips/Thighs Knees Ankles/Feet
18 | P a g e
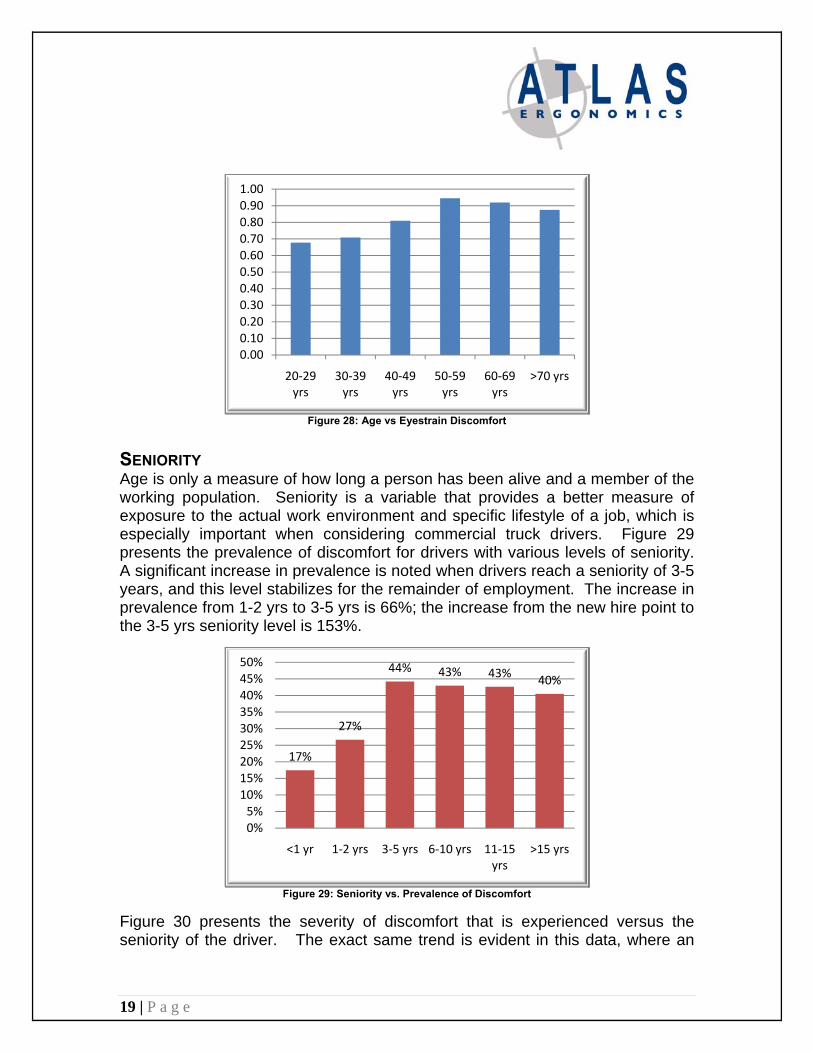
Figure 26: Age vs Prevalence of Discomfort
Figure 27 presents data on severity of discomfort, and a similar minor upward trend is seen as employees get older. A gradual 20% increase in average total discomfort is seen from drivers in their 20s through to drivers in their 60s. This increase does not present a measure that would significantly affect the prioritization of an ergonomics process. The relatively stable values for the average maximum discomfort indicates that the relative strain on the drivers does not increase based on their age.
Figure 27: Age vs Average Total and Max Discomfort
A review of discomfort for each of the body regions did not provide any significant trends that would influence an ergonomics process. The only discomfort measure that demonstrated a trend that could be related to aging is eyestrain (see Figure 28). The size of this increase in conjunction with the relatively small discomfort values would lead to a simple explanation that this trend is more related to aging versus any work-related factors.
33%37% 36%
38% 38%
31%
0%
5%
10%
15%
20%
25%
30%
35%
40%
45%
20‐29 yrs
30‐39 yrs
40‐49 yrs
50‐59 yrs
60‐69 yrs
>70 yrs
0.002.004.006.008.0010.0012.0014.00
20‐29 yrs
30‐39 yrs
40‐49 yrs
50‐59 yrs
60‐69 yrs
>70 yrs
Average Total Discomfort
Average Max Discomfort
19 | P a g e
Figure 28: Age vs Eyestrain Discomfort
SENIORITY Age is only a measure of how long a person has been alive and a member of the working population. Seniority is a variable that provides a better measure of exposure to the actual work environment and specific lifestyle of a job, which is especially important when considering commercial truck drivers. Figure 29 presents the prevalence of discomfort for drivers with various levels of seniority. A significant increase in prevalence is noted when drivers reach a seniority of 3-5 years, and this level stabilizes for the remainder of employment. The increase in prevalence from 1-2 yrs to 3-5 yrs is 66%; the increase from the new hire point to the 3-5 yrs seniority level is 153%.
Figure 29: Seniority vs. Prevalence of Discomfort
Figure 30 presents the severity of discomfort that is experienced versus the seniority of the driver. The exact same trend is evident in this data, where an
0.000.100.200.300.400.500.600.700.800.901.00
20‐29 yrs
30‐39 yrs
40‐49 yrs
50‐59 yrs
60‐69 yrs
>70 yrs
17%
27%
44% 43% 43%40%
0%5%
10%15%20%25%30%35%40%45%50%
<1 yr 1‐2 yrs 3‐5 yrs 6‐10 yrs 11‐15 yrs
>15 yrs

20 | P a g e
89% increase in average total discomfort is seen from 1-2 yrs to 3-5 yrs of seniority, and a 207% increase is seen from newly hired drivers to those drivers with 3-5 yrs of seniority. The average maximum discomfort line does not look as significant in the graph, but the trend is equally dramatic with a 63% and 163% increase in discomfort over the same time periods. These trends in discomfort are seen across all of the body regions. Figure 31 illustrates a range of 153%-325% increase in discomfort for drivers as you move from new hires (< 1 yr) to drivers with 3-5 yrs of seniority. With these significant increases in discomfort that occur early on in employment, it is important for an organization to look at its turnover rate and the average seniority of a driver when they leave the company. As noted in Figure 9, only a small percentage of drivers have greater than 5 years of seniority (24%). A correlation in these factors presents an additional opportunity to save costs by addressing the causes of the increased discomfort early in a driver’s career with the company.
Figure 30: Seniority vs. Average Total and Max Discomfort
Figure 31: Increase in Discomfort for New Hires to 3-5 yr Seniority
0.00
5.00
10.00
15.00
20.00
<1 yr 1‐2 yrs 3‐5 yrs 6‐10 yrs 11‐15 yrs
>15 yrs
Average Total Discomfort
Average Max Discomfort
170%
248%
325%
154%
252%
181%
263%
190%
270%
0%
50%
100%
150%
200%
250%
300%
350%
21 | P a g e
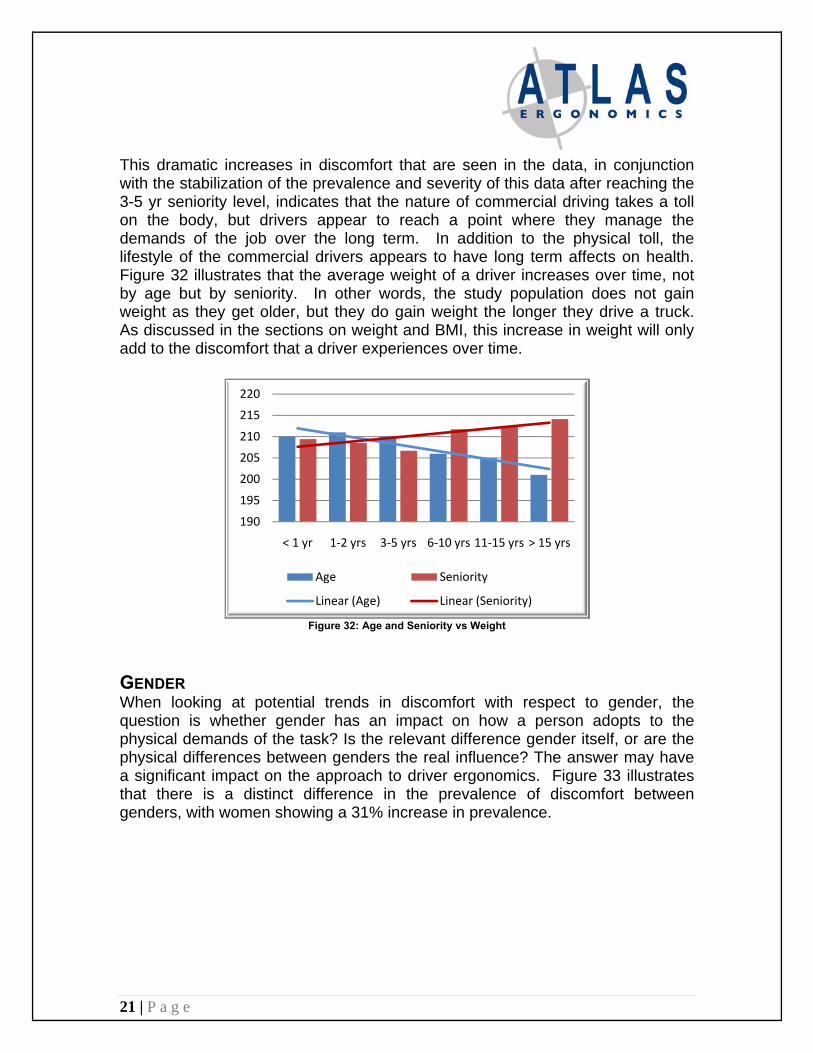
This dramatic increases in discomfort that are seen in the data, in conjunction with the stabilization of the prevalence and severity of this data after reaching the 3-5 yr seniority level, indicates that the nature of commercial driving takes a toll on the body, but drivers appear to reach a point where they manage the demands of the job over the long term. In addition to the physical toll, the lifestyle of the commercial drivers appears to have long term affects on health. Figure 32 illustrates that the average weight of a driver increases over time, not by age but by seniority. In other words, the study population does not gain weight as they get older, but they do gain weight the longer they drive a truck. As discussed in the sections on weight and BMI, this increase in weight will only add to the discomfort that a driver experiences over time.
Figure 32: Age and Seniority vs Weight
GENDER When looking at potential trends in discomfort with respect to gender, the question is whether gender has an impact on how a person adopts to the physical demands of the task? Is the relevant difference gender itself, or are the physical differences between genders the real influence? The answer may have a significant impact on the approach to driver ergonomics. Figure 33 illustrates that there is a distinct difference in the prevalence of discomfort between genders, with women showing a 31% increase in prevalence.
190
195
200
205
210
215
220
< 1 yr 1‐2 yrs 3‐5 yrs 6‐10 yrs 11‐15 yrs > 15 yrs
Age Seniority
Linear (Age) Linear (Seniority)

22 | P a g e
Figure 33: Gender vs. Prevalence of Discomfort
The severity of discomfort, as measured by average total and max discomfort, shows an even greater increase in discomfort for women (see Figure 34); the average total discomfort is 74% higher and the average max discomfort is 55% higher. These values indicate a systematic impact of gender on discomfort.
Figure 34: Gender vs. Average Total and Max Discomfort
Figure 35 shows the differences in discomfort levels between women and men by body part. Women consistently have significantly higher levels of discomfort. The upper limb region, which can include the head/neck and upper back, presents the most significant increases in discomfort. The low back was the area of the body with the lowest increase in discomfort. The important question to ask is what differences exist between genders that can be attributed to these differences in discomfort.
35.7%
46.9%
0.0%
10.0%
20.0%
30.0%
40.0%
50.0%
Men Women
10.84
3.59
18.89
5.58
0.00
5.00
10.00
15.00
20.00
Average Total Discomfort Average Max Discomfort
Men Women

23 | P a g e
Figure 35: Increase in Discomfort for Women by Body Part
The demographic variables that have been reviewed in the previous sections of this paper include height, weight, BMI, age, and seniority. Reviewing the details for these demographic variables, the following differences are seen based on gender:
1. Weight and BMI: a) Women have an average weight that is lighter than men at 160 lbs
versus 213 lbs. b) 6-10% of the drivers in the overweight through obese classifications
were women. c) This represents a low representation by women, and likely has a
minimal impact on the differences in discomfort. In fact, this trend should result in higher levels of discomfort for men.
2. Age and Seniority: a) The average age for women and men is relatively equal at 43.25
and 43.75 yrs respectively. b) Women had an average level of seniority of 3.7 yrs versus 4.8 for
men. c) These factors should be considered positive as lower levels of
seniority were correlated with lower levels of discomfort. 3. Height:
a) The average height for women is 5’4” and 5’10” for men. b) Height is the lone demographic factor that has a significant
difference between genders. Based on the data presented earlier in this paper on height, it is clear that the design of the cab and seat are creating a challenge for individuals of smaller stature, resulting in elevated levels of discomfort across all body parts.
104%
69%
107%
85% 90%
42%
86%
56%63%
0%
20%
40%
60%
80%
100%
120%
24 | P a g e
A final factor that is not measured by the survey that may result in higher discomfort for women is muscular strength. Grip strength, upper body strength, and lower body strength may have an influence on the strain placed on drivers due to such tasks as gripping and turning the steering wheel and depressing the clutch. These factors will need to be measured to determine the potential impact on drivers.
25 | P a g e
CONCLUSIONS
The review of this significant database of driver demographics and discomfort provides valuable insight into the trends that must be acknowledged, and therefore the solutions that must be considered for the future. These trends highlight how a driver interacts with their job and their workstation (i.e. cab), and how differences in employee demographics may lead to approaches to improve the safety of an organization:
1. Population: The commercial driving population is comprised predominately of men. The drivers are evenly distributed by age, but tend to be taller in stature and heavier in weight; 20% of the population is >250 lbs and 54% of the population is >200 lbs.
2. Height: Stature appears to be a demographic variable with significant impact on driver discomfort. Smaller individuals seem to have concerns with reaching controls and accessing all features of the cab, while taller drivers seem to have issues with fitting into the available space. Optimization of fit and modifications to driver set-up may be key factors to address this issue.
3. Weight and BMI: Weight is a measure that has a correlation with discomfort, but BMI is appears to be a better indicator of risk. The driver population has an extremely high number of individuals in the overweight and obese classifications. Discomfort is distinctly higher for the obese population, which therefore prioritizes this group for intervention. The data illustrates a financial impact of obesity as noted by a higher frequency of LWDs and a higher cost per claim. Research has further shown that BMI is linked to sleep apnea and short sleep cycles, which subsequently increases the health and safety risk for drivers (Dagan et al., 2006).
4. Age and Seniority: In a recent study by the BLS, it was found that median days away from work increases as age increases. Workers age 65 and over experienced the longest absences from work with a median of 16 days, compared to 4 days away from work for workers age 16 to 24. Age does not appear to be an indicator of risk within the driver population;
26 | P a g e
insignificant trends were noted in the data. But, given the wide distribution of age within the population, this finding by the BLS may be an important factor to consider when looking at the potential costs of injury and the age of the driver when they are a new hire. Seniority provided a significant indicator of risk, with drivers experiencing higher levels of discomfort as they approached 3-5 yrs of service. The low number of drivers with > 5 years seniority seems to indicate a potential opportunity to increase retention and reduce turnover.
5. Gender: The differences in average height and strength that are seen between genders appear to result in elevated strain on the female population. Although a small number of women were in the study population (8%), their significantly higher discomfort levels presented a noticeable trend. Controls designed to improve the fit for drivers of smaller stature will have a positive impact on the female driver population.
The second paper in this series on transportation ergonomics will focus on the trends in discomfort over time. The drivers from this survey participated in follow-up surveys over a 4 year period, and their concerns were addressed over the course of this project. The interventions and results will be presented to highlight solutions that should be considered by a commercial transportation company. If there are any questions or comments related to this paper, they should be directed to [email protected].
27 | P a g e
BIBLIOGRAPHY
Center for Disease Control and Prevention, National Center for Health Statistics. Prevalence of Overweight and Obesity Among Adults: United States, 1999-2000. Available at: www.cdc.gov/nchs/products/pubs/pubd/hestats/obese/obse99.htm. Dagan Y, Doljansky JT, Green A, Weiner A. (2006). Body Mass Index (BMI) as a first-line screening criterion for detection of excessive daytime sleepiness among professional drivers. Traffic Inj Prev. Mar;7(1):44-8. Flegal KM, Carroll MD, Ogden CL, Johnson CL. (2002). Prevalence and trends in obesity among US adults, 1999-2000. JAMA, 288:1723-1727. Gallagher D, Heymsfield SB, Heo M, et al. (2000). Healthy percentage body fat ranges; an approach for developing guidelines based on body mass index. Am J Clin Nutr., 72:694-701 Robb, MJ, and Mansfield, NJ. (2007). Self-reported musculoskeletal problems amongst professional truck drivers. ErgonomicsVol. 50, No. 6, 814–827.