Embed Size (px)
Citation preview
PLUMMETING COSTS
AND DRAMATIC
IMPROVEMENTS
IN BATTERIES
CAN ACCELERATE
OUR CLEAN
TRANSPORTATION
FUTURE
APRIL 2021
TRANSPORTATION
Global carbon emissions must be halved by 2030 to limit warming to 1.5°C and avoid catastrophic climate impacts. The U.S. transportation sector is the country’s largest carbon emitter and a challenging piece of the decarbonization puzzle. Fortunately, recent advances in electric vehicle (EV) battery cost and performance, range, and recharging—along with a proliferation of vehicle models—have readied EVs to overtake gasoline and diesel vehicles as the dominant on-road technology. Now that the plummeting cost of wind and solar power have enabled a rapid and cost-effective expansion of a clean electricity grid, a cost-effective pathway to decarbonize the transportation sector is in reach. Yet electric vehicles make up only a small part of today’s U.S. vehicle fleet, and many sales projections for the next decade are modest. Several hurdles, including high upfront vehicle costs and inadequate charging infrastructure, rather than technical or economic feasibility, are the largest barriers to EV sales growth and accelerated decarbonization to align with global climate targets.
In this report, we analyze the economic, human health, environmental, and electric grid impacts of a future in which ground transportation is all-electric. Our main scenario, the Drive Rapid Innovation in Vehicle Electrification (DRIVE Clean) scenario, represents a future in which EVs constitute 100% of new U.S. light-duty vehicle (LDV) sales by 2030 as well as 100% of medium-duty vehicle (MDV) and heavy-duty truck (HDT) sales by 2035. The grid reaches 90% clean electricity by 2035, and substantial EV charging infrastructure is deployed. We compare this scenario to a No New Policy scenario, in which EVs constitute 45% of new LDV sales, 38% of MDV sales, and 12% of HDT sales in 2035, and the clean electricity share reaches only 47% by 2035. By demonstrating that the ambitious DRIVE Clean goals are technically feasible and economically beneficial, we aim to inform broader discussions of the U.S. transportation transition. Following are key findings from our analysis.
1 EXECUTIVE SUMMARY
2035 2.0 THE REPORT | i
CONSUMER SAVINGS FROM EV OWNERSHIP START SOON AND GROW RAPIDLY
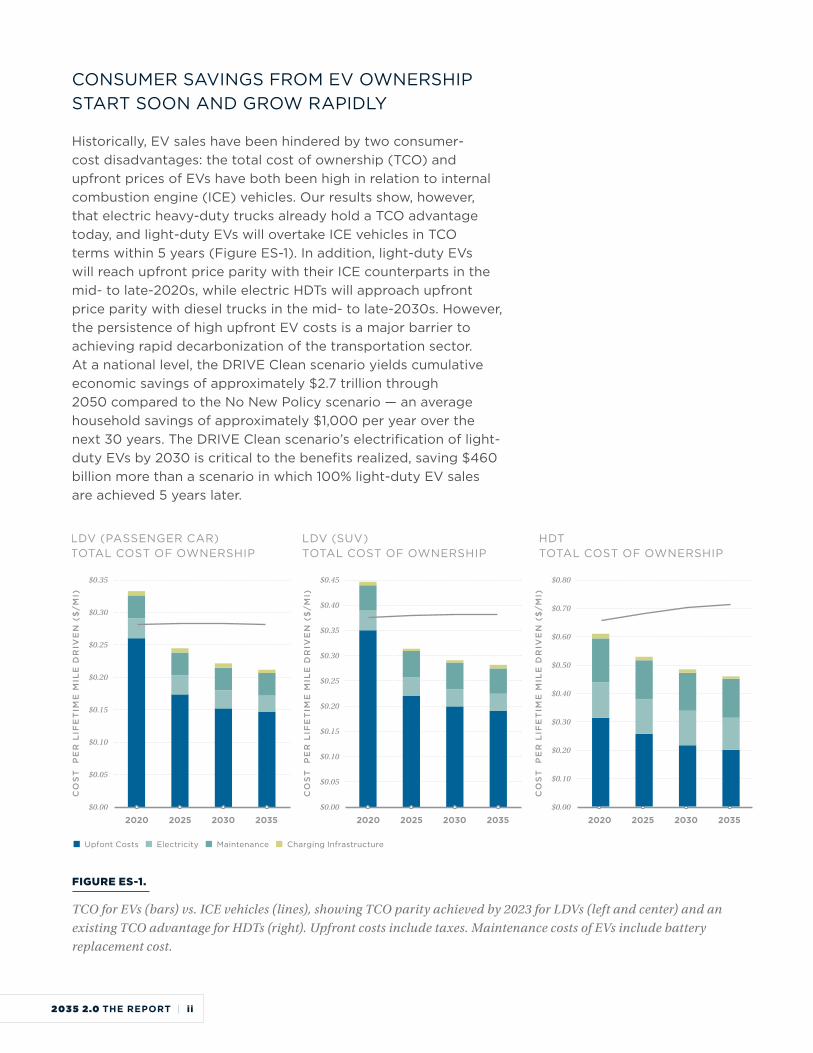
Historically, EV sales have been hindered by two consumer-cost disadvantages: the total cost of ownership (TCO) and upfront prices of EVs have both been high in relation to internal combustion engine (ICE) vehicles. Our results show, however, that electric heavy-duty trucks already hold a TCO advantage today, and light-duty EVs will overtake ICE vehicles in TCO terms within 5 years (Figure ES-1). In addition, light-duty EVs will reach upfront price parity with their ICE counterparts in the mid- to late-2020s, while electric HDTs will approach upfront price parity with diesel trucks in the mid- to late-2030s. However, the persistence of high upfront EV costs is a major barrier to achieving rapid decarbonization of the transportation sector. At a national level, the DRIVE Clean scenario yields cumulative economic savings of approximately $2.7 trillion through 2050 compared to the No New Policy scenario — an average household savings of approximately $1,000 per year over the next 30 years. The DRIVE Clean scenario’s electrification of light-duty EVs by 2030 is critical to the benefits realized, saving $460 billion more than a scenario in which 100% light-duty EV sales are achieved 5 years later.
FIGURE ES-1.
TCO for EVs (bars) vs. ICE vehicles (lines), showing TCO parity achieved by 2023 for LDVs (left and center) and an existing TCO advantage for HDTs (right). Upfront costs include taxes. Maintenance costs of EVs include battery replacement cost.
LDV (PASSENGER CAR) TOTAL COST OF OWNERSHIP
LDV (SUV) TOTAL COST OF OWNERSHIP
HDT TOTAL COST OF OWNERSHIP
$0.35
$0.30
$0.25
$0.20
$0.15
$0.10
$0.05
$0.00
$0.45
$0.40
$0.35
$0.30
$0.25
$0.20
$0.15
$0.10
$0.05
$0.00
$0.80
$0.70
$0.60
$0.50
$0.40
$0.30
$0.20
$0.10
$0.00
CO
ST
P
ER
LIF
ET
IME
MIL
E D
RIV
EN
($
/MI)
CO
ST
P
ER
LIF
ET
IME
MIL
E D
RIV
EN
($
/MI)
CO
ST
P
ER
LIF
ET
IME
MIL
E D
RIV
EN
($
/MI)
2020 2025 2030 2035 2020 2025 2030 2035 2020 2025 2030 2035
Upfont Costs Electricity Maintenance Charging Infrastructure
2035 2.0 THE REPORT | ii
ACCELERATING EV ADOPTION SAVES 150,000 LIVES, AVOIDS $1.3 TRILLION IN HEALTH AND ENVIRONMENTAL DAMAGES THROUGH 2050
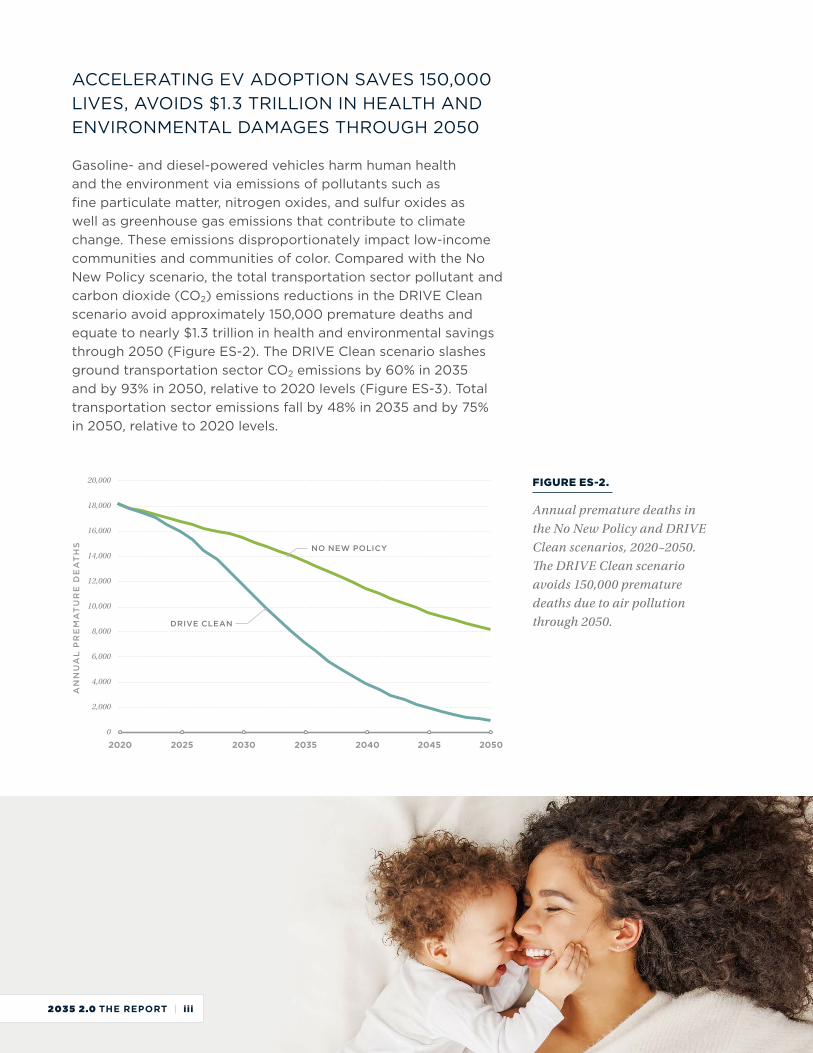
Gasoline- and diesel-powered vehicles harm human health and the environment via emissions of pollutants such as fine particulate matter, nitrogen oxides, and sulfur oxides as well as greenhouse gas emissions that contribute to climate change. These emissions disproportionately impact low-income communities and communities of color. Compared with the No New Policy scenario, the total transportation sector pollutant and carbon dioxide (CO2) emissions reductions in the DRIVE Clean scenario avoid approximately 150,000 premature deaths and equate to nearly $1.3 trillion in health and environmental savings through 2050 (Figure ES-2). The DRIVE Clean scenario slashes ground transportation sector CO2 emissions by 60% in 2035 and by 93% in 2050, relative to 2020 levels (Figure ES-3). Total transportation sector emissions fall by 48% in 2035 and by 75% in 2050, relative to 2020 levels.
FIGURE ES-2.
Annual premature deaths in the No New Policy and DRIVE Clean scenarios, 2020–2050. The DRIVE Clean scenario avoids 150,000 premature deaths due to air pollution through 2050.
20,000
18,000
16,000
14,000
12,000
10,000
8,000
6,000
4,000
2,000
0
AN
NU
AL
PR
EM
AT
UR
E D
EA
TH
S
2020 2025 2030 2035 2040 2045 2050
DRIVE CLEAN
NO NEW POLICY
2035 2.0 THE REPORT | iii
GHG EMISSIONS IN THE TRANSPORTATION SECTOR
2,000
1,500
1,000
500
0TO
TA
L T
RA
NS
PO
RT
SE
CT
OR
CO
2 E
MIS
SIO
NS
(MT
/Y
R)
1990 2000 2010 2020 2030 2040 2050
MEDIUM- AND HEAVY-DUTY TRUCKS ELECTRIFICATION
(100% SALES BY 2035)
LIGHT-DUTY VEHICLE ELECTRIFICATION
(100% SALES BY 2030)
NO NEW POLICY EMISSIONS
FIGURE ES-3.
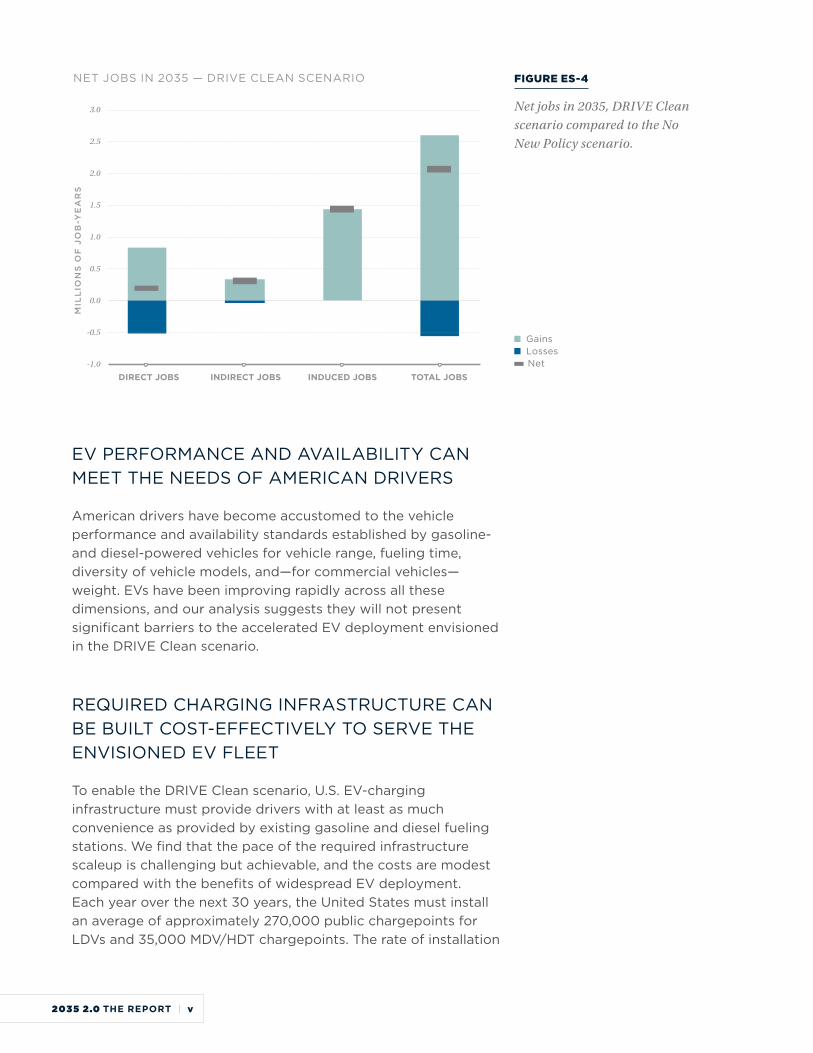
Transportation sector CO2 emissions in the DRIVE Clean and No New Policy scenarios through 2050.
THE ELECTRIC VEHICLE TRANSITION SUPPORTS EMPLOYMENT OPPORTUNITIES ACROSS THE ECONOMY
The DRIVE Clean scenario supports consistent job gains in 2020-2035, peaking at over 2 million jobs in 2035 compared to the No New Policy scenario (Figure ES-4). Employment gradually ramps up in this timeframe as electric vehicle manufacturing expands and the electric grid adds new renewable energy and battery storage resources to support increased vehicle electrification. Consumer cost savings in the transition to electric vehicles similarly increases induced jobs in the economy. While electric vehicles require less maintenance and have fewer parts, the reduction in auto repair jobs is more than offset by gains in economy-wide induced jobs and increased power sector jobs.
2035 2.0 THE REPORT | iv
3.0
2.5
2.0
1.5
1.0
0.5
0.0
-0.5
-1.0
MIL
LIO
NS
OF
JO
B-Y
EA
RS
DIRECT JOBS INDIRECT JOBS INDUCED JOBS TOTAL JOBS
NET JOBS IN 2035 — DRIVE CLEAN SCENARIO
Gains Losses Net
FIGURE ES-4
Net jobs in 2035, DRIVE Clean scenario compared to the No New Policy scenario.
EV PERFORMANCE AND AVAILABILITY CAN MEET THE NEEDS OF AMERICAN DRIVERS
American drivers have become accustomed to the vehicle performance and availability standards established by gasoline- and diesel-powered vehicles for vehicle range, fueling time, diversity of vehicle models, and—for commercial vehicles—weight. EVs have been improving rapidly across all these dimensions, and our analysis suggests they will not present significant barriers to the accelerated EV deployment envisioned in the DRIVE Clean scenario.
REQUIRED CHARGING INFRASTRUCTURE CAN BE BUILT COST-EFFECTIVELY TO SERVE THE ENVISIONED EV FLEET
To enable the DRIVE Clean scenario, U.S. EV-charging infrastructure must provide drivers with at least as much convenience as provided by existing gasoline and diesel fueling stations. We find that the pace of the required infrastructure scaleup is challenging but achievable, and the costs are modest compared with the benefits of widespread EV deployment. Each year over the next 30 years, the United States must install an average of approximately 270,000 public chargepoints for LDVs and 35,000 MDV/HDT chargepoints. The rate of installation
2035 2.0 THE REPORT | v
is comparable to historical rates achieved in other rapidly electrifying regions. The cumulative investment in public charging infrastructure ($6.5 billion per year) makes up a small portion of EV TCO in the DRIVE Clean scenario (Figure ES-1).
GLOBAL AND DOMESTIC SUPPLY CHAINS CAN SATISFY ACCELERATED EV AND BATTERY PRODUCTION, LED BY U.S. COMPANIES
With strong policy support, domestic and global EV manufacturing capacity can sufficiently scale to meet the DRIVE Clean goals. In addition, accelerated U.S. EV deployment will present opportunities for U.S. manufacturing leadership in an increasingly competitive global context. The DRIVE Clean scenario requires that annual U.S. electric LDV sales grow from 331,000 to over 15 million by 2030. Domestic manufacturing of these vehicles is beginning to ramp up, with significant investments from manufacturers such as Ford and General Motors. At the same time, more than 125 zero-emission MDVs and HDTs are in production or development in the United States. Similarly, the DRIVE Clean scenario will depend on at least 1,300 GWh of battery capacity per year by 2035. While current global lithium-ion battery demand is about 300 GWh, global battery manufacturing capacity is expected to exceed 2,000 GWh by 2028. Strong policy will be necessary to further develop domestic vehicle and battery manufacturing capacity, encourage raw material procurement and cost-competitive battery recycling, and help the U.S. compete globally.
ELECTRIC GRID IMPACTS OF THE ENVISIONED EV FLEET ARE MANAGEABLE
Even with additional electric loads in the DRIVE Clean scenario, the 90% clean grid is dependable without coal plants or new natural gas plants by 2035. In addition, the resulting wholesale electricity cost is lower than today’s costs. Under the DRIVE Clean scenario, all existing coal plants are retired by 2030, no new fossil fuel plants are built, and electricity demand growth from increased electrification averages about 2% per year, a growth rate slower than that achieved in 1975-2005 (Figure ES-5). To meet this demand, the United States must install on average 105 GW of new wind and solar and 30 GW of new battery storage each year—nearly four times the current deployment rate in the U.S., but lower than that achieved by China in 2020 (Figure ES-6).
2035 2.0 THE REPORT | vi
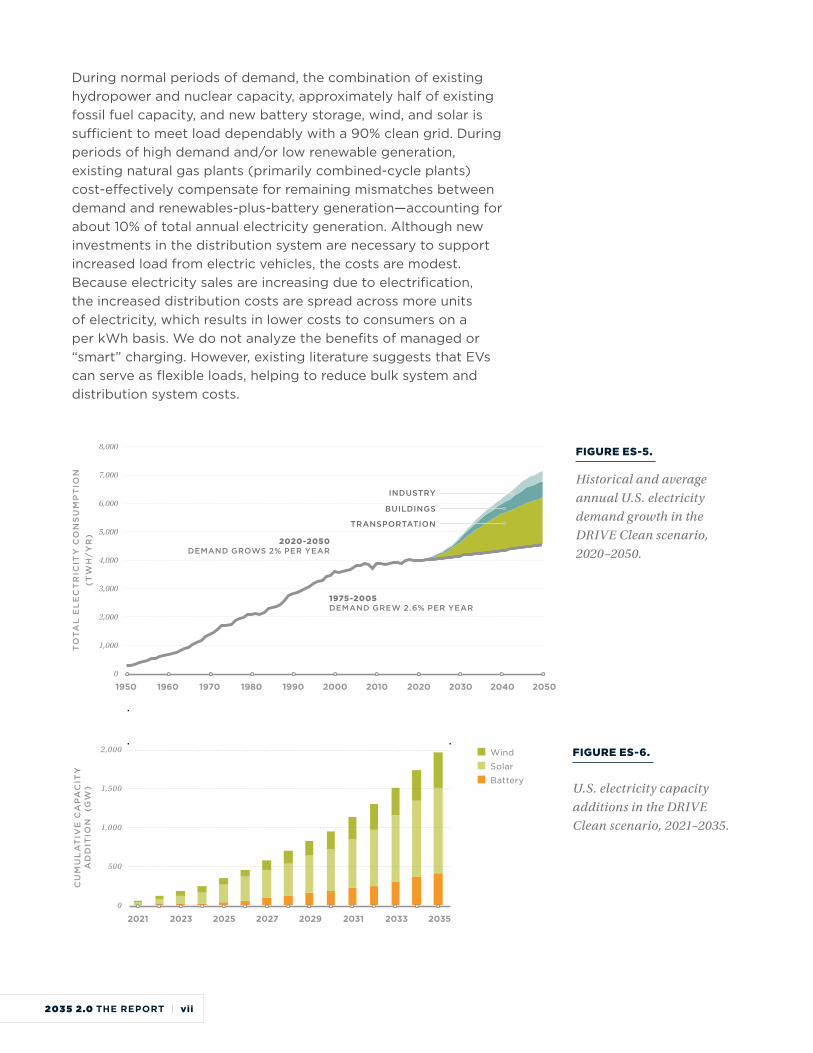
During normal periods of demand, the combination of existing hydropower and nuclear capacity, approximately half of existing fossil fuel capacity, and new battery storage, wind, and solar is sufficient to meet load dependably with a 90% clean grid. During periods of high demand and/or low renewable generation, existing natural gas plants (primarily combined-cycle plants) cost-effectively compensate for remaining mismatches between demand and renewables-plus-battery generation—accounting for about 10% of total annual electricity generation. Although new investments in the distribution system are necessary to support increased load from electric vehicles, the costs are modest. Because electricity sales are increasing due to electrification, the increased distribution costs are spread across more units of electricity, which results in lower costs to consumers on a per kWh basis. We do not analyze the benefits of managed or “smart” charging. However, existing literature suggests that EVs can serve as flexible loads, helping to reduce bulk system and distribution system costs.
8,000
7,000
6,000
5,000
4,000
3,000
2,000
1,000
0
TO
TA
L E
LE
CT
RIC
ITY
CO
NS
UM
PT
ION
(T
WH
/Y
R)
1950 1960 1970 1980 1990 2000 2010 2020 2030 2040 2050
1975-2005 DEMAND GREW 2.6% PER YEAR
2020-2050 DEMAND GROWS 2% PER YEAR
INDUSTRY
BUILDINGS
TRANSPORTATION
FIGURE ES-5.
Historical and average annual U.S. electricity demand growth in the DRIVE Clean scenario, 2020–2050.
FIGURE ES-6.
U.S. electricity capacity additions in the DRIVE Clean scenario, 2021–2035.
2,000
1,500
1,000
500
0
CU
MU
LA
TIV
E C
AP
AC
ITY
A
DD
ITIO
N
(GW
)
2021 2023 2025 2027 2029 2031 2033 2035
Wind
Solar
Battery
2035 2.0 THE REPORT | vii
ACCELERATING TRANSPORTATION ELECTRIFICATION: THE CRITICAL ROLE OF A POLICY ECOSYSTEM
Plummeting battery costs, breakthroughs in battery technology, and dramatic declines in clean energy costs have accelerated the timeline for cost-effective transportation decarbonization. Significant barriers remain, but the total consumer cost savings and societal benefits of accelerated vehicle electrification are staggering. Achieving the goal of the DRIVE Clean scenario puts the United States on a 1.5°C pathway for economy-wide decarbonization while yielding substantial human health and environmental benefits and saving consumers $2.7 trillion in vehicle spending—approximately $1,000 in average household savings each year—over the next 30 years. If light-duty vehicle electrification is delayed to 2035 in accordance with many currently proposed transportation electrification goals, we leave significant cost savings on the table. When it comes to electrifying transportation, sooner is definitely better.
New policies and regulations will be needed to achieve the accelerated 100% electric vehicle sales goal. A companion report from Energy Innovation details the policy and regulatory changes that could enable the electric vehicle and charging-infrastructure deployment necessary to equitably decarbonize ground transportation.
2035 2.0 THE REPORT | viii

1. Executive Summary i
2. Introduction 1
3. Scenarios, Methods, and Data 6
4. Key Findings 15
4.1 Consumer Savings from EV Ownership 15 Start Soon and Grow Rapidly
4.2 Accelerating EV Adoption Saves 150,000 18 Lives, Avoids $1.3 Trillion in Health and Environmental Damages Through 2050
4.3 Accelerating EV Sales Goals Supports 21 2 Million Jobs in 2035
4.4 EV Performance and Availability Can 24 Meet the Needs of American Drivers
4.5 Required Charging Infrastructure Can 29 Be Built Cost-Effectively to Serve the Envisioned EV Fleet
4.6 Global and Domestic Supply Chains 34 Can Satisfy Accelerated EV and Battery Production, Led by U.S. Companies
4.7 Electric Grid Impacts of the Envisioned 38 EV Fleet Are Manageable
5. Conclusions, Caveats, and Future Work 47
TABLE OF CONENTS
NAMES AND AFFILIATIONS OF AUTHORS AND TECHNICAL REVIEW COMMITTEE
Amol Phadke#*1, Nikit Abhyankar#*1, Jessica Kersey2, Taylor McNair*4,Umed Paliwal1, David Wooley*1, Olivia Ashmoore5, Robbie Orvis5, Michael O’Boyle5, Ric O’Connell4, Utkarsha Agwan3, Priyanka Mohanty1, Priya Sreedharan4, Deepak Rajagopal6
#Co-lead Authors; *Corresponding Authors; 1Goldman School of Public Policy, University of California, Berkeley; 2Energy and Resources Group, University of California, Berkeley; 3Electrical Engineering and Computer Sciences, University of California, Berkeley; 4GridLab; 5Energy Innovation; 6Institute of the Environment and Sustainability, University of California, Los Angeles
Below are the members of the Technical Review Committee (TRC). The TRC provided input and guidance related to study design and evaluation, but the contents and conclusions of the report, including any errors and omissions, are the sole responsibility of the authors. TRC member affiliations in no way imply that those organizations support or endorse this work in any way.
Dan Sperling Institute for Transportation Studies, University of California, Davis
Gil Tal Institute for Transportation Studies, University of California, Davis
Roland Hwang Natural Resources Defense Council
Mike Backstrom Southern California Edison
Leslie Aguayo Greenlining Institute
Will Barrett American Lung Association
Anand Gopal Hewlett Foundation
Bill Van Amberg CALSTART
Tim Lipman Institute for Transportation Studies, University of California, Berkeley
David Farnsworth Regulatory Assistance Project
Peter Huether American Council for an Energy-Efficient Economy
Alexa Diaz Forth Mobility
Zoe Lipman Blue Green Alliance
ACKNOWLEDGEMENTS
The following people provided invaluable technical support, input, and assistance in making this report possible.
Chelsea Eakin, Josh Goldman, Gabrielle Levy, Jamie Schoshinski, Elisabeth Soto, Courtney St. John, Phoebe Sweet, Climate Nexus
Sara Baldwin, Todd Fincannon, Silvio Marcacci, Amanda Myers, Sarah Spengeman, Energy Innovation
Jarett Zuboy, independent contractor
Simone Cobb, Goldman School of Public Policy, University of California Berkeley
Chani Wiggins, Winn Strategies
Annie Dore, BeeSpring Designs
Appendices, supporting reports, and
data visualizations can be found at
2035report.com.
ACKNOWLEDGMENTS
ABOUT GRIDLAB
GridLab is an innovative non-profit that provides technical grid expertise to enhance policy decision-making and to ensure a rapid transition to a reliable, cost-effective, and low-carbon future.
ABOUT ENERGY INNOVATION
Energy Innovation is a nonpartisan energy and environmental policy firm, delivering high-quality research and original analysis to policymakers to help them make informed choices on energy policy. Energy Innovation’s mission is accelerating clean energy by supporting the policies that most effectively reduce greenhouse gas emissions, working closely with policymakers, other experts, NGOs, the media, and the private sector.
ABOUT UNIVERSITY OF CALIFORNIA BERKELEY GOLDMAN SCHOOL OF PUBLIC POLICY
The Center for Environmental Public Policy, housed at UC Berkeley’s Goldman School of Public Policy, takes an integrated approach to solving environmental problems and supports the creation and implementation of public policies based on exacting analytical standards that carefully define problems and match them with the most impactful solutions.
Funding for this report was provided by ClimateWorks Foundation and others.
Global carbon emissions must be halved by 2030 to limit global warming to 1.5°C and avoid the most catastrophic climate impacts. Based on recent analysis by Energy Innovation, zero-emission vehicles must constitute 100% of light-duty vehicle (LDV) sales no later than 2035 to align with a 1.5°C pathway and a safe climate future (Orvis 2021). However, decarbonizing the U.S. transportation sector—the country’s largest carbon emitter (Figure 1)—has proven extremely difficult to date. In fact, transportation’s greenhouse gas (GHG) emissions have increased 7% since 2010 (EPA 2021). Cars and trucks remain almost entirely dependent on gasoline and diesel fuels, and current U.S. policies are inadequate to achieve a 1.5°C pathway and reduce air pollution emissions that disproportionately impact frontline communities and communities of color.
The transition to zero-emissions vehicles presents unique challenges. Hundreds of millions of Americans own or lease vehicles for personal and business purposes. Each driver relies on a well-established network of refueling stations and maintenance facilities to keep their vehicles operational. Numerous economic, historical, cultural, political, and personal ties bind Americans to their conventional vehicles. The challenges of displacing this fossil-fuel based transportation system hinder the introduction of technologies with potential to improve vehicle performance while reducing costs and environmental impacts—threatening untenable delays in the transition to a clean transportation future.
2INTRODUCTION
2035 2.0 THE REPORT | 1

8,000
7,000
6,000
5,000
4,000
3,000
2,000
1,000
0
TO
TA
L G
HG
EM
ISS
ION
S (
MIL
LIO
N T
ON
S/
YR
)
TRANSPORTATION
ELECTRICITY GENERATION
INDUSTRY
AGRICULTURE
COMMERCIAL
RESIDENTIAL
1990 1994 1998 2002 2006 2010 2014 2018
LIGHT-DUTY VEHICLES
59%MEDIUM-DUTY VEHICLES AND
HEAVY-DUTY TRUCKS
23%
AVIATION9%
SHIPPING 2%
RAIL 2%
OTHER 5%
FIGURE 1.
Total U.S. GHG emissions, 1990–2018 (left), and total U.S. transportation GHG emissions, 2018 (right). The transportation sector is responsible for nearly 30% of total economy-wide GHG emissions (EPA 2021). In 2018, on-road vehicles—the focus of this report—were responsible for nearly 84% of transportation emissions. Aviation, shipping, rail, and other transportation categories are not considered in this report (image recreated from EPA 2021).
Electric vehicles (EVs) are the key to rapidly decarbonizing the U.S. transportation sector. Although EV technology dates back to the beginning of the 1900s, recent advances in battery cost and performance, vehicle range, and recharging—along with a proliferation of EV models from automakers and a rapidly expanding network of vehicle chargers—have readied EVs to overtake gasoline and diesel vehicles as the dominant on-road technology, based on economics alone. Most importantly, the price of EV batteries declined 89% between 2010 and 2020 and is conservatively expected to fall 27% more by 2025 (Figure 2).1 In addition, EVs produce no tailpipe emissions, their high efficiency slashes GHG emissions,2 and overall emissions disappear as EVs are charged with increasingly carbon-free electricity. In short, electric vehicles are positioned to provide large individual, national, and global benefits in the near term.
1 Battery prices currently average approximately $135/kWh, with lithium ferrous-phosphate (LFP) battery packs priced as low as $100/kWh in China. Battery price projections vary widely owing to the nascent state of the industry, and experts have underpredicted the rapid decline in battery prices over the past few years.2 Battery-electric motors are four times more efficient than traditional internal combustion engines (ICEs).
2035 2.0 THE REPORT | 2
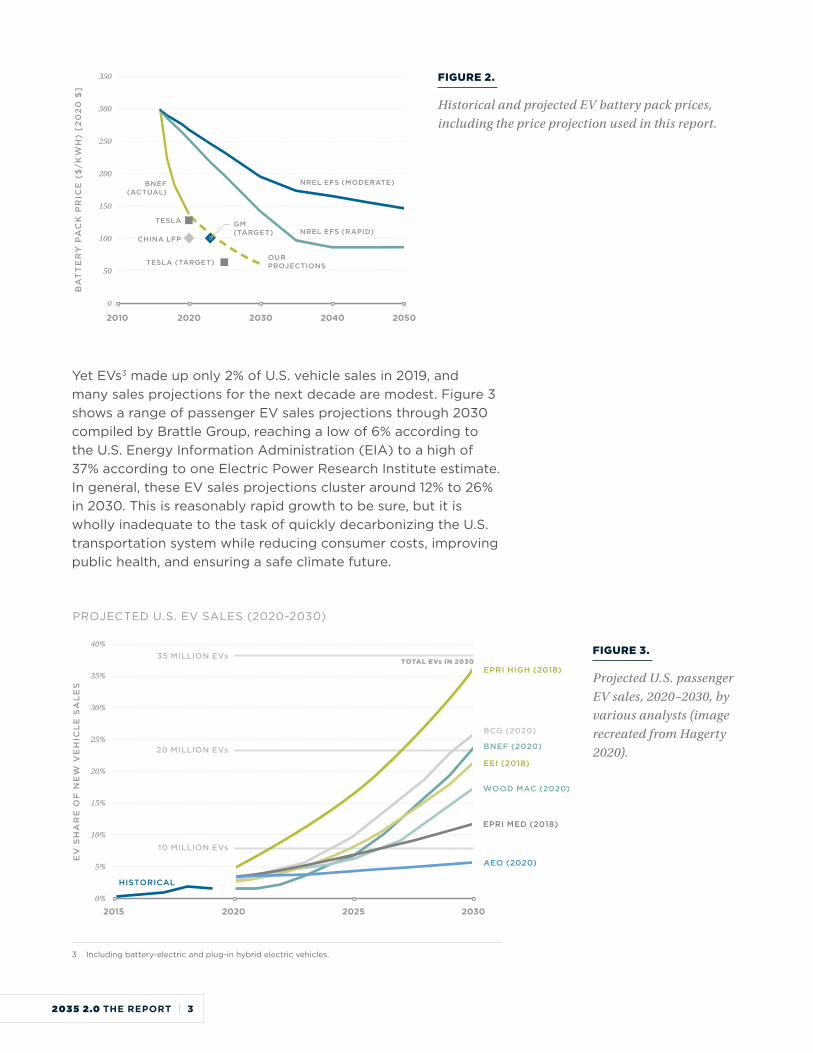
FIGURE 2.
Historical and projected EV battery pack prices, including the price projection used in this report.
350
300
250
200
150
100
50
0
BA
TT
ER
Y P
AC
K P
RIC
E (
$/K
WH
) [2
02
0 $
]
BNEF (ACTUAL)
OUR PROJECTIONSTESLA (TARGET)
CHINA LFP
GM (TARGET)
TESLA
NREL EFS (MODERATE)
NREL EFS (RAPID)
2010 2020 2030 2040 2050
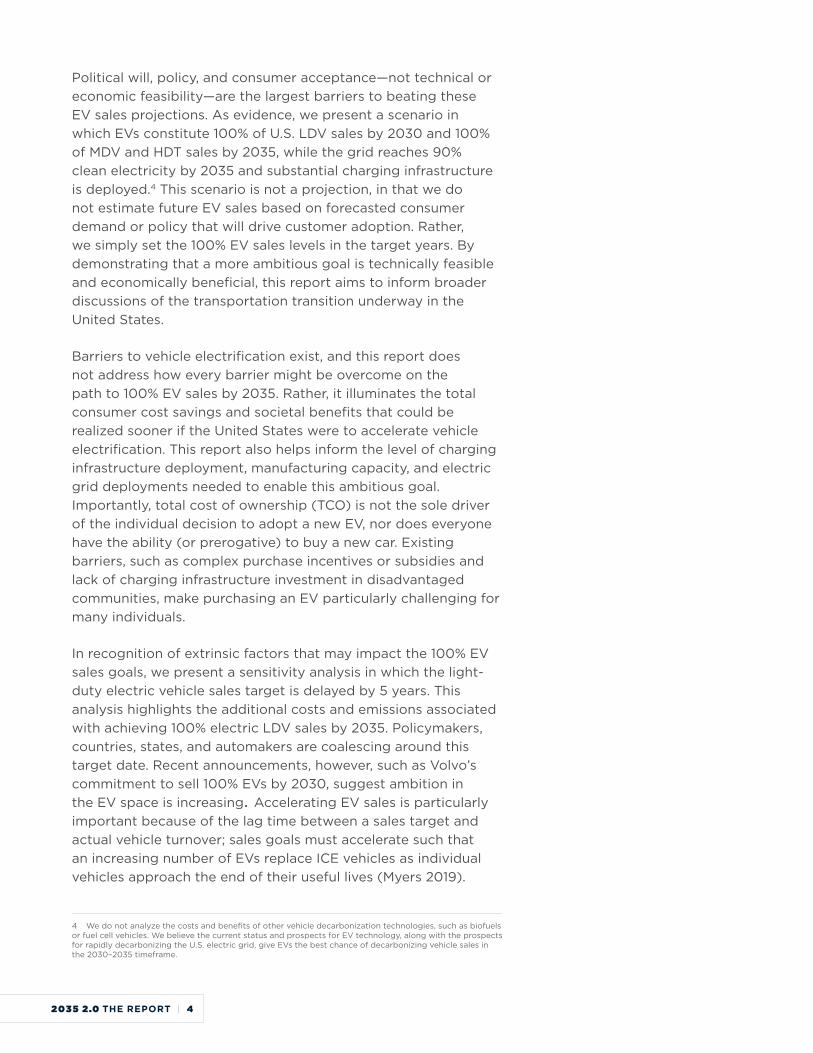
Yet EVs3 made up only 2% of U.S. vehicle sales in 2019, and many sales projections for the next decade are modest. Figure 3 shows a range of passenger EV sales projections through 2030 compiled by Brattle Group, reaching a low of 6% according to the U.S. Energy Information Administration (EIA) to a high of 37% according to one Electric Power Research Institute estimate. In general, these EV sales projections cluster around 12% to 26% in 2030. This is reasonably rapid growth to be sure, but it is wholly inadequate to the task of quickly decarbonizing the U.S. transportation system while reducing consumer costs, improving public health, and ensuring a safe climate future.
40%
35%
30%
25%
20%
15%
10%
5%
0%
2015 2020 2025 2030
PROJECTED U.S. EV SALES (2020-2030)
HISTORICAL
AEO (2020)
EPRI MED (2018)
WOOD MAC (2020)
EEI (2018)
BNEF (2020)
BCG (2020)
EPRI HIGH (2018)TOTAL EVs IN 2030
35 MILLION EVs
20 MILLION EVs
10 MILLION EVs
EV
SH
AR
E O
F N
EW
VE
HIC
LE
SA
LE
S
FIGURE 3.
Projected U.S. passenger EV sales, 2020–2030, by various analysts (image recreated from Hagerty 2020).
3 Including battery-electric and plug-in hybrid electric vehicles.
2035 2.0 THE REPORT | 3
Political will, policy, and consumer acceptance—not technical or economic feasibility—are the largest barriers to beating these EV sales projections. As evidence, we present a scenario in which EVs constitute 100% of U.S. LDV sales by 2030 and 100% of MDV and HDT sales by 2035, while the grid reaches 90% clean electricity by 2035 and substantial charging infrastructure is deployed.4 This scenario is not a projection, in that we do not estimate future EV sales based on forecasted consumer demand or policy that will drive customer adoption. Rather, we simply set the 100% EV sales levels in the target years. By demonstrating that a more ambitious goal is technically feasible and economically beneficial, this report aims to inform broader discussions of the transportation transition underway in the United States.
Barriers to vehicle electrification exist, and this report does not address how every barrier might be overcome on the path to 100% EV sales by 2035. Rather, it illuminates the total consumer cost savings and societal benefits that could be realized sooner if the United States were to accelerate vehicle electrification. This report also helps inform the level of charging infrastructure deployment, manufacturing capacity, and electric grid deployments needed to enable this ambitious goal. Importantly, total cost of ownership (TCO) is not the sole driver of the individual decision to adopt a new EV, nor does everyone have the ability (or prerogative) to buy a new car. Existing barriers, such as complex purchase incentives or subsidies and lack of charging infrastructure investment in disadvantaged communities, make purchasing an EV particularly challenging for many individuals.
In recognition of extrinsic factors that may impact the 100% EV sales goals, we present a sensitivity analysis in which the light-duty electric vehicle sales target is delayed by 5 years. This analysis highlights the additional costs and emissions associated with achieving 100% electric LDV sales by 2035. Policymakers, countries, states, and automakers are coalescing around this target date. Recent announcements, however, such as Volvo’s commitment to sell 100% EVs by 2030, suggest ambition in the EV space is increasing. Accelerating EV sales is particularly important because of the lag time between a sales target and actual vehicle turnover; sales goals must accelerate such that an increasing number of EVs replace ICE vehicles as individual vehicles approach the end of their useful lives (Myers 2019).
4 We do not analyze the costs and benefits of other vehicle decarbonization technologies, such as biofuels or fuel cell vehicles. We believe the current status and prospects for EV technology, along with the prospects for rapidly decarbonizing the U.S. electric grid, give EVs the best chance of decarbonizing vehicle sales in the 2030–2035 timeframe.
2035 2.0 THE REPORT | 4

Regardless of the 100% electrification target date, new policies and regulations will be needed to achieve the goal. A companion report from Energy Innovation details the policy and regulatory changes that could enable the EV and charging-infrastructure deployment necessary to equitably decarbonize ground transportation (Baldwin et al. 2021). In the remainder of this report, a brief discussion of methods, data, and scenarios is followed by a summary of key findings. The appendix provides more information on the analysis and findings.
2035 2.0 THE REPORT | 5
This report uses the latest available data to demonstrate the feasibility and impacts of achieving 100% EV sales for all U.S. ground transportation by 2030 (light-duty vehicles) and 2035 (medium- and heavy-duty vehicles). We also assume the electricity grid is operating on 90% clean (carbon-free) electricity by 2035. We run a supporting power-sector analysis to assess the overall impact of both goals on the dependability and functionality of the electric grid.
SCENARIOS
Our analysis evaluates two scenarios:
No New Policy, a business-as-usual scenario in which fleet electrification proceeds as determined by current market forces without assistance from new state or federal policy.
This scenario assumes the continuation of existing (2020) state and federal policies and assumes the extant barriers to EV adoption persist, such as underdeveloped charging infrastructure, higher upfront EV price premiums, no widespread adoption of EV-specific electricity rate designs, low levels of consumer awareness and acceptance related to EVs, few policies aimed at addressing equitable access to EVs, and poor accounting for the societal advantages of EVs over conventional vehicles. In this scenario, EVs constitute about 45% of new LDV sales, 38% of new medium-duty vehicle (MDV) sales, and 12% of new heavy-duty truck (HDT) sales in 2035. The scenario is based on projections from Bloomberg New Energy Finance (BNEF), which suggest that—absent policy intervention—ICE vehicles will constitute 46% of the total on-road vehicle population by 2050 (McKerracher 2021). In this scenario, the electric grid decarbonizes based on current state and federal power-sector policy. This business-as-usual approach closely mirrors the projections of the National Renewable Energy Laboratory’s (NREL’s) standard scenarios, in which the clean electricity (carbon-free) share reaches 47% by 2035 (Cole 2020).
3SCENARIOS, METHODS, AND DATA
2035 2.0 THE REPORT | 6
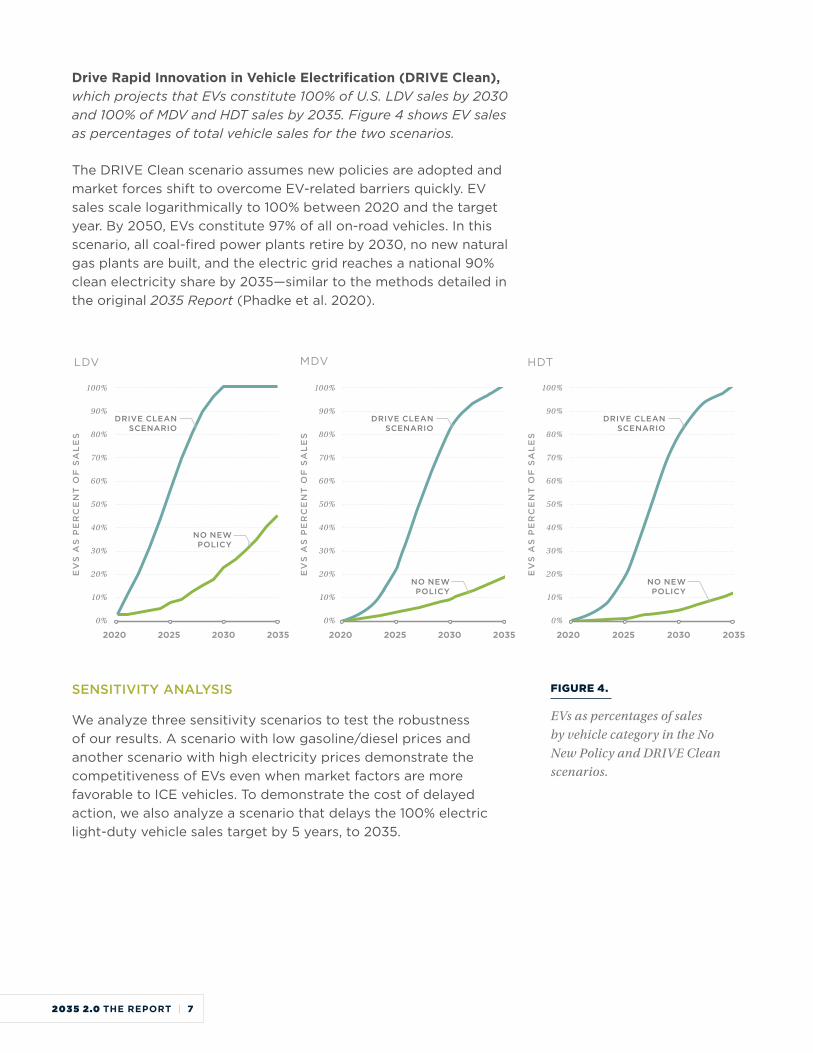
Drive Rapid Innovation in Vehicle Electrification (DRIVE Clean), which projects that EVs constitute 100% of U.S. LDV sales by 2030 and 100% of MDV and HDT sales by 2035. Figure 4 shows EV sales as percentages of total vehicle sales for the two scenarios.
The DRIVE Clean scenario assumes new policies are adopted and market forces shift to overcome EV-related barriers quickly. EV sales scale logarithmically to 100% between 2020 and the target year. By 2050, EVs constitute 97% of all on-road vehicles. In this scenario, all coal-fired power plants retire by 2030, no new natural gas plants are built, and the electric grid reaches a national 90% clean electricity share by 2035—similar to the methods detailed in the original 2035 Report (Phadke et al. 2020).
100%
90%
80%
70%
60%
50%
40%
30%
20%
10%
0%
100%
90%
80%
70%
60%
50%
40%
30%
20%
10%
0%
100%
90%
80%
70%
60%
50%
40%
30%
20%
10%
0%
EV
S A
S P
ER
CE
NT
OF
SA
LE
S
EV
S A
S P
ER
CE
NT
OF
SA
LE
S
EV
S A
S P
ER
CE
NT
OF
SA
LE
S
DRIVE CLEAN SCENARIO
DRIVE CLEAN SCENARIO
LDV MDV HDT
NO NEW POLICY
NO NEW POLICY
2020 2025 2030 20352020 2025 2030 20352020 2025 2030 2035
DRIVE CLEAN SCENARIO
NO NEW POLICY
SENSITIVITY ANALYSIS
We analyze three sensitivity scenarios to test the robustness of our results. A scenario with low gasoline/diesel prices and another scenario with high electricity prices demonstrate the competitiveness of EVs even when market factors are more favorable to ICE vehicles. To demonstrate the cost of delayed action, we also analyze a scenario that delays the 100% electric light-duty vehicle sales target by 5 years, to 2035.
FIGURE 4.
EVs as percentages of sales by vehicle category in the No New Policy and DRIVE Clean scenarios.
2035 2.0 THE REPORT | 7
METHODS
VEHICLE COSTS AND STOCKS
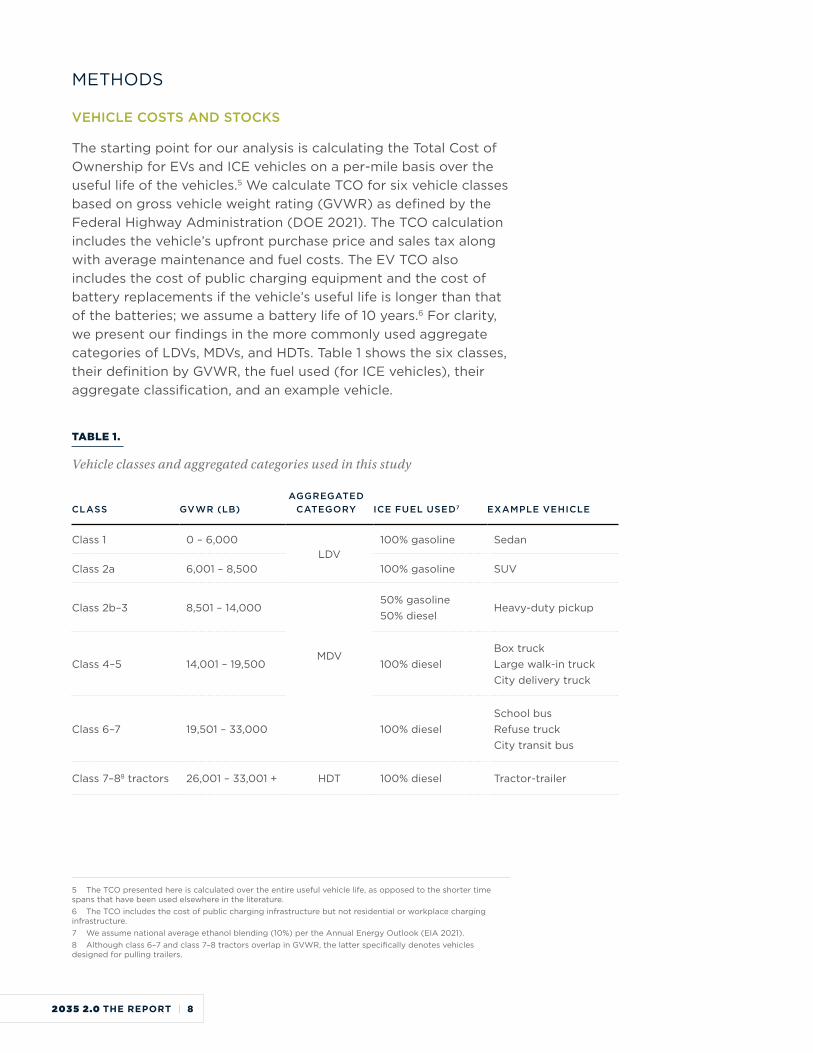
The starting point for our analysis is calculating the Total Cost of Ownership for EVs and ICE vehicles on a per-mile basis over the useful life of the vehicles.5 We calculate TCO for six vehicle classes based on gross vehicle weight rating (GVWR) as defined by the Federal Highway Administration (DOE 2021). The TCO calculation includes the vehicle’s upfront purchase price and sales tax along with average maintenance and fuel costs. The EV TCO also includes the cost of public charging equipment and the cost of battery replacements if the vehicle’s useful life is longer than that of the batteries; we assume a battery life of 10 years.6 For clarity, we present our findings in the more commonly used aggregate categories of LDVs, MDVs, and HDTs. Table 1 shows the six classes, their definition by GVWR, the fuel used (for ICE vehicles), their aggregate classification, and an example vehicle.
TABLE 1.
Vehicle classes and aggregated categories used in this study
CLASS GVWR (LB)AGGREGATED
CATEGORY ICE FUEL USED7 EXAMPLE VEHICLE
Class 1 0 – 6,000LDV
100% gasoline Sedan
Class 2a 6,001 – 8,500 100% gasoline SUV
Class 2b–3 8,501 – 14,000
MDV
50% gasoline50% diesel
Heavy-duty pickup
Class 4–5 14,001 – 19,500 100% dieselBox truckLarge walk-in truckCity delivery truck
Class 6–7 19,501 – 33,000 100% dieselSchool busRefuse truckCity transit bus
Class 7–88 tractors 26,001 – 33,001 + HDT 100% diesel Tractor-trailer
5 The TCO presented here is calculated over the entire useful vehicle life, as opposed to the shorter time spans that have been used elsewhere in the literature.6 The TCO includes the cost of public charging infrastructure but not residential or workplace charging infrastructure. 7 We assume national average ethanol blending (10%) per the Annual Energy Outlook (EIA 2021). 8 Although class 6–7 and class 7–8 tractors overlap in GVWR, the latter specifically denotes vehicles designed for pulling trailers.
2035 2.0 THE REPORT | 8
To model the dynamics of the nationwide vehicle fleet once EV sales targets are introduced, we use a custom vehicle stock turnover model. The stock model estimates ICE vehicles and EVs retired per year using a survival function modeled separately by vehicle class. We estimate the total number of vehicles sold per year using historical sales data from the Federal Reserve Bank of St. Louis (FRED 2021). Annual vehicle sales are allocated between ICE vehicles and EVs based on the EV sales target for that year. These nationwide estimates are downscaled to the state level based on scalar factors provided by the NREL Electrification Futures Study (Murphy et al. 2021). Combining the vehicle-level TCO and the vehicle populations from the stock model, we arrive at total fleet-level costs per year.
CHARGING INFRASTRUCTURE REQUIREMENTS
To facilitate analysis of light-duty vehicle charging infrastructure requirements and impacts to the power sector, we use NREL’s Electric Vehicle Infrastructure Projection Tool (EVI-Pro) to estimate an annual (8,760-hour) EV charging load profile by state from 2020 through 2050. EVI-Pro provides a load profile for the following charging locations and power levels: residential Level 1 (L1), residential Level 2 (L2), workplace L1, workplace L2, public L2, and public direct-current fast-charging (DCFC). In line with the current state of the market, where advancements in charging technology have produced higher-capacity chargers at lower cost, we assume a phaseout of L1 chargers at work and home by 2025.
To estimate the number of public charging ports necessary to accommodate increasing EV penetrations, we first identify the maximum demand estimated by EVI-Pro in each year for residential, workplace, and public charging. The demand in each of these three categories is split nearly evenly among four charger types: 1.4-kW L1, 11-kW L2, 50-kW DCFC, and 100-kW DCFC. We then estimate the total number of chargepoints necessary to meet the peak charging demand, assuming a peak demand coincident utilization factor of 50%–90%, depending on charger category. Because the number of chargepoints per charging station varies widely depending on station design and location, we present our findings in terms of total chargepoints.
We assume that the HDT charging infrastructure will be installed at existing highway truck stops. We estimate the overall charging infrastructure requirement by modeling every existing U.S. highway truck stop and optimally siting 125-, 350-, and 1,000-kW chargepoints such that every long-haul freight mile a truck will travel is covered. The MDV charging infrastructure (50-, 125-, and
2035 2.0 THE REPORT | 9
350-kW chargepoints) is assumed to be built at warehouses and parking lots such that all MDV miles traveled in any given day could be reliably charged. MDVs are also assumed to have access to the LDV and HDT charging infrastructure. The MDV and HDT traffic flows and miles traveled are taken from FHWA (2020).
ESTIMATING LOAD GROWTH
We estimate the hourly load shapes for LDV charging load using EVI-Pro. For MDVs and HDTs, we use hourly charging load shapes from NREL’s Electrification Futures Study and scale them by the state-level vehicle stock and EV efficiencies from our scenarios.
To better understand the overall impact on the grid, we account for the increased trend toward electrification of buildings (residential and commercial) and industry that may occur in the United States between now and 2050. We use the high-electrification case (with moderate technology improvement) in NREL’s Electrification Futures Study (Murphy 2021). In particular, we use state-level hourly load profiles by sector and end use, adjusting for distribution losses, as defined in the Electrification Futures Study.
POWER SECTOR MODELING
We perform power sector modeling using state-of-the-art models, based on the analysis conducted in the 2035 Report, including NREL’s Regional Energy Deployment System (ReEDS) capacity-expansion model and Energy Exemplar’s PLEXOS electricity production-cost model, in conjunction with publicly available generation and transmission datasets. Forecasts of renewable energy and battery cost reductions are based on NREL’s Annual Technology Baseline 2019 (NREL 2019). We use these data and methods to analyze a national 90% clean electricity share by 2035, accounting for load growth from rapid transportation electrification as well as the electrification of industry and buildings.9
ENVIRONMENTAL AND PUBLIC HEALTH IMPACTS
We rely on the peer-reviewed literature to estimate the value of environmental and public health impacts. For the transportation sector health impacts, we use national average mortality factors of vehicle miles traveled from Thakrar et al. (2020) to estimate total premature deaths due to vehicular criteria air pollutant emissions, specifically from primary and secondary
9 For details, see the 2035 Report (Phadke et al. 2020).
2035 2.0 THE REPORT | 10
particulate matter (PM2.5), in each year.10 For the power sector health impacts, we use the same methodology used in the 2035 Report. We estimate the change in yearly sulfur dioxide (SO2) and nitrogen oxide (NOx) emissions (which contribute towards secondary PM2.5 formation in the atmosphere) in each of the 134 grid regions based on the ReEDS output.11 We then apply state-level mortality factors from Thind et al. (2019) to estimate total premature deaths due to SO2 and NOx emissions in each state.
We estimate the economic benefits of avoided CO2 and PM2.5 emissions using a methodology and values consistent with the 2035 Report. We multiply the value of statistical life from Holland et al. (2020), $9.6 million (2020 real), with the avoided premature deaths due to primary and secondary PM2.5 emissions reductions. The economic benefit of avoided CO2 emissions is estimated using a social cost of carbon derived from Baker et al. (2019), Ricke et al. (2018), and Caldeira et al. (2016), which is $49.6/MT in 2020, increasing at 3% per year ($66.1/MT by 2030 and $76.6/MT by 2035). We multiply the social cost of carbon by net carbon dioxide (CO2) emissions reductions from the transportation and power sectors.
EMPLOYMENT IMPACTS
Finally, we utilize Energy Innovation’s Energy Policy Simulator (EPS) to evaluate the employment impacts of the DRIVE Clean scenario relative to the No New Policy scenario. EPS is an open-source system dynamics computer model developed to inform policymakers and regulators about which climate and energy policies will reduce greenhouse gas emissions most effectively and with the most beneficial financial and public health outcomes.12 The EPS used the model outputs from the No New Policy and DRIVE Clean scenarios to calculate changes in jobs. The jobs module in the EPS is an input-output macroeconomic model which allocates changes in output resulting from policies to individual industries, sorted by International Standard Industrial Classification (ISIC) codes (United Nations 2008). Full documentation of the mechanics of EPS’s jobs module is available online (Energy Innovation 2021).
10 PM2.5 includes diesel particulate matter (DPM). DPM is a particularly harmful pollutant (also known as soot or black carbon) composed of carbon and organic compounds, many of which are known carcinogens. Exposure to DPM disproportionately impacts low-income communities and communities of color and is often concentrated near highways or ports (CARB 2021). 11 Owing to the limitations of ReEDs, our analysis does not include an estimate of primary PM2.5 power sector emissions. This means that the result of our analysis is a conservative estimate of health impacts, particularly when going from a No New Policy scenario that includes more coal and gas generation, to a clean case that is dominated by renewables. 12 See generally, us.energypolicy.solutions.
2035 2.0 THE REPORT | 11
DATA
Our key cost inputs are divided into two categories of assumptions: power-sector assumptions and transportation-sector assumptions. For the power sector, we rely on assumptions in the 2035 Report 90% Clean Case (Phadke et al. 2020). For the transportation sector, key cost inputs include battery prices, upfront EV and ICE vehicle prices including sales tax, gasoline and diesel prices, electricity prices for charging, and vehicle maintenance costs. Upfront prices for all classes of EVs are determined by adding up the costs of batteries, electric drivetrains, vehicle assembly, and indirect costs, and then harmonizing with the sales prices of current or proposed EV models. Upfront EV prices decline through the early 2030s, in accordance with projected declines in battery prices, and then upfront prices stabilize through 2050. Because ICEs are an established technology, we assume upfront ICE vehicle prices remain stable throughout the study period. We assume a sales tax commensurate with recent International Council on Clean Transportation (ICCT) analyses of 8% for ICE vehicles and EVs (Yang 2016). The 2020 upfront vehicle prices for ICE MDVs and HDTs are in line with a 2019 California Air Resources Board (CARB) report (CARB 2019).
Electricity prices follow the EIA 2020 Annual Energy Outlook forecasts and assume national average residential, commercial, and industrial electricity prices for LDVs, MDVs, and HDTs, respectively (EIA 2021).13 This assumption holds despite the
13 Rate designs for different vehicle types will vary from average rates, particularly if demand charges are relied on heavily in fast-charging applications. Although nuanced pricing is outside the scope of this analysis, the companion policy report from Energy Innovation addresses rate design and makes recommendations to avoid unduly high costs of charging that would conflict with this analysis.
2035 2.0 THE REPORT | 12
fact that our assumed electricity mix is far cleaner than EIA’s, because we find that a 90% clean electricity system results in approximately the same cost as today’s system. The costs of gasoline and diesel similarly follow EIA projections. We source vehicle maintenance costs for medium- and heavy-duty electric and ICE vehicles from the CARB 2019 analysis (CARB 2019). Maintenance costs for LDVs are taken from a 2019 ICCT report; we assume cars correspond to class 1 vehicles and SUVs to class 2a vehicles (Lutsey 2019).
We triangulate vehicle operational characteristics, including average useful service life and vehicle-miles traveled (VMT), from several sources, including an analysis of California’s EMission FACtors (EMFAC) 2017 data (CARB 2017), Environmental Protection Agency (EPA) rulemaking analysis (Federal Register 2002), and other industry reports. Finally, we use CARB’s figures for fuel efficiency of ICE and electric MDVs and HDTs, and we use NREL’s fuel efficiency projections for LDVs (Kontou 2018).
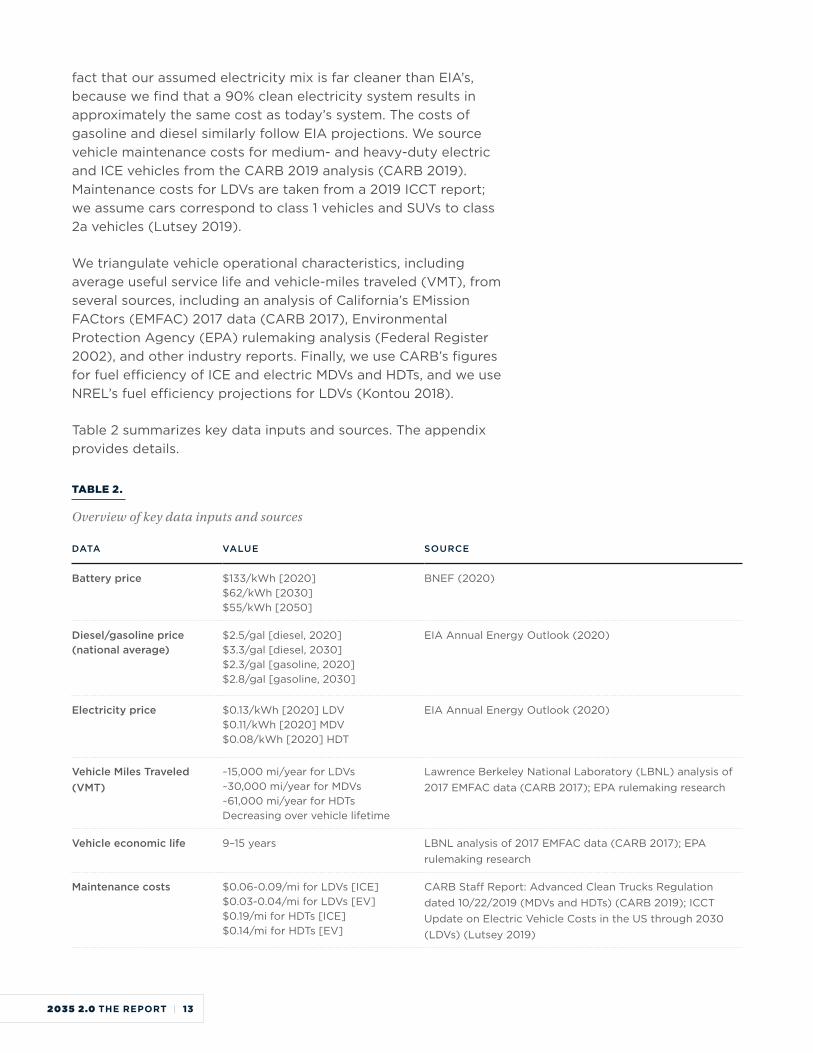
Table 2 summarizes key data inputs and sources. The appendix provides details.
TABLE 2.
Overview of key data inputs and sources
DATA VALUE SOURCE
Battery price $133/kWh [2020]$62/kWh [2030]$55/kWh [2050]
BNEF (2020)
Diesel/gasoline price (national average)
$2.5/gal [diesel, 2020]$3.3/gal [diesel, 2030]$2.3/gal [gasoline, 2020]$2.8/gal [gasoline, 2030]
EIA Annual Energy Outlook (2020)
Electricity price $0.13/kWh [2020] LDV$0.11/kWh [2020] MDV$0.08/kWh [2020] HDT
EIA Annual Energy Outlook (2020)
Vehicle Miles Traveled (VMT)
~15,000 mi/year for LDVs~30,000 mi/year for MDVs~61,000 mi/year for HDTsDecreasing over vehicle lifetime
Lawrence Berkeley National Laboratory (LBNL) analysis of 2017 EMFAC data (CARB 2017); EPA rulemaking research
Vehicle economic life 9–15 years LBNL analysis of 2017 EMFAC data (CARB 2017); EPA rulemaking research
Maintenance costs $0.06-0.09/mi for LDVs [ICE]$0.03-0.04/mi for LDVs [EV]$0.19/mi for HDTs [ICE]$0.14/mi for HDTs [EV]
CARB Staff Report: Advanced Clean Trucks Regulation dated 10/22/2019 (MDVs and HDTs) (CARB 2019); ICCT Update on Electric Vehicle Costs in the US through 2030 (LDVs) (Lutsey 2019)
2035 2.0 THE REPORT | 13
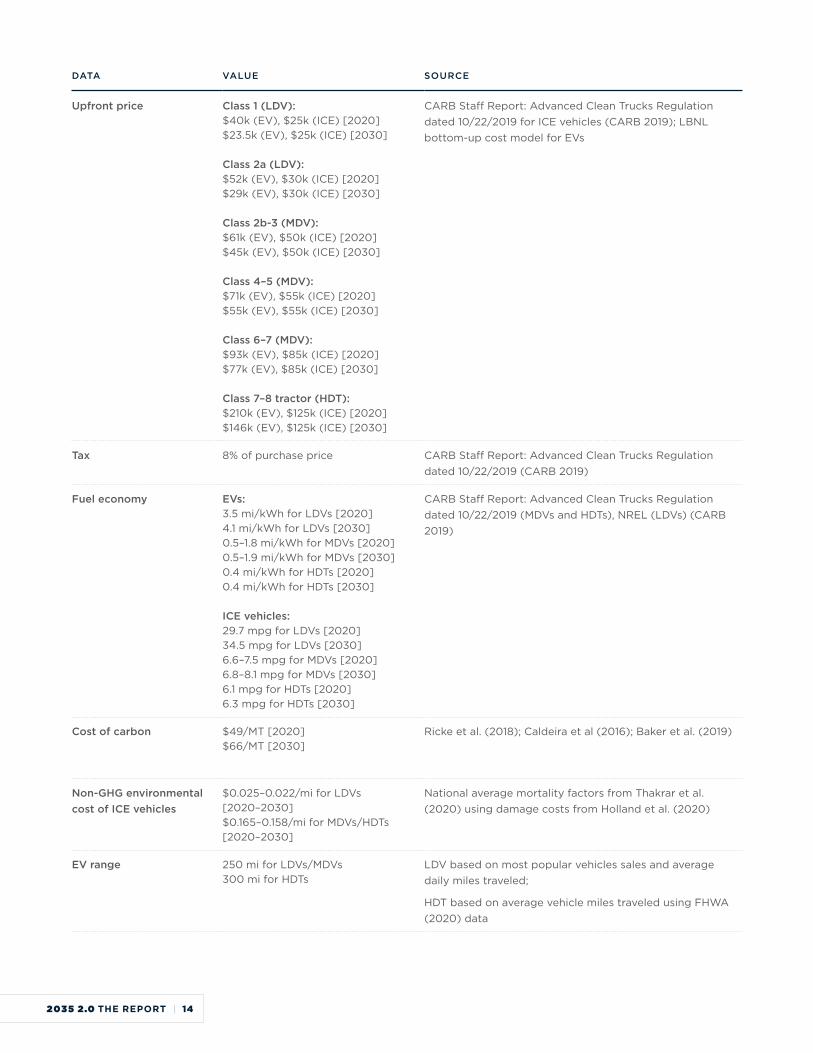
DATA VALUE SOURCE
Upfront price Class 1 (LDV):$40k (EV), $25k (ICE) [2020]$23.5k (EV), $25k (ICE) [2030]
Class 2a (LDV):$52k (EV), $30k (ICE) [2020]$29k (EV), $30k (ICE) [2030]
Class 2b-3 (MDV):$61k (EV), $50k (ICE) [2020]$45k (EV), $50k (ICE) [2030]
Class 4–5 (MDV):$71k (EV), $55k (ICE) [2020]$55k (EV), $55k (ICE) [2030]
Class 6–7 (MDV):$93k (EV), $85k (ICE) [2020]$77k (EV), $85k (ICE) [2030]
Class 7–8 tractor (HDT):$210k (EV), $125k (ICE) [2020]$146k (EV), $125k (ICE) [2030]
CARB Staff Report: Advanced Clean Trucks Regulation dated 10/22/2019 for ICE vehicles (CARB 2019); LBNL bottom-up cost model for EVs
Tax 8% of purchase price CARB Staff Report: Advanced Clean Trucks Regulation dated 10/22/2019 (CARB 2019)
Fuel economy EVs:3.5 mi/kWh for LDVs [2020]4.1 mi/kWh for LDVs [2030]0.5–1.8 mi/kWh for MDVs [2020]0.5–1.9 mi/kWh for MDVs [2030]0.4 mi/kWh for HDTs [2020]0.4 mi/kWh for HDTs [2030]
ICE vehicles:29.7 mpg for LDVs [2020]34.5 mpg for LDVs [2030]6.6–7.5 mpg for MDVs [2020]6.8–8.1 mpg for MDVs [2030]6.1 mpg for HDTs [2020]6.3 mpg for HDTs [2030]
CARB Staff Report: Advanced Clean Trucks Regulation dated 10/22/2019 (MDVs and HDTs), NREL (LDVs) (CARB 2019)
Cost of carbon $49/MT [2020]$66/MT [2030]
Ricke et al. (2018); Caldeira et al (2016); Baker et al. (2019)
Non-GHG environmental cost of ICE vehicles
$0.025–0.022/mi for LDVs [2020–2030]$0.165–0.158/mi for MDVs/HDTs [2020–2030]
National average mortality factors from Thakrar et al. (2020) using damage costs from Holland et al. (2020)
EV range 250 mi for LDVs/MDVs300 mi for HDTs
LDV based on most popular vehicles sales and average daily miles traveled;
HDT based on average vehicle miles traveled using FHWA (2020) data
2035 2.0 THE REPORT | 14
4.1 CONSUMER SAVINGS FROM EV OWNERSHIP START SOON AND GROW RAPIDLY
Historically, EV sales have been hindered by two consumer-cost disadvantages: the TCO and upfront prices of EVs have both been high in relation to ICE vehicles. Our results show, however, that proposed electric heavy-duty trucks already hold a TCO advantage today, and light-duty EVs will overtake ICE vehicles in TCO terms within 5 years. In addition, light-duty EVs will reach upfront price parity with their ICE counterparts in the mid to late 2020s (sooner for sedans than for SUVs), while electric trucks will approach upfront price parity with diesel trucks in the mid to late 2030s—eliminating the final, and most significant, consumer-cost barrier to EV ownership. Given this economic shift, accelerating EV deployment will yield considerable consumer-cost savings.
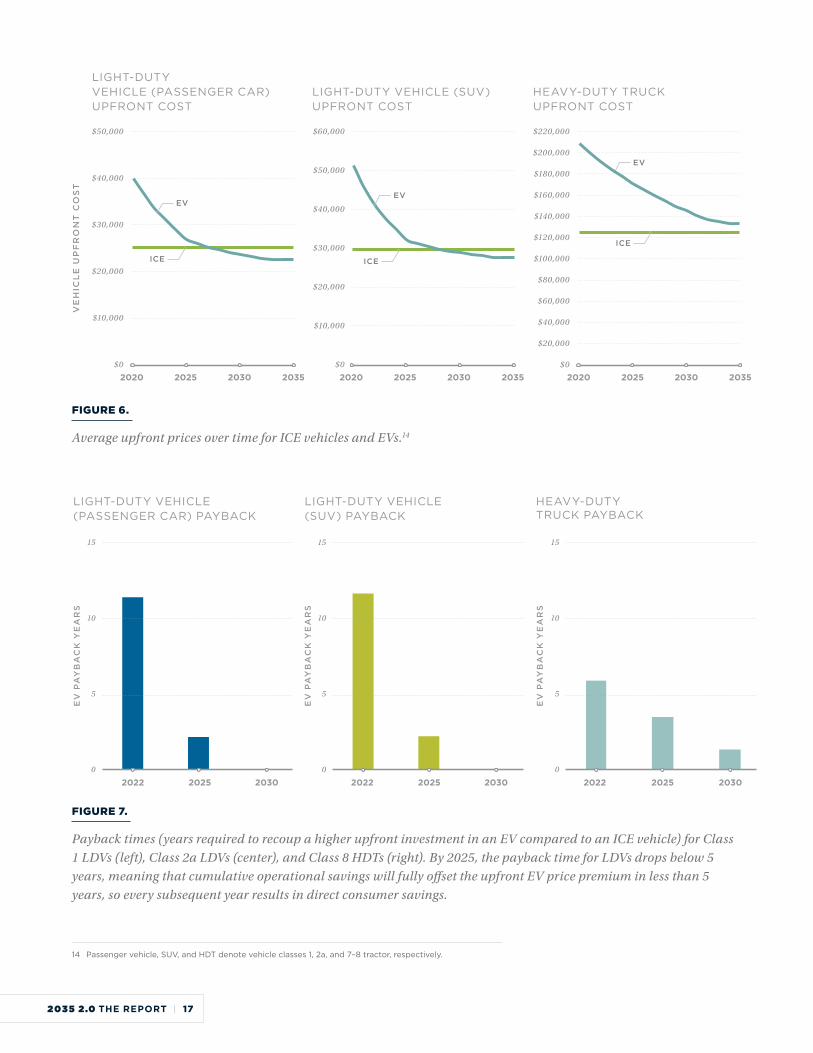
Figure 5 compares the TCO for EVs and ICE vehicles between 2020 and 2035. For light-duty vehicles, the $0.05/mi TCO disadvantage of EVs in 2020 changes to a $0.06/mi advantage by 2030. In absolute terms, in 2020 an electric passenger vehicle is $9,840 more expensive to own than the ICE equivalent. However, by 2030, an electric light-duty vehicle is nearly $12,800 less expensive. For heavy-duty trucks, an EV advantage of $0.05/mi in 2020 soars to $0.22/mi in 2030—magnified by the large number of miles traveled by this class of vehicles. In absolute terms, in 2020 this translates to a $42,800 TCO advantage of electric heavy-duty trucks, which increases to $200,000 in 2030. The TCO advantage of EVs continues to grow through 2050. For both LDVs and HDTs, EV economics improve primarily because of declining upfront vehicle prices, which are driven by declining battery prices (Figure 6). These falling upfront prices reduce the EV payback time, which is always shorter than the typical 15-year life of a vehicle (Figure 7). The TCO advantage grows more slowly between 2030 and 2050; in 2050, electric LDVs and HDTs have a $0.08/mi and $0.29/mi advantage, respectively. According to our analysis, light-duty electric vehicles are expected to achieve upfront price parity
4KEY FINDINGS
2035 2.0 THE REPORT | 15
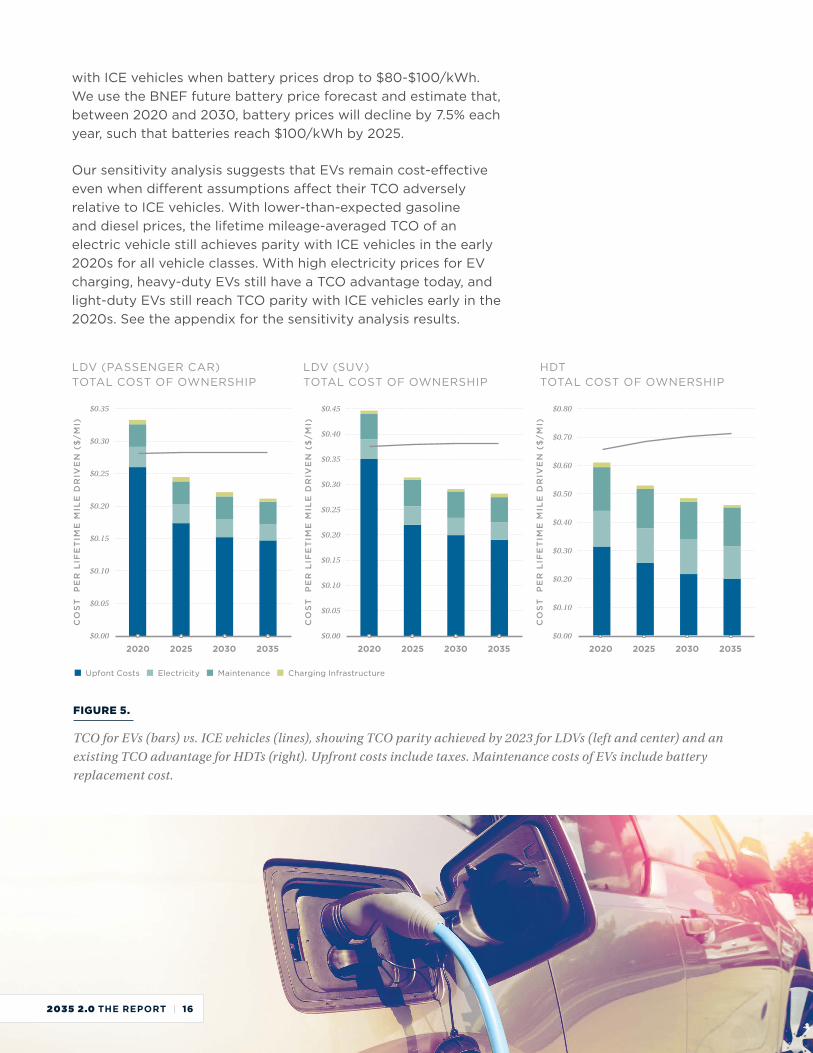
with ICE vehicles when battery prices drop to $80-$100/kWh. We use the BNEF future battery price forecast and estimate that, between 2020 and 2030, battery prices will decline by 7.5% each year, such that batteries reach $100/kWh by 2025.
Our sensitivity analysis suggests that EVs remain cost-effective even when different assumptions affect their TCO adversely relative to ICE vehicles. With lower-than-expected gasoline and diesel prices, the lifetime mileage-averaged TCO of an electric vehicle still achieves parity with ICE vehicles in the early 2020s for all vehicle classes. With high electricity prices for EV charging, heavy-duty EVs still have a TCO advantage today, and light-duty EVs still reach TCO parity with ICE vehicles early in the 2020s. See the appendix for the sensitivity analysis results.
FIGURE 5.
TCO for EVs (bars) vs. ICE vehicles (lines), showing TCO parity achieved by 2023 for LDVs (left and center) and an existing TCO advantage for HDTs (right). Upfront costs include taxes. Maintenance costs of EVs include battery replacement cost.
LDV (PASSENGER CAR) TOTAL COST OF OWNERSHIP
LDV (SUV) TOTAL COST OF OWNERSHIP
HDT TOTAL COST OF OWNERSHIP
$0.35
$0.30
$0.25
$0.20
$0.15
$0.10
$0.05
$0.00
$0.45
$0.40
$0.35
$0.30
$0.25
$0.20
$0.15
$0.10
$0.05
$0.00
$0.80
$0.70
$0.60
$0.50
$0.40
$0.30
$0.20
$0.10
$0.00
CO
ST
P
ER
LIF
ET
IME
MIL
E D
RIV
EN
($
/MI)
CO
ST
P
ER
LIF
ET
IME
MIL
E D
RIV
EN
($
/MI)
CO
ST
P
ER
LIF
ET
IME
MIL
E D
RIV
EN
($
/MI)
2020 2025 2030 2035 2020 2025 2030 2035 2020 2025 2030 2035
Upfont Costs Electricity Maintenance Charging Infrastructure
2035 2.0 THE REPORT | 16
$50,000
$40,000
$30,000
$20,000
$10,000
$0
$60,000
$50,000
$40,000
$30,000
$20,000
$10,000
$0
$220,000
$200,000
$180,000
$160,000
$140,000
$120,000
$100,000
$80,000
$60,000
$40,000
$20,000
$0
VE
HIC
LE
UP
FR
ON
T C
OS
TLIGHT-DUTY VEHICLE (PASSENGER CAR) UPFRONT COST
LIGHT-DUTY VEHICLE (SUV) UPFRONT COST
HEAVY-DUTY TRUCK UPFRONT COST
EV
EV
ICE
ICE
2020 2025 2030 2035 2020 2025 2030 2035 2020 2025 2030 2035
EV
ICE
FIGURE 6.
Average upfront prices over time for ICE vehicles and EVs.14
LIGHT-DUTY VEHICLE (PASSENGER CAR) PAYBACK
15
10
5
0
EV
PA
YB
AC
K Y
EA
RS
2022 2025 2030
LIGHT-DUTY VEHICLE (SUV) PAYBACK
15
10
5
0
EV
PA
YB
AC
K Y
EA
RS
2022 2025 2030
HEAVY-DUTY TRUCK PAYBACK
15
10
5
0
EV
PA
YB
AC
K Y
EA
RS
2022 2025 2030
14 Passenger vehicle, SUV, and HDT denote vehicle classes 1, 2a, and 7–8 tractor, respectively.
FIGURE 7.
Payback times (years required to recoup a higher upfront investment in an EV compared to an ICE vehicle) for Class 1 LDVs (left), Class 2a LDVs (center), and Class 8 HDTs (right). By 2025, the payback time for LDVs drops below 5 years, meaning that cumulative operational savings will fully offset the upfront EV price premium in less than 5 years, so every subsequent year results in direct consumer savings.
2035 2.0 THE REPORT | 17
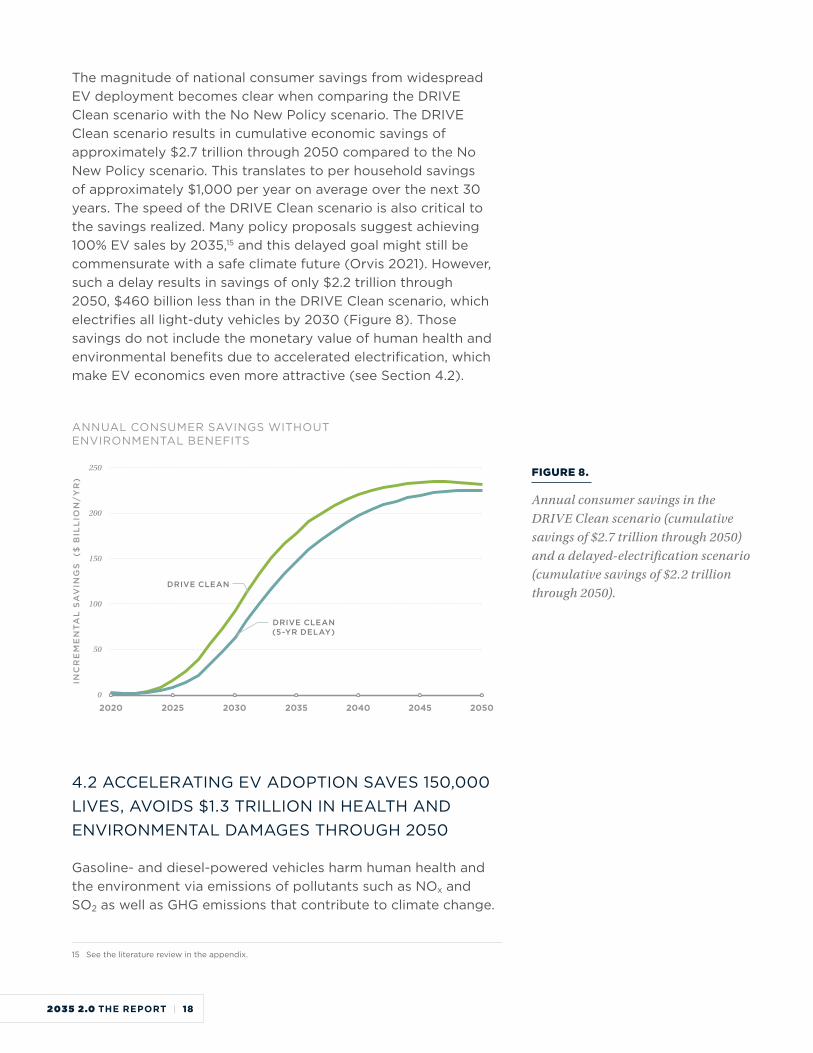
The magnitude of national consumer savings from widespread EV deployment becomes clear when comparing the DRIVE Clean scenario with the No New Policy scenario. The DRIVE Clean scenario results in cumulative economic savings of approximately $2.7 trillion through 2050 compared to the No New Policy scenario. This translates to per household savings of approximately $1,000 per year on average over the next 30 years. The speed of the DRIVE Clean scenario is also critical to the savings realized. Many policy proposals suggest achieving 100% EV sales by 2035,15 and this delayed goal might still be commensurate with a safe climate future (Orvis 2021). However, such a delay results in savings of only $2.2 trillion through 2050, $460 billion less than in the DRIVE Clean scenario, which electrifies all light-duty vehicles by 2030 (Figure 8). Those savings do not include the monetary value of human health and environmental benefits due to accelerated electrification, which make EV economics even more attractive (see Section 4.2).
FIGURE 8.
Annual consumer savings in the DRIVE Clean scenario (cumulative savings of $2.7 trillion through 2050) and a delayed-electrification scenario (cumulative savings of $2.2 trillion through 2050).
ANNUAL CONSUMER SAVINGS WITHOUT ENVIRONMENTAL BENEFITS
250
200
150
100
50
0
INC
RE
ME
NT
AL
SA
VIN
GS
($
BIL
LIO
N/
YR
)
2020 2025 2030 2035 2040 2045 2050
DRIVE CLEAN
DRIVE CLEAN (5-YR DELAY)
4.2 ACCELERATING EV ADOPTION SAVES 150,000 LIVES, AVOIDS $1.3 TRILLION IN HEALTH AND ENVIRONMENTAL DAMAGES THROUGH 2050
Gasoline- and diesel-powered vehicles harm human health and the environment via emissions of pollutants such as NOx and SO2 as well as GHG emissions that contribute to climate change.
15 See the literature review in the appendix.
2035 2.0 THE REPORT | 18
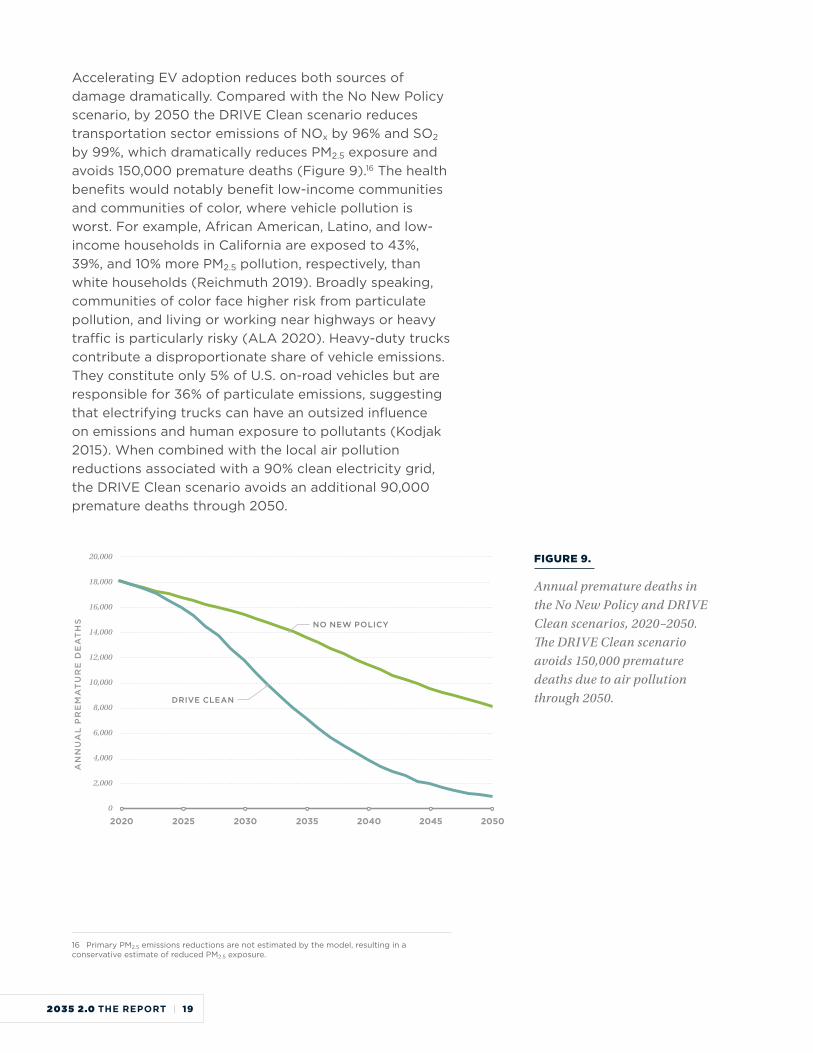
Accelerating EV adoption reduces both sources of damage dramatically. Compared with the No New Policy scenario, by 2050 the DRIVE Clean scenario reduces transportation sector emissions of NOx by 96% and SO2 by 99%, which dramatically reduces PM2.5 exposure and avoids 150,000 premature deaths (Figure 9).16 The health benefits would notably benefit low-income communities and communities of color, where vehicle pollution is worst. For example, African American, Latino, and low-income households in California are exposed to 43%, 39%, and 10% more PM2.5 pollution, respectively, than white households (Reichmuth 2019). Broadly speaking, communities of color face higher risk from particulate pollution, and living or working near highways or heavy traffic is particularly risky (ALA 2020). Heavy-duty trucks contribute a disproportionate share of vehicle emissions. They constitute only 5% of U.S. on-road vehicles but are responsible for 36% of particulate emissions, suggesting that electrifying trucks can have an outsized influence on emissions and human exposure to pollutants (Kodjak 2015). When combined with the local air pollution reductions associated with a 90% clean electricity grid, the DRIVE Clean scenario avoids an additional 90,000 premature deaths through 2050.
FIGURE 9.
Annual premature deaths in the No New Policy and DRIVE Clean scenarios, 2020–2050. The DRIVE Clean scenario avoids 150,000 premature deaths due to air pollution through 2050.
20,000
18,000
16,000
14,000
12,000
10,000
8,000
6,000
4,000
2,000
0
AN
NU
AL
PR
EM
AT
UR
E D
EA
TH
S
2020 2025 2030 2035 2040 2045 2050
DRIVE CLEAN
NO NEW POLICY
16 Primary PM2.5 emissions reductions are not estimated by the model, resulting in a conservative estimate of reduced PM2.5 exposure.
2035 2.0 THE REPORT | 19

The DRIVE Clean scenario also slashes ground transportation sector CO2 emissions by 60% in 2035—putting this sector on a path to meet its share of the global 1.5°C goal—and by 93% in 2050, relative to 2020 levels (Figure 10). Total transportation sector emissions are reduced by 48% in 2035 and by 75% in 2050, relative to 2020 levels. In total, the pollutant and CO2 emissions reductions in the DRIVE Clean scenario equate to nearly $1.3 trillion in health and environmental savings through 2050, compared with the No New Policy scenario. These savings represent roughly $7,300 per car and $258,200 per HDT over the lifetime of each vehicle type. Combined with a 90% clean electricity grid by 2035, the aggressive electrification in the DRIVE Clean scenario would accelerate U.S. climate change mitigation efforts.
FIGURE 10.
Transportation sector CO2 emissions in the DRIVE Clean and No New Policy scenarios through 2050.
GHG EMISSIONS IN THE TRANSPORTATION SECTOR
2,000
1,500
1,000
500
0TO
TA
L T
RA
NS
PO
RT
SE
CT
OR
CO
2 E
MIS
SIO
NS
(MT
/Y
R)
1990 2000 2010 2020 2030 2040 2050
MEDIUM AND HEAVY DUTY TRUCKS ELECTRIFICATION
(100% SALES BY 2035)
LIGHT-DUTY VEHICLE ELECTRIFICATION
(100% SALES BY 2030)
NO NEW POLICY EMISSIONS
DRIVE CLEAN SCENARIO ALIGNS WITH A 1.5°C PATHWAY
To avoid the worst impacts of climate change and commit the nation to a 1.5°C pathway, the United States must cut GHG emissions approximately in half by 2030 on its way to net-zero emissions by 2050. By 2030, the DRIVE Clean scenario reduces combined CO2 emissions in the transportation and power sector by 58% relative to 2005 levels as vehicles electrify and the grid nears 90% clean electricity. At this point in 2030, economy-wide emissions reductions fall 35% relative to 2005 levels. If electrification in the buildings and industrial sectors is also pursued during this time, as modeled in our analysis, the result is an additional 10% reduction in economy-wide emissions, leading to 45% economy-wide emissions reductions by 2030 relative to 2005 levels. These emissions reductions are more aggressive than those in a recently published Energy Innovation analysis of a 1.5°C U.S. pathway, which assumes 100% zero-emission LDV sales by 2035 and 100% zero-emission HDT sales by 2045 (Orvis 2021).
2035 2.0 THE REPORT | 20
4.3 ACCELERATING EV SALES GOALS SUPPORTS 2 MILLION JOBS IN 2035
Though economic recovery seems just within reach, major sectors of the U.S. economy remain devastated by the COVID-19 pandemic. Already with the American Rescue Plan Act of 2021, substantial resources have been allocated to help individuals, families, and businesses. Enacting policies that rapidly electrify America’s transportation sector in line with the DRIVE Clean scenario present an opportunity to put more Americans back to work, and put more money back into consumers’ pockets.
We model the employment impacts of the DRIVE Clean scenario using Energy Innovation’s Energy Policy Simulator (EPS), an open-source system dynamics model developed to inform policymakers and regulators about which climate and energy policies will reduce greenhouse gas emissions most effectively and with the most beneficial financial and public health outcomes.17 The EPS used the electricity grid and transportation model outputs to calculate changes in jobs between the DRIVE Clean and No New Policy scenarios, i.e. the net impact of the combined clean electricity standard and vehicle electrification policies.
17 See generally, energypolicy.solutions.
2035 2.0 THE REPORT | 21
3.0
2.5
2.0
1.5
1.0
0.5
0.0
-0.5
-1.0
MIL
LIO
NS
OF
JO
B-Y
EA
RS
DIRECT JOBS INDIRECT JOBS INDUCED JOBS TOTAL JOBS
NET JOBS IN 2035 — DRIVE CLEAN SCENARIO
Gains Losses Net
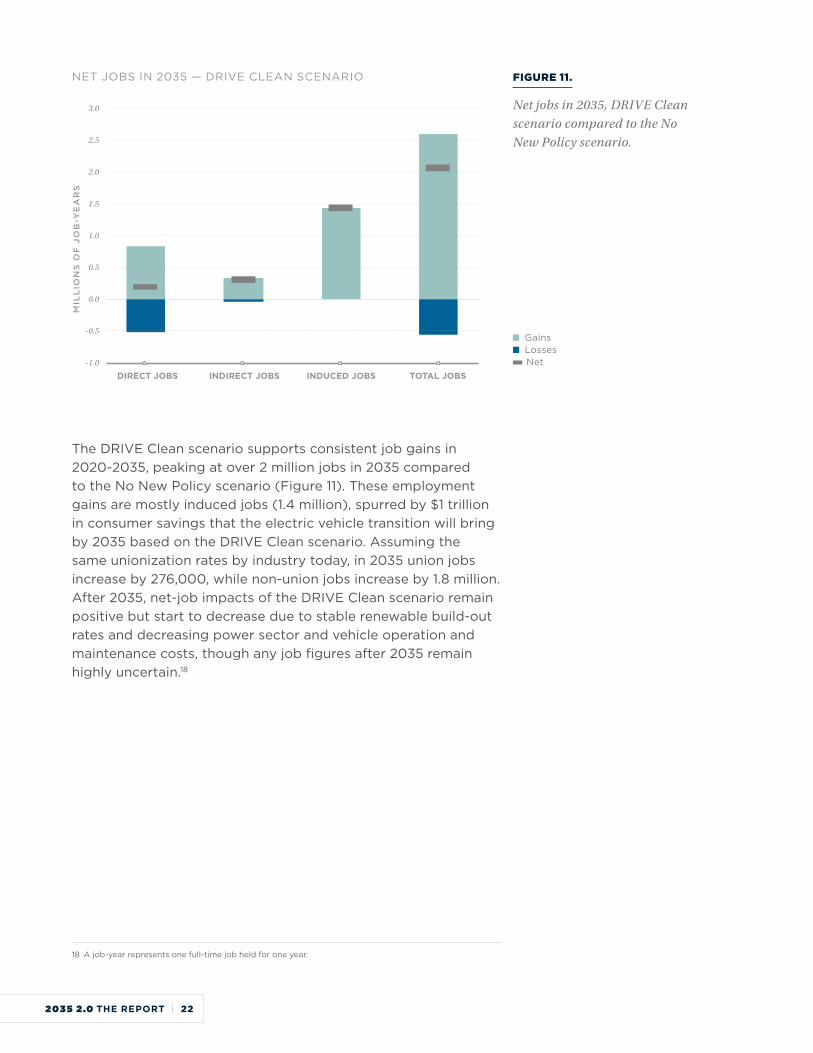
FIGURE 11.
Net jobs in 2035, DRIVE Clean scenario compared to the No New Policy scenario.
The DRIVE Clean scenario supports consistent job gains in 2020-2035, peaking at over 2 million jobs in 2035 compared to the No New Policy scenario (Figure 11). These employment gains are mostly induced jobs (1.4 million), spurred by $1 trillion in consumer savings that the electric vehicle transition will bring by 2035 based on the DRIVE Clean scenario. Assuming the same unionization rates by industry today, in 2035 union jobs increase by 276,000, while non-union jobs increase by 1.8 million. After 2035, net-job impacts of the DRIVE Clean scenario remain positive but start to decrease due to stable renewable build-out rates and decreasing power sector and vehicle operation and maintenance costs, though any job figures after 2035 remain highly uncertain.18
18 A job-year represents one full-time job held for one year.
2035 2.0 THE REPORT | 22
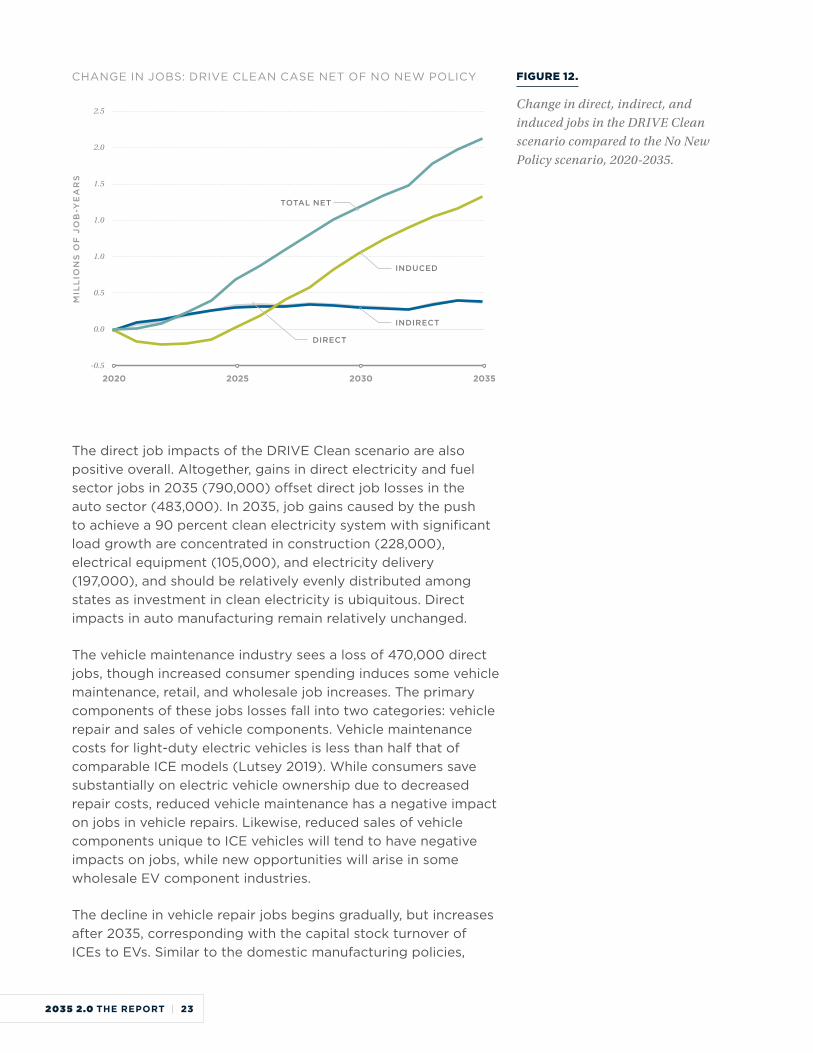
FIGURE 12.
Change in direct, indirect, and induced jobs in the DRIVE Clean scenario compared to the No New Policy scenario, 2020-2035.
2.5
2.0
1.5
1.0
1.0
0.5
0.0
-0.5
MIL
LIO
NS
OF
JO
B-Y
EA
RS
2020 2025 2030 2035
INDUCED
INDIRECT
DIRECT
TOTAL NET
CHANGE IN JOBS: DRIVE CLEAN CASE NET OF NO NEW POLICY
The direct job impacts of the DRIVE Clean scenario are also positive overall. Altogether, gains in direct electricity and fuel sector jobs in 2035 (790,000) offset direct job losses in the auto sector (483,000). In 2035, job gains caused by the push to achieve a 90 percent clean electricity system with significant load growth are concentrated in construction (228,000), electrical equipment (105,000), and electricity delivery (197,000), and should be relatively evenly distributed among states as investment in clean electricity is ubiquitous. Direct impacts in auto manufacturing remain relatively unchanged.
The vehicle maintenance industry sees a loss of 470,000 direct jobs, though increased consumer spending induces some vehicle maintenance, retail, and wholesale job increases. The primary components of these jobs losses fall into two categories: vehicle repair and sales of vehicle components. Vehicle maintenance costs for light-duty electric vehicles is less than half that of comparable ICE models (Lutsey 2019). While consumers save substantially on electric vehicle ownership due to decreased repair costs, reduced vehicle maintenance has a negative impact on jobs in vehicle repairs. Likewise, reduced sales of vehicle components unique to ICE vehicles will tend to have negative impacts on jobs, while new opportunities will arise in some wholesale EV component industries.
The decline in vehicle repair jobs begins gradually, but increases after 2035, corresponding with the capital stock turnover of ICEs to EVs. Similar to the domestic manufacturing policies,
2035 2.0 THE REPORT | 23
federal and state labor policies focused on retraining workers for the electrified economy should begin early, with a focus on adaptation and skills training for the clean transportation economy. Support for economic redevelopment and diversification beyond the clean energy industry can help more generally with an effective transition from an economy currently over-reliant on fossil fuels, to one powered by clean energy.
It is worth noting that the EPS does not predict a sharp decline in oil production jobs despite declines in domestic consumption, due to the fungibility of oil supply and prices in a global oil market. Though it is likely that the transition to EVs will continue and even accelerate globally, the impacts of worldwide transportation decarbonization is challenging to model at this juncture.
Finally, it is important to note that the EPS model used for this analysis does not account for the impact of “Made in America” domestic manufacturing policy impacts, which would likely alter the overall job picture for the U.S. under the DRIVE Clean scenario. EPS assumes that the domestic content of different industries remains constant at today’s levels – at this moment, the U.S. lags behind other countries in the supply chain for EVs and energy storage components, but this could change with the right policy package. With an increased emphasis on domestic manufacturing, a few key industries could see domestic contributions in vehicles increase significantly, including chemical feedstocks to lithium-ion batteries, battery manufacturing, recycling, and assembly, EV manufacturing, and renewable energy manufacturing. Current labor dynamics and manufacturing capacity are discussed in Section 4.6 of this report, while policies to support domestic manufacturing in an electrified transportation future are detailed in the companion policy report from Energy Innovation, Accelerating Clean, Electrified Transportation by 2035: Policy Priorities (Baldwin et al. 2021).
4.4 EV PERFORMANCE AND AVAILABILITY CAN MEET THE NEEDS OF AMERICAN DRIVERS
In addition to TCO and upfront vehicle prices, vehicle performance and availability have historically hindered electric vehicle deployment. American drivers have become accustomed to the standards established by gasoline- and diesel-powered vehicles for vehicle range, fueling time, diversity of vehicle models, and—for commercial vehicles—weight. Fortunately, EVs
2035 2.0 THE REPORT | 24
have been improving rapidly across all these dimensions, and our analysis suggests that they will not present significant barriers to accelerated electric vehicle deployment as envisioned in the DRIVE Clean scenario.
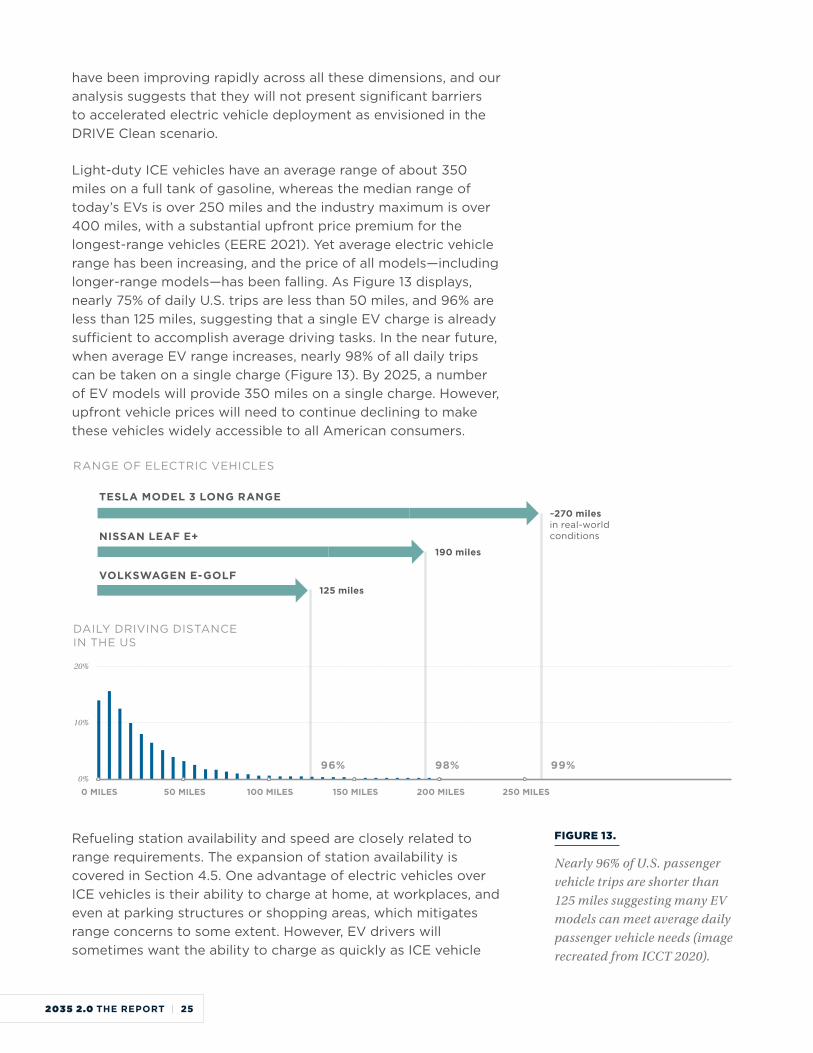
Light-duty ICE vehicles have an average range of about 350 miles on a full tank of gasoline, whereas the median range of today’s EVs is over 250 miles and the industry maximum is over 400 miles, with a substantial upfront price premium for the longest-range vehicles (EERE 2021). Yet average electric vehicle range has been increasing, and the price of all models—including longer-range models—has been falling. As Figure 13 displays, nearly 75% of daily U.S. trips are less than 50 miles, and 96% are less than 125 miles, suggesting that a single EV charge is already sufficient to accomplish average driving tasks. In the near future, when average EV range increases, nearly 98% of all daily trips can be taken on a single charge (Figure 13). By 2025, a number of EV models will provide 350 miles on a single charge. However, upfront vehicle prices will need to continue declining to make these vehicles widely accessible to all American consumers.
RANGE OF ELECTRIC VEHICLES
TESLA MODEL 3 LONG RANGE
VOLKSWAGEN E-GOLF
NISSAN LEAF E+
~270 milesin real-world conditions
190 miles
125 miles
DAILY DRIVING DISTANCE IN THE US
20%
10%
0%
0 MILES 50 MILES 100 MILES 150 MILES 200 MILES 250 MILES
99%98%96%
Refueling station availability and speed are closely related to range requirements. The expansion of station availability is covered in Section 4.5. One advantage of electric vehicles over ICE vehicles is their ability to charge at home, at workplaces, and even at parking structures or shopping areas, which mitigates range concerns to some extent. However, EV drivers will sometimes want the ability to charge as quickly as ICE vehicle
FIGURE 13.
Nearly 96% of U.S. passenger vehicle trips are shorter than 125 miles suggesting many EV models can meet average daily passenger vehicle needs (image recreated from ICCT 2020).
2035 2.0 THE REPORT | 25
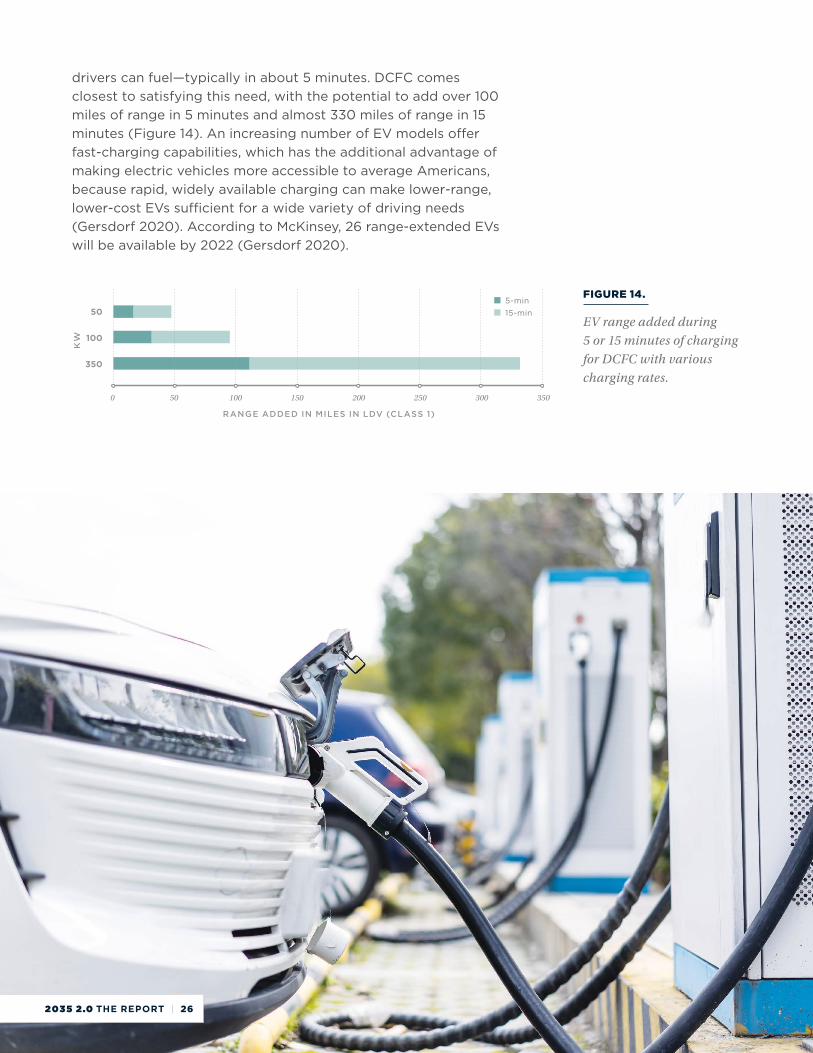
drivers can fuel—typically in about 5 minutes. DCFC comes closest to satisfying this need, with the potential to add over 100 miles of range in 5 minutes and almost 330 miles of range in 15 minutes (Figure 14). An increasing number of EV models offer fast-charging capabilities, which has the additional advantage of making electric vehicles more accessible to average Americans, because rapid, widely available charging can make lower-range, lower-cost EVs sufficient for a wide variety of driving needs (Gersdorf 2020). According to McKinsey, 26 range-extended EVs will be available by 2022 (Gersdorf 2020).
FIGURE 14.
EV range added during 5 or 15 minutes of charging for DCFC with various charging rates.
50
100
350
0 50 100 150 200 250 300 350
5-min 15-min
RANGE ADDED IN MILES IN LDV (CLASS 1)
KW
2035 2.0 THE REPORT | 26
INCREASING EV DIVERSITY CAN MEET THE NEEDS OF AMERICAN DRIVERS
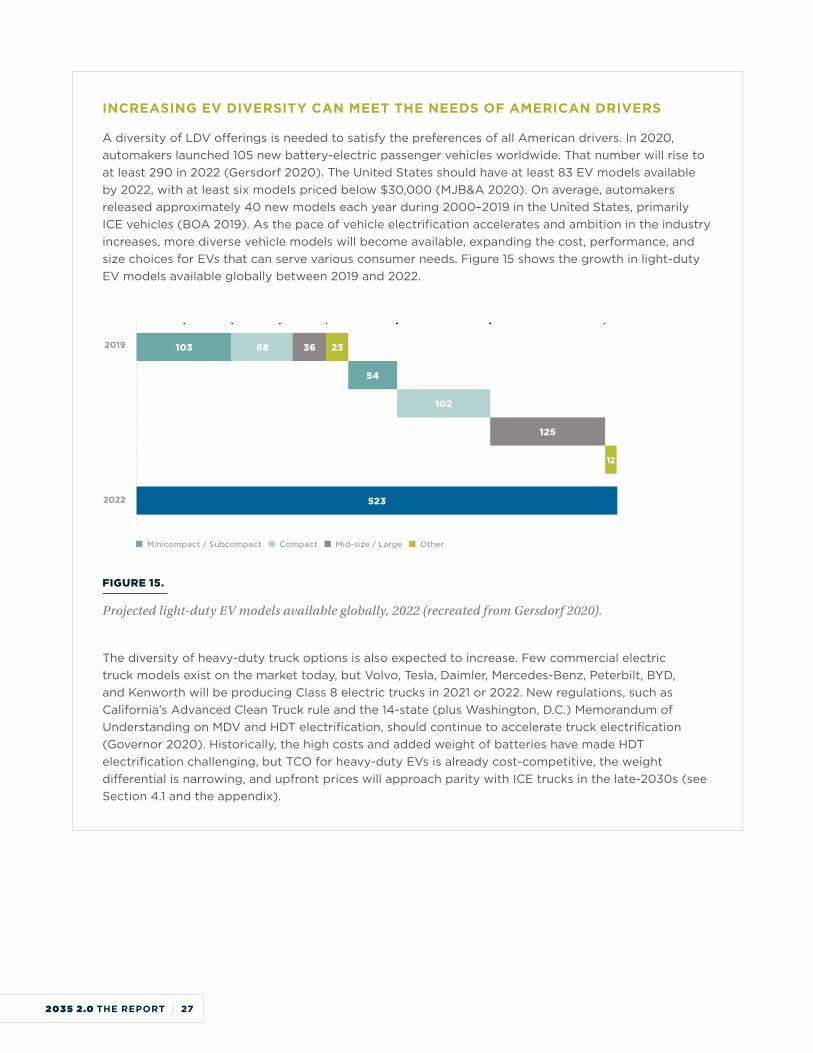
A diversity of LDV offerings is needed to satisfy the preferences of all American drivers. In 2020, automakers launched 105 new battery-electric passenger vehicles worldwide. That number will rise to at least 290 in 2022 (Gersdorf 2020). The United States should have at least 83 EV models available by 2022, with at least six models priced below $30,000 (MJB&A 2020). On average, automakers released approximately 40 new models each year during 2000–2019 in the United States, primarily ICE vehicles (BOA 2019). As the pace of vehicle electrification accelerates and ambition in the industry increases, more diverse vehicle models will become available, expanding the cost, performance, and size choices for EVs that can serve various consumer needs. Figure 15 shows the growth in light-duty EV models available globally between 2019 and 2022.
523
54
102
125
12
2019
2022
Minicompact / Subcompact Compact Mid-size / Large Other
103 68 36 23
FIGURE 15.
Projected light-duty EV models available globally, 2022 (recreated from Gersdorf 2020).
The diversity of heavy-duty truck options is also expected to increase. Few commercial electric truck models exist on the market today, but Volvo, Tesla, Daimler, Mercedes-Benz, Peterbilt, BYD, and Kenworth will be producing Class 8 electric trucks in 2021 or 2022. New regulations, such as California’s Advanced Clean Truck rule and the 14-state (plus Washington, D.C.) Memorandum of Understanding on MDV and HDT electrification, should continue to accelerate truck electrification (Governor 2020). Historically, the high costs and added weight of batteries have made HDT electrification challenging, but TCO for heavy-duty EVs is already cost-competitive, the weight differential is narrowing, and upfront prices will approach parity with ICE trucks in the late-2030s (see Section 4.1 and the appendix).
2035 2.0 THE REPORT | 27
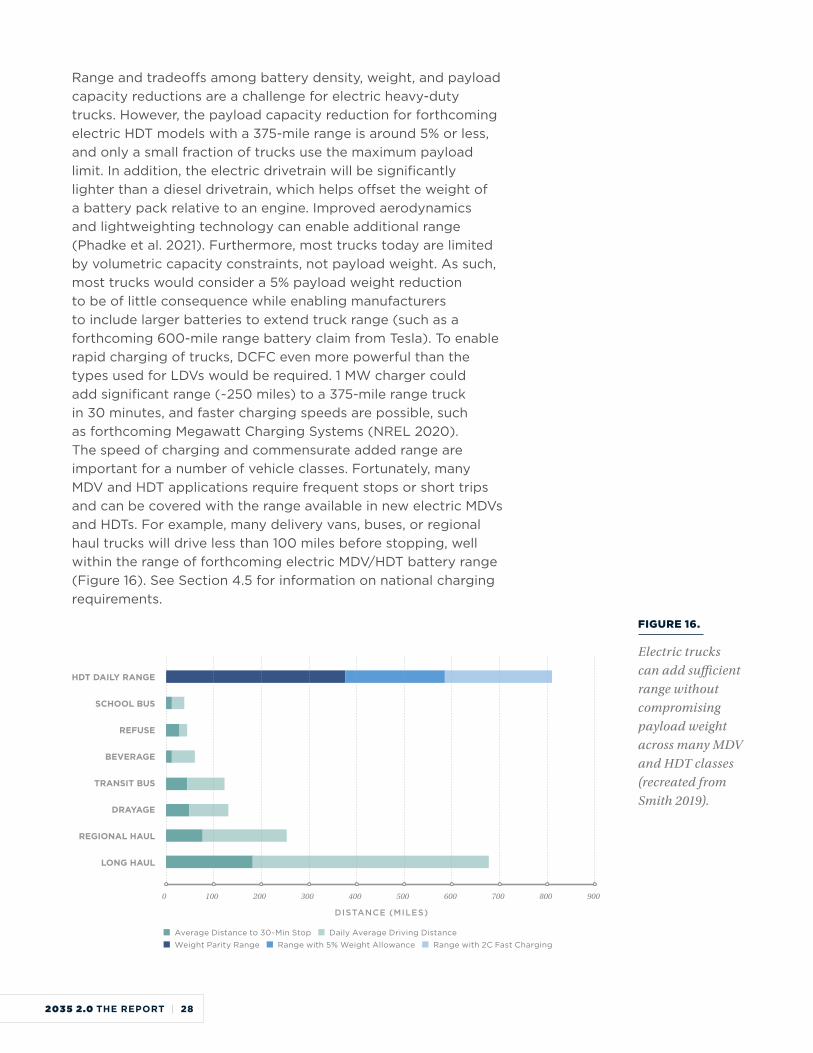
Range and tradeoffs among battery density, weight, and payload capacity reductions are a challenge for electric heavy-duty trucks. However, the payload capacity reduction for forthcoming electric HDT models with a 375-mile range is around 5% or less, and only a small fraction of trucks use the maximum payload limit. In addition, the electric drivetrain will be significantly lighter than a diesel drivetrain, which helps offset the weight of a battery pack relative to an engine. Improved aerodynamics and lightweighting technology can enable additional range (Phadke et al. 2021). Furthermore, most trucks today are limited by volumetric capacity constraints, not payload weight. As such, most trucks would consider a 5% payload weight reduction to be of little consequence while enabling manufacturers to include larger batteries to extend truck range (such as a forthcoming 600-mile range battery claim from Tesla). To enable rapid charging of trucks, DCFC even more powerful than the types used for LDVs would be required. 1 MW charger could add significant range (~250 miles) to a 375-mile range truck in 30 minutes, and faster charging speeds are possible, such as forthcoming Megawatt Charging Systems (NREL 2020). The speed of charging and commensurate added range are important for a number of vehicle classes. Fortunately, many MDV and HDT applications require frequent stops or short trips and can be covered with the range available in new electric MDVs and HDTs. For example, many delivery vans, buses, or regional haul trucks will drive less than 100 miles before stopping, well within the range of forthcoming electric MDV/HDT battery range (Figure 16). See Section 4.5 for information on national charging requirements.
HDT DAILY RANGE
SCHOOL BUS
REFUSE
BEVERAGE
TRANSIT BUS
DRAYAGE
REGIONAL HAUL
LONG HAUL
0 100 200 300 400 500 600 700 800 900
Average Distance to 30-Min Stop Daily Average Driving Distance Weight Parity Range Range with 5% Weight Allowance Range with 2C Fast Charging
DISTANCE (MILES)
FIGURE 16.
Electric trucks can add sufficient range without compromising payload weight across many MDV and HDT classes (recreated from Smith 2019).
2035 2.0 THE REPORT | 28
4.5 REQUIRED CHARGING INFRASTRUCTURE CAN BE BUILT COST-EFFECTIVELY TO SERVE THE ENVISIONED EV FLEET
To enable the DRIVE Clean scenario, U.S. electric vehicle charging infrastructure must provide drivers with at least as much convenience as provided by existing gasoline and diesel fueling stations. A 2019 poll suggests the largest roadblock to increased EV sales is the unavailability of or distance to charging stations (Toth/Morning Consult 2019). As fast charging and longer battery ranges become more ubiquitous, this dynamic may change. EVs with 250–300 miles of range are rapidly becoming cost-competitive and more widely available to many American consumers. Many automakers will soon offer fast-charging capabilities that add 50–100 miles of range in 5–10 minutes. Widespread availability of home-charging infrastructure will further alleviate range concerns. The pace of the required DRIVE Clean infrastructure scaleup is challenging but achievable, and the costs are modest compared with the benefits of widespread electric vehicle deployment.
LIGHT-DUTY VEHICLE CHARGING
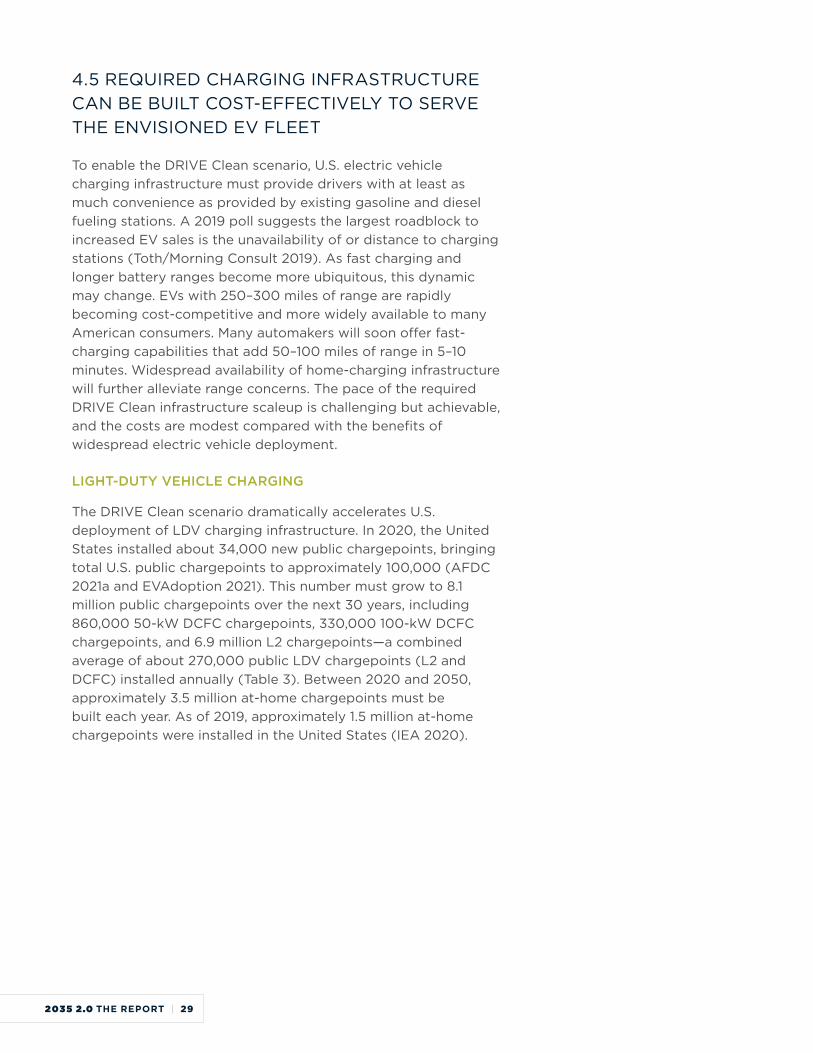
The DRIVE Clean scenario dramatically accelerates U.S. deployment of LDV charging infrastructure. In 2020, the United States installed about 34,000 new public chargepoints, bringing total U.S. public chargepoints to approximately 100,000 (AFDC 2021a and EVAdoption 2021). This number must grow to 8.1 million public chargepoints over the next 30 years, including 860,000 50-kW DCFC chargepoints, 330,000 100-kW DCFC chargepoints, and 6.9 million L2 chargepoints—a combined average of about 270,000 public LDV chargepoints (L2 and DCFC) installed annually (Table 3). Between 2020 and 2050, approximately 3.5 million at-home chargepoints must be built each year. As of 2019, approximately 1.5 million at-home chargepoints were installed in the United States (IEA 2020).
2035 2.0 THE REPORT | 29
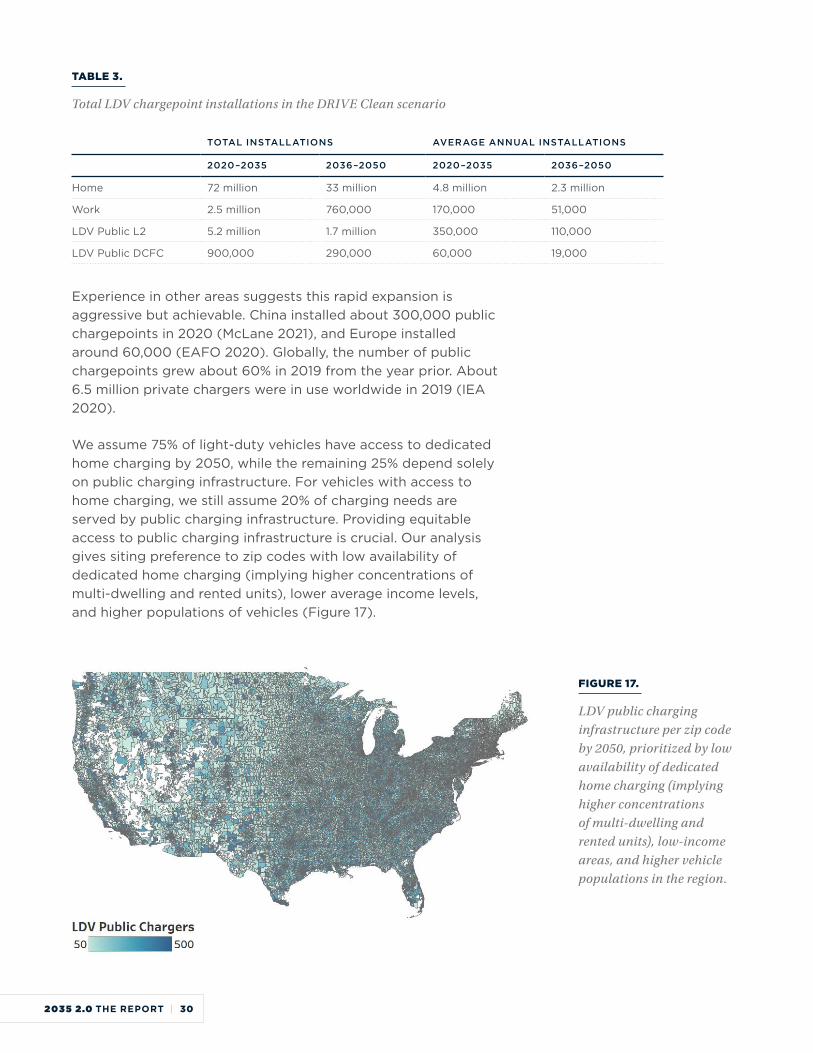
TABLE 3.
Total LDV chargepoint installations in the DRIVE Clean scenario
TOTAL INSTALLATIONS AVERAGE ANNUAL INSTALLATIONS
2020–2035 2036–2050 2020–2035 2036–2050
Home 72 million 33 million 4.8 million 2.3 million
Work 2.5 million 760,000 170,000 51,000
LDV Public L2 5.2 million 1.7 million 350,000 110,000
LDV Public DCFC 900,000 290,000 60,000 19,000
Experience in other areas suggests this rapid expansion is aggressive but achievable. China installed about 300,000 public chargepoints in 2020 (McLane 2021), and Europe installed around 60,000 (EAFO 2020). Globally, the number of public chargepoints grew about 60% in 2019 from the year prior. About 6.5 million private chargers were in use worldwide in 2019 (IEA 2020).
We assume 75% of light-duty vehicles have access to dedicated home charging by 2050, while the remaining 25% depend solely on public charging infrastructure. For vehicles with access to home charging, we still assume 20% of charging needs are served by public charging infrastructure. Providing equitable access to public charging infrastructure is crucial. Our analysis gives siting preference to zip codes with low availability of dedicated home charging (implying higher concentrations of multi-dwelling and rented units), lower average income levels, and higher populations of vehicles (Figure 17).
FIGURE 17.
LDV public charging infrastructure per zip code by 2050, prioritized by low availability of dedicated home charging (implying higher concentrations of multi-dwelling and rented units), low-income areas, and higher vehicle populations in the region.
2035 2.0 THE REPORT | 30
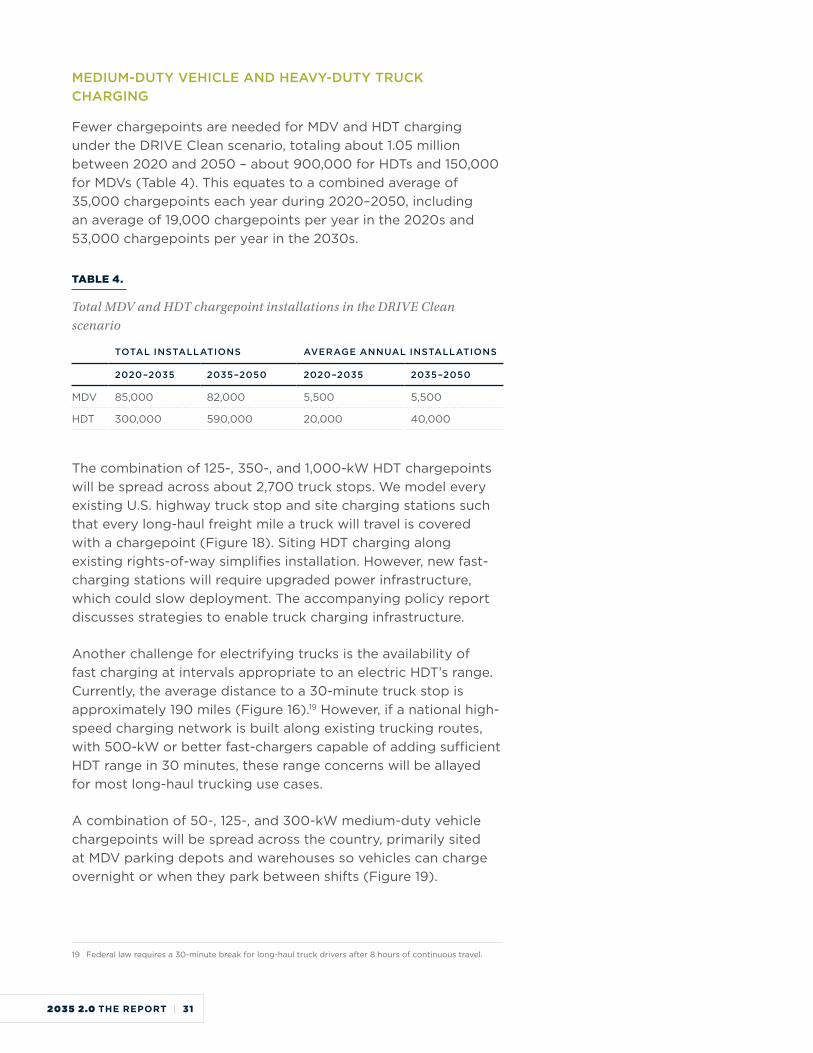
MEDIUM-DUTY VEHICLE AND HEAVY-DUTY TRUCK CHARGING
Fewer chargepoints are needed for MDV and HDT charging under the DRIVE Clean scenario, totaling about 1.05 million between 2020 and 2050 – about 900,000 for HDTs and 150,000 for MDVs (Table 4). This equates to a combined average of 35,000 chargepoints each year during 2020–2050, including an average of 19,000 chargepoints per year in the 2020s and 53,000 chargepoints per year in the 2030s.
TABLE 4.
Total MDV and HDT chargepoint installations in the DRIVE Clean scenario
TOTAL INSTALLATIONS AVERAGE ANNUAL INSTALLATIONS
2020–2035 2035–2050 2020–2035 2035–2050
MDV 85,000 82,000 5,500 5,500
HDT 300,000 590,000 20,000 40,000
The combination of 125-, 350-, and 1,000-kW HDT chargepoints will be spread across about 2,700 truck stops. We model every existing U.S. highway truck stop and site charging stations such that every long-haul freight mile a truck will travel is covered with a chargepoint (Figure 18). Siting HDT charging along existing rights-of-way simplifies installation. However, new fast-charging stations will require upgraded power infrastructure, which could slow deployment. The accompanying policy report discusses strategies to enable truck charging infrastructure.
Another challenge for electrifying trucks is the availability of fast charging at intervals appropriate to an electric HDT’s range. Currently, the average distance to a 30-minute truck stop is approximately 190 miles (Figure 16).19 However, if a national high-speed charging network is built along existing trucking routes, with 500-kW or better fast-chargers capable of adding sufficient HDT range in 30 minutes, these range concerns will be allayed for most long-haul trucking use cases.
A combination of 50-, 125-, and 300-kW medium-duty vehicle chargepoints will be spread across the country, primarily sited at MDV parking depots and warehouses so vehicles can charge overnight or when they park between shifts (Figure 19).
19 Federal law requires a 30-minute break for long-haul truck drivers after 8 hours of continuous travel.
2035 2.0 THE REPORT | 31
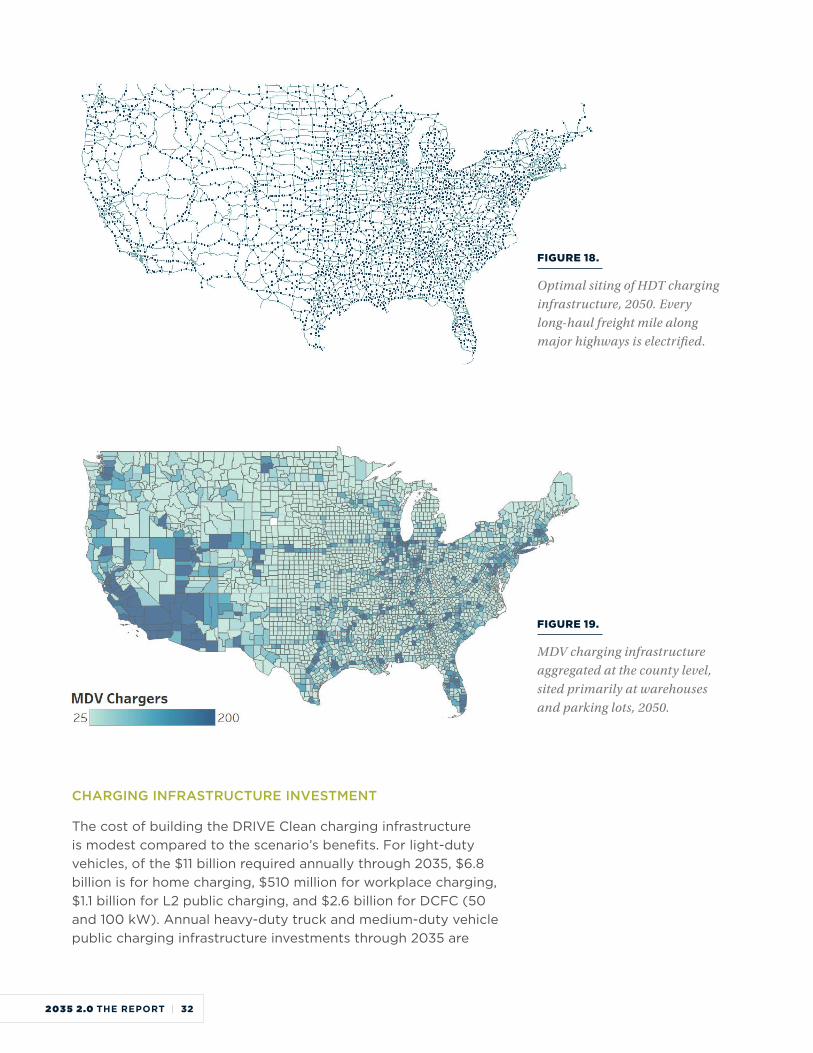
FIGURE 18.
Optimal siting of HDT charging infrastructure, 2050. Every long-haul freight mile along major highways is electrified.
FIGURE 19.
MDV charging infrastructure aggregated at the county level, sited primarily at warehouses and parking lots, 2050.
CHARGING INFRASTRUCTURE INVESTMENT
The cost of building the DRIVE Clean charging infrastructure is modest compared to the scenario’s benefits. For light-duty vehicles, of the $11 billion required annually through 2035, $6.8 billion is for home charging, $510 million for workplace charging, $1.1 billion for L2 public charging, and $2.6 billion for DCFC (50 and 100 kW). Annual heavy-duty truck and medium-duty vehicle public charging infrastructure investments through 2035 are
2035 2.0 THE REPORT | 32

$3.6 billion and $390 million, respectively. Beyond 2035, annual charging infrastructure investments for HDTs and MDVs increases to $6.3 billion and $520 million, respectively, while public L2 and DCFC investments for LDVs falls to $460 million and $1.1 billion, respectively. The cumulative investment in public charging infrastructure makes up a small portion of EV TCO in the DRIVE Clean scenario (see Section 4.1). As another point of comparison, U.S. utilities invest about $30 billion annually in new electricity distribution system upgrades (Figure 20) (EEI 2021). Still, the United States must commit to accelerating project-development timelines—already a major hurdle in charging infrastructure deployment—to reach DRIVE Clean levels on time. The accompanying policy report from Energy Innovation provides recommendations to facilitate equitable charging infrastructure deployment (Baldwin et al. 2021).
While the power sector analysis considers the impact of vehicle electrification on new generation and transmission investments (Section 4.7), it does not consider impacts to the distribution system. The distribution grid will require upgrades to support new electric loads from vehicle charging. A supporting analysis from E3 evaluates the distribution system investments that would be required to support electrification, drawing from both top-down (marginal cost study based analysis) and bottom-up (based on distribution resource planning assessments) approaches. E3 presents a range of estimates of distribution system investments over the next 30 years based on annual EV sales and associated charging infrastructure requirements of the DRIVE Clean scenario. The mid-case estimate suggests a cumulative $116 billion of distribution system investments over the next 30 years, or approximately $3.7 billion per year. Low and high estimates range from $900 million to $5 billion of distribution system investments per year. The cost of public charging, including the estimated distribution upgrade costs, will not increase rates, however, as the increased electricity sales helps increase throughput for utilities in order to cover the additional expenses. In fact, the analysis shows that even in the high estimate of distribution cost upgrades, distribution rates ($/kWh) would actually fall by 2% through 2035. The full analysis of distribution system investments is detailed in the appendix.
2035 2.0 THE REPORT | 33
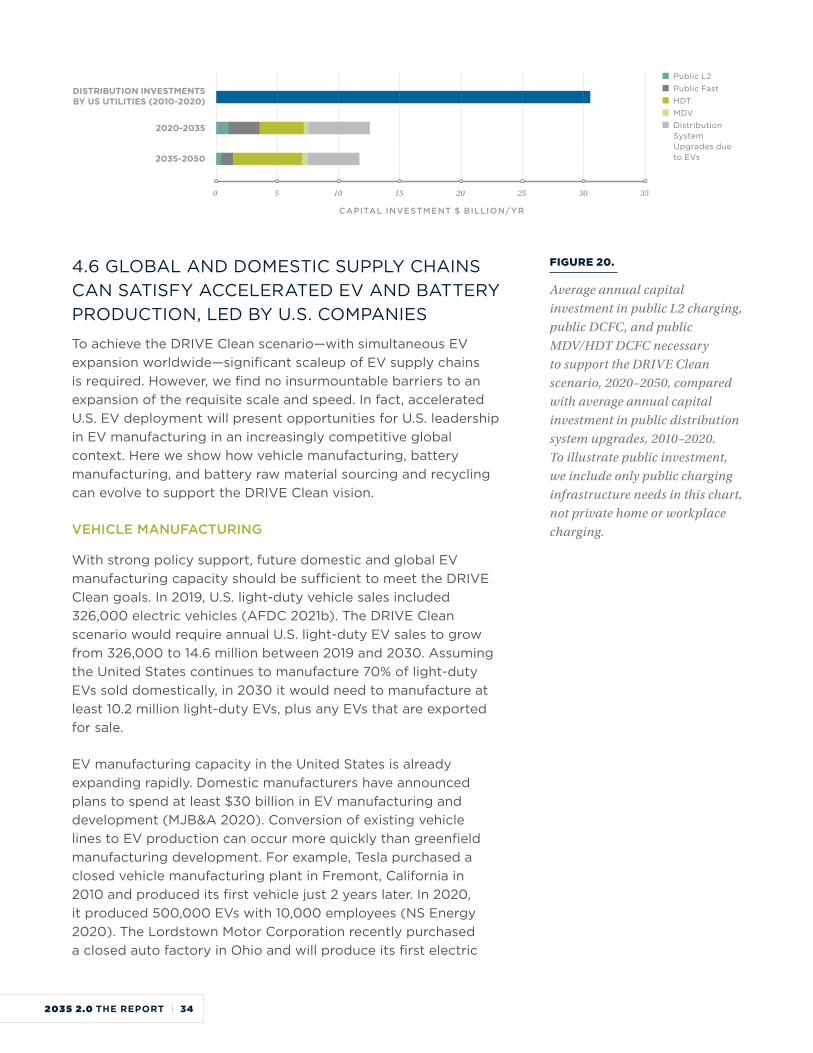
DISTRIBUTION INVESTMENTS BY US UTILITIES (2010-2020)
2020-2035
2035-2050
0 5 10 15 20 25 30 35
Public L2 Public Fast HDT MDV Distribution
System Upgrades due to EVs
CAPITAL INVESTMENT $ BILLION/YR
4.6 GLOBAL AND DOMESTIC SUPPLY CHAINS CAN SATISFY ACCELERATED EV AND BATTERY PRODUCTION, LED BY U.S. COMPANIES
To achieve the DRIVE Clean scenario—with simultaneous EV expansion worldwide—significant scaleup of EV supply chains is required. However, we find no insurmountable barriers to an expansion of the requisite scale and speed. In fact, accelerated U.S. EV deployment will present opportunities for U.S. leadership in EV manufacturing in an increasingly competitive global context. Here we show how vehicle manufacturing, battery manufacturing, and battery raw material sourcing and recycling can evolve to support the DRIVE Clean vision.
VEHICLE MANUFACTURING
With strong policy support, future domestic and global EV manufacturing capacity should be sufficient to meet the DRIVE Clean goals. In 2019, U.S. light-duty vehicle sales included 326,000 electric vehicles (AFDC 2021b). The DRIVE Clean scenario would require annual U.S. light-duty EV sales to grow from 326,000 to 14.6 million between 2019 and 2030. Assuming the United States continues to manufacture 70% of light-duty EVs sold domestically, in 2030 it would need to manufacture at least 10.2 million light-duty EVs, plus any EVs that are exported for sale.
EV manufacturing capacity in the United States is already expanding rapidly. Domestic manufacturers have announced plans to spend at least $30 billion in EV manufacturing and development (MJB&A 2020). Conversion of existing vehicle lines to EV production can occur more quickly than greenfield manufacturing development. For example, Tesla purchased a closed vehicle manufacturing plant in Fremont, California in 2010 and produced its first vehicle just 2 years later. In 2020, it produced 500,000 EVs with 10,000 employees (NS Energy 2020). The Lordstown Motor Corporation recently purchased a closed auto factory in Ohio and will produce its first electric
FIGURE 20.
Average annual capital investment in public L2 charging, public DCFC, and public MDV/HDT DCFC necessary to support the DRIVE Clean scenario, 2020–2050, compared with average annual capital investment in public distribution system upgrades, 2010–2020. To illustrate public investment, we include only public charging infrastructure needs in this chart, not private home or workplace charging.
2035 2.0 THE REPORT | 34
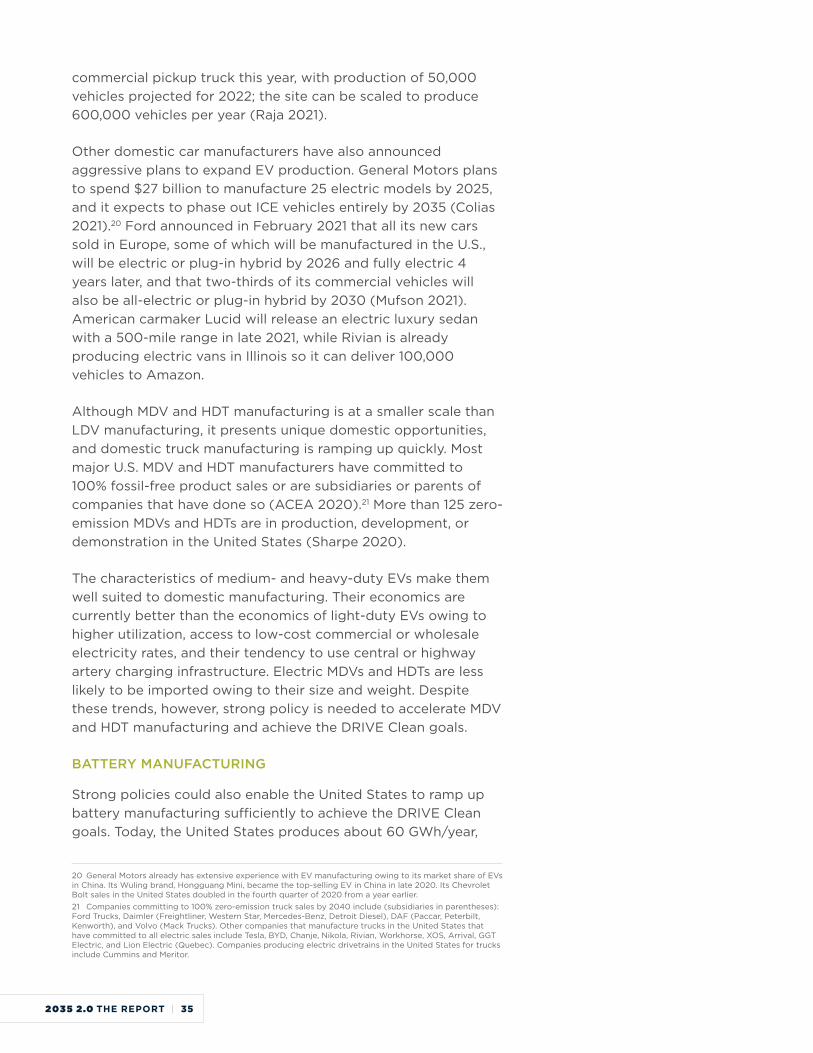
commercial pickup truck this year, with production of 50,000 vehicles projected for 2022; the site can be scaled to produce 600,000 vehicles per year (Raja 2021).
Other domestic car manufacturers have also announced aggressive plans to expand EV production. General Motors plans to spend $27 billion to manufacture 25 electric models by 2025, and it expects to phase out ICE vehicles entirely by 2035 (Colias 2021).20 Ford announced in February 2021 that all its new cars sold in Europe, some of which will be manufactured in the U.S., will be electric or plug-in hybrid by 2026 and fully electric 4 years later, and that two-thirds of its commercial vehicles will also be all-electric or plug-in hybrid by 2030 (Mufson 2021). American carmaker Lucid will release an electric luxury sedan with a 500-mile range in late 2021, while Rivian is already producing electric vans in Illinois so it can deliver 100,000 vehicles to Amazon.
Although MDV and HDT manufacturing is at a smaller scale than LDV manufacturing, it presents unique domestic opportunities, and domestic truck manufacturing is ramping up quickly. Most major U.S. MDV and HDT manufacturers have committed to 100% fossil-free product sales or are subsidiaries or parents of companies that have done so (ACEA 2020).21 More than 125 zero-emission MDVs and HDTs are in production, development, or demonstration in the United States (Sharpe 2020).
The characteristics of medium- and heavy-duty EVs make them well suited to domestic manufacturing. Their economics are currently better than the economics of light-duty EVs owing to higher utilization, access to low-cost commercial or wholesale electricity rates, and their tendency to use central or highway artery charging infrastructure. Electric MDVs and HDTs are less likely to be imported owing to their size and weight. Despite these trends, however, strong policy is needed to accelerate MDV and HDT manufacturing and achieve the DRIVE Clean goals.
BATTERY MANUFACTURING
Strong policies could also enable the United States to ramp up battery manufacturing sufficiently to achieve the DRIVE Clean goals. Today, the United States produces about 60 GWh/year,
20 General Motors already has extensive experience with EV manufacturing owing to its market share of EVs in China. Its Wuling brand, Hongguang Mini, became the top-selling EV in China in late 2020. Its Chevrolet Bolt sales in the United States doubled in the fourth quarter of 2020 from a year earlier.21 Companies committing to 100% zero-emission truck sales by 2040 include (subsidiaries in parentheses): Ford Trucks, Daimler (Freightliner, Western Star, Mercedes-Benz, Detroit Diesel), DAF (Paccar, Peterbilt, Kenworth), and Volvo (Mack Trucks). Other companies that manufacture trucks in the United States that have committed to all electric sales include Tesla, BYD, Chanje, Nikola, Rivian, Workhorse, XOS, Arrival, GGT Electric, and Lion Electric (Quebec). Companies producing electric drivetrains in the United States for trucks include Cummins and Meritor.
2035 2.0 THE REPORT | 35
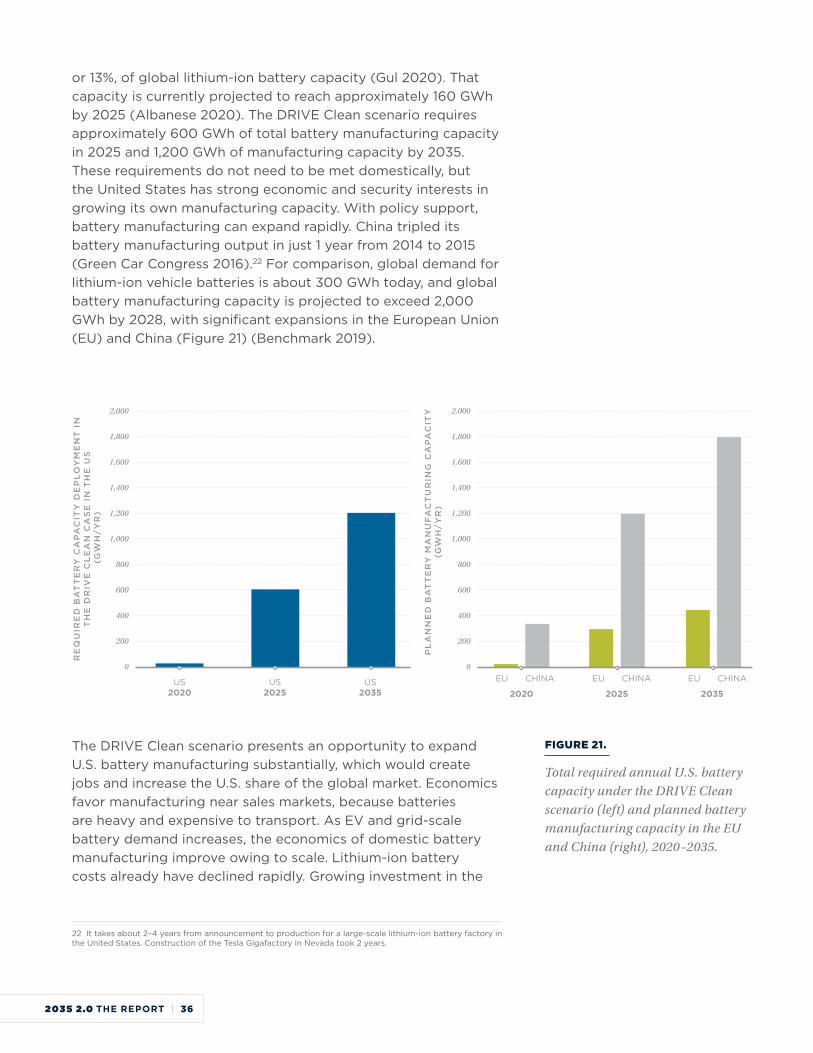
or 13%, of global lithium-ion battery capacity (Gul 2020). That capacity is currently projected to reach approximately 160 GWh by 2025 (Albanese 2020). The DRIVE Clean scenario requires approximately 600 GWh of total battery manufacturing capacity in 2025 and 1,200 GWh of manufacturing capacity by 2035. These requirements do not need to be met domestically, but the United States has strong economic and security interests in growing its own manufacturing capacity. With policy support, battery manufacturing can expand rapidly. China tripled its battery manufacturing output in just 1 year from 2014 to 2015 (Green Car Congress 2016).22 For comparison, global demand for lithium-ion vehicle batteries is about 300 GWh today, and global battery manufacturing capacity is projected to exceed 2,000 GWh by 2028, with significant expansions in the European Union (EU) and China (Figure 21) (Benchmark 2019).
2,000
1,800
1,600
1,400
1,200
1,000
800
600
400
200
0
PL
AN
NE
D B
AT
TE
RY
MA
NU
FA
CT
UR
ING
CA
PA
CIT
Y
(GW
H/
YR
)
EU CHINA
2020 2025 2035
EU CHINA EU CHINA
2,000
1,800
1,600
1,400
1,200
1,000
800
600
400
200
0
RE
QU
IRE
D B
AT
TE
RY
CA
PA
CIT
Y D
EP
LO
YM
EN
T I
N
TH
E D
RIV
E C
LE
AN
CA
SE
IN
TH
E U
S (
GW
H/
YR
)
US 2020
US 2025
US 2035
The DRIVE Clean scenario presents an opportunity to expand U.S. battery manufacturing substantially, which would create jobs and increase the U.S. share of the global market. Economics favor manufacturing near sales markets, because batteries are heavy and expensive to transport. As EV and grid-scale battery demand increases, the economics of domestic battery manufacturing improve owing to scale. Lithium-ion battery costs already have declined rapidly. Growing investment in the
22 It takes about 2–4 years from announcement to production for a large-scale lithium-ion battery factory in the United States. Construction of the Tesla Gigafactory in Nevada took 2 years.
FIGURE 21.
Total required annual U.S. battery capacity under the DRIVE Clean scenario (left) and planned battery manufacturing capacity in the EU and China (right), 2020–2035.
2035 2.0 THE REPORT | 36

domestic lithium-ion supply chain will further reduce costs, particularly as the United States expands its technical prowess in solid-state lithium-ion technology. Just as China built its global lead in battery production in 10 years, strong U.S. policies can ensure increased battery production to support the DRIVE Clean goals (Jin 2021b).
GLOBAL BATTERY RAW MATERIALS AND RECYCLING
Enabling high levels of electric vehicle manufacturing requires a reliable supply of raw materials for advanced batteries. Production of materials such as lithium, cobalt, and graphite must expand dramatically to meet this demand. Most battery raw material production is currently located outside of the United States, often in potentially unstable nations. Uncertainties surrounding the raw material supply chain include the following:
• The effect of changing lithium-ion battery design and chemistry on demand for rare earth metals
• The potential for interruptions to world trade in raw materials due to conflicts or the unacceptable labor conditions under which materials are obtained
• The effect of global competition for raw materials on supply and costs
• Potential reductions in raw material import requirements due to investment in rare earth metals recycling
Most analysts, however, expect battery raw material supplies—with the possible exception of lithium—will not constrain battery production during the next 10 years, and efforts are underway to address lithium supplies and demand (McKerracher 2021; Slowik 2020). Governments worldwide are planning numerous efforts to address longer-term supply risks for other minerals and elements (Fehrenbacher 2021).
Cost-effective battery recycling is a promising way to secure raw materials, reduce waste, and create high-quality jobs. One study suggests that 15 jobs are created to recycle every 1,000 metric tons of end-of-life lithium-ion batteries (Akram 2020). Multiple systems and processes already exist to recover rare earth metals from used batteries. Battery recycling will be especially important for the United States as it achieves high-volume EV manufacturing in the 2020s and 2030s. The United States could meet about 30%–40% of anticipated demand for lithium, nickel, manganese, cobalt, and graphite in passenger EVs with recycled battery materials by 2035 (Reichmuth 2019).
To date, China is the only country with a dedicated vehicle
2035 2.0 THE REPORT | 37
battery recycling policy (Reichmuth 2019). The European Commission has proposed requiring collection of used batteries and implementing standards for recycled content in new batteries. In 2020, the United States established a consortium of agencies to promote a domestic battery industry, citing the role the industry plays in consumer electronics and national defense and suggested using the Defense Production Act to speed development of mines for rare earth elements. Congress included provisions to secure domestic and allied sources of strategic minerals and metals, including lithium, in the National Defense Authorization Act for fiscal year 2021 (Lasley 2020).
In early 2021, President Biden ordered a 100-day review of U.S. supply chain vulnerabilities for critical items, including EV batteries and specialized minerals (Lynch 2021). One outcome of this review could be a decision (following the examples of the EU and China) to establish recycling incentives or regulations, require battery products to be standardized for easy disassembly, develop second-life battery uses, and establish tracing systems for battery components.23 These are some of the reasons to expect that U.S. battery production can supply a substantial portion of the batteries and raw materials needed to meet the DRIVE Clean goals.
4.7 ELECTRIC GRID IMPACTS OF THE ENVISIONED EV FLEET ARE MANAGEABLE
The DRIVE Clean scenario represents a significant change in the composition of U.S. electricity supply and demand, with clean generation making up 90% of supply, and demand increasing 25%. However, the aggressive expansion of renewable energy generation is achievable, and the resulting wholesale electricity cost is lower than today’s costs. Most importantly, the high-renewables, high-electrification vision of the DRIVE Clean scenario results in a dependable U.S. electricity grid.
The DRIVE Clean scenario requires a substantial increase in U.S. renewable energy installations due to the accelerated electrification of the transportation, industry, and residential and commercial buildings sectors. The combined demand growth requires electricity generation to increase approximately 2% per year, consistent with the 2.6% average historical growth in the electric sector during 1975–2005, when emissions in
23 There are also policy options for battery raw material at the state level. A bill in the California legislature would condition eligibility for state fleet procurement programs on vehicles with batteries having a minimum content of lithium mined in California.
2035 2.0 THE REPORT | 38
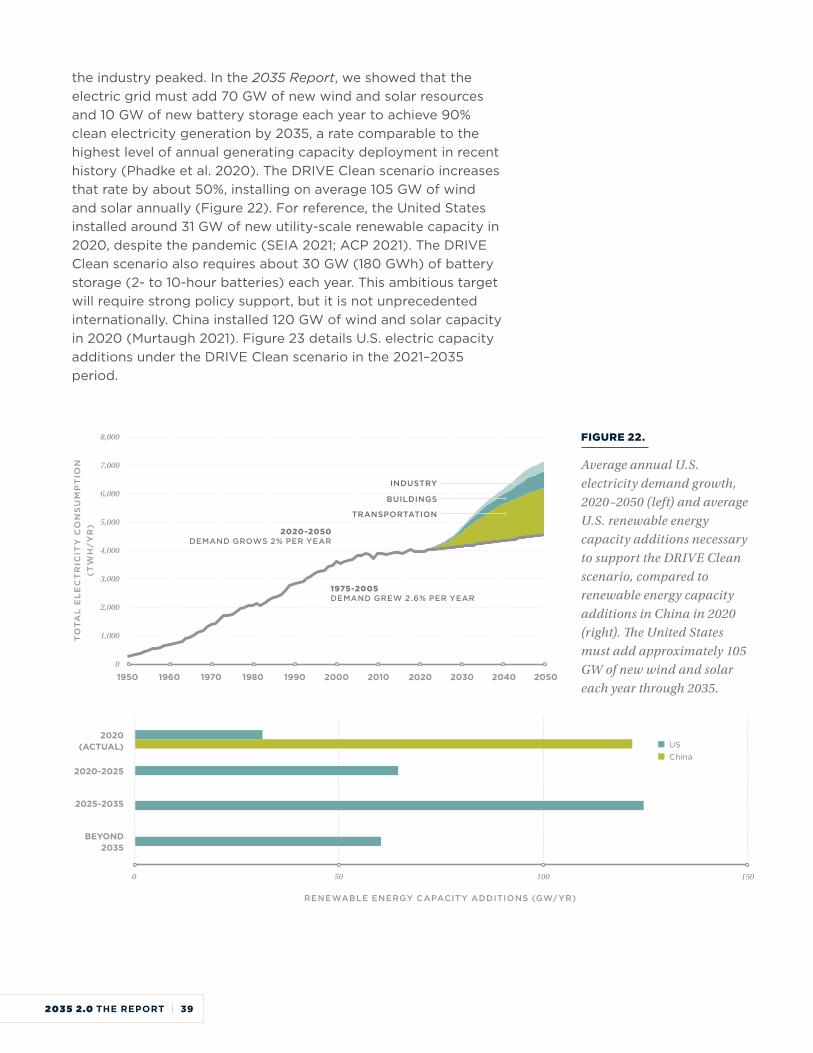
the industry peaked. In the 2035 Report, we showed that the electric grid must add 70 GW of new wind and solar resources and 10 GW of new battery storage each year to achieve 90% clean electricity generation by 2035, a rate comparable to the highest level of annual generating capacity deployment in recent history (Phadke et al. 2020). The DRIVE Clean scenario increases that rate by about 50%, installing on average 105 GW of wind and solar annually (Figure 22). For reference, the United States installed around 31 GW of new utility-scale renewable capacity in 2020, despite the pandemic (SEIA 2021; ACP 2021). The DRIVE Clean scenario also requires about 30 GW (180 GWh) of battery storage (2- to 10-hour batteries) each year. This ambitious target will require strong policy support, but it is not unprecedented internationally. China installed 120 GW of wind and solar capacity in 2020 (Murtaugh 2021). Figure 23 details U.S. electric capacity additions under the DRIVE Clean scenario in the 2021–2035 period.
8,000
7,000
6,000
5,000
4,000
3,000
2,000
1,000
0
TO
TA
L E
LE
CT
RIC
ITY
CO
NS
UM
PT
ION
(T
WH
/Y
R)
1950 1960 1970 1980 1990 2000 2010 2020 2030 2040 2050
1975-2005 DEMAND GREW 2.6% PER YEAR
2020-2050 DEMAND GROWS 2% PER YEAR
INDUSTRY
BUILDINGS
TRANSPORTATION
2020 (ACTUAL)
2020-2025
2025-2035
BEYOND 2035
0 50 100 150
US China
RENEWABLE ENERGY CAPACITY ADDITIONS (GW/YR)
FIGURE 22.
Average annual U.S. electricity demand growth, 2020–2050 (left) and average U.S. renewable energy capacity additions necessary to support the DRIVE Clean scenario, compared to renewable energy capacity additions in China in 2020 (right). The United States must add approximately 105 GW of new wind and solar each year through 2035.
2035 2.0 THE REPORT | 39

FIGURE 23.
U.S. electricity capacity additions in the DRIVE Clean scenario, 2021–2035.
Wind
Solar
Battery
2,000
1,500
1,000
500
0
CU
MU
LA
TIV
E C
AP
AC
ITY
A
DD
ITIO
N
(GW
)
2021 2023 2025 2027 2029 2031 2033 2035
The average electricity generation cost in 2035 in the DRIVE Clean scenario is slightly lower than 2020 electricity costs owing to the steep renewable energy cost reductions and higher system utilization enabled by increased electrification. The benefit derives from the complementary load profiles of different types of EV charging and electric loads in the buildings sectors—electricity use is higher in the DRIVE Clean scenario, but it is more evenly distributed across seasons. In 2035, the additional electricity demand is dominated by EV charging (Figure 24). Public chargers are primarily used during the day and home chargers in the evening, helping to smooth load across all hours of the day. Small load increases from building electrification occur mostly in winter due to space heating. The higher winter load results in more efficient renewable energy use, because net peak load occurs in summer, with significant renewable energy curtailment in winter and spring. The higher winter load reduces curtailment in those months, which also reduces the need for battery capacity.
The system benefits increase as electrification increases. In 2050, the total additional load is much higher—with more significant contributions from buildings and industry—but the additional load profiles are still relatively flat, and the difference between winter and summer peak loads is smaller than it is in 2035 (Figures 24 and 25). These characteristics further reduce renewable energy curtailment and average generation costs. Our study does not assume availability of flexible loads such as managed EV charging or demand response from building loads, but flexibility would further increase system efficiency and reduce costs under the DRIVE Clean scenario. Demand-side flexibility in the form of increased demand response or flexible chargers and water heaters, for example, would also significantly reduce additional transmission or distribution investments needed to support the load growth.
2035 2.0 THE REPORT | 40
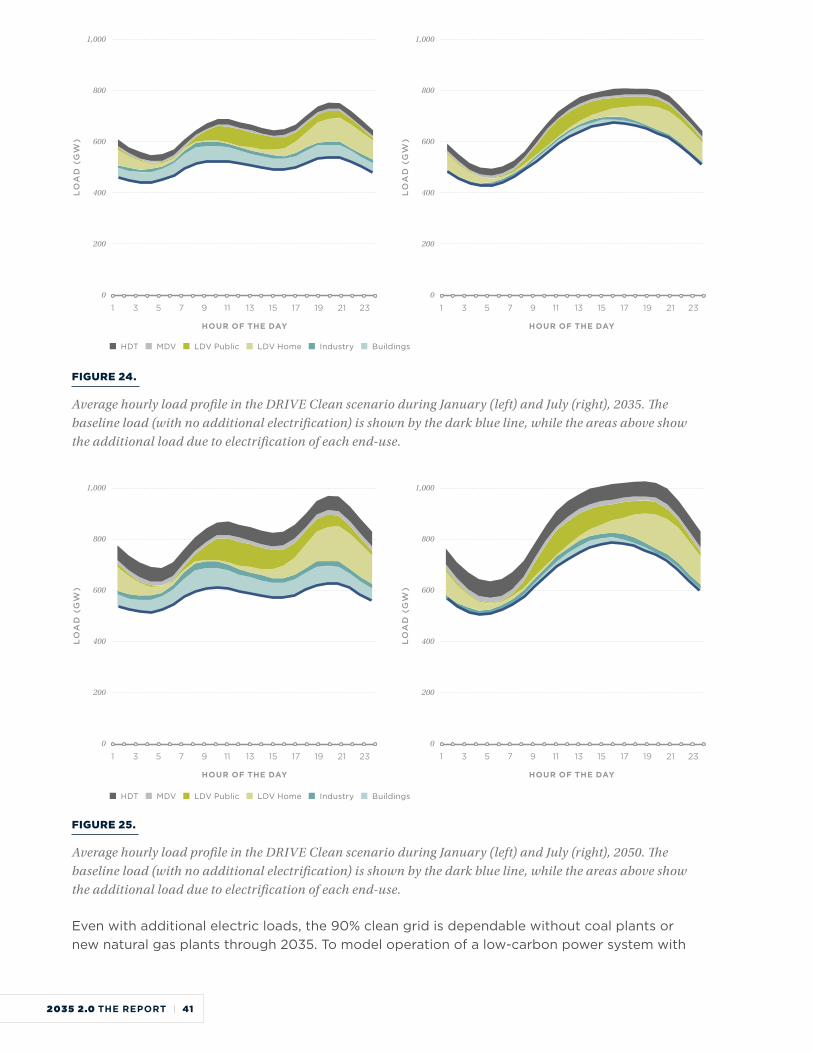
1,000
800
600
400
200
0
1,000
800
600
400
200
0
LO
AD
(G
W)
HOUR OF THE DAY HOUR OF THE DAY
LO
AD
(G
W)
1 3 5 7 9 11 13 15 17 19 21 23 1 3 5 7 9 11 13 15 17 19 21 23
HDT MDV LDV Public LDV Home Industry Buildings
FIGURE 24.
Average hourly load profile in the DRIVE Clean scenario during January (left) and July (right), 2035. The baseline load (with no additional electrification) is shown by the dark blue line, while the areas above show the additional load due to electrification of each end-use.
1,000
800
600
400
200
0
1,000
800
600
400
200
0
LO
AD
(G
W)
HOUR OF THE DAY HOUR OF THE DAY
LO
AD
(G
W)
1 3 5 7 9 11 13 15 17 19 21 23 1 3 5 7 9 11 13 15 17 19 21 23
HDT MDV LDV Public LDV Home Industry Buildings
FIGURE 25.
Average hourly load profile in the DRIVE Clean scenario during January (left) and July (right), 2050. The baseline load (with no additional electrification) is shown by the dark blue line, while the areas above show the additional load due to electrification of each end-use.
Even with additional electric loads, the 90% clean grid is dependable without coal plants or new natural gas plants through 2035. To model operation of a low-carbon power system with
2035 2.0 THE REPORT | 41
additional electrification load, we analyze U.S. hourly dispatch at the powerplant level using PLEXOS. We incorporate 7 years of weather data (2007–2013) to evaluate the impact of extreme weather events on renewable generation and load. To ensure grid dependability and estimate the generation capacity required to meet system demand in every hour, even during periods of low renewable energy generation and/or high demand, we simulate hourly operation of the U.S. power system for more than 60,000 hours (each hour across 7 weather years). For each hour, we confirm how electricity demand is met in each of 134 regional zones (parts of the U.S. power system represented in the model) while abiding by technical constraints (such as ramp rates and minimum generation) and operational requirements (such as provision of ancillary services like spinning, regulation, and load-following services) for more than 15,000 individual generators and 310 transmission lines.
To highlight the dependability of a 90% clean electricity grid with additional electrification load under the DRIVE Clean scenario, and to estimate natural gas capacity requirements, we identify the period during the 7 weather years when maximum natural gas generation capacity is needed to compensate for the largest gap between clean electricity generation (including battery generation) and load. The maximum natural gas capacity required is about 311 GW on February 2nd of the 2010 weather year (Figure 26). At 7 AM Eastern Time on that day, solar generation is zero, while wind generation is 85% below installed wind capacity, resulting in approximately 81 GW of wind and solar production (about 82% below the 7 year renewable generation hourly average). The additional electricity demand due to home charging (4.5 GW) and public charging (50 GW) of electric vehicles is significant, while electrification of buildings (44 GW) and industry (12 GW) contributes an additional 56 GW. The total system demand of about 627 GW is met by a combination of other clean resources, such as 118 GW of hydropower and nuclear, approximately 311 GW of existing natural gas, and 115 GW of battery discharge.
2035 2.0 THE REPORT | 42
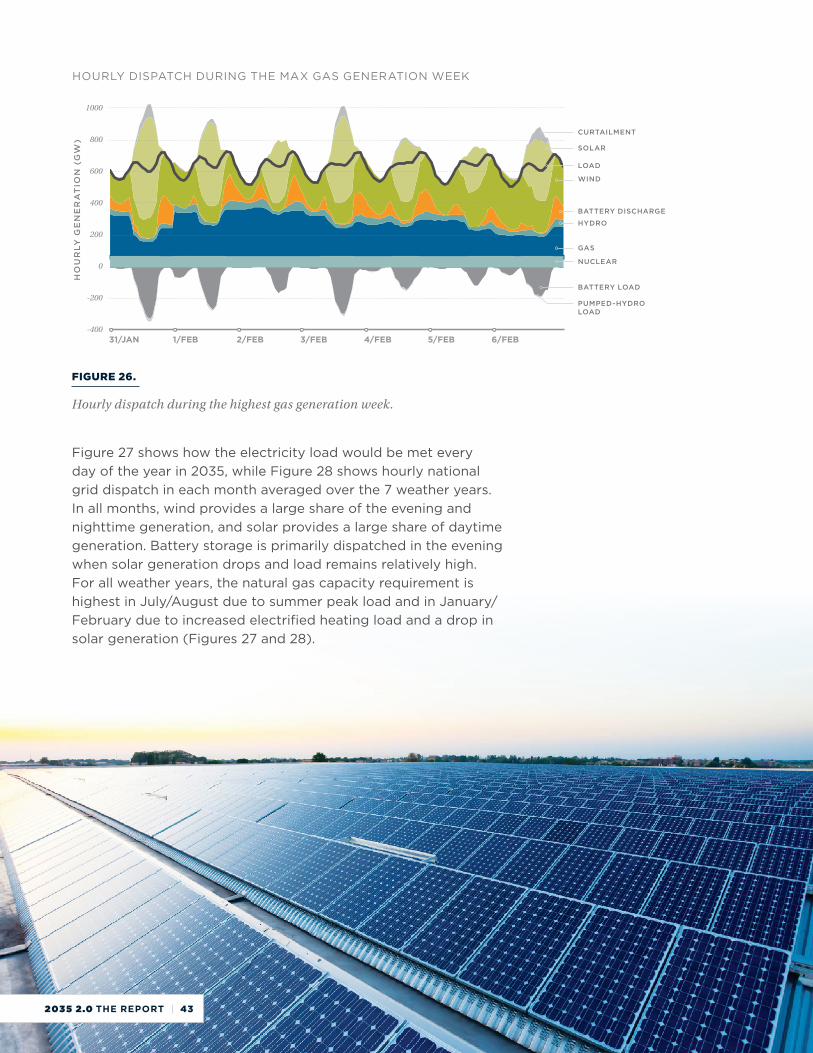
HO
UR
LY G
EN
ER
AT
ION
(G
W)
1000
800
600
400
200
0
-200
-40031/JAN 1/FEB 2/FEB 3/FEB 4/FEB 5/FEB 6/FEB
BATTERY LOAD
PUMPED-HYDRO LOAD
HOURLY DISPATCH DURING THE MAX GAS GENERATION WEEK
NUCLEAR
GAS
HYDRO
BATTERY DISCHARGE
WIND
SOLAR
LOAD
CURTAILMENT
FIGURE 26.
Hourly dispatch during the highest gas generation week.
Figure 27 shows how the electricity load would be met every day of the year in 2035, while Figure 28 shows hourly national grid dispatch in each month averaged over the 7 weather years. In all months, wind provides a large share of the evening and nighttime generation, and solar provides a large share of daytime generation. Battery storage is primarily dispatched in the evening when solar generation drops and load remains relatively high. For all weather years, the natural gas capacity requirement is highest in July/August due to summer peak load and in January/February due to increased electrified heating load and a drop in solar generation (Figures 27 and 28).
2035 2.0 THE REPORT | 43
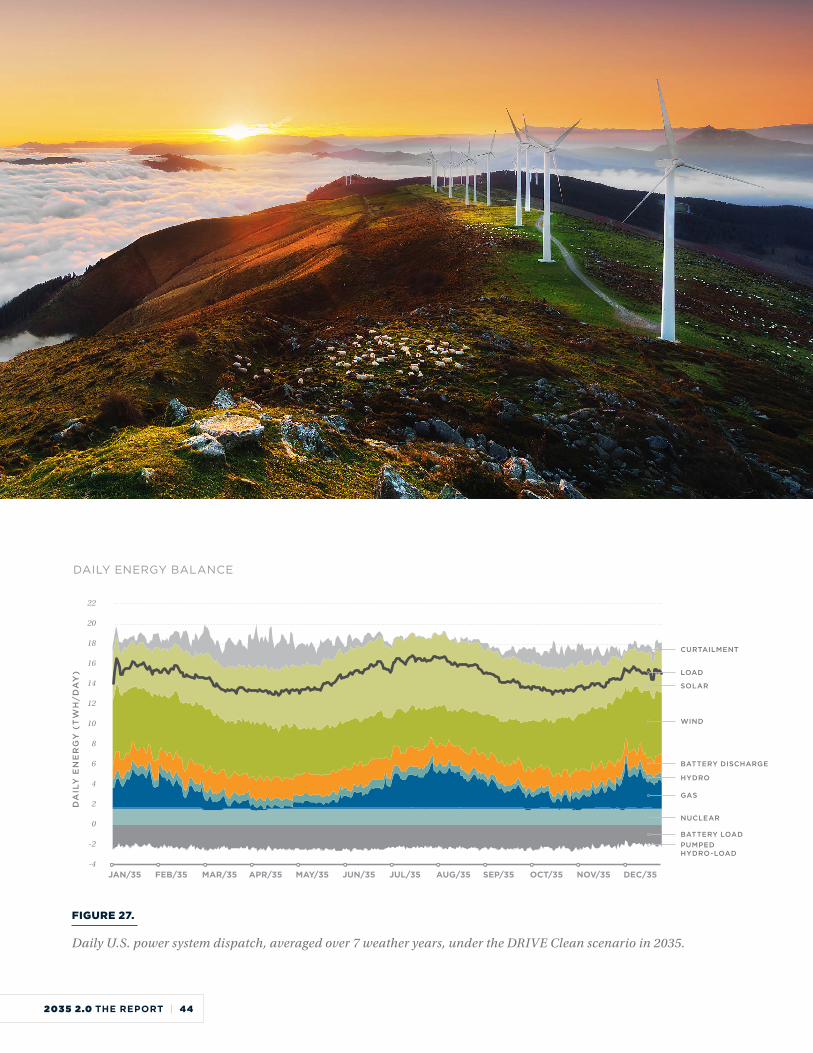
DA
ILY
EN
ER
GY
(T
WH
/DA
Y)
22
20
18
16
14
12
10
8
6
4
2
0
-2
-4JAN/35 FEB/35 MAR/35 APR/35 MAY/35 JUN/35 JUL/35 AUG/35 SEP/35 OCT/35 NOV/35 DEC/35
NUCLEAR
BATTERY LOADPUMPED HYDRO-LOAD
GAS
HYDRO
BATTERY DISCHARGE
WIND
SOLAR
LOAD
CURTAILMENT
DAILY ENERGY BALANCE
FIGURE 27.
Daily U.S. power system dispatch, averaged over 7 weather years, under the DRIVE Clean scenario in 2035.
2035 2.0 THE REPORT | 44
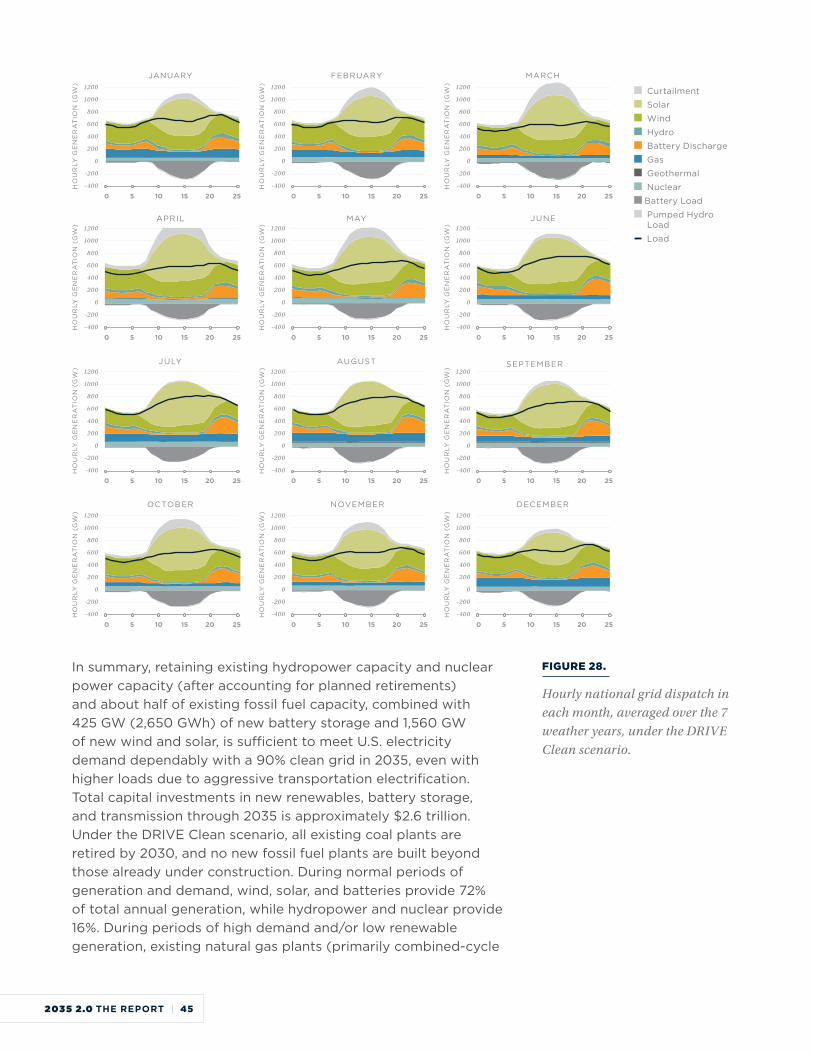
JANUARY FEBRUARY MARCH
50 10 15 20 25
HO
UR
LY G
EN
ER
AT
ION
(G
W) 1200
1000
800
600
400
200
0
-200
-400
50 10 15 20 25
HO
UR
LY G
EN
ER
AT
ION
(G
W) 1200
1000
800
600
400
200
0
-200
-400
50 10 15 20 25
HO
UR
LY G
EN
ER
AT
ION
(G
W) 1200
1000
800
600
400
200
0
-200
-400
50 10 15 20 25
HO
UR
LY G
EN
ER
AT
ION
(G
W) 1200
1000
800
600
400
200
0
-200
-400
50 10 15 20 25
HO
UR
LY G
EN
ER
AT
ION
(G
W) 1200
1000
800
600
400
200
0
-200
-400
50 10 15 20 25
HO
UR
LY G
EN
ER
AT
ION
(G
W) 1200
1000
800
600
400
200
0
-200
-400
50 10 15 20 25
HO
UR
LY G
EN
ER
AT
ION
(G
W) 1200
1000
800
600
400
200
0
-200
-400
50 10 15 20 25
HO
UR
LY G
EN
ER
AT
ION
(G
W) 1200
1000
800
600
400
200
0
-200
-400
50 10 15 20 25
HO
UR
LY G
EN
ER
AT
ION
(G
W) 1200
1000
800
600
400
200
0
-200
-400
50 10 15 20 25
HO
UR
LY G
EN
ER
AT
ION
(G
W) 1200
1000
800
600
400
200
0
-200
-400
50 10 15 20 25
HO
UR
LY G
EN
ER
AT
ION
(G
W) 1200
1000
800
600
400
200
0
-200
-400
50 10 15 20 25
HO
UR
LY G
EN
ER
AT
ION
(G
W) 1200
1000
800
600
400
200
0
-200
-400
APRIL MAY JUNE
JULY AUGUST SEPTEMBER
OCTOBER NOVEMBER DECEMBER
Curtailment
Solar
Wind
Hydro
Battery Discharge
Gas
Geothermal
Nuclear
Battery Load
Pumped Hydro Load
Load
In summary, retaining existing hydropower capacity and nuclear power capacity (after accounting for planned retirements) and about half of existing fossil fuel capacity, combined with 425 GW (2,650 GWh) of new battery storage and 1,560 GW of new wind and solar, is sufficient to meet U.S. electricity demand dependably with a 90% clean grid in 2035, even with higher loads due to aggressive transportation electrification. Total capital investments in new renewables, battery storage, and transmission through 2035 is approximately $2.6 trillion. Under the DRIVE Clean scenario, all existing coal plants are retired by 2030, and no new fossil fuel plants are built beyond those already under construction. During normal periods of generation and demand, wind, solar, and batteries provide 72% of total annual generation, while hydropower and nuclear provide 16%. During periods of high demand and/or low renewable generation, existing natural gas plants (primarily combined-cycle
FIGURE 28.
Hourly national grid dispatch in each month, averaged over the 7 weather years, under the DRIVE Clean scenario.
2035 2.0 THE REPORT | 45

plants) cost-effectively compensate for remaining mismatches between demand and renewables-plus-battery generation—accounting for about 10% of total annual electricity generation.
Under the DRIVE Clean scenario, increased electrification and renewable energy and battery storage deployments require investments mainly in new transmission spurs connecting renewable generation to existing high-capacity transmission, rather than new investments in bulk transmission. While the DRIVE Clean scenario requires about three times more spurline investment than the No New Policy scenario, the total transmission requirements in DRIVE Clean add only $0.2 cents/kWh to total system costs. Recent studies that account for low renewable energy and battery storage costs indicate similar findings (Jayadev et al. 2020). Studies that assume much higher renewable energy costs or do not consider substantial battery storage find higher levels of additional bulk transmission are required (Clack et al. 2017, NREL 2012). Further work is needed to understand transmission needs more precisely.
2035 2.0 THE REPORT | 46
As the nation’s largest emitter of GHGs and a leading source of harmful air pollutants, the transportation sector must move rapidly to reduce pollution and transition to electric vehicles. In this analysis, we show that switching to all-electric light-duty vehicles, medium-duty vehicles, and heavy-duty trucks can be cost-effective for consumers while yielding numerous national benefits. Transitioning to 100% electric LDV sales by 2030 and 100% electric MDV and HDT sales by 2035 results in $2.7 trillion in cumulative consumer cost savings, and $1.3 trillion in environmental and human health cost savings through 2050.
Other industrialized nations are charging ahead with electric vehicle adoption, spurred by strong public policy, strategic infrastructure investments, and expanded consumer engagement. As vehicle electrification expands globally, the United States needs increased ambition and leadership to remain competitive as a vehicle and battery manufacturer. With strong policies in the near term, the U.S. auto industry can pivot quickly to become a global leader in vehicle electrification, gain market share, and sustain and create jobs. The United States can also improve public health, help address the climate crisis, and save consumers trillions of dollars. The benefits of such a shift speak for themselves, as do the costs of inaction.
Like all analyses, ours has limitations. The DRIVE Clean scenario is not a projection; rather, it is intended to illustrate the potential health, environmental, and economic benefits of accelerating EV sales in the next 10–15 years while moving to a 90% clean electric grid. Although this report describes the system characteristics needed to accommodate high levels of renewable generation and demand-side electrification, it does not address the institutional, market, and regulatory changes needed to facilitate such a transformation. Specifically, it does not evaluate the political, societal, or consumer-adoption issues surrounding the DRIVE Clean scenario targets. A supporting policy report from Energy Innovation offers recommendations that address some barriers to such a transition, but these factors should be explored further in future analyses to inform decision making.
5CONCLUSIONS, CAVEATS, AND FUTURE WORK
2035 2.0 THE REPORT | 47

In addition, we do not evaluate the broader portfolio of clean vehicle technologies that could decarbonize the transportation sector. Other technologies, such as hydrogen, can and may support transportation decarbonization efforts across all vehicle classes in the future. We also exclude consideration of other mobility measures—such as public transit, car sharing, and smart urban planning to reduce vehicle miles traveled—but these measures are critical adjuncts to electrification for holistically decarbonizing the transportation sector.
We also recognize that the transportation sector has contributed to economic and racial inequities and disproportionate health impacts in the United States. In the shift to electrified transportation, attention must be paid to approaches that ensure a more equitable transition for all people, regardless of race, income, or geographic location.
Finally, although we assess operational feasibility of the U.S. power system using weather-synchronized load and generation data, further work is needed to advance our understanding of other facets of a 90% clean power system with increasing vehicle, building, and industrial electrification. Although this analysis does not attempt a full power-system reliability
2035 2.0 THE REPORT | 48
assessment, we perform scenario and sensitivity analysis to ensure that demand is met in all periods, including during extreme weather events and periods of low renewable energy generation. Although the capacity-expansion modeling (ReEDS) required that clean resources contribute 90% of annual generation in 2035, the hourly operational model (PLEXOS) simulated roughly 88% clean generation, primarily due to higher curtailment of wind and solar. PLEXOS model dispatch decisions were based on the variable cost of generation and did not consider the carbon free or non-carbon free nature of the generation source. In an electricity market with a 90% clean energy constraint, as modeled in the DRIVE Clean scenario, clean energy may bid negative prices in certain hours in order to get dispatched and meet the 90% constraint. We utilize ReEDS to effectively model this 90% clean electricity share, while the main purpose of our simulation in PLEXOS is to evaluate operational feasibility. For this reason, we did not simulate the same 90% clean energy constraint in PLEXOS, which might have required clean energy to bid negative prices in order to get dispatched.
This report suggests that the high-renewables, high-electrification vision of the DRIVE Clean scenario results in a dependable U.S. electricity grid. Importantly, our study does not assume the availability of flexible loads such as “smart” or managed electric vehicle charging or demand response from building loads. These technologies and systems offer additional flexibility to further increase system reliability and efficiency and reduce costs under the DRIVE Clean scenario. Further description of study limitations and a more robust narrative of detailed results can be found in the appendix.
2035 2.0 THE REPORT | 49
ACEA (European Automobile Manufacturers Association). 2020. Joint Statement: The Transition to Zero-Emission Road Freight Transport.
ACP (American Clean Power). 2020. American Clean Power Market Report Q4 2020.
AFDC (Alternative Fuels Data Center). 2021a. Alternative Fueling Station Locator. U.S. Department of Energy, Office of Energy Efficiency and Renewable Energy. Accessed March 18, 2021.
AFDC (Alternative Fuels Data Center). 2021b. U.S. Plug-In Electric Vehicle Sales by Model. U.S. Department of Energy, Office of Energy Efficiency and Renewable Energy. Accessed March 31, 2021.
Akram, Muhammad Nadeem and Walid Abdul-Kader. 2020. EV Battery Recycling and Its Impact on Society. University of Windsor.
ALA (American Lung Association). 2020. State of the Air.
Albanese, Nick. Presentation. June 9, 2020. Electric Vehicle Outlook 2020. Bloomberg New Energy Finance.
Baldwin, Sara, Amanda Myers, Michael O’Boyle, and David Wooley. 2021. Accelerating Clean, Electrified Transportation by 2035: Policy Priorities (A 2035 2.0 Companion Report). Energy Innovation and University of California, Berkeley.
Baker, J.A, H.M. Paulson, M. Feldstein, G.P. Shultz, T. Halstead, T. Stephenson, N.G. Mankiw, and R. Walton. 2019. The Climate Leadership Council Carbon Dividends Plan. Climate Leadership Council.
Benchmark (Benchmark Mineral Intelligence). 2019. Who Is Winning the Global Lithium Ion Battery Arms Race?
BOA (Bank of America Merrill Lynch). 2019. Car Wars 2020-2023…The Rise (and Fall) of the Crossover?
Busch, Chris. 2020. Why Electric Vehicles Will Likely Emerge as California’s Top Manufacturing Export in 2020. Forbes.
CARB (California Air Resources Board). 2017. EMFAC2017 Web Database. Accessed April 2021.
CARB (California Air Resources Board). 2019. Public Hearing to Consider the Proposed Advanced Clean Trucks Regulation. Staff Report: Initial Statement of Reasons.
CARB (California Air Resources Board). 2021. Overview: Diesel Exhaust and Health. Accessed April 2021.
Clack, C.T.M., S.A. Qvist, J. Apt, M. Bazilian, A.R. Brandt, K. Caldeira, S.J.
REFERENCES
2035 2.0 THE REPORT | 50
Davis, V. Diakov, M.A. Handschy, P.D.H. Hines, P. Jaramillo, D.M. Kammen, J.C.S. Long, M. Granger Morgan, A. Reed, V. Sivaram, J. Sweeney, G.R. Tynan, D.G. Victor, J.P. Weyant, and J.F. Whitacre. 2017. Evaluation of a Proposal for Reliable Low-Cost Grid Power with 100% Wind, Water, and Solar. PNAS 114(26): 6722–6727.
Cole, Wesley, Sean Corcoran, Nathaniel Gates, Trieu Mai, and Paritosh Das. 2020. 2020 Standard Scenario Report: A U.S. Electricity Sector Outlook. National Renewable Energy Laboratory.
Colias, Mike. 2021. Inside GM’s Plans to Convert Its Factories for EVs. The Wall Street Journal.
DOE (Department of Energy). Vehicle Weight Classes & Categories. Accessed April 2021.
DOE (U.S. Department of Energy). 2020. Energy Storage Grand Challenge: Energy Storage Market Report. DOE/GO-102020-5497.
EAFO (European Alternative Fuels Observatory). 2020. Normal and High-Power Public Recharging Points. Accessed March 2021.
EEI (Edison Electric Institute). 2021. Presentation. America’s Electric Companies are #Committed2Clean.
EERE (Energy Efficiency and Renewable Energy, Department of Energy). 2020. Cumulative Plug-In Vehicle Sales in the United States Reach 1.6 Million Units.
EERE (Energy Efficiency and Renewable Energy, Department of Energy). 2021. Median Driving Range of All-Electric Vehicles Tops 250 Miles for Model Year 2020.
EIA (U.S. Energy Information Administration). 2018. Major Utilities Continue to Increase Spending on US Electric Distribution Systems.
EIA (U.S. Energy Information Administration). 2021. Annual Energy Outlook 2021.
Energy Innovation. 2021. Energy Policy Solutions, Input-Output Model. Accessed March 2021.
EPA (Environmental Protection Agency). 2021. Greenhouse Gas Inventory Data Explorer. Accessed March 2021.
EVAdoption. 2021. Charging Stats.
Fehrenbacher, Katie. 2021. The Electric Revolution Needs Sustainable Battery Materials. GreenBiz.
Federal Register. 2002. EPA Approved North Carolina Regulations. Vol. 67, No. 153.
FHWA (Federal Highway Administration). 2020. Freight Analysis Framework Database Version 5. Department of Transportation.
FRED (Federal Reserve Bank of St. Louis). 2021. Light Weight Vehicle Sales: Autos and Light Trucks (Alt Sales). Accessed April 2021.
Gersdorf, Thomas, Patrick Hertzke, Patrick Schaufuss, and Stephanie Schenk. 2020. McKinsey Electric Vehicle Index: Europe Cushions a Global Plunge in EV Sales. McKinsey.
Governor Andrew M. Cuomo. Press Release. 2020. Governor Cuomo
2035 2.0 THE REPORT | 51
Announces New York and 14 States and D.C. to Ramp Up Electrification of Buses and Trucks.
Green Car Congress. 2016. CCM: China Li-Ion Industry Booming; Domestic Outputs Triples in 2015 to 15.7 GWh.
Gul, Timur, Araceli Fernandez Pales, and Leonardo Paoli. 2020. Batteries and Hydrogen Technology: Keys for a Clean Energy Future. IEA.
Hagerty, Michael, Sanem Sergici, and Long Lam. 2020. Getting to 20 Million EVs by 2030. Brattle Group.
Holland, S.P., E.T. Mansur, N.Z. Muller, and A.J. Yates. 2019. Decompositions and Policy Consequences of an Extraordinary Decline in Air Pollution from Electricity Generation. Dartmouth College.
ICCT (The International Council on Clean Transportation). 2020. Five Things You Know About EVs That Aren’t Exactly True.
IEA (International Energy Administration). 2020. Global EV Outlook 2020.
Jayadev, G., B.D. Leibowicz, and E. Kutanoglu. 2020. U.S. Electricity Infrastructure of the Future: Generation and Transmission Pathways Through 2050. Applied Energy 260: 114267.
Jin, Lingzhi, Hui He, Hongyang Cui, Nic Lutsey, Chuqi Wu, Yidan Chu, Jin Zhu, Ying Xiong, and Xi Liu. 2021a. Race to Electrify Light-Duty Vehicles in China, The United States, and Europe: A Comparison of Key EV Market Development Indicators. The International Council on Clean Transportation.
Jin, Lingzhi, Hui He, Hongyang Cui, Nic Lutsey, Chuqi Wu, Yidan Chu, Jin Zhu, Ying Xiong, and Xi Liu. 2021b. Driving a Green Future: A Retrospective Review of China’s Electric Vehicle Development and Outlook for the Future. The International Council on Clean Transportation.
Kodjak, Drew. 2015. Policies to Reduce Fuel Consumption, Air Pollution, and Carbon Emissions from Vehicles in G20 Nations. The International Council on Clean Transportation.
Kontou, Eleftheria, Marc Melaina, and Aaron Brooker. 2018. Light-Duty Vehicle Attribute Projections (Years 2015-2030). National Renewable Energy Laboratory.
Lasley, Shane. 2020. Strategic Metals Firepower for Pentagon. MetalTech News.
Lutsey, Nic, and Michael Nicholas. 2019. Update on Electric Vehicle Costs in the United States through 2030. The International Council on Clean Transportation.
Lynch, David. 2021. Biden Orders Sweeping Review of U.S. Supply Chain Weak Spots. The Washington Post.
McKerracher, Colin, Dr. Ali Izadi-Najafabadi, Aleksandra O’Donovan, Nick Albanese, Dr. Nikola Soulopolous, David Doherty, Milo Boers, Ryan Fisher, Corey Cantor, Dr. James Frith, Siyi Mi, Andrew Grant, Alejandro Zamorano-Cadavid, Allen Tom Abraham, Kwasi Ampofo, Nannan Kou, Will Edmonds, Dr. Ian Berryman, Josh Landess, and Jinghong Lyu. 2021.
2035 2.0 THE REPORT | 52
Electric Vehicle Outlook 2020. BNEF (Bloomberg New Energy Finance).
McLane, Ross, and Qiyu Liu. 2021. What China Can Teach the US About EV Fast-Charging Rollouts. GreenBiz.
MJB&A. 2020. Electric Vehicle Market Status – Update: Manufacturer Commitments to Future Electric Mobility in the U.S. and Worldwide.
Mufson, Steven. 2021. Auto Industry Peers into an Electric Future and Sees Bumps Ahead. The Washington Post.
Murtaugh, Dan. 2021. China Blows Past Clean Energy Record With Wind Capacity Jump. Bloomberg New Energy Finance.
Murphy, Caitlin, Trieu Mai, Yinong Sun, Paige Jadun, Matteo Muratori, Brent Nelson, and Ryan Jones. 2021. Electrification Futures Study: Scenarios of Power System Evolution and Infrastructure Development for the United States. Golden, CO: National Renewable Energy Laboratory. NREL/TP-6A20-72330.
Myers, Amanda. 2019. The Capital Stock Turnover Problem for 100% Clean Energy Targets. Greentech Media.
NREL (National Renewable Energy Laboratory). 2012. Renewable Electricity Futures Study. NREL.
NREL (National Renewable Energy Laboratory). 2019. Annual Technology Baseline.
NREL (National Renewable Energy Laboratory). 2020. NREL-Hosted Event Supports Industry Development of Megawatt Charging System Connectors.
NS Energy. 2020. Where Are Tesla’s Factories Based? Including Elon Musk’s Gigafactories in Shanghai and Berlin.
Orvis, Robbie. 2021. A 1.5 Celsius Pathway to Climate Leadership for the United States. Energy Innovation.
Phadke, Amol, Umed Paliwal, Nikit Abhyankar, Taylor McNair, Ben Paulos, David Wooley, Ric O’Connell. 2020. 2035 Report: Plummeting Solar, Wind and Battery Costs Can Accelerate Our Clean Electricity Future. Goldman School of Public Policy, University of California Berkeley.
Phadke, Amol, Aditya Khandekar, Nikit Abhyankar, David Wooley, Deepak Rajagopal. 2021. Why Regional and Long-Haul Trucks are Primed for Electrification Now. Lawrence Berkeley National Laboratory.
Raja, James. 2021. Webinar Presentation. Electric Truck Future is Here.
Reichmuth, David. 2019. Inequitable Exposure to Air Pollution from Vehicles in California (2019). Union of Concerned Scientists.
Ricke, K., L. Drouet, K. Caldeira, and M. Tavoni. 2018. Country-Level Social Cost of Carbon. Nature Climate Change 8: 895–900.
SEIA (Solar Energy Industries Association). 2021. U.S. Solar Market Insight.
Sharpe, Ben, Claire Buysee, Jason Mathers, Victor Poudelet. 2020. Race to Zero: How Manufacturers are Positioned for Zero Emission Commercial Trucks and Buses in North America. EDF (Environmental Defense Fund), The International Council on Clean Transportation
2035 2.0 THE REPORT | 53
(ICCT), and Propulsion Québec.
Slowik, Peter, Nic Lutsey, and Chih-Wei Hsu. 2020. How Technology, Recycling, and Policy Can Mitigate Supply Risks to the Long-Term Transition to Zero-Emission Vehicles. The International Council on Clean Transportation.
Smith, David, Ron Graves, Burak Ozpineci, P.T. Jones, Jason Lustbader, Ken Kelly, Kevin Walkowicz, Alicia Birky, Grant Payne, Cory Sigler, Jeff Mosbacher. 2019. Medium- and Heavy-Duty Vehicle Electrification: An Assessment of Technology and Knowledge Gaps. Oak Ridge National Laboratory. ORNL/SPR-2020/7.
Thakrar et al. 2020. Reducing Mortality from Air Pollution in the United States by Targeting Specific Emission Sources. 2020 , Environ. Sci. Technol. Lett. 2020, 7, 9, 639–645.
Thind, M.P.S., C.W. Tessum, I.L. Azevedo, and J.D. Marshall. 2019. Fine Particulate Air Pollution from Electricity Generation in the US: Health Impacts by Race, Income, and Geography. Environmental Science & Technology 53(23): 14010–14019.
Toth, Jacqueline. 2019. For Widespread Adoption of Electric Vehicles, Many Roadblocks Ahead. Morning Consult.
United Nations. 2008. International Standard Industrial Classification of All Economic Activities, Revision 4. ST/ESA/STAT/SER.M/4/Rev.4.
Yang, Zifei, Peter Slowik, Nic Lutsey, and Stephanie Searle. 2016. Principles for Effective Electric Vehicle Incentive Design. The International Council on Clean Transportation.
ZETA (Zero Emission Transportation Association). 2021.
2035 2.0 THE REPORT | 54