Embed Size (px)
Citation preview
Colorado Department of Transportation 2035 Control Totals
December 14, 2006
Prepared by the Office of Financial Management and Budget
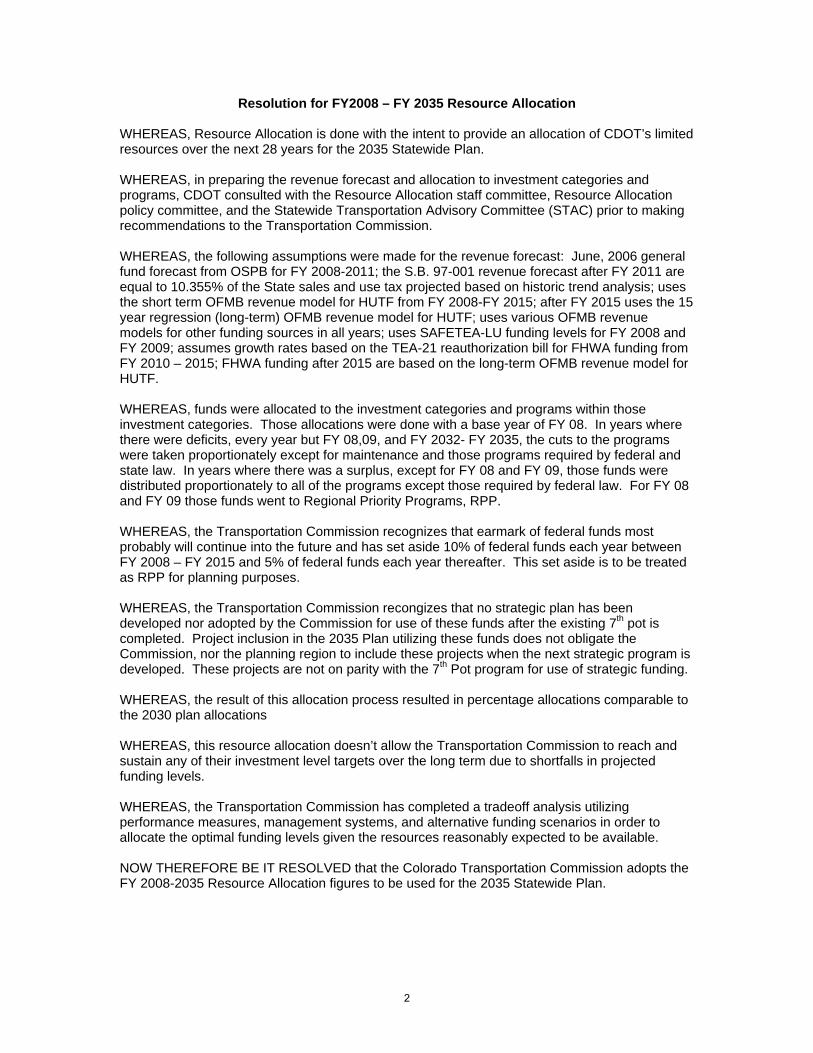
Resolution for FY2008 – FY 2035 Resource Allocation WHEREAS, Resource Allocation is done with the intent to provide an allocation of CDOT’s limited resources over the next 28 years for the 2035 Statewide Plan. WHEREAS, in preparing the revenue forecast and allocation to investment categories and programs, CDOT consulted with the Resource Allocation staff committee, Resource Allocation policy committee, and the Statewide Transportation Advisory Committee (STAC) prior to making recommendations to the Transportation Commission. WHEREAS, the following assumptions were made for the revenue forecast: June, 2006 general fund forecast from OSPB for FY 2008-2011; the S.B. 97-001 revenue forecast after FY 2011 are equal to 10.355% of the State sales and use tax projected based on historic trend analysis; uses the short term OFMB revenue model for HUTF from FY 2008-FY 2015; after FY 2015 uses the 15 year regression (long-term) OFMB revenue model for HUTF; uses various OFMB revenue models for other funding sources in all years; uses SAFETEA-LU funding levels for FY 2008 and FY 2009; assumes growth rates based on the TEA-21 reauthorization bill for FHWA funding from FY 2010 – 2015; FHWA funding after 2015 are based on the long-term OFMB revenue model for HUTF. WHEREAS, funds were allocated to the investment categories and programs within those investment categories. Those allocations were done with a base year of FY 08. In years where there were deficits, every year but FY 08,09, and FY 2032- FY 2035, the cuts to the programs were taken proportionately except for maintenance and those programs required by federal and state law. In years where there was a surplus, except for FY 08 and FY 09, those funds were distributed proportionately to all of the programs except those required by federal law. For FY 08 and FY 09 those funds went to Regional Priority Programs, RPP. WHEREAS, the Transportation Commission recognizes that earmark of federal funds most probably will continue into the future and has set aside 10% of federal funds each year between FY 2008 – FY 2015 and 5% of federal funds each year thereafter. This set aside is to be treated as RPP for planning purposes. WHEREAS, the Transportation Commission recongizes that no strategic plan has been developed nor adopted by the Commission for use of these funds after the existing 7th pot is completed. Project inclusion in the 2035 Plan utilizing these funds does not obligate the Commission, nor the planning region to include these projects when the next strategic program is developed. These projects are not on parity with the 7th Pot program for use of strategic funding. WHEREAS, the result of this allocation process resulted in percentage allocations comparable to the 2030 plan allocations WHEREAS, this resource allocation doesn’t allow the Transportation Commission to reach and sustain any of their investment level targets over the long term due to shortfalls in projected funding levels. WHEREAS, the Transportation Commission has completed a tradeoff analysis utilizing performance measures, management systems, and alternative funding scenarios in order to allocate the optimal funding levels given the resources reasonably expected to be available. NOW THEREFORE BE IT RESOLVED that the Colorado Transportation Commission adopts the FY 2008-2035 Resource Allocation figures to be used for the 2035 Statewide Plan.
2
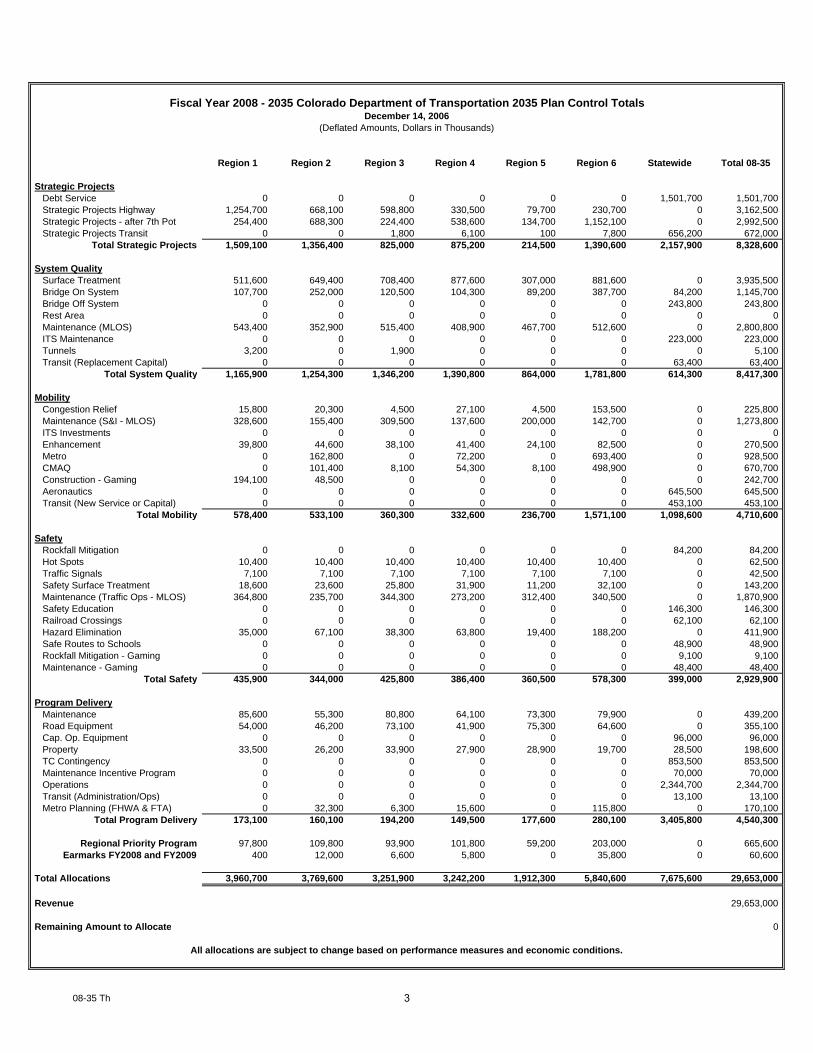
Region 1 Region 2 Region 3 Region 4 Region 5 Region 6 Statewide Total 08-35
Strategic ProjectsDebt Service 0 0 0 0 0 0 1,501,700 1,501,700Strategic Projects Highway 1,254,700 668,100 598,800 330,500 79,700 230,700 0 3,162,500Strategic Projects - after 7th Pot 254,400 688,300 224,400 538,600 134,700 1,152,100 0 2,992,500Strategic Projects Transit 0 0 1,800 6,100 100 7,800 656,200 672,000
Total Strategic Projects 1,509,100 1,356,400 825,000 875,200 214,500 1,390,600 2,157,900 8,328,600
System QualitySurface Treatment 511,600 649,400 708,400 877,600 307,000 881,600 0 3,935,500Bridge On System 107,700 252,000 120,500 104,300 89,200 387,700 84,200 1,145,700Bridge Off System 0 0 0 0 0 0 243,800 243,800Rest Area 0 0 0 0 0 0 0 0Maintenance (MLOS) 543,400 352,900 515,400 408,900 467,700 512,600 0 2,800,800ITS Maintenance 0 0 0 0 0 0 223,000 223,000Tunnels 3,200 0 1,900 0 0 0 0 5,100Transit (Replacement Capital) 0 0 0 0 0 0 63,400 63,400
Total System Quality 1,165,900 1,254,300 1,346,200 1,390,800 864,000 1,781,800 614,300 8,417,300
MobilityCongestion Relief 15,800 20,300 4,500 27,100 4,500 153,500 0 225,800Maintenance (S&I - MLOS) 328,600 155,400 309,500 137,600 200,000 142,700 0 1,273,800ITS Investments 0 0 0 0 0 0 0 0Enhancement 39,800 44,600 38,100 41,400 24,100 82,500 0 270,500Metro 0 162,800 0 72,200 0 693,400 0 928,500CMAQ 0 101,400 8,100 54,300 8,100 498,900 0 670,700Construction - Gaming 194,100 48,500 0 0 0 0 0 242,700Aeronautics 0 0 0 0 0 0 645,500 645,500Transit (New Service or Capital) 0 0 0 0 0 0 453,100 453,100
Total Mobility 578,400 533,100 360,300 332,600 236,700 1,571,100 1,098,600 4,710,600
SafetyRockfall Mitigation 0 0 0 0 0 0 84,200 84,200Hot Spots 10,400 10,400 10,400 10,400 10,400 10,400 0 62,500Traffic Signals 7,100 7,100 7,100 7,100 7,100 7,100 0 42,500Safety Surface Treatment 18,600 23,600 25,800 31,900 11,200 32,100 0 143,200
Maintenance (Traffic Ops - MLOS) 364,800 235,700 344,300 273,200 312,400 340,500 0 1,870,900Safety Education 0 0 0 0 0 0 146,300 146,300Railroad Crossings 0 0 0 0 0 0 62,100 62,100Hazard Elimination 35,000 67,100 38,300 63,800 19,400 188,200 0 411,900Safe Routes to Schools 0 0 0 0 0 0 48,900 48,900Rockfall Mitigation - Gaming 0 0 0 0 0 0 9,100 9,100Maintenance - Gaming 0 0 0 0 0 0 48,400 48,400
Total Safety 435,900 344,000 425,800 386,400 360,500 578,300 399,000 2,929,900
Program DeliveryMaintenance 85,600 55,300 80,800 64,100 73,300 79,900 0 439,200Road Equipment 54,000 46,200 73,100 41,900 75,300 64,600 0 355,100Cap. Op. Equipment 0 0 0 0 0 0 96,000 96,000Property 33,500 26,200 33,900 27,900 28,900 19,700 28,500 198,600TC Contingency 0 0 0 0 0 0 853,500 853,500Maintenance Incentive Program 0 0 0 0 0 0 70,000 70,000Operations 0 0 0 0 0 0 2,344,700 2,344,700Transit (Administration/Ops) 0 0 0 0 0 0 13,100 13,100Metro Planning (FHWA & FTA) 0 32,300 6,300 15,600 0 115,800 0 170,100
Total Program Delivery 173,100 160,100 194,200 149,500 177,600 280,100 3,405,800 4,540,300
Regional Priority Program 97,800 109,800 93,900 101,800 59,200 203,000 0 665,600Earmarks FY2008 and FY2009 400 12,000 6,600 5,800 0 35,800 0 60,600
Total Allocations 3,960,700 3,769,600 3,251,900 3,242,200 1,912,300 5,840,600 7,675,600 29,653,000
Revenue 29,653,000
Remaining Amount to Allocate 0
All allocations are subject to change based on performance measures and economic conditions.
Fiscal Year 2008 - 2035 Colorado Department of Transportation 2035 Plan Control TotalsDecember 14, 2006
(Deflated Amounts, Dollars in Thousands)
08-35 Th 3
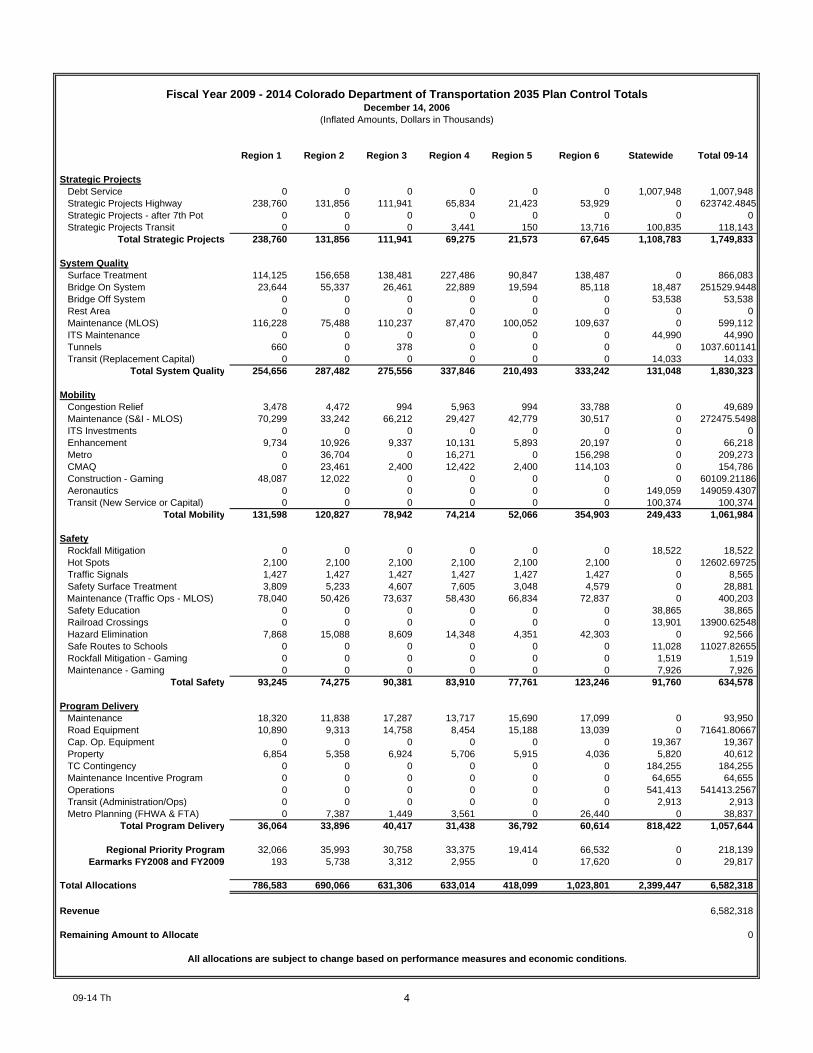
Region 1 Region 2 Region 3 Region 4 Region 5 Region 6 Statewide Total 09-14
Strategic ProjectsDebt Service 0 0 0 0 0 0 1,007,948 1,007,948 Strategic Projects Highway 238,760 131,856 111,941 65,834 21,423 53,929 0 623742.4845Strategic Projects - after 7th Pot 0 0 0 0 0 0 0 0Strategic Projects Transit 0 0 0 3,441 150 13,716 100,835 118,143
Total Strategic Projects 238,760 131,856 111,941 69,275 21,573 67,645 1,108,783 1,749,833
System QualitySurface Treatment 114,125 156,658 138,481 227,486 90,847 138,487 0 866,083 Bridge On System 23,644 55,337 26,461 22,889 19,594 85,118 18,487 251529.9448Bridge Off System 0 0 0 0 0 0 53,538 53,538Rest Area 0 0 0 0 0 0 0 0Maintenance (MLOS) 116,228 75,488 110,237 87,470 100,052 109,637 0 599,112ITS Maintenance 0 0 0 0 0 0 44,990 44,990Tunnels 660 0 378 0 0 0 0 1037.601141Transit (Replacement Capital) 0 0 0 0 0 0 14,033 14,033
Total System Quality 254,656 287,482 275,556 337,846 210,493 333,242 131,048 1,830,323
MobilityCongestion Relief 3,478 4,472 994 5,963 994 33,788 0 49,689 Maintenance (S&I - MLOS) 70,299 33,242 66,212 29,427 42,779 30,517 0 272475.5498ITS Investments 0 0 0 0 0 0 0 0Enhancement 9,734 10,926 9,337 10,131 5,893 20,197 0 66,218Metro 0 36,704 0 16,271 0 156,298 0 209,273CMAQ 0 23,461 2,400 12,422 2,400 114,103 0 154,786Construction - Gaming 48,087 12,022 0 0 0 0 0 60109.21186Aeronautics 0 0 0 0 0 0 149,059 149059.4307Transit (New Service or Capital) 0 0 0 0 0 0 100,374 100,374
Total Mobility 131,598 120,827 78,942 74,214 52,066 354,903 249,433 1,061,984
SafetyRockfall Mitigation 0 0 0 0 0 0 18,522 18,522 Hot Spots 2,100 2,100 2,100 2,100 2,100 2,100 0 12602.69725Traffic Signals 1,427 1,427 1,427 1,427 1,427 1,427 0 8,565Safety Surface Treatment 3,809 5,233 4,607 7,605 3,048 4,579 0 28,881
Maintenance (Traffic Ops - MLOS) 78,040 50,426 73,637 58,430 66,834 72,837 0 400,203Safety Education 0 0 0 0 0 0 38,865 38,865Railroad Crossings 0 0 0 0 0 0 13,901 13900.62548Hazard Elimination 7,868 15,088 8,609 14,348 4,351 42,303 0 92,566 Safe Routes to Schools 0 0 0 0 0 0 11,028 11027.82655Rockfall Mitigation - Gaming 0 0 0 0 0 0 1,519 1,519Maintenance - Gaming 0 0 0 0 0 0 7,926 7,926
Total Safety 93,245 74,275 90,381 83,910 77,761 123,246 91,760 634,578
Program DeliveryMaintenance 18,320 11,838 17,287 13,717 15,690 17,099 0 93,950 Road Equipment 10,890 9,313 14,758 8,454 15,188 13,039 0 71641.80667Cap. Op. Equipment 0 0 0 0 0 0 19,367 19,367Property 6,854 5,358 6,924 5,706 5,915 4,036 5,820 40,612TC Contingency 0 0 0 0 0 0 184,255 184,255Maintenance Incentive Program 0 0 0 0 0 0 64,655 64,655Operations 0 0 0 0 0 0 541,413 541413.2567Transit (Administration/Ops) 0 0 0 0 0 0 2,913 2,913 Metro Planning (FHWA & FTA) 0 7,387 1,449 3,561 0 26,440 0 38,837
Total Program Delivery 36,064 33,896 40,417 31,438 36,792 60,614 818,422 1,057,644
Regional Priority Program 32,066 35,993 30,758 33,375 19,414 66,532 0 218,139Earmarks FY2008 and FY2009 193 5,738 3,312 2,955 0 17,620 0 29,817
Total Allocations 786,583 690,066 631,306 633,014 418,099 1,023,801 2,399,447 6,582,318
Revenue 6,582,318
Remaining Amount to Allocate 0
All allocations are subject to change based on performance measures and economic conditions.
Fiscal Year 2009 - 2014 Colorado Department of Transportation 2035 Plan Control TotalsDecember 14, 2006
(Inflated Amounts, Dollars in Thousands)
09-14 Th 4

Region 1 Region 2 Region 3 Region 4 Region 5 Region 6 Statewide Total 2008
Strategic ProjectsDebt Service 0 0 0 0 0 0 167,989 167,989Strategic Projects Highway 4,911 7,084 0 4,224 6,520 13,300 0 36,040Strategic Projects - after 7th Pot 0 0 0 0 0 0 0 0Strategic Projects Transit 0 0 3,221 7,279 0 0 73 10,573
Total Strategic Projects 4,911 7,084 3,221 11,502 6,520 13,300 168,062 214,602
System QualitySurface Treatment 22,192 28,467 24,028 39,792 16,223 22,345 0 153,047Bridge On System 3,672 8,595 4,110 3,555 3,043 13,221 2,872 39,068Bridge Off System 0 0 0 0 0 0 8,511 8,511Rest Area 0 0 0 0 0 0 0 0Maintenance (MLOS) 17,977 11,676 17,050 13,529 15,475 16,957 0 92,663ITS Maintenance 0 0 0 0 0 0 8,672 8,672Tunnels 200 0 0 0 0 0 0 200Transit (Replacement Capital) 0 0 0 0 0 0 2,004 2,004
Total System Quality 44,041 48,737 45,188 56,876 34,741 52,523 22,058 304,165
MobilityCongestion Relief 615 790 176 1,054 176 5,971 0 8,781Maintenance (S&I - MLOS) 10,873 5,141 10,241 4,551 6,616 4,720 0 42,143ITS Investments 0 0 0 0 0 0 0 0Enhancement 1,541 1,729 1,478 1,603 933 3,196 0 10,480Metro 0 7,265 0 3,220 0 30,935 0 41,420CMAQ 0 5,024 400 2,692 400 24,727 0 33,243Construction - Gaming 10,546 2,637 0 0 0 0 0 13,183Aeronautics 0 0 0 0 0 0 23,055 23,055Transit (New Service or Capital) 0 0 0 0 0 0 14,239 14,239
Total Mobility 23,575 22,586 12,294 13,121 8,125 69,549 37,293 186,542
SafetyRockfall Mitigation 0 0 0 0 0 0 3,273 3,273Hot Spots 405 405 405 405 405 405 0 2,429Traffic Signals 275 275 275 275 275 275 0 1,651Safety Surface Treatment 802 1,035 874 1,453 590 813 0 5,567
Maintenance (Traffic Ops - MLOS) 12,070 7,799 11,389 9,037 10,337 11,265 0 61,898Safety Education 0 0 0 0 0 0 6,444 6,444Railroad Crossings 0 0 0 0 0 0 2,328 2,328Hazard Elimination 1,385 2,657 1,516 2,526 766 7,448 0 16,299Safe Routes to Schools 0 0 0 0 0 0 1,477 1,477Rockfall Mitigation - Gaming 0 0 0 0 0 0 0 0Maintenance - Gaming 0 0 0 0 0 0 1,110 1,110
Total Safety 14,937 12,171 14,459 13,696 12,373 20,207 14,633 102,476
Program DeliveryMaintenance 2,834 1,831 2,674 2,122 2,427 2,645 0 14,531Road Equipment 2,099 1,795 2,845 1,629 2,928 2,513 0 13,809Cap. Op. Equipment 0 0 0 0 0 0 3,733 3,733Property 1,291 1,009 1,304 1,075 1,114 760 1,096 7,649TC Contingency 0 0 0 0 0 0 35,381 35,381Maintenance Incentive Program 0 0 0 0 0 0 10,000 10,000Operations 0 0 0 0 0 0 83,739 83,739Transit (Administration/Ops) 0 0 0 0 0 0 412 412Metro Planning (FHWA & FTA) 0 1,411 277 680 0 5,050 0 7,417
Total Program Delivery 6,223 6,046 7,099 5,506 6,468 10,968 134,360 176,670
Regional Priority Program 4,152 4,661 3,983 4,322 2,514 8,616 0 28,248Earmarks FY2008 and FY2009 242 6,414 3,352 2,955 0 18,649 0 31,611
Total Allocations 98,081 107,700 89,597 107,978 70,741 193,811 376,407 1,044,316
Revenue 1,044,316
Remaining Amount to Allocate 0
All allocations are subject to change based on performance measures and economic conditions.
Fiscal Year 2008 Colorado Department of Transportation 2035 Plan Control TotalsDecember 14, 2006
(Inflated Amounts, Dollars in Thousands)
2008 Th 5
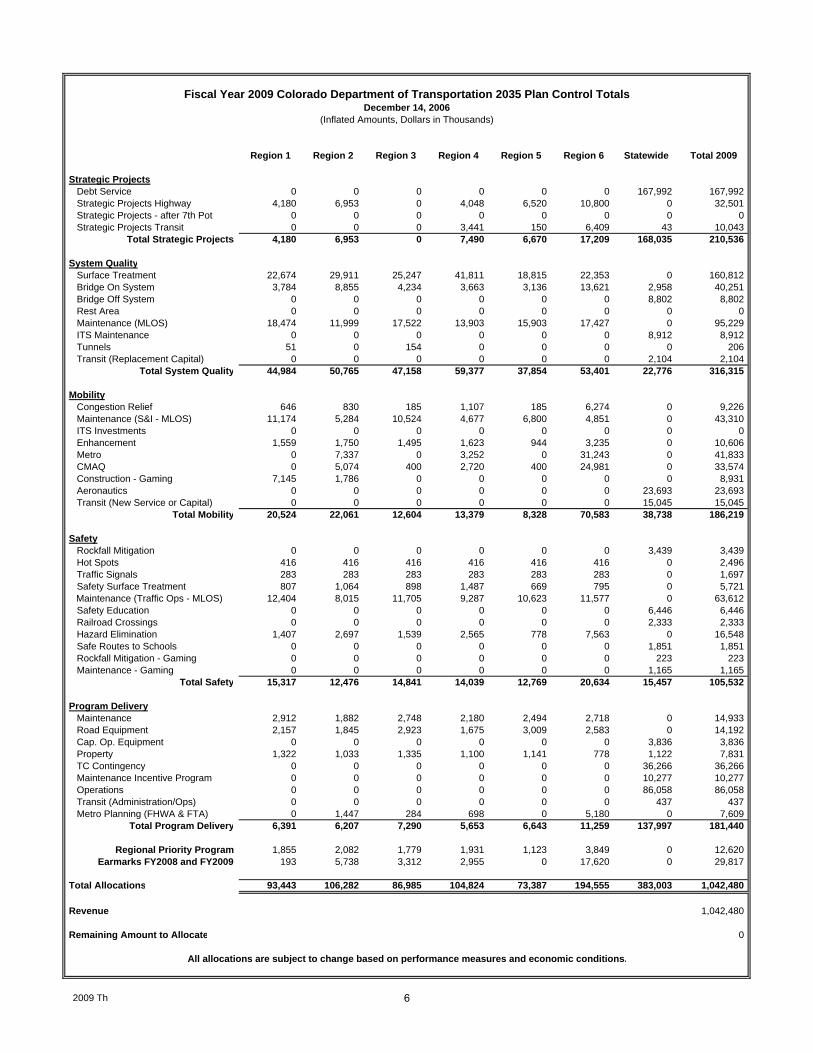
Region 1 Region 2 Region 3 Region 4 Region 5 Region 6 Statewide Total 2009
Strategic ProjectsDebt Service 0 0 0 0 0 0 167,992 167,992Strategic Projects Highway 4,180 6,953 0 4,048 6,520 10,800 0 32,501Strategic Projects - after 7th Pot 0 0 0 0 0 0 0 0Strategic Projects Transit 0 0 0 3,441 150 6,409 43 10,043
Total Strategic Projects 4,180 6,953 0 7,490 6,670 17,209 168,035 210,536
System QualitySurface Treatment 22,674 29,911 25,247 41,811 18,815 22,353 0 160,812Bridge On System 3,784 8,855 4,234 3,663 3,136 13,621 2,958 40,251Bridge Off System 0 0 0 0 0 0 8,802 8,802Rest Area 0 0 0 0 0 0 0 0Maintenance (MLOS) 18,474 11,999 17,522 13,903 15,903 17,427 0 95,229ITS Maintenance 0 0 0 0 0 0 8,912 8,912Tunnels 51 0 154 0 0 0 0 206Transit (Replacement Capital) 0 0 0 0 0 0 2,104 2,104
Total System Quality 44,984 50,765 47,158 59,377 37,854 53,401 22,776 316,315
MobilityCongestion Relief 646 830 185 1,107 185 6,274 0 9,226Maintenance (S&I - MLOS) 11,174 5,284 10,524 4,677 6,800 4,851 0 43,310ITS Investments 0 0 0 0 0 0 0 0Enhancement 1,559 1,750 1,495 1,623 944 3,235 0 10,606Metro 0 7,337 0 3,252 0 31,243 0 41,833CMAQ 0 5,074 400 2,720 400 24,981 0 33,574Construction - Gaming 7,145 1,786 0 0 0 0 0 8,931Aeronautics 0 0 0 0 0 0 23,693 23,693Transit (New Service or Capital) 0 0 0 0 0 0 15,045 15,045
Total Mobility 20,524 22,061 12,604 13,379 8,328 70,583 38,738 186,219
SafetyRockfall Mitigation 0 0 0 0 0 0 3,439 3,439Hot Spots 416 416 416 416 416 416 0 2,496Traffic Signals 283 283 283 283 283 283 0 1,697Safety Surface Treatment 807 1,064 898 1,487 669 795 0 5,721
Maintenance (Traffic Ops - MLOS) 12,404 8,015 11,705 9,287 10,623 11,577 0 63,612Safety Education 0 0 0 0 0 0 6,446 6,446Railroad Crossings 0 0 0 0 0 0 2,333 2,333Hazard Elimination 1,407 2,697 1,539 2,565 778 7,563 0 16,548Safe Routes to Schools 0 0 0 0 0 0 1,851 1,851Rockfall Mitigation - Gaming 0 0 0 0 0 0 223 223Maintenance - Gaming 0 0 0 0 0 0 1,165 1,165
Total Safety 15,317 12,476 14,841 14,039 12,769 20,634 15,457 105,532
Program DeliveryMaintenance 2,912 1,882 2,748 2,180 2,494 2,718 0 14,933Road Equipment 2,157 1,845 2,923 1,675 3,009 2,583 0 14,192Cap. Op. Equipment 0 0 0 0 0 0 3,836 3,836Property 1,322 1,033 1,335 1,100 1,141 778 1,122 7,831TC Contingency 0 0 0 0 0 0 36,266 36,266Maintenance Incentive Program 0 0 0 0 0 0 10,277 10,277Operations 0 0 0 0 0 0 86,058 86,058Transit (Administration/Ops) 0 0 0 0 0 0 437 437Metro Planning (FHWA & FTA) 0 1,447 284 698 0 5,180 0 7,609
Total Program Delivery 6,391 6,207 7,290 5,653 6,643 11,259 137,997 181,440
Regional Priority Program 1,855 2,082 1,779 1,931 1,123 3,849 0 12,620Earmarks FY2008 and FY2009 193 5,738 3,312 2,955 0 17,620 0 29,817
Total Allocations 93,443 106,282 86,985 104,824 73,387 194,555 383,003 1,042,480
Revenue 1,042,480
Remaining Amount to Allocate 0
All allocations are subject to change based on performance measures and economic conditions.
Fiscal Year 2009 Colorado Department of Transportation 2035 Plan Control TotalsDecember 14, 2006
(Inflated Amounts, Dollars in Thousands)
2009 Th 6

Region 1 Region 2 Region 3 Region 4 Region 5 Region 6 Statewide Total 2010
Strategic ProjectsDebt Service 0 0 0 0 0 0 167,991 167,991Strategic Projects Highway 517 275 247 136 33 95 0 1,304Strategic Projects - after 7th Pot 0 0 0 0 0 0 0 0Strategic Projects Transit 0 0 0 0 0 7,307 3,137 10,444
Total Strategic Projects 517 275 247 136 33 7,403 171,128 179,739
System QualitySurface Treatment 18,021 26,535 21,569 40,583 17,170 18,021 0 141,900Bridge On System 3,732 8,735 4,177 3,613 3,093 13,436 2,918 39,704Bridge Off System 0 0 0 0 0 0 8,506 8,506Rest Area 0 0 0 0 0 0 0 0Maintenance (MLOS) 18,999 12,339 18,019 14,298 16,354 17,921 0 97,931ITS Maintenance 0 0 0 0 0 0 7,699 7,699Tunnels 178 0 0 0 0 0 0 178Transit (Replacement Capital) 0 0 0 0 0 0 2,155 2,155
Total System Quality 40,930 47,609 43,765 58,494 36,617 49,378 21,278 298,071
MobilityCongestion Relief 570 733 163 977 163 5,536 0 8,141Maintenance (S&I - MLOS) 11,491 5,434 10,823 4,810 6,993 4,988 0 44,539ITS Investments 0 0 0 0 0 0 0 0Enhancement 1,634 1,834 1,567 1,701 989 3,391 0 11,117Metro 0 5,180 0 2,296 0 22,058 0 29,534CMAQ 0 3,298 400 1,729 400 15,880 0 21,707Construction - Gaming 7,505 1,876 0 0 0 0 0 9,382Aeronautics 0 0 0 0 0 0 24,365 24,365Transit (New Service or Capital) 0 0 0 0 0 0 15,412 15,412
Total Mobility 21,200 18,355 12,953 11,513 8,545 51,853 39,777 164,196
SafetyRockfall Mitigation 0 0 0 0 0 0 3,035 3,035Hot Spots 359 359 359 359 359 359 0 2,157Traffic Signals 244 244 244 244 244 244 0 1,466Safety Surface Treatment 628 924 751 1,414 598 628 0 4,942
Maintenance (Traffic Ops - MLOS) 12,756 8,243 12,037 9,551 10,925 11,906 0 65,417Safety Education 0 0 0 0 0 0 6,472 6,472Railroad Crossings 0 0 0 0 0 0 2,088 2,088Hazard Elimination 1,157 2,218 1,265 2,109 639 6,218 0 13,606Safe Routes to Schools 0 0 0 0 0 0 1,657 1,657Rockfall Mitigation - Gaming 0 0 0 0 0 0 234 234Maintenance - Gaming 0 0 0 0 0 0 1,224 1,224
Total Safety 15,144 11,988 14,657 13,677 12,766 19,355 14,709 102,297
Program DeliveryMaintenance 2,995 1,935 2,826 2,242 2,565 2,795 0 15,357Road Equipment 1,863 1,594 2,525 1,447 2,599 2,231 0 12,260Cap. Op. Equipment 0 0 0 0 0 0 3,314 3,314Property 1,166 912 1,178 971 1,006 687 990 6,911TC Contingency 0 0 0 0 0 0 30,837 30,837Maintenance Incentive Program 0 0 0 0 0 0 10,569 10,569Operations 0 0 0 0 0 0 88,499 88,499Transit (Administration/Ops) 0 0 0 0 0 0 447 447Metro Planning (FHWA & FTA) 0 1,073 210 517 0 3,840 0 5,640
Total Program Delivery 6,024 5,513 6,740 5,177 6,170 9,553 134,657 173,834
Regional Priority Program 5,464 6,133 5,241 5,687 3,308 11,337 0 37,172
Total Allocations 89,280 89,875 83,603 94,685 67,439 148,879 381,549 955,310
Revenue 955,310
Remaining Amount to Allocate 0
All allocations are subject to change based on performance measures and economic conditions.
Fiscal Year 2010 Colorado Department of Transportation 2035 Plan Control TotalsDecember 14, 2006
(Inflated Amounts, Dollars in Thousands)
2010 Th 7
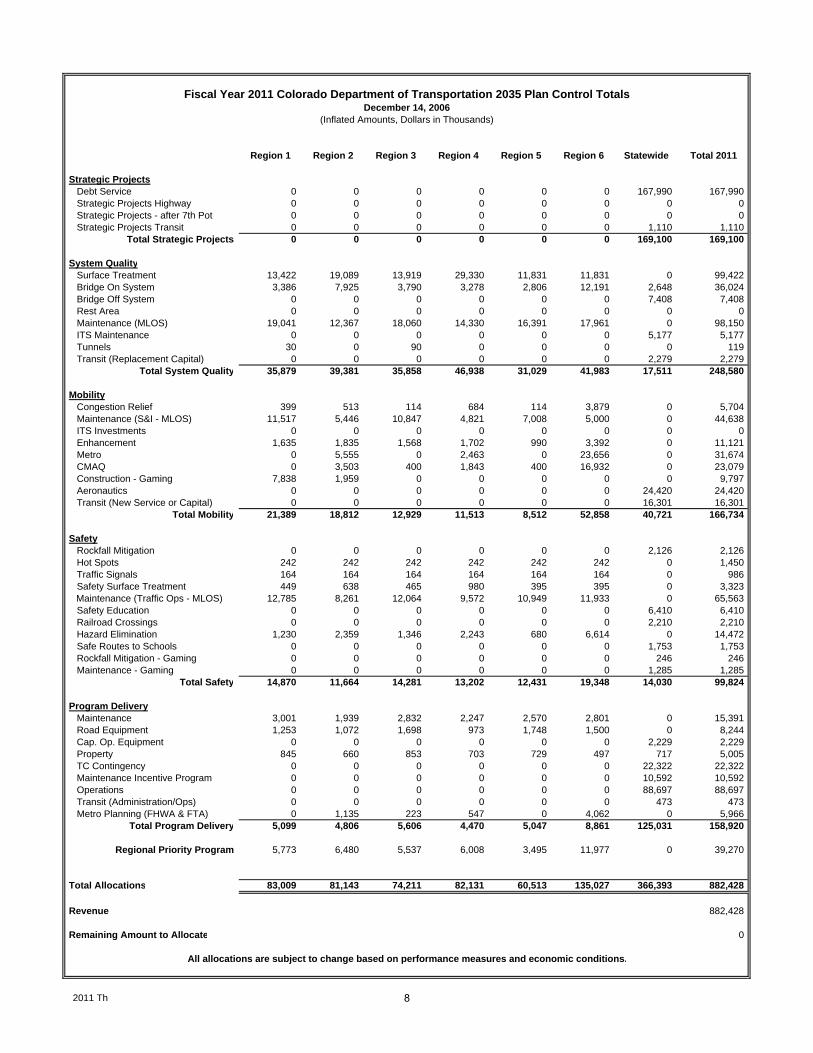
Region 1 Region 2 Region 3 Region 4 Region 5 Region 6 Statewide Total 2011
Strategic ProjectsDebt Service 0 0 0 0 0 0 167,990 167,990Strategic Projects Highway 0 0 0 0 0 0 0 0Strategic Projects - after 7th Pot 0 0 0 0 0 0 0 0Strategic Projects Transit 0 0 0 0 0 0 1,110 1,110
Total Strategic Projects 0 0 0 0 0 0 169,100 169,100
System QualitySurface Treatment 13,422 19,089 13,919 29,330 11,831 11,831 0 99,422Bridge On System 3,386 7,925 3,790 3,278 2,806 12,191 2,648 36,024Bridge Off System 0 0 0 0 0 0 7,408 7,408Rest Area 0 0 0 0 0 0 0 0Maintenance (MLOS) 19,041 12,367 18,060 14,330 16,391 17,961 0 98,150ITS Maintenance 0 0 0 0 0 0 5,177 5,177Tunnels 30 0 90 0 0 0 0 119Transit (Replacement Capital) 0 0 0 0 0 0 2,279 2,279
Total System Quality 35,879 39,381 35,858 46,938 31,029 41,983 17,511 248,580
MobilityCongestion Relief 399 513 114 684 114 3,879 0 5,704Maintenance (S&I - MLOS) 11,517 5,446 10,847 4,821 7,008 5,000 0 44,638ITS Investments 0 0 0 0 0 0 0 0Enhancement 1,635 1,835 1,568 1,702 990 3,392 0 11,121Metro 0 5,555 0 2,463 0 23,656 0 31,674CMAQ 0 3,503 400 1,843 400 16,932 0 23,079Construction - Gaming 7,838 1,959 0 0 0 0 0 9,797Aeronautics 0 0 0 0 0 0 24,420 24,420Transit (New Service or Capital) 0 0 0 0 0 0 16,301 16,301
Total Mobility 21,389 18,812 12,929 11,513 8,512 52,858 40,721 166,734
SafetyRockfall Mitigation 0 0 0 0 0 0 2,126 2,126Hot Spots 242 242 242 242 242 242 0 1,450Traffic Signals 164 164 164 164 164 164 0 986Safety Surface Treatment 449 638 465 980 395 395 0 3,323
Maintenance (Traffic Ops - MLOS) 12,785 8,261 12,064 9,572 10,949 11,933 0 65,563Safety Education 0 0 0 0 0 0 6,410 6,410Railroad Crossings 0 0 0 0 0 0 2,210 2,210Hazard Elimination 1,230 2,359 1,346 2,243 680 6,614 0 14,472Safe Routes to Schools 0 0 0 0 0 0 1,753 1,753Rockfall Mitigation - Gaming 0 0 0 0 0 0 246 246Maintenance - Gaming 0 0 0 0 0 0 1,285 1,285
Total Safety 14,870 11,664 14,281 13,202 12,431 19,348 14,030 99,824
Program DeliveryMaintenance 3,001 1,939 2,832 2,247 2,570 2,801 0 15,391Road Equipment 1,253 1,072 1,698 973 1,748 1,500 0 8,244Cap. Op. Equipment 0 0 0 0 0 0 2,229 2,229Property 845 660 853 703 729 497 717 5,005TC Contingency 0 0 0 0 0 0 22,322 22,322Maintenance Incentive Program 0 0 0 0 0 0 10,592 10,592Operations 0 0 0 0 0 0 88,697 88,697Transit (Administration/Ops) 0 0 0 0 0 0 473 473Metro Planning (FHWA & FTA) 0 1,135 223 547 0 4,062 0 5,966
Total Program Delivery 5,099 4,806 5,606 4,470 5,047 8,861 125,031 158,920
Regional Priority Program 5,773 6,480 5,537 6,008 3,495 11,977 0 39,270
Total Allocations 83,009 81,143 74,211 82,131 60,513 135,027 366,393 882,428
Revenue 882,428
Remaining Amount to Allocate 0
All allocations are subject to change based on performance measures and economic conditions.
Fiscal Year 2011 Colorado Department of Transportation 2035 Plan Control TotalsDecember 14, 2006
(Inflated Amounts, Dollars in Thousands)
2011 Th 8
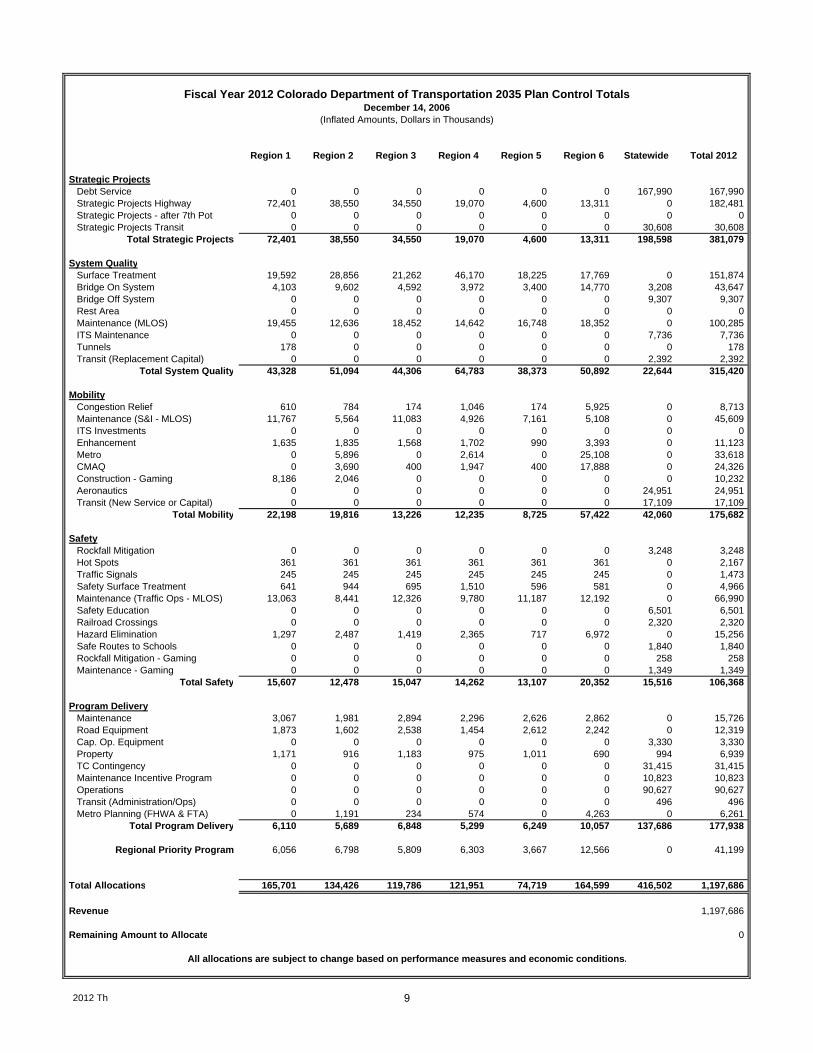
Region 1 Region 2 Region 3 Region 4 Region 5 Region 6 Statewide Total 2012
Strategic ProjectsDebt Service 0 0 0 0 0 0 167,990 167,990Strategic Projects Highway 72,401 38,550 34,550 19,070 4,600 13,311 0 182,481Strategic Projects - after 7th Pot 0 0 0 0 0 0 0 0Strategic Projects Transit 0 0 0 0 0 0 30,608 30,608
Total Strategic Projects 72,401 38,550 34,550 19,070 4,600 13,311 198,598 381,079
System QualitySurface Treatment 19,592 28,856 21,262 46,170 18,225 17,769 0 151,874Bridge On System 4,103 9,602 4,592 3,972 3,400 14,770 3,208 43,647Bridge Off System 0 0 0 0 0 0 9,307 9,307Rest Area 0 0 0 0 0 0 0 0Maintenance (MLOS) 19,455 12,636 18,452 14,642 16,748 18,352 0 100,285ITS Maintenance 0 0 0 0 0 0 7,736 7,736Tunnels 178 0 0 0 0 0 0 178Transit (Replacement Capital) 0 0 0 0 0 0 2,392 2,392
Total System Quality 43,328 51,094 44,306 64,783 38,373 50,892 22,644 315,420
MobilityCongestion Relief 610 784 174 1,046 174 5,925 0 8,713Maintenance (S&I - MLOS) 11,767 5,564 11,083 4,926 7,161 5,108 0 45,609ITS Investments 0 0 0 0 0 0 0 0Enhancement 1,635 1,835 1,568 1,702 990 3,393 0 11,123Metro 0 5,896 0 2,614 0 25,108 0 33,618CMAQ 0 3,690 400 1,947 400 17,888 0 24,326Construction - Gaming 8,186 2,046 0 0 0 0 0 10,232Aeronautics 0 0 0 0 0 0 24,951 24,951Transit (New Service or Capital) 0 0 0 0 0 0 17,109 17,109
Total Mobility 22,198 19,816 13,226 12,235 8,725 57,422 42,060 175,682
SafetyRockfall Mitigation 0 0 0 0 0 0 3,248 3,248Hot Spots 361 361 361 361 361 361 0 2,167Traffic Signals 245 245 245 245 245 245 0 1,473Safety Surface Treatment 641 944 695 1,510 596 581 0 4,966
Maintenance (Traffic Ops - MLOS) 13,063 8,441 12,326 9,780 11,187 12,192 0 66,990Safety Education 0 0 0 0 0 0 6,501 6,501Railroad Crossings 0 0 0 0 0 0 2,320 2,320Hazard Elimination 1,297 2,487 1,419 2,365 717 6,972 0 15,256Safe Routes to Schools 0 0 0 0 0 0 1,840 1,840Rockfall Mitigation - Gaming 0 0 0 0 0 0 258 258Maintenance - Gaming 0 0 0 0 0 0 1,349 1,349
Total Safety 15,607 12,478 15,047 14,262 13,107 20,352 15,516 106,368
Program DeliveryMaintenance 3,067 1,981 2,894 2,296 2,626 2,862 0 15,726Road Equipment 1,873 1,602 2,538 1,454 2,612 2,242 0 12,319Cap. Op. Equipment 0 0 0 0 0 0 3,330 3,330Property 1,171 916 1,183 975 1,011 690 994 6,939TC Contingency 0 0 0 0 0 0 31,415 31,415Maintenance Incentive Program 0 0 0 0 0 0 10,823 10,823Operations 0 0 0 0 0 0 90,627 90,627Transit (Administration/Ops) 0 0 0 0 0 0 496 496Metro Planning (FHWA & FTA) 0 1,191 234 574 0 4,263 0 6,261
Total Program Delivery 6,110 5,689 6,848 5,299 6,249 10,057 137,686 177,938
Regional Priority Program 6,056 6,798 5,809 6,303 3,667 12,566 0 41,199
Total Allocations 165,701 134,426 119,786 121,951 74,719 164,599 416,502 1,197,686
Revenue 1,197,686
Remaining Amount to Allocate 0
All allocations are subject to change based on performance measures and economic conditions.
Fiscal Year 2012 Colorado Department of Transportation 2035 Plan Control TotalsDecember 14, 2006
(Inflated Amounts, Dollars in Thousands)
2012 Th 9

Region 1 Region 2 Region 3 Region 4 Region 5 Region 6 Statewide Total 2013
Strategic ProjectsDebt Service 0 0 0 0 0 0 167,994 167,994Strategic Projects Highway 78,084 41,576 37,261 20,566 4,961 14,356 0 196,805Strategic Projects - after 7th Pot 0 0 0 0 0 0 0 0Strategic Projects Transit 0 0 0 0 0 0 32,200 32,200
Total Strategic Projects 78,084 41,576 37,261 20,566 4,961 14,356 200,193 396,998
System QualitySurface Treatment 19,964 26,310 28,167 34,512 12,536 33,274 0 154,763Bridge On System 4,255 9,958 4,762 4,119 3,526 15,318 3,327 45,265Bridge Off System 0 0 0 0 0 0 9,623 9,623Rest Area 0 0 0 0 0 0 0 0Maintenance (MLOS) 19,903 12,927 18,877 14,978 17,133 18,774 0 102,592ITS Maintenance 0 0 0 0 0 0 7,736 7,736Tunnels 45 0 134 0 0 0 0 178Transit (Replacement Capital) 0 0 0 0 0 0 2,502 2,502
Total System Quality 44,167 49,195 51,940 53,610 33,195 67,366 23,188 322,660
MobilityCongestion Relief 622 799 178 1,065 178 6,038 0 8,879Maintenance (S&I - MLOS) 12,038 5,692 11,338 5,039 7,325 5,226 0 46,659ITS Investments 0 0 0 0 0 0 0 0Enhancement 1,635 1,836 1,569 1,702 990 3,393 0 11,125Metro 0 6,228 0 2,761 0 26,522 0 35,511CMAQ 0 3,872 400 2,049 400 18,819 0 25,540Construction - Gaming 8,534 2,134 0 0 0 0 0 10,668Aeronautics 0 0 0 0 0 0 25,525 25,525Transit (New Service or Capital) 0 0 0 0 0 0 17,896 17,896
Total Mobility 22,829 20,561 13,484 12,617 8,893 59,998 43,421 181,802
SafetyRockfall Mitigation 0 0 0 0 0 0 3,310 3,310Hot Spots 361 361 361 361 361 361 0 2,167Traffic Signals 245 245 245 245 245 245 0 1,473Safety Surface Treatment 641 844 904 1,107 402 1,068 0 4,966
Maintenance (Traffic Ops - MLOS) 13,364 8,635 12,610 10,006 11,445 12,473 0 68,531Safety Education 0 0 0 0 0 0 6,514 6,514Railroad Crossings 0 0 0 0 0 0 2,427 2,427Hazard Elimination 1,362 2,611 1,490 2,483 753 7,321 0 16,020Safe Routes to Schools 0 0 0 0 0 0 1,925 1,925Rockfall Mitigation - Gaming 0 0 0 0 0 0 271 271Maintenance - Gaming 0 0 0 0 0 0 1,416 1,416
Total Safety 15,973 12,697 15,610 14,203 13,207 21,468 15,863 109,021
Program DeliveryMaintenance 3,137 2,027 2,960 2,349 2,687 2,928 0 16,088Road Equipment 1,872 1,601 2,538 1,454 2,612 2,242 0 12,319Cap. Op. Equipment 0 0 0 0 0 0 3,330 3,330Property 1,173 917 1,185 976 1,012 691 996 6,948TC Contingency 0 0 0 0 0 0 31,622 31,622Maintenance Incentive Program 0 0 0 0 0 0 11,072 11,072Operations 0 0 0 0 0 0 92,712 92,712Transit (Administration/Ops) 0 0 0 0 0 0 519 519Metro Planning (FHWA & FTA) 0 1,246 244 601 0 4,459 0 6,549
Total Program Delivery 6,182 5,791 6,927 5,379 6,310 10,319 140,251 181,160
Regional Priority Program 6,332 7,108 6,074 6,591 3,834 13,139 0 43,078
Total Allocations 173,567 136,927 131,296 112,966 70,399 186,647 422,916 1,234,719
Revenue 1,234,719
Remaining Amount to Allocate 0
All allocations are subject to change based on performance measures and economic conditions.
Fiscal Year 2013 Colorado Department of Transportation 2035 Plan Control TotalsDecember 14, 2006
(Inflated Amounts, Dollars in Thousands)
2013 Th 10
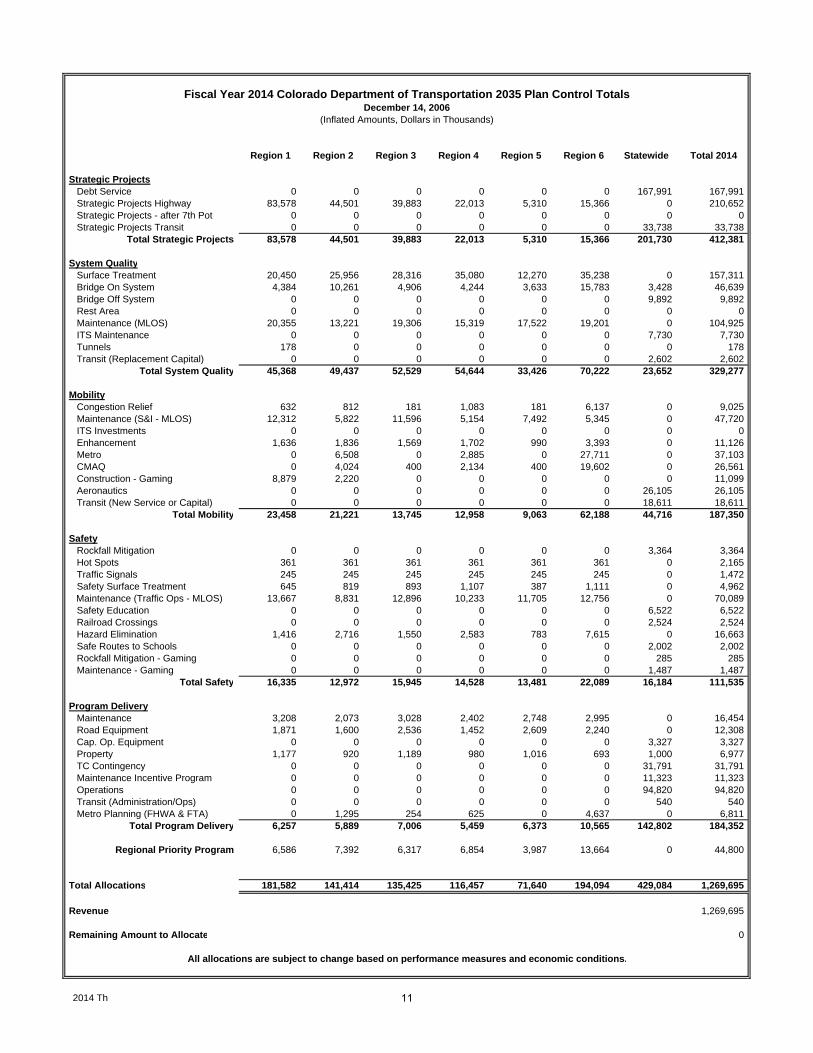
Region 1 Region 2 Region 3 Region 4 Region 5 Region 6 Statewide Total 2014
Strategic ProjectsDebt Service 0 0 0 0 0 0 167,991 167,991Strategic Projects Highway 83,578 44,501 39,883 22,013 5,310 15,366 0 210,652Strategic Projects - after 7th Pot 0 0 0 0 0 0 0 0Strategic Projects Transit 0 0 0 0 0 0 33,738 33,738
Total Strategic Projects 83,578 44,501 39,883 22,013 5,310 15,366 201,730 412,381
System QualitySurface Treatment 20,450 25,956 28,316 35,080 12,270 35,238 0 157,311Bridge On System 4,384 10,261 4,906 4,244 3,633 15,783 3,428 46,639Bridge Off System 0 0 0 0 0 0 9,892 9,892Rest Area 0 0 0 0 0 0 0 0Maintenance (MLOS) 20,355 13,221 19,306 15,319 17,522 19,201 0 104,925ITS Maintenance 0 0 0 0 0 0 7,730 7,730Tunnels 178 0 0 0 0 0 0 178Transit (Replacement Capital) 0 0 0 0 0 0 2,602 2,602
Total System Quality 45,368 49,437 52,529 54,644 33,426 70,222 23,652 329,277
MobilityCongestion Relief 632 812 181 1,083 181 6,137 0 9,025Maintenance (S&I - MLOS) 12,312 5,822 11,596 5,154 7,492 5,345 0 47,720ITS Investments 0 0 0 0 0 0 0 0Enhancement 1,636 1,836 1,569 1,702 990 3,393 0 11,126Metro 0 6,508 0 2,885 0 27,711 0 37,103CMAQ 0 4,024 400 2,134 400 19,602 0 26,561Construction - Gaming 8,879 2,220 0 0 0 0 0 11,099Aeronautics 0 0 0 0 0 0 26,105 26,105Transit (New Service or Capital) 0 0 0 0 0 0 18,611 18,611
Total Mobility 23,458 21,221 13,745 12,958 9,063 62,188 44,716 187,350
SafetyRockfall Mitigation 0 0 0 0 0 0 3,364 3,364Hot Spots 361 361 361 361 361 361 0 2,165Traffic Signals 245 245 245 245 245 245 0 1,472Safety Surface Treatment 645 819 893 1,107 387 1,111 0 4,962
Maintenance (Traffic Ops - MLOS) 13,667 8,831 12,896 10,233 11,705 12,756 0 70,089Safety Education 0 0 0 0 0 0 6,522 6,522Railroad Crossings 0 0 0 0 0 0 2,524 2,524Hazard Elimination 1,416 2,716 1,550 2,583 783 7,615 0 16,663Safe Routes to Schools 0 0 0 0 0 0 2,002 2,002Rockfall Mitigation - Gaming 0 0 0 0 0 0 285 285Maintenance - Gaming 0 0 0 0 0 0 1,487 1,487
Total Safety 16,335 12,972 15,945 14,528 13,481 22,089 16,184 111,535
Program DeliveryMaintenance 3,208 2,073 3,028 2,402 2,748 2,995 0 16,454Road Equipment 1,871 1,600 2,536 1,452 2,609 2,240 0 12,308Cap. Op. Equipment 0 0 0 0 0 0 3,327 3,327Property 1,177 920 1,189 980 1,016 693 1,000 6,977TC Contingency 0 0 0 0 0 0 31,791 31,791Maintenance Incentive Program 0 0 0 0 0 0 11,323 11,323Operations 0 0 0 0 0 0 94,820 94,820Transit (Administration/Ops) 0 0 0 0 0 0 540 540Metro Planning (FHWA & FTA) 0 1,295 254 625 0 4,637 0 6,811
Total Program Delivery 6,257 5,889 7,006 5,459 6,373 10,565 142,802 184,352
Regional Priority Program 6,586 7,392 6,317 6,854 3,987 13,664 0 44,800
Total Allocations 181,582 141,414 135,425 116,457 71,640 194,094 429,084 1,269,695
Revenue 1,269,695
Remaining Amount to Allocate 0
All allocations are subject to change based on performance measures and economic conditions.
Fiscal Year 2014 Colorado Department of Transportation 2035 Plan Control TotalsDecember 14, 2006
(Inflated Amounts, Dollars in Thousands)
2014 Th 11

12
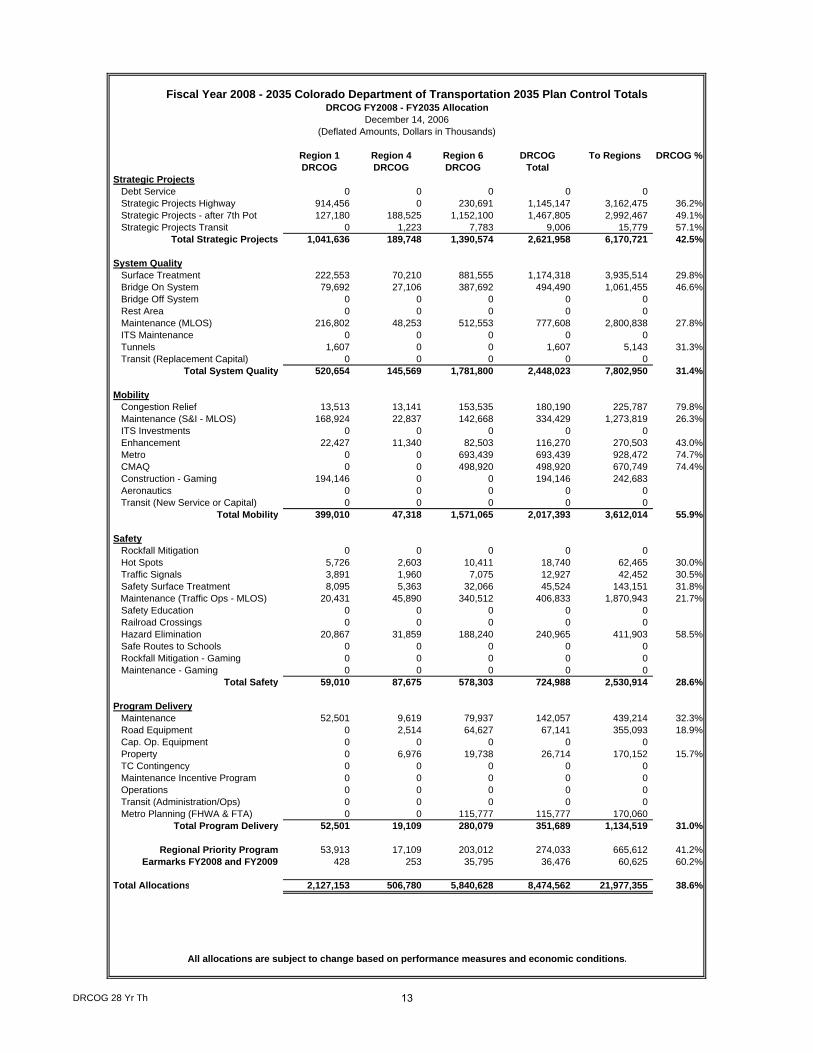
Region 1 Region 4 Region 6 DRCOG To Regions DRCOG %DRCOG DRCOG DRCOG Total
Strategic ProjectsDebt Service 0 0 0 0 0Strategic Projects Highway 914,456 0 230,691 1,145,147 3,162,475 36.2%Strategic Projects - after 7th Pot 127,180 188,525 1,152,100 1,467,805 2,992,467 49.1%Strategic Projects Transit 0 1,223 7,783 9,006 15,779 57.1%
Total Strategic Projects 1,041,636 189,748 1,390,574 2,621,958 6,170,721 42.5%
System QualitySurface Treatment 222,553 70,210 881,555 1,174,318 3,935,514 29.8%Bridge On System 79,692 27,106 387,692 494,490 1,061,455 46.6%Bridge Off System 0 0 0 0 0Rest Area 0 0 0 0 0Maintenance (MLOS) 216,802 48,253 512,553 777,608 2,800,838 27.8%ITS Maintenance 0 0 0 0 0Tunnels 1,607 0 0 1,607 5,143 31.3%Transit (Replacement Capital) 0 0 0 0 0
Total System Quality 520,654 145,569 1,781,800 2,448,023 7,802,950 31.4%
MobilityCongestion Relief 13,513 13,141 153,535 180,190 225,787 79.8%Maintenance (S&I - MLOS) 168,924 22,837 142,668 334,429 1,273,819 26.3%ITS Investments 0 0 0 0 0Enhancement 22,427 11,340 82,503 116,270 270,503 43.0%Metro 0 0 693,439 693,439 928,472 74.7%CMAQ 0 0 498,920 498,920 670,749 74.4%Construction - Gaming 194,146 0 0 194,146 242,683Aeronautics 0 0 0 0 0Transit (New Service or Capital) 0 0 0 0 0
Total Mobility 399,010 47,318 1,571,065 2,017,393 3,612,014 55.9%
SafetyRockfall Mitigation 0 0 0 0 0Hot Spots 5,726 2,603 10,411 18,740 62,465 30.0%Traffic Signals 3,891 1,960 7,075 12,927 42,452 30.5%Safety Surface Treatment 8,095 5,363 32,066 45,524 143,151 31.8%
Maintenance (Traffic Ops - MLOS) 20,431 45,890 340,512 406,833 1,870,943 21.7%Safety Education 0 0 0 0 0Railroad Crossings 0 0 0 0 0Hazard Elimination 20,867 31,859 188,240 240,965 411,903 58.5%Safe Routes to Schools 0 0 0 0 0Rockfall Mitigation - Gaming 0 0 0 0 0Maintenance - Gaming 0 0 0 0 0
Total Safety 59,010 87,675 578,303 724,988 2,530,914 28.6%
Program DeliveryMaintenance 52,501 9,619 79,937 142,057 439,214 32.3%Road Equipment 0 2,514 64,627 67,141 355,093 18.9%Cap. Op. Equipment 0 0 0 0 0Property 0 6,976 19,738 26,714 170,152 15.7%TC Contingency 0 0 0 0 0Maintenance Incentive Program 0 0 0 0 0Operations 0 0 0 0 0Transit (Administration/Ops) 0 0 0 0 0Metro Planning (FHWA & FTA) 0 0 115,777 115,777 170,060
Total Program Delivery 52,501 19,109 280,079 351,689 1,134,519 31.0%
Regional Priority Program 53,913 17,109 203,012 274,033 665,612 41.2%Earmarks FY2008 and FY2009 428 253 35,795 36,476 60,625 60.2%
Total Allocations 2,127,153 506,780 5,840,628 8,474,562 21,977,355 38.6%
All allocations are subject to change based on performance measures and economic conditions.
Fiscal Year 2008 - 2035 Colorado Department of Transportation 2035 Plan Control TotalsDRCOG FY2008 - FY2035 Allocation
December 14, 2006(Deflated Amounts, Dollars in Thousands)
DRCOG 28 Yr Th 13
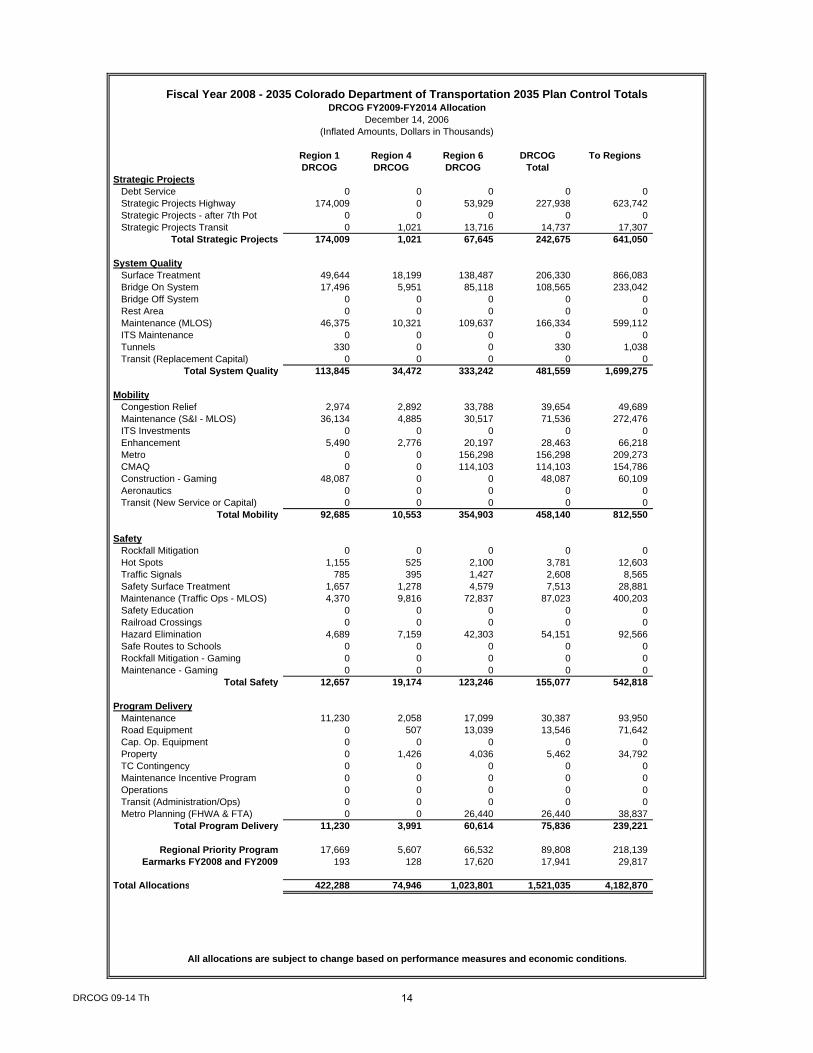
Region 1 Region 4 Region 6 DRCOG To RegionsDRCOG DRCOG DRCOG Total
Strategic ProjectsDebt Service 0 0 0 0 0Strategic Projects Highway 174,009 0 53,929 227,938 623,742Strategic Projects - after 7th Pot 0 0 0 0 0Strategic Projects Transit 0 1,021 13,716 14,737 17,307
Total Strategic Projects 174,009 1,021 67,645 242,675 641,050
System QualitySurface Treatment 49,644 18,199 138,487 206,330 866,083Bridge On System 17,496 5,951 85,118 108,565 233,042Bridge Off System 0 0 0 0 0Rest Area 0 0 0 0 0Maintenance (MLOS) 46,375 10,321 109,637 166,334 599,112ITS Maintenance 0 0 0 0 0Tunnels 330 0 0 330 1,038Transit (Replacement Capital) 0 0 0 0 0
Total System Quality 113,845 34,472 333,242 481,559 1,699,275
MobilityCongestion Relief 2,974 2,892 33,788 39,654 49,689Maintenance (S&I - MLOS) 36,134 4,885 30,517 71,536 272,476ITS Investments 0 0 0 0 0Enhancement 5,490 2,776 20,197 28,463 66,218Metro 0 0 156,298 156,298 209,273CMAQ 0 0 114,103 114,103 154,786Construction - Gaming 48,087 0 0 48,087 60,109Aeronautics 0 0 0 0 0Transit (New Service or Capital) 0 0 0 0 0
Total Mobility 92,685 10,553 354,903 458,140 812,550
SafetyRockfall Mitigation 0 0 0 0 0Hot Spots 1,155 525 2,100 3,781 12,603Traffic Signals 785 395 1,427 2,608 8,565Safety Surface Treatment 1,657 1,278 4,579 7,513 28,881
Maintenance (Traffic Ops - MLOS) 4,370 9,816 72,837 87,023 400,203Safety Education 0 0 0 0 0Railroad Crossings 0 0 0 0 0Hazard Elimination 4,689 7,159 42,303 54,151 92,566Safe Routes to Schools 0 0 0 0 0Rockfall Mitigation - Gaming 0 0 0 0 0Maintenance - Gaming 0 0 0 0 0
Total Safety 12,657 19,174 123,246 155,077 542,818
Program DeliveryMaintenance 11,230 2,058 17,099 30,387 93,950Road Equipment 0 507 13,039 13,546 71,642Cap. Op. Equipment 0 0 0 0 0Property 0 1,426 4,036 5,462 34,792TC Contingency 0 0 0 0 0Maintenance Incentive Program 0 0 0 0 0Operations 0 0 0 0 0Transit (Administration/Ops) 0 0 0 0 0Metro Planning (FHWA & FTA) 0 0 26,440 26,440 38,837
Total Program Delivery 11,230 3,991 60,614 75,836 239,221
Regional Priority Program 17,669 5,607 66,532 89,808 218,139Earmarks FY2008 and FY2009 193 128 17,620 17,941 29,817
Total Allocations 422,288 74,946 1,023,801 1,521,035 4,182,870
All allocations are subject to change based on performance measures and economic conditions.
Fiscal Year 2008 - 2035 Colorado Department of Transportation 2035 Plan Control TotalsDRCOG FY2009-FY2014 Allocation
December 14, 2006(Inflated Amounts, Dollars in Thousands)
DRCOG 09-14 Th 14
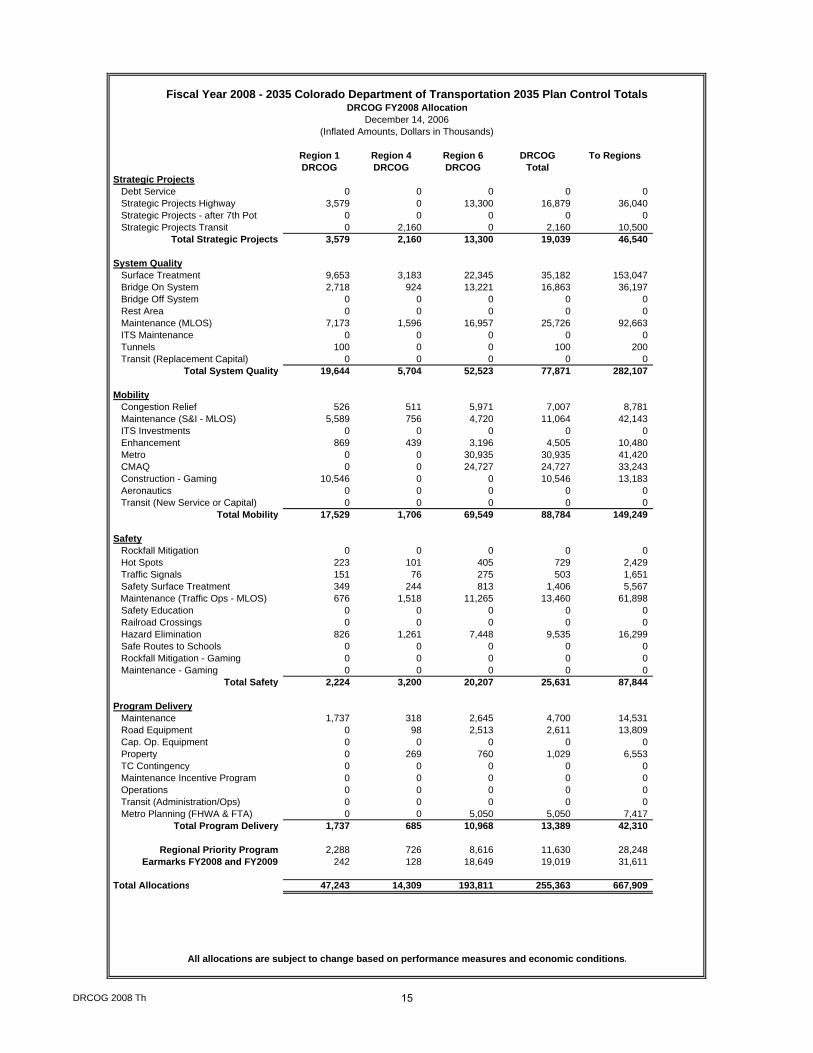
Region 1 Region 4 Region 6 DRCOG To RegionsDRCOG DRCOG DRCOG Total
Strategic ProjectsDebt Service 0 0 0 0 0Strategic Projects Highway 3,579 0 13,300 16,879 36,040Strategic Projects - after 7th Pot 0 0 0 0 0Strategic Projects Transit 0 2,160 0 2,160 10,500
Total Strategic Projects 3,579 2,160 13,300 19,039 46,540
System QualitySurface Treatment 9,653 3,183 22,345 35,182 153,047Bridge On System 2,718 924 13,221 16,863 36,197Bridge Off System 0 0 0 0 0Rest Area 0 0 0 0 0Maintenance (MLOS) 7,173 1,596 16,957 25,726 92,663ITS Maintenance 0 0 0 0 0Tunnels 100 0 0 100 200Transit (Replacement Capital) 0 0 0 0 0
Total System Quality 19,644 5,704 52,523 77,871 282,107
MobilityCongestion Relief 526 511 5,971 7,007 8,781Maintenance (S&I - MLOS) 5,589 756 4,720 11,064 42,143ITS Investments 0 0 0 0 0Enhancement 869 439 3,196 4,505 10,480Metro 0 0 30,935 30,935 41,420CMAQ 0 0 24,727 24,727 33,243Construction - Gaming 10,546 0 0 10,546 13,183Aeronautics 0 0 0 0 0Transit (New Service or Capital) 0 0 0 0 0
Total Mobility 17,529 1,706 69,549 88,784 149,249
SafetyRockfall Mitigation 0 0 0 0 0Hot Spots 223 101 405 729 2,429Traffic Signals 151 76 275 503 1,651Safety Surface Treatment 349 244 813 1,406 5,567
Maintenance (Traffic Ops - MLOS) 676 1,518 11,265 13,460 61,898Safety Education 0 0 0 0 0Railroad Crossings 0 0 0 0 0Hazard Elimination 826 1,261 7,448 9,535 16,299Safe Routes to Schools 0 0 0 0 0Rockfall Mitigation - Gaming 0 0 0 0 0Maintenance - Gaming 0 0 0 0 0
Total Safety 2,224 3,200 20,207 25,631 87,844
Program DeliveryMaintenance 1,737 318 2,645 4,700 14,531Road Equipment 0 98 2,513 2,611 13,809Cap. Op. Equipment 0 0 0 0 0Property 0 269 760 1,029 6,553TC Contingency 0 0 0 0 0Maintenance Incentive Program 0 0 0 0 0Operations 0 0 0 0 0Transit (Administration/Ops) 0 0 0 0 0Metro Planning (FHWA & FTA) 0 0 5,050 5,050 7,417
Total Program Delivery 1,737 685 10,968 13,389 42,310
Regional Priority Program 2,288 726 8,616 11,630 28,248Earmarks FY2008 and FY2009 242 128 18,649 19,019 31,611
Total Allocations 47,243 14,309 193,811 255,363 667,909
All allocations are subject to change based on performance measures and economic conditions.
Fiscal Year 2008 - 2035 Colorado Department of Transportation 2035 Plan Control TotalsDRCOG FY2008 Allocation
December 14, 2006(Inflated Amounts, Dollars in Thousands)
DRCOG 2008 Th 15
Region 1 Region 4 Region 6 DRCOG To RegionsDRCOG DRCOG DRCOG Total
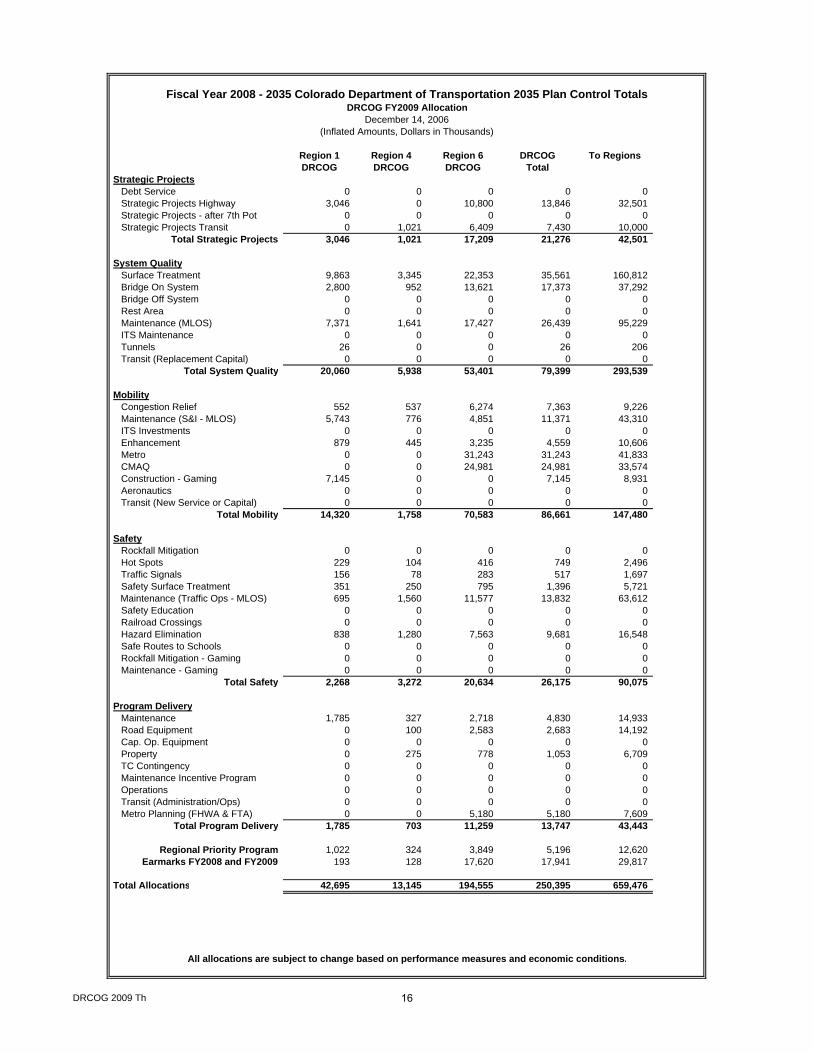
Strategic ProjectsDebt Service 0 0 0 0 0Strategic Projects Highway 3,046 0 10,800 13,846 32,501Strategic Projects - after 7th Pot 0 0 0 0 0Strategic Projects Transit 0 1,021 6,409 7,430 10,000
Total Strategic Projects 3,046 1,021 17,209 21,276 42,501
System QualitySurface Treatment 9,863 3,345 22,353 35,561 160,812Bridge On System 2,800 952 13,621 17,373 37,292Bridge Off System 0 0 0 0 0Rest Area 0 0 0 0 0Maintenance (MLOS) 7,371 1,641 17,427 26,439 95,229ITS Maintenance 0 0 0 0 0Tunnels 26 0 0 26 206Transit (Replacement Capital) 0 0 0 0 0
Total System Quality 20,060 5,938 53,401 79,399 293,539
MobilityCongestion Relief 552 537 6,274 7,363 9,226Maintenance (S&I - MLOS) 5,743 776 4,851 11,371 43,310ITS Investments 0 0 0 0 0Enhancement 879 445 3,235 4,559 10,606Metro 0 0 31,243 31,243 41,833CMAQ 0 0 24,981 24,981 33,574Construction - Gaming 7,145 0 0 7,145 8,931Aeronautics 0 0 0 0 0Transit (New Service or Capital) 0 0 0 0 0
Total Mobility 14,320 1,758 70,583 86,661 147,480
SafetyRockfall Mitigation 0 0 0 0 0Hot Spots 229 104 416 749 2,496Traffic Signals 156 78 283 517 1,697Safety Surface Treatment 351 250 795 1,396 5,721
Maintenance (Traffic Ops - MLOS) 695 1,560 11,577 13,832 63,612Safety Education 0 0 0 0 0Railroad Crossings 0 0 0 0 0Hazard Elimination 838 1,280 7,563 9,681 16,548Safe Routes to Schools 0 0 0 0 0Rockfall Mitigation - Gaming 0 0 0 0 0Maintenance - Gaming 0 0 0 0 0
Total Safety 2,268 3,272 20,634 26,175 90,075
Program DeliveryMaintenance 1,785 327 2,718 4,830 14,933Road Equipment 0 100 2,583 2,683 14,192Cap. Op. Equipment 0 0 0 0 0Property 0 275 778 1,053 6,709TC Contingency 0 0 0 0 0Maintenance Incentive Program 0 0 0 0 0Operations 0 0 0 0 0Transit (Administration/Ops) 0 0 0 0 0Metro Planning (FHWA & FTA) 0 0 5,180 5,180 7,609
Total Program Delivery 1,785 703 11,259 13,747 43,443
Regional Priority Program 1,022 324 3,849 5,196 12,620Earmarks FY2008 and FY2009 193 128 17,620 17,941 29,817
Total Allocations 42,695 13,145 194,555 250,395 659,476
All allocations are subject to change based on performance measures and economic conditions.
Fiscal Year 2008 - 2035 Colorado Department of Transportation 2035 Plan Control TotalsDRCOG FY2009 Allocation
December 14, 2006(Inflated Amounts, Dollars in Thousands)
DRCOG 2009 Th 16

Region 1 Region 4 Region 6 DRCOG To RegionsDRCOG DRCOG DRCOG Total
Strategic ProjectsDebt Service 0 0 0 0 0Strategic Projects Highway 377 0 95 472 1,304Strategic Projects - after 7th Pot 0 0 0 0 0Strategic Projects Transit 0 0 7,307 7,307 7,307
Total Strategic Projects 377 0 7,403 7,780 8,611
System QualitySurface Treatment 7,839 3,247 18,021 29,107 141,900Bridge On System 2,762 939 13,436 17,137 36,785Bridge Off System 0 0 0 0 0Rest Area 0 0 0 0 0Maintenance (MLOS) 7,580 1,687 17,921 27,189 97,931ITS Maintenance 0 0 0 0 0Tunnels 89 0 0 89 178Transit (Replacement Capital) 0 0 0 0 0
Total System Quality 18,270 5,873 49,378 73,522 276,794
MobilityCongestion Relief 487 474 5,536 6,497 8,141Maintenance (S&I - MLOS) 5,906 798 4,988 11,693 44,539ITS Investments 0 0 0 0 0Enhancement 922 466 3,391 4,778 11,117Metro 0 0 22,058 22,058 29,534CMAQ 0 0 15,880 15,880 21,707Construction - Gaming 7,505 0 0 7,505 9,382Aeronautics 0 0 0 0 0Transit (New Service or Capital) 0 0 0 0 0
Total Mobility 14,821 1,738 51,853 68,411 124,419
SafetyRockfall Mitigation 0 0 0 0 0Hot Spots 198 90 359 647 2,157Traffic Signals 134 68 244 446 1,466Safety Surface Treatment 273 237 628 1,138 4,942
Maintenance (Traffic Ops - MLOS) 714 1,605 11,906 14,225 65,417Safety Education 0 0 0 0 0Railroad Crossings 0 0 0 0 0Hazard Elimination 689 1,052 6,218 7,960 13,606Safe Routes to Schools 0 0 0 0 0Rockfall Mitigation - Gaming 0 0 0 0 0Maintenance - Gaming 0 0 0 0 0
Total Safety 2,009 3,052 19,355 24,416 87,588
Program DeliveryMaintenance 1,836 336 2,795 4,967 15,357Road Equipment 0 87 2,231 2,318 12,260Cap. Op. Equipment 0 0 0 0 0Property 0 243 687 929 5,920TC Contingency 0 0 0 0 0Maintenance Incentive Program 0 0 0 0 0Operations 0 0 0 0 0Transit (Administration/Ops) 0 0 0 0 0Metro Planning (FHWA & FTA) 0 0 3,840 3,840 5,640
Total Program Delivery 1,836 666 9,553 12,055 39,177
Regional Priority Program 3,011 955 11,337 15,304 37,172
Total Allocations 40,323 12,285 148,879 201,487 573,761
All allocations are subject to change based on performance measures and economic conditions.
Fiscal Year 2008 - 2035 Colorado Department of Transportation 2035 Plan Control TotalsDRCOG FY2010 Allocation
December 14, 2006(Inflated Amounts, Dollars in Thousands)
DRCOG 2010 Th 17
Region 1 Region 4 Region 6 DRCOG To Regions DRCOG %DRCOG DRCOG DRCOG Total
Strategic ProjectsDebt Service 0 0 0 0 0Strategic Projects Highway 0 0 0 0 0Strategic Projects - after 7th Pot 0 0 0 0 0Strategic Projects Transit 0 0 0 0 0
Total Strategic Projects 0 0 0 0 0
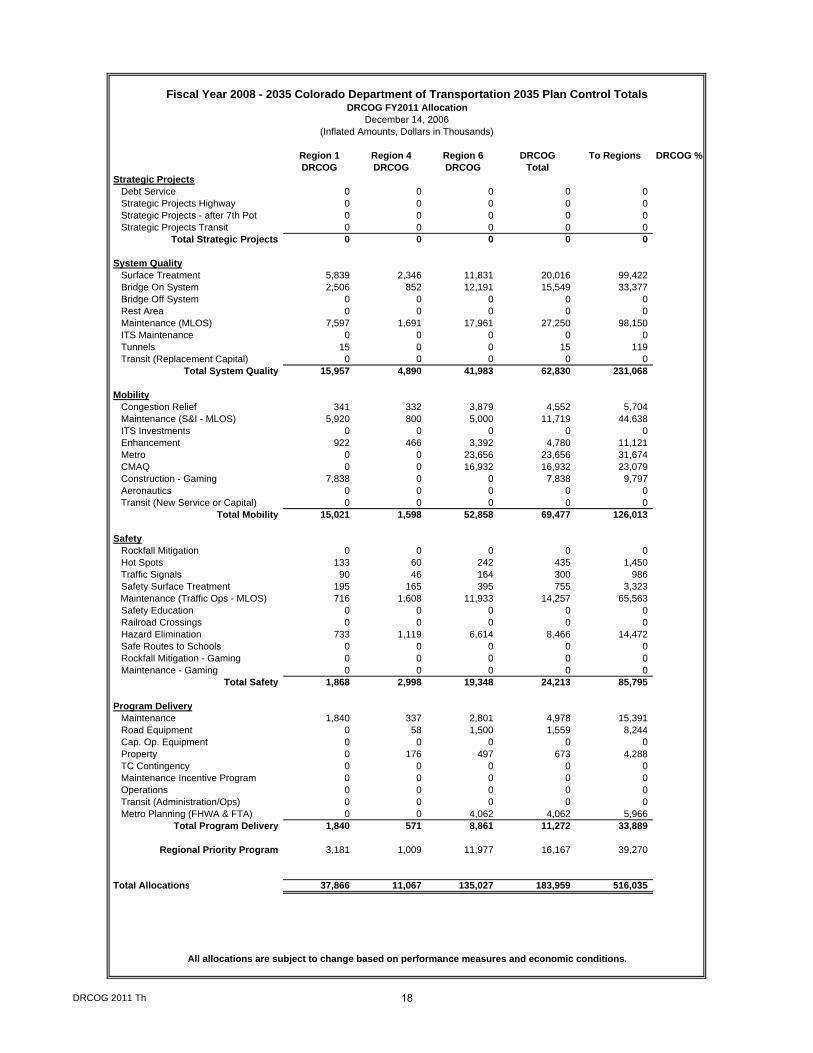
System QualitySurface Treatment 5,839 2,346 11,831 20,016 99,422Bridge On System 2,506 852 12,191 15,549 33,377Bridge Off System 0 0 0 0 0Rest Area 0 0 0 0 0Maintenance (MLOS) 7,597 1,691 17,961 27,250 98,150ITS Maintenance 0 0 0 0 0Tunnels 15 0 0 15 119Transit (Replacement Capital) 0 0 0 0 0
Total System Quality 15,957 4,890 41,983 62,830 231,068
MobilityCongestion Relief 341 332 3,879 4,552 5,704Maintenance (S&I - MLOS) 5,920 800 5,000 11,719 44,638ITS Investments 0 0 0 0 0Enhancement 922 466 3,392 4,780 11,121Metro 0 0 23,656 23,656 31,674CMAQ 0 0 16,932 16,932 23,079Construction - Gaming 7,838 0 0 7,838 9,797Aeronautics 0 0 0 0 0Transit (New Service or Capital) 0 0 0 0 0
Total Mobility 15,021 1,598 52,858 69,477 126,013
SafetyRockfall Mitigation 0 0 0 0 0Hot Spots 133 60 242 435 1,450Traffic Signals 90 46 164 300 986Safety Surface Treatment 195 165 395 755 3,323
Maintenance (Traffic Ops - MLOS) 716 1,608 11,933 14,257 65,563Safety Education 0 0 0 0 0Railroad Crossings 0 0 0 0 0Hazard Elimination 733 1,119 6,614 8,466 14,472Safe Routes to Schools 0 0 0 0 0Rockfall Mitigation - Gaming 0 0 0 0 0Maintenance - Gaming 0 0 0 0 0
Total Safety 1,868 2,998 19,348 24,213 85,795
Program DeliveryMaintenance 1,840 337 2,801 4,978 15,391Road Equipment 0 58 1,500 1,559 8,244Cap. Op. Equipment 0 0 0 0 0Property 0 176 497 673 4,288TC Contingency 0 0 0 0 0Maintenance Incentive Program 0 0 0 0 0Operations 0 0 0 0 0Transit (Administration/Ops) 0 0 0 0 0Metro Planning (FHWA & FTA) 0 0 4,062 4,062 5,966
Total Program Delivery 1,840 571 8,861 11,272 33,889
Regional Priority Program 3,181 1,009 11,977 16,167 39,270
Total Allocations 37,866 11,067 135,027 183,959 516,035
All allocations are subject to change based on performance measures and economic conditions.
Fiscal Year 2008 - 2035 Colorado Department of Transportation 2035 Plan Control TotalsDRCOG FY2011 Allocation
December 14, 2006(Inflated Amounts, Dollars in Thousands)
DRCOG 2011 Th 18
Region 1 Region 4 Region 6 DRCOG To RegionsDRCOG DRCOG DRCOG Total
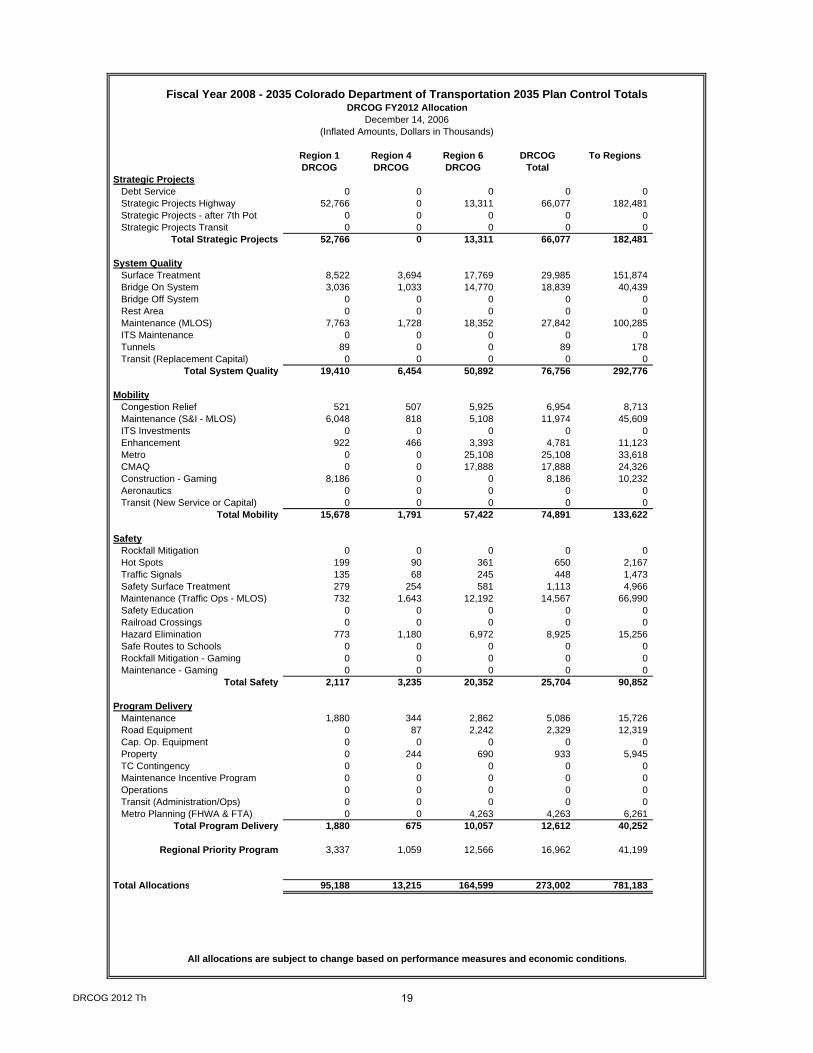
Strategic ProjectsDebt Service 0 0 0 0 0Strategic Projects Highway 52,766 0 13,311 66,077 182,481Strategic Projects - after 7th Pot 0 0 0 0 0Strategic Projects Transit 0 0 0 0 0
Total Strategic Projects 52,766 0 13,311 66,077 182,481
System QualitySurface Treatment 8,522 3,694 17,769 29,985 151,874Bridge On System 3,036 1,033 14,770 18,839 40,439Bridge Off System 0 0 0 0 0Rest Area 0 0 0 0 0Maintenance (MLOS) 7,763 1,728 18,352 27,842 100,285ITS Maintenance 0 0 0 0 0Tunnels 89 0 0 89 178Transit (Replacement Capital) 0 0 0 0 0
Total System Quality 19,410 6,454 50,892 76,756 292,776
MobilityCongestion Relief 521 507 5,925 6,954 8,713Maintenance (S&I - MLOS) 6,048 818 5,108 11,974 45,609ITS Investments 0 0 0 0 0Enhancement 922 466 3,393 4,781 11,123Metro 0 0 25,108 25,108 33,618CMAQ 0 0 17,888 17,888 24,326Construction - Gaming 8,186 0 0 8,186 10,232Aeronautics 0 0 0 0 0Transit (New Service or Capital) 0 0 0 0 0
Total Mobility 15,678 1,791 57,422 74,891 133,622
SafetyRockfall Mitigation 0 0 0 0 0Hot Spots 199 90 361 650 2,167Traffic Signals 135 68 245 448 1,473Safety Surface Treatment 279 254 581 1,113 4,966
Maintenance (Traffic Ops - MLOS) 732 1,643 12,192 14,567 66,990Safety Education 0 0 0 0 0Railroad Crossings 0 0 0 0 0Hazard Elimination 773 1,180 6,972 8,925 15,256Safe Routes to Schools 0 0 0 0 0Rockfall Mitigation - Gaming 0 0 0 0 0Maintenance - Gaming 0 0 0 0 0
Total Safety 2,117 3,235 20,352 25,704 90,852
Program DeliveryMaintenance 1,880 344 2,862 5,086 15,726Road Equipment 0 87 2,242 2,329 12,319Cap. Op. Equipment 0 0 0 0 0Property 0 244 690 933 5,945TC Contingency 0 0 0 0 0Maintenance Incentive Program 0 0 0 0 0Operations 0 0 0 0 0Transit (Administration/Ops) 0 0 0 0 0Metro Planning (FHWA & FTA) 0 0 4,263 4,263 6,261
Total Program Delivery 1,880 675 10,057 12,612 40,252
Regional Priority Program 3,337 1,059 12,566 16,962 41,199
Total Allocations 95,188 13,215 164,599 273,002 781,183
All allocations are subject to change based on performance measures and economic conditions.
Fiscal Year 2008 - 2035 Colorado Department of Transportation 2035 Plan Control TotalsDRCOG FY2012 Allocation
December 14, 2006(Inflated Amounts, Dollars in Thousands)
DRCOG 2012 Th 19

Region 1 Region 4 Region 6 DRCOG To RegionsDRCOG DRCOG DRCOG Total
Strategic ProjectsDebt Service 0 0 0 0 0Strategic Projects Highway 56,908 0 14,356 71,264 196,805Strategic Projects - after 7th Pot 0 0 0 0 0Strategic Projects Transit 0 0 0 0 0
Total Strategic Projects 56,908 0 14,356 71,264 196,805
System QualitySurface Treatment 8,685 2,761 33,274 44,720 154,763Bridge On System 3,149 1,071 15,318 19,537 41,938Bridge Off System 0 0 0 0 0Rest Area 0 0 0 0 0Maintenance (MLOS) 7,941 1,767 18,774 28,483 102,592ITS Maintenance 0 0 0 0 0Tunnels 22 0 0 22 178Transit (Replacement Capital) 0 0 0 0 0
Total System Quality 19,797 5,599 67,366 92,762 299,472
MobilityCongestion Relief 531 517 6,038 7,086 8,879Maintenance (S&I - MLOS) 6,188 837 5,226 12,250 46,659ITS Investments 0 0 0 0 0Enhancement 922 466 3,393 4,782 11,125Metro 0 0 26,522 26,522 35,511CMAQ 0 0 18,819 18,819 25,540Construction - Gaming 8,534 0 0 8,534 10,668Aeronautics 0 0 0 0 0Transit (New Service or Capital) 0 0 0 0 0
Total Mobility 16,175 1,820 59,998 77,993 138,382
SafetyRockfall Mitigation 0 0 0 0 0Hot Spots 199 90 361 650 2,167Traffic Signals 135 68 245 448 1,473Safety Surface Treatment 279 186 1,068 1,532 4,966
Maintenance (Traffic Ops - MLOS) 748 1,681 12,473 14,902 68,531Safety Education 0 0 0 0 0Railroad Crossings 0 0 0 0 0Hazard Elimination 812 1,239 7,321 9,372 16,020Safe Routes to Schools 0 0 0 0 0Rockfall Mitigation - Gaming 0 0 0 0 0Maintenance - Gaming 0 0 0 0 0
Total Safety 2,172 3,264 21,468 26,905 93,157
Program DeliveryMaintenance 1,923 352 2,928 5,203 16,088Road Equipment 0 87 2,242 2,329 12,319Cap. Op. Equipment 0 0 0 0 0Property 0 244 691 935 5,953TC Contingency 0 0 0 0 0Maintenance Incentive Program 0 0 0 0 0Operations 0 0 0 0 0Transit (Administration/Ops) 0 0 0 0 0Metro Planning (FHWA & FTA) 0 0 4,459 4,459 6,549
Total Program Delivery 1,923 684 10,319 12,926 40,909
Regional Priority Program 3,489 1,107 13,139 17,735 43,078
Total Allocations 100,464 12,474 186,647 299,586 811,803
All allocations are subject to change based on performance measures and economic conditions.
Fiscal Year 2008 - 2035 Colorado Department of Transportation 2035 Plan Control TotalsDRCOG FY2013 Allocation
December 14, 2006(Inflated Amounts, Dollars in Thousands)
DRCOG 2013 Th 20

Region 1 Region 4 Region 6 DRCOG To RegionsDRCOG DRCOG DRCOG Total
Strategic ProjectsDebt Service 0 0 0 0 0Strategic Projects Highway 60,912 0 15,366 76,278 210,652Strategic Projects - after 7th Pot 0 0 0 0 0Strategic Projects Transit 0 0 0 0 0
Total Strategic Projects 60,912 0 15,366 76,278 210,652
System QualitySurface Treatment 8,896 2,806 35,238 46,940 157,311Bridge On System 3,244 1,103 15,783 20,130 43,211Bridge Off System 0 0 0 0 0Rest Area 0 0 0 0 0Maintenance (MLOS) 8,122 1,808 19,201 29,131 104,925ITS Maintenance 0 0 0 0 0Tunnels 89 0 0 89 178Transit (Replacement Capital) 0 0 0 0 0
Total System Quality 20,351 5,718 70,222 96,290 305,626
MobilityCongestion Relief 540 525 6,137 7,203 9,025Maintenance (S&I - MLOS) 6,328 856 5,345 12,528 47,720ITS Investments 0 0 0 0 0Enhancement 922 466 3,393 4,782 11,126Metro 0 0 27,711 27,711 37,103CMAQ 0 0 19,602 19,602 26,561Construction - Gaming 8,879 0 0 8,879 11,099Aeronautics 0 0 0 0 0Transit (New Service or Capital) 0 0 0 0 0
Total Mobility 16,670 1,847 62,188 80,706 142,634
SafetyRockfall Mitigation 0 0 0 0 0Hot Spots 198 90 361 650 2,165Traffic Signals 135 68 245 448 1,472Safety Surface Treatment 281 186 1,111 1,578 4,962
Maintenance (Traffic Ops - MLOS) 765 1,719 12,756 15,241 70,089Safety Education 0 0 0 0 0Railroad Crossings 0 0 0 0 0Hazard Elimination 844 1,289 7,615 9,748 16,663Safe Routes to Schools 0 0 0 0 0Rockfall Mitigation - Gaming 0 0 0 0 0Maintenance - Gaming 0 0 0 0 0
Total Safety 2,223 3,352 22,089 27,664 95,350
Program DeliveryMaintenance 1,967 360 2,995 5,322 16,454Road Equipment 0 87 2,240 2,327 12,308Cap. Op. Equipment 0 0 0 0 0Property 0 245 693 938 5,977TC Contingency 0 0 0 0 0Maintenance Incentive Program 0 0 0 0 0Operations 0 0 0 0 0Transit (Administration/Ops) 0 0 0 0 0Metro Planning (FHWA & FTA) 0 0 4,637 4,637 6,811
Total Program Delivery 1,967 693 10,565 13,224 41,550
Regional Priority Program 3,629 1,152 13,664 18,444 44,800
Total Allocations 105,752 12,761 194,094 312,606 840,611
All allocations are subject to change based on performance measures and economic conditions.
Fiscal Year 2008 - 2035 Colorado Department of Transportation 2035 Plan Control TotalsDRCOG FY2014 Allocation
December 14, 2006(Inflated Amounts, Dollars in Thousands)
DRCOG 2014 Th 21

22
Region 2 PPACG To Regions PPACG %
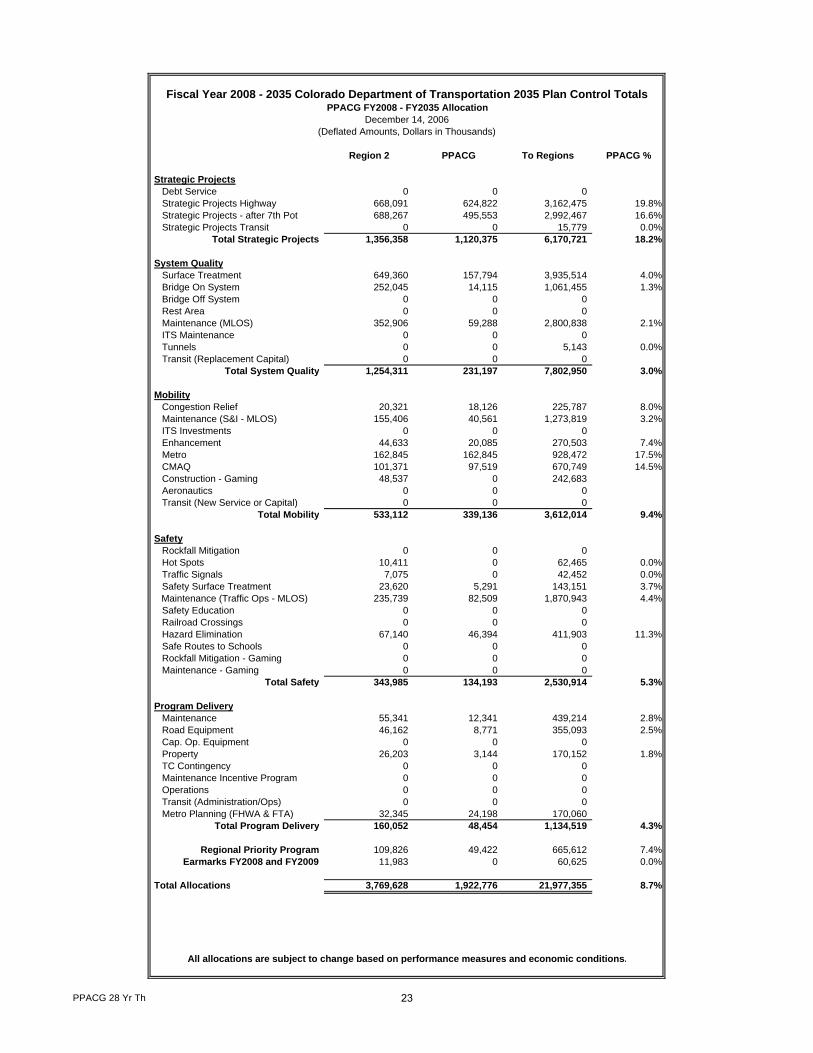
Strategic ProjectsDebt Service 0 0 0Strategic Projects Highway 668,091 624,822 3,162,475 19.8%Strategic Projects - after 7th Pot 688,267 495,553 2,992,467 16.6%Strategic Projects Transit 0 0 15,779 0.0%
Total Strategic Projects 1,356,358 1,120,375 6,170,721 18.2%
System QualitySurface Treatment 649,360 157,794 3,935,514 4.0%Bridge On System 252,045 14,115 1,061,455 1.3%Bridge Off System 0 0 0Rest Area 0 0 0Maintenance (MLOS) 352,906 59,288 2,800,838 2.1%ITS Maintenance 0 0 0Tunnels 0 0 5,143 0.0%Transit (Replacement Capital) 0 0 0
Total System Quality 1,254,311 231,197 7,802,950 3.0%
MobilityCongestion Relief 20,321 18,126 225,787 8.0%Maintenance (S&I - MLOS) 155,406 40,561 1,273,819 3.2%ITS Investments 0 0 0Enhancement 44,633 20,085 270,503 7.4%Metro 162,845 162,845 928,472 17.5%CMAQ 101,371 97,519 670,749 14.5%Construction - Gaming 48,537 0 242,683Aeronautics 0 0 0Transit (New Service or Capital) 0 0 0
Total Mobility 533,112 339,136 3,612,014 9.4%
SafetyRockfall Mitigation 0 0 0Hot Spots 10,411 0 62,465 0.0%Traffic Signals 7,075 0 42,452 0.0%Safety Surface Treatment 23,620 5,291 143,151 3.7%
Maintenance (Traffic Ops - MLOS) 235,739 82,509 1,870,943 4.4%Safety Education 0 0 0Railroad Crossings 0 0 0Hazard Elimination 67,140 46,394 411,903 11.3%Safe Routes to Schools 0 0 0Rockfall Mitigation - Gaming 0 0 0Maintenance - Gaming 0 0 0
Total Safety 343,985 134,193 2,530,914 5.3%
Program DeliveryMaintenance 55,341 12,341 439,214 2.8%Road Equipment 46,162 8,771 355,093 2.5%Cap. Op. Equipment 0 0 0Property 26,203 3,144 170,152 1.8%TC Contingency 0 0 0Maintenance Incentive Program 0 0 0Operations 0 0 0Transit (Administration/Ops) 0 0 0Metro Planning (FHWA & FTA) 32,345 24,198 170,060
Total Program Delivery 160,052 48,454 1,134,519 4.3%
Regional Priority Program 109,826 49,422 665,612 7.4%Earmarks FY2008 and FY2009 11,983 0 60,625 0.0%
Total Allocations 3,769,628 1,922,776 21,977,355 8.7%
All allocations are subject to change based on performance measures and economic conditions.
(Deflated Amounts, Dollars in Thousands)
Fiscal Year 2008 - 2035 Colorado Department of Transportation 2035 Plan Control TotalsPPACG FY2008 - FY2035 Allocation
December 14, 2006
PPACG 28 Yr Th 23
Region 2 PPACG To Regions
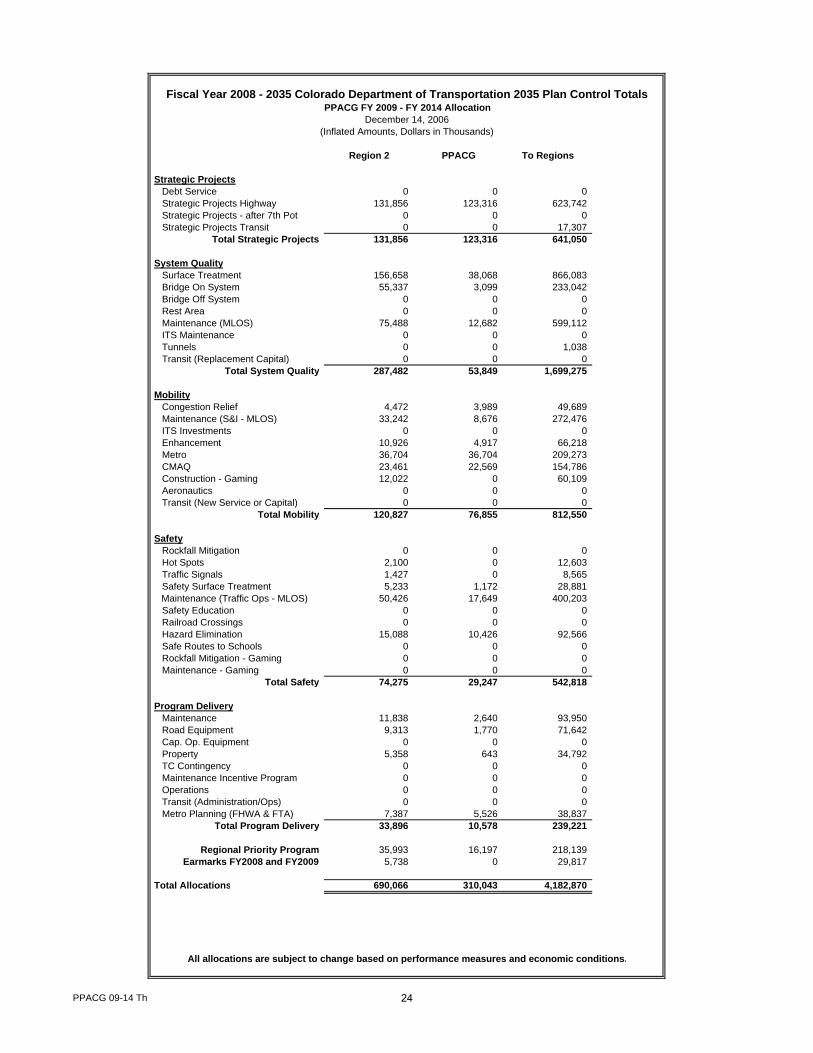
Strategic ProjectsDebt Service 0 0 0Strategic Projects Highway 131,856 123,316 623,742Strategic Projects - after 7th Pot 0 0 0Strategic Projects Transit 0 0 17,307
Total Strategic Projects 131,856 123,316 641,050
System QualitySurface Treatment 156,658 38,068 866,083Bridge On System 55,337 3,099 233,042Bridge Off System 0 0 0Rest Area 0 0 0Maintenance (MLOS) 75,488 12,682 599,112ITS Maintenance 0 0 0Tunnels 0 0 1,038Transit (Replacement Capital) 0 0 0
Total System Quality 287,482 53,849 1,699,275
MobilityCongestion Relief 4,472 3,989 49,689Maintenance (S&I - MLOS) 33,242 8,676 272,476ITS Investments 0 0 0Enhancement 10,926 4,917 66,218Metro 36,704 36,704 209,273CMAQ 23,461 22,569 154,786Construction - Gaming 12,022 0 60,109Aeronautics 0 0 0Transit (New Service or Capital) 0 0 0
Total Mobility 120,827 76,855 812,550
SafetyRockfall Mitigation 0 0 0Hot Spots 2,100 0 12,603Traffic Signals 1,427 0 8,565Safety Surface Treatment 5,233 1,172 28,881
Maintenance (Traffic Ops - MLOS) 50,426 17,649 400,203Safety Education 0 0 0Railroad Crossings 0 0 0Hazard Elimination 15,088 10,426 92,566Safe Routes to Schools 0 0 0Rockfall Mitigation - Gaming 0 0 0Maintenance - Gaming 0 0 0
Total Safety 74,275 29,247 542,818
Program DeliveryMaintenance 11,838 2,640 93,950Road Equipment 9,313 1,770 71,642Cap. Op. Equipment 0 0 0Property 5,358 643 34,792TC Contingency 0 0 0Maintenance Incentive Program 0 0 0Operations 0 0 0Transit (Administration/Ops) 0 0 0Metro Planning (FHWA & FTA) 7,387 5,526 38,837
Total Program Delivery 33,896 10,578 239,221
Regional Priority Program 35,993 16,197 218,139Earmarks FY2008 and FY2009 5,738 0 29,817
Total Allocations 690,066 310,043 4,182,870
All allocations are subject to change based on performance measures and economic conditions.
Fiscal Year 2008 - 2035 Colorado Department of Transportation 2035 Plan Control TotalsPPACG FY 2009 - FY 2014 Allocation
December 14, 2006(Inflated Amounts, Dollars in Thousands)
PPACG 09-14 Th 24
Region 2 PPACG To Regions
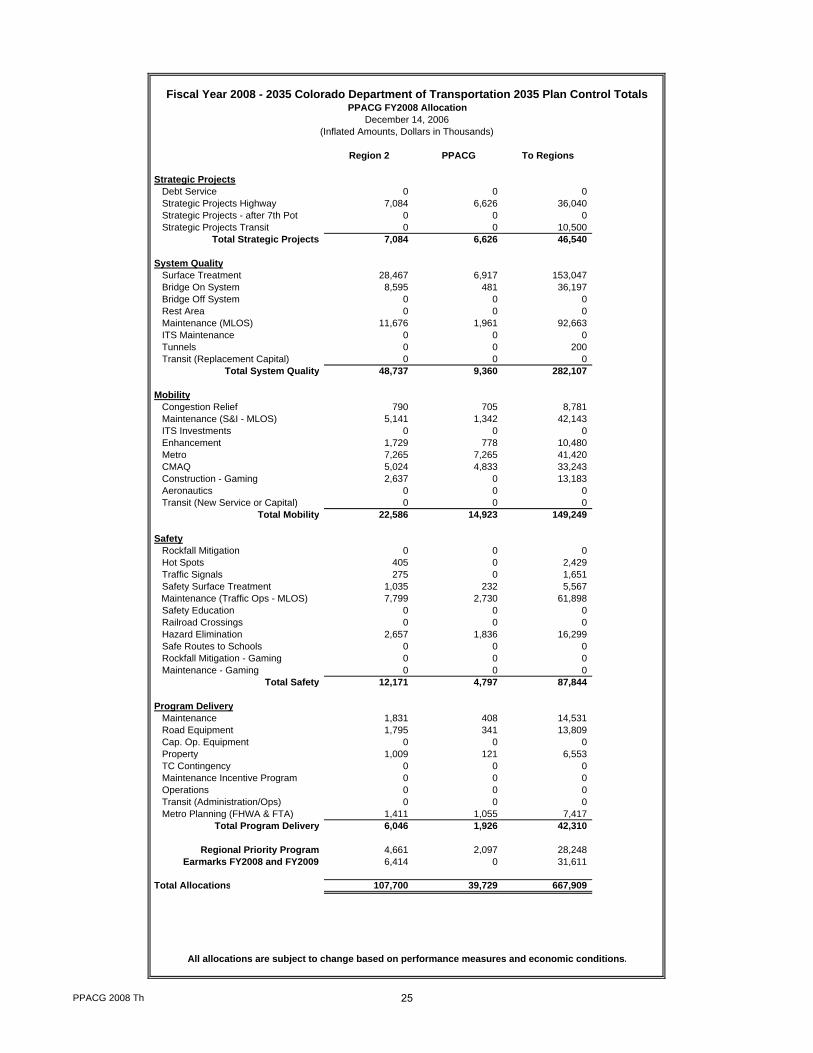
Strategic ProjectsDebt Service 0 0 0Strategic Projects Highway 7,084 6,626 36,040Strategic Projects - after 7th Pot 0 0 0Strategic Projects Transit 0 0 10,500
Total Strategic Projects 7,084 6,626 46,540
System QualitySurface Treatment 28,467 6,917 153,047Bridge On System 8,595 481 36,197Bridge Off System 0 0 0Rest Area 0 0 0Maintenance (MLOS) 11,676 1,961 92,663ITS Maintenance 0 0 0Tunnels 0 0 200Transit (Replacement Capital) 0 0 0
Total System Quality 48,737 9,360 282,107
MobilityCongestion Relief 790 705 8,781Maintenance (S&I - MLOS) 5,141 1,342 42,143ITS Investments 0 0 0Enhancement 1,729 778 10,480Metro 7,265 7,265 41,420CMAQ 5,024 4,833 33,243Construction - Gaming 2,637 0 13,183Aeronautics 0 0 0Transit (New Service or Capital) 0 0 0
Total Mobility 22,586 14,923 149,249
SafetyRockfall Mitigation 0 0 0Hot Spots 405 0 2,429Traffic Signals 275 0 1,651Safety Surface Treatment 1,035 232 5,567
Maintenance (Traffic Ops - MLOS) 7,799 2,730 61,898Safety Education 0 0 0Railroad Crossings 0 0 0Hazard Elimination 2,657 1,836 16,299Safe Routes to Schools 0 0 0Rockfall Mitigation - Gaming 0 0 0Maintenance - Gaming 0 0 0
Total Safety 12,171 4,797 87,844
Program DeliveryMaintenance 1,831 408 14,531Road Equipment 1,795 341 13,809Cap. Op. Equipment 0 0 0Property 1,009 121 6,553TC Contingency 0 0 0Maintenance Incentive Program 0 0 0Operations 0 0 0Transit (Administration/Ops) 0 0 0Metro Planning (FHWA & FTA) 1,411 1,055 7,417
Total Program Delivery 6,046 1,926 42,310
Regional Priority Program 4,661 2,097 28,248Earmarks FY2008 and FY2009 6,414 0 31,611
Total Allocations 107,700 39,729 667,909
All allocations are subject to change based on performance measures and economic conditions.
Fiscal Year 2008 - 2035 Colorado Department of Transportation 2035 Plan Control TotalsPPACG FY2008 Allocation
December 14, 2006(Inflated Amounts, Dollars in Thousands)
PPACG 2008 Th 25

Region 2 PPACG To Regions
Strategic ProjectsDebt Service 0 0 0Strategic Projects Highway 6,953 6,503 32,501Strategic Projects - after 7th Pot 0 0 0Strategic Projects Transit 0 0 10,000
Total Strategic Projects 6,953 6,503 42,501
System QualitySurface Treatment 29,911 7,268 160,812Bridge On System 8,855 496 37,292Bridge Off System 0 0 0Rest Area 0 0 0Maintenance (MLOS) 11,999 2,016 95,229ITS Maintenance 0 0 0Tunnels 0 0 206Transit (Replacement Capital) 0 0 0
Total System Quality 50,765 9,780 293,539
MobilityCongestion Relief 830 741 9,226Maintenance (S&I - MLOS) 5,284 1,379 43,310ITS Investments 0 0 0Enhancement 1,750 787 10,606Metro 7,337 7,337 41,833CMAQ 5,074 4,881 33,574Construction - Gaming 1,786 0 8,931Aeronautics 0 0 0Transit (New Service or Capital) 0 0 0
Total Mobility 22,061 15,125 147,480
SafetyRockfall Mitigation 0 0 0Hot Spots 416 0 2,496Traffic Signals 283 0 1,697Safety Surface Treatment 1,064 238 5,721
Maintenance (Traffic Ops - MLOS) 8,015 2,805 63,612Safety Education 0 0 0Railroad Crossings 0 0 0Hazard Elimination 2,697 1,864 16,548Safe Routes to Schools 0 0 0Rockfall Mitigation - Gaming 0 0 0Maintenance - Gaming 0 0 0
Total Safety 12,476 4,908 90,075
Program DeliveryMaintenance 1,882 420 14,933Road Equipment 1,845 351 14,192Cap. Op. Equipment 0 0 0Property 1,033 124 6,709TC Contingency 0 0 0Maintenance Incentive Program 0 0 0Operations 0 0 0Transit (Administration/Ops) 0 0 0Metro Planning (FHWA & FTA) 1,447 1,083 7,609
Total Program Delivery 6,207 1,977 43,443
Regional Priority Program 2,082 937 12,620Earmarks FY2008 and FY2009 5,738 0 29,817
Total Allocations 106,282 39,229 659,476
All allocations are subject to change based on performance measures and economic conditions.
Fiscal Year 2008 - 2035 Colorado Department of Transportation 2035 Plan Control TotalsPPACG FY 2009 Allocation
December 14, 2006(Inflated Amounts, Dollars in Thousands)
PPACG 2009 Th 26
Region 2 PPACG To Regions
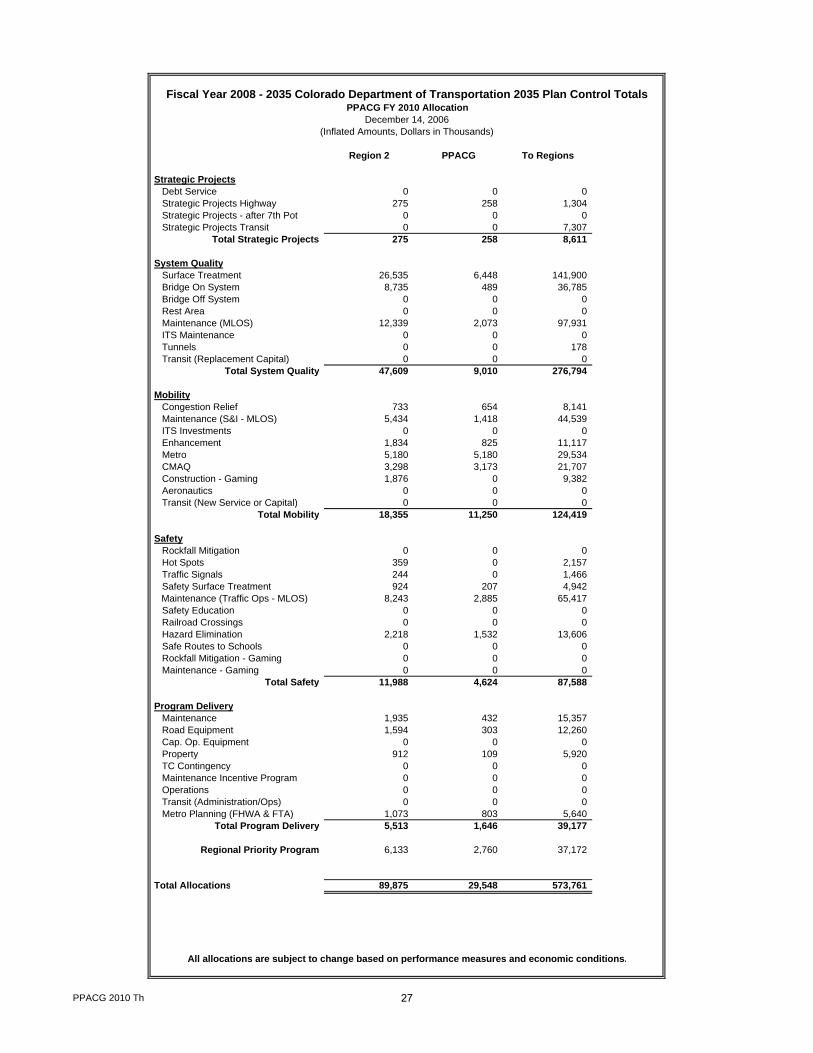
Strategic ProjectsDebt Service 0 0 0Strategic Projects Highway 275 258 1,304Strategic Projects - after 7th Pot 0 0 0Strategic Projects Transit 0 0 7,307
Total Strategic Projects 275 258 8,611
System QualitySurface Treatment 26,535 6,448 141,900Bridge On System 8,735 489 36,785Bridge Off System 0 0 0Rest Area 0 0 0Maintenance (MLOS) 12,339 2,073 97,931ITS Maintenance 0 0 0Tunnels 0 0 178Transit (Replacement Capital) 0 0 0
Total System Quality 47,609 9,010 276,794
MobilityCongestion Relief 733 654 8,141Maintenance (S&I - MLOS) 5,434 1,418 44,539ITS Investments 0 0 0Enhancement 1,834 825 11,117Metro 5,180 5,180 29,534CMAQ 3,298 3,173 21,707Construction - Gaming 1,876 0 9,382Aeronautics 0 0 0Transit (New Service or Capital) 0 0 0
Total Mobility 18,355 11,250 124,419
SafetyRockfall Mitigation 0 0 0Hot Spots 359 0 2,157Traffic Signals 244 0 1,466Safety Surface Treatment 924 207 4,942
Maintenance (Traffic Ops - MLOS) 8,243 2,885 65,417Safety Education 0 0 0Railroad Crossings 0 0 0Hazard Elimination 2,218 1,532 13,606Safe Routes to Schools 0 0 0Rockfall Mitigation - Gaming 0 0 0Maintenance - Gaming 0 0 0
Total Safety 11,988 4,624 87,588
Program DeliveryMaintenance 1,935 432 15,357Road Equipment 1,594 303 12,260Cap. Op. Equipment 0 0 0Property 912 109 5,920TC Contingency 0 0 0Maintenance Incentive Program 0 0 0Operations 0 0 0Transit (Administration/Ops) 0 0 0Metro Planning (FHWA & FTA) 1,073 803 5,640
Total Program Delivery 5,513 1,646 39,177
Regional Priority Program 6,133 2,760 37,172
Total Allocations 89,875 29,548 573,761
All allocations are subject to change based on performance measures and economic conditions.
Fiscal Year 2008 - 2035 Colorado Department of Transportation 2035 Plan Control TotalsPPACG FY 2010 Allocation
December 14, 2006(Inflated Amounts, Dollars in Thousands)
PPACG 2010 Th 27

Region 2 PPACG To Regions
Strategic ProjectsDebt Service 0 0 0Strategic Projects Highway 0 0 0Strategic Projects - after 7th Pot 0 0 0Strategic Projects Transit 0 0 0
Total Strategic Projects 0 0 0
System QualitySurface Treatment 19,089 4,639 99,422Bridge On System 7,925 444 33,377Bridge Off System 0 0 0Rest Area 0 0 0Maintenance (MLOS) 12,367 2,078 98,150ITS Maintenance 0 0 0Tunnels 0 0 119Transit (Replacement Capital) 0 0 0
Total System Quality 39,381 7,160 231,068
MobilityCongestion Relief 513 458 5,704Maintenance (S&I - MLOS) 5,446 1,421 44,638ITS Investments 0 0 0Enhancement 1,835 826 11,121Metro 5,555 5,555 31,674CMAQ 3,503 3,370 23,079Construction - Gaming 1,959 0 9,797Aeronautics 0 0 0Transit (New Service or Capital) 0 0 0
Total Mobility 18,812 11,631 126,013
SafetyRockfall Mitigation 0 0 0Hot Spots 242 0 1,450Traffic Signals 164 0 986Safety Surface Treatment 638 143 3,323
Maintenance (Traffic Ops - MLOS) 8,261 2,891 65,563Safety Education 0 0 0Railroad Crossings 0 0 0Hazard Elimination 2,359 1,630 14,472Safe Routes to Schools 0 0 0Rockfall Mitigation - Gaming 0 0 0Maintenance - Gaming 0 0 0
Total Safety 11,664 4,664 85,795
Program DeliveryMaintenance 1,939 432 15,391Road Equipment 1,072 204 8,244Cap. Op. Equipment 0 0 0Property 660 79 4,288TC Contingency 0 0 0Maintenance Incentive Program 0 0 0Operations 0 0 0Transit (Administration/Ops) 0 0 0Metro Planning (FHWA & FTA) 1,135 849 5,966
Total Program Delivery 4,806 1,564 33,889
Regional Priority Program 6,480 2,916 39,270
Total Allocations 81,143 27,935 516,035
All allocations are subject to change based on performance measures and economic conditions.
Fiscal Year 2008 - 2035 Colorado Department of Transportation 2035 Plan Control TotalsPPACG FY 2011 Allocation
December 14, 2006(Inflated Amounts, Dollars in Thousands)
PPACG 2011 Th 28

Region 2 PPACG To Regions
Strategic ProjectsDebt Service 0 0 0Strategic Projects Highway 38,550 36,054 182,481Strategic Projects - after 7th Pot 0 0 0Strategic Projects Transit 0 0 0
Total Strategic Projects 38,550 36,054 182,481
System QualitySurface Treatment 28,856 7,012 151,874Bridge On System 9,602 538 40,439Bridge Off System 0 0 0Rest Area 0 0 0Maintenance (MLOS) 12,636 2,123 100,285ITS Maintenance 0 0 0Tunnels 0 0 178Transit (Replacement Capital) 0 0 0
Total System Quality 51,094 9,673 292,776
MobilityCongestion Relief 784 700 8,713Maintenance (S&I - MLOS) 5,564 1,452 45,609ITS Investments 0 0 0Enhancement 1,835 826 11,123Metro 5,896 5,896 33,618CMAQ 3,690 3,550 24,326Construction - Gaming 2,046 0 10,232Aeronautics 0 0 0Transit (New Service or Capital) 0 0 0
Total Mobility 19,816 12,424 133,622
SafetyRockfall Mitigation 0 0 0Hot Spots 361 0 2,167Traffic Signals 245 0 1,473Safety Surface Treatment 944 211 4,966
Maintenance (Traffic Ops - MLOS) 8,441 2,954 66,990Safety Education 0 0 0Railroad Crossings 0 0 0Hazard Elimination 2,487 1,718 15,256Safe Routes to Schools 0 0 0Rockfall Mitigation - Gaming 0 0 0Maintenance - Gaming 0 0 0
Total Safety 12,478 4,884 90,852
Program DeliveryMaintenance 1,981 442 15,726Road Equipment 1,602 304 12,319Cap. Op. Equipment 0 0 0Property 916 110 5,945TC Contingency 0 0 0Maintenance Incentive Program 0 0 0Operations 0 0 0Transit (Administration/Ops) 0 0 0Metro Planning (FHWA & FTA) 1,191 891 6,261
Total Program Delivery 5,689 1,747 40,252
Regional Priority Program 6,798 3,059 41,199
Total Allocations 134,426 67,840 781,183
All allocations are subject to change based on performance measures and economic conditions.
Fiscal Year 2008 - 2035 Colorado Department of Transportation 2035 Plan Control TotalsPPACG FY 2012 Allocation
December 14, 2006(Inflated Amounts, Dollars in Thousands)
PPACG 2012 Th 29

Region 2 PPACG To Regions
Strategic ProjectsDebt Service 0 0 0Strategic Projects Highway 41,576 38,883 196,805Strategic Projects - after 7th Pot 0 0 0Strategic Projects Transit 0 0 0
Total Strategic Projects 41,576 38,883 196,805
System QualitySurface Treatment 26,310 6,393 154,763Bridge On System 9,958 558 41,938Bridge Off System 0 0 0Rest Area 0 0 0Maintenance (MLOS) 12,927 2,172 102,592ITS Maintenance 0 0 0Tunnels 0 0 178Transit (Replacement Capital) 0 0 0
Total System Quality 49,195 9,123 299,472
MobilityCongestion Relief 799 713 8,879Maintenance (S&I - MLOS) 5,692 1,486 46,659ITS Investments 0 0 0Enhancement 1,836 826 11,125Metro 6,228 6,228 35,511CMAQ 3,872 3,724 25,540Construction - Gaming 2,134 0 10,668Aeronautics 0 0 0Transit (New Service or Capital) 0 0 0
Total Mobility 20,561 12,977 138,382
SafetyRockfall Mitigation 0 0 0Hot Spots 361 0 2,167Traffic Signals 245 0 1,473Safety Surface Treatment 844 189 4,966
Maintenance (Traffic Ops - MLOS) 8,635 3,022 68,531Safety Education 0 0 0Railroad Crossings 0 0 0Hazard Elimination 2,611 1,804 16,020Safe Routes to Schools 0 0 0Rockfall Mitigation - Gaming 0 0 0Maintenance - Gaming 0 0 0
Total Safety 12,697 5,016 93,157
Program DeliveryMaintenance 2,027 452 16,088Road Equipment 1,601 304 12,319Cap. Op. Equipment 0 0 0Property 917 110 5,953TC Contingency 0 0 0Maintenance Incentive Program 0 0 0Operations 0 0 0Transit (Administration/Ops) 0 0 0Metro Planning (FHWA & FTA) 1,246 932 6,549
Total Program Delivery 5,791 1,798 40,909
Regional Priority Program 7,108 3,199 43,078
Total Allocations 136,927 70,996 811,803
All allocations are subject to change based on performance measures and economic conditions.
Fiscal Year 2008 - 2035 Colorado Department of Transportation 2035 Plan Control TotalsPPACG FY 2013 Allocation
December 14, 2006(Inflated Amounts, Dollars in Thousands)
PPACG 2013 Th 30
Region 2 PPACG To Regions
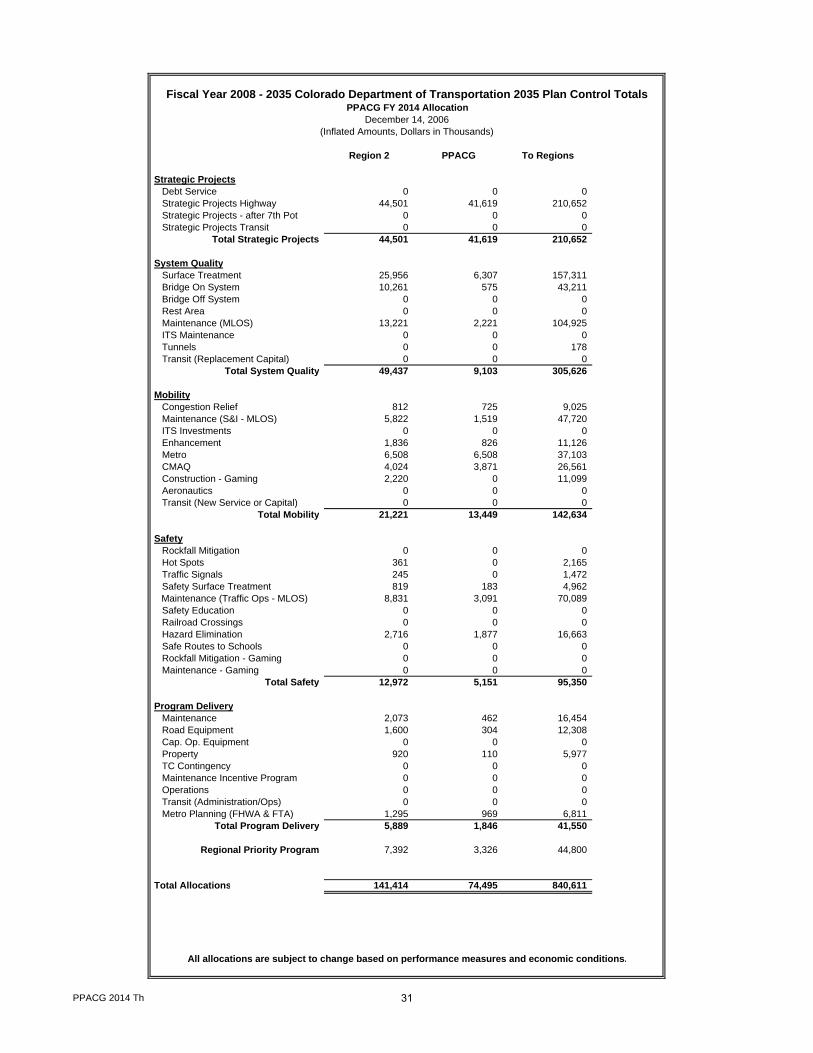
Strategic ProjectsDebt Service 0 0 0Strategic Projects Highway 44,501 41,619 210,652Strategic Projects - after 7th Pot 0 0 0Strategic Projects Transit 0 0 0
Total Strategic Projects 44,501 41,619 210,652
System QualitySurface Treatment 25,956 6,307 157,311Bridge On System 10,261 575 43,211Bridge Off System 0 0 0Rest Area 0 0 0Maintenance (MLOS) 13,221 2,221 104,925ITS Maintenance 0 0 0Tunnels 0 0 178Transit (Replacement Capital) 0 0 0
Total System Quality 49,437 9,103 305,626
MobilityCongestion Relief 812 725 9,025Maintenance (S&I - MLOS) 5,822 1,519 47,720ITS Investments 0 0 0Enhancement 1,836 826 11,126Metro 6,508 6,508 37,103CMAQ 4,024 3,871 26,561Construction - Gaming 2,220 0 11,099Aeronautics 0 0 0Transit (New Service or Capital) 0 0 0
Total Mobility 21,221 13,449 142,634
SafetyRockfall Mitigation 0 0 0Hot Spots 361 0 2,165Traffic Signals 245 0 1,472Safety Surface Treatment 819 183 4,962
Maintenance (Traffic Ops - MLOS) 8,831 3,091 70,089Safety Education 0 0 0Railroad Crossings 0 0 0Hazard Elimination 2,716 1,877 16,663Safe Routes to Schools 0 0 0Rockfall Mitigation - Gaming 0 0 0Maintenance - Gaming 0 0 0
Total Safety 12,972 5,151 95,350
Program DeliveryMaintenance 2,073 462 16,454Road Equipment 1,600 304 12,308Cap. Op. Equipment 0 0 0Property 920 110 5,977TC Contingency 0 0 0Maintenance Incentive Program 0 0 0Operations 0 0 0Transit (Administration/Ops) 0 0 0Metro Planning (FHWA & FTA) 1,295 969 6,811
Total Program Delivery 5,889 1,846 41,550
Regional Priority Program 7,392 3,326 44,800
Total Allocations 141,414 74,495 840,611
All allocations are subject to change based on performance measures and economic conditions.
Fiscal Year 2008 - 2035 Colorado Department of Transportation 2035 Plan Control TotalsPPACG FY 2014 Allocation
December 14, 2006(Inflated Amounts, Dollars in Thousands)
PPACG 2014 Th 31

32

Region 4 NFR To Regions NFR %
Strategic ProjectsDebt Service 0 0 0Strategic Projects Highway 330,482 237,947 3,162,475 7.5%Strategic Projects - after 7th Pot 538,644 161,593 2,992,467 5.4%Strategic Projects Transit 6,083 4,860 15,779 30.8%
Total Strategic Projects 875,209 404,401 6,170,721 6.6%
System QualitySurface Treatment 877,620 64,066 3,935,514 1.6%Bridge On System 104,255 13,136 1,061,455 1.2%Bridge Off System 0 0 0Rest Area 0 0 0Maintenance (MLOS) 408,922 75,242 2,800,838 2.7%ITS Maintenance 0 0 0Tunnels 0 0 5,143 0.0%Transit (Replacement Capital) 0 0 0
Total System Quality 1,390,797 152,444 7,802,950 2.0%
MobilityCongestion Relief 27,094 10,215 225,787 4.5%Maintenance (S&I - MLOS) 137,572 22,149 1,273,819 1.7%ITS Investments 0 0 0Enhancement 41,387 16,389 270,503 6.1%Metro 72,189 72,189 928,472 7.8%CMAQ 54,316 54,316 670,749 8.1%Construction - Gaming 0 0 242,683 0.0%Aeronautics 0 0 0Transit (New Service or Capital) 0 0 0
Total Mobility 332,559 175,258 3,612,014 4.9%
SafetyRockfall Mitigation 0 0 0Hot Spots 10,411 5,216 62,465 8.4%Traffic Signals 7,075 4,075 42,452 9.6%Safety Surface Treatment 31,923 5,938 143,151 4.1%
Maintenance (Traffic Ops - MLOS) 273,158 32,779 1,870,943 1.8%Safety Education 0 0 0Railroad Crossings 0 0 0Hazard Elimination 63,845 28,794 411,903 7.0%Safe Routes to Schools 0 0 0Rockfall Mitigation - Gaming 0 0 0Maintenance - Gaming 0 0 0
Total Safety 386,411 76,802 2,530,914 3.0%
Program DeliveryMaintenance 64,125 11,927 439,214 2.7%Road Equipment 41,901 13,115 355,093 3.7%Cap. Op. Equipment 0 0 0Property 27,905 7,534 170,152 4.4%TC Contingency 0 0 0Maintenance Incentive Program 0 0 0Operations 0 0 0Transit (Administration/Ops) 0 0 0Metro Planning (FHWA & FTA) 15,595 15,595 170,060
Total Program Delivery 149,526 48,171 1,134,519 4.2%
Regional Priority Program 101,839 21,590 665,612 3.2%Earmarks FY2008 and FY2009 5,837 0 60,625 0.0%
Total Allocations 3,242,178 878,666 21,977,355 4.0%
All allocations are subject to change based on performance measures and economic conditions.
Fiscal Year 2008 - 2035 Colorado Department of Transportation 2035 Plan Control TotalsNFR FY2008 - FY2035 Allocation
December 14, 2006(Deflated Amounts, Dollars in Thousands)
NFR 28 Yr Th 33
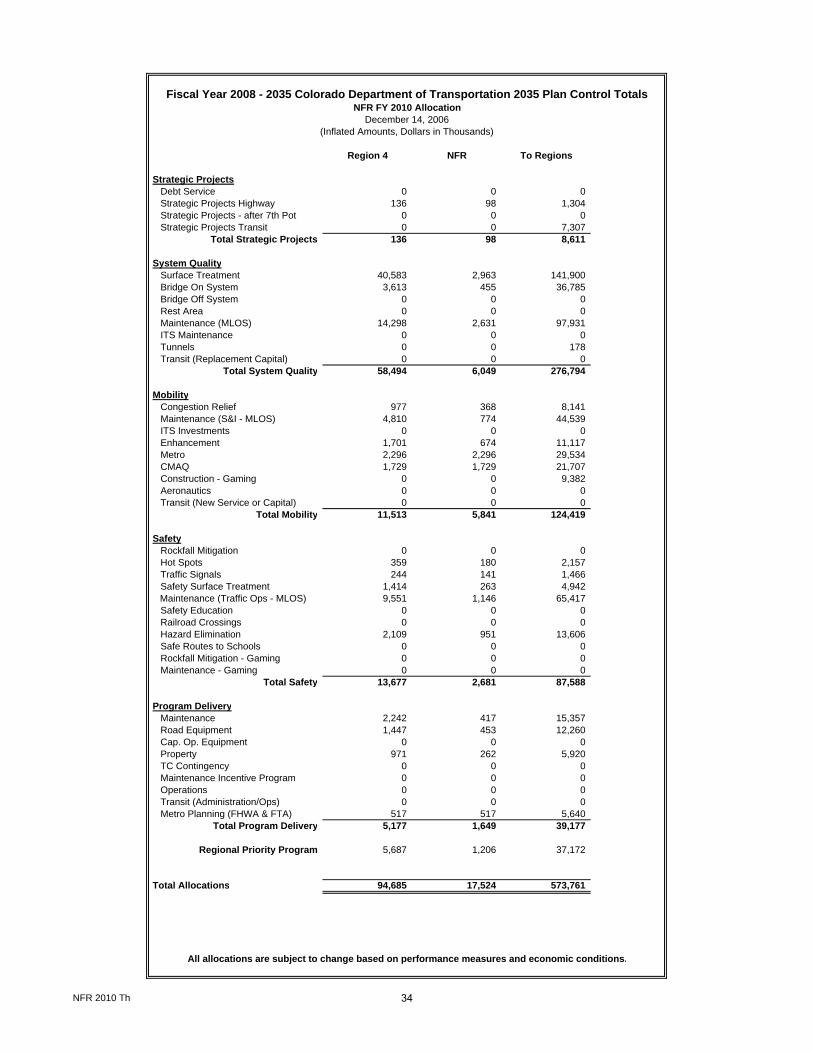
Region 4 NFR To Regions
Strategic ProjectsDebt Service 0 0 0Strategic Projects Highway 136 98 1,304Strategic Projects - after 7th Pot 0 0 0Strategic Projects Transit 0 0 7,307
Total Strategic Projects 136 98 8,611
System QualitySurface Treatment 40,583 2,963 141,900Bridge On System 3,613 455 36,785Bridge Off System 0 0 0Rest Area 0 0 0Maintenance (MLOS) 14,298 2,631 97,931ITS Maintenance 0 0 0Tunnels 0 0 178Transit (Replacement Capital) 0 0 0
Total System Quality 58,494 6,049 276,794
MobilityCongestion Relief 977 368 8,141Maintenance (S&I - MLOS) 4,810 774 44,539ITS Investments 0 0 0Enhancement 1,701 674 11,117Metro 2,296 2,296 29,534CMAQ 1,729 1,729 21,707Construction - Gaming 0 0 9,382Aeronautics 0 0 0Transit (New Service or Capital) 0 0 0
Total Mobility 11,513 5,841 124,419
SafetyRockfall Mitigation 0 0 0Hot Spots 359 180 2,157Traffic Signals 244 141 1,466Safety Surface Treatment 1,414 263 4,942
Maintenance (Traffic Ops - MLOS) 9,551 1,146 65,417Safety Education 0 0 0Railroad Crossings 0 0 0Hazard Elimination 2,109 951 13,606Safe Routes to Schools 0 0 0Rockfall Mitigation - Gaming 0 0 0Maintenance - Gaming 0 0 0
Total Safety 13,677 2,681 87,588
Program DeliveryMaintenance 2,242 417 15,357Road Equipment 1,447 453 12,260Cap. Op. Equipment 0 0 0Property 971 262 5,920TC Contingency 0 0 0Maintenance Incentive Program 0 0 0Operations 0 0 0Transit (Administration/Ops) 0 0 0Metro Planning (FHWA & FTA) 517 517 5,640
Total Program Delivery 5,177 1,649 39,177
Regional Priority Program 5,687 1,206 37,172
Total Allocations 94,685 17,524 573,761
All allocations are subject to change based on performance measures and economic conditions.
Fiscal Year 2008 - 2035 Colorado Department of Transportation 2035 Plan Control TotalsNFR FY 2010 Allocation
December 14, 2006(Inflated Amounts, Dollars in Thousands)
NFR 2010 Th 34
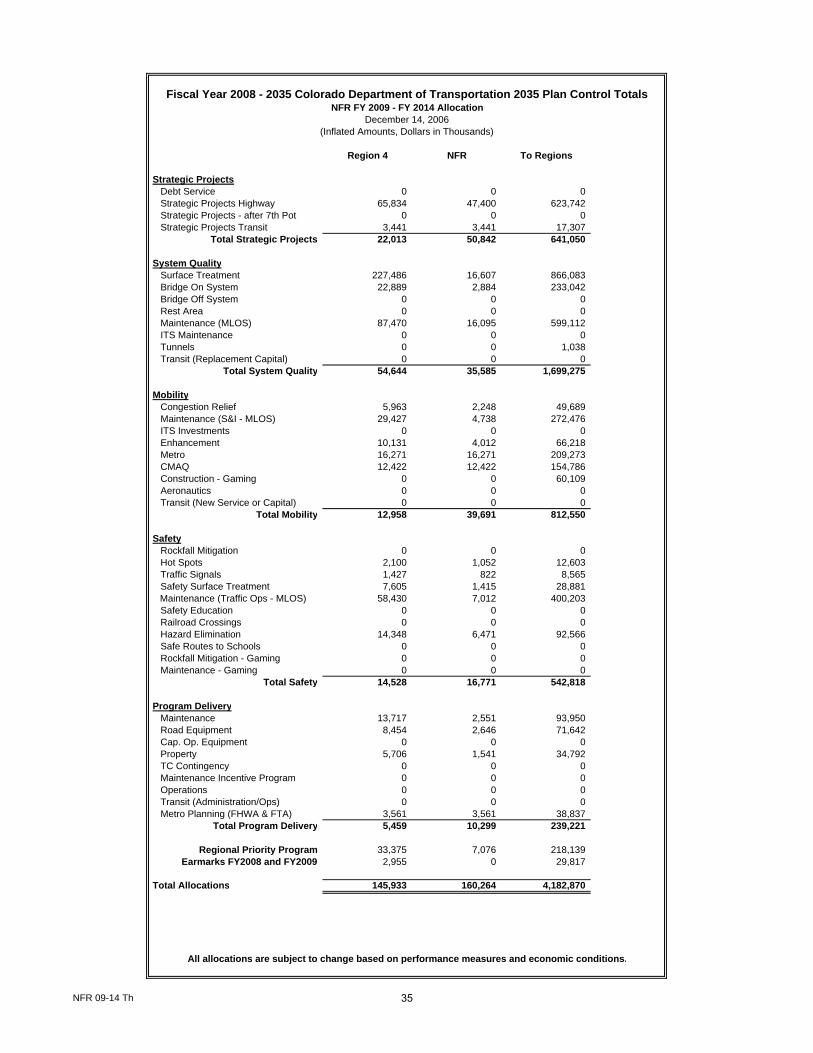
Region 4 NFR To Regions
Strategic ProjectsDebt Service 0 0 0Strategic Projects Highway 65,834 47,400 623,742Strategic Projects - after 7th Pot 0 0 0Strategic Projects Transit 3,441 3,441 17,307
Total Strategic Projects 22,013 50,842 641,050
System QualitySurface Treatment 227,486 16,607 866,083Bridge On System 22,889 2,884 233,042Bridge Off System 0 0 0Rest Area 0 0 0Maintenance (MLOS) 87,470 16,095 599,112ITS Maintenance 0 0 0Tunnels 0 0 1,038Transit (Replacement Capital) 0 0 0
Total System Quality 54,644 35,585 1,699,275
MobilityCongestion Relief 5,963 2,248 49,689Maintenance (S&I - MLOS) 29,427 4,738 272,476ITS Investments 0 0 0Enhancement 10,131 4,012 66,218Metro 16,271 16,271 209,273CMAQ 12,422 12,422 154,786Construction - Gaming 0 0 60,109Aeronautics 0 0 0Transit (New Service or Capital) 0 0 0
Total Mobility 12,958 39,691 812,550
SafetyRockfall Mitigation 0 0 0Hot Spots 2,100 1,052 12,603Traffic Signals 1,427 822 8,565Safety Surface Treatment 7,605 1,415 28,881
Maintenance (Traffic Ops - MLOS) 58,430 7,012 400,203Safety Education 0 0 0Railroad Crossings 0 0 0Hazard Elimination 14,348 6,471 92,566Safe Routes to Schools 0 0 0Rockfall Mitigation - Gaming 0 0 0Maintenance - Gaming 0 0 0
Total Safety 14,528 16,771 542,818
Program DeliveryMaintenance 13,717 2,551 93,950Road Equipment 8,454 2,646 71,642Cap. Op. Equipment 0 0 0Property 5,706 1,541 34,792TC Contingency 0 0 0Maintenance Incentive Program 0 0 0Operations 0 0 0Transit (Administration/Ops) 0 0 0Metro Planning (FHWA & FTA) 3,561 3,561 38,837
Total Program Delivery 5,459 10,299 239,221
Regional Priority Program 33,375 7,076 218,139Earmarks FY2008 and FY2009 2,955 0 29,817
Total Allocations 145,933 160,264 4,182,870
All allocations are subject to change based on performance measures and economic conditions.
Fiscal Year 2008 - 2035 Colorado Department of Transportation 2035 Plan Control TotalsNFR FY 2009 - FY 2014 Allocation
December 14, 2006(Inflated Amounts, Dollars in Thousands)
NFR 09-14 Th 35

Region 4 NFR To Regions
Strategic ProjectsDebt Service 0 0 0Strategic Projects Highway 4,224 3,041 36,040Strategic Projects - after 7th Pot 0 0 0Strategic Projects Transit 7,279 5,119 10,500
Total Strategic Projects 11,502 8,160 46,540
System QualitySurface Treatment 39,792 2,905 153,047Bridge On System 3,555 448 36,197Bridge Off System 0 0 0Rest Area 0 0 0Maintenance (MLOS) 13,529 2,489 92,663ITS Maintenance 0 0 0Tunnels 0 0 200Transit (Replacement Capital) 0 0 0
Total System Quality 56,876 5,842 282,107
MobilityCongestion Relief 1,054 397 8,781Maintenance (S&I - MLOS) 4,551 733 42,143ITS Investments 0 0 0Enhancement 1,603 635 10,480Metro 3,220 3,220 41,420CMAQ 2,692 2,692 33,243Construction - Gaming 0 0 13,183Aeronautics 0 0 0Transit (New Service or Capital) 0 0 0
Total Mobility 13,121 7,677 149,249
SafetyRockfall Mitigation 0 0 0Hot Spots 405 203 2,429Traffic Signals 275 158 1,651Safety Surface Treatment 1,453 270 5,567
Maintenance (Traffic Ops - MLOS) 9,037 1,084 61,898Safety Education 0 0 0Railroad Crossings 0 0 0Hazard Elimination 2,526 1,139 16,299Safe Routes to Schools 0 0 0Rockfall Mitigation - Gaming 0 0 0Maintenance - Gaming 0 0 0
Total Safety 13,696 2,855 87,844
Program DeliveryMaintenance 2,122 395 14,531Road Equipment 1,629 510 13,809Cap. Op. Equipment 0 0 0Property 1,075 290 6,553TC Contingency 0 0 0Maintenance Incentive Program 0 0 0Operations 0 0 0Transit (Administration/Ops) 0 0 0Metro Planning (FHWA & FTA) 680 680 7,417
Total Program Delivery 5,506 1,875 42,310
Regional Priority Program 4,322 916 28,248Earmarks FY2008 and FY2009 2,955 0 31,611
Total Allocations 107,978 27,326 667,909
All allocations are subject to change based on performance measures and economic conditions.
Fiscal Year 2008 - 2035 Colorado Department of Transportation 2035 Plan Control TotalsNFR FY 2008 Allocation
December 14, 2006(Inflated Amounts, Dollars in Thousands)
NFR 2008 Th 36
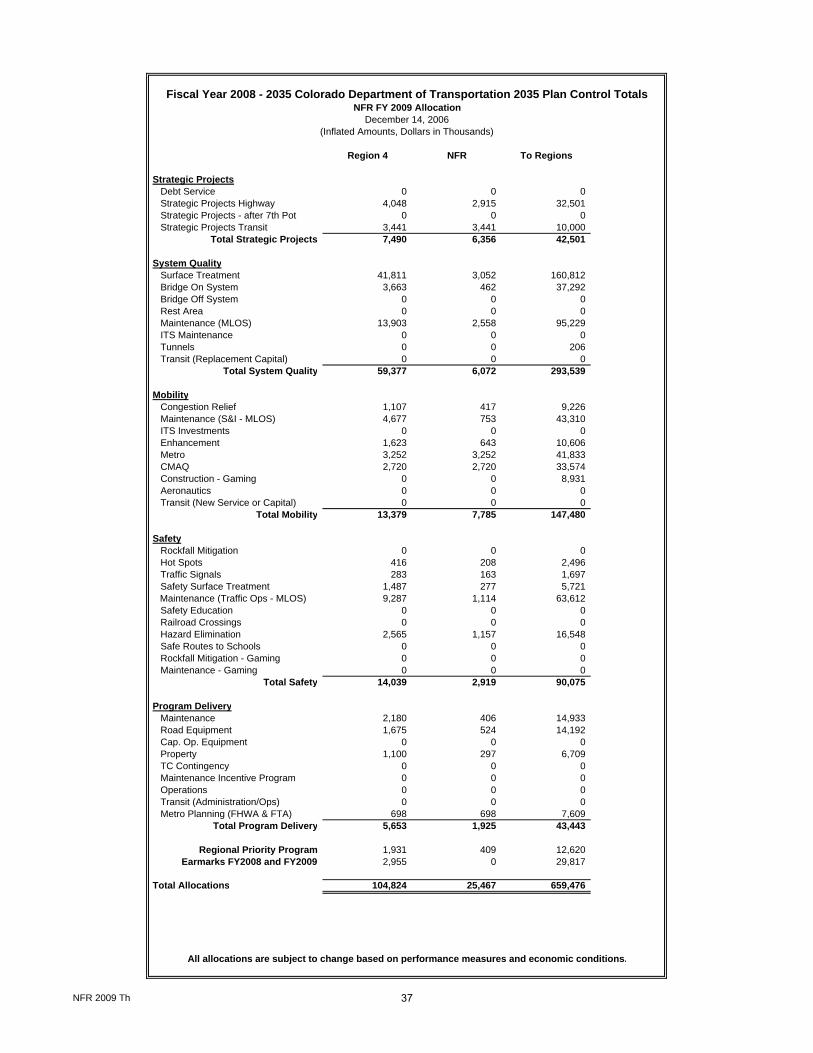
Region 4 NFR To Regions
Strategic ProjectsDebt Service 0 0 0Strategic Projects Highway 4,048 2,915 32,501Strategic Projects - after 7th Pot 0 0 0Strategic Projects Transit 3,441 3,441 10,000
Total Strategic Projects 7,490 6,356 42,501
System QualitySurface Treatment 41,811 3,052 160,812Bridge On System 3,663 462 37,292Bridge Off System 0 0 0Rest Area 0 0 0Maintenance (MLOS) 13,903 2,558 95,229ITS Maintenance 0 0 0Tunnels 0 0 206Transit (Replacement Capital) 0 0 0
Total System Quality 59,377 6,072 293,539
MobilityCongestion Relief 1,107 417 9,226Maintenance (S&I - MLOS) 4,677 753 43,310ITS Investments 0 0 0Enhancement 1,623 643 10,606Metro 3,252 3,252 41,833CMAQ 2,720 2,720 33,574Construction - Gaming 0 0 8,931Aeronautics 0 0 0Transit (New Service or Capital) 0 0 0
Total Mobility 13,379 7,785 147,480
SafetyRockfall Mitigation 0 0 0Hot Spots 416 208 2,496Traffic Signals 283 163 1,697Safety Surface Treatment 1,487 277 5,721
Maintenance (Traffic Ops - MLOS) 9,287 1,114 63,612Safety Education 0 0 0Railroad Crossings 0 0 0Hazard Elimination 2,565 1,157 16,548Safe Routes to Schools 0 0 0Rockfall Mitigation - Gaming 0 0 0Maintenance - Gaming 0 0 0
Total Safety 14,039 2,919 90,075
Program DeliveryMaintenance 2,180 406 14,933Road Equipment 1,675 524 14,192Cap. Op. Equipment 0 0 0Property 1,100 297 6,709TC Contingency 0 0 0Maintenance Incentive Program 0 0 0Operations 0 0 0Transit (Administration/Ops) 0 0 0Metro Planning (FHWA & FTA) 698 698 7,609
Total Program Delivery 5,653 1,925 43,443
Regional Priority Program 1,931 409 12,620Earmarks FY2008 and FY2009 2,955 0 29,817
Total Allocations 104,824 25,467 659,476
All allocations are subject to change based on performance measures and economic conditions.
Fiscal Year 2008 - 2035 Colorado Department of Transportation 2035 Plan Control TotalsNFR FY 2009 Allocation
December 14, 2006(Inflated Amounts, Dollars in Thousands)
NFR 2009 Th 37
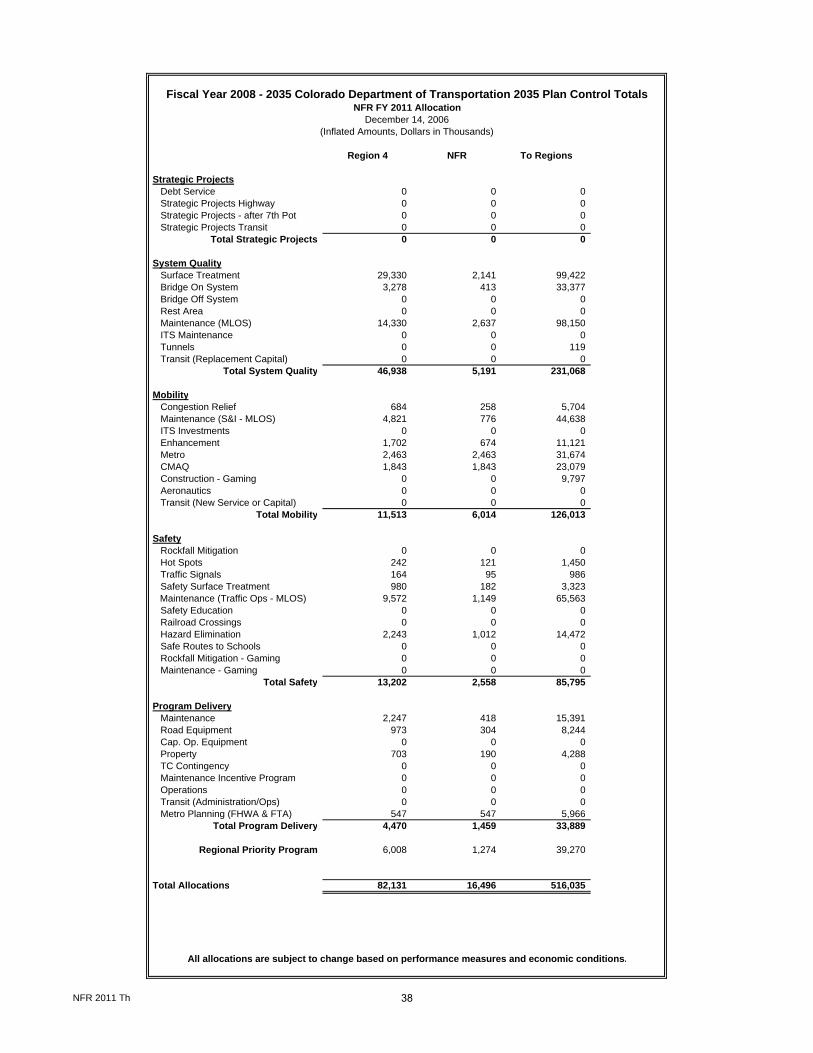
Region 4 NFR To Regions
Strategic ProjectsDebt Service 0 0 0Strategic Projects Highway 0 0 0Strategic Projects - after 7th Pot 0 0 0Strategic Projects Transit 0 0 0
Total Strategic Projects 0 0 0
System QualitySurface Treatment 29,330 2,141 99,422Bridge On System 3,278 413 33,377Bridge Off System 0 0 0Rest Area 0 0 0Maintenance (MLOS) 14,330 2,637 98,150ITS Maintenance 0 0 0Tunnels 0 0 119Transit (Replacement Capital) 0 0 0
Total System Quality 46,938 5,191 231,068
MobilityCongestion Relief 684 258 5,704Maintenance (S&I - MLOS) 4,821 776 44,638ITS Investments 0 0 0Enhancement 1,702 674 11,121Metro 2,463 2,463 31,674CMAQ 1,843 1,843 23,079Construction - Gaming 0 0 9,797Aeronautics 0 0 0Transit (New Service or Capital) 0 0 0
Total Mobility 11,513 6,014 126,013
SafetyRockfall Mitigation 0 0 0Hot Spots 242 121 1,450Traffic Signals 164 95 986Safety Surface Treatment 980 182 3,323
Maintenance (Traffic Ops - MLOS) 9,572 1,149 65,563Safety Education 0 0 0Railroad Crossings 0 0 0Hazard Elimination 2,243 1,012 14,472Safe Routes to Schools 0 0 0Rockfall Mitigation - Gaming 0 0 0Maintenance - Gaming 0 0 0
Total Safety 13,202 2,558 85,795
Program DeliveryMaintenance 2,247 418 15,391Road Equipment 973 304 8,244Cap. Op. Equipment 0 0 0Property 703 190 4,288TC Contingency 0 0 0Maintenance Incentive Program 0 0 0Operations 0 0 0Transit (Administration/Ops) 0 0 0Metro Planning (FHWA & FTA) 547 547 5,966
Total Program Delivery 4,470 1,459 33,889
Regional Priority Program 6,008 1,274 39,270
Total Allocations 82,131 16,496 516,035
All allocations are subject to change based on performance measures and economic conditions.
Fiscal Year 2008 - 2035 Colorado Department of Transportation 2035 Plan Control TotalsNFR FY 2011 Allocation
December 14, 2006(Inflated Amounts, Dollars in Thousands)
NFR 2011 Th 38
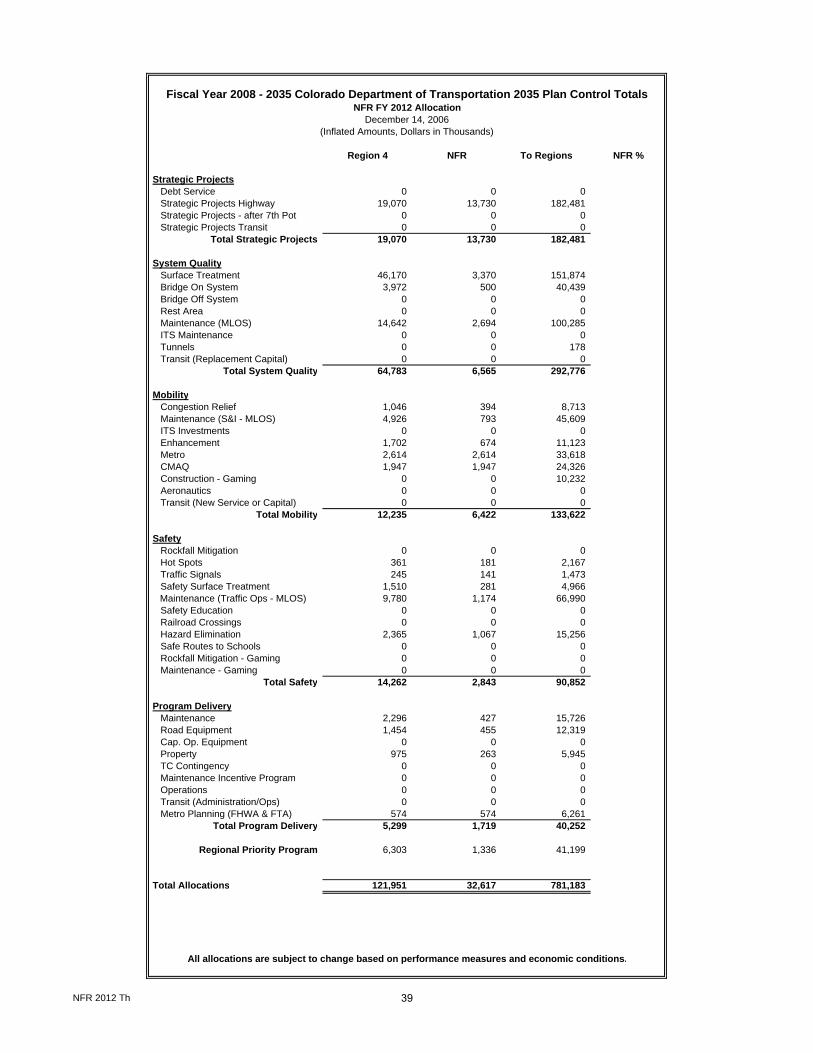
Region 4 NFR To Regions NFR %
Strategic ProjectsDebt Service 0 0 0Strategic Projects Highway 19,070 13,730 182,481Strategic Projects - after 7th Pot 0 0 0Strategic Projects Transit 0 0 0
Total Strategic Projects 19,070 13,730 182,481
System QualitySurface Treatment 46,170 3,370 151,874Bridge On System 3,972 500 40,439Bridge Off System 0 0 0Rest Area 0 0 0Maintenance (MLOS) 14,642 2,694 100,285ITS Maintenance 0 0 0Tunnels 0 0 178Transit (Replacement Capital) 0 0 0
Total System Quality 64,783 6,565 292,776
MobilityCongestion Relief 1,046 394 8,713Maintenance (S&I - MLOS) 4,926 793 45,609ITS Investments 0 0 0Enhancement 1,702 674 11,123Metro 2,614 2,614 33,618CMAQ 1,947 1,947 24,326Construction - Gaming 0 0 10,232Aeronautics 0 0 0Transit (New Service or Capital) 0 0 0
Total Mobility 12,235 6,422 133,622
SafetyRockfall Mitigation 0 0 0Hot Spots 361 181 2,167Traffic Signals 245 141 1,473Safety Surface Treatment 1,510 281 4,966
Maintenance (Traffic Ops - MLOS) 9,780 1,174 66,990Safety Education 0 0 0Railroad Crossings 0 0 0Hazard Elimination 2,365 1,067 15,256Safe Routes to Schools 0 0 0Rockfall Mitigation - Gaming 0 0 0Maintenance - Gaming 0 0 0
Total Safety 14,262 2,843 90,852
Program DeliveryMaintenance 2,296 427 15,726Road Equipment 1,454 455 12,319Cap. Op. Equipment 0 0 0Property 975 263 5,945TC Contingency 0 0 0Maintenance Incentive Program 0 0 0Operations 0 0 0Transit (Administration/Ops) 0 0 0Metro Planning (FHWA & FTA) 574 574 6,261
Total Program Delivery 5,299 1,719 40,252
Regional Priority Program 6,303 1,336 41,199
Total Allocations 121,951 32,617 781,183
All allocations are subject to change based on performance measures and economic conditions.
Fiscal Year 2008 - 2035 Colorado Department of Transportation 2035 Plan Control TotalsNFR FY 2012 Allocation
December 14, 2006(Inflated Amounts, Dollars in Thousands)
NFR 2012 Th 39

Region 4 NFR To Regions
Strategic ProjectsDebt Service 0 0 0Strategic Projects Highway 20,566 14,808 196,805Strategic Projects - after 7th Pot 0 0 0Strategic Projects Transit 0 0 0
Total Strategic Projects 20,566 14,808 196,805
System QualitySurface Treatment 34,512 2,519 154,763Bridge On System 4,119 519 41,938Bridge Off System 0 0 0Rest Area 0 0 0Maintenance (MLOS) 14,978 2,756 102,592ITS Maintenance 0 0 0Tunnels 0 0 178Transit (Replacement Capital) 0 0 0
Total System Quality 53,610 5,794 299,472
MobilityCongestion Relief 1,065 402 8,879Maintenance (S&I - MLOS) 5,039 811 46,659ITS Investments 0 0 0Enhancement 1,702 674 11,125Metro 2,761 2,761 35,511CMAQ 2,049 2,049 25,540Construction - Gaming 0 0 10,668Aeronautics 0 0 0Transit (New Service or Capital) 0 0 0
Total Mobility 12,617 6,697 138,382
SafetyRockfall Mitigation 0 0 0Hot Spots 361 181 2,167Traffic Signals 245 141 1,473Safety Surface Treatment 1,107 206 4,966
Maintenance (Traffic Ops - MLOS) 10,006 1,201 68,531Safety Education 0 0 0Railroad Crossings 0 0 0Hazard Elimination 2,483 1,120 16,020Safe Routes to Schools 0 0 0Rockfall Mitigation - Gaming 0 0 0Maintenance - Gaming 0 0 0
Total Safety 14,203 2,849 93,157
Program DeliveryMaintenance 2,349 437 16,088Road Equipment 1,454 455 12,319Cap. Op. Equipment 0 0 0Property 976 264 5,953TC Contingency 0 0 0Maintenance Incentive Program 0 0 0Operations 0 0 0Transit (Administration/Ops) 0 0 0Metro Planning (FHWA & FTA) 601 601 6,549
Total Program Delivery 5,379 1,756 40,909
Regional Priority Program 6,591 1,397 43,078
Total Allocations 112,966 33,301 811,803
All allocations are subject to change based on performance measures and economic conditions.
Fiscal Year 2008 - 2035 Colorado Department of Transportation 2035 Plan Control TotalsNFR FY 2013 Allocation
December 14, 2006(Inflated Amounts, Dollars in Thousands)
NFR 2013 Th 40
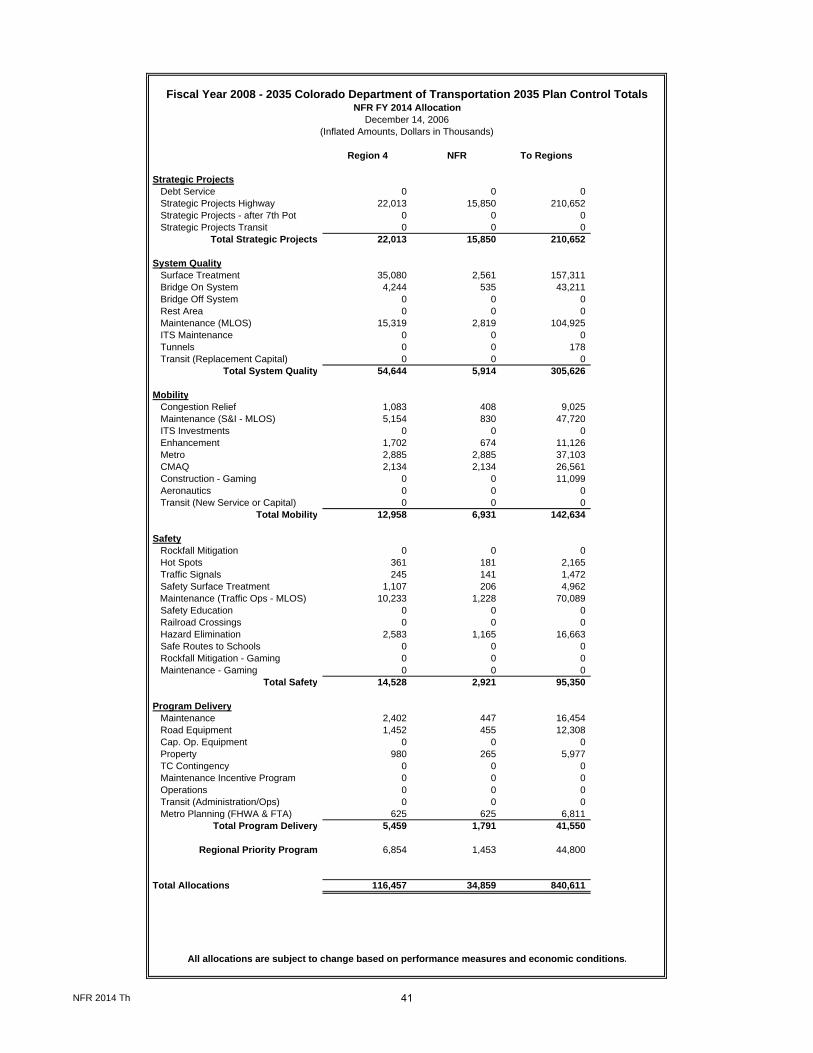
Region 4 NFR To Regions
Strategic ProjectsDebt Service 0 0 0Strategic Projects Highway 22,013 15,850 210,652Strategic Projects - after 7th Pot 0 0 0Strategic Projects Transit 0 0 0
Total Strategic Projects 22,013 15,850 210,652
System QualitySurface Treatment 35,080 2,561 157,311Bridge On System 4,244 535 43,211Bridge Off System 0 0 0Rest Area 0 0 0Maintenance (MLOS) 15,319 2,819 104,925ITS Maintenance 0 0 0Tunnels 0 0 178Transit (Replacement Capital) 0 0 0
Total System Quality 54,644 5,914 305,626
MobilityCongestion Relief 1,083 408 9,025Maintenance (S&I - MLOS) 5,154 830 47,720ITS Investments 0 0 0Enhancement 1,702 674 11,126Metro 2,885 2,885 37,103CMAQ 2,134 2,134 26,561Construction - Gaming 0 0 11,099Aeronautics 0 0 0Transit (New Service or Capital) 0 0 0
Total Mobility 12,958 6,931 142,634
SafetyRockfall Mitigation 0 0 0Hot Spots 361 181 2,165Traffic Signals 245 141 1,472Safety Surface Treatment 1,107 206 4,962
Maintenance (Traffic Ops - MLOS) 10,233 1,228 70,089Safety Education 0 0 0Railroad Crossings 0 0 0Hazard Elimination 2,583 1,165 16,663Safe Routes to Schools 0 0 0Rockfall Mitigation - Gaming 0 0 0Maintenance - Gaming 0 0 0
Total Safety 14,528 2,921 95,350
Program DeliveryMaintenance 2,402 447 16,454Road Equipment 1,452 455 12,308Cap. Op. Equipment 0 0 0Property 980 265 5,977TC Contingency 0 0 0Maintenance Incentive Program 0 0 0Operations 0 0 0Transit (Administration/Ops) 0 0 0Metro Planning (FHWA & FTA) 625 625 6,811
Total Program Delivery 5,459 1,791 41,550
Regional Priority Program 6,854 1,453 44,800
Total Allocations 116,457 34,859 840,611
All allocations are subject to change based on performance measures and economic conditions.
Fiscal Year 2008 - 2035 Colorado Department of Transportation 2035 Plan Control TotalsNFR FY 2014 Allocation
December 14, 2006(Inflated Amounts, Dollars in Thousands)
NFR 2014 Th 41