Embed Size (px)
Citation preview
Transportation Planning Based on GSM Traces:A Case Study on Ivory Coast
Mirco Nanni1(B), Roberto Trasarti1, Barbara Furletti1, Lorenzo Gabrielli1,Peter Van Der Mede2, Joost De Bruijn2, Erik De Romph2, and Gerard Bruil2
1 KDD Lab, Isti CNR, Pisa, Italy{mirco.nanni,roberto.trasarti,barbara.furletti,
lorenzo.gabrielli}@isti.cnr.it2 Goudappel Groep, Deventer, The Netherlands
{pvdmede,jdbruijn,edromph,gbruil}@goudappel.nl
Abstract. In this work we present an analysis process that exploitsmobile phone transaction (trajectory) data to infer a transport demandmodel for the territory under monitoring. In particular, long-term analy-sis of individual call traces are performed to reconstruct systematic move-ments, and to infer an origin-destination matrix. We will show a casestudy on Ivory Coast, with emphasis on its major urbanization Abid-jan. The case study includes the exploitation of the inferred mobilitydemand model in the construction of a transport model that projectsthe demand onto the transportation network (obtained from open data),and thus allows an understanding of current and future infrastructurerequirements of the country.
1 Introduction
Population growth, massive urbanization and, particularly, the extensive increaseof car use in the last century have led to serious spatial, transport, infrastructuraland environmental problems in almost all urbanized areas. As a consequence,since the 1960s urban and transport planning methodologies were developed toforecast future traffic volumes and the expected use of infrastructure and facili-ties. The purpose of such forecasts is evident: infrastructure and urban planningprovide keys to the mitigation and preclusion of transport and environmentalproblems. Today, urban and transport planning are major tasks of all publicauthorities.
The availability of spatial data on demographics, labor and land use has untilnow been a prerequisite for establishing an Origin and Destination matrix (ODmatrix) for a transport model. It is a time consuming activity to obtain the nec-essary data in many developed countries. Moreover, in most developing countriesthe overall availability of data is very limited and, therefore, the use of transportmodels has never been a promising option for such countries. In this work weexplore the possibility of deriving a proper OD matrix from mobile phone data,by using publicly available (free) transport network data and standard trans-portation modeling software, in order to build a basic transport demand model.
J. Nin and D. Villatoro (Eds.): CitiSens 2013, LNAI 8313, pp. 15–25, 2014.DOI: 10.1007/978-3-319-04178-0 2, c© Springer International Publishing Switzerland 2014
16 M. Nanni et al.
In this way, we also provide evidence that also for countries or cities where manydata seem to be lacking, now transport demand models can be created. This willon the one hand allow national and local authorities to have a far better under-standing of transportation needs and challenges, and will help funding agenciesand investors to better assess their potential risks and benefits.
In the next sections we will describe step by step the process we proposeto derive transport demand models from phone data, and use it to build a (asfar as we know) first transport demand model for Ivory Coast and its majorurbanization Abidjan.
2 Background
This work tries to combine data mining of GSM traces with transportationmodeling methodologies to gain insights into mobility in a monitored area, toallow what-if analysis through simulation or modeling.
GSM data have already been used to describe mobility in several studies,essentially based on the fact that a sequence of geo-referenced calls of usersconstitutes approximate trajectories of their movements. The key limitations ofGSM data are that locations are only approximations and that sampling ratemay be low and erratic. Works like [1] try to overcome these issues by workingat a large geographical scale and/or under specific conditions (in that case,users where tourists in a large area). In the present work we follow a differentapproach, and try to exploit the relatively long temporal extension of a datasetto infer more reliable movement information. In particular, an approach similarto [2] (translated from GPS to GSM data) [6] and [9] is adopted, where we tryto extract regular movements that repeat consistently in time, which thereforeare less likely to be artifacts of the data sampling procedure, and use them tomeasure systematic mobility in the area (details are provided in next sections).Also, concepts like most favored location, which are exploited in this work, havealready been applied in the scientific studies, e.g. [3], but mainly for simpledistributions of a population or the recognition of specific activities, such asworking, being at home, or leisure.
Macroscopic transport modeling methodology is well established [7,8]. Thismethodology is mainly implemented through commercial and academic softwaretools (e.g. OmniTRANS, Visum, Cube, Emme/2, TransCAD), and readily avail-able. These tools can be used only by professionals with accurate knowledge oftraffic theory and transport modeling experience. Macroscopic modeling has beenused widely by governments and engineering firms to predict future transportnetwork problems and for infrastructure planning. The current paper does notaddress network or transport planning as such. Its main purpose is to use datamining of GSM traces as an input for transport models, thus integrating thesetraces as widely and readily available sources of information into the transportplanning realm.
Transportation Planning Based on GSM Traces 17
3 Introduction of the Case Study
The data used in this work is composed of anonymized Call Detail Records(CDR) of mobile phone calls and SMS exchanges between five million of Orangescustomers in Ivory Coast (corresponding to around one quarter of the nationalpopulation) between December 1, 2011 and April 28, 2012. The data was madeavailable by Orange in the context of the D4D (Data for Development) datachallenge [10]. The data contains 10 samples taken in different time windows,each covering 50,000 individuals, corresponding to around 1 % of the populationof customers. The IDs of individuals are changed from sample to sample andit is not known whether the sub-populations described in the different samplesoverlap, making it impossible to link data among different samples. The dataprovided contains for each observation the coordinates of the antenna servingthe user during a communication, in other words the device is operating in anarea covered by that antenna.
In general the coverage of an antenna is influenced by several factors: strengthof the signal, the height of the pole, the orientation, the weather, the nearbybuildings, etc. Since the provided data does not contain this information and it isnot easy to retrieve it from external sources, we apply a well-known methodologyin order to estimate the coverage of the antennas using only their spatial location.The method is called as centroid Voronoi tessellation and assumes that the spaceis partitioned into separate areas, each defined as the set of locations that arecloser to our antenna than any other one. The partitioning of the space obtainedwill be used in all the following analysis.
4 Systematic Traffic Analysis and Transport Modeling
The basic events we are interested to spot in the data are systematic trips. Fol-lowing the approach in [2], we define systematic trips as routine movements thatusers perform (almost) every day at (approximately) the same hours. By com-bining together the systematic movements of each individual in our population,we can obtain an estimated OD matrix that describes the expected flow of peoplebetween pairs of spatial locations as in [4].
Since the current GSM data are not detailed enough to detect whether a userstopped at a location or initiated a trip within an input sequence, we tackledthe problem through a two-step procedure: first, we identified locations thatare significant for the mobility of the individual, also called attractors; second,we identified movements between significant locations that occur with a highfrequency, which are later aggregated across the whole population to fill in anOD matrix. The first step is performed according to the standard approach, alsoillustrated in [3]: the location where the largest number of calls took place isidentified and labeled as L1 (most frequent location). Then, the second mostfrequent location is identified and labeled as L2. It seems likely that in mostcases L1 corresponds to the home location and L2 to work or any other mainactivity of the individual, or vice versa. The second step is performed over the
18 M. Nanni et al.
sequences of L1 and L2 that appear in the traces of each single user. We checkedthe frequency of movements L1 L2 and L2 L1 within specified time slots. Eachmovement identifies a trip, and if its frequency is high enough, we assume it tobe a systematic trip that the user performs during a typical day.
4.1 Detecting Users Attractors
The available data provide the information of the zone from which a phone call isstarted. Thanks to the large amount of data provided by the telephone operatorit is possible to use the spatio-temporal footprint left by the users for the purposeof monitoring their movements in the territory.
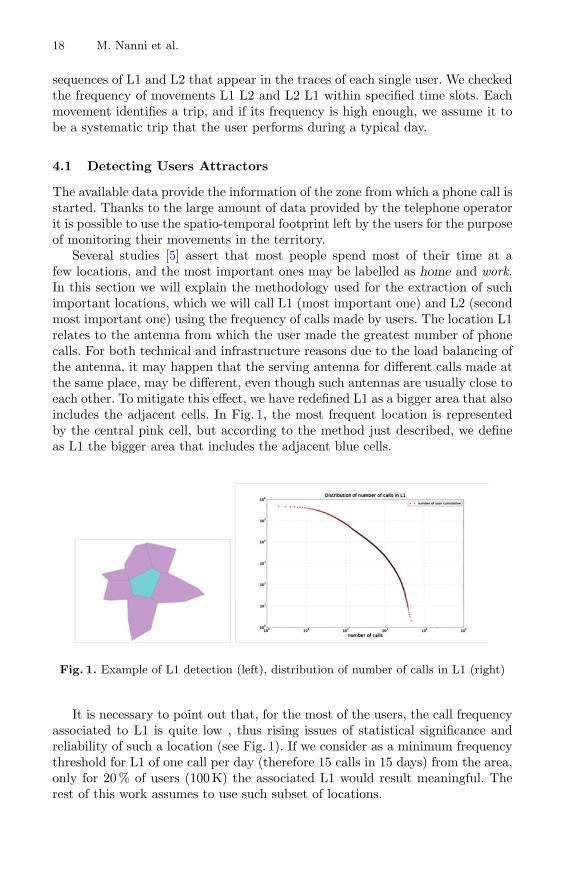
Several studies [5] assert that most people spend most of their time at afew locations, and the most important ones may be labelled as home and work.In this section we will explain the methodology used for the extraction of suchimportant locations, which we will call L1 (most important one) and L2 (secondmost important one) using the frequency of calls made by users. The location L1relates to the antenna from which the user made the greatest number of phonecalls. For both technical and infrastructure reasons due to the load balancing ofthe antenna, it may happen that the serving antenna for different calls made atthe same place, may be different, even though such antennas are usually close toeach other. To mitigate this effect, we have redefined L1 as a bigger area that alsoincludes the adjacent cells. In Fig. 1, the most frequent location is representedby the central pink cell, but according to the method just described, we defineas L1 the bigger area that includes the adjacent blue cells.
Fig. 1. Example of L1 detection (left), distribution of number of calls in L1 (right)
It is necessary to point out that, for the most of the users, the call frequencyassociated to L1 is quite low , thus rising issues of statistical significance andreliability of such a location (see Fig. 1). If we consider as a minimum frequencythreshold for L1 of one call per day (therefore 15 calls in 15 days) from the area,only for 20 % of users (100 K) the associated L1 would result meaningful. Therest of this work assumes to use such subset of locations.
Transportation Planning Based on GSM Traces 19
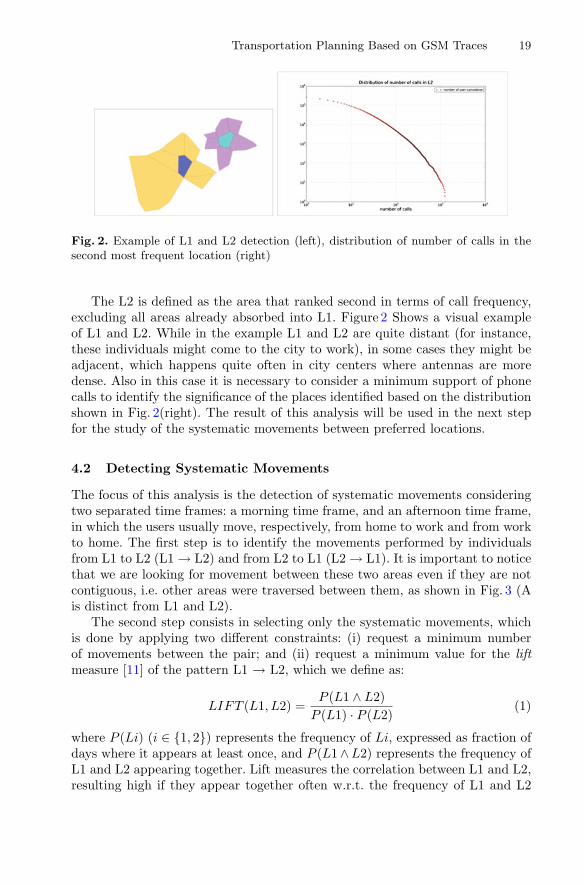
Fig. 2. Example of L1 and L2 detection (left), distribution of number of calls in thesecond most frequent location (right)
The L2 is defined as the area that ranked second in terms of call frequency,excluding all areas already absorbed into L1. Figure 2 Shows a visual exampleof L1 and L2. While in the example L1 and L2 are quite distant (for instance,these individuals might come to the city to work), in some cases they might beadjacent, which happens quite often in city centers where antennas are moredense. Also in this case it is necessary to consider a minimum support of phonecalls to identify the significance of the places identified based on the distributionshown in Fig. 2(right). The result of this analysis will be used in the next stepfor the study of the systematic movements between preferred locations.
4.2 Detecting Systematic Movements
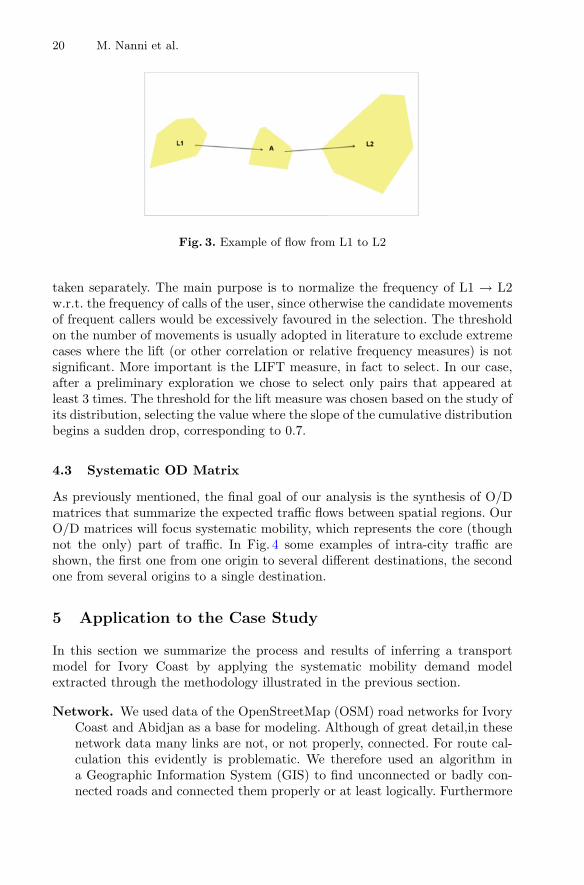
The focus of this analysis is the detection of systematic movements consideringtwo separated time frames: a morning time frame, and an afternoon time frame,in which the users usually move, respectively, from home to work and from workto home. The first step is to identify the movements performed by individualsfrom L1 to L2 (L1 → L2) and from L2 to L1 (L2 → L1). It is important to noticethat we are looking for movement between these two areas even if they are notcontiguous, i.e. other areas were traversed between them, as shown in Fig. 3 (Ais distinct from L1 and L2).
The second step consists in selecting only the systematic movements, whichis done by applying two different constraints: (i) request a minimum numberof movements between the pair; and (ii) request a minimum value for the liftmeasure [11] of the pattern L1 → L2, which we define as:
LIFT (L1, L2) =P (L1 ∧ L2)
P (L1) · P (L2)(1)
where P (Li) (i ∈ {1, 2}) represents the frequency of Li, expressed as fraction ofdays where it appears at least once, and P (L1 ∧L2) represents the frequency ofL1 and L2 appearing together. Lift measures the correlation between L1 and L2,resulting high if they appear together often w.r.t. the frequency of L1 and L2
20 M. Nanni et al.
Fig. 3. Example of flow from L1 to L2
taken separately. The main purpose is to normalize the frequency of L1 → L2w.r.t. the frequency of calls of the user, since otherwise the candidate movementsof frequent callers would be excessively favoured in the selection. The thresholdon the number of movements is usually adopted in literature to exclude extremecases where the lift (or other correlation or relative frequency measures) is notsignificant. More important is the LIFT measure, in fact to select. In our case,after a preliminary exploration we chose to select only pairs that appeared atleast 3 times. The threshold for the lift measure was chosen based on the study ofits distribution, selecting the value where the slope of the cumulative distributionbegins a sudden drop, corresponding to 0.7.
4.3 Systematic OD Matrix
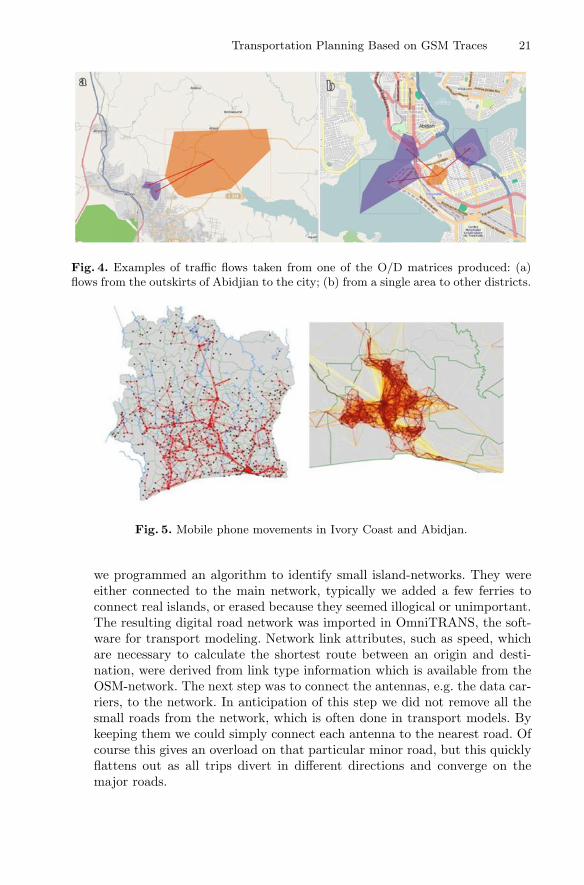
As previously mentioned, the final goal of our analysis is the synthesis of O/Dmatrices that summarize the expected traffic flows between spatial regions. OurO/D matrices will focus systematic mobility, which represents the core (thoughnot the only) part of traffic. In Fig. 4 some examples of intra-city traffic areshown, the first one from one origin to several different destinations, the secondone from several origins to a single destination.
5 Application to the Case Study
In this section we summarize the process and results of inferring a transportmodel for Ivory Coast by applying the systematic mobility demand modelextracted through the methodology illustrated in the previous section.
Network. We used data of the OpenStreetMap (OSM) road networks for IvoryCoast and Abidjan as a base for modeling. Although of great detail,in thesenetwork data many links are not, or not properly, connected. For route cal-culation this evidently is problematic. We therefore used an algorithm ina Geographic Information System (GIS) to find unconnected or badly con-nected roads and connected them properly or at least logically. Furthermore
Transportation Planning Based on GSM Traces 21
Fig. 4. Examples of traffic flows taken from one of the O/D matrices produced: (a)flows from the outskirts of Abidjian to the city; (b) from a single area to other districts.
Fig. 5. Mobile phone movements in Ivory Coast and Abidjan.
we programmed an algorithm to identify small island-networks. They wereeither connected to the main network, typically we added a few ferries toconnect real islands, or erased because they seemed illogical or unimportant.The resulting digital road network was imported in OmniTRANS, the soft-ware for transport modeling. Network link attributes, such as speed, whichare necessary to calculate the shortest route between an origin and desti-nation, were derived from link type information which is available from theOSM-network. The next step was to connect the antennas, e.g. the data car-riers, to the network. In anticipation of this step we did not remove all thesmall roads from the network, which is often done in transport models. Bykeeping them we could simply connect each antenna to the nearest road. Ofcourse this gives an overload on that particular minor road, but this quicklyflattens out as all trips divert in different directions and converge on themajor roads.
22 M. Nanni et al.
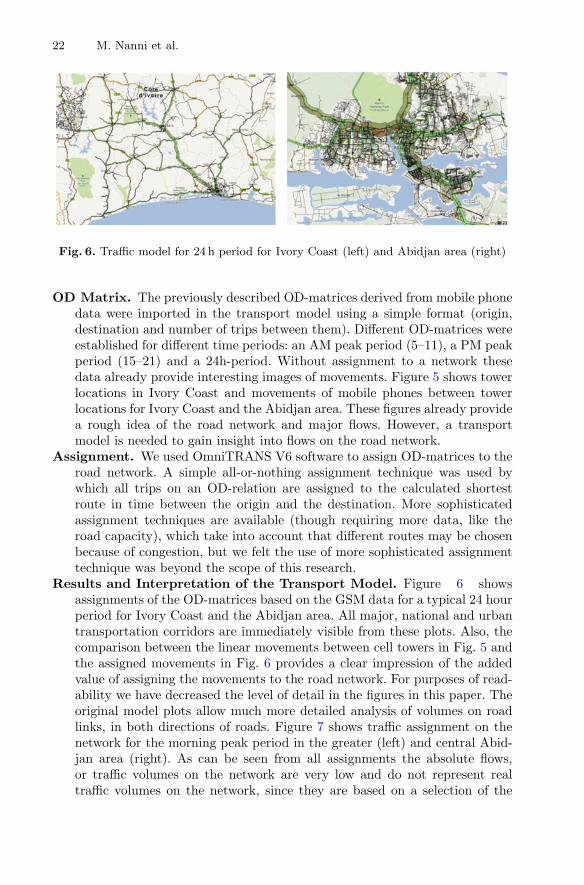
Fig. 6. Traffic model for 24 h period for Ivory Coast (left) and Abidjan area (right)
OD Matrix. The previously described OD-matrices derived from mobile phonedata were imported in the transport model using a simple format (origin,destination and number of trips between them). Different OD-matrices wereestablished for different time periods: an AM peak period (5–11), a PM peakperiod (15–21) and a 24h-period. Without assignment to a network thesedata already provide interesting images of movements. Figure 5 shows towerlocations in Ivory Coast and movements of mobile phones between towerlocations for Ivory Coast and the Abidjan area. These figures already providea rough idea of the road network and major flows. However, a transportmodel is needed to gain insight into flows on the road network.
Assignment. We used OmniTRANS V6 software to assign OD-matrices to theroad network. A simple all-or-nothing assignment technique was used bywhich all trips on an OD-relation are assigned to the calculated shortestroute in time between the origin and the destination. More sophisticatedassignment techniques are available (though requiring more data, like theroad capacity), which take into account that different routes may be chosenbecause of congestion, but we felt the use of more sophisticated assignmenttechnique was beyond the scope of this research.
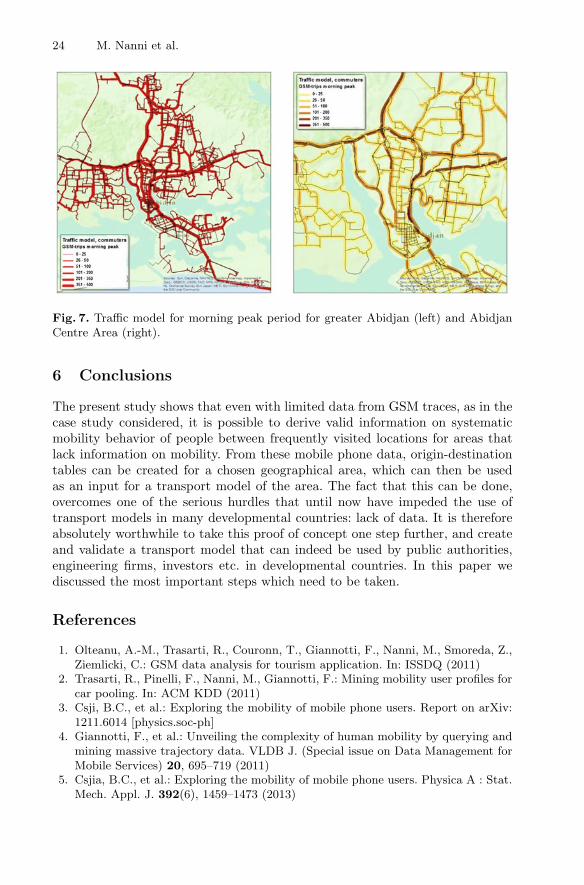
Results and Interpretation of the Transport Model. Figure 6 showsassignments of the OD-matrices based on the GSM data for a typical 24 hourperiod for Ivory Coast and the Abidjan area. All major, national and urbantransportation corridors are immediately visible from these plots. Also, thecomparison between the linear movements between cell towers in Fig. 5 andthe assigned movements in Fig. 6 provides a clear impression of the addedvalue of assigning the movements to the road network. For purposes of read-ability we have decreased the level of detail in the figures in this paper. Theoriginal model plots allow much more detailed analysis of volumes on roadlinks, in both directions of roads. Figure 7 shows traffic assignment on thenetwork for the morning peak period in the greater (left) and central Abid-jan area (right). As can be seen from all assignments the absolute flows,or traffic volumes on the network are very low and do not represent realtraffic volumes on the network, since they are based on a selection of the
Transportation Planning Based on GSM Traces 23
sample provided for this study. Still, as a relative measure all figures showroads with more and less dense traffic. To make the transport model suitablefor identifying and exploring current or future transport problems in IvoryCoast, an accurate assessment of absolute traffic flows on relevant parts ofthe network is necessary. In the following discussion we will deal with whatmust be done to overcome the limitations of the current model.
Discussion. It is highly rewarding that we were able to create a transport modelfor an area where we, as researchers, have never been, and for which datawere solely obtained from the internet and from a completely new source(GSM call traces). However, the transport model is not yet finished, andthis is mainly due to a number of remaining limitations in the data whichwere available. The good news is, that all these limitations can be solved,but the effort to do this varies.First, to make an estimate of actual and validated traffic flows on the net-work, the current model values should be augmented or weighed by a factor.This factor will depend for instance on the market penetration of Orangeoperated cellphones, cellphone ownership and cellphone usage in Ivory Coastetc. As these levels may differ throughout the country, the weighing-methodshould take into account local differences. Techniques to do this are alreadyavailable since also in transport modeling using conventional data, OD matri-ces are calibrated from traffic counts. A set of reliable traffic counts in the net-work should therefore suffice to establish augmented OD matrices to describenot just the traffic based on mobile phones traces, but the total traffic flows.A second, more serious limitation in the present model is that it does notmake a distinction between the different transport modalities. To achievesuch a distinction filters and algorithms must be developed to detect andestimate different modes of travel from data. The data available now wouldhardly allow a distinction of modes that is based on travel speeds. However,for modeling purposes, some basic statistics on modal split can be obtainedfrom the same traffic counts as are needed to augment the traffic present inthe model and could highly increase the quality of the model.If we could overcome the above mentioned problems, and it seems absolutelyfeasible that this can be done, then we will have a model that can be usedboth for an accurate assessment of the current traffic situation in CI andAbidjan and for forecasting purposes. For forecasting purposes one needs toimplement future planned projects in the model and specify the expectedgeneral growth in mobility for all modes. Once we have an adequately aug-mented mode specific OD matrix, the model immediately allows other calcu-lations and forecasts for environmental impact analysis, such as greenhousegasses, NOx and PM10 emissions. Of course, for these purposes additionalstatistics on the Ivory Coasts vehicle park must be incorporated.
24 M. Nanni et al.
Fig. 7. Traffic model for morning peak period for greater Abidjan (left) and AbidjanCentre Area (right).
6 Conclusions
The present study shows that even with limited data from GSM traces, as in thecase study considered, it is possible to derive valid information on systematicmobility behavior of people between frequently visited locations for areas thatlack information on mobility. From these mobile phone data, origin-destinationtables can be created for a chosen geographical area, which can then be usedas an input for a transport model of the area. The fact that this can be done,overcomes one of the serious hurdles that until now have impeded the use oftransport models in many developmental countries: lack of data. It is thereforeabsolutely worthwhile to take this proof of concept one step further, and createand validate a transport model that can indeed be used by public authorities,engineering firms, investors etc. in developmental countries. In this paper wediscussed the most important steps which need to be taken.
References
1. Olteanu, A.-M., Trasarti, R., Couronn, T., Giannotti, F., Nanni, M., Smoreda, Z.,Ziemlicki, C.: GSM data analysis for tourism application. In: ISSDQ (2011)
2. Trasarti, R., Pinelli, F., Nanni, M., Giannotti, F.: Mining mobility user profiles forcar pooling. In: ACM KDD (2011)
3. Csji, B.C., et al.: Exploring the mobility of mobile phone users. Report on arXiv:1211.6014 [physics.soc-ph]
4. Giannotti, F., et al.: Unveiling the complexity of human mobility by querying andmining massive trajectory data. VLDB J. (Special issue on Data Management forMobile Services) 20, 695–719 (2011)
5. Csjia, B.C., et al.: Exploring the mobility of mobile phone users. Physica A : Stat.Mech. Appl. J. 392(6), 1459–1473 (2013)
Transportation Planning Based on GSM Traces 25
6. Furletti, B., Gabrielli, L., Renso, C., Rinzivillo, S.: Identifying users profiles frommobile calls habits. In: UrbComp (2012)
7. Hensher, D.A., Kenneth, J.: Handbook of Transport Modelling. Pergamon, Ams-terdam (2000)
8. Ortuzar, J., Willumsen, L.G.: Modelling Transport, 4th edn. Wiley, West Sussex(2011)
9. Calabrese, F., Di Lorenzo, G., Liu, L., Ratti, C.: Estimating origin-destinationflows using mobile phone data. Pervasive Comput. 4, 36–44 (2011)
10. D4D Challenge. http://www.d4d.orange.com/11. Tan, P.-N., Steinbach, M., Kumar, V.: Introduction to Data Mining. Addison Wes-
ley, Boston (2006). ISBN 0-321-32136-7

http://www.springer.com/978-3-319-04177-3