Embed Size (px)
Citation preview

TREE ISLAND WIRE INCOME FUND
Q2 2011
Report to Unitholdersfor the period endedJune 30, 2011

TREE ISLAND WIRE INCOME FUND
FUND PROFILE
Launched on November 12, 2002, Tree Island Wire Income Fund owns 100% of Tree Island Industries Ltd. The Fund is listed on the Toronto Stock Exchange (listing symbol TIL.UN).
The Fund has Convertible Debentures listed on the TorontoStock Exchange (listing symbol TIL.DB).
Tree Island ProfileHeadquartered in Richmond, British Columbia, Tree IslandIndustries Ltd. produces wire products for a diverse rangeof construction, agricultural, manufacturing and industrialapplications. Its products include bright wire, stainless steelwire and galvanized wire; a broad array of fasteners,including packaged, collated and bulk nails; stuccoreinforcing products, engineered structural mesh, fencingand other fabricated wire products. The Company marketsthese products under the Tree Island, Halsteel, K-Lath,Industrial Alloys, TI Wire, Tough Strand and Select brandnames. Tree Island also owns and operates a Hong Kong-based company that assists the international sourcing ofproducts to Tree Island and its customers.
Report to Unitholders : 1
Management’s Discussion and Analysis : 2
Interim Condensed Consolidated Financial Statements : 24
Notes to the Interim Condensed Consolidated Financial Statements : 29
Unitholder Information : Inside Back Cover

Q2 : 2011 1
In this, my first report to you as the President and CEOof the Tree Island Wire Income Fund, it is my pleasureto provide an update on the Fund’s progress for thethree and six months ended June 30, 2011.
Financial results for the second quarter period were inline with our expectations. Sales volumes and revenueswere largely similar to the results achieved in thesecond quarter of 2010, despite continued weaknessin the US residential construction market, adverseweather conditions in both Canada and the US, andthe negative impact of a stronger Canadian dollar on our US dollar-denominated sales. Second quarterrevenues of $38.0 million declined by $0.7 million, or 1.9%, year-over-year, with the negative foreignexchange impact largely offset by stable volumes and higher prices for our finished products. Thehigher product prices were achieved through anumber of price increases implemented during thequarter in response to rising steel costs.
Our bottom-line results felt more of the impact of the higher raw material costs, reflecting the typicallag that occurs as we work to align finished productprices with rising input costs. We were able tominimize much of this impact with our continuedfocus on more profitable products and continued cost control. We also benefited from the positiveinfluence of a stronger Canadian dollar on our USoperating costs and by a decrease in depreciationexpense of $0.4 million as a result of a comprehensivereview of our property, plant and equipment in thefirst quarter of 2011 and resulting extension of theremaining useful lives of certain of our manufacturingequipment and buildings . Accordingly, secondquarter gross profit was $3.3 million compared to $3.6 million in Q2 2010 and gross profit per ton was$129 compared to $138. EBITDA before foreignexchange was $1.7 million compared to $2.3 millionduring the same period last year.
Our results for the first half of 2011 improved year-over-year. For the six months ended June 30, 2011,revenues increased to $76.9 million from $73.3 million.Gross profit increased to $7.9 million, from $6.2 million
TREE ISLAND WIRE INCOME FUND
TO OUR UNITHOLDERS
and EBITDA improved to $3.7 million, from $2.5 million. While the Fund generated a net lossamounting to $4.0 million or $0.18 per share duringthe first half of 2011, this was mainly due to a $3.2 million loss on renegotiated debt during the first quarter. Adjusted for non-cash charges, first half net income increased to $1 million, from a loss of $2.8 million during the same period last year.
While we are pleased with our progress, our outlookremains cautious due to continuing weakness in theUS residential construction market. However, demandfrom other end markets, including commercialconstruction (primarily mining) and industrial/OEM,continues to show signs of improvement. Ourobjective is to keep a very close eye on our costs on an ongoing basis and to pick and choose end-marketsthat enable us to maintain profitability and cashgeneration. This strategy has enabled us to chartsteady improvements in the past number of quarters.We are confident that this same plan will enable theFund to reasonably prosper from any improvement in the current economic environment.
In closing, I would like to thank our employees forcontinuing to build Tree Island’s reputation for productquality and service leadership in these challengingtimes. I believe we are moving forward with significantcompetitive advantages that enhance our prospects of success.
Dale R. MacLeanPresident and CEO, Tree Island IndustriesTrustee, Tree Island Wire Income Fund

TREE ISLAND WIRE INCOME FUND
MANAGEMENT’S DISCUSSION AND ANALYSISFor the three and six month periods ended June 30, 2011 and 2010
2 Tree Island Wire Income Fund : Q2 : 2011 : Management’s Discussion and Analysis
The following is a discussion of the financial condition andresults of operations of Tree Island Wire Income Fund (the“Fund”) and its wholly owned operating subsidiary TreeIsland Industries Limited (“Tree Island” or the “Company”).This discussion is current to August 9, 2011 and should beread in conjunction with the unaudited interim condensedconsolidated financial statements for the three and sixmonths ended June 30, 2011. The Fund’s interim condensedconsolidated financial statements are prepared in accordancewith International Financial Reporting Standards (“IFRS”)applicable to the preparation of interim financial statementsincluding IAS 34 Interim Financial Reporting and IFRS 1 FirstTime Adoption of International Financial ReportingStandards and are reported in Canadian dollars. They do notinclude all of the information required for full annualfinancial statements. The 2010 prior period comparativefinancial information throughout this report has beenrestated in accordance with IFRS; however, 2009 informationis presented in accordance with Canadian GAAP and has notbeen restated.
Additional information relating to the Fund, including theaudited consolidated financial statements, prepared inaccordance with Canadian GAAP, and Annual InformationForm (“AIF”) for the year ended December 31, 2010, can befound at www.sedar.com or on the Fund’s website atwww.treeisland.com.
The Management’s Discussion and Analysis includes thefollowing sections:
1. Forward-Looking Statements and Risk 3
2. Non-IFRS Measures 3
3. The Fund and Tree Island 4
4. Developments and Second Quarter 2011 Business Overview 6
5. Results from Operations 8
6. Comparison of Results for the Three Months Ended June 30, 2011 and 2010 9
7. Comparison of Results for the Six Months Ended June 30, 2011 and 2010 11
8. Financial Condition and Liquidity 15
9. Capital Expenditures & Capacity 19
10. Contractual Obligations and Commitments 19
11. Summary of Quarterly Financial Information 20
12. Accounting Policies and Estimates 20
13. Related Party Transactions 22
14. Risks and Uncertainties 22
15. Disclosure Controls and Procedures and Internal Control over Financial Reporting 23

Tree Island Wire Income Fund : Q2 : 2011 : Management’s Discussion and Analysis 3
1. FORWARD-LOOKING STATEMENTS AND RISKThis management’s discussion and analysis (“MD&A”) includes forward-looking information with respect to the Fund and TreeIsland, including our business, operations and strategies, as well as financial performance and conditions. The use of forward-looking words such as, “may,” “will,” “expect” or similar variations generally identify such statements. Any statements thatare contained herein that are not statements of historical fact may be deemed to be forward-looking statements. Although we believe that expectations reflected in forward-looking statements are reasonable, such statements involve risks anduncertainties, including the risks and uncertainties discussed under the heading “Risks Relating to the Company’s Business” in the Fund’s AIF for the year ended December 31, 2010 as well as section 14 of this MD&A.
Forward-looking statements, by their nature, necessarily involve risks and uncertainties that could cause actual results to differmaterially from those contemplated by the statements. Such risks and uncertainties include, but are not limited to: generaleconomic conditions and markets and, in particular, the impact of the current economic uncertainties, impact of recent tradecases, risks associated with operations such as competition, dependence on the construction industry, market conditions forour products, supplies of and costs for our raw materials, dependence on key personnel, labour relations, regulatory matters,environmental risks, the successful execution of acquisition and integration strategies and other strategic initiatives, foreignexchange fluctuations, the effect of leverage and restrictive covenants in financing arrangements, the cost and availability ofcapital, the possibility of deterioration in our working capital position, the impact on liquidity if we were to go offside ofcovenants in our debt facilities, the impact that changes in supplier payment terms or slow payment of accounts receivablecould have on our liquidity, product liability, the ability to obtain insurance, energy cost increases, changes in tax legislation,other legislation and governmental regulation, changes in accounting policies and practices, operations in a foreign country,unit price volatility and interest rate risk related to the fair value of convertible instruments, and other risks and uncertaintiesset forth in our publicly filed materials.
This MD&A has been reviewed by the Fund’s board of trustees, and it’s Audit Committee, and contains information that iscurrent as of the date of this MD&A, unless otherwise noted. Events occurring after that date could render the informationcontained herein inaccurate or misleading in a material respect. Readers are cautioned not to place undue reliance on thisforward-looking information and management of the Fund undertakes no obligation to update publicly or revise anyforward-looking information, whether as a result of new information, future events or otherwise except as required byapplicable securities laws.
2. NON-IFRS MEASURESReferences in this MD&A to “EBITDA” are to operating profit plus depreciation and references to “Adjusted Net Income(Loss)” are to net income (loss) per IFRS adjusted for certain non-cash items including non-cash financing expenses, changes infair value of convertible instruments and loss on renegotiated debt. EBITDA is a measure used by many investors to compareissuers on the basis of ability to generate cash flows from operations. Adjusted Net Income (Loss) is a measure for investors to understand the impact of significant non-cash items that affect our results from operations. Neither EBITDA nor AdjustedNet Income (Loss) are earnings measures recognized by IFRS and do not have a standardized meaning prescribed by IFRS. We believe that EBITDA and Adjusted Net Income (Loss) are important supplemental measure in evaluating the Fund’sperformance. You are cautioned that EBITDA and Adjusted Net Income (Loss) should not be construed as alternatives to netincome or loss, determined in accordance with IFRS, as indicators of performance or to cash flows from operating, investingand financing activities as measures of liquidity and cash flows. Our method of calculating EBITDA and Adjusted Net Income(Loss) may differ from methods used by other issuers and, accordingly, our EBITDA or Adjusted Net Income (Loss) may not becomparable to similar measures presented by other issuers.
References in this MD&A are made to “Standardized Distributable Cash” and “Adjusted Distributable Cash” which are notrecognized measures under IFRS and do not have standardized meanings prescribed by IFRS. Canadian open-ended incometrusts, such as this Fund, use Standardized Distributable Cash and Adjusted Distributable Cash as indicators of financialperformance and ability to fund distributions. We define Standardized Distributable Cash as net cash from operating activitiesless all capital expenditures. We define Adjusted Distributable Cash as Standardized Distributable Cash plus the change in non-cash operating assets and liabilities, plus Non-maintenance Capital expenditures. Changes in non-cash operating assetsand liabilities and Non-maintenance Capital expenditures are added back in the calculation of Adjusted Distributable Cashbecause they are funded through the Fund’s committed credit facilities. We define Maintenance Capital expenditures as cashoutlays required to maintain our plant and equipment at current operating capacity and efficiency levels. Non-maintenanceCapital expenditures are defined as cash outlays required to increase business operating capacity or improve operatingefficiency, and are also referred to as profit improvement capital.

4 Tree Island Wire Income Fund : Q2 : 2011 : Management’s Discussion and Analysis
Our Adjusted Distributable Cash may differ from similar computations as reported by other entities and, accordingly, may not be comparable to distributable cash as reported by such entities. We believe that in addition to net income, AdjustedDistributable Cash is a useful supplemental measure that may assist investors in assessing the return on their investment inUnits.
3. THE FUND AND TREE ISLAND
3.1 About the Fund There were 22,900,904 Units of the Fund outstanding as of June 30, 2011 and 29,900,904 as of August 9, 2011. There were45,504 Phantom Units issued under the Fund’s long-term incentive plan as at August 9, 2011. Each Phantom Unit is convertible,subject to vesting conditions, into one Unit. The Fund holds a 100% ownership interest in Tree Island and is organized as atrust on a corporation structure.
During 2009 and the early part of 2010, the Fund completed a recapitalization of the business referred to in this MD&A as theRecapitalization Transaction. As part of the Recapitalization Transaction, on November 26, 2009 the Fund issued convertibledebentures (“Debentures”) by way of a private placement which was then followed by a public offering of Debentures withthe same terms and conditions in January 2010. In total, 197,500 Debentures with a face value of $100 each were issued. Each$100 Debenture is convertible into 200 Fund Units at the option of the Debenture holder. As at August 9, 2011, the totalnumber of Debentures remaining outstanding is 193,846.
In addition, as part of the same private placement transaction mentioned above, the Fund issued 4,875,000 warrants (the“Warrants”) with an expiry of November 26, 2014 to certain investors. The warrants allow the holder to purchase, for a periodof five years from the closing of the private placement, one Unit at an exercise price of $0.57. No warrants have been exercisedsince issuance.
3.2 About Tree IslandMarkets and ProductsTree Island supplies a diverse range of steel wire and fabricated steel wire products to customers in five key markets:residential construction, commercial construction, agricultural, industrial, original equipment manufacturers (“OEM”) and specialty applications.
Our product lines include bright and galvanized carbon wire; stainless steel wire; packaged, collated and bulk nails; stuccowoven mesh; fencing and other fabricated wire products; engineered structural mesh; and a diverse array of complementaryproducts. We market these products to customers in Canada, the United States and internationally.
The following summarizes our key product groups and the end-use markets we serve with each:
MARKETS PRODUCTS SPECIFIC END USES
Residential Construction
Collated, bulk and packaged nails, stucco reinforcing mesh
Construction and renovation for new and existing homes
Commercial Construction
Welded wire reinforcement mesh, concrete reinforcing products
Commercial construction, mining, infrastructure projects
Industrial/OEM Low carbon wire (bright/galvanized/annealed) High carbon wire(bright/galvanized/annealed) Hi-tensile baling wire
Wire fabricating, industrial applications, OEM manufacturing (i.e. mattresses, innersprings, tires), forestry, recycling
Agricultural Hi-tensile game fence, farm fence, vineyard wire, barbed wire, bailing wire, vinyl coated wire
Agriculture, farming
Specialty Spring wire, cold heading wire, shaped wire, stainless specialty alloy bar, rod and wire
Consumer products, industrial applications,telecommunications, aerospace, automotive,oil industry

Tree Island Wire Income Fund : Q2 : 2011 : Management’s Discussion and Analysis 5
SeasonalityOur operations are impacted by the seasonal nature of the various industries we serve, primarily the Canadian constructionand agriculture industries. Accordingly, revenues, sales volumes and operating results for interim quarters are not necessarilyindicative of the results that may be expected for the full fiscal year and fourth quarter results are traditionally lower thanother quarters due to the onset of winter and the corresponding reduction in consumer activities.
Product StrategyTree Island is a manufacturer and supplier of premium quality wire products for a broad range of applications. Our goal is to match the appropriate wire product, level of quality and price point for our customers needs. We achieve this bymanufacturing most of our products at our own manufacturing facilities, while outsourcing others from qualifiedmanufacturers.
Our traditional market emphasis has been western North America where the Tree Island, Halsteel, K-Lath, TI Wire andIndustrial Alloys brands have an excellent reputation.
Premium Brands
We manufacture our premium, branded products internally in our North American facilities, targeting them to customers thatseek value and reliable high performance. Our Premium brands are designed to create a high level of customer satisfactionand offer:
• Consistent, high quality standards that meet customers’ needs, ASTM standards and applicable codes
• Broad range of products
• Short lead times
• Technical support and reliable service
PREMIUM BRANDS PRODUCTS
Tree Island Bright and galvanized wire, nails, welded wire mesh, fencing and stucco reinforcing
Halsteel Collated nails produced in the United States
K-Lath Wide range of stucco reinforcing products
TI Wire Bright wire, welded wire mesh and cold heading wire
Industrial Alloys Stainless steel wire and bars
Tough Strand Agricultural fence products including Hi-tensile game fence, farm fence, vineyard wire, barbed wire, vinyl coated wire
Select Brand
Most of our Select brand products are externally manufactured, and are limited to high-volume commodity items. Productswithin this group meet general industry specifications but are not customized to individual customer requirements. Selectbrand products allow us to enhance our relationship with those customers that require a diverse product line includingcompetitively priced commodity products. These products typically create complementary pull through for our Premiumbrands.
Direct Ship
As a service to our customer, we use our network of suppliers world-wide to source commodity products not manufactured by Tree Island for our customers. These products may not fall within our ongoing long-term product strategy.

6 Tree Island Wire Income Fund : Q2 : 2011 : Management’s Discussion and Analysis
Organizational Structure Our corporate structure has three primary entities: Tree Island Industries Ltd. is our Canadian operating company as well as isthe parent company to our operations in the USA, Tree Island Wire (USA) Inc., and our Asian operations, Tree IslandInternational Ltd. (“TI International”).
4. DEVELOPMENTS AND SECOND QUARTER 2011 BUSINESS OVERVIEWSummary of ResultsOur financial results held steady in the second quarter of 2011 as we continued to target key end-markets, maintain pricediscipline and manage our costs closely. Product prices were increased in response to higher raw material costs, but the gainswere partially offset by the negative impact of a stronger Canadian dollar on our US dollar-denominated sales.
For the three months ended June 30, 2011, the Fund reported revenues of $38.0 million, compared to $38.7 million during thesame period in 2010. Sales volumes were stable at 27,676 tons, compared to 27,732 tons in 2010. Market conditions remainedchallenging. According to the US Census Bureau, housing starts in the key Western US region were approximately 36,900 thethird lowest second quarter since 1959.
Gross profit softened as a result of higher raw material costs, decreasing $0.2 million to $3.6 million (2010 - $3.8 million), while gross profit per ton decreased 7.0% to $129 per ton (2010 - $138 per ton). EBITDA for the second quarter was $1.7 million (2010 – $2.3 million). The negative impact of higher raw material costs on EBITDA was partially offset by ourongoing focus on profitability through careful management of working capital, cash flow and tight control of overall costs,including optimization of our mix of manufactured and imported products.
Wire Rod Prices Driven by increased raw material costs and managed supply, steel costs increased sharply in the first half of 2011. Since thestart of the year, North American steel suppliers have increased steel prices by as much as 25% in some cases. As part of ourstrategy to manage rising steel costs, we source our raw materials from a variety of suppliers either domestically or fromoverseas, always looking for the best pricing available for shipment to our plants. We also strive for quick turnover of ourinventories. To the extent that we cannot mitigate increases in steel costs through these measures, we, along with ourcompetitors, attempt to recover the higher costs through price increases. We implemented a series of product price increasesin the first six months of 2011, and we will continue working to align product prices with raw material costs through thesecond half of the year. We cannot give any assurances that we will be successful in increasing prices sufficient to recoverincreased wire rod costs.
Remediation on surplus lands sold in 2009On July 2, 2009 the Fund completed the sale of 12.5 acres of surplus lands at its Richmond, BC manufacturing facility for grossproceeds of $10.5 million. The agreement contains a condition whereby $1.5 million will be held in trust and will be releasedupon providing to the purchaser a Certificate of Compliance for the environmental remediation. The Fund has the option ofrequesting to drawdown the holdback as approved by the purchaser, prior to the issuance of the Certificate of Compliance toa maximum of $0.5 million. The environmental remediation was required to be completed within one year from the closing ofthe sale. If the Fund did not deliver the Certificate of Compliance within one year from the closing of the sale, the purchasercould use the holdback to obtain a Certificate of Compliance. As of the date of these financial statements, the purchaser hasnot elected to complete the remediation.

Tree Island Wire Income Fund : Q2 : 2011 : Management’s Discussion and Analysis 7
The Fund has completed the remediation work based on the planned requirements and has submitted the results for approvaland issuance of Certificate of Completion. The Fund has incurred $1.0 million up to June 30, 2011 of which $0.5 million wasdrawn down from the holdback as permitted under the agreement and the remainder was paid through the Fund’s operatingcash flows. The costs incurred are deferred and included in prepaid expenses.
The Fund is expecting to obtain the Certificate of Compliance in 2011 and still expects that the $1.5 million holdback will besufficient to complete the remediation activities. At the time of the sale of the surplus land, the Fund recognized a gainexcluding the $1.5 million holdback. Upon completion of the environmental remediation and issuance of a Certificate ofCompliance the accounting for the disposal will be finalized and a gain or loss will be recognized for the difference betweenthe $1.5 million holdback and the total costs incurred of the environmental remediation.
Appointment of CEOOn June 2, 2011, the Fund announced the retirement of Ted Leja and appointment of Dale MacLean, as the President andChief Executive Officer effective July 18, 2011. He was also appointed as a member of the Fund’s Board of Trustees effective onthat date.
Mr. MacLean brings extensive knowledge of marketing, sales, operations and supply chain logistics. Previously, Mr. MacLeanserved as Executive Vice President and General Manager of Taymor Industries, a leading supplier of decorative and builders’hardware to the North American building products market. In this position, he worked with many of the same clients anddistribution channels that Tree Island currently serves. Mr. MacLean’s career also includes over two decades with CN Rail andBC Rail where he held progressively senior positions in sales, marketing, customer service and operations management. Prior to joining Taymor, Mr. MacLean held responsibility for BC Rail’s $325 million Forest Products, Bulk and Intermodal commercialportfolios as Vice President Marketing and Sales. Mr. MacLean is an honors graduate of Seneca College and holds a Masters of Business Administration degree from the University of Western Ontario.
Mr. Leja will provide assistance over the coming months to ensure a smooth transition to new leadership and will continue as a member of the Fund’s Board of Trustees.
Trade Action ReviewsDuring the second quarter the US government announced two trade action reviews: one related to certain galvanized wireimported from China and Mexico and another related to certain nails imported from the United Arab Emirates. We aremonitoring both cases closely, however, we cannot reasonably estimate the impact of these trade actions until thedetermination is announced in the fall of 2011.
OutlookGiven the economic weakness in the US and global economies and high levels of unemployment in the US, our outlookremains cautious with the expectation of mixed market conditions through the remainder of the year. The US residentialconstruction market remains at historically low levels, with weather-related delays in construction starts and agriculturalactivity exacerbating conditions in many regions of Canada and the US. However, demand from other end markets, includingcommercial construction (primarily mining) and industrial/OEM show some signs of improvement.
To date, the impact of higher raw material costs has been partially offset by the positive impact of a higher Canadian dollar onour U.S. dollar-denominated raw material purchases and by our own efforts to increase prices for finished goods in line withthe higher costs. Going forward, we will continue working to keep selling prices aligned with costs, although there can be nocertainty that our price increases will be fully realized. To help minimize our exposure to raw material price volatility, we willalso continue to practice very tight management of our inventories.
Overall, we will continue to manage the business with tight control of costs and working capital, while maintaining our strongfocus on improving profitability through pricing discipline and targeted growth. We will also continue with our successfulefforts to strengthen customer relationships.

8 Tree Island Wire Income Fund : Q2 : 2011 : Management’s Discussion and Analysis
5. RESULTS FROM OPERATIONS($000’s except for tonnage and per-unit amounts)
Three Months Ended June 30 Six Months Ended June 30
Summary of Results 2011 2010 2011 2010
Sales Volumes – Tons (1) 27,676 27,732 57,624 55,619Revenue $ 38,000 $ 38,742 $ 76,944 $ 73,274
Cost of Goods Sold (33,474) (33,489) (67,361) (64,197)Depreciation (962) (1,414) (1,639) (2,834)
Gross Profit $ 3,564 $ 3,839 $ 7,944 $ 6,243 Selling, General and Administrative Expenses (2,801) (2,971) (5,886) (6,534)Operating Income (Loss) $ 763 $ 868 $ 2,058 $ (291)
Foreign Exchange Gain (Loss) 160 (758) 578 (1,315)Financing Expenses (2,040) (2,452) (4,106) (6,286)Changes in fair value on convertible instruments 1,779 3,114 887 3,750 Loss on renegotiated debt - - (3,234) -
Income (Loss) before income taxes 662 772 (3,817) (4,142)Income Tax (Expense) Recovery (633) (962) (193) 1,415
Net Income (Loss) $ 29 $ (190) $ (4,010) $ (2,727)
EBITDA (2)
Operating Income (Loss) 763 868 2,058 (291)Add back Depreciation 962 1,414 1,639 2,834
EBITDA 1,725 2,282 3,697 2,543 Foreign Exchange Gain (loss) 160 (758) 578 (1,315)
Adjusted EBITDA 1,885 1,524 4,275 1,228
Net Income (Loss) 29 (190) (4,010) (2,727)Adjustment for significant non-cash items
Non-cash financing expenses 1,297 1,786 2,623 3,723 Non-cash loss on renegotiated debt - - 3,234 - Changes in fair value of convertible instruments (1,779) (3,114) (887) (3,750)
Adjusted Net Income (Loss) (2) (453) (1,518) 960 (2,754)
Per UnitNet income (loss) per unit - basic
and fully diluted $ 0.00 $ (0.01) $ (0.18) $ (0.12)Standardized Distributable Cash per Unit - Basic and Fully Diluted (2) $ (0.20) $ (0.09) $ (0.37) $ (0.51)Adjusted Distributable Cash per Unit - Basic and Fully Diluted (2) $ 0.05 $ 0.07 $ 0.08 $ 0.07
Per Ton Gross Profit per Ton $ 129 $ 138 $ 138 $ 112 EBITDA per Ton (2) $ 62 $ 82 $ 64 $ 46 Adjusted EBITDA per Ton (2) $ 68 $ 55 $ 74 $ 22
As at As at Financial Position June 30, 2011 December 31, 2010
Total Assets $ 94,861 $ 87,450 Total non-current financial liabilities $ 41,439 $ 36,321
(1) Sales volumes exclude tons which were processed as part of tolling arrangements(2) See definition of EBITDA, Adjusted Net Income (Loss), Standardized Distributable Cash and Adjusted Distributable Cash
in the Section 2 – Non-IFRS Measures

Tree Island Wire Income Fund : Q2 : 2011 : Management’s Discussion and Analysis 9
6. COMPARISON OF RESULTS FOR THE THREE MONTHS ENDED JUNE 30, 2011 AND 2010
The results for the three months ended June 30, 2011 are prepared in accordance with IFRS and the 2010 prior periodcomparative financial information has been restated in accordance with IFRS. For further information on the transition toIFRS, please refer to Section 12 of this management discussion and analysis as well as Note 20 of the Fund’s interim condensedJune 30, 2011 consolidated financial statements.
RevenueFor the three months ended June 30, 2011, we generated revenues of $38.0 million, a decrease of $0.7 million, or 1.9%, fromthe same period in 2010. The slight decline in revenue primarily reflects marginally lower sales volumes and the negativeimpact of a stronger Canadian dollar on our US dollar-denominated revenues, partially offset by price increases implementedto address rising raw material costs. During the second quarter of 2011, the average exchange rate for the Canadian dollar was5.9% stronger than in Q2 2010. Holding all other factors constant, had exchange rates for the Canadian dollar remainedconsistent with the second quarter of 2010, our Q2 2011 revenues would have been approximately $1.5 million higher.
Sales volumes for the second quarter 2011 were stable but softened slightly by 0.2% to 27,676 tons, from 27,732 tons duringthe same period in 2010. Domestic sales increased 316 tons or 1.2%. Our results reflect the success of our “Back to Basics”strategy, which focuses on pricing discipline and targeted growth by providing customers with a broad range of high-qualityproducts, ongoing product innovation and high levels of customer service.
These strategies helped us maintain second quarter sales in a highly competitive environment and through challenging marketconditions. Sales volumes to the residential construction market, representing 30.3% of our total sales (34.3% in 2010),reflected the weak conditions, with sales volumes declining by 1,120 tons year-over-year. This was primarily due to lowerfastener sales. By comparison, primarily driven by increased sales of construction fabric rolls and construction fabric sheets, ourvolumes to the commercial construction sector increased by 1,883 tons. Sales in this market represented 22.4% of our totalsales portfolio in Q2 2011 compared to 15.5% in Q2 2010. Industrial/OEM market volumes were consistent with 2010 results.Sales volumes to the agricultural sector decreased by 670 tons, due to weather-related delays in the growing season. Secondquarter 2011 sales of specialty products increased by 245 tons year-over-year as US demand for stainless steel productsincreased. International trading sales decreased by 480 tons year-over-year, reflecting the discontinuation of certain projects inour Asian subsidiaries. Revenues from tolled baling wire for the pulp industry increased by $0.5 million in the second quarterof 2011, compared to the same period in 2010.
Sales volumes by market were as follows:
Three Months Ended June 30, 2011 Three Months Ended June 30, 2010
Market Tons (000's) (2) % of Sales Volumes Tons (000's) (2) % of Sales Volumes
Residential Construction 8.4 30.3% 9.5 34.3%Commercial Construction 6.2 22.4% 4.3 15.5%Industrial/OEM 10.2 36.8% 10.2 36.8%Agricultural 1.4 5.1% 2.1 7.6%Specialty 1.0 3.6% 0.7 2.6%International Trading (1) 0.5 1.8% 0.9 3.2%Total 27.7 100.0% 27.7 100.0%
(1) International includes Tree Island International trading sales and does not include North American import sales, which are reflected inour sales volumes to other markets.
(2) Sales volumes exclude tons which were processed as part of tolling arrangements.
The share of sales volumes from our import and trading activities, compared to the share of sales from products manufactured at our domestic manufacturing facilities, were as follows:
Three Months Ended June 30, 2011 Three Months Ended June 30, 2010
Tons (000's) (2) % of Sales Volumes Tons (000's) (2) % of Sales Volumes
North American Manufactured 25.5 92.1% 23.5 84.8%Imported & Trading 2.2 7.9% 4.2 15.2%Total 27.7 100.0% 27.7 100.0%

10 Tree Island Wire Income Fund : Q2 : 2011 : Management’s Discussion and Analysis
During the second quarter, sales volumes of our North American manufactured products increased both in total tons and as a percentage of total sales volumes. The increase in manufactured product volumes relative to import and trading productvolumes reflects our increased emphasis on manufacturing as a core competency and our efforts to increase throughput at ourNorth American manufacturing operations. By contrast, combined import and trading sales declined to 2,242 tons in Q2 2011from 4,233 tons in Q2 2010, and represented a smaller percentage of the total sales at 7.9% in 2011 compared to 15.2% in2010. Going forward, we will continue to review and optimize the mix of manufactured versus imported products as we workto enhance profitability and provide our customers with value and the specific products they need.
Cost of Goods SoldCost of goods sold for the second quarter of 2011 was consistent with that of the same period in 2010. Reflecting our strategy of strategic purchases and tight management of our raw materials inventories, raw materials inventories increased by $4.7 million and were offset by a $4.6 million decrease in finished goods for resale. This is consistent with our goal ofincreasing profitability and throughput in our plants.
Gross ProfitSecond quarter gross profit declined by $0.2 million, to $3.6 million, while gross profit per ton decreased by $9 per ton to $129 per ton, compared to the same period in 2010. The decline in gross profit and gross profit per ton primarily reflectshigher raw material costs and the impact of a stronger Canadian dollar on our US dollar-denominated sales. Our Q2 2011 gross profit was impacted positively by a decrease in depreciation expense of $0.4 million as a result of a comprehensivereview of our property, plant and equipment in the first quarter and resulting extension of the remaining useful lives ofcertain of our manufacturing equipment and buildings.
ExpensesSelling, general and administrative (“SG&A”) expenses decreased to $2.8 million in the second quarter of 2011, a reduction of $0.2 million, or 5.7%, compared to the same period in 2010. The reduction in SG&A expense reflects improved operationalefficiencies and the positive impact of the stronger Canadian dollar on expenses at our US operations, partially offset byexpenses related to the transition to IFRS.
EBITDAEBITDA for the second quarter of 2011 was $1.7 million, compared to $2.3 million in Q2 2010. The year-over-year change inEBITDA reflects the lower gross profit, partially offset by the lower depreciation charge of $0.4 million in 2011 due to thecomprehensive review of asset useful lives.
Adjusted EBITDA, which excludes foreign exchange gains and losses in the period, was $1.9 million compared to $1.5 million in the equivalent period in 2010.
Financing ExpensesFor the three month ended June 30, 2011, financing expenses decreased by $0.4 million to $2.0 million. The components offinancing expense are below:
Three months ended June 30
2011 2010
Non-cash accretion of debt discount and interest on long term debt and Convertible Debentures $ 1,297 $ 1,786 Cash interest on debentures 478 411 Interest on Senior Credit Facility 123 127 Other interest and financing costs 81 66 Financing transaction costs and amortization of deferred financing costs 61 62
$ 2,040 $ 2,452
The decrease is primarily due to a decrease in the non-cash accretion of debt discount and interest on long term debt andconvertible debentures of $0.5 million, primarily due to a reduction in the discount rate on the Forbearance Agreements as aresult of the renegotiation of payment terms in the first quarter of 2011. For further information on the change of accountingon the Forbearance Agreements, see the discussion regarding the Loss on Renegotiated Debt below and Note 9 of the June 30, 2011 interim condensed consolidated financial statements.

Tree Island Wire Income Fund : Q2 : 2011 : Management’s Discussion and Analysis 11
Changes in Fair Value on Convertible Instruments Under IFRS, certain of our financial instruments are recorded at fair market value and are re-measured each period. Theseinstruments are the conversion feature on the Debentures, change of control option and warrants issued as part of theRecapitalization Transaction. The change in fair value for the three months ended June 30, 2011 was a gain of $1.8 millionversus a gain of $3.1 million in the prior period.
The fair market value of these financial liabilities incorporates the market value of the Fund’s units and as such the fair valueof these instruments will fluctuate inversely with the changes in the Fund’s unit price or in the risk free rate. Fair market valueis determined using an option pricing model with a volatility assumption of 42% and a risk free rate of 2.65%. The sensitivityof the change in fair value on convertible instruments is discussed in section 12 of this MD&A.
Foreign ExchangeWe reported a gain on foreign exchange of $0.2 million in the second quarter of 2011, compared to a loss of $0.8 million in Q2 2010. This improvement resulted from the strengthening of the Canadian dollar against the US dollar. Foreign exchangegains and losses are unpredictable in nature and therefore can be expected to vary significantly from period-to-period andover time.
Income TaxesWe recorded a Q2 2011 income tax expense of $0.6 million, compared to an income tax expense of $1.0 million in Q2 2010.The income tax expense represents a deferred income tax expense of $0.6 million (Q1 2010 - $0.9 expense) and a currentincome tax expense of $5 thousand (Q1 2010 - $44 thousand expense). The income tax expense was based on the statutory taxrate of 26.5% (2010 – 28.5%) applied to the income of subsidiaries before taxes, with adjustments for permanent differencesbetween accounting and taxable income.
Net Income (Loss)We reported net income of $29 thousand in the second quarter of 2011 (2010 - net loss of $0.2 million), or a loss of $0.00 per unit basic and diluted (2010 - net loss of $0.01 per unit basic and diluted). Net Loss reflects an increase in the gain recognized for the change in fair value of convertible instruments of $1.8 million (2010 – gain of $3.1 million). This wasoffset by a decrease in EBITDA to $1.7 million (2010 – $2.3 million), a decrease in financing expense to $2.0 million (2010 - $2.5 million), a foreign exchange gain of $0.2 million (2010 - loss of $0.8 million) and a tax expense of $0.6 million (2010 -income tax expense of $1.0 million).
Adjusted Net LossAdjusted for the impact of certain non-cash items recognized in net income, the Adjusted Net Loss was $0.5 million versus $1.5 million in the prior period. The decrease in Adjusted Net Loss reflects the decrease in EBITDA of $0.6 million, decrease in depreciation of $0.4 million, increase in foreign exchange of $0.9 million, increase in cash-related financing costs of $0.1 million, and decrease in income tax expense of $0.4 million from the same period last year.
7. COMPARISON OF RESULTS FOR THE SIX MONTHS ENDED JUNE 30, 2011 AND 2010
Results for the six months ended June, 2011 are prepared in accordance with IFRS. Comparative financial information for thesame six-month period in 2010 has been restated in accordance with IFRS. For further information on the transition to IFRS,please refer to Section 12 of this MD&A as well as Note 20 of the Fund’s June 30, 2011 interim condensed consolidatedfinancial statements.
RevenueDuring the six months ended June 30, 2011, we generated revenues of $76.9 million, an increase of $3.7 million, or 5.0%, from the same period in 2010. The improvement in revenue primarily reflects higher sales volumes, higher selling prices andincreased tolling revenue. The gains were partially offset by the negative impact of a stronger Canadian dollar on our USdollar-denominated revenues. During the first six months of 2011, the average exchange rate for the Canadian dollar was5.5% stronger than the same period in 2010. Holding all other factors constant, had exchange rates for the Canadian dollarremained consistent with the first six months of 2010, our six-month 2011 revenues would have been approximately $2.8 million higher.
Sales volumes for the first six months of 2011 increased by 3.6% to 57,624 tons, from 55,619 tons during the same period in2010. These gains reflect our continued efforts towards targeted growth in key end-markets and were achieved despitecontinuing challenges in the US residential construction market. According to the US Census Bureau, housing starts for the key Western US region were just 60,800 for the first six months of 2011, a very low level by historical standards.

12 Tree Island Wire Income Fund : Q2 : 2011 : Management’s Discussion and Analysis
Our sales to the residential construction market reflected this weakness, with volumes down 1,049 tons compared to the same period last year, primarily due to lower fastener sales. Sales to the residential construction market represented 29.2% of first half 2011 total sales, compared to 32.2% in the same period in 2010. By comparison, primarily driven by increased salesof welded wire mesh products to the Canadian mining industry and increased sales of construction fabric rolls and constructionfabric sheets, our volumes to the commercial construction sector grew by 3,726 tons year-over-year and represented 20.5% of our total sales portfolio, compared to 14.6% in 2010. Industrial/OEM market volumes improved by 1,151 tons reflectingincreased volumes to the recycling (high carbon galvanized wire) and the upholstery industries (high carbon wire). Salesvolumes to the agricultural sector decreased by 410 tons, due to weather-related delays in the growing season. Specialtyproducts sales for the first six months of 2011 increased by 745 tons year-over-year as US demand for stainless steel productsincreased. International trading sales decreased by 746 tons year-over-year, reflecting the discontinuation of certain projects in our Asian subsidiaries. Revenues from tolled baling wire for the pulp industry increased by $0.9 million in the first half of2011, compared to the same period in 2010.
Sales volumes by market were as follows:
Six Months Ended June 30, 2011 Six Months Ended June 30, 2010
Market Tons (000's) (2) % of Sales Volumes Tons (000's) (2) % of Sales Volumes
Residential Construction 16.8 29.2% 17.9 32.2%Commercial Construction 11.8 20.5% 8.1 14.6%Industrial/OEM 21.4 37.1% 20.2 36.3%Agricultural 4.9 8.5% 5.3 9.5%Specialty 2.0 3.5% 1.2 2.2%International (1) 0.7 1.2% 2.9 5.2%Total 57.6 100.0% 55.6 100.0%
(1) International includes Tree Island International trading sales and does not include North American import sales, which are reflected inour sales volumes to other markets.
(2) Sales volumes exclude tons which were processed as part of tolling arrangements.
The share of sales volumes from our import and trading activities, compared to the share of sales from products manufacturedat our domestic manufacturing facilities, were as follows:
Six Months Ended June 30, 2011 Six Months Ended June 30, 2010
Market Tons (000's) % of Sales Volumes Tons (000's) % of Sales Volumes
North American Manufactured 53.6 93.1% 46.6 83.8%Imported & Trading 4.0 6.9% 9.0 16.2%Total 57.6 100.0% 55.6 100.0%
During the first half of 2011, sales volumes of our North American manufactured products increased both in total tons and as a percentage of total sales volumes. As mentioned above, the increase in manufactured product volumes relative to importand trading product volumes reflects our increased emphasis on manufacturing as a core competency as well as our efforts to increase throughput at our North American manufacturing operations. By contrast, combined import and trading salesdeclined to 4,051 tons in the first six months of 2011 from 8,983 tons in the same period in 2010, and represented a smallerpercentage of total sales at 6.9% in 2011 compared to 16.2% in 2010. Going forward, we will continue to review and optimizethe mix of manufactured versus imported products as we work to enhance profitability and provide our customers with valueand the specific products they need.
Cost of Goods SoldFor the first six months of 2011, cost of goods sold increased by approximately $3.2 million from the same period last year. Raw materials inventories increased by $7.5 million and were offset by a $4.9 million decrease in finished goods for resale. This is consistent with our goal of increasing profitability and throughput in our plants.

Tree Island Wire Income Fund : Q2 : 2011 : Management’s Discussion and Analysis 13
Gross ProfitDuring the first half of 2011, gross profit improved by $1.7 million, to $7.9 million, while gross profit per ton increased by $26per ton to $138 per ton, compared to the same period in 2010. The increase in gross profit and gross profit per ton primarilyreflects higher sales volumes together with the net benefit of a stronger Canadian dollar on US dollar-denominated costsincurred by our Canadian operations. Gross profit also benefited from a decrease in depreciation expense resulting from acomprehensive review of our property, plant and equipment in the first quarter. This review resulted in an extension of theremaining useful lives of certain of our manufacturing equipment and buildings. Although throughput at the manufacturingfacilities has been increasing, gross profit in both 2011 and 2010 continued to be negatively impacted by the suboptimalutilization of our manufacturing facilities.
ExpensesSG&A expenses decreased to $5.9 million in the first half of 2011, a reduction of $0.6 million, or 9.9%, compared to the sameperiod in 2010. The reduction in SG&A expense reflects reductions in staffing levels and the positive impact of the strongerCanadian dollar on expenses at our US operations, partially offset by expenses related to the transition to IFRS.
EBITDAEBITDA for the first half of 2011 increased to $3.7 million, from $2.5 million in 2010. The $1.2 million improvement reflects our focus on profitable markets and products, tight management of costs and increased volume through our manufacturingfacilities.
Adjusted EBITDA, which excludes foreign exchange gains and losses in the period, increased to $4.3 million from $1.2 million in the equivalent period in 2010.
Financing ExpensesFor the six month ended June 30, 2011, financing expenses decreased by $2.2 million to $4.1 million. The components offinancing expense are below:
Six months ended June 30
2011 2010
Non-cash accretion of debt discount and interest on long term debt and Convertible Debentures $ 2,623 $ 3,723 Cash interest on debentures 967 507 Interest on Senior Credit Facility 213 352 Other interest and financing costs 180 163 Financing transaction costs and amortization of deferred financing costs 123 1,541
$ 4,106 $ 6,286
The decrease is primarily due to a decrease in financing transaction costs and amortization of deferred financing fees of $1.4million. This is primarily due to expensing in 2010 of $0.3 million of transaction costs relating to the issuance of Debentures inthe quarter and the remaining amortization of $0.9 million of deferred financing fees associated with our previous seniorcredit facilities whose term ended in March 2010. The $0.1 million reduction in interest cost on our Senior Credit Facility wasthe result of a lower outstanding loan balance during the period. The decrease from the prior year in the non-cash accretionon our long term debt and Debentures of $1.1 million is due to amendments to our Forbearance Agreements which resultedin a change of accounting and consequent reduction in discount rate from approximately 22% to 13%. For furtherinformation on the change of accounting on the Forbearance Agreements, see the discussion regarding the Loss onRenegotiated Debt below and Note 9 of the June 30, 2011 interim condensed consolidated financial statements.
The overall decrease was offset by a $0.4 million increase in the cash interest on the Debentures. This reflects the fact thatDebentures issued under the rights offering in the prior quarter were only outstanding for a portion of that quarter.
Changes in Fair Value on Convertible Instruments Under IFRS, certain of our financial instruments are recorded at fair market value and are re-measured each period. These instruments are the conversion feature on the Debentures, change of control option and warrants issued as part of the Recapitalization Transaction. The change in fair value for the six months ended June 30, 2011 was a gain of $0.9 millionversus a gain of $3.7 million in the prior-year period.
The fair market value of these financial liabilities incorporates the market value of the Fund’s units and as such, the fair valueof these instruments will fluctuate inversely with the changes in the Fund’s unit price or in the risk-free rate. The sensitivity ofthe change in fair value on convertible instruments is discussed in section 12 of this MD&A.

14 Tree Island Wire Income Fund : Q2 : 2011 : Management’s Discussion and Analysis
Loss on Renegotiated DebtFor accounting purposes, it was determined that the January 31, 2011 amendment to the Forbearance Agreements resulted in an exchange of debt instruments with substantially different terms. As a result, in the first quarter of 2011 the ForbearanceAgreements were accounted for as an extinguishment of the original financial liabilities and recognition of new financialliabilities at their present value resulting in a loss on renegotiation of debt of $3.2 million. Present value was determined using discounted cash flows and a credit-adjusted discount rate of 13%. The discount rate, together with the stated interest,comprises the debt discount. Using the effective interest rate method, the debt discount is amortized as accretion and chargedto interest expense over the term of the Forbearance Agreement.
Foreign ExchangeWe reported a gain on foreign exchange of $0.6 million in the first half of 2011, compared to a loss of $1.3 million in 2010.This improvement resulted from the strengthening of the Canadian dollar against the US dollar. Foreign exchange gains andlosses are unpredictable in nature and therefore can be expected to vary significantly from period-to-period and over time.
Income TaxesIn the six months ended June 30, 2011, we recorded an income tax expense of $0.2 million, compared to an income taxrecovery of $1.4 million in 2010. The income tax expense represents a deferred income tax expense of $45 thousand (2010 -$0.3 million recovery) and a current income tax expense of $0.1 million (2010 - $1.1 million recovery). The income tax expensewas based on the statutory tax rate of 26.5% (2010 – 28.5%) applied to the income of subsidiaries before taxes, withadjustments for permanent differences between accounting and taxable income.
Net LossWe reported a net loss of $4.0 million in the first six months of 2011 (2010 - net loss of $2.7 million), or a loss of $0.18 per unitbasic and diluted (2010 - net loss of $0.12 per unit basic and diluted). The increase in the net loss primarily reflects the loss onrenegotiation of debt of $3.2 million and a tax expense of $0.2 million (2010 - income tax recovery of $1.4 million). These wereoffset by a gain recognized for the change in fair value of convertible instruments of $0.9 million (2010 – gain of $3.7 million),increase in EBITDA to $3.7 million (2010 – $2.5 million), decrease in financing expense to $4.1 million (2010 - $6.3 million) and a foreign exchange gain of $0.6 million (2010 - loss of $1.3 million).
Adjusted Net Income (Loss)Adjusted for the impact of certain non-cash items recognized in net loss, Adjusted Net Income for the first half of 2011increased to $1.0 million, from a loss of $2.8 million during the same period in 2010. The $3.8 million increase in Adjusted NetIncome (Loss) reflects the $1.2 million increase in EBITDA, the $1.2 million decrease in depreciation, the $1.9 million increase inforeign exchange, the $1.1 million decrease in cash related financing transaction costs, and the $1.6 million increase in incometax compared to the same period last year.

Tree Island Wire Income Fund : Q2 : 2011 : Management’s Discussion and Analysis 15
8. FINANCIAL CONDITION AND LIQUIDITY8.1 Working CapitalOur business requires an ongoing investment in working capital, comprised primarily of accounts receivable and inventories,offset by credit in the form of accounts payable, interest payable, income taxes payable and accrued liabilities. Our largestinvestment in working capital is in our inventories. We rely on credit from our key suppliers to finance the purchase of the rawmaterials needed for our operations.
Our investment in working capital fluctuates from quarter-to-quarter based on factors such as seasonal sales demand, strategicpurchasing decisions taken by management, and the timing of collections from customers and payments made to oursuppliers. The residential construction, commercial construction and agricultural markets are seasonal in nature. As a result,sales and working capital requirements may be higher in the first and second quarters when demand is historically highest. A summary of the composition of our working capital during the periods ended June 30, 2011 and December 31, 2010 isprovided below ($000’s):
June 30 December 312011 2010
Investment in working capital assetsCash $ 3,073 $ 5,634 Accounts receivable 15,442 9,698 Inventories 37,524 30,878 Other current assets 2,319 2,917
$ 58,358 $ 49,127 Less current liabilities
Senior Credit Facility (7,437) - Accounts payable & accrued Llabilities (14,831) (13,329)Other current liabilities (2,371) (2,242)Current portion of long-term debt (3,713) (5,271)
Net investment in working capital $ 30,006 $ 28,285
Our objective for managing the investment in working capital is to maximize the turnover of productive current assets, beingaccounts receivable and inventories. We manage our cash to keep utilization of our revolving credit line as low as practicableto maintain borrowing capacity for when it is needed and to reduce ongoing interest costs. We also work with our key vendorsavail ourselves of vendor credit where possible and on advantageous terms.
We manage our inventories, our largest working capital asset, in part by purchasing raw materials more frequently and insmaller quantities than in past years, with an emphasis on a continuous inflow of inventories to meet our production needs.Making smaller and more frequent purchases, typically from suppliers located closer to our manufacturing facilities, enables us to hold less inventory at a cost more closely related to the current market price. We have also established processes toregularly adjust the levels of finished goods stocked in our warehouses so that we can both satisfy customer needs and meetour objective of minimizing inventories on hand.
Our second largest working capital asset is our accounts receivable. We manage our accounts receivable and the related creditrisk by focusing on well-established customers with favourable credit profiles. The credit worthiness of customers is assessedusing credit scores supplied by a third party and through direct monitoring of their financial well-being on a continual basis.We have established guidelines for customer credit limits and when thresholds in these areas are reached, appropriateprecautions are taken to improve collectability. We maintain provisions for potential credit losses (allowance for doubtfulaccounts) and such losses to date have been within our expectations.

16 Tree Island Wire Income Fund : Q2 : 2011 : Management’s Discussion and Analysis
8.2 Liquidity and CapitalCash FlowFollowing is a summary of our cash flow for the three and six month periods ended June 30, 2011 and 2010 ($000’s – bracketedfigures indicate use of cash):
Three Months Ended June 30 Six Months Ended June 30
2011 2010 2011 2010
Net cash used in operating activities $ 1,128 $ 1,523 $ 1,943 $ 1,646 Change in non-cash operating assets and liabilities $ (5,748) $ (3,516) $ (10,338) $ (13,034)Net cash used for investing activities $ (49) $ (26) $ (158) $ (46)Net cash provided by (used for) financing activities
Amounts drawn from the Senior Credit Facility 5,303 293 7,451 3,365
Repayment of long-term debt (669) (712) (1,398) (1,538)Financing transaction costs incurred - - - (396)Issuance of debentures
(net of transaction costs) - - - 9,519 $ 4,634 $ (419) $ 6,053 $ 10,950
Exchange rate changes on foreign cash balances (4) 137 (61) 35
Decrease in cash balances $ (39) $ (2,301) $ (2,561) $ (449)
During the three and six months ended June 30, 2011, cash provided by operating activities was $1.1 million and $1.9 millionrespectively, compared to $1.5 million and $1.6 million in the same periods last year. During Q2 2011, the $0.4 million decreasein cash provided by operating activities was the result of decreased EBITDA for the quarter. The increase in cash provided byoperations for the six-month period reflects increased EBITDA in Q1 2011. In Q2 2011, $5.7 million of cash was consumed forworking capital, compared to $3.5 million in Q1 2010. This primarily reflects greater reductions in accounts payable during themost recent quarter.
Investing activities consumed small amounts of cash in both periods for capital expenditures.
During the second quarter of 2011, we drew advances of $5.3 million on the Senior Credit Facility, increasing the amountoutstanding from $2.1 million as at March 31, 2011 to $7.4 million as at June 30, 2011. This was primarily due to paying downaccounts payable and accrued liabilities by $4.3 million during the second quarter of 2011.
In regards to the long-term debt, the Fund made payments of $0.7 million during the second quarter of 2011 (2010 - $0.7 million) and payments of $1.4 million during the six months ended June 30, 2011 (2010 - $1.5 million), in accordance with the terms of the debt.
Senior Credit FacilityUnder the terms of the Senior Credit Facility, up to $35 million may be borrowed for operating requirements in Canadian andUS currency. Interest is charged at variable rates based on the Canadian and/or US prime rate and the Canadian B.A. and/orEuro dollar rate. The Senior Credit Facility matures on March 25, 2013.
The Senior Credit Facility is a revolving loan and the Fund expects that it is sufficient to accommodate its daily operating needs.The credit available at any given time under the Senior Credit Facility is limited to the amount of the calculated borrowingbase, less a minimum availability of $2.5 million.
The Senior Credit facility has defined covenants, primarily a quarterly test whereby the Fund is required to meet a definedfixed charge coverage ratio if the availability on the Senior Credit Facility falls below $7.5 million (“Availability Test”). Inaddition, there are other restrictive covenants that limit the discretion of our management with respect to certain businessmatters.
As at June 30, 2011 the Fund’s availability was significantly in excess of the Availability Test and the Fund was in compliancewith its financial and other covenants on the Senior Credit Facility. For more details on the Senior Credit Facility please refer to Note 7 of the Fund’s interim condensed consolidated financial statements for June 30, 2011.

Tree Island Wire Income Fund : Q2 : 2011 : Management’s Discussion and Analysis 17
Debentures FinancingAs part of the Recapitalization Transaction, between Q4 2009 and the early part of 2010 we raised a total of $19.75 millionthrough the issuance of Debentures offered through a private placement and rights offering. The proceeds after transactioncosts of $2.2 million were applied to our credit facilities at the time. The Debentures are issued in $100 increments and payinterest quarterly, 30 days in arrears, at a stated rate of 10%. They mature on November 26, 2014 and are convertible intounits at $0.50.
No Debentures were converted during the three or six months ended June 30, 2011 (2010 – Q2: $365,000 of Debentures wereconverted to 730,000 units for a total of $365,400 Debentures converted to 730,800 units in the six-month period).
Long-term Incentive PlanSubject to vesting conditions determined by the Board of Trustees, the Phantom Units can be exchanged by holders at anytime for Units of the Fund to be issued from treasury for no further consideration. When the Fund pays distributions,distributions on vested and unvested Phantom Units are paid in additional Phantom Units.
During the three months ended June 30, 2011, no Phantom units were granted to employees under the plan and 28,695Phantom Units were converted into Units of the Fund. The maximum number of Units reserved for issuance pursuant toawards of Phantom Units is 500,000.
8.3 Standardized Distributable CashTo provide a transparent measure of cash available for distribution to unitholders that would be comparable between entitiesand consistent over time, the Canadian Institute of Chartered Accountants (“CICA”) has recommended the use of StandardizedDistributable Cash. Standardized Distributable Cash is defined as net cash from operating activities less all capital expenditures,less restrictions on distributions arising from compliance issues with financial covenants and less any minority interests.References in this MD&A to Standardized Distributable Cash is in all material respects in accordance with therecommendations provided in CICA’s publication Standardized Distributable Cash in Income Trusts and Other Flow-ThroughEntities: Guidance on Preparation and Disclosure.
Standardized Distributable Cash for the three and six month periods ended June 30, 2011 and 2010 was calculated as follows($000’s except for unit, per unit and % amounts):
Three Months Ended June 30 Six Months Ended June 30
2011 2010 2011 2010
Net Cash Used in Operating Activities $ (4,620) $ (1,993) $ (8,395) $ (11,388)Capital Expenditures (49) (26) (158) (46)Standardized Distributable Cash $ (4,669) $ (2,019) $ (8,553) $ (11,434)
Distributions Paid or Payable $ - $ - $ - $ - Weighted Average Units Issued and Outstanding
Basic 22,878,200 22,473,271 22,871,096 22,417,977 Fully Diluted 22,878,200 22,473,271 22,871,096 22,417,977
Standardized Distributable Cash per Unit (1)
Basic (0.2041) (0.0898) (0.3740) (0.5100)Fully Diluted (0.2041) (0.0898) (0.3740) (0.5100)
Distributions Paid or Payable per Unit - Basic and Fully Diluted $ - $ - $ - $ - Standardized Distribution Payout % 0% 0% 0% 0%
(1) Standardized Distribution payout percentage is calculated as distributions paid or payable per Unit, divided by standardized distributablecash per Unit.
The Standardized Distributable Cash generated since inception is as follows ($000’s except for % amounts):
Since Inception
Standardized Distributable Cash Generated Since Inception 170,206 Distributions Paid or Payable Since Inception 158,997 Standardized Distribution Payout % Since Inception 93%

18 Tree Island Wire Income Fund : Q2 : 2011 : Management’s Discussion and Analysis
We believe that the calculation of Standardized Distributable Cash distorts the Fund’s quarter-to-quarter distributable cashand payout ratios, given that our non-cash operating working capital fluctuates significantly as a result of the seasonality ofour business. As a result, we believe that our historical measure of Adjusted Distributable Cash, which excludes the impact ofchanges in non-cash working capital, is a better measure for determining our operating performance. Accordingly, acalculation and discussion of Adjusted Distributable Cash is provided in the following section.
8.4 Adjusted Distributable Cash and Distributions Historically, our policy was to make equal monthly distributions to unitholders based on our estimate of the annual AdjustedDistributable Cash available for distribution. The amount of Adjusted Distributable Cash available for distribution was basedon the Adjusted Distributable Cash generated, after allowances for cash redemption of units and any reserve deemed prudentby the Trustees of the Fund. Distributions were declared to unitholders of record on the last business day of each month.Distributions were payable on the 15th day (or closest business day following) of the month following the declaration. Due to the impact of the global economic crisis, limited credit availability and cash constraints, the Fund reduced distributions inNovember 2008 and subsequently suspended them in January 2009. Adjusted Distributable Cash for the three months endedJune 30, 2011 and 2010 was calculated as follows ($000’s except for unit, per unit and % amounts):
Three Months Ended June 30 Six Months Ended June 30
2011 2010 2011 2010
Standardized Distributable Cash $ (4,669) $ (2,019) $ (8,553) $ (11,434)Change in Non-cash Operating
Assets & Liabilities 5,748 3,516 10,338 13,034 Proceeds on Sale of Surplus Land - - - - Non-maintenance Capital Expenditures 4 - 5 - Adjusted Distributable Cash (1) $ 1,083 $ 1,497 $ 1,790 $ 1,600
Distributions Paid or Payable $ - $ - $ - $ - Weighted Average Units Issued and Outstanding
Basic 22,878,200 22,473,271 22,641,642 22,035,040 Fully Diluted 22,878,200 22,473,271 22,641,642 22,035,040
Adjusted Distributable Cash per UnitBasic 0.0473 0.0666 0.0791 0.0726 Fully Diluted 0.0473 0.0666 0.0791 0.0726
Distributions Paid or Payable per Unit - Basic & Fully Diluted $ - $ - $ - $ - Adjusted Distribution Payout % 0% 0% 0% 0%
(1) Adjusted distribution payout percentage is calculated as distributions paid or payable per Unit, divided by adjusted distributable cash per Unit
The Adjusted Distributable Cash generated since inception is as follows ($000’s except for % amounts):
Since Inception
Adjusted Distributable Cash Generated Since Inception (1) 136,025 Distributions Paid or Payable Since Inception 158,997 Adjusted Distribution Payout % Since Inception (1) 117%
(1) Includes pre-tax proceeds on the sale of a property option during the year ended December 31, 2006 and the pre-tax proceeds on thesale of surplus land (the tax provision for these proceeds on sale is included in the net cash provided from operating activities) for theyear ended December 31, 2006.
8.5 Utilization of Distributable CashFor the three months ended June 30, 2011, no distributions were declared or paid out of cash generated by the Fund.

Tree Island Wire Income Fund : Q2 : 2011 : Management’s Discussion and Analysis 19
9. CAPITAL EXPENDITURES & CAPACITYFor the three and six month periods ended June 30, 2011, we made capital expenditures of $49 thousand and $0.2 millionrespectively (Q1 2010 - $26 thousand and $46 thousand), made up of maintenance capital. We have planned capitalexpenditures for the 2011 fiscal year to a level which we believe will be sufficient to maintain the existing productive capacityof our manufacturing operations. Non-maintenance Capital is funded out of our Senior Credit Facility and maintenance capitalis funded from cash generated by operations. We anticipate that we will continue to have sufficient capacity to meetprojected future demand.
10. CONTRACTUAL OBLIGATIONS AND COMMITMENTSAs of June 30, 2011, we were committed to the contracts, operating leases and debt repayments (including scheduled interestpayments on interest bearing debt) set out below, which will be financed through working capital and our Senior CreditFacility.
Remainder of 2011 2012 2013 2014 2015 Thereafter Total
CommitmentsWire Rod Purchases $ 21,482 $ - $ - $ - $ - $ - $ 21,482 Finished Goods 1,930 - - - - - 1,930 Operating Lease Agreements 1,258 1,640 817 748 758 674 5,895
24,670 1,640 817 748 758 674 29,307 Financial Liabilities
Revolving Credit 7,437 - - - - - 7,437 Accounts Payable 14,831 - - - - - 14,831 Long-term debt 1,407 4,664 12,801 24,275 - - 43,147 Debentures 976 1,938 1,938 21,132 - - 25,984
Total $ 49,321 $ 8,242 $ 15,556 $ 46,155 $ 758 $ 674 $120,706
The wire rod purchases are for raw materials to be used in the day-to-day operations of our manufacturing facilities and areexpected to be delivered within the third and fourth quarters of 2011.
We have leases for facilities and equipment that are considered to be operating leases for accounting purposes and as such are not recorded on the statement of financial position. We do not have any leases that would be considered finance leases.
We have an ongoing and renewing tolling agreement for contract manufacturing whereby our customer retains ownership ofthe raw materials and finished goods and we charge the customer a tolling fee for processing the raw material into finishedgoods, thereby reducing our working capital requirements.

20 Tree Island Wire Income Fund : Q2 : 2011 : Management’s Discussion and Analysis00
11. SUMMARY OF QUARTERLY FINANCIAL INFORMATIONThe table below provides selected quarterly financial information for the eight most recent fiscal quarters to June 30, 2011.Information for 2011 and 2010 are presented in accordance with IFRS; however, the 2009 information is presented inaccordance with Canadian GAAP and has not been restated to be in accordance with IFRS. This information reflects alladjustments of a normal, recurring nature which are, in our opinion, necessary to present fairly the results of operations forthe periods presented ($000’s, except tons and per unit amounts). Fourth quarter results are traditionally lower than the otherquarters due to the seasonality of our business. Quarter-over-quarter results may also be impacted by unusual or infrequentlyoccurring items. These financial results are not necessarily indicative of results for any future period and should not be reliedupon to predict future performance.
Jun 30 Mar 31 Dec 31 Sep 30 Jun 30 Mar 31 Dec 31 Sep 302011 2011 2010 (1) 2010 2010 (1) 2010 2009 (2) 2009 (2)
Sales Volumes – Tons (3) 27,676 29,948 20,565 23,192 27,732 27,886 21,171 31,565 Revenue 38,000 38,944 27,746 31,392 38,742 34,532 26,740 38,456 Gross Profit 3,564 4,380 509 (488) 3,839 2,404 (3,378) (1,718)EBITDA 1,725 1,972 (320) (2,173) 2,282 261 (5,514) (5,303)Foreign exchange gain (loss) 160 418 763 710 (758) (557) 150 1,162Adjusted EBITDA 1,885 2,390 443 (1,463) 1,524 (296) (5,364) (4,141)Net Income (Loss) 29 (4,039) (3,211) (5,459) (190) (2,537) 13,294 (1,625)Net Income (Loss) per Unit – Basic 0.00 (0.18) (0.14) (0.24) (0.01) (0.12) 0.60 (0.07)Gross Profit per Ton 119 146 25 (21) 138 86 (160) (54)EBITDA per Ton 58 66 (16) (94) 78 9 (260) (168)Distributions Paid or Payable - - - - - - - -
(1) Balances have been reclassified for comparative purposes.(2) Information for 2009 is presented in accordance with Canadian GAAP. (3) Sales volumes exclude tons which are part of tolling arrangements.
• Q3 2009: Declines in the price of steel led to a reduction in the value of certain of our finished goods inventories. In accordance with prior Canadian GAAP, we recorded a write down of $0.5 million inventory values to net realizable value.
• Q2 2010: Our “Back to Basics” strategy, the focus on profitability and cost control continued to result in improvedprofitability and EBITDA for the quarter despite reduced volumes.
• Q3 2010: Continued weakness in the economy and in particular many of our key markets, impacted our Q3 sales. This wascompounded by our decision to focus working capital on higher-margin product lines, rather than higher volume productlines, and by customers in certain markets to reduce inventories in line with low demand.
• Q4 2010: Continuing weakness in our key markets resulted in lower volumes compared to the same quarter in the prioryear. However, the focus on profitability and cost control helped mitigate the negative impact.
• Q1 2011: Significant increases in steel prices required us to announce a series of price increases to mitigate the impact onour margins. A strong Canadian dollar also negatively impacted our US dollar-denominated sales but contributed toreductions in costs of sales and expenses relating to our US dollar-denominated costs.
12. ACCOUNTING POLICIES AND ESTIMATESThe Fund’s significant accounting policies are contained in Note 2 of the interim condensed consolidated financial statementsfor the three months ended March 31, 2011 and have not changed in the second quarter of 2011. Please refer to the Fund’sMarch 31, 2011 quarterly report for more details. Certain of these policies involve critical accounting estimates that require theFund to make subjective or complex judgments about matters that are inherently uncertain and because of the likelihood thatmaterially different amounts could be reported under differing conditions or using different assumptions. The Fund evaluatesthese estimates and assumptions regularly.

Tree Island Wire Income Fund : Q2 : 2011 : Management’s Discussion and Analysis 21
Critical Accounting EstimatesThe areas that we consider to have critical accounting estimates are: going concern, valuation of financial instruments,inventory valuation, allowance for doubtful accounts, income taxes, and property, plant and equipment. These criticalestimates and the judgments involved are discussed further in the Fund’s interim condensed consolidated financial statementsfor the three months ended March 31, 2011 (Note 4) and have not changed for the second quarter of 2011.
Property, plant and equipment
During the first quarter of 2011, the Fund conducted a comprehensive review of the remaining useful life of its property, plant and equipment. As a result of this review, the estimated useful lives of certain equipment and property were extendedfor between 3 to 17 years. This change in estimate has been accounted for prospectively from January 1, 2011 and resulted in a $0.4 million reduction in depreciation for the second quarter and $1.2 million reduction for the six months ended June 30, 2011.
Price Risk on Convertible Instruments
Our results of operations are exposed to changes in our unit price because the conversion feature and warrants are valued atfair value, which will vary with changes in the Fund’s unit price and changes in the risk free rate. The table below describespotential risks:
Conversion Warrants Feature
Increase (decrease) to the net income of a $0.01 increase in the Fund’s unit price (17) (118)Increase (decrease) to the net income of a 1% increase in risk fee rate (11) (72)
Adoption of International Financial Reporting Standards (“IFRS”)The Fund has adopted IFRS effective January 1, 2011 and prepared comparative financial information using IFRS for the yearended December 31, 2010. Prior to the adoption of IFRS, the Fund prepared its consolidated financial statements underCanadian GAAP.
While the adoption of IFRS has not changed the actual cash flows of the Fund, the adoption has resulted in significant changesto the reported financial position and results of operations of the Fund. Reconciliations between IFRS and Canadian GAAPhave been prepared for the comparative 2010 periods to reconcile the financial position, unitholders’ equity, statement ofoperations and comprehensive income (loss).
These reconciliations and description of the impact of the conversion to IFRS are available in the Fund’s June 30, 2011 interimcondensed consolidated financial statements (Note 20). Below is a summary of the more significant changes.
Property, Plant and Equipment (“PPE”)As a result of one of the available transitional elections upon adoption of IFRS, the Fund elected to value machinery andequipment on transition at fair value which then becomes the deemed cost on which to amortize/depreciate in future periods.This resulted in an increase to the carrying value of the “PPE” of $0.8 million as at the transition date and the resultingadjustment being charged to retained earnings and a minimal change to depreciation for the three and six months endedJune 30, 2011
Fund Units and Instruments Convertible into Fund UnitsUnder Canadian GAAP, the Fund’s units were classified as equity. Upon transition to IFRS, the equity classification of the unitswas evaluated because the units can be redeemed at the option of the holder, subject to certain terms and restrictions (seeNote 12 of the June 30, 2011 interim condensed consolidated financial statements). Based on IAS 32, the units meet theconditions for equity classification and therefore continue to be classified as equity under IFRS. However, other instrumentsthat are convertible into Fund units do not qualify for this exemption and are discussed below.
Convertible Debentures
The Fund has issued Convertible Debentures which are considered to be compound instruments and under Canadian GAAP.The proceeds received were bifurcated to record the fair value of the associated elements which included the embeddedfinancial derivative for the change of control premium, the conversion feature and any warrants issued with the residual beingallocated to the debt portion of the Convertible Debentures. Transaction costs were allocated pro rata between the elementsof the Convertible Debentures. The Convertible Debentures and change of control option were classified as financial liabilitiesand the conversion feature and warrants were classified as equity.

22 Tree Island Wire Income Fund : Q2 : 2011 : Management’s Discussion and Analysis
Under IFRS, the Convertible Debentures continue to be considered compound instruments and the original determination offair values at issuance are consistent between Canadian GAAP and IFRS. The accounting and classification of the ConvertibleDebentures and of the change of control premium have not changed on conversion to IFRS. However, the conversion featureand warrants under IFRS are classified as financial liabilities and fair value is re-measured at each reporting period withchanges in fair value being recorded in the statement of operations. Under Canadian GAAP, the conversion feature andwarrants were recorded in unitholders’ equity net of allocated transaction costs. Under IFRS, as a result of being classified asfinancial liabilities, the associated transactions costs have been expensed when incurred. At the transition date, thetransaction costs related to the conversion feature and warrants from the Convertible Debentures of $0.3 million issued in2009 have been adjusted to retained earnings and for the three and six month periods ending June 30, 2010 the transactioncosts of $nil and $0.3 million relating to the conversion feature and warrants from the Convertible Debentures issued inJanuary 2010 have been charged to financing expenses in the restated statement of operations.
This change in classification of the conversion feature and warrants and resulting recognition of fair value changes in thestatement of operations will result in increased volatility of net income and earnings per unit. This has resulted in a gain of$1.8 million and $0.9 million for the three and six months ended June 30, 2011 (2010 - $3.1 million gain and $3.7 million gain)on the revaluation of these instruments to fair value at each period end.
Deferred gain on sale of optionIn 2006 the Fund sold a purchase option on its leased property in Pomona, California. The net pre-tax cash proceeds receivedon the sale was $5.3 million. The sale was treated as a sale and lease back under Canadian GAAP and the gain was deferredand amortized over the ten year life of the new lease.
Under IAS 17, the Pomona option sale would have been accounted for as a gain at the time of the transaction. As such,retained earnings as at January 1, 2010 has been adjusted for the balance of the deferred gain of $3.3 million under CanadianGAAP and for the three and six months ended June 30, 2011, the amount of deferred gain recognized under Canadian GAAPin the statement of operations of $0.1 million and $0.2 million has been reversed.
13. RELATED PARTY TRANSACTIONSOne of the investors in the Recapitalization Transaction, The Futura Corporation (“Futura”), is considered to be a related party to the Fund because of its ownership interest and the holding of two positions on the Board of Trustees. Futura haspurchased $5 million of Convertible Debentures and was issued 1,875,000 warrants as part of the Recapitalization Transaction.During the three and six months ended June 30, 2011, Futura received interest settled in cash of $0.1 million and $0.2 million(2010 - $0.1 million and $0.1 million) on the Convertible Debentures at the stated rate of interest.
As well, the Fund sells products to subsidiaries of a company controlled by Futura, Canwel Building Materials Group Ltd.(“Canwel”), which amounted to, net of rebates, for the three and six months ended June 30, 2011, $1.1 million and $2.9 million (2010 - $1.2 million and $3.5 million). Trade accounts receivable owing from Canwel is $0.5 million (2010 - $nil) as at June 30, 2011. These transactions are in the normal course and are recorded at terms equivalent to an arm’s lengthtransaction. Outstanding trade accounts receivable from Canwel at period end are unsecured, interest free and settlementoccurs in cash.
14. RISKS AND UNCERTAINTIESInvestment in the Fund is subject to a number of risks. Cash distributions to unitholders are dependent upon the ability of Tree Island to pay its interest and principal obligations under the notes, and to declare and pay dividends in respect of thevoting common shares. Tree Island’s income is dependent upon the fabricated wire products business, which is susceptible to anumber of risks. A detailed discussion of our significant business risks is provided in the Fund’s 2010 Annual Information Formunder the heading “Risk Factors” which can be found at www.sedar.com. There have been no changes to these risks in the second quarter 2011 from those discussed in the Fund’s 2010 Annual Information Form other than as discussed below.
Trade ActionsThe US government announced two trade action reviews: one related to certain galvanized wire imported from China andMexico and another related to certain nails imported from the United Arab Emirates. We are monitoring both cases closely,however, we cannot reasonably estimate the impact of these trade actions until the determination is announced in the fall of 2011. These actions could have a material negative impact on our financial results.
Price Risk on Convertible InstrumentsThe results of our operations are exposed to changes in our unit price because the conversion feature and warrants are valuedat fair value, which will vary inversely with changes in the Fund’s unit price and changes in the risk free rate. The impact ofvariances in the unit price volatility and risk free rate are shown in section 12 “Accounting Policies and Estimates.”

Q2 : 2011 23
NOTICE OF NO AUDITOR REVIEW OF INTERIM FINANCIAL STATEMENTSUnder National Instrument 51-102 “Continuous Disclosure Obligations”, Part 4, Subsection 4.3(3a), if an auditor has notperformed a review of the interim financial statements, they must be accompanied by a notice indicating that the financialstatements have not been reviewed by an auditor.
The accompanying interim unaudited consolidated financial statements of the Fund have been prepared by and are theresponsibility of the Fund’s management.
The Fund’s independent auditor, Ernst & Young LLP, has not performed a review of these financial statements in accordancewith standards established by the Canadian Institute of Chartered Accountants for a review of interim financial statements byan entity’s auditor.
August 9, 2011
15. DISCLOSURE CONTROLS AND PROCEDURES AND INTERNAL CONTROL OVER FINANCIAL REPORTING
Our management is responsible for designing disclosure controls and procedures that: (a) provide reasonable assurance thatmaterial information required to be disclosed by us is accumulated and communicated to management to allow timelydecisions regarding required disclosure; and (b) ensure that information required to be disclosed by us is recorded, processed,summarized, and reported within the time periods specified in applicable securities legislation.
Our management is also responsible for designing, establishing and maintaining an adequate system of internal control overfinancial reporting. Our internal control system was designed based on the Internal Control – Integrated Framework (“COSOFramework”) published by The Committee of Sponsoring Organizations of the Treadway Commission to provide reasonableassurance regarding the reliability of financial reporting and the preparation of financial statements for external purposes, inaccordance with IFRS.
Our Chief Executive Officer and Chief Financial Officer certified the appropriateness of the financial disclosures in the interimfinancial report together with the other financial information included in the interim filings for the period ended June 30,2011. These executives also certified that they are responsible for the design of disclosure controls and procedures and internalcontrol over financial reporting. There have been no changes in internal control over financial reporting during the quarterended June 30, 2011 that have materially affected, or are reasonably likely to materially affect, our internal control overfinancial reporting.
The Fund’s Board of Trustees and Audit Committee reviewed and approved the June 30, 2011 unaudited interim condensedconsolidated financial statements and this MD&A prior to its release.
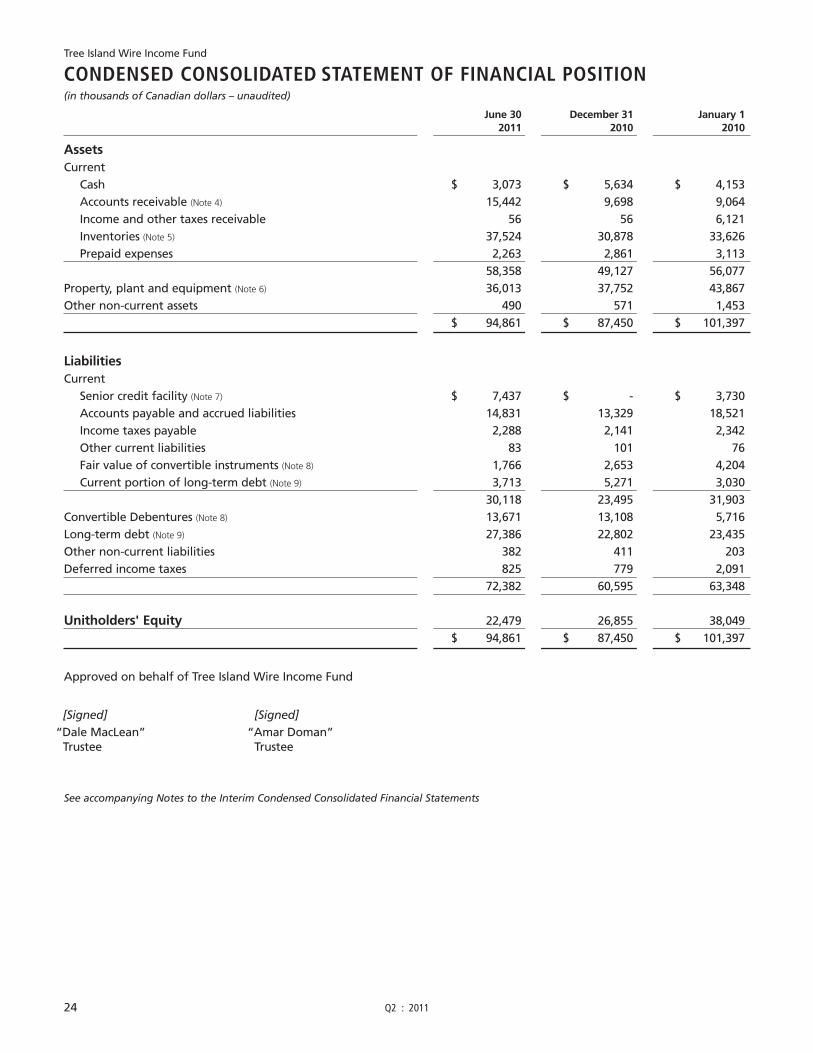
Tree Island Wire Income Fund
CONDENSED CONSOLIDATED STATEMENT OF FINANCIAL POSITION(in thousands of Canadian dollars – unaudited)
June 30 December 31 January 12011 2010 2010
AssetsCurrent
Cash $ 3,073 $ 5,634 $ 4,153 Accounts receivable (Note 4) 15,442 9,698 9,064 Income and other taxes receivable 56 56 6,121 Inventories (Note 5) 37,524 30,878 33,626 Prepaid expenses 2,263 2,861 3,113
58,358 49,127 56,077 Property, plant and equipment (Note 6) 36,013 37,752 43,867 Other non-current assets 490 571 1,453
$ 94,861 $ 87,450 $ 101,397
LiabilitiesCurrent
Senior credit facility (Note 7) $ 7,437 $ - $ 3,730 Accounts payable and accrued liabilities 14,831 13,329 18,521 Income taxes payable 2,288 2,141 2,342 Other current liabilities 83 101 76 Fair value of convertible instruments (Note 8) 1,766 2,653 4,204 Current portion of long-term debt (Note 9) 3,713 5,271 3,030
30,118 23,495 31,903 Convertible Debentures (Note 8) 13,671 13,108 5,716 Long-term debt (Note 9) 27,386 22,802 23,435 Other non-current liabilities 382 411 203 Deferred income taxes 825 779 2,091
72,382 60,595 63,348
Unitholders' Equity 22,479 26,855 38,049 $ 94,861 $ 87,450 $ 101,397
Approved on behalf of Tree Island Wire Income Fund
See accompanying Notes to the Interim Condensed Consolidated Financial Statements
24 Q2 : 2011
[Signed] [Signed]“Dale MacLean” “Amar Doman”
Trustee Trustee

Tree Island Wire Income Fund
CONDENSED CONSOLIDATED STATEMENT OF OPERATIONS(in thousands of Canadian dollars, except units and per-unit amounts – unaudited)
Three Months Ended June 30 Six Months Ended June 30
2011 2010 2011 2010
Sales $ 38,000 $ 38,742 $ 76,944 $ 73,274 Cost of goods sold (Note 5) 33,474 33,489 67,361 64,197 Depreciation 962 1,414 1,639 2,834 Gross profit 3,564 3,839 7,944 6,243 Selling, general and administrative expenses 2,801 2,971 5,886 6,534 Operating income (loss) 763 868 2,058 (291)Foreign exchange gain (loss) 160 (758) 578 (1,315)Changes in financial liabilities recognized
at fair value 1,779 3,114 887 3,750 Loss on renegotiated debt (Note 9) - - (3,234) - Financing expenses (Note 10) (2,040) (2,452) (4,106) (6,286)Income (loss) before income taxes 662 772 (3,817) (4,142)Income tax recovery (expense) (Note 14) (633) (962) (193) 1,415 Net income (loss) for the period $ 29 $ (190) $ (4,010) $ (2,727)
Net income (loss) per unitBasic $ 0.00 $ (0.01) $ (0.18) $ (0.12)Diluted $ 0.00 $ (0.01) $ (0.18) $ (0.12)
Weighted-average number of units (Note 19)
Basic 22,878,200 22,473,271 22,871,096 22,417,977 Diluted 22,878,200 22,473,271 22,871,096 22,417,977
See accompanying Notes to the Interim Condensed Consolidated Financial Statements
Q2 : 2011 25

Tree Island Wire Income Fund
CONDENSED CONSOLIDATED STATEMENT OF COMPREHENSIVE INCOME (LOSS)(in thousands of Canadian dollars – unaudited)
Three Months Ended June 30 Six Months Ended June 30
2011 2010 2011 2010
Net income (loss) for the period $ 29 $ (190) $ (4,010) $ (2,727)
Other comprehensive income (loss)Unrealized gain (loss) on translating financial statements of subsidiary operations 32 1,028 (382) (955)
Comprehensive income (loss) for the period $ 61 $ 838 $ (4,392) $ (1,772)
See accompanying Notes to the Interim Condensed Consolidated Financial Statements
26 Q2 : 2011

Q2 : 2011 27
Tree Island Wire Income Fund
CONDENSED CONSOLIDATED STATEMENT OF CHANGES IN EQUITY(in thousands of Canadian dollars – unaudited)
AccumulatedOther
Unitholders’ Accumulated ComprehensiveCapital Earnings (Deficit) Distributions Loss Total
Balance as at December 31, 2010 $ 211,460 $ (25,038) $ (159,248) $ (319) $ 26,855
Conversion of phantom units (Note 12) 4 - - - 4
Net loss - (4,039) - - (4,039)
Other comprehensive loss - - - (414) (414)
Balance as at March 31, 2011 $ 211,464 $ (29,077) $ (159,248) $ (733) $ 22,406
Conversion of phantom units (Note 12) 12 - - - 12
Net income - 29 - - 29
Other comprehensive income - - - 32 32
Balance as at June 30, 2011 $ 211,476 $ (29,048) $ (159,248) $ (701) $ 22,479
Balance as at January 1, 2010 $ 211,125 $ (13,828) $ (159,248) $ - $ 38,049
Conversion of phantom units (Note 12) 3 - - - 3
Net loss - (2,537) - - (2,537)
Other comprehensive loss - - - (73) (73)
Balance as at March 31, 2010 $ 211,128 $ (16,365) $ (159,248) $ (73) $ 35,442
Conversion of phantom units (Note 12) 6 - - - 6
Conversion of debentures (Note 12) 326 - - - 326
Net loss - (190) - - (190)
Other comprehensive income - - - 1,028 1,028
Balance as at June 30, 2010 $ 211,460 $ (16,555) $ (159,248) $ 955 $ 36,612
See accompanying Notes to the Interim Condensed Consolidated Financial Statements

Tree Island Wire Income Fund
CONDENSED CONSOLIDATED STATEMENT OF CASH FLOWS(in thousands of Canadian dollars – unaudited)
Three Months Ended June 30 Six Months Ended June 30
2011 2010 2011 2010
Cash flows from operating activitiesNet income (loss) for the period $ 29 $ (190) $ (4,010) $ (2,727)Items not involving cash
Depreciation 962 1,414 1,639 2,834 Fair value changes on convertible instruments (1,779) (3,114) (887) (3,750)Amortization and write-off of deferred financing 61 61 123 1,245 Loss on renegotiated debt - - 3,234 - Non cash accretion of debt discount 1,652 1,812 2,978 3,749 Deferred income tax (recoveries) 628 918 45 (330)Unit-based compensation 11 332 15 335 Exchange revaluation on foreign denominated debt (436) 290 (1,194) 290
1,128 1,523 1,943 1,646 Change in non-cash operating assets and liabilities (Note 19) (5,748) (3,516) (10,338) (13,034)
Net cash used in operating activities (4,620) (1,993) (8,395) (11,388)
Cash flows from investing activitiesPurchase of property, plant and equipment (49) (26) (158) (46)
Net cash used in investing activities (49) (26) (158) (46)
Cash flows from financing activitiesIssuance of Convertible Debentures, net of transaction costs - - - 9,519 Repayment of long-term debt (669) (712) (1,398) (1,538)Financing transaction costs incurred - - - (396)Advance on (repayment of) revolving credit 5,303 293 7,451 3,365
Net cash (used in) provided by financing activities 4,634 (419) 6,053 10,950
Effect of exchange rate changes on cash (4) 137 (61) 35
Decrease in cash (39) (2,301) (2,561) (449)Cash, beginning of period 3,112 6,005 5,634 4,153 Cash, end of period $ 3,073 $ 3,704 $ 3,073 $ 3,704
Supplemental cash flow information:Interest paid $ 700 $ 510 $ 1,359 $ 866 Income taxes $ - $ 302 $ - $ 302
See accompanying Notes to the Interim Condensed Consolidated Financial Statements
28 Q2 : 2011

Tree Island Wire Income Fund : Q2 : 2011 : Notes to the Interim Condensed Consolidated Financial Statements 29
Tree Island Wire Income Fund
NOTES TO THE INTERIM CONDENSED CONSOLIDATED FINANCIAL STATEMENTSFor the three and six month periods ended June 30, 2011 and 2010 (in thousands of Canadian dollars, except per-unit amounts - unaudited)
1. NATURE OF BUSINESS
Nature of Business
These condensed consolidated interim financial statements of Tree Island Wire Income Fund (the “Fund”) for the three and six month periods ended June 30, 2011 were authorized for issue in accordance with a resolution of the Trustees onAugust 9, 2011.
The Fund is an unincorporated, open-ended, limited purpose trust established under the laws of the Province of BritishColumbia pursuant to a Declaration of Trust dated September 30, 2002 and headquartered in Richmond, British Columbia,Canada. Each unitholder participates pro rata in distributions of net earnings and, in the event of termination of the Fund,participates pro rata in the net assets remaining after satisfaction of all liabilities. The Fund’s Units are publicly traded on the TSX.
The Fund owns 100% of the common shares of Tree Island Industries Ltd. (“TII” or “Tree Island”). Tree Island supplies a diverserange of steel wire and fabricated steel wire products to customers in Canada, the United States and Asia.
The Fund’s operations are impacted by the seasonal nature of various industries, primarily the construction and agricultureindustries. Accordingly, revenues, sales volumes and operating results for interim quarters are not necessarily indicative of theresults that may be expected for the full fiscal year and fourth quarter results are traditionally lower than other quarters dueto the onset of winter and the corresponding reduction in consumer activities.
Recapitalization and Liquidity
Through the later half of 2009 and the first quarter of 2010, the Fund completed a recapitalization of the business (the“Recapitalization Transaction”). This included issuing 10% second lien convertible debentures (“Convertible Debentures”) on November 26, 2009 by means of a private placement with three investors for $9,750 (“Private Placement”) followedsubsequently on January 29, 2010, with a successful public rights offering for an additional $10,000 (Note 8). The Fund,through its operating subsidiaries, also entered into forbearance and payment agreements (“Forbearance Agreements”) withthe Fund’s significant trade creditors pursuant to which the Fund has restructured $40,435 of trade payables through deferredpayment arrangements extending to December 31, 2014 (Note 9). The Fund has also entered into senior credit facilities for amaximum facility of $35 million (“Senior Credit Facility”) which are further described in Note 7.
In January 2011, the Fund amended the principal repayment schedule under the Forbearance Agreements. The new paymentterms are further described in Note 9.
With the Senior Credit Facility of $35 million, working capital of $28 million, amended Forbearance Agreements and cash flow forecasts projected through 2012, the Fund believes there is sufficient capital to continue as a going concern. The accompanying condensed consolidated interim financial statements have been prepared assuming the Fund will be able to maintain sufficient capital or obtain new sources of capital to continue as a going concern which contemplates therealization of assets and the satisfaction of liabilities in the normal course of business. These condensed consolidated interimfinancial statements do not include any adjustments relating to the amounts and classifications of recorded asset and liabilities that might be necessary should the Fund be unable to continue as a going concern.
2. BASIS OF PREPARATION AND ACCOUNTING POLICIES
Basis of Preparation
These condensed consolidated interim financial statements of the Fund as of and for the three and six month periods endedJune 30, 2011 have been prepared in accordance with International Accounting Standard (“IAS”) IAS 34, “Interim FinancialReporting”. They should be read in conjunction with the annual consolidated financial statements, the notes thereto in theFund’s Annual Report for the year ended December 31, 2010 and the March 31, 2011 First Quarter condensed consolidatedinterim financial statements and do not include all of the information required for full annual financial statements.
Basis of consolidation
The consolidated financial statements include the accounts of the Fund and TII, and TII’s wholly-owned subsidiaries, Tree Island Wire Holdings (USA) Inc. (“TIWH”) and its subsidiary Tree Island Wire (USA) Inc. (“TIW”), Tree Island International Ltd. (“TI International”) and its subsidiaries General Industries & Products International Trade (Tianjin) Co. Ltd. (“GIP”) and Tianjin S G United Wire Co Ltd. (“Shoutung”). Intercompany accounts and transactions have been eliminated on consolidation.

30 Tree Island Wire Income Fund : Q2 : 2011 : Notes to the Interim Condensed Consolidated Financial Statements
Functional and Presentation Currency
The functional and presentation currency of the Fund and its subsidiary Tree Island is the Canadian Dollar. The functionalcurrencies of Tree Island’s subsidiaries are: TIW and TIWH is the US Dollar; TI International is the US dollar and GIP andShoutong have a functional currency of RMB. Transactions in currencies other than the functional currency are recorded at the rate of exchange prevailing on the date of the transaction. Monetary assets and liabilities that are denominated in foreigncurrencies are translated at the rate prevailing at each reporting date. Non-monetary assets and liabilities denominated inforeign currencies that are measured at fair value are retranslated to the functional currency at the exchange rate at the datethe fair value was determined. Non-monetary items that are measured at historical cost in a foreign currency are translated atthe exchange rate on the date of the transaction.
Accounting Policies
The Canadian Accounting Standards Board (“AcSB”) requires all public companies to adopt International Financial ReportingStandards (“IFRS”) as issued by the International Accounting Standards Board, replacing Canadian generally acceptedaccounting principles (“GAAP”), for interim and annual financial statements relating to fiscal years beginning on or afterJanuary 1, 2011. As a result, the Fund has adopted IFRS on January 1, 2011 and prepared comparative financial informationunder IFRS. The impact of the transition from Canadian GAAP to IFRS on the three and six months ended June 30, 2010 isexplained in Note 20. IFRS 1 First-Time Adoption of IFRS has been applied.
The accounting policies, methods of application and critical judgements and estimates used in the preparation of these interim consolidated financial statements are consistent with those disclosed in the interim condensed consolidated financialstatements as at March 31, 2011.
These condensed consolidated interim financial statements have been prepared on a historical cost basis except for certainfinancial liabilities categorized as fair value through profit or loss. In addition, these condensed consolidated interim financialstatements have been prepared using the accrual basis of accounting, except for cash flow information.
3. FUTURE IFRS STANDARDS AND INTERPETATIONS ISSUED BUT NOT YET EFFECTIVE
Unless otherwise indicated below, the Fund is in the process of assessing whether there will be any significant changes to its consolidated financial statements upon adoption of these new standards, interpretations, or amendments. At this time, it the Fund does not plan to early adopt any of these new standards, interpretations, or amendments.
IFRS 7 - On October 7, 2010, the IASB issued amendments to IFRS 7 Financial Instruments: Disclosures as part of itscomprehensive review of off-balance sheet activities. The amendments are intended to provide users of financial statementsadditional information regarding financial assets (for example, securitizations), including the possible effects of risks thatremain with the entity that transferred the assets. The amendments also require additional disclosures if a disproportionateamount of transfer transactions are undertaken around the end of a reporting period. These amendments are to be appliedfor annual periods beginning on or after July 1, 2011, with earlier application permitted.
IFRS 9 – Financial Instruments was issued in November 2009. This Standard is the first step in the process to replace IAS 39 –Financial Instruments: Recognition and Measurement. IFRS 9 introduces new requirements for classifying and measuringfinancial assets, and could affect the Fund’s accounting for its financial assets. The Standard is not applicable until annualperiods beginning on or after January 1, 2013, but is available for early adoption.
IFRS 10 replaces the portion of IAS 27 Consolidated and Separate Financial Statements that addresses the accounting forconsolidated financial statements. It also includes the issues raised in SIC-12 Consolidation — Special Purpose Entities. IFRS 10establishes a single control model that applies to all entities (including ‘special purpose entities,’ or ‘structured entities’ as theyare now referred to in the new standards). The changes introduced by IFRS 10 will require management to exercise significantjudgment to determine which entities are controlled, and therefore are required to be consolidated by a parent, comparedwith the requirements that were in IAS 27. Therefore, IFRS 10 may change which entities are within a group. The Standard isnot applicable until annual periods beginning on or after January 1, 2013, but is available for early adoption.
IFRS 12 includes all of the disclosures that were previously in IAS 27 related to consolidated financial statements, as well as allof the disclosures that were previously included in IAS 31 – Investment in Joint Ventures and IAS 28 – Investment in Associates.These disclosures relate to an entity’s interests in subsidiaries, joint arrangements, associates and structured entities. A numberof new disclosures are also required. One of the most significant changes introduced by IFRS 12 is that an entity is nowrequired to disclose the judgments made to determine whether it controls another entity. The Standard is not applicable untilannual periods beginning on or after January 1, 2013, but is available for early adoption.
IFRS 13 does not change when an entity is required to use fair value, but rather, provides guidance on how to measure the fairvalue of financial and non-financial assets and liabilities when required or permitted by IFRS. The disclosure requirements aresubstantial. IFRS 13 is not applicable until annual periods beginning on or after January 1, 2013 and will be adoptedprospectively.

Tree Island Wire Income Fund : Q2 : 2011 : Notes to the Interim Condensed Consolidated Financial Statements 31
4. ACCOUNTS RECEIVABLE
Below is the composition and aging of the Fund’s accounts receivable at each period end:
June 30 December 31 January 12011 2010 2010
Accounts ReceivableUp to date $ 12,701 $ 7,158 $ 6,906 Under 30 days past due 2,405 2,296 1,893 30-60 days past due 428 358 349 61-90 days past due 106 151 62 Over 91 days past due 609 709 1,160
16,249 10,672 10,370 Allowance for doubtful accounts (807) (974) (1,306)
Balance, end of period $ 15,442 $ 9,698 $ 9,064
The maximum credit risk that the Fund is exposed to by way of its accounts receivable is equal to the carrying amount of$15,442 as at June 30, 2011. The Fund has concentrations of credit risk relating to receivables derived from the Western UnitedStates. As at June 30, 2011, this exposure was $7.2 million in accounts receivables for which $0.6 million has been provided forin the allowance for doubtful accounts.
At the end of each reporting period a review of the provision for bad and doubtful accounts is performed. It is an assessment of the potential amount of trade accounts receivable which will be paid by customers after the balance sheet date.The assessment is made by reference to age, status and risk of each receivable, current economic conditions and historicalinformation. The trade accounts receivable balance is reduced through the use of the allowance for doubtful accounts and the amount of the loss is recognized in the income statement. Reversals to the allowance for doubtful accounts occur whenpreviously allowed for trade accounts receivable are collected. Individual trade accounts receivable, together with anyassociated allowance previously recognized, are written off when there is no realistic prospect of future recovery.
The following table represents a summary of the movement of the allowance for doubtful accounts.
June 30 December 312011 2010
Opening Balance $ 974 $ 1,306 Additions during the period 29 405 Reversals during the period (99) (568)Write-offs during the period (75) (133)Foreign exchange revaluation (22) (36)
Balance, end of period $ 807 $ 974
5. INVENTORIES
The Fund had the following categories of inventory as at:
June 30 December 31 January 12011 2010 2010
Raw materials $ 8,327 $ 7,458 $ 6,686 Finished and semi finished products 21,356 15,763 19,128 Consumable supplies and spare parts 7,841 7,657 7,812
$ 37,524 $ 30,878 $ 33,626
At each period end, the Fund reviews the ending inventories on hand to determine if a writedown to net realizable value isrequired. The Fund has recognized a cumulative charge over the three and six month periods ended June 30, 2011 of $129 and $129 (2010 - $158 and $261) in cost of goods sold to writedown inventories to net realizable value.

32 Tree Island Wire Income Fund : Q2 : 2011 : Notes to the Interim Condensed Consolidated Financial Statements
In the three and six month periods ended June 30, 2011 and 2010, the Fund has recognized, in income, inventory costs for the following:
Three months ended June 30 Six months ended June 30
2011 2010 2011 2010
Opening inventory $ 34,072 $ 40,058 $ 30,878 $ 33,626 Raw material purchases 26,764 22,042 54,195 46,746 Finished goods purchased for resale 978 4,821 1,096 7,671 Conversion costs 9,313 9,104 18,845 18,793 Writedown (129) (158) (129) (261)Inventories, closing (37,524) (42,378) (37,524) (42,378)
Cost of goods sold $ 33,474 $ 33,489 $ 67,361 $ 64,197
6. PROPERTY PLANT AND EQUIPMENT
Land & Building & Machinery & Constructionimprovements improvements equipment in progress Total
CostAs at January 1, 2010 $ 9,177 $ 38,959 $ 17,609 $ 195 $ 65,940
Additions - - 115 (158) (43)Foreign currency translation (72) (275) (165) - (512)
As at December 31, 2010 $ 9,105 $ 38,684 $ 17,559 $ 37 $ 65,385 Additions - - - 170 170 Foreign currency translation (43) (160) (184) (1) (388)
As at June 30, 2011 $ 9,062 $ 38,524 $ 17,375 $ 206 $ 65,167
Accumulated depreciation As at January 1, 2010 $ - $ 20,993 $ 1,080 $ - $ 22,073
Additions - 2,982 2,801 - 5,783 Foreign currency translation - (223) - - (223)
As at December 31, 2010 $ - $ 23,752 $ 3,881 $ - $ 27,633 Additions - 697 937 - 1,634 Foreign currency translation - (103) (10) - (113)
As at June 30, 2011 $ - $ 24,346 $ 4,808 $ - $ 29,154
Net book values as at: January 1, 2010 $ 9,177 $ 17,966 $ 16,529 $ 195 $ 43,867 December 31, 2010 $ 9,105 $ 14,932 $ 13,678 $ 37 $ 37,752
June 30, 2011 $ 9,062 $ 14,178 $ 12,567 $ 206 $ 36,013
The Fund reviews the carrying value of its long-lived assets annually. Where the carrying value of the assets is not expected to be recoverable from future cash flows, they are written down to fair value. In 2010, the Fund had reviewed certain idledmachinery and equipment at its operations in China and concluded that impairment was indicated and likely and as a result an impairment charge $105 was recognized in 2010.
7. SENIOR CREDIT FACILITY
On March 25, 2010, the Fund entered into a three year Senior Credit Facility with Wells Fargo Capital Finance Corporation.Under the terms of the Senior Credit Facility, up to $35 million may be borrowed for operating requirements in Canadian andUS currency. Interest is charged at variable rates based on the Canadian and/or US prime rate and the Canadian B.A. and/orEuro dollar rate. The Senior Credit Facility matures on March 25, 2013.
The amount available under the Senior Credit Facility is limited to the amount of the calculated borrowing base less aminimum availability of $2,500. The borrowing base is calculated as 85% of eligible receivables, plus the lesser of (a) 85% of the net orderly liquidation value of inventory and (b) 65% of eligible inventory.

Tree Island Wire Income Fund : Q2 : 2011 : Notes to the Interim Condensed Consolidated Financial Statements 33
The Senior Credit Facility has financial tests and other covenants with which the Fund and its subsidiaries must comply.Quarterly, the Fund is required to meet a rolling 4 quarters defined fixed charge coverage ratio of 1:1 if the availability on theSenior Credit Facility falls below $7,500. As well, the Senior Credit Facility contains restrictive covenants that limit the discretionof the Fund’s management with respect to certain business matters. These covenants place restrictions on, among other things,the ability of TII and TIW to incur additional indebtedness, to create liens or other encumbrances, to pay dividends or makecertain other payments (Note 9), investments, loans and guarantees and to sell or otherwise dispose of assets and merge orconsolidate with another entity.
As at June 30, 2011 the Fund was in compliance with all of its financial covenants on the Senior Credit Facility.
The Fund had the following amounts outstanding on its revolving lines of credit:
June 30 December 31 January 12011 2010 2010
Senior Credit Facility (1) $ 7,437 $ - $ 3,730 Deferred financing costs (2) (484) (571) (884)
$ 6,953 $ (571) $ 2,846
(1) The portion of the Senior Credit Facility denominated in US dollars is $1,446 (Dec 31, 2010 - $nil; Jan 1, 2010 - $2,314).(2) Deferred financing costs are included in other non-current assest on the statement of financial position.
The Senior Credit Facility is collateralized by a first charge over the Fund’s assets including, first charge on the real and personalproperty of TII, TIW and TI International as well as guarantees, pledges and assignments between the Fund’s subsidiaries. All existing and after-acquired real and personal property of the Fund and its subsidiaries are pledged as collateral against theSenior Credit Facility.
8. CONVERTIBLE DEBENTURES
As part of the Recapitalization Transaction, on November 26, 2009, the Fund completed a private placement with certaininvestors to issue an aggregate of $9,750 principal amount of Convertible Debentures along with 4,875,000 warrants (see Note 12). In the first quarter of 2010, an additional $10,000 in Convertible Debentures were issued through a rightsoffering to unitholders. All Convertible Debentures have the same rights and terms governed by those described in the trustindenture regardless of when they were issued.
The Convertible Debentures mature on November 26, 2014 and are convertible into units at $0.50. The conversion price issubject to change based on certain events described in the trust indenture. The Convertible Debentures are subordinated debtuntil all outstanding commitments on the Senior Credit Facility have been fully settled. If a change of control event occurs, asdefined in the trust indenture, the Fund is required to offer to purchase the outstanding Convertible Debentures for 110% ofthe principal owing. The Fund has the option to redeem the Convertible Debentures at par after November 26, 2012 and up tothe day prior to maturity so long as the weighted average trading price per unit for the 30 consecutive days prior toredemption is not greater than 150% of the conversion price and no event of default has occurred.
The Convertible Debentures pay interest quarterly, 30 days in arrears, at a stated rate of 10%. Interest is payable in cash unlessthe Fund is restricted from doing so under certain circumstances (an “Interest Block Condition”). An Interest Block Conditioncan be triggered by certain events including the Fund being in default under its Senior Credit Facility or the aggregateborrowing availability under the Senior Credit Facility on the date interest is payable and for a period of 30 days prior is below$5,500. If the quarterly interest cannot be paid in cash then the interest payable, subject to regulatory approval, can be settledby issuing additional Convertible Debentures equal to the amount of the interest owed; or, defer payment of interest.Deferred interest will accrue additional interest at 10% per annum until paid in full.
The Convertible Debentures are classified as a liability, less fair values allocated to the conversion feature, to the change ofcontrol premium and to the warrants issued. As a result, the recorded liability for the Convertible Debentures is lower than itsface value which is characterized as the debt discount. Using the effective interest rate method and the 21.9% rate implicit inthe calculation, the debt discount, together with the stated interest and associated transaction costs, are amortized as interestexpense over the life of the Convertible Debentures.
The conversion feature, change of control option and warrants are classified as financial liabilities under IAS 32 and areaccounted for at fair value. Changes in fair value are recognized in the statement of operations at each period end. Fair valueis determined using an option pricing model with a volatility assumption of 42% and a risk free rate of 2.65%. The expectedvolatility reflects the assumption that the historical volatility is indicative of future trends, which may not be the actualoutcome.

34 Tree Island Wire Income Fund : Q2 : 2011 : Notes to the Interim Condensed Consolidated Financial Statements
The allocation of fair values of the Convertible Debentures at issuance is outlined in the table below:
Rights PrivateOffering Placement
January 29 November 262010 2009 Total
Face value of Convertible Debentures issued $ 10,000 $ 9,750 $ 19,750 Less allocation of fair value to:
Conversion feature (1) (2,739) (2,341) (5,080)Change of control premium (2) (162) (158) (320)Warrants (3) - (902) (902)
Carrying value of Convertible Debentures on issue 7,099 6,349 13,448 Financing costs allocated to debt component (767) (750) (1,517)
Net debt component of Convertible Debentures on issue 6,332 5,599 11,931
(1) The transaction costs associated with the conversion feature were $297 and charged to financing costs in 2010.(2) Change of control premium has been recorded as a liability within other convertible instruments.(3) No warrants were issued on the Rights Offering.
The carrying value of the Convertible Debentures at period end is:
June 30 December 31 January 31
Convertible Debentures 2011 2010 2010
Opening carrying value $ 13,108 $ 5,716 $ –Net debt component issued in the period - 6,332 5,599Accretion of debt discount for the period 1,530 2,769 117Payment of interest in cash (967) (1,478) –Conversion of debentures to Fund units (1) - (231) –
Carrying value at period end $ 13,671 $ 13,108 $ 5,716
(1) During the year ended December 31, 2010, $365 principal value of Convertible Debentures were converted to 730,400 unitsresulting in an increase to Unitholder's Capital of $326 (net of the proprotion of issuance costs of $39) offset by charges of $231from Convertible Debentures and $6 from Change of Control.
The fair values and change for the other elements are:
Conversion Change ofFair Value Feature Warrants Control Option Total
January 1, 2010 $ 3,055 $ 991 $ 158 $ 4,204 Addition on Rights Offering 2,739 - 162 2,901 Change in fair value (3,743) (709) - (4,452)December 31, 2010 2,051 282 320 2,653 Change in fair value (772) (115) - (887)
June 30, 2011 $ 1,279 $ 167 $ 320 $ 1,766

Tree Island Wire Income Fund : Q2 : 2011 : Notes to the Interim Condensed Consolidated Financial Statements 35
9. LONG TERM DEBT
Year of June 30 December 31 January 31Maturity (1) 2011 2010 2010
Forbearance Agreements - beginning of period 2014 $ 27,538 $ 25,324 $ 25,143Renegotiation of debt 3,234 - –Payments (1,157) (2,483) (209)Foreign exchange revaluation (1,185) (1,300) (82)Accretion of debt discount 2,415 5,997 472
Forbearance Agreements - end of period 30,845 27,538 25,324Other long-term debt 2011 254 535 1,141
31,099 28,073 26,465Less current portion (1) (3,713) (5,271) (3,030)
$ 27,386 $ 22,802 $ 23,435
(1) The Forbearance Agreements were amended on January 31, 2011 to extend the repayment term by one year so that they now mature in 2014. The current portion as at December 31, 2010 is based on the previous terms of the agreements.
In 2009 as part of the Recapitalization Transaction, the Fund entered into five Forbearance Agreements with two significanttrade creditors. Subsequently, on January 31, 2011, the Fund and the holders of the Forbearance Agreements agreed to amendthe agreements by extending the schedule of repayment of principal by an additional year so that the term of the agreementsnow ends on December 31, 2014. The other terms and conditions within the original Forbearance Agreements remain in place.The comparison of the amended schedule of principal repayments to the original principal payment schedule is as follows:
Amended Original
2011 $ 2,387 $ 4,774 2012 4,774 15,494 2013 13,099 15,522 2014 15,530 -
$ 35,790 $ 35,790
For accounting purposes, it was determined that the January 31, 2011 amendment resulted in an exchange of debtinstruments with substantially different terms. As a result, in the period ended March 31, 2011 the Forbearance Agreementswere accounted for as an extinguishment of the original financial liabilities and the recognition of new financial liabilities attheir present value resulting in a loss on renegotiation of debt of $3,234. Present value was determined using discounted cash flows and credit adjusted discount rate of 13%. The discount rate, together with the stated interest, comprises the debtdiscount. Using the effective interest rate method, the debt discount is amortized as accretion and charged to interest expenseover the term of the Forbearance Agreements.
Interest accrues at a rate of 7% per annum compounded annually beginning November 2010 and is payable at maturity. On event of default and acceleration of payment under the Convertible Debentures, the holders of the ForbearanceAgreements are entitled to $3 million of any net proceeds that are received by the Trustee of the Convertible Debentures.
Approximately $33.3 million of the principal under the Forbearance Agreements is denominated in US dollars.
The Forbearance Agreements include a provision for early payment of a portion of the principal outstanding if certainconditions are met. The provisions would not become effective until year-end 2011 and if the conditions are met, payable thefollowing year. At this point, management cannot reasonably estimate the probability of the provisions for early paymentoccurring and as a result it has not been factored in to the present value calculations.

36 Tree Island Wire Income Fund : Q2 : 2011 : Notes to the Interim Condensed Consolidated Financial Statements
10. FINANCING EXPENSES
Three months ended June 30 Six months ended June 30
2011 2010 2011 2010
Non-cash accretion of debt discount and interest on long term debt and Convertible Debentures $ 1,297 $ 1,786 $ 2,623 $ 3,723 Cash interest on Convertible Debentures 478 411 967 507 Interest on Senior Credit Facility 123 127 213 352 Other interest and financing costs 81 66 180 163 Financing transaction costs and
amortization of deferred financing costs 61 62 123 1,541
$ 2,040 $ 2,452 $ 4,106 $ 6,286
11. PHANTOM UNITS
The Fund has a long-term incentive plan that grants Phantom Units to certain executives and management personnel. The Phantom Units are accounted for at fair value and is measured at each reporting date using an option pricing modeltaking into account the terms and conditions that the Phantom Units were granted.
The change in fair value related to Phantom Units for three and six months ended June 30, 2011 were $11 and $15 (2010 - $332 and $335). The expense is included in selling, general and administrative expense. A summary of the Fund’sPhantom Units changes during the periods ended is as follows:
Three months ended June 30 Six months ended June 30
2011 2010 2011 2010
Vested Unvested Vested Unvested Vested Unvested Vested Unvested
Balance, beginning of period 70,032 37,500 37,106 95,832 63,999 54,081 42,787 95,832 Vested 4,167 (4,167) - - 20,748 (20,748) - - Forfeited - (33,333) - - - (33,333) - -
Converted (28,695) - (12,691) - (39,243) - (18,372) -
Balance, end of period 45,504 - 24,415 95,832 45,504 - 24,415 95,832
12. UNITHOLDER’S CAPITAL
Fund Units
An unlimited number of Fund units may be issued by the Fund pursuant to the Fund’s Declaration of Trust. Each unit istransferable and represents an equal, undivided beneficial interest in any distributions from the Fund and in the net assets ofthe Fund. All units are of the same class with equal rights and privileges and are not subject to future calls or assessments. Eachunit entitles the holder to one vote at all meetings of unitholders. Fund units are redeemable at any time at the option of theholder at a price based on market value as defined in the trust agreement, subject to a maximum of $50,000 in cashredemption by the Fund in any one month. The limitations may be waived at the discretion of the Trustees of the Fund.Redemption in excess of these amounts, assuming no waiver of the limitation, shall be paid by way of pro-rata distribution ofTII securities held by the Fund. Based on IAS 32, the units meet the conditions set out in paragraphs 16A and 16B for equityclassification. However, other instruments that are convertible into Fund units do not qualify for this exemption and arediscussed in Note 8.

Tree Island Wire Income Fund : Q2 : 2011 : Notes to the Interim Condensed Consolidated Financial Statements 37
During the period, the Fund had the following Unit transactions:
Issuance Units Gross Costs Net
Unitholders' capital - December 31, 2010 22,861,661 $ 222,860 $ 11,400 $ 211,460
Conversion of Phantom Units 39,243 16 - 16
Unitholders' capital - June 30, 2011 22,900,904 $ 222,876 $ 11,400 $ 211,476
Issuance Units Gross Costs Net
Unitholders' capital - January 1, 2010 22,112,489 $ 222,525 $ 11,400 $ 211,125
Conversion of Convertible Debentures 730,800 $ 326 $ - 326 Conversion of Phantom Units 18,372 9 - 9
Unitholders' capital - June 30, 2010 22,861,661 $ 222,860 $ 11,400 $ 211,460
Warrants
As part of the Recapitalization Transaction, the Fund issued 4,875,000 warrants, with an expiry of November 26, 2014, tocertain investors. The warrants have an exercise price of $0.57 and expire November 26, 2014. No warrants have been exercised since issuance. As discussed in Note 8, the warrants are measured at fair value at each period end.
13. RELATED PARTY TRANSACTIONS
Transactions with associated companies
One of the investors in the Recapitalization Transaction, The Futura Corporation (“Futura”), is considered to be a related partyto the Fund because of their ownership interest and holding two positions on the Board of Trustees. Futura has purchased$5,000 of Convertible Debentures and was issued 1,875,000 warrants as part of the Recapitalization Transaction. During thethree and six month periods ended June 30, 2011, Futura received interest settled in cash of $125 and $248 (2010 - $92 and$129) on the Convertible Debentures at the stated rate of interest.
As well, the Fund sells products to subsidiaries of a company controlled by Futura, Canwel Building Materials Group Ltd.(“Canwel”), which amounted to, net of rebates, $1,135 and $2,942 (2010 - $1,152 and $3,472) during the three and six monthperiods ended June 30, 2011 and trade accounts receivable owing from Canwel is $479 (2010 - $nil) as at June 30, 2011. Thesetransactions are in the normal course and are recorded at terms equivalent to an arm’s length transaction. Outstanding tradeaccounts receivable from Canwel at period end are unsecured, interest free and settlement occurs in cash.
Transactions with key management personnel
Included in the definition of key management for purposes of disclosure of related party transactions are members of Board of the Fund and officers of Tree Island. Short term employee benefits for key management personnel for the three and sixmonth periods ended March 31, 2011 were $535 and $878 (2010 - $398 and $932) which includes wages, salaries, unit-basedcompensation and social security contributions, paid annual and sick leave, vehicle costs and bonuses. It also includes Trusteesfees for members of the Board.
Post Retirement Benefits
The Fund has three defined contribution pension plans for the benefit of all eligible personnel employed by the Fund’ssubsidiaries. Contributions made by the Fund’s subsidiaries amounted to $293 and $566 for the three and six month periodsended June 30, 2011 (2010 - $281 and $605). Funding obligations are satisfied upon making contributions.
14. INCOME TAXES
Income tax obligations relating to distributions from the Fund are the obligations of the unitholders. A provision for incometaxes is recognized for TII and its wholly-owned subsidiaries, as TII and its wholly-owned subsidiaries are subject to tax.

38 Tree Island Wire Income Fund : Q2 : 2011 : Notes to the Interim Condensed Consolidated Financial Statements
Deferred Tax Assets
The Fund has concluded that it is not probable that the benefits of recognized deferred income tax assets will be realized prior to their expiry and therefore, no deferred tax assets have been recognized on the consolidated balance sheets.
Income Tax (Expense) Recovery
The income tax (expense) recovery is divided between current and deferred taxes as follows:
Three months ended June 30 Six months ended June 30
2011 2010 2011 2010
Recorded in the income statement Current tax (expense) recovery $ (5) $ (44) $ (148) $ 1,085 Deferred tax (expense) recovery (628) (918) (45) 330
$ (633) $ (962) $ (193) $ 1,415
The expense or recovery of income taxes varies from the amount that would be expected if computed by applying theCanadian federal and provincial and US federal and state statutory income tax rates to the income before income taxes as shown in the following table:
Three months ended June 30 Six months ended June 30
2011 2010 2011 2010
Income (loss) before provision for income taxes $ 662 $ 772 $ (3,817) $ (4,142)Income of the Fund subject to tax in the hands of the recipient (1,419) (2,370) (124) (3,518)
Loss of wholly-owned subsidiary companies before income taxes (757) (1,598) (3,941) (7,660)Tax Rate 26.5% 28.5% 26.5% 28.5%
Expected recovery of income taxes $ 201 $ 455 $ 1,044 $ 2,183 Increased (Reduced) by:
Revisions of prior period estimates - - (123) 143 Items not taxable (8) (10) (15) (15)Non-taxable foreign exchange gain included in other comprehensive income (loss) 118 (775) 476 (519)Differential tax rates on U.S. and Chinese subsidiaries 123 141 183 474 Reduction (increase) in statutory future income tax rate 43 (89) (11) (17)Future income tax valuation allowance (304) 451 (1,407) (952)Other (806) (1,135) (340) 118
Income tax (expense) recovery $ (633) $ (962) $ (193) $ 1,415
Taxation of the Trust
In 2006 the Canadian federal government announced proposed legislation to tax distributions made by income trusts. This legislation has received royal assent and as a result income trusts will be subject to tax at corporate rates on the taxableportion of their distributions and unitholders will be taxed as if they have received a dividend equal to the taxable portion of their distributions beginning in 2011.
In 2009, rules were enacted to facilitate the conversion of trusts, such as the Fund, into corporations without undue income taxconsequences (generally effective for conversions that occur after July 13, 2008 and before 2013). The Fund will be evaluatingthe merits and costs of conversion into a corporation to take advantage of the transitional rules.

Tree Island Wire Income Fund : Q2 : 2011 : Notes to the Interim Condensed Consolidated Financial Statements 39
15. FINANCIAL INSTRUMENTS
Fair Value of Financial Instruments
The Fund records certain of its financial instruments at fair value using various techniques. These include estimates of fairvalues based on prevailing market rates (bid and ask prices, as appropriate) for instruments with similar characteristics and risk profiles or internal or external valuation models, such as discounted cash flow analysis, using, to the extent possible,observable market-based inputs.
The financial instruments have been categorized on a fair value hierarchy based on whether the inputs to those valuationtechniques are observable (inputs reflect market data obtained from independent sources) or unobservable (inputs reflect the Fund’s market assumptions).
The three levels of fair value estimation are:
Level 1 – quoted prices in active markets for identical instruments.
Level 2 – quoted prices for similar instruments in active markets; quoted prices for identical or similar instruments in markets that are not active; and model-derived valuations in which all significant inputs and significant and significant value drivers are observable in active markets.
Level 3 – valuations derived from valuation techniques in which one or more significant inputs or significant value drivers are unobservable.
The following tables summarize the bases used to measure certain financial liabilities at fair value through profit and loss. The Fund does not have any financial assets valued at fair value through profit and loss. Financial liabilities carried at fair valuehave been classified into three levels based upon a fair value hierarchy that reflects the significance of the inputs used inmaking the measurements.
June 30, 2011 December 31, 2010 January 1, 2010
Fair Value Carrying Carrying CarryingCategory Classification(3) Fair Value Value Fair Value Value Fair Value Value
Financial Liabilities:Change of control premium Level 3 HFT $ 320 $ 320 $ 320 $ 320 $ 158 $ 158 Long-term debt (1) Level 2 OFL 30,927 31,099 30,360 28,073 26,465 26,465 Convertible Debentures (2) Level 3 OFL 17,619 13,671 18,415 13,108 5,716 5,716 Conversion feature Level 3 HFT 1,279 1,279 2,051 2,051 3,055 3,055
Warrants Level 3 HFT 167 167 282 282 991 991
Total Financial Liabilities $ 50,312 $ 46,536 $ 51,428 $ 43,834 $ 36,385 $ 36,385
(1) Fair value on the Company's long-term debt is based on estimated market interest rate on similar borrowings. A 1% change in themarket interest rate would change the fair value by $757.
(2) Convertible Debentures began trading on the TSX in the first quarter of 2010 and the fair value disclosed is based on the closing price at period end less the fair values of the conversion feature, warrants and change of control premium.
(3) Held for Trading ("HFT"), Other Financial Liabilities ("OFL").
Risk exposure and Management
The Fund is exposed to various risks associated with its financial instruments. These risks are categorized as credit risk, liquidity risk and market risk.
Credit Risk
The Fund is exposed to credit losses in the event of non-payment of accounts receivable of its subsidiaries’ customer accounts.However the credit risk is minimized through selling to well-established customers of high-credit quality. The credit worthinessof customers is assessed using credit scores supplied by a third party and through direct monitoring of their financial well-being on a continual basis. The Fund establishes guidelines for customer credit limits and should thresholds in these areas bereached, appropriate precautions are taken to improve collectability. The Fund maintains provisions for potential credit losses(allowance for doubtful accounts) and any such losses to date have been within management’s expectations (see note 4).
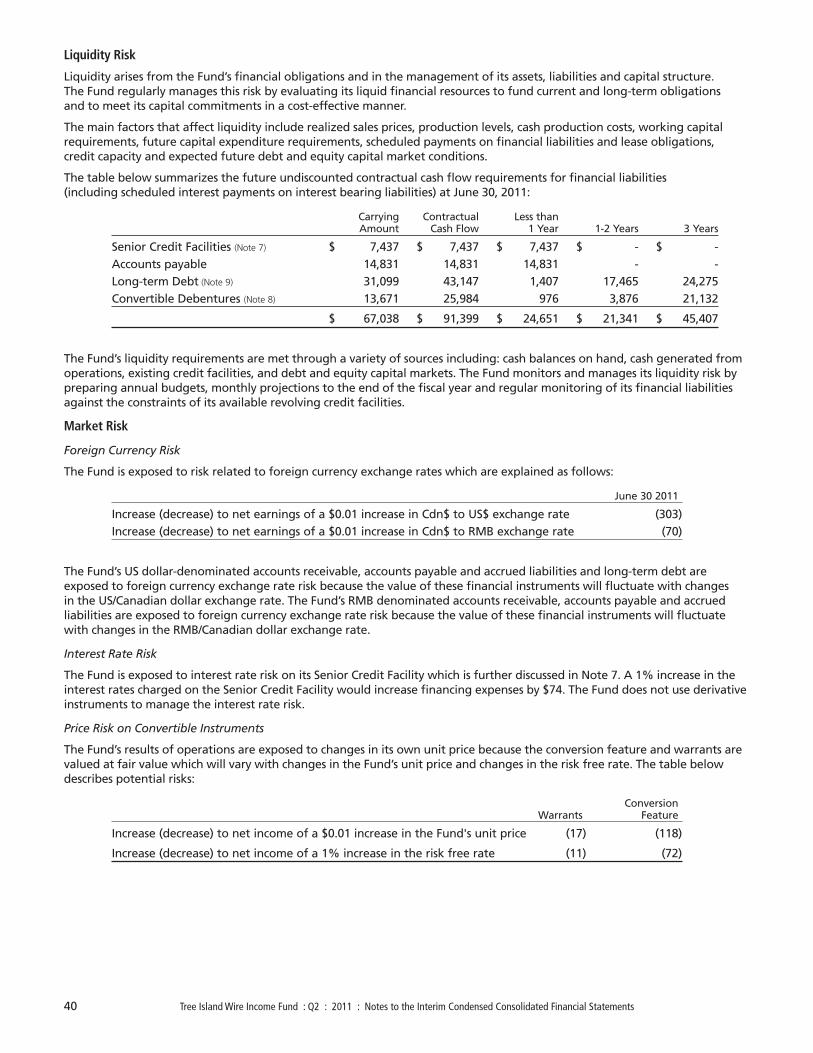
40 Tree Island Wire Income Fund : Q2 : 2011 : Notes to the Interim Condensed Consolidated Financial Statements
Liquidity Risk
Liquidity arises from the Fund’s financial obligations and in the management of its assets, liabilities and capital structure. The Fund regularly manages this risk by evaluating its liquid financial resources to fund current and long-term obligations and to meet its capital commitments in a cost-effective manner.
The main factors that affect liquidity include realized sales prices, production levels, cash production costs, working capitalrequirements, future capital expenditure requirements, scheduled payments on financial liabilities and lease obligations, credit capacity and expected future debt and equity capital market conditions.
The table below summarizes the future undiscounted contractual cash flow requirements for financial liabilities (including scheduled interest payments on interest bearing liabilities) at June 30, 2011:
Carrying Contractual Less than Amount Cash Flow 1 Year 1-2 Years 3 Years
Senior Credit Facilities (Note 7) $ 7,437 $ 7,437 $ 7,437 $ - $ - Accounts payable 14,831 14,831 14,831 - - Long-term Debt (Note 9) 31,099 43,147 1,407 17,465 24,275 Convertible Debentures (Note 8) 13,671 25,984 976 3,876 21,132
$ 67,038 $ 91,399 $ 24,651 $ 21,341 $ 45,407
The Fund’s liquidity requirements are met through a variety of sources including: cash balances on hand, cash generated fromoperations, existing credit facilities, and debt and equity capital markets. The Fund monitors and manages its liquidity risk bypreparing annual budgets, monthly projections to the end of the fiscal year and regular monitoring of its financial liabilitiesagainst the constraints of its available revolving credit facilities.
Market Risk
Foreign Currency Risk
The Fund is exposed to risk related to foreign currency exchange rates which are explained as follows:
June 30 2011
Increase (decrease) to net earnings of a $0.01 increase in Cdn$ to US$ exchange rate (303)Increase (decrease) to net earnings of a $0.01 increase in Cdn$ to RMB exchange rate (70)
The Fund’s US dollar-denominated accounts receivable, accounts payable and accrued liabilities and long-term debt areexposed to foreign currency exchange rate risk because the value of these financial instruments will fluctuate with changes in the US/Canadian dollar exchange rate. The Fund’s RMB denominated accounts receivable, accounts payable and accruedliabilities are exposed to foreign currency exchange rate risk because the value of these financial instruments will fluctuatewith changes in the RMB/Canadian dollar exchange rate.
Interest Rate Risk
The Fund is exposed to interest rate risk on its Senior Credit Facility which is further discussed in Note 7. A 1% increase in theinterest rates charged on the Senior Credit Facility would increase financing expenses by $74. The Fund does not use derivativeinstruments to manage the interest rate risk.
Price Risk on Convertible Instruments
The Fund’s results of operations are exposed to changes in its own unit price because the conversion feature and warrants arevalued at fair value which will vary with changes in the Fund’s unit price and changes in the risk free rate. The table belowdescribes potential risks:
ConversionWarrants Feature
Increase (decrease) to net income of a $0.01 increase in the Fund's unit price (17) (118)
Increase (decrease) to net income of a 1% increase in the risk free rate (11) (72)

Tree Island Wire Income Fund : Q2 : 2011 : Notes to the Interim Condensed Consolidated Financial Statements 41
16. WEIGHTED AVERAGE UNITS OUTSTANDING
Three months ended June 30 Six months ended June 30
2011 2010 2011 2010
Weighted average number of units outstanding during the period - basic 22,878,200 22,473,271 22,871,096 22,417,977
Dilutive effect of:Convertible Debentures (1) - - - - Phantom units (1) - - - - Warrants (1) - - - -
Weighted average number of units outstanding during the period - diluted 22,878,200 22,473,271 22,871,096 22,417,977
(1) As there was a loss for the three and six month periods ended June 30, 2011 and 2010, the Fund has excluded all ConvertibleDebentures, phantom units, and warrants from the calculation of diluted loss per share because they would be anti-dilutive.
17. PROVISIONS AND COMMITMENTS
Litigation and Claims
The Fund is party to certain legal actions and claims, none of which individually, or in the aggregate, is expected to have amaterial adverse effect on the Fund’s financial position, results of operations or cash flows.
Environmental Remediation on Sale of Surplus Land
On July 2, 2009 the Fund completed the sale of 12.5 acres of surplus lands at its Richmond, BC manufacturing facility for grossproceeds of $10,500. The agreement contains a condition whereby $1,500 will be held in trust and will be released uponproviding to the purchaser a Certificate of Compliance for the environmental remediation. The Fund has the option ofrequesting to drawdown the holdback as approved by the purchaser, prior to the issuance of the Certificate of Compliance toa maximum of $500. The environmental remediation was required to be completed within one year from the closing of thesale. If the Fund did not deliver the Certificate of Compliance within one year from the closing of the sale, the purchaser coulduse the holdback to obtain a Certificate of Compliance. As of the date of these financial statements, the purchaser has notelected to complete the remediation.
The Fund has completed the remediation work based on the planned requirements and has submitted the results for approvaland issuance of Certificate of Completion. The Fund has incurred $1,000 up to June 30, 2011 of which $500 was drawn downfrom the holdback as permitted under the agreement and the remainder was paid through the Fund’s operating cash flows.The costs incurred are deferred and included in prepaid expenses.
The Fund is expecting to obtain the Certificate of Compliance in 2011 and still expects that the $1,500 holdback will besufficient to complete the remediation activities. At the time of the sale of the surplus land, the Fund recognized a gainexcluding the $1,500 holdback. Upon completion of the environmental remediation and issuance of a Certificate ofCompliance the accounting for the disposal will be finalized and a gain or loss will be recognized for the difference betweenthe $1,500 holdback and the total costs incurred of the environmental remediation.

Restructuring
Between January 2009 and throughout 2010 the Fund implemented a restructuring plan including restrictions on salariesacross the company, lay-offs of salaried and hourly staff and the closure of certain US manufacturing facilities. The costs and expenditures for the restructuring activities are summarized below:
June 30 December 31 January 12011 2010 2010
Restructuring provision, opening balance $ 53 $ 1,658 $ - Expenses
Employee termination benefits (1) - 115 1,658Foreign exchange effect - (13) - Paid (53) (1,707) -
Restructuring provision, ending balance $ - $ 53 $ 1,658
(1) Charged to selling, general and administration costs.
Closure of Facilities
As part of prior restructuring activities, the Fund has closed two of its operating facilities, Corona and Ontario’s warehousefacility, both in California, USA and relocated the operations to other existing plants in the vicinity. Both facilities were closedprior to the expiry of their non-cancellable leases. The Fund continues to have an unavoidable legal obligation to pay the leasepayments until the end of the term. The Fund has offset the costs of these leases with sub-lease contracts where possible;however, the sub-lease revenue is not sufficient to offset the contractual lease obligations.
The full amount of the costs associated with these non-cancellable lease obligations are accrued as a provision for onerouscontracts and a charge has been recorded to cost of goods sold in the period the facility was vacated. Because the remainingterm exceeded one year, the liabilities have been recorded at the discounted future cash flows using a discount rate of 13%and are being amortized with a charge to financing expense over the remaining term using the effective interest method.
Below is a table summarizing the provisions:
OntarioWarehousing
Corona Facility Total
Balance at January 1, 2010 $ 1,154 $ 31 $ 1,186 Provisions made during the period 257 174 432 Provisions used during the period (238) (28) (266)Foreign exchange effect (57) (7) (64)Adjustments during the period - - -
Balance at December 31, 2010 $ 1,117 $ 171 $ 1,288 Provisions made during the period 123 14 137 Provisions used during the period (117) (58) (175)Foreign exchange effect (35) (5) (40)Adjustments during the period - - -
Balance at June 30, 2011 $ 1,088 $ 122 $ 1,210
Purchase Commitments
The Fund’s wholly-owned subsidiaries have committed to rod purchases totaling $21,482 (US$22,278) at June 30, 2011 and imported finished goods purchases of $1,930 (US$2,002).
Operating Lease Commitments
The Fund and its subsidiaries also have various operating lease agreements with remaining terms of up to five years withvarying renewal options. Annual lease rental payments due under non-cancelable operating leases, including payments for US facilities which have been accrued as discussed above, are as follows:
Less than 1 year $ 1,258 1 to 5 years 4,637 More than 5 years -
$ 5,895
42 Tree Island Wire Income Fund : Q2 : 2011 : Notes to the Interim Condensed Consolidated Financial Statements

Tree Island Wire Income Fund : Q2 : 2011 : Notes to the Interim Condensed Consolidated Financial Statements 43
18. SEGMENTED INFORMATION
General Information
The Fund operates primarily within one industry, the steel wire and fabricated wire products industry with no separatelyreportable business segments. The Fund groups its products into the following: residential construction, commercialconstruction, industrial/OEM, agricultural, and specialty. No one customer is more than 10% of total revenue earned by the Fund. The products are sold primarily to customers in the United States, Canada and China.
Geographic Information
Three months ended June 30 Six months ended June 30
2011 2010 2011 2010
SALES (1)
Canada $ 14,476 $ 15,163 $ 31,948 $ 29,219 United States 21,981 21,947 42,463 39,872 China 534 570 703 1,642 Other 1,009 1,062 1,830 2,541
$ 38,000 $ 38,742 $ 76,944 $ 73,274
June 30 December 31 January 12011 2010 2010
PROPERTY, PLANT AND EQUIPMENT (2)
Canada $ 27,621 $ 28,696 $ 33,609 United States 8,260 8,895 9,943 China 132 161 315
$ 36,013 $ 37,752 $ 43,867
(1) Sales are attributed to geographic areas based on the location of customers.(2) Property, plant and equipment are attributed to geographic areas based on the location of the
subsidiary company owning the assets.
19. CHANGE IN NON-CASH OPERATING ASSETS AND LIABILITES
Three months ended June 30 Six months ended June 30
2011 2010 2011 2010
Accounts receiveable (Note4) $ 2,248 $ 311 $ (5,934) $ (6,435)Inventories (Note 6) (3,542) (2,320) (6,646) (8,752)Accoutns payable and accrued liabilities (4,228) (1,986) 1,869 2,498Income and other taxes 5 (12) 148 (1,141)Other (320) 491 226 795
$ (5,748) $ (3,516) $ (10,338) $ (13,034)
20. TRANSITION TO IFRS
The Fund’s consolidated financial statements were previously prepared in accordance with Canadian GAAP. The adoption ofIFRS has not changed the actual cash flows of the Fund and there have been no significant changes to the categories withinthe statement of cash flows. The Fund’s consolidated financial statements for the year ending December 31, 2011 will be thefirst annual financial statements prepared in accordance with IFRS and these condensed consolidated interim financialstatements were prepared as described in Note 2, including the application of IFRS 1. IFRS 1 requires an entity to adopt IFRS in its first annual financial statements prepared under IFRS by making an explicit and unreserved statement in those financialstatements of compliance with IFRS. The Fund will make this statement when it issues its 2011 annual financial statements. IFRS1 also requires that comparative financial information be provided. As a result, the first date at which the Fund has appliedIFRS was January 1, 2010 (the “Transition Date”). IFRS 1 requires first-time adopters to retrospectively apply all effective IFRSstandards as of the reporting date, which for the Fund will be December 31, 2011. However, it also provides for certainoptional exemptions and certain mandatory exceptions for first-time IFRS adopters which are discussed below.

44 Tree Island Wire Income Fund : Q2 : 2011 : Notes to the Interim Condensed Consolidated Financial Statements
Initial Elections upon Adoption
IFRS 1 provides entities adopting IFRS for the first time a number of optional exemptions and mandatory exceptions to thegeneral requirement for full retrospective application of IFRS. The Fund analyzed the various accounting policy optionsavailable and has implemented those that it determined to be the most appropriate for its specific circumstances. The IFRS 1exemptions most relevant to the Fund are as follows:
BUSINESS COMBINATIONS: An optional exemption is available within IFRS 1 that allows carry forward of the previousaccounting for business combinations prior to the transition date or alternatively to retrospectively adjust a prior businesscombination to comply with IFRS. The Fund has elected not to retrospectively apply IFRS 3 to past business combinations.
FAIR VALUE OR REVALUATION AS DEEMED COST: This exemption allows an entity to revalue individual items of property,plant and equipment at fair value at the transition date and use this fair value as the deemed transition cost. The Fund electedvalue a majority of items of machinery and equipment on transition at fair value which then becomes the deemed cost onwhich to amortize/depreciate in future periods. Land, building and improvements will continue to be valued at cost lessaccumulated amortization determined under prior Canadian GAAP as permitted under IFRS net of any adjustments required at transition to comply with IFRS.
CUMULATIVE TRANSLATION DIFFERENCE: This exemption allows cumulative translation gains and losses to be deemed zero at transition. The Fund has applied this exemption.
BORROWING COSTS: This exemption allows an entity to adopt IAS 23 prospectively for property, plant and equipmentconstruction projects for which the capitalization commencement date is after its transition date. The Fund has applied thisexemption and has not restated any borrowing costs that were capitalized prior to January 1, 2010.
SHARE BASED PAYMENTS: For Phantom Units, which are accounted for as cash-settled share-based payment transactionsunder IFRS, the Fund has not applied IFRS 2 to Phantom Units that were converted prior to January 1, 2010.
ESTIMATES: IFRS 1 stipulates a mandatory exemption from full retrospective application of IFRS as it relates to the use ofestimates. It requires that estimates at the date of transition to IFRS must be consistent with estimates made for the same datein accordance with previous Canadian GAAP (after adjustments to reflect any difference in accounting policies), unless there isobjective evidence that those estimates were in error. The Fund did not use hindsight in its estimates upon transition to IFRS,nor did it find any evidence that any of its previously made estimates were in error.
Reconciliations of Canadian GAAP to IFRS
While the adoption of IFRS has not changed the actual cash flows of the Fund, the adoption has resulting significant changesto the reported financial position and results of operations of the Fund. Presented below are reconciliations prepared toreconcile the financial position, unitholder’s equity, statement of operations and comprehensive income (loss) for prior periods.Certain amounts have been reclassified in the Canadian GAAP balances to conform with current presentation.

Tree Island Wire Income Fund : Q2 : 2011 : Notes to the Interim Condensed Consolidated Financial Statements 45
I. Reconciliation of the consolidated statement of position as at January 1, 2010:
Canadian Effect of As at January 1, 2010 Note GAAP transition to IFRS IFRS
AssetsCurrent
Cash $ 4,153 $ - $ 4,153 Accounts receivable 9,064 - 9,064 Income and other taxes receivable 6,121 - 6,121 Inventories 33,626 - 33,626 Prepaid expenses 3,113 - 3,113
$ 56,077 $ - $ 56,077 Property, plant and equipment (a) 43,047 820 43,867 Other non-current assets 1,453 - 1,453
$ 100,577 $ 820 $ 101,397
LiabilitiesCurrent
Senior Credit Facility $ 3,730 $ - $ 3,730 Accounts payable and accrued liabilities (b) 18,351 170 18,521 Income taxes payable 2,342 - 2,342 Other current liabilities (c) 41 35 76 Fair value of convertible instruments (c) 158 4,046 4,204 Current portion of long-term debt 3,030 - 3,030
$ 27,652 $ 4,251 $ 31,903 Convertible Debentures 5,716 - 5,716 Long-term debt (d) 23,063 372 23,435 Deferred gain on sale of option (e) 3,337 (3,337) - Other non-current liabilities 203 - 203 Deferred income taxes (f) 1,254 837 2,091
$ 61,225 $ 2,123 $ 63,348
Unitholders' Equity 39,352 (1,303) 38,049 $ 100,577 $ 820 $ 101,397

46 TTree Island Wire Income Fund : Q2 : 2011 : Notes to the Interim Condensed Consolidated Financial Statements
II. Reconciliation of consolidated statement of financial position as at June 30, 2010:Canadian Effect of
As at June 30, 2010 Note GAAP transition to IFRS IFRS
AssetsCurrent
Cash (h) $ 3,721 $ (17) $ 3,704 Accounts receivable (h) 15,447 110 15,557 Income and other taxes receivable 6,258 - 6,258 Inventories (h) 42,379 (1) 42,378 Prepaid expenses (h) 2,509 5 2,514 Deferred income taxes (f) - - -
$ 70,314 $ 97 $ 70,411 Property, plant and equipment (a), (h) 40,352 885 41,237 Other non-current assets 317 - 317
$ 110,983 $ 982 $ 111,965
LiabilitiesCurrent
Senior Credit Facility $ 7,095 $ 716 $ 7,095 Accounts payable and accrued liabilities (b), (h) 20,402 530 21,118 Income taxes payable (h) 311 1,424 1,735 Other current liabilities (c) 70 26 96 Fair value of convertible instruments (c) 320 2,940 3,260 Current portion of long-term debt 4,348 - 4,348
$ 32,546 $ 5,106 $ 37,652 Convertible Debentures 12,611 - 12,611 Long-term debt (d) 23,500 372 23,872 Deferred gain on sale of option (e) 3,135 (3,135) - Other non-current liabilities 294 5 299 Deferred income taxes (f) 2,343 (1,424) 919
$ 74,429 $ 924 $ 75,353
Unitholders' Equity 36,554 58 36,612 $ 110,983 $ 982 $ 111,965

Tree Island Wire Income Fund : Q2 : 2011 : Notes to the Interim Condensed Consolidated Financial Statements 47
III. Reconciliation of consolidated statement of financial position as at December 31, 2010:Canadian Effect of
As at December31, 2010 Note GAAP transition to IFRS IFRS
AssetsCurrent
Cash (h) 5,623 11 5,634 Accounts receivable (h) 9,695 3 9,698 Income and other taxes receivable 56 - 56 Inventories (h) 30,873 5 30,878 Prepaid expenses (h) 2,863 (2) 2,861
49,110 17 49,127 Property, plant and equipment (a), (h) 37,141 611 37,752 Other non-current assets 571 - 571
86,822 628 87,450
LiabilitiesCurrent
Senior Credit Facilty - - - Accounts payable and accrued liabilities (b), (h) 13,243 86 13,329 Income taxes payable 1,662 479 2,141 Other current liabilities (c) 68 33 101 Fair value of convertible instruments (c) - 2,653 2,653 Current portion of long-term debt (g) 2,884 2,387 5,271
17,857 5,638 23,495 Convertible Debentures 13,108 - 13,108 Long-term debt (g) 24,815 (2,013) 22,802 Deferred gain on sale of option (e) 2,710 (2,710) - Other non-current liabilities 667 (256) 411 Deferred income taxes (f) - 779 779
59,157 1,438 60,595
Unitholders' Equity 27,665 (810) 26,855 86,822 628 87,450

48 Tree Island Wire Income Fund : Q2 : 2011 : Notes to the Interim Condensed Consolidated Financial Statements
IV. Reconciliation of consolidated statement of operations for the three months ended June 30, 2010:
Canadian Effect of Three months ended June 30, 2010 Note GAAP transition to IFRS IFRS
Sales $ 38,742 $ - $ 38,742 Cost of goods sold (b) 33,449 40 33,489 Depreciation (a) 1,407 7 1,414 Gross profit $ 3,886 $ (47) $ 3,839 Selling, general and administrative expenses (a) 3,129 (158) 2,971 Operating income $ 757 $ 111 $ 868 Foreign exchange loss (h) (702) (56) (758)Amortization of deferred gain (e) 119 (119) - Changes in fair value of convertible instruments (c) - 3,114 3,114 Financing expenses (b), (c) (2,389) (63) (2,452)Income (loss) before income taxes $ (2,215) $ 2,987 $ 772 Income tax expense (f) (84) (878) (962)Net loss for the period $ (2,299) $ 2,109 $ (190)
Net loss per unitBasic $ (0.10) $ 0.09 $ (0.01)Diluted $ (0.10) $ 0.09 $ (0.01)
Weighted-average number of units (Note 16)
Basic 22,473,271 - 22,473,271 Diluted 22,473,271 - 22,473,271

Tree Island Wire Income Fund : Q2 : 2011 : Notes to the Interim Condensed Consolidated Financial Statements 49
V. Reconciliation of consolidated statement of operations for the six months ended June 30, 2010:Canadian Effect of
Six months ended June 30, 2010 Note GAAP transition to IFRS IFRS
Sales $ 73,274 $ - $ 73,274 Cost of goods sold (b) 64,105 92 64,197 Depreciation (a) 2,840 (6) 2,834 Gross profit $ 6,329 $ (86) $ 6,243 Selling, general and administrative expenses (a) 6,847 (313) 6,534 Operating loss $ (518) $ 227 $ (291)Foreign exchange loss (h) (1,298) (17) (1,315)Amortization of deferred gain (e) 240 (240) - Changes in fair value of convertible instruments (c) - 3,750 3,750 Financing expenses (b), (c) (5,863) (423) (6,286)Loss before income taxes $ (7,439) $ 3,297 $ (4,142)Income tax recovery (f) 1,061 354 1,415 Net loss for the period $ (6,378) $ 3,651 $ (2,727)
Net loss per unitBasic $ (0.28) $ 0.16 $ (0.12)Diluted $ (0.28) $ 0.16 $ (0.12)
Weighted-average number of units (Note 16)
Basic 22,417,977 - 22,417,977 Diluted 22,417,977 - 22,417,977

50 Tree Island Wire Income Fund : Q2 : 2011 : Notes to the Interim Condensed Consolidated Financial Statements
VI. Reconciliation of consolidated statement of operations for the year ended December 31, 2010:
Canadian Effect of Tweleve months ended December 31, 2010 Note GAAP transition to IFRS IFRS
Sales $ 132,411 $ - $ 132,411 Cost of goods sold (b) 120,409 78 120,487 Depreciation (a) 5,577 80 5,657 Gross profit $ 6,425 $ (158) $ 6,267 Selling, general and administrative expenses (a) 12,143 (269) 11,874 Operating loss $ (5,718) $ 111 $ (5,607)Foreign exchange loss (h) 124 33 157 Gain on sale of property, plant and equipment 66 - 66 Property, plant and equipment impairment (h) (105) (11) (116)Amortization of deferred gain (e) 477 (477) - Changes fair value of convertible instruments (c) - 4,362 4,362 Financing expenses (b), (c) (10,958) (307) (11,265)Loss before income taxes $ (16,114) $ 3,711 $ (12,403)Income tax recovery (f) 1,334 (141) 1,193 Net loss for the period $ (14,780) $ 3,570 $ (11,210)
Net loss per unitBasic $ (0.65) $ 0.16 $ (0.50)Diluted $ (0.65) $ 0.16 $ (0.50)
Weighted-average number of unitsBasic 22,641,642 - 22,641,642 Diluted 22,641,642 - 22,641,642
Tree Island Wire Income Fund : Q2 : 2011 : Notes to the Interim Condensed Consolidated Financial Statements 51
VII. Reconciliation of Unitholders’ Equity as at January 1, 2010
Accumulated Accumulated Other
Unitholders' Contributed Earnings Comprehensive Notes Capital Surplus (Deficit) Distributions Loss Total
Balance as at Janaury 1, 2010 Canadian GAAP $ 211,125 $ 3,342 $ 2,193 $ (159,248) $ (18,060) $ 39,352
IFRS Adjustments
Reverse compensation expense on phantom units (c) - - 429 - - 429
Reverse prior unit based compensation expense (c) - (3,342) - - - (3,342)
Adjust financing cost on conversion feature and warrants (c) - - (330) - - (330)
Adjust conversion feature and warrants to fair value (c) - - (803) - - (803)
Adjust phantom units to fair value (c) - - (35) - - (35)
Reclass of CTA into retained earnings IFRS 1 - - (18,060) - 18,060 -
Reverse balance of gain on sale leaseback (e) - - 3,337 - - 3,337
Adjustment due to revaluation of PPE to fair value (a) - - 820 - - 820
Adjustment to the Corona lease accrual (b) - - (170) - - (170)
Expense financing cost on forbearance (d) - - (372) - - (372)
Adjustment to deferred income taxes (f) - - (837) - - (837)
Balance as at January 1, 2010 211,125 - (13,828) (159,248) - 38,049

52 Tree Island Wire Income Fund : Q2 : 2011 : Notes to the Interim Condensed Consolidated Financial Statements
VIII. Reconciliation of Unitholders’ Equity as at June 30, 2010Accumulated
OtherUnitholders' Contributed Accumulated Comprehensive
Notes Capital Surplus Deficit Distributions Income (Loss) Total
Balance as at June 30, 2010 Canadian GAAP $ 211,564 $ 5,800 $ (3,508) $ (159,248) $ (18,054) $ 36,554
IFRS Adjustments
Reclass of CTA into retained earnings IFRS 1 - - (18,060) - 18,060 -
Reverse phantom unit compensation (c) - (647) 429 - - (218)
Adjust conversion of phantom units to market value (c) (104) 113 - - - 9
Reclass to liability conversion feature on debentures (c) - (5,355) - - - (5,355)
Expense cost of conversion of debentures (c) - 89 - - - 89
Change in functional currency for TI International (h) - - (20) - - (20)
Reverse compensation expense on phantom units (c) - - 218 - - 218
Expense financing cost on conversion feature and warrants (c) - - (626) - - (626)
Adjust for changes in fair value on conversion feature and warrants (c) - - 3,750 - - 3,750
Depreciation adjustment due to PPE revaluation (a) - - (6) - - (6)
Reversal of amortization gain on sale leaseback (e) - - 3,135 - - 3,135
Adjustment to CTA (h) - - - - 949 949
Adjustment to the Corona lease accrual (b) - - (273) - - (273)
Expense financing cost on forbearance (d) - - (372) - - (372)
Adjustment to current income taxes (f) - - 202 - - 202
Adjustment to deferred income taxes (f) - - (1,424) - - (1,424)
Balance as at June 30, 2010 $ 211,460 $ - $ (16,555) $ (159,248) $ 955 $ 36,612

Tree Island Wire Income Fund : Q2 : 2011 : Notes to the Interim Condensed Consolidated Financial Statements 53
IX. Reconciliation of Unitholders’ Equity as at December 31, 2010Accumulated
OtherUnitholders' Contributed Accumulated Comprehensive
Notes Capital Surplus Deficit Distributions Loss Total
Balance as at December 31, 2010 Canadian GAAP $ 211,564 $ 5,750 $ (12,587) $ (159,248) $ (17,814) $ 27,665
IFRS Adjustments
Reclass of CTA into retained earnings IFRS 1 - - (18,060) - 18,060 -
Reverse phantom unit compensation (c) - (533) 429 - - (104)
Adjust conversion of phantom units to market value (c) (104) 113 - - - 9
Reclass to liability conversion feature on debentures (c) - (5,355) - - - (5,355)
Expense cost of conversion of debentures (c) - 89 - - - 89
Reclass to liability rights equity element (c) - (64) - - - (64)
Change in functional currency for TI International (h) - - (17) - - (17)
Reverse compensation expense on phantom units (c) - - 97 - - 97
Expense financing cost on conversion feature and warrants (c) - - (626) - - (626)
Adjust for changes in fair value on conversion feature and warrants (c) - - 4,362 - - 4,362
Depreciation adjustment due to PPE revaluation (a) - - 80 - - 80
Reversal of amortization gain on sale leaseback (e) - - 2,860 - - 2,860
Adjustment to CTA (h) - - - - (565) (565)
Adjustment to the Corona lease accrual (b) - - 82 - - 82
Expense financing cost on forbearance (d) - - (372) - - (372)
Adjustment to current income taxes (f) - - (479) - - (479)
Adjustment to deferred income taxes (f) - - (807) - - (807)
Balance as at December 31, 2010 $ 211,460 $ - $ (25,038) $ (159,248) $ (319) $ 26,855

54 Tree Island Wire Income Fund : Q2 : 2011 : Notes to the Interim Condensed Consolidated Financial Statements
X. Reconciliation of consolidated comprehensive income (loss) for the three months ended June 30, 2010:Canadian Effect of
Three months ended June 30, 2010 Note GAAP transition to IFRS IFRS
Net loss for the period $ (1,622) $ 1,618 $ (4)Other comprehensive income (loss)
Unrealized gain (loss) on translating financialstatements of subsidiary operations (258) 1,286 1,028
Tax effect (f) (8) 8 - Other comprehensive income (loss) (266) 1,294 1,028
Comprehensive income (loss) for the period $ (1,888) $ 2,912 $ 1,024
XI. Reconciliation of consolidated comprehensive loss for the six months ended June 30, 2010:Canadian Effect of
Six months ended June 30, 2010 Note GAAP transition to IFRS IFRS
Net loss for the period $ (5,701) $ 3,160 $ (2,541)Other comprehensive income
Unrealized loss on translating financialstatements of subsidiary operations (103) 1,058 955
Tax effect (f) 109 (109) - Other comprehensive income (loss) 6 949 955
Comprehensive income (loss) for the period $ (5,695) $ 4,109 $ (1,586)
XII. Reconciliation of consolidated comprehensive loss for the year ended December 31, 2010:Canadian Effect of
Year ended December 31, 2010 Note GAAP transition to IFRS IFRS
Net loss for the period $ (14,780) $ 3,570 $ (11,210)Other comprehensive income (loss)
Unrealized loss on translating financialstatements of subsidiary operations (34) (288) (322)
Tax effect (f) 280 (280) - Other comprehensive income (loss) 246 (568) (322)
Comprehensive loss for the period $ (14,534) $ 3,002 $ (11,532)

Tree Island Wire Income Fund : Q2 : 2011 : Notes to the Interim Condensed Consolidated Financial Statements 55
Notes to the Reconciliations
(a) Property, plant and equipment (“PPE”)
As discussed above in the initial elections upon adoption of IFRS, the Fund elected to value machinery and equipment ontransition at fair value which then becomes the deemed cost on which to amortize/depreciate in future periods. This resultedin an increase to the carrying value of the “PPE” of $820 as at the transition date and the resulting adjustment being chargedto retained earnings.
(b) Accounts payable and accrued liabilities
In accordance with IAS 37, the provision for the Corona onerous contract was re-evaluated to reduce the future expected sub-lease rental income to the contractual sub-lease receipts. Therefore, the present value of the provision increased as at thetransition date by $170. This difference increased the amount of accretion amortized using the effective interest method by$64 and $127 in the three and six months ending June 30, 2010.
(c) Fund units and instruments convertible into Fund units
Under Canadian GAAP, the Fund’s units were classified as equity. Upon transition to IFRS, the equity classification of the units was evaluated because the units can be redeemed at the option of the holder subject to certain terms and restrictions(see Note 12). Based on IAS 32, the units meet the conditions set out in paragraphs 16A and 16B for equity classification andtherefore continue to be classified as equity under IFRS. However, other instruments that are convertible into Fund units donot qualify for this exemption and are discussed below.
Convertible Debentures
The Fund has issued Convertible Debentures which are considered to be compound instruments and under Canadian GAAPthe proceeds received were bifurcated to record the fair value of the associated elements which included the embeddedfinancial derivative for the change of control premium, the conversion feature and any warrants issued with the residual beingallocated to the debt portion of the Convertible Debentures. Transaction costs were allocated pro rata between the elementsof the Convertible Debentures. The Convertible Debentures and change of control option were classified as financial liabilitiesand the conversion feature and warrants were classified as equity.
Under IFRS, the Convertible Debentures continue to be considered compound instruments and the original determination offair values at issuance are consistent between Canadian GAAP and IFRS. The accounting and classification of the ConvertibleDebentures and of the change of control premium have not changed on conversion to IFRS. However, the conversion featureand warrants under IFRS are classified as financial liabilities at fair value and are re-measured at each reporting period withchanges in fair value being recorded in the statement of operations.
As well, under Canadian GAAP, the conversion feature and warrants were recorded in unitholders’ equity net of allocatedtransaction costs. Under IFRS, as a result of being classified as financial liabilities, the associated transactions costs have beenexpensed when incurred. At the transition date, the transaction costs related to the conversion feature and warrants from the Convertible Debentures of $330 issued in 2009 have been adjusted to retained earnings and for the three and six monthsending June 30, 2010 the transaction costs of $nil and $296 relating to the conversion feature and warrants from theConvertible Debentures issued in January 2010 have been charged to financing expenses in the restated statement ofoperations.
Phantom Units
In accordance with Canadian GAAP, the Phantom units were classified as equity and accounted for as stock basedcompensation with compensation cost being measured on the market price of the Fund’s units on the date of the grant of thePhantom Units and recognized in to the statement of operations straight-line over the vesting period with the offset beingcontributed surplus. When converted, the issued units would be recorded in Unitholders’ Capital at the market price at thedate of grant and the related contributed surplus would be removed.
Under IFRS, the Phantom Units do not qualify for the exemption under IAS 32 and are considered instead financial liabilitiesand are now included with other current liabilities. Also, the calculation of compensation expense has changed upon adoptionof IFRS so that the Phantom Units are accounted for under IFRS 2 as cash-settled awards whereby the outstanding PhantomUnits are accounted for at fair value at each reporting period and changes in fair value are recognized in compensationexpense. As there is no exercise price, the fair value of the Phantom Units is considered to be the market price for the Fundunits. The changes in fair value for unvested awards are recognized over the vesting period and the changes in fair value ofvested awards are recognized in full each period until converted to units or forfeited. When a Phantom Unit is converted, theassociated liability will be derecognized and recorded as Unitholders’ capital at the market price on the date of conversion.

56 Tree Island Wire Income Fund : Q2 : 2011 : Notes to the Interim Condensed Consolidated Financial Statements
(d) Long-term debt
Under Canadian GAAP, transaction costs related to the original extinguishment of the trade payable and recognition of theForbearance Agreements in 2009 were netted against the present value upon initial recognition. Under IAS 39 AppendixAG62, if the debt is accounted for as an extinguishment any costs or fees incurred are recognized as part of the gain or loss on extinguishment. As a result, the transaction costs of $0.4 million on the initial renegotiation in 2009 were charged againstretained earnings at the transition date.
(e) Deferred gain on sale of option
In 2006 the Fund sold a purchase option on its leased property in Pomona, California. The net pre-tax cash proceeds receivedon the sale was $5,264. The sale was treated as a sale and lease back under Canadian GAAP and the gain was deferred andamortized over the ten year life of the new lease. Under IAS 17, the Pomona option sale would have been accounted for as again at the time of the transaction. As such, retained earnings as at January 1, 2010 has been adjusted for the balance of thedeferred gain of $3,337 under Canadian GAAP and for the three months ended June 30, 2010, six months ending June 30,2010 and year-ended December 31, 2010, the amount of deferred gain recognized under Canadian GAAP in the statement of operations of $121, $119 and $477 respectively has been reversed.
(f) Deferred income taxes (previously referred to as future income taxes under Canadian GAAP) and current income taxes
The current and deferred income tax adjustments reflect changes in the accounting of tax on various items including creationof temporary differences resulting from the effect of the IFRS adjustments described above. In particular, a deferred taxliability was recorded as at the transition date of $837 and was charged to retained earnings. In addition, under IFRS, there is no longer income tax allocated to any exchange gains/losses relating to foreign denominated intercompany balances as aresult, comprehensive income was increased by $8 and reduced by $109 for the three and six months ending June 30, 2010 and reduced by $280 for the year ended December 31, 2010.
(g) Current portion of long-term debt
The Fund had amended the term of the Forbearance Agreements in the first quarter of 2011 and Canadian GAAP allowed the reduced payment terms to be presented in the current portion of long-term debt as at December 31, 2010 because theagreement had been reached prior to the issuance of the financial statements. IFRS, under IAS 1 is strict in this regard and thechange in presentation of current versus long-term portions of the long-term debt must be reflected in the period it occurred.As a result, the current portion of long-term debt for the December 31, 2010 has been increased by $2,387 and the long-termdebt has been reduced by the equivalent amount. The amended payment schedule has been reflected now in the June 30,2011 presentation of current portion of long-term debt and the long-term debt balance.
(h) Foreign currency translation
Cumulative foreign currency translation balances
Under Canadian GAAP, the Fund recognized translation differences on foreign operations in a separate component of equity. Cumulative currency translation differences for all foreign operations are deemed to be zero as at January 1, 2010. The resulting adjustment of $18,060 was recognized against retained earnings.
Functional currency
Under prior Canadian GAAP, Tree Island International, the Hong Kong parent company to the Fund’s Chinese subsidiaries, wasconsidered to be an integrated subsidiary and was translated into Canadian dollars using the temporal method. The conceptof integrated subsidiaries does not exist under IFRS. It was determined that the functional currency of the Hong Kongcompany is US dollars. The Chinese subsidiaries of Tree Island International continue to have a functional currency of RMB. The change in functional currency of the Hong Kong company resulted in various immaterial translation differencethroughout the statement of financial position including the change in cash balance of $17 as at June 30, 2010 and $11 as at the December 31, 2010.

UNITHOLDER INFORMATION TREE ISLAND WIRE INCOME FUND
Officers:
Tree Island Wire Income Fund
Amar Doman Chair of the Board
Theodore A. Leja Vice-Chair of the Board
Dale McLean President and Chief Executive Officer
Nancy Davies Chief Financial Officer andVice President, Finance
Kelly Stark-Anderson Secretary
Board of Trustees:
Tree Island Wire Income Fund
Amar Doman
Michael Fitch
Sam Fleiser
Theodore A. Leja
Dale McLean
Harry Rosenfeld
Corporate Head Office
Tree Island Industries Ltd. 3933 Boundary Road Richmond, BC Canada V6V 1T8
Website
www.treeisland.com
Mailing Address
Tree Island Wire IncomeFund P.O. Box 50 New Westminster, B.C. Canada V3L 4Y1
Convertible Debentures:
Market Information
Convertible Debentures Listed: Toronto Stock ExchangeTrading Symbol: TIL.DB
Registrar and Transfer Agent
Valiant Trust Company
Units:
Market Information
Units Listed: Toronto Stock Exchange Trading Symbol:TIL.UN
Registrar and Transfer Agent
Computershare Investor Services Inc.
Investor Relations
Nancy Davies Chief Financial Officer and Vice President, Finance 604-523-4587 [email protected]
Auditors
Ernst & Young LLP Vancouver, B.C.
Leadership Team
Dale McLean President and Chief Executive Officer
Nancy Davies Chief Financial Officer andVice President, Finance
Ken Stuttaford Vice President, Sales and Marketing
Stephen Ogden Vice President, Operations
Mark Stock Vice President, Human Resources andInformation Technology