Embed Size (px)
Citation preview
Bureau Veritas UK Ltd
Analysis of Trends in Gravimetric Particulate Mass Measurements in the
United Kingdom
January 2009
Analysis of Trends in Gravimetric Particulate Mass Measurements in the UK
Ref: Bureau Veritas/AQ/AGG06801/RM/2543 Bureau Veritas UK Ltd ii
DOCUMENT INFORMATION AND CONTROL SHEET
Client: Department for the Environment, Food and Rural Affairs (Defra)
Defra Air Quality & Industrial Programme Area 3C Ergon House c/o 17 Smith Square London SW1P 3JR
Project Manager Tel: Fax: Email:
Dr Janet Dixon +44 (0) 20 7238 1699 +44 (0) 20 7238 1657 [email protected]
Environmental Consultant
Bureau Veritas HS&E Ltd Great Guildford House 30, Great Guildford Street London SE1 0ES
Project Director Tel: Fax: Email:
Dr Richard Maggs +44 (0) 20 7902 6158 +44 (0) 20 7902 6149 [email protected]
Project Team Dr Richard Maggs Dr David Harrison Patricia Bowe Dr David Carslaw – ITS Ken Stevenson – AEA John Stedman - AEA
Principal Authors
Dr Richard Maggs Dr David Harrison Dr David Carslaw Ken Stevenson
Document Status and Approval Schedule
Issue
Status
Description
Prepared by: Signed/Dated
Reviewed by: Signed/Dated
1 Draft 6 Sent by Email.
21st January 2009
21st January 2009
Analysis of Trends in Gravimetric Particulate Mass Measurements in the UK
Ref: Bureau Veritas/AQ/AGG06801/RM/2543 Bureau Veritas UK Ltd iii
CONTENTS
Executive Summary ix
1..........................Introduction 1
2..........................Implementation in the United Kingdom 2
2.1..................The role of the Automatic Urban and Rural Network (AURN) 2 2.2..................PM monitoring techniques used in the United Kingdom Network 3 2.3..................Links with AQUILA and JRC 5
3..........................Trends in Gravimetric Particulate Matter: Emissions and Concentrations 2000 – 2007 7
3.1..................Emissions of particulate matter in the UK 7 3.2..................Trends in ambient PM10 and PM2.5 concentrations 11
4..........................Analysis of Trends 18
4.1..................Evidence for the overestimation of gravimetric measurements 18 4.1.1 ......Partisol 2025, KFG and FDMS Ambient Data 18 4.1.2 ......Comparison of PM data for different weighing laboratories 20 4.1.3 ......Travel Blank Filters 23 4.1.4 ......Summary of evidence for an overestimation 29
4.2..................Bureau Veritas Laboratories Audit 30 4.2.1 ......Results of the Audit 30 4.2.2 ......Experiments to ascertain the source of the high blank values. 33 4.2.3 ......Conclusions of Laboratory Audit 37
4.3..................Travel blank trend analysis 38 4.3.1 ......Statistics of the trend in Bureau Veritas weighed Whatman QMA quartz filters 38 4.3.2 ......Trend Analysis and seasonal affects 40 4.3.3 ......Change Point analysis 43 4.3.4 ......Affect of Humidity 43 4.3.5 ......Filter Weight 46 4.3.6 ......Days between pre- and post-exposure weights 48 4.3.7 ......Trends and change-point in ambient data 49
4.4..................Organic Carbon Artefacts 51 4.5..................Inter-Laboratory Comparison 52 4.6..................Summary of main findings 53
5..........................Consultation and Response Summaries 54
6..........................Correction of Partisol Data 56
7..........................Implications for compliance with EU Directives 59
8..........................Future Considerations and Mitigation Plans 62
Acknowledgements 63
References ..... 64
Glossary ......... 65
Analysis of Trends in Gravimetric Particulate Mass Measurements in the UK
Ref: Bureau Veritas/AQ/AGG06801/RM/2543 Bureau Veritas UK Ltd iv
Appendix A - Policy Context 66
Appendix B - Graphs and Tables of Annual Trends in PM 68
Appendix C – Consultees Responses 78
Analysis of Trends in Gravimetric Particulate Mass Measurements in the UK
Ref: Bureau Veritas/AQ/AGG06801/RM/2543 Bureau Veritas UK Ltd v
LIST OF FIGURES
Figure 3.1 Urban UK exhaust emissions of PM10 from road transport ..................................................8
Figure 3.2 Urban UK emissions of PM10 from road transport including exhaust and tyre and brake wear sources. ........................................................................................................................................9
Figure 3.3 Annual mean UK average concentrations of sulphate and nitrate (1999 – 2006). ............10
Figure 3.4 Monthly time series of PM10 and PM2.5 concentrations by site operating Bureau Veritas weighed Whatman QMA quartz filters only. ........................................................................................14
Figure 3.5 Trends of annual average PM10 concentrations measured by the Partisol operating Whatman QMA quartz filters weighed to EN12341 by Bureau Veritas Laboratories for sites with greater than 75 % data capture. ..........................................................................................................16
Figure 3.6 Trends of annual average PM2.5 concentrations measured by the Partisol operating Whatman QMA quartz filters weighed to EN12341 by Bureau Veritas Laboratories for sites with greater than 75 % data capture. ..........................................................................................................16
Figure 3.7 Trend of annual average TEOM concentrations for sites with greater than 75 % data capture. All measurements contain the inbuilt 3and 1.03 A and B correction factors. In addition, the PM10 concentrations have been multiplied by 1.3. ..............................................................................17
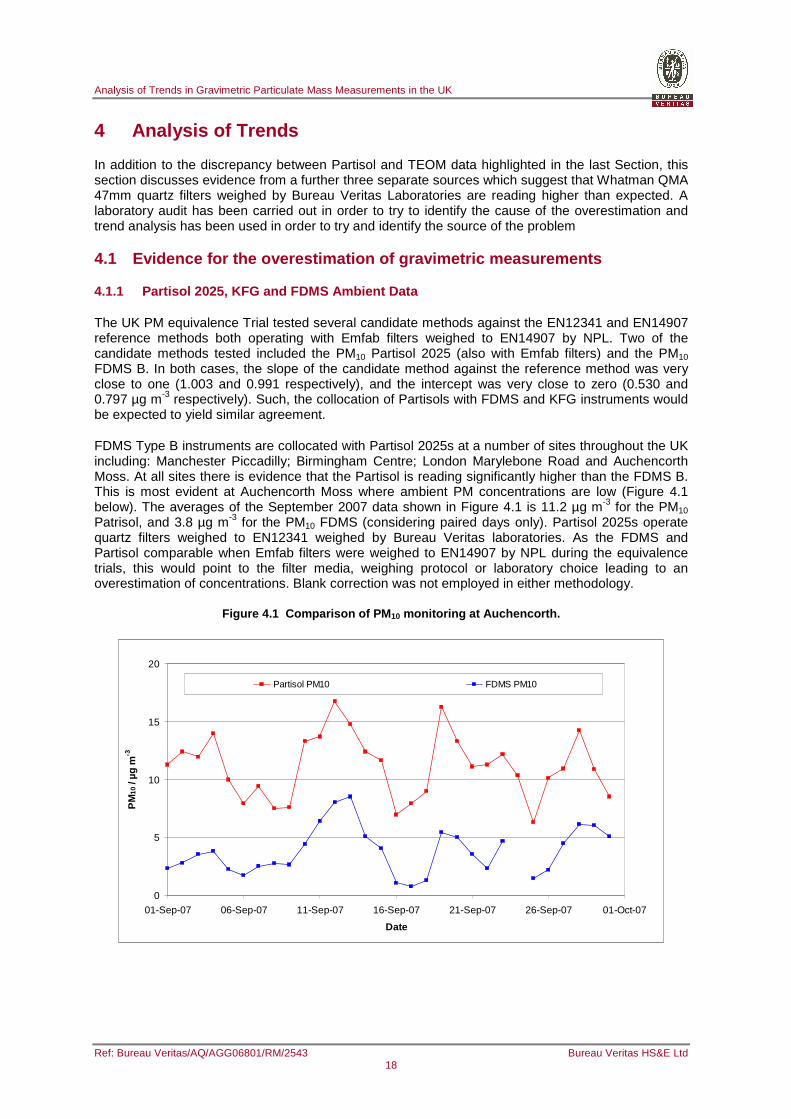
Figure 4.1 Comparison of PM10 monitoring at Auchencorth...............................................................18
Figure 4.2 Comparison of PM10 monitoring at London Marylebone Road in both a summer and winter period. .......................................................................................................................................19
Figure 4.3 PM2.5 Concentrations measured in Teddington 2007. .......................................................20
Figure 4.4 PM2.5 Difference due to Laboratory, Filter Media and Instrument......................................21
Figure 4.5 PM2.5 Spread in concentration equivalent due to repeat weighing of Whatman QMA quartz filters weighed by NPL..............................................................................................................22
Figure 4.6 Variability of travel blank concentration equivalent as a function of date for all Whatman quartz filters for Partisols weighed by Bureau Veritas Laboratories for the Defra sites and Derby. The line of best fit is a locally-weighted regression smooth, and the uncertainty intervals are shaded.....24
Figure 4.7 Variability of the PM10 and PM2.5 travel blank concentration equivalent as a function of date for all Whatman quartz filters for Partisols weighed by Bureau Veritas Laboratories for the Defra sites and Derby....................................................................................................................................25
Figure 4.8 Variability of the travel blank concentration equivalent for Emfab filters weighed by Bureau Veritas and deployed in a Partisol in Earls Court Road in London.........................................26
Figure 4.9 Variability of the travel blank concentration equivalent for PNS-X8 KFG filters weighed by Bureau Veritas assuming the same flow rate as a Partisol 2025........................................................27
Figure 4.10 Variability of the laboratory blank concentration equivalent for Whatman QMA quartz Partisol 2025 filters weighed by AEA. Travel (field) blank concentration equivalents are also shown for the Defra research sites. ................................................................................................................28
Figure 4.11 Photo of conditioning of un-sampled filters showing slight overlap. ...............................31
Analysis of Trends in Gravimetric Particulate Mass Measurements in the UK
Ref: Bureau Veritas/AQ/AGG06801/RM/2543 Bureau Veritas UK Ltd vi
Figure 4.12 Photo of balance and automated filter handler. ..............................................................31
Figure 4.13 Photo of conditioning of sampled Partisol filters in filter holders.....................................33
Figure 4.14 Increase in mass (µg) of filters based on their position for conditioning on the tray.......36
Figure 4.15 Box and whisker plot of Bureau Veritas weighed Whatman QMA Quartz filters filter weights used in Partisol 2025s by month. The filled circles show the median concentrations and the shaded boxes show the 25th and 75th percentile concentrations. .......................................................38
Figure 4.16 Dependency of site on annual average field blank concentration equivalent. .................40
Figure 4.17 Monthly time series of Bureau Veritas weighed Whatman QMA blank filter weights for Partisol 2025s decomposed into trend, seasonal and remainder components using the STL technique. ............................................................................................................................................41
Figure 4.18 Variation of Whatman QMA travel filter blank mass against ambient absolute humidity. Data were collected in the Netherlands...............................................................................................42
Figure 4.19 Seasonal affect in Emfab filters weighed by Bureau Veritas for Partisols. ......................42
Figure 4.20 Change-point analysis of de-seasonalised monthly mean Bureau Veritas weighed Whatman QMA blank filter weights for Partisol 2025s. .......................................................................43
Figure 4.21 Relationship between blank filter weight and laboratory temperature and humidity........44
Figure 4.22 Time series of laboratory humidity at the time of initial filter weighing. The shaded area shows the tolerances allowed under EN12341. ..................................................................................45
Figure 4.23 Scatter plot of laboratory relative humidity for travel blanks at time of post weighing of Bureau Veritas weighed Whatman QMA quartz filters for Patrisols....................................................45
Figure 4.24 Time series of initial filter weight. .....................................................................................46
Figure 4.25 Relationship between initial filter weight and blank filter concentrations. The period covered is shown by the shaded area in Figure 4.24..........................................................................47
Figure 4.26 Variation of Initial Filter Mass for Whatman QMA filters weighed by BV and NPL for the 2007 Teddington Field Trials. ..............................................................................................................47
Figure 4.27 PM2.5 Scatter plot of the initial mass difference of Whatman QMA quartz filters weighed by BV and NPL versus the difference in measured PM2.5 concentration. ...........................................48
Figure 4.28 Scatter plot of the blank concentration equivalent versus the days between pre and post weighings.............................................................................................................................................49
Figure 4.29 Monthly time series of mean PM10 and PM2.5 concentrations decomposed into trend, seasonal and remainder components using the STL technique. Data are for the 17 sites where there were at least 1500 days of valid measurements. ................................................................................50
Figure 4.30 Change-point analysis of PM2.5 concentrations at Harwell and North Kensington. The black line shows the de-seasonalised data, the thick line shows the mean level filter weights before and after the change-point, the dashed line shows the best estimate of the change-point timing and the error bars adjacent to the x-axis show the 95 % confidence intervals in the timing of the change-point. ....................................................................................................................................................51
Figure 6.1 Trend of corrected annual average PM10 concentrations. .................................................58

Analysis of Trends in Gravimetric Particulate Mass Measurements in the UK
Ref: Bureau Veritas/AQ/AGG06801/RM/2543 Bureau Veritas UK Ltd vii
Figure 6.2 Trend of corrected annual average PM2.5 concentrations..................................................58
Figure 7.1 Changes in PM10 model verification with correction of measured gravimetric data for background locations and agreement with FDMS data (2007) (µg m-3) .............................................60
Figure 7.2 Changes in PM10 model verification with correction of measured gravimetric data for roadside locations and agreement with FDMS data (2007) (µg m-3) ..................................................60
LIST OF TABLES
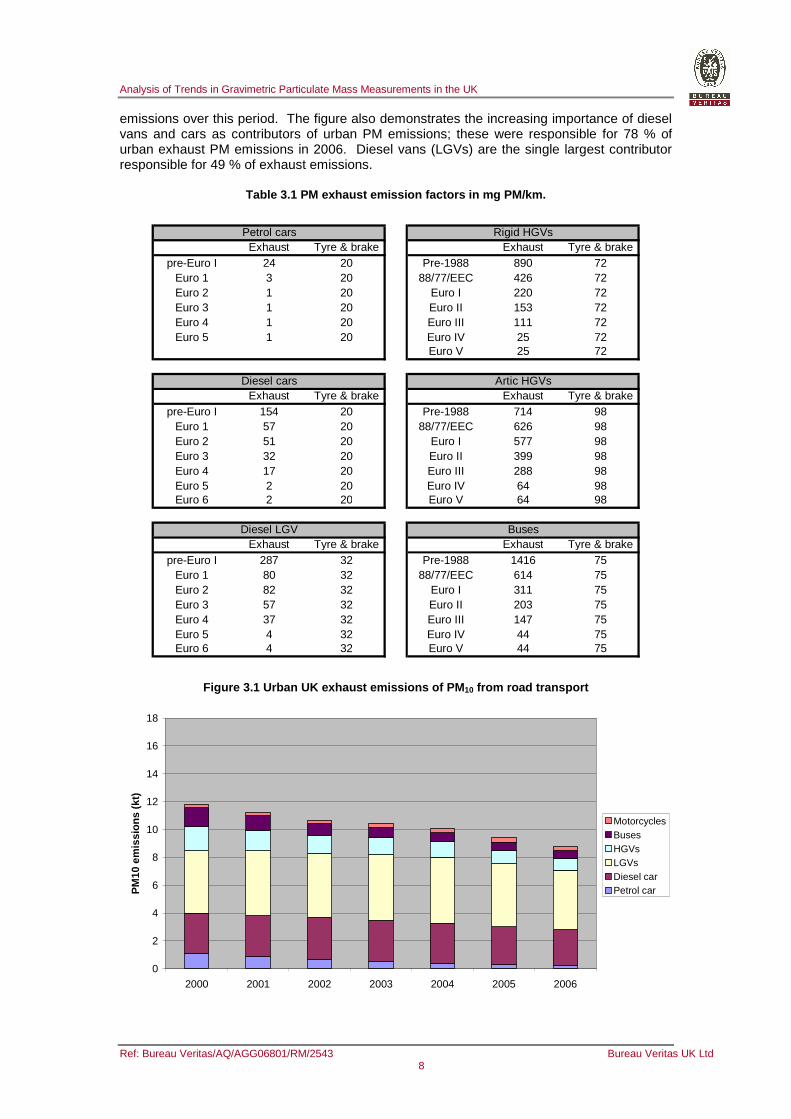
Table 3.1 PM exhaust emission factors in mg PM/km. .........................................................................8
Table 3.2 Partisol units managed by Bureau Veritas as of 30th April 2008.........................................13
Table 3.3 Annual average concentrations for all sites where there is greater than 75 % collection in a calendar year. Averages are for sites operating Bureau Veritas weighed Whatman QMA quartz filters only.............................................................................................................................................15
Table 4.1 Equivalent Concentration of blank filters conditioned with overlap and on their own. ........34
Table 4.2 Increase in concentration of PM on filters after weighing; conditioning for a further 48 hours then weighing again relative to PM concentration...............................................................................35
Table 4.3 Increase in concentration of PM on filters after weighing; conditioning for a further 48 hours then weighing again relative to Maximum RH.....................................................................................35
Table 4.4 Annual average blank concentration equivalent. ................................................................39
Table 4.5 Variation in Bureau Veritas weighed Whatman QMA Quartz filters filter weights used in Partisol 2025s by month placed in sampler.........................................................................................39
Table 4.6 Summary of WASP Inter-Laboratory Comparisons since 2005..........................................52
Table 6.1 Calculation of total expanded relative uncertainties for correcting Partisol concentrations at different Limit Values and Scottish Air Quality Objectives. .............................................................57
Table 7.1 Annual average concentration calculated by the monthly correction method minus the annual average concentration calculated by the annual correction method for those PM10 sites used in the 2005 and 2006 PCM models. ....................................................................................................61
Table 7.2 Annual average concentration calculated by the monthly correction method minus the annual average concentration calculated by the annual correction method for those PM2.5 sites used in the 2005 and 2006 PCM models. ....................................................................................................61
Analysis of Trends in Gravimetric Particulate Mass Measurements in the UK
Ref: Bureau Veritas/AQ/AGG06801/RM/2543 Bureau Veritas UK Ltd viii
Disclaimer
This Report was completed by Bureau Veritas on the basis of a defined programme of work and terms and conditions agreed with the Client. We confirm that in preparing this Report we have exercised all reasonable skill and care taking into account the project objectives, the agreed scope of works, prevailing site conditions and the degree of manpower and resources allocated to the project.
Bureau Veritas accepts no responsibility to any parties whatsoever, following the issue of the Report, for any matters arising outside the agreed scope of the works.
This Report is issued in confidence to the Client and Bureau Veritas has no responsibility to any third parties to whom this Report may be circulated, in part or in full, and any such parties rely on the contents of the report solely at their own risk.
Unless specifically assigned or transferred within the terms of the agreement, the consultant asserts and retains all Copyright, and other Intellectual Property Rights, in and over the Report and its contents.
Any questions or matters arising from this Report should be addressed in the first instance to the Project Manager.
Analysis of Trends in Gravimetric Particulate Mass Measurements in the UK
Ref: Bureau Veritas/AQ/AGG06801/RM/2543 Bureau Veritas UK Ltd ix
Executive Summary
This report provides for an analysis of observed trends in filter based gravimetric PM10 and PM2.5 concentrations in the United Kingdom as gathered through a network of samplers over the period 2000-2008. The use of gravimetric samplers in the UK provides for part of the UK implementation of monitoring requirements around compliance against legally binding limit values for particulate matter (comprising of the metrics PM10 and PM2.5).
The UK Air Quality Strategy (2007) sets out UK Government policy on the improvement of air quality across the UK. Consequently, the anticipated trend for the occurrence of Particulate Matter (PM) in the UK is one of decline. Monitoring of resultant PM concentrations (PM10 and PM2.5) therefore provide a valuable evidence-base to support UK policy on whether declining trends in emissions results in concurrent improvements in PM concentrations.
Analysis of annual mean PM10 and PM2.5 trends over the period 2000 – 2007 indicates that this anticipated decline in PM levels is not occuring, when based on gravimetric filter mass samplers. This observation conflicts with previous trends reported by the UK Air Quality Expert Group in their 2005 report entitled “Particulate Matter in the United Kingdom” based on previously reported TEOM methods.
Of particular note in the trend of gravimetric PM measurements is the apparent increase in PM concentrations in 2006 and 2007. This forms the primary focus of this report in relation to in-depth analysis.
Collocation of different monitoring methods at a number of sites provides for a comparison of gravimetric filter-based methods with EU reference method equivalent data acquired through non-gravimetric methods. Such comparisons provide for re-assurance in monitoring methods or, conversely, give rise to discrepancies that require further investigation. In the case of the current work, comparison between EU compliant non-gravimetric methods with gravimetric methods at Auchencorth Moss in Scotland (where levels of PM are expected to be very low), indicate that gravimetric methods lead to an over-estimation in PM10 levels in September 2007, by a magnitude of three times. Elsewhere, comparisons of filter-based gravimetric methods with non-gravimetric methods show less discrepancy but support the notion that measurements undertaken by the gravimetric methods (in this case by the Partisol 2025) lead to an over-estimation of PM10 levels during both summer (August 2007) and in winter (December 2006).
Potential discrepancies between filter-based gravimetric methods may arise for a wide range of reasons, including:
• Filter types;
• Environmental conditions during pre- and post-exposure;
• Environmental conditions during sampling;
• Differences in instrumentation
In the UK, the number of laboratories commercially accredited for the provision of filters for gravimetric samplers is limited. However, accepting that discrepancies between accredited laboratory providers may still arise a comparison of between providers was undertaken as part of a study (in this case for PM2.5) undertaken at Teddington in 2007.
In this trial, collocation of the EU reference method (Low Volume Sampler) and the Partisol 2025 method was undertaken, which additionally included different filter media (quartz vs. Teflon coated glass fibre (Emfab)) and two different providers (Bureau Veritas Laboratories and the National Physical Laboratory). Results showed that differences in mean PM2.5 concentrations for the period June – August 2007 were strongly influenced by the provider (i.e. laboratory protocols) resulting in a difference in reported mean of 6.7 µg m-3. Interestingly, the choice of filter media was shown to influence reported concentrations with quartz filters providing for an over-estimation of PM2.5 concentrations of 3.8 µg m-3 when compared to Emfab filter measurements. Differences between
Analysis of Trends in Gravimetric Particulate Mass Measurements in the UK
Ref: Bureau Veritas/AQ/AGG06801/RM/2543 Bureau Veritas UK Ltd x
instrumentation were lowest at 1.7 µg m-3 (with the Partisol consistently reading lower than the reference method)
Further analysis of quartz travel blank filters (filters that have been deployed into the day-to-day operations of the Partisol 2025 units but not actively sampled) show a strong influence in the over-estimation of reported mass concentrations for PM10 and PM2.5 during 2006 and 2007. The impact on reported mass concentrations is statistically the same between PM10 and PM2.5 highlighting that a common influence is driving the change in quartz travel blank mass. Analysis of Emfab travel blank filters provided by the same laboratory over the period 2003 – 2008 at a site in London (Earls Court Road) does not provide for the same trend in travel blanks. This indicates a strong influence of filter media on travel blank behaviour. Namely, Emfab filters appear to be less influenced by artefacts than quartz filters.
Seasonal trend decomposition analysis has shown that a strong seasonal cycle occurs within the quartz travel blank data, which correlates well with ambient absolute humidity. Similar trends in seasonal effect on quartz blank filter mass and ambient absolute humidity is shown elsewhere in data gathered from The Netherlands, supporting this analysis.
Statistical analysis on the travel blank filter data (expressed as concentration equivalent) shows a statistically significant change-point in the data around April / May 2006 (95 % confidence interval in the timing of the change-point = December 2005 to May 2006). This indicates that there is a causal link between increases in quartz travel blanks and reported PM concentrations.
Analysis of initial filter weights has provided for evidence of the possibility of two distinct nominally identical quartz filter types. The filters with a higher initial weight are associated with blank filters that have concentrations of 2.8 ± 0.4 µg m-3 (95 % confidence interval in the mean) and the filters with a lower initial weight with concentrations of 0.3± 0.3 µg m-3. Statistically, it can be shown that there is a clear difference in these two groups in their mean blank concentrations of 2.5 µg m-3. This is a potentially important finding as it shows that nominally identical filters have different characteristics in terms of their blank filter concentrations. The manufacturing facility have been contacted, and confirmed that the tolerance for filter weight is from 127 mg to 161 mg (target 144 mg), and all of the filters used herein are within range. They confirmed these filter media are manufactured using a single machine. Although, all filter weights in any given batch will be very similar, the range of weights between batches would be much greater. This would explain the two separate distinct bands observed during 2005 but does not contribute significantly to explaining the significant change-point reported above.
Statistical analysis of ambient concentration data (PM10 and PM2.5) highlights the occurrence of a different seasonal cycle when compared to travel filter blanks for quartz filters. This seasonal cycle peaks in spring as opposed to summer suggesting that different factors may influence travel filter blanks when compared to exposed filters. Trend analysis has shown that concentrations in ambient PM Levels have increased by around 9 µg m-3 over the period 2000 – 2007. Change-point analysis applied to monthly mean measurements of ambient PM10 and PM2.5 concentrations has yielded no significant change-point over the time series. The result is not surprising as stronger influences on PM occurrence dominate. A refined analysis was therefore chosen to asses the likely extent of change-point in ambient PM concentrations. This approach considered the analysis of data at two sites (Harwell and North Kensington) on data determined through the subtraction of TEOM data from gravimetric concentrations. This data would include volatile PM not measured by the TEOM in addition to any artefact due to filter issues (i.e. travel blanks). The results of the refined approach confirmed the presence of a significant change-point in data at both sites, albeit at different times. At Harwell, the change-point occurrence was found in April/May 2006, whilst at North Kensington the change-point occurrence was found in December 2005. For both sites the uncertainty interval includes the May 2006 change-point observed for travel filter blanks. Wider uncertainties are evident, which, in part, are likely to be attributed to increased variability in the data encompassing all the influences of emissions, meteorology, filter mass, etc that ambient data entails.
As way of re-assurance of quality in the provision of filter weighing services an audit was undertaken of the laboratory by representatives of CMCU and QA/QC units. Specifically, the audit focused on protocols and the variability in environmental conditions for the conditioning of filters pre- and post-
Analysis of Trends in Gravimetric Particulate Mass Measurements in the UK
Ref: Bureau Veritas/AQ/AGG06801/RM/2543 Bureau Veritas UK Ltd xi
weighing after exposure to sampling. Whilst historical problems in maintaining the temperature (20 ºC) and humidity conditions (50% RH) were highlighted, the impacts on mass measurements are unlikely to be solely attributed to this aspect of operations. No single issue was identified in the audit as being responsible for the observed increase in travel blanks in 2006 and 2007.
Current assessment methods used in the UK for determining compliance against limit values comprise of both monitoring and modelling methods. In recent years the Pollution Climate Mapping (PCM) model has used data acquired from gravimetric Partisol samplers to validate the approach. Thus, use of the Partisol data has since introduced a bias into the national assessment method, which has led to an over-estimation of exceedences of the limit values for PM10, when compared to otherwise unbiased assessments. Comparison of the PCM model outputs against the FDMS method (a non-gravimetric method shown to be equivalent to the EU reference method in the UK) has highlighted the discrepancies of using Partisol 2025 gravimetric measurements to validate the model approach. Consequently, the bias introduced through the use of gravimetric data is required to be removed.
Initial consideration to the application of these values to annual means removes the apparent increasing trend in PM concentrations across the UK observed in recent years and significantly reduce the extent of [otherwise] reported exceedences of the PM10 limit values.
In addition to the application of the above annual mean corrections to Partisol data, it is proposed that gravimetric sampling of PM mass in the UK move toward a filter media based on Emfab (Teflon coated glass fibre) or equivalent to reduce identified artefacts associated with filter media choice. The current EU reference method (EN12341) for PM10 relies solely on the use of quartz filters. Consequently it is recommended that the UK lobby the European Committee for the Normalization (CEN) to take on board experiences across Member States of the practical implementation of gravimetric sampling within its current review and update of the existing standard.
As part of the need to seek wider opinion on the issues around gravimetric analysis of particulate matter included in this report, a consultation exercise was undertaken on the draft version of the report through and open letter to UK and European experts.
The general consensus is that the report adequately demonstrates a problem. However, the majority of respondents felt that correction should not be carried out until after the outcome of Working Group 15, which continues to investigate issues around methods and uncertainty in gravimetric analysis. However, it is generally felt that the immediate issues of correction and compliance necessitate the need to override these concerns. Most respondents felt that, as it is not definitive that the field blank is of the same magnitude as the overestimation, it is essential that the cause of the overestimation is identified before any corrections are applied. The authors continue to investigate the root cause of the issue. However, having identified the issue, a procedure for correcting field data using blank filters is proposed on the basis that future data still requires consideration to the application of tightened QA/QC procedures.
CMCU and QA/QC have already reviewed the procedures for operating gravimetric samplers in the UK network, including routine travel blanks and providing for subtraction of travel blanks from filter mass measurements reported within each fortnightly batch.
A previous draft for consultation of this report (published May 2008) proposed correction by subtracting the average blank concentration equivalent from the annual mean data. JRC suggests the application of daily correction factors which, while statistically valid, pose problems in relation to the shortage of filter blank measurements. After consultation, it was decided that the daily data should be corrected by subtraction of the monthly correction factor for the month in which the filter was sampled and to use these data to calculate annual averages. Use of this method has the advantage in that sites with less than 100 % data capture are corrected more accurately; and as the seasonal variation is corrected for, the daily data are valid, and so the link between daily and annual averages is maintained. The annual correction method proposed in the previous draft was calculated using the average rounded (to zero decimal places) daily data on the National database. The monthly corrected method used the raw un-rounded daily concentration data, and so is more accurate.
Analysis of Trends in Gravimetric Particulate Mass Measurements in the UK
Ref: Bureau Veritas/AQ/AGG06801/RM/2543 Bureau Veritas UK Ltd 1
1 Introduction
This report provides for an analysis of observed trends in gravimetric particulate matter occurrence in the United Kingdom over the period 2000 – 2008. It provides for a means of understanding the methods by which the UK has implemented provisions to comply with European Directives on particulate matter and to establish monitoring methods that comply with the European reference methods.
The primary focus of the report is gravimetric mass measurement of PM in order to convey the UK experience of implementing the European reference methods EN12341 and EN14907 – for PM10 and PM2.5, respectively – which has shown to lead to an apparent over-estimation of levels of both pollutants.
Other European reference method equivalent non-gravimetric methods are also deployed in the UK network and have been used in the current report as a means of providing further assurance on identification of issues associated with a number of apparent artefacts - laboratory, filter media, environmental variables used for filter conditioning – and comparisons with wider available datasets.
Consideration is made to the methods by which correction for apparent over-estimation of PM10 and PM2.5 levels can be applied and the implications for UK compliance against the EU Directives for legally binding Limit Values on PM10 (to be achieved by 31 December 2004).
The proposed methods for re-alignment of the UK Pollution Climate Mapping assessment are conveyed in order to build a consensus amongst UK expert groups and other interested parties on how best to achieve appropriate correction to historical data and to the procedures to be applied for future year assessments.
The report is structured in the following way:
• Chapter 2 provides for an understanding of the operational set-up of the UK compliance network for reporting against European Directives and the roles of various bodies and organizations;
• Chapter 3 undertakes the analysis of trends in reported levels of ambient gravimetric particulate matter levels, as observed from monitoring stations across the UK for PM10 and PM2.5 metrics;
• Chapter 4 conveys the full details of in-depth analysis and statistical significance of apparent artefacts in the trends observed for PM10 and PM2.5 as reported in Chapter 3;
• Chapter 5 summarises the consultees responses to the May 2008 draft of this document;
• Chapter 6 details methods for the correction of Partisol Data;
• Chapter 7 discusses implications for compliance with EU Directives;
• Chapter 8 provides for a summary of key discussion areas highlighting future considerations and mitigation plans;
• Appendix A sets out the policy context for UK compliance to European Directives and the harmonization of monitoring methods across Member States for reporting of ambient air pollution levels;
• Appendix B shows tables and graphs of the PM trends with and without correction for Partisol measurement offset;
• Appendix C details the consultees responses to the May 2008 draft of this document;
Acknowledgments, a glossary and references are provided at the end of this report.
Analysis of Trends in Gravimetric Particulate Mass Measurements in the UK
Ref: Bureau Veritas/AQ/AGG06801/RM/2543 Bureau Veritas UK Ltd 2
2 Implementation in the United Kingdom
2.1 The role of the Automatic Urban and Rural Netwo rk (AURN)
In the UK, the implementation of the EU legislation on ambient air quality is done through a number of contracts, awarded to commercial entities through open public tendering procedures. Further details of contracts awarded, the appointed contractors, and the key deliverables are provided at http://www.airquality.co.uk
The UK Automatic Urban and Rural Network (AURN) provides for the UK response to European legislation on the monitoring of the following pollutants:
• Particulate Matter – PM10 and PM2.5
• Gaseous pollutants – NO2, O3, CO, SO2
Requirements for a number of other pollutants included in the legislative framework of European legislation are fulfilled by a number of additional networks, due to technical reasons around methodologies and/or spatial coverage.
The AURN comprises a number of bodies and organizations involved in the day-to-day operations of the network. The following provides for a summary of these roles and provides for confirmation of the current appointed contractors (up to 2013):
• Bureau Veritas HS&E Ltd is the appointed Central Management and Co-ordination Unit (CMCU) for the AURN. The role of the CMCU is to manage the overall infrastructure of the network and to provide for preliminary analysis of data, its validation and onward dissemination to public information channels through the Air Quality Communications Unit. Once validated, the data is passed to the appointed QA/QC unit. For continuous monitoring, data is polled via telemetry and validated within the hour and published as “provisional data”. CMCU contractor is responsible for the appointment of local site operators – locally appointed organizations responsible for routine calibration procedures for equipment – and equipment support units. The equipment support units are appointed representatives of equipment manufacturers that maintain and service monitors. They respond to breakdown and poor performance of units as identified by CMCU through the polled diagnostic information.
• Kings College London - Environmental Research Group (KCL ERG) is the appointed CMCU for the London Air Quality Network (LAQN) and Regional Network monitoring sites affiliated to the AURN. The role of KCL is almost identical to that of Bureau Veritas HS&E Limited.
• AEA Technology plc (AEA) is the appointed QA/QC unit for the network. The role of the QA/QC unit is to work closely with CMCU on the initial validation of data polled via telemetry. Provisional data is further ratified and published in its final format every three months, having taken into account further information available on the diagnostics and equipment performance, maintenance and servicing records and any localized events that may influence the validity of the data. AEA is also the appointed Air Quality Communications Unit, and remain responsible for the hosting and maintenance of the Air Quality Information Archive (at www.airquality.co.uk)
• Air Liquide is the appointed contractor for the supply of standard gases to the AURN.
• The Department for the Environment, Food and Rural Affairs (Defra) is the competent authority legally mandated to report on air quality compliance issues to the European Commission. It is the lead body in appointing contracts on air quality for UK Government associated with EU legislation applicable at the Member State level. The devolved administrations are the Scottish Government, the Department of the Environment Northern Ireland and the Welsh Assembly, which additional take lead roles in responding to air quality issues at the national and European levels.
Analysis of Trends in Gravimetric Particulate Mass Measurements in the UK
Ref: Bureau Veritas/AQ/AGG06801/RM/2543 Bureau Veritas UK Ltd 3
Further details on the UK network are available at the following website:
http://www.bv-aurnsiteinfo.co.uk/
The AURN is comprised of sites which are wholly funded by Government and those that are owned by local government. In the case of the latter, local authority owned sites in the UK have completed the necessary quality assurance and quality control audits for affiliation into the network. Broadly speaking, the sites in the AURN are therefore referred to as “Defra-owned” or “Affiliate” sites.
2.2 PM monitoring techniques used in the United Kin gdom Network
The following section provides for a broad overview of the current methods deployed in the UK AURN. For filter-based measurement methods, automatic filter exchange methods have been chosen as preference above manual filter exchange methods in order to reduce overall costs and to remove impractical filter exchanges at midnight, in order to comply with the specified requirements of fixed 24-hour mass measurements stipulated in EU legislation.
Previously in the UK, a comprehensive study of cross-comparison of PM monitoring methods has been undertaken into order to comply with the need to seek equivalence with the EU reference method. This study largely focused on PM10 and was undertaken in accordance with guidelines on demonstrating equivalence of monitoring methods with reference methods [1]. Consequently, where reference is made to PM Equivalence Trials, the reader is guided to the more detailed and in-depth study as published at the following website [2]:
http://www.airquality.co.uk/archive/reports/cat05/0606130952_UKPMEquivalence.pdf
Consideration is made to the outcome of the above study in relation to informing the UK methods for deployment on PM mass, whilst additionally flagging current short-falls in equivalence criteria due to further modifications made in equipment after the event. Where reference is made to Slope and Intercept, these are statistical parameters used in determining the relationship between the EU reference methods (x-axis) and the candidate method (y-axis). Further details of the analysis of datasets can be found in the UK PM Equivalence Trials.
The following provides for a brief overview of current methods deployed in the AURN:
• PM10 Reference Method
Two AURN sites (Thurrock and Marylebone Road) operate units specified in the European Reference Method EN12341 – the Low Volume Sampler – in a PNS-X8 confirmation (the KFG (Kleinfiltergerat)). These units are operated with Whatman QMA quartz filters weighed by Bureau Veritas. The filters in these units are changed weekly.
Previously there were instruments in Harwell, Port Talbot, Glasgow and Belfast. These were removed from site in 2004 and were used operating Emfab filters in the UK Equivalence Trials.
Two SEQ47/50s are owned by Defra, and have recently been tested in further UK trials but are not as yet deployed into the AURN though these will be replacing the existing KFGs at Thurrock and Marylebone Road in due course. They differ from EN12341 in that there is sheath air cooling, and that filters are automatically exchanged daily.
• PM2.5 Reference Method
No UK sites operate the EN14907 reference method. UK experience is largely confined to their use in the UK PM Equivalence Trials [2,3], where prototypes of the final version were operated using Emfab filters.
Analysis of Trends in Gravimetric Particulate Mass Measurements in the UK
Ref: Bureau Veritas/AQ/AGG06801/RM/2543 Bureau Veritas UK Ltd 4
• Tapered Element Oscillating Microbalance (PM 10)
The PM10 TEOM is deployed widely around the UK. In the 2006 UK PM Equivalence Trials [2] the TEOM was shown to be not equivalent to the reference method, even with the application of a wide range of correction factors. The instrument was shown to underestimate PM mass, due to volatile species (such as ammonium nitrate and organic carbon aerosols) being lost at 50 °C, and the proportion of particles that are volatile varies in a non-linear fashion.
Current replacement and upgrade of TEOM units with PM10 equivalent methodologies is being carried out in 2008.
• Tapered Element Oscillating Microbalance (PM 2.5)
The PM2.5 TEOM was not originally included in the PM Equivalence Trials report in 2006 (PM10 formed the emphasis of this trial). However, a single test was undertaken during the summer of 2007 at one site in the UK only [3]. Data acquired during this limited study was shown not to experience the loss of volatiles, although this is thought to be attributable to the low volatile fraction in PM observed in the UK during the generally wet summer of 2007. There are currently only 4 PM2.5 TEOMs in the AURN.
• Filter Dynamic Measurement System Type B (FDMS) (PM 10)
FDMS Type B PM10 was tested in the UK PM Equivalence Trials [2] and was shown to be equivalent to EN12341 without the need for correction factors (Slope: 0.991; Intercept: 0.797 for “All Data” in the UK PM Equivalence Trials). This model is no longer commercially available and has been superseded by the Type C drier configuration. There are currently 21 PM10 FDMS Bs in the AURN.
• Filter Dynamic Measurement System Type B (FDMS) (PM 2.5)
FDMS Type B PM2.5 was tested in the UK PM Equivalence Trials [2] and was shown to be equivalent without the need for correction factors (Slope: 1.067; Intercept: -2.331 for “All Data” in the UK PM Equivalence Trials). This model is no longer commercially available and has been superseded by the Type C drier configuration. There are currently only 2 PM2.5 FDMS Bs in the UK network – the EMEP site in Auchencorth Moss, Scotland, and the other is located at an affiliate site in Swansea, Wales.
• Filter Dynamic Measurement System Type C (PM 10)
The Type C model FDMS differs from the Type B model in that it includes an improved drier that has a larger surface area. The instrument was tested during summer 2007 [3] for one dataset only and therefore is limited with regards to the extent to which it complies with EU equivalence criteria for PM measurements against the reference method. In this limited trial, the slope was the same as the FDMS Type B; however the instrument was shown to over read with an intercept of approximately 2 µg m-3, and as such did not meet the test for equivalence without the application of an intercept correction factor. Further tests are being undertaken to assess whether a correction factor needs to be applied to those instruments deployed in the AURN. There are currently 2 PM10 FDMS Cs in the National network and affiliate sites.
• Filter Dynamic Measurement System Type C (PM 2.5)
The Type C model FDMS differs from the Type B model in that it includes an improved drier that has a larger surface area. The instrument was tested during summer 2007 [3] for one dataset only and therefore is limited with regards to the extent to which it complies with EU equivalence criteria for PM measurements against the reference method. In this limited trial, the slope was the same as the FDMS Type B; however the instrument was shown to over read with an intercept of approximately 2 µg m-3, and as such did not meet the test for equivalence without the application of an intercept correction factor. Further tests are being undertaken to assess whether a correction factor needs to be applied to those instruments deployed in the National Network. Currently, there are no PM2.5 FDMS Cs deployed in the AURN.
Analysis of Trends in Gravimetric Particulate Mass Measurements in the UK
Ref: Bureau Veritas/AQ/AGG06801/RM/2543 Bureau Veritas UK Ltd 5
• Partisol 2025 (PM 10)
This was tested in the UK PM Equivalence Trials and was shown to be equivalent without the need for correction factors [2]. Both reference method and Partisol were operating using Emfab filters, which deviates from the requirements of EN12341. The Partisol units operated in the AURN are done so with quartz filters (Whatman QMA weighed by Bureau Veritas) in order to comply with the requirements of EN12341. Currently, 8 sites monitor PM10 using Partisol 2025 units.
• Partisol 2025 (PM 2.5)
This was tested during summer 2007 for one dataset only [3]. As the PM2.5 Partisol is effectively a subset of the PM10 Partisol, and the latter was shown to be equivalent, The PM2.5 Partisol was expected to agree closely with the standard. In practice, results from the limited 2007 trial indicated that it underestimated PM2.5 concentrations. Artefacts attributed to low PM concentrations in the summer of 2007, and the problems associated with regression calculations where there is significant scatter on data that are restricted to within a narrow range were additionally understood to provide for confounding effects in this analysis. There are currently 8 units measuring PM2.5 in the AURN, and they are operated with Whatman QMA quartz filters weighed by Bureau Veritas.
• Met One Unheated Beta Attenuation Monitor (BAM) (PM 10)
This was tested in the UK PM Equivalence Trials [2] and was shown to be equivalent with the application of a slope correction factor. There are currently no Met One BAMs in the AURN.
2.3 Links with AQUILA and JRC
In order to provide and maintain consistency across Member States various organisations provide assurance on measurements made within the AURN, covering issues related to precision, bias and accuracy and traceability to primary national standards. Within the UK, this function is undertaken by the QA/QC unit, but additionally through organisations such as the National Physical Laboratory and AQUILA (the EU Network of Air Quality Reference Laboratories).
The European Reference Laboratory of Air Pollution (ERLAP) is responsible for the harmonization of air quality measurements across Member States in support of the current air quality directives. Quality assurance programmes are undertaken with the participation of national air quality reference laboratories. In the UK this function is taken by AEA and the National Physical Laboratory (NPL).
Meetings of ERLAP are normally held at the European Commission’s Joint Research Centre (JRC) located at Ispra, Italy. Upon attendance at meetings, both NPL and AEA are tasked with informing Defra and the devolved administrations of any issues that may have consequences for the operation of the AURN. CMCU has previously attended AQUILA programme meeting at the Joint Research Council (JRC) premises in Ispra in May 2007 related to the monitoring of particulate matter for compliance against the EU Directives. The outcome of our work on the “UK Particulate Matter Equivalence Programme (2006)” was discussed by the Department’s representative.
The JRC are currently running an inter-comparison of Member State routine network PM measurements against reference PM methods operated by the JRC within mobile laboratory facility. This programme covers all Member States of the EU and hence, will take several years to complete. The exercise in the UK was undertaken at the Port Talbot AURN site during the period 21 April to 16 May 2008.
The JRC ran the following PM monitoring equipment: • Two PM10 sequential samplers (quartz Whatman QMA, 47 mm filters weighed by JRC); • Topas LAP 320 aerosol particle size spectrometer counting particles >300nm; • Sunset instruments semi continuous EC/OC analyzer (hourly values); • One PM2.5 sequential sampler (quartz Whatman QMA, 47 mm filters weighed by JRC); • Two PM1 sequential sampler (quartz Whatman QMA, 47 mm filters weighed by JRC) • PM10 FDMS Type B instrument.
Analysis of Trends in Gravimetric Particulate Mass Measurements in the UK
Ref: Bureau Veritas/AQ/AGG06801/RM/2543 Bureau Veritas UK Ltd 6
The routine AURN PM monitors at Port Talbot are: • PM10: FDMS Type C PM10; • PM2.5: Partisol PM2.5 (quartz filter weighed by Bureau Veritas Laboratories).
However, to obtain additional value from the exercise the following additional equipment was operated by Bureau Veritas and AEA:
• PM2.5 FDMS Type C; • Partisol PM10 (quartz filter weighed by Bureau Veritas Laboratories); • Partisol PM10 (Emfab filter weighed by Bureau Veritas Laboratories); • Partisol PM2.5 (Emfab filter weighed by Bureau Veritas Laboratories); • Partisol PM10 (Emfab filter weighed by AEA).
Although this inter-comparison is necessarily of limited duration we anticipate that once the results are analysed, it will provide considerable additional information on the PM monitoring practices and procedures in the UK.
Analysis of Trends in Gravimetric Particulate Mass Measurements in the UK
Ref: Bureau Veritas/AQ/AGG06801/RM/2543 Bureau Veritas UK Ltd 7
3 Trends in Gravimetric Particulate Matter: Emissio ns and Concentrations 2000 – 2007
This chapter provides an overview of the current analysis of PM trends in relation to both emissions and in relation to measured PM concentrations. Gravimetric filter based measurements provide for the focus of attention in relation to the latter, in order to highlight the apparent discrepancies between anticipated improvements in PM concentrations when compared to the trends in emissions.
3.1 Emissions of particulate matter in the UK
Particulate matter is directly emitted from many sources and is referred to as primary PM. However, chemical reactions in the atmosphere result in the formation of additional – secondary – PM giving rise to a wide variability in PM composition at local, regional and national levels. This provides for significant challenges in monitoring where uncertainty, precision and accuracy of monitoring methods are paramount for the reporting of robust data against legally binding standards.
The UK’s National Atmospheric Emissions Inventory (NAEI) currently estimates that 152 kilotonnes of PM10 were emitted in 2006 [4,5]. There is no single over-riding source of PM, though road transport is a major emitter, responsible for around 22 % of UK emissions of PM10 in 2006. Other significant sources are domestic combustion, electricity generation and industrial combustion, various industrial processes involving mineral products and agriculture.
Due to technological measures to control emissions from road vehicles and industry processes driven by tighter emissions legislation and fuel switching from solid fuels to gas, PM emissions in the UK have been on a steady decline since 1980. Nationally, emissions of PM10 are estimated to have declined by 18% since 2000. A similar trend is apparent for the finer PM size fractions; emissions of PM2.5 are estimated to have declined by 14 % since 2000. Road transport makes a larger contribution to emissions of the finer PM size fraction. Its contribution rises from 22 % for PM10 to 27 % for PM2.5 and 44 % for PM0.1.
In most urban areas, road transport is likely to be the most dominant source of directly emitted PM, except possibly in areas where there is a significant amount of solid fuel burning, construction or other activities of a dusty nature. PM is emitted directly from vehicle exhausts as a consequence of incomplete fuel combustion and burning of engine lubricants, but there are also significant amounts of PM emitted to air though mechanical processes such as wear of tyre material, brake and clutch pads and road surface and through re-suspension of already deposited road dust.
Emissions of PM from vehicle exhausts are dominated by diesel vehicles, but over the last 15 years diesel engine emissions have been regulated by increasingly strict European emission standards for PM. For example, a diesel car purchased in 2008 has to meet Euro 4 standards where limit values for PM are 82 % lower than for a new car purchased between 1993 and 1996 meeting Euro 1 standards. Table 3.1 shows the trend in PM urban exhaust emission factors in mg/km for successive Euro standards for different vehicle types. The reductions in emissions have been achieved through improved engine technology and fuel systems, improvements in the quality of diesel fuel (for example reductions in the sulphur content) and more recently by the introduction of exhaust after treatment systems such as oxidation catalysts and, more recently, diesel particulate filters.
As a consequence of the penetration of cleaner diesel vehicles (cars, vans and heavy duty vehicles) into the UK fleet and the retirement of older, high emitting vehicles, exhaust emissions of PM from road transport in urban areas have, overall, been declining in spite of the growth in traffic levels and the increased dieselisation of the car fleet. This can be seen in Figure 3.1 which shows urban PM exhaust emissions by vehicle type from the period 2000 to 2006 taken from the latest inventory. It indicates a 26 % reduction in urban exhaust PM
Analysis of Trends in Gravimetric Particulate Mass Measurements in the UK
Ref: Bureau Veritas/AQ/AGG06801/RM/2543 Bureau Veritas UK Ltd 8
emissions over this period. The figure also demonstrates the increasing importance of diesel vans and cars as contributors of urban PM emissions; these were responsible for 78 % of urban exhaust PM emissions in 2006. Diesel vans (LGVs) are the single largest contributor responsible for 49 % of exhaust emissions.
Table 3.1 PM exhaust emission factors in mg PM/km.
Exhaust Tyre & brake Exhaust Tyre & brakepre-Euro I 24 20 Pre-1988 890 72
Euro 1 3 20 88/77/EEC 426 72Euro 2 1 20 Euro I 220 72Euro 3 1 20 Euro II 153 72Euro 4 1 20 Euro III 111 72Euro 5 1 20 Euro IV 25 72
Euro V 25 72
Exhaust Tyre & brake Exhaust Tyre & brakepre-Euro I 154 20 Pre-1988 714 98
Euro 1 57 20 88/77/EEC 626 98Euro 2 51 20 Euro I 577 98Euro 3 32 20 Euro II 399 98Euro 4 17 20 Euro III 288 98Euro 5 2 20 Euro IV 64 98Euro 6 2 20 Euro V 64 98
Exhaust Tyre & brake Exhaust Tyre & brakepre-Euro I 287 32 Pre-1988 1416 75
Euro 1 80 32 88/77/EEC 614 75Euro 2 82 32 Euro I 311 75Euro 3 57 32 Euro II 203 75Euro 4 37 32 Euro III 147 75Euro 5 4 32 Euro IV 44 75Euro 6 4 32 Euro V 44 75
Diesel LGV Buses
Artic HGVsDiesel cars
Petrol cars Rigid HGVs
Figure 3.1 Urban UK exhaust emissions of PM 10 from road transport
0
2
4
6
8
10
12
14
16
18
2000 2001 2002 2003 2004 2005 2006
PM
10 e
mis
sion
s (k
t)
MotorcyclesBusesHGVsLGVsDiesel carPetrol car
Analysis of Trends in Gravimetric Particulate Mass Measurements in the UK
Ref: Bureau Veritas/AQ/AGG06801/RM/2543 Bureau Veritas UK Ltd 9
Current projections suggest the decline in urban exhaust emissions will continue; a further 27% reduction is anticipated between 2006 and 2010 due to the continued penetration of cleaner vehicles in the fleet offsetting the growth in traffic.
The decline in exhaust emissions from vehicles due to legislation has started to raise the importance of non-exhaust, mechanical sources of PM from traffic. The NAEI includes estimates of emissions from tyre wear and brake wear, but as yet does not include emissions from road surface wear. Emission factors for combined tyre and brake wear under urban traffic conditions can also be found in Table 3.1. This shows quite clearly how the emission factors for these sources were once relatively small compared with exhaust emissions from older generation diesel vehicles, but are now becoming similar or even larger than exhaust emission factors for more modern vehicles. A detailed description of the emission factors used in the NAEI and the effectiveness of abatement technologies for exhaust emission control can be found in AQEG (2005) [6].
Because emissions from tyre and brake wear cannot presently be controlled, their emissions have been steadily increasing as traffic levels have increased. In urban areas, tyre and brake wear emissions have increased by 4.5 % from 2000 to 2006 and are now 55% of exhaust emissions of PM10.
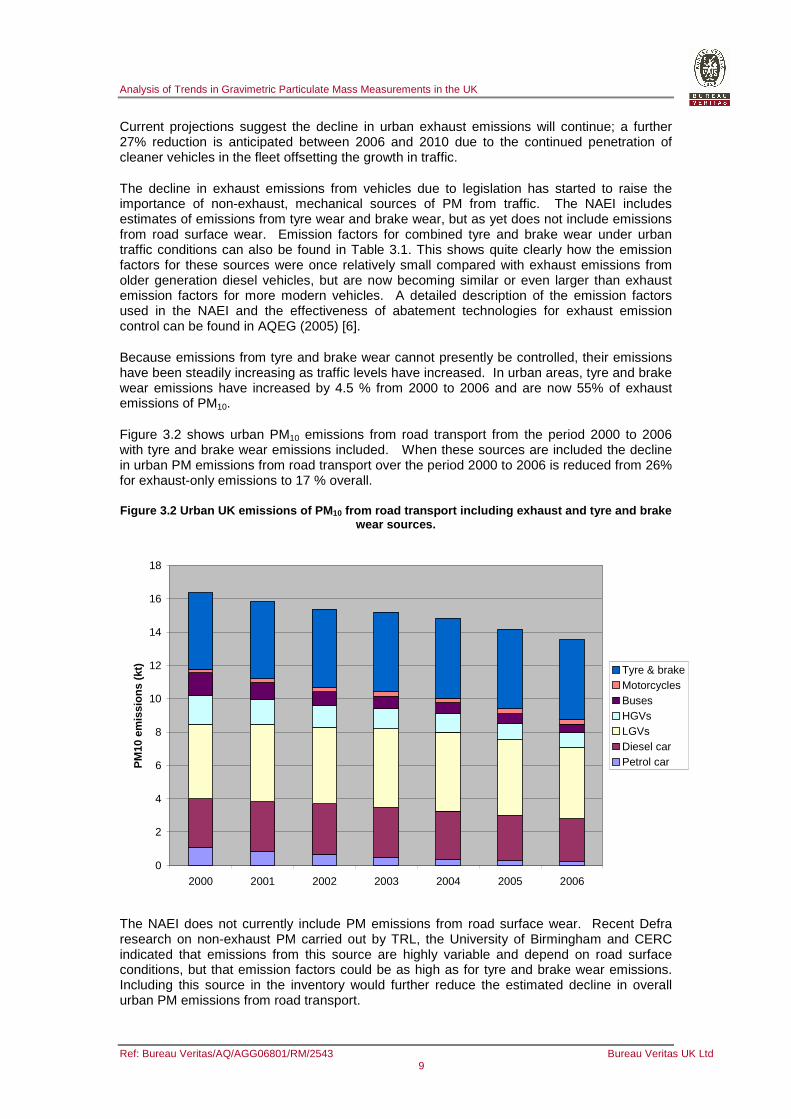
Figure 3.2 shows urban PM10 emissions from road transport from the period 2000 to 2006 with tyre and brake wear emissions included. When these sources are included the decline in urban PM emissions from road transport over the period 2000 to 2006 is reduced from 26% for exhaust-only emissions to 17 % overall.
Figure 3.2 Urban UK emissions of PM 10 from road transport including exhaust and tyre and brake wear sources.
0
2
4
6
8
10
12
14
16
18
2000 2001 2002 2003 2004 2005 2006
PM
10 e
mis
sion
s (k
t) Tyre & brakeMotorcyclesBusesHGVsLGVsDiesel carPetrol car
The NAEI does not currently include PM emissions from road surface wear. Recent Defra research on non-exhaust PM carried out by TRL, the University of Birmingham and CERC indicated that emissions from this source are highly variable and depend on road surface conditions, but that emission factors could be as high as for tyre and brake wear emissions. Including this source in the inventory would further reduce the estimated decline in overall urban PM emissions from road transport.
Analysis of Trends in Gravimetric Particulate Mass Measurements in the UK
Ref: Bureau Veritas/AQ/AGG06801/RM/2543 Bureau Veritas UK Ltd 10
Accounting for re-suspension as a source of non-exhaust PM in emission inventories is far more complex and this is another highly variable source. It may not be possible to represent re-suspension in terms of a simple emission factor and treated in a conventional emissions inventory approach, and instead may require a more sophisticated source apportionment modelling approach for a given receptor point. The Defra research led to implied emission factors for re-suspension by heavy duty and light duty vehicles by analysis of ambient monitoring data for the coarse PM fraction. The implied emission factors were much higher for heavy duty vehicles than for light duty vehicles and ranged from 1-140 mg/km. Including a re-suspension component to the non-exhaust PM emissions inventory on this basis would further reduce the estimated decline in urban PM emissions from traffic sources over the 2000 to 2006 period.
Finally, it should be pointed out that the PM emission trends described here are based on average urban road transport conditions. Any given location where ambient roadside PM data are monitored, analysed and interpreted will vary to different degrees from the urban UK average situation depending on local traffic conditions including the mix of vehicles such as proportion of cars, vans, HGVs, buses and taxis in the traffic flows, the petrol/diesel car mix, age and technology mix of vehicles (e.g. buses fitted with diesel particulate filters) and congestion. All these will vary around the country, and potentially with time of day and day of the week. Annual traffic levels over the time period from 2000 to 2006 will also have been changing at different rates around the country.
This means that emissions would have to be modelled using emission factors and activity data that reflect local conditions over the relevant period of time if trends in PM concentrations are to be truly interpreted in the context of primary PM emissions.
Beyond road traffic emissions of PM emissions arising as a result of industrial activities have been shown to be in decline as a result of tighter regulation. Consequently, over-riding factors in respect of overall trends in PM across the UK are those of the formation of secondary PM formation, which are dealt with through international agreements such as the National Emissions Ceiling Directive, the Large Combustion Plant Directive and the Solvent Emissions Directive to name but a few.
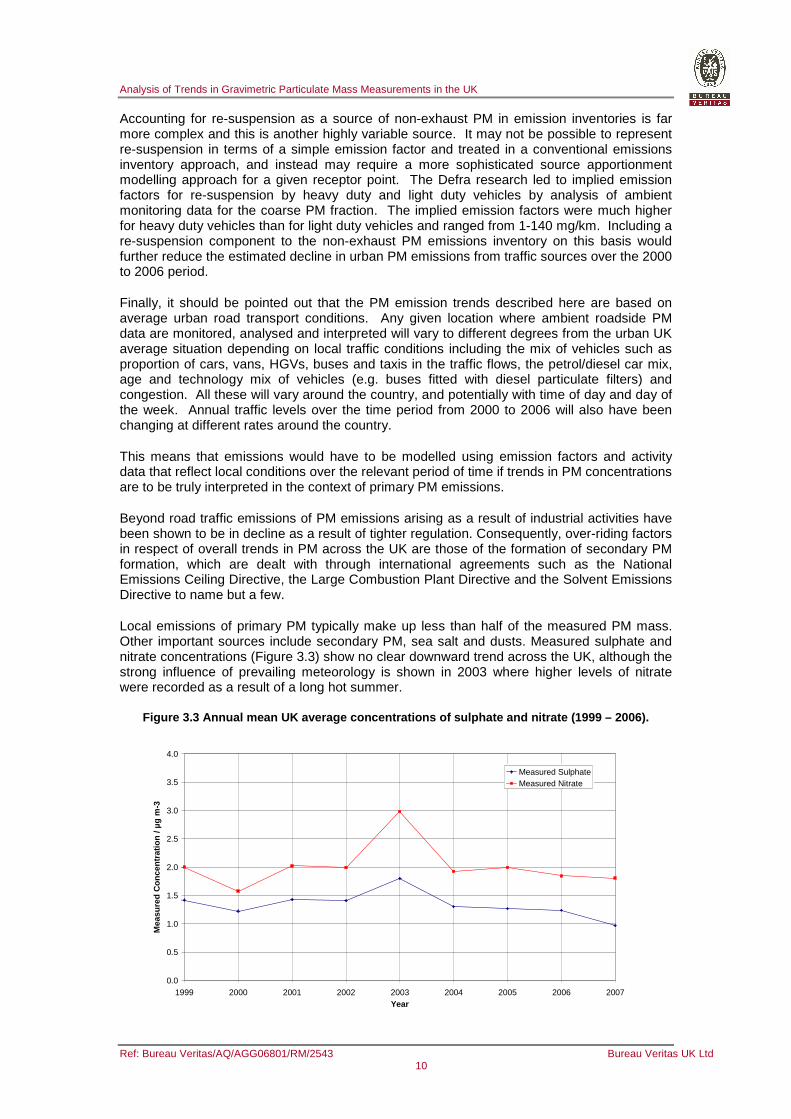
Local emissions of primary PM typically make up less than half of the measured PM mass. Other important sources include secondary PM, sea salt and dusts. Measured sulphate and nitrate concentrations (Figure 3.3) show no clear downward trend across the UK, although the strong influence of prevailing meteorology is shown in 2003 where higher levels of nitrate were recorded as a result of a long hot summer.
Figure 3.3 Annual mean UK average concentrations of sulphate and nitrate (1999 – 2006).
0.0
0.5
1.0
1.5
2.0
2.5
3.0
3.5
4.0
1999 2000 2001 2002 2003 2004 2005 2006 2007Year
Mea
sure
d C
once
ntra
tion
/ µg
m-3
Measured SulphateMeasured Nitrate
Analysis of Trends in Gravimetric Particulate Mass Measurements in the UK
Ref: Bureau Veritas/AQ/AGG06801/RM/2543 Bureau Veritas UK Ltd 11
3.2 Trends in ambient PM 10 and PM2.5 concentrations
Long-term data sets on pollutant occurrence provide a means of measuring the success of national and international policy measures aimed at improving the quality of the air we breathe (Appendix A). Gravimetric monitoring for PM has now been undertaken in the UK for some 7 years (not at all sites), which provides for a means of assessing the likely extent to which existing policy measures may need to be reviewed.
The methods employed within the AURN have been reviewed in earlier sections. TEOMs are deployed widely; however, consideration of trends with this instrument should be treated with caution, as they are known to underestimate concentrations by a varied amount due to the loss of volatile species. Many TEOMs within the AURN have been / are undergoing conversion to FDMS; however, there are currently insufficient data to consider annual trends in detail. However, the collocation of FDMS instruments with gravimetric samplers has proved useful in relation to highlighting discrepancies in filter-based measurements, reported in the next chapter.
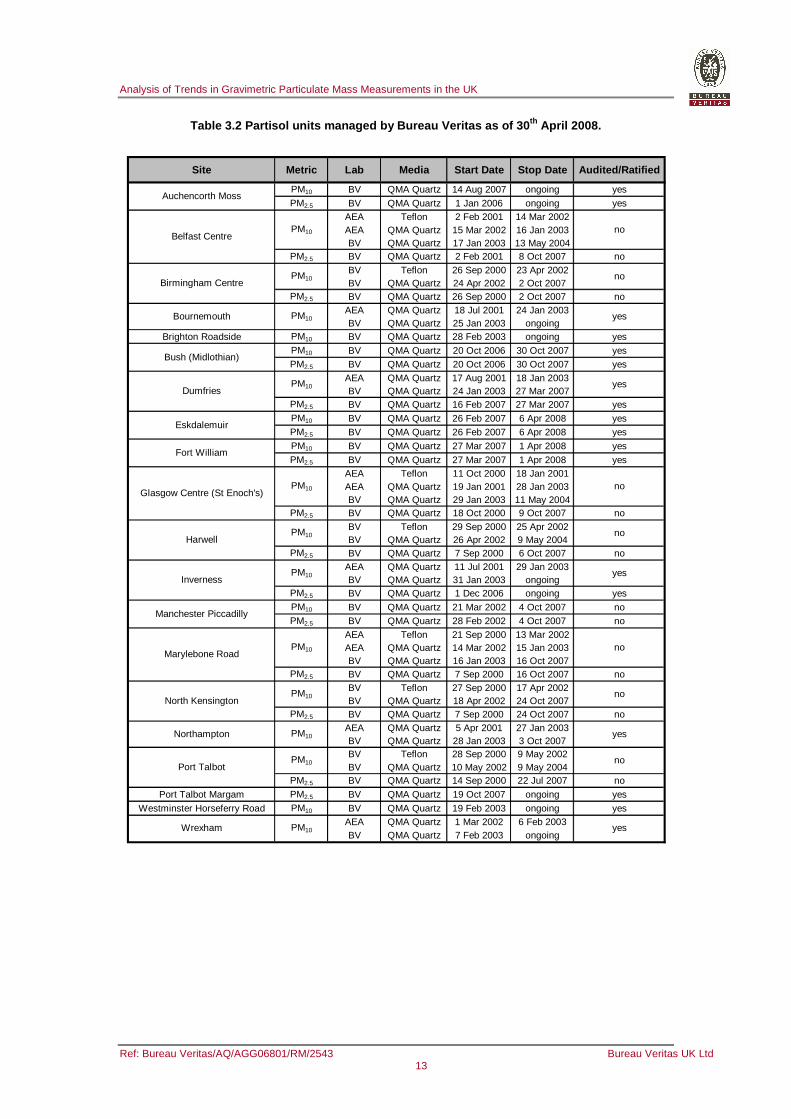
Table 3.2 shows Partisol units operated by Bureau Veritas as of 30th April 2008. PM10 Partisol 2025 units have been introduced in to the AURN since 2000 at Bournemouth, Brighton, Dumfries, Northampton, Port Talbot, Westminster and Wrexham. Prior to early 2003, these instruments were operated using Whatman QMA filters weighed by AEA, before switching to the same filter media weighed BV Laboratories. In 2006 an EMEP site was set up in Auchencorth Moss, near Edinburgh, and the Partisols at this site are incorporated in to the AURN. Partisols within the AURN are audited and the data are ratified, both by AEA, and all of these data have been uploaded on to airquality.co.uk.
A further network of Partisols were also running from 2000, and were introduced as part of a research project [7]. PM10 and PM2.5 instruments were installed at Belfast, Birmingham, Glasgow Centre, Harwell, Manchester Piccadilly, London Marylebone Road, London North Kensington, and Port Talbot. The PM10 Partisols were originally operating using Teflon filters weighed either by AEA or BV as a requirement of the biological assay work on PM required to fulfil the needs of the (then) research programme. The PM2.5 Partisols have always operated using Whatman QMA filters, but they were in some cases originally weighed by AEA. Since early 2003, all 16 of these instruments have operated on Whatman QMA filters as weighed by BV. Four of the PM10 Partisols were removed in 2004, and the remaining 12 PM10 and PM2.5 instruments were switched off in 2007. Regardless of the laboratory or media, all the provisional data have been uploaded on to airquality.co.uk, but it should be noted that Teflon data do not form part of the reference method in EN12341. These instruments have not been audited nor the data ratified.
A network of Scottish sites was introduced in order to collect one years worth of data using both PM10 and PM2.5 instruments at Bush, Eskdalemuir and Fort William, and the addition of PM2.5 Partisols to the existing sites at Inverness and Dumfries. These Partisols are not part of the AURN, but have been operated in an identical manner and have been audited by AEA. It is therefore proposed that these data will be corrected following the procedure recommended in this report and uploaded to the Scottish Air Quality Database at www.scottishairquality.co.uk.
Moving forward, new contracts were issued for the CMCU and QAQC of the AURN beginning April 2008, and this has lead to a reorganization of the Partisols network, and the requirement that all instruments will be incorporated in to the AURN and, as such, audited and the data ratified, both by AEA. In October 2007, the PM2.5 Port Talbot Partisol was relocated to a new site. The four Partisols at Marylebone Road and North Kensington were re-activated in May 2008. Brighton Roadside was relocated to Preston Park and converted to PM2.5 on 20th May 2008. Harwell PM2.5 and PM10 were reinstated in July and September 2008 respectively. Northampton was re-activated and converted to PM2.5, in September 2008 Glasgow Centre and Glasgow Kerbside are due to return from October 2008 onwards. Westminster and
Analysis of Trends in Gravimetric Particulate Mass Measurements in the UK
Ref: Bureau Veritas/AQ/AGG06801/RM/2543 Bureau Veritas UK Ltd 12
Bournemouth are due to be converted to PM2.5 at the beginning of 2009. Wrexham will have a co-located PM2.5 Partisol installed in late 2008.
In order to provide for consistency in comparison in trends analysis it is important that such differences are considered. Consequently, for the purposes of this report concentrations are only considered if the filters were Whatman QMA Quartz filters weighed by Bureau Veritas Laboratories (and the previous names under which these laboratories have traded).
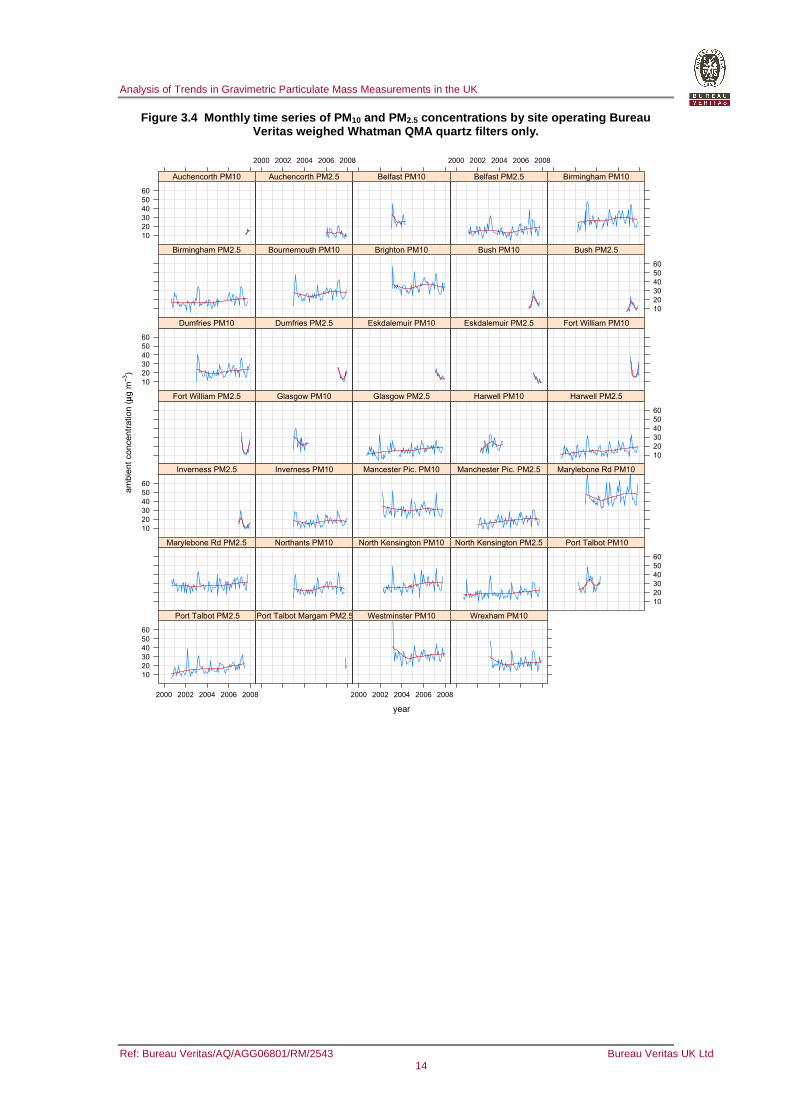
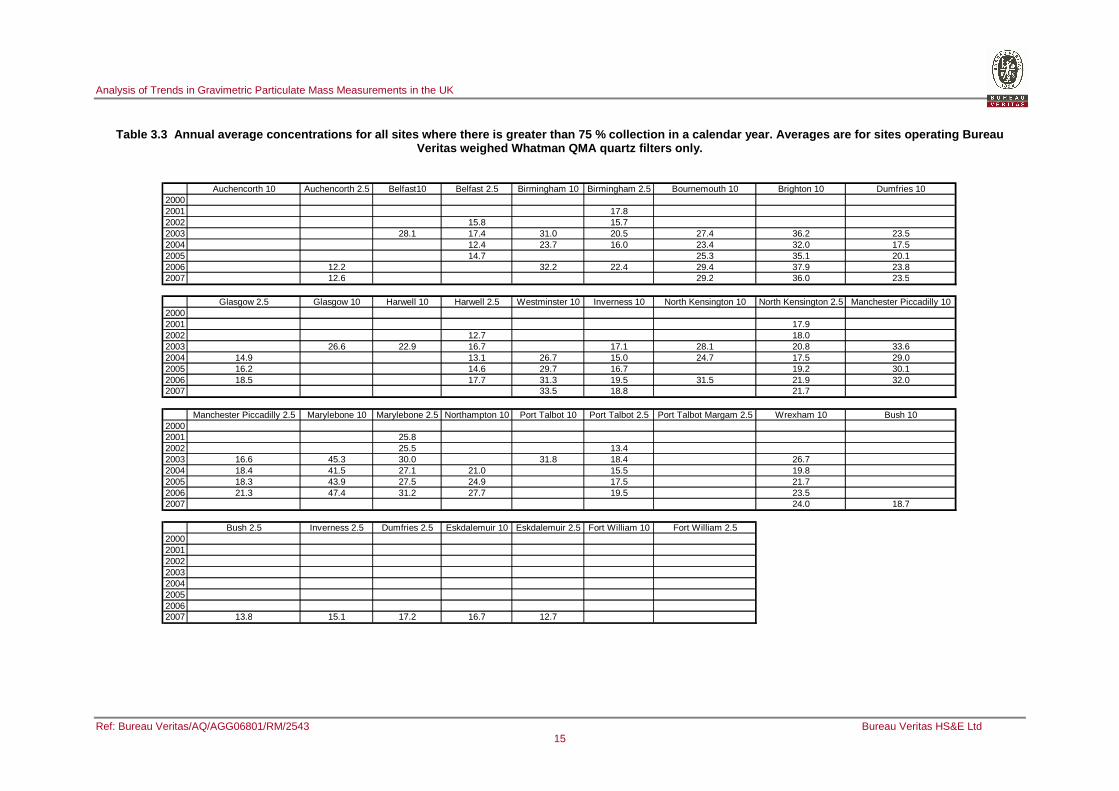
Figure 3.2 shows the trends in monthly averaged ambient PM10 and PM2.5 concentrations as measured by Partisol units operating with Whatman QMA quartz filters weighed by BV for varying periods since 2000. Table 3.3 shows the valid annual average concentrations for all sites. A valid annual average is taken as at least 75 % data capture for the year. Many sites were discontinued in 2007, limiting the number of valid data for this year.
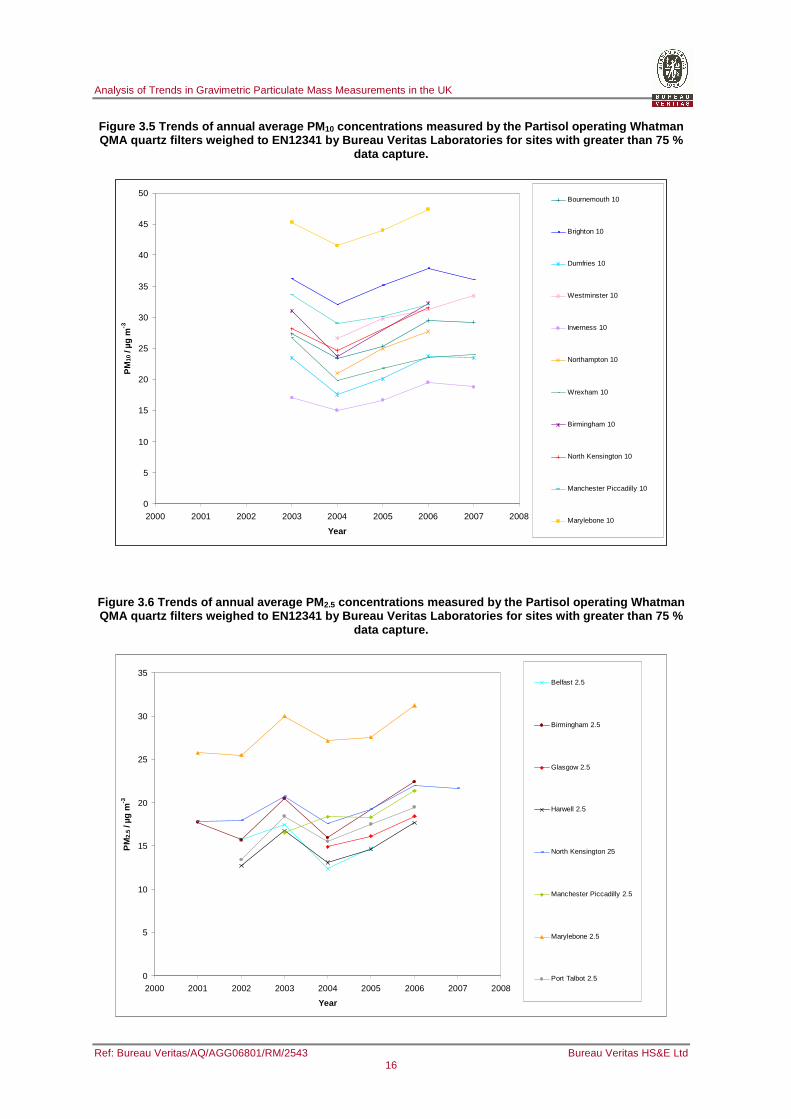
Figure 3.5 and Figure 3.6 show the trends in PM10 and PM2.5.
Specific issues to note are: • 2003 is generally accepted to be an unusually high pollution year, and should be treated
with caution. • During 2007, relatively low levels of PM were experienced due to the dominance of low
pressure and persistent rainfall over the UK. This weather event could explain the reduced concentrations observed in 2007. However, Westminster experienced rising concentrations during 2007. The only other London instrument to still be running for greater than 75 % of 2007 was the North Kensington PM2.5, which shows falling concentrations for 2007 (Data available for first 9 months of 2007 only).
Overall, the analysis of data acquired over the period 2001 - 2007 at various sites across the UK indicates that, for gravimetric measurements made by Partisol 2025, there is an increasing trend in PM mass concentrations. The increase in mass is most notable in recent years, which provides for a focal point of further attention in the following in-depth analysis of the trends reported here.
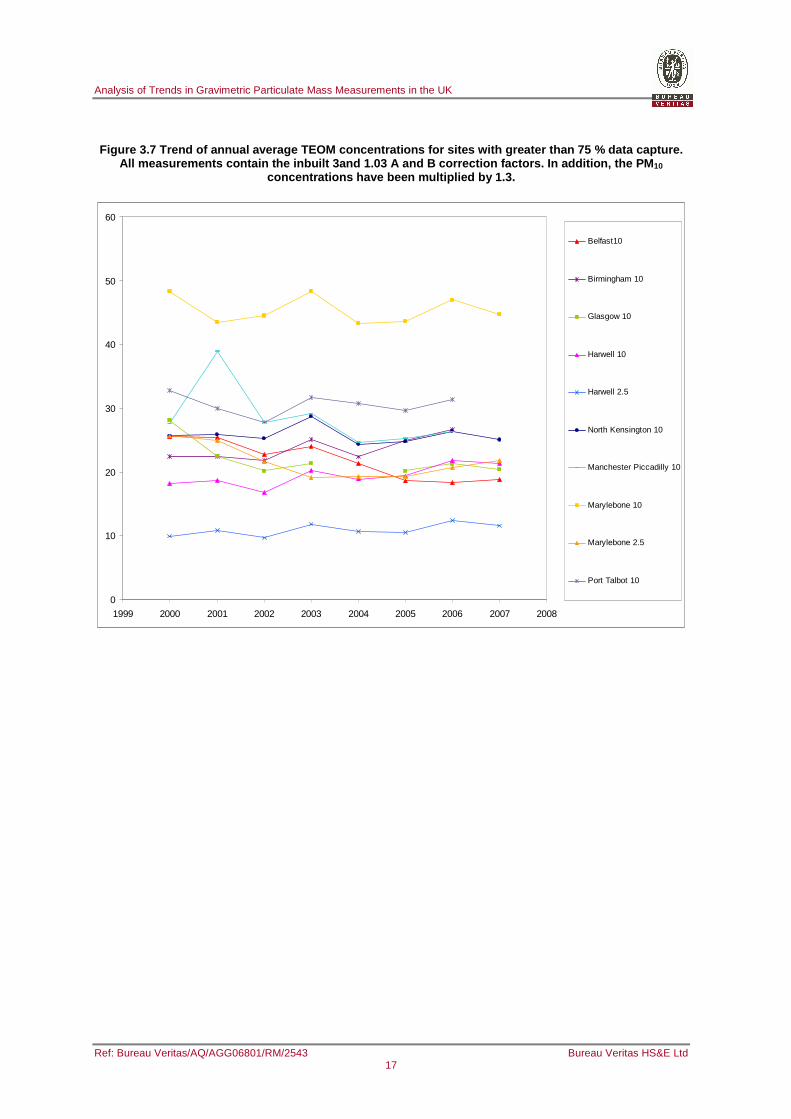
Figure 3.7 shows the trends for the same sites where TEOMs are collocated. It is noted that concentrations are much more level than those observed for the Partisols. This indicates either that there are increasing concentrations of volatile species (not seen in Figure 3.3), or that there is a problem with the Partisol data. This discrepancy is discussed in detail in the following Section.
Analysis of Trends in Gravimetric Particulate Mass Measurements in the UK
Ref: Bureau Veritas/AQ/AGG06801/RM/2543 Bureau Veritas UK Ltd 13
Table 3.2 Partisol units managed by Bureau Veritas as of 30 th April 2008.
Site Metric Lab Media Start Date Stop Date Audited/Ratifi ed
PM10 BV QMA Quartz 14 Aug 2007 ongoing yesPM2.5 BV QMA Quartz 1 Jan 2006 ongoing yes
AEA Teflon 2 Feb 2001 14 Mar 2002AEA QMA Quartz 15 Mar 2002 16 Jan 2003BV QMA Quartz 17 Jan 2003 13 May 2004
PM2.5 BV QMA Quartz 2 Feb 2001 8 Oct 2007 noBV Teflon 26 Sep 2000 23 Apr 2002BV QMA Quartz 24 Apr 2002 2 Oct 2007
PM2.5 BV QMA Quartz 26 Sep 2000 2 Oct 2007 noAEA QMA Quartz 18 Jul 2001 24 Jan 2003BV QMA Quartz 25 Jan 2003 ongoing
Brighton Roadside PM10 BV QMA Quartz 28 Feb 2003 ongoing yesPM10 BV QMA Quartz 20 Oct 2006 30 Oct 2007 yesPM2.5 BV QMA Quartz 20 Oct 2006 30 Oct 2007 yes
AEA QMA Quartz 17 Aug 2001 18 Jan 2003BV QMA Quartz 24 Jan 2003 27 Mar 2007
PM2.5 BV QMA Quartz 16 Feb 2007 27 Mar 2007 yesPM10 BV QMA Quartz 26 Feb 2007 6 Apr 2008 yesPM2.5 BV QMA Quartz 26 Feb 2007 6 Apr 2008 yesPM10 BV QMA Quartz 27 Mar 2007 1 Apr 2008 yesPM2.5 BV QMA Quartz 27 Mar 2007 1 Apr 2008 yes
AEA Teflon 11 Oct 2000 18 Jan 2001AEA QMA Quartz 19 Jan 2001 28 Jan 2003BV QMA Quartz 29 Jan 2003 11 May 2004
PM2.5 BV QMA Quartz 18 Oct 2000 9 Oct 2007 noBV Teflon 29 Sep 2000 25 Apr 2002BV QMA Quartz 26 Apr 2002 9 May 2004
PM2.5 BV QMA Quartz 7 Sep 2000 6 Oct 2007 noAEA QMA Quartz 11 Jul 2001 29 Jan 2003BV QMA Quartz 31 Jan 2003 ongoing
PM2.5 BV QMA Quartz 1 Dec 2006 ongoing yesPM10 BV QMA Quartz 21 Mar 2002 4 Oct 2007 noPM2.5 BV QMA Quartz 28 Feb 2002 4 Oct 2007 no
AEA Teflon 21 Sep 2000 13 Mar 2002AEA QMA Quartz 14 Mar 2002 15 Jan 2003BV QMA Quartz 16 Jan 2003 16 Oct 2007
PM2.5 BV QMA Quartz 7 Sep 2000 16 Oct 2007 noBV Teflon 27 Sep 2000 17 Apr 2002BV QMA Quartz 18 Apr 2002 24 Oct 2007
PM2.5 BV QMA Quartz 7 Sep 2000 24 Oct 2007 noAEA QMA Quartz 5 Apr 2001 27 Jan 2003BV QMA Quartz 28 Jan 2003 3 Oct 2007BV Teflon 28 Sep 2000 9 May 2002BV QMA Quartz 10 May 2002 9 May 2004
PM2.5 BV QMA Quartz 14 Sep 2000 22 Jul 2007 no
Port Talbot Margam PM2.5 BV QMA Quartz 19 Oct 2007 ongoing yes
Westminster Horseferry Road PM10 BV QMA Quartz 19 Feb 2003 ongoing yesAEA QMA Quartz 1 Mar 2002 6 Feb 2003BV QMA Quartz 7 Feb 2003 ongoing
yes
no
no
yes
no
PM10
PM10
PM10
no
no
yes
yes
no
no
yes
Wrexham
PM10
PM10
PM10
PM10
PM10
PM10
PM10
PM10
PM10
Marylebone Road
North Kensington
Northampton
Port Talbot
Glasgow Centre (St Enoch's)
Harwell
Inverness
Manchester Piccadilly
Bush (Midlothian)
Dumfries
Eskdalemuir
Fort William
Auchencorth Moss
Belfast Centre
Birmingham Centre
Bournemouth
Analysis of Trends in Gravimetric Particulate Mass Measurements in the UK
Ref: Bureau Veritas/AQ/AGG06801/RM/2543 Bureau Veritas UK Ltd 14
Figure 3.4 Monthly time series of PM 10 and PM2.5 concentrations by site operating Bureau Veritas weighed Whatman QMA quartz filters only.
year
am
bie
nt
co
nce
ntr
atio
n (
µµg
m−−3)
10
20
30
40
50
60
Auchencorth PM10
2000 2002 2004 2006 2008
Auchencorth PM2.5 Belfast PM10
2000 2002 2004 2006 2008
Belfast PM2.5 Birmingham PM10
Birmingham PM2.5 Bournemouth PM10 Brighton PM10 Bush PM10
10
20
30
40
50
60
Bush PM2.5
10
20
30
40
50
60
Dumfries PM10 Dumfries PM2.5 Eskdalemuir PM10 Eskdalemuir PM2.5 Fort William PM10
Fort William PM2.5 Glasgow PM10 Glasgow PM2.5 Harwell PM10
10
20
30
40
50
60
Harwell PM2.5
10
20
30
40
50
60
Inverness PM2.5 Inverness PM10 Mancester Pic. PM10 Manchester Pic. PM2.5 Marylebone Rd PM10
Marylebone Rd PM2.5 Northants PM10 North Kensington PM10 North Kensington PM2.5
10
20
30
40
50
60
Port Talbot PM10
10
20
30
40
50
60
2000 2002 2004 2006 2008
Port Talbot PM2.5 Port Talbot Margam PM2.5
2000 2002 2004 2006 2008
Westminster PM10 Wrexham PM10
Analysis of Trends in Gravimetric Particulate Mass Measurements in the UK
Ref: Bureau Veritas/AQ/AGG06801/RM/2543 Bureau Veritas HS&E Ltd 15
Table 3.3 Annual average concentrations for all si tes where there is greater than 75 % collection in a calendar year. Averages are for sites operating B ureau Veritas weighed Whatman QMA quartz filters only.
Auchencorth 10 Auchencorth 2.5 Belfast10 Belfast 2.5 Birmingham 10 Birmingham 2.5 Bournemouth 10 Brighton 10 Dumfries 1020002001 17.82002 15.8 15.72003 28.1 17.4 31.0 20.5 27.4 36.2 23.52004 12.4 23.7 16.0 23.4 32.0 17.52005 14.7 25.3 35.1 20.12006 12.2 32.2 22.4 29.4 37.9 23.82007 12.6 29.2 36.0 23.5
Glasgow 2.5 Glasgow 10 Harwell 10 Harwell 2.5 Westminster 10 Inverness 10 North Kensington 10 North Kensington 2.5 Manchester Piccadilly 1020002001 17.92002 12.7 18.02003 26.6 22.9 16.7 17.1 28.1 20.8 33.62004 14.9 13.1 26.7 15.0 24.7 17.5 29.02005 16.2 14.6 29.7 16.7 19.2 30.12006 18.5 17.7 31.3 19.5 31.5 21.9 32.02007 33.5 18.8 21.7
Manchester Piccadilly 2.5 Marylebone 10 Marylebone 2.5 Northampton 10 Port Talbot 10 Port Talbot 2.5 Port Talbot Margam 2.5 Wrexham 10 Bush 1020002001 25.82002 25.5 13.42003 16.6 45.3 30.0 31.8 18.4 26.72004 18.4 41.5 27.1 21.0 15.5 19.82005 18.3 43.9 27.5 24.9 17.5 21.72006 21.3 47.4 31.2 27.7 19.5 23.52007 24.0 18.7
Bush 2.5 Inverness 2.5 Dumfries 2.5 Eskdalemuir 10 Eskdalemuir 2.5 Fort William 10 Fort William 2.520002001200220032004200520062007 13.8 15.1 17.2 16.7 12.7
Analysis of Trends in Gravimetric Particulate Mass Measurements in the UK
Ref: Bureau Veritas/AQ/AGG06801/RM/2543 Bureau Veritas HS&E Ltd 16
Figure 3.5 Trends of annual average PM 10 concentrations measured by the Partisol operating W hatman QMA quartz filters weighed to EN12341 by Bureau Verit as Laboratories for sites with greater than 75 %
data capture.
0
5
10
15
20
25
30
35
40
45
50
2000 2001 2002 2003 2004 2005 2006 2007 2008
Year
PM
10 /
µg m
-3
Bournemouth 10
Brighton 10
Dumfries 10
Westminster 10
Inverness 10
Northampton 10
Wrexham 10
Birmingham 10
North Kensington 10
Manchester Piccadilly 10
Marylebone 10
Figure 3.6 Trends of annual average PM 2.5 concentrations measured by the Partisol operating W hatman QMA quartz filters weighed to EN12341 by Bureau Verit as Laboratories for sites with greater than 75 %
data capture.
0
5
10
15
20
25
30
35
2000 2001 2002 2003 2004 2005 2006 2007 2008
Year
PM
2.5
/ µg
m-3
Belfast 2.5
Birmingham 2.5
Glasgow 2.5
Harwell 2.5
North Kensington 25
Manchester Piccadilly 2.5
Marylebone 2.5
Port Talbot 2.5
Analysis of Trends in Gravimetric Particulate Mass Measurements in the UK
Ref: Bureau Veritas/AQ/AGG06801/RM/2543 Bureau Veritas HS&E Ltd 17
Figure 3.7 Trend of annual average TEOM concentratio ns for sites with greater than 75 % data capture. All measurements contain the inbuilt 3and 1.03 A an d B correction factors. In addition, the PM 10
concentrations have been multiplied by 1.3.
0
10
20
30
40
50
60
1999 2000 2001 2002 2003 2004 2005 2006 2007 2008
Belfast10
Birmingham 10
Glasgow 10
Harwell 10
Harwell 2.5
North Kensington 10
Manchester Piccadilly 10
Marylebone 10
Marylebone 2.5
Port Talbot 10
Analysis of Trends in Gravimetric Particulate Mass Measurements in the UK
Ref: Bureau Veritas/AQ/AGG06801/RM/2543 Bureau Veritas HS&E Ltd 18
4 Analysis of Trends
In addition to the discrepancy between Partisol and TEOM data highlighted in the last Section, this section discusses evidence from a further three separate sources which suggest that Whatman QMA 47mm quartz filters weighed by Bureau Veritas Laboratories are reading higher than expected. A laboratory audit has been carried out in order to try to identify the cause of the overestimation and trend analysis has been used in order to try and identify the source of the problem
4.1 Evidence for the overestimation of gravimetric measurements
4.1.1 Partisol 2025, KFG and FDMS Ambient Data
The UK PM equivalence Trial tested several candidate methods against the EN12341 and EN14907 reference methods both operating with Emfab filters weighed to EN14907 by NPL. Two of the candidate methods tested included the PM10 Partisol 2025 (also with Emfab filters) and the PM10 FDMS B. In both cases, the slope of the candidate method against the reference method was very close to one (1.003 and 0.991 respectively), and the intercept was very close to zero (0.530 and 0.797 µg m-3 respectively). Such, the collocation of Partisols with FDMS and KFG instruments would be expected to yield similar agreement.
FDMS Type B instruments are collocated with Partisol 2025s at a number of sites throughout the UK including: Manchester Piccadilly; Birmingham Centre; London Marylebone Road and Auchencorth Moss. At all sites there is evidence that the Partisol is reading significantly higher than the FDMS B. This is most evident at Auchencorth Moss where ambient PM concentrations are low (Figure 4.1 below). The averages of the September 2007 data shown in Figure 4.1 is 11.2 µg m-3 for the PM10 Patrisol, and 3.8 µg m-3 for the PM10 FDMS (considering paired days only). Partisol 2025s operate quartz filters weighed to EN12341 weighed by Bureau Veritas laboratories. As the FDMS and Partisol comparable when Emfab filters were weighed to EN14907 by NPL during the equivalence trials, this would point to the filter media, weighing protocol or laboratory choice leading to an overestimation of concentrations. Blank correction was not employed in either methodology.
Figure 4.1 Comparison of PM 10 monitoring at Auchencorth.
0
5
10
15
20
01-Sep-07 06-Sep-07 11-Sep-07 16-Sep-07 21-Sep-07 26-Sep-07 01-Oct-07
Date
PM
10 /
µg m
-3
Partisol PM10 FDMS PM10
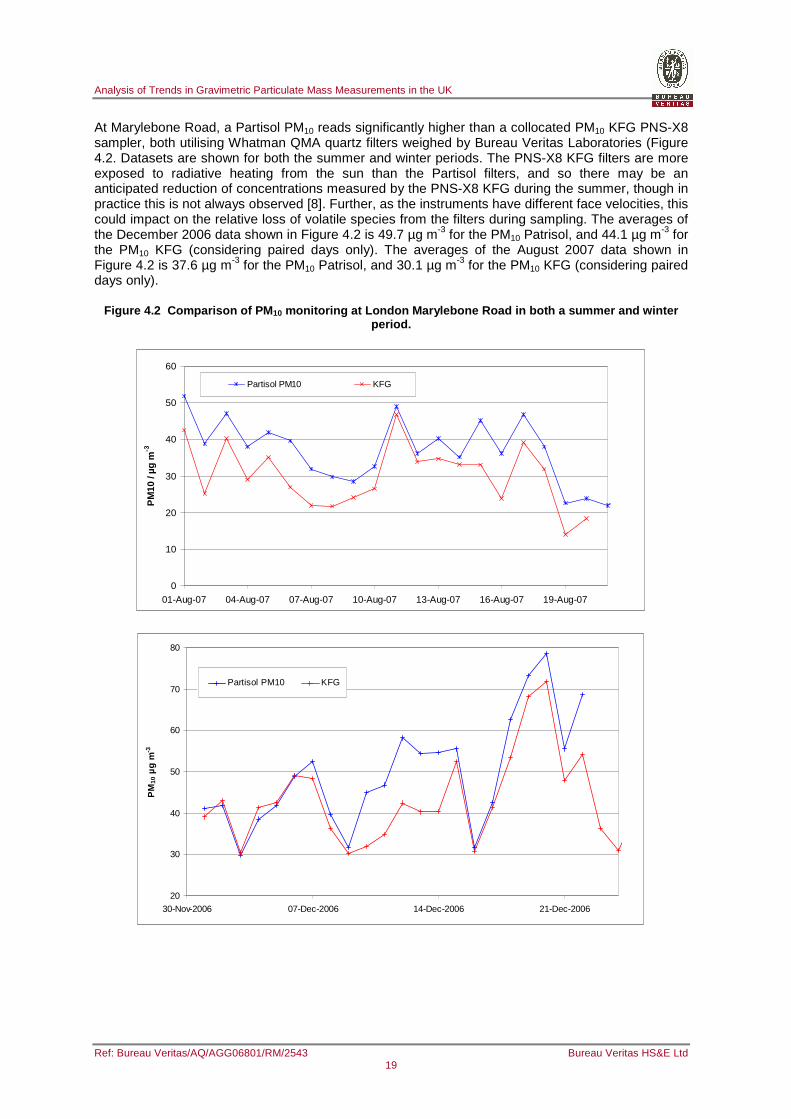
Analysis of Trends in Gravimetric Particulate Mass Measurements in the UK
Ref: Bureau Veritas/AQ/AGG06801/RM/2543 Bureau Veritas HS&E Ltd 19
At Marylebone Road, a Partisol PM10 reads significantly higher than a collocated PM10 KFG PNS-X8 sampler, both utilising Whatman QMA quartz filters weighed by Bureau Veritas Laboratories (Figure 4.2. Datasets are shown for both the summer and winter periods. The PNS-X8 KFG filters are more exposed to radiative heating from the sun than the Partisol filters, and so there may be an anticipated reduction of concentrations measured by the PNS-X8 KFG during the summer, though in practice this is not always observed [8]. Further, as the instruments have different face velocities, this could impact on the relative loss of volatile species from the filters during sampling. The averages of the December 2006 data shown in Figure 4.2 is 49.7 µg m-3 for the PM10 Patrisol, and 44.1 µg m-3 for the PM10 KFG (considering paired days only). The averages of the August 2007 data shown in Figure 4.2 is 37.6 µg m-3 for the PM10 Patrisol, and 30.1 µg m-3 for the PM10 KFG (considering paired days only).
Figure 4.2 Comparison of PM 10 monitoring at London Marylebone Road in both a sum mer and winter period.
0
10
20
30
40
50
60
01-Aug-07 04-Aug-07 07-Aug-07 10-Aug-07 13-Aug-07 16-Aug-07 19-Aug-07
PM
10 /
µg m
-3
Partisol PM10 KFG
20
30
40
50
60
70
80
30-Nov-2006 07-Dec-2006 14-Dec-2006 21-Dec-2006
PM
10 µ
g m
-3
Partisol PM10 KFG
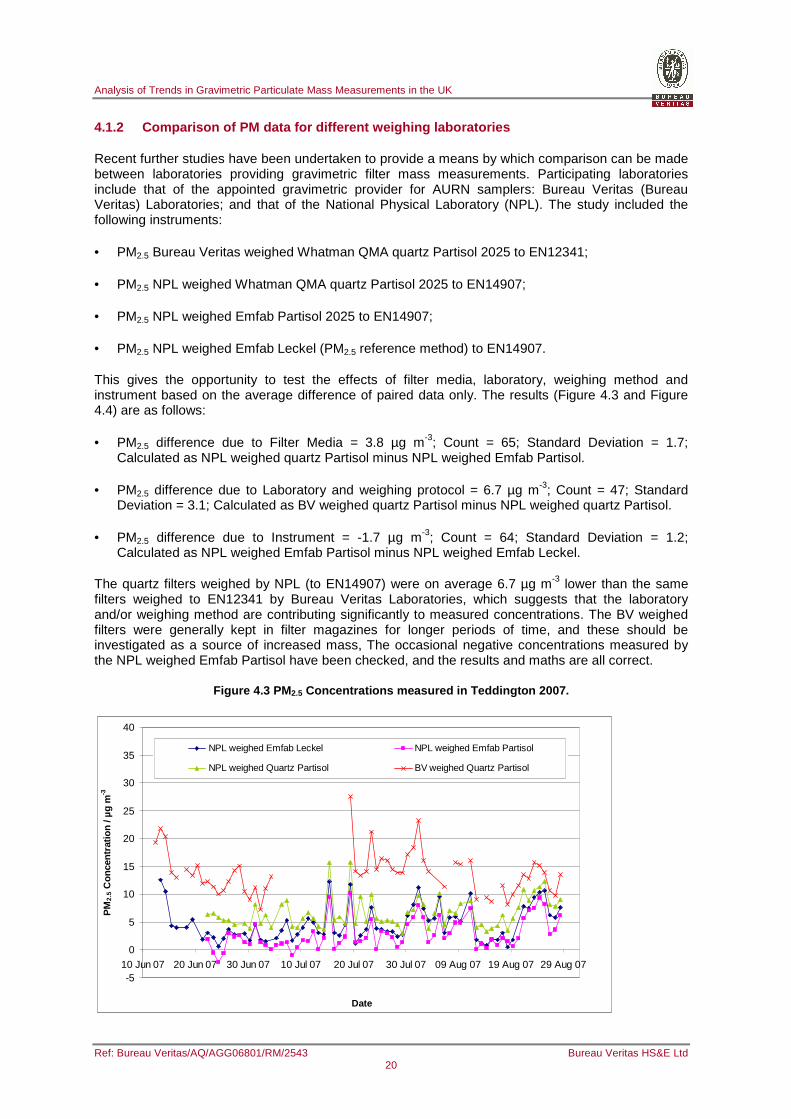
Analysis of Trends in Gravimetric Particulate Mass Measurements in the UK
Ref: Bureau Veritas/AQ/AGG06801/RM/2543 Bureau Veritas HS&E Ltd 20
4.1.2 Comparison of PM data for different weighing laboratories
Recent further studies have been undertaken to provide a means by which comparison can be made between laboratories providing gravimetric filter mass measurements. Participating laboratories include that of the appointed gravimetric provider for AURN samplers: Bureau Veritas (Bureau Veritas) Laboratories; and that of the National Physical Laboratory (NPL). The study included the following instruments:
• PM2.5 Bureau Veritas weighed Whatman QMA quartz Partisol 2025 to EN12341;
• PM2.5 NPL weighed Whatman QMA quartz Partisol 2025 to EN14907;
• PM2.5 NPL weighed Emfab Partisol 2025 to EN14907;
• PM2.5 NPL weighed Emfab Leckel (PM2.5 reference method) to EN14907.
This gives the opportunity to test the effects of filter media, laboratory, weighing method and instrument based on the average difference of paired data only. The results (Figure 4.3 and Figure 4.4) are as follows:
• PM2.5 difference due to Filter Media = 3.8 µg m-3; Count = 65; Standard Deviation = 1.7; Calculated as NPL weighed quartz Partisol minus NPL weighed Emfab Partisol.
• PM2.5 difference due to Laboratory and weighing protocol = 6.7 µg m-3; Count = 47; Standard Deviation = 3.1; Calculated as BV weighed quartz Partisol minus NPL weighed quartz Partisol.
• PM2.5 difference due to Instrument = -1.7 µg m-3; Count = 64; Standard Deviation = 1.2; Calculated as NPL weighed Emfab Partisol minus NPL weighed Emfab Leckel.
The quartz filters weighed by NPL (to EN14907) were on average 6.7 µg m-3 lower than the same filters weighed to EN12341 by Bureau Veritas Laboratories, which suggests that the laboratory and/or weighing method are contributing significantly to measured concentrations. The BV weighed filters were generally kept in filter magazines for longer periods of time, and these should be investigated as a source of increased mass, The occasional negative concentrations measured by the NPL weighed Emfab Partisol have been checked, and the results and maths are all correct.
Figure 4.3 PM 2.5 Concentrations measured in Teddington 2007.
-5
0
5
10
15
20
25
30
35
40
10 Jun 07 20 Jun 07 30 Jun 07 10 Jul 07 20 Jul 07 30 Jul 07 09 Aug 07 19 Aug 07 29 Aug 07
Date
PM
2.5
Con
cent
ratio
n / µ
g m
-3
NPL weighed Emfab Leckel NPL weighed Emfab Partisol
NPL weighed Quartz Partisol BV weighed Quartz Partisol
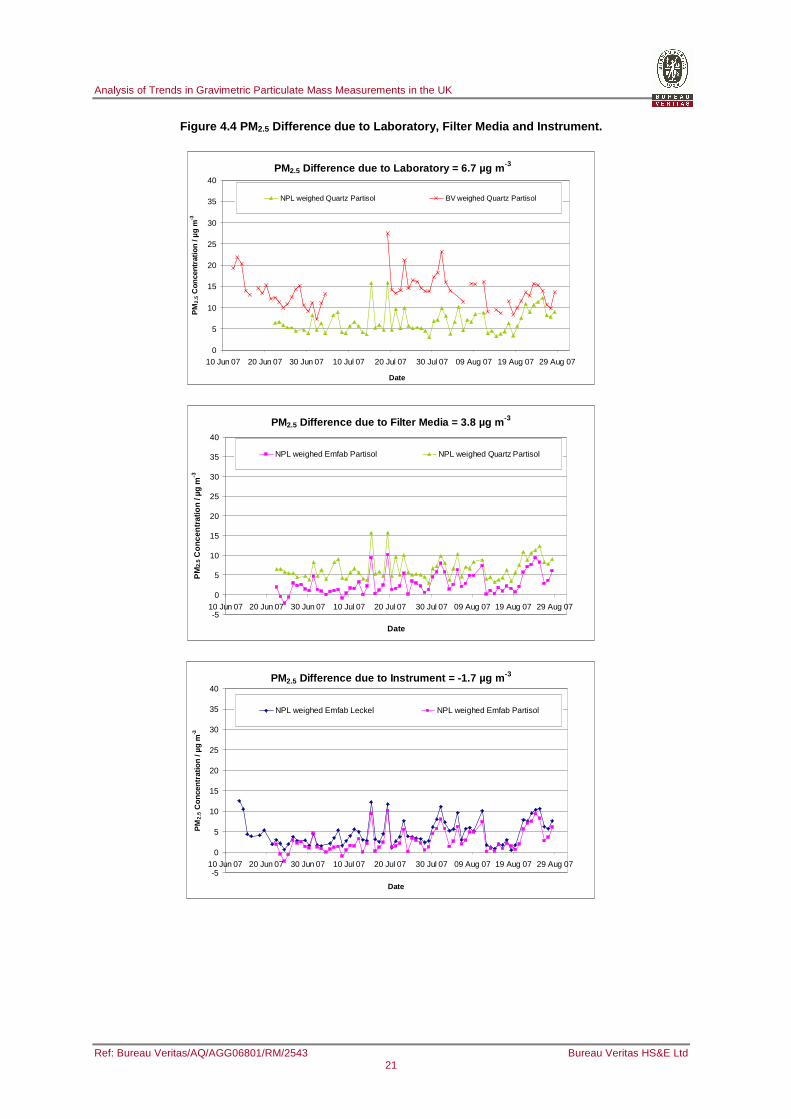
Analysis of Trends in Gravimetric Particulate Mass Measurements in the UK
Ref: Bureau Veritas/AQ/AGG06801/RM/2543 Bureau Veritas HS&E Ltd 21
Figure 4.4 PM 2.5 Difference due to Laboratory, Filter Media and Ins trument.
PM2.5 Difference due to Laboratory = 6.7 µg m -3
0
5
10
15
20
25
30
35
40
10 Jun 07 20 Jun 07 30 Jun 07 10 Jul 07 20 Jul 07 30 Jul 07 09 Aug 07 19 Aug 07 29 Aug 07
Date
PM
2.5
Con
cent
ratio
n / µ
g m
-3
NPL weighed Quartz Partisol BV weighed Quartz Partisol
PM2.5 Difference due to Filter Media = 3.8 µg m -3
-5
0
5
10
15
20
25
30
35
40
10 Jun 07 20 Jun 07 30 Jun 07 10 Jul 07 20 Jul 07 30 Jul 07 09 Aug 07 19 Aug 07 29 Aug 07
Date
PM
2.5
Con
cent
ratio
n / µ
g m
-3
NPL weighed Emfab Partisol NPL weighed Quartz Partisol
PM2.5 Difference due to Instrument = -1.7 µg m -3
-5
0
5
10
15
20
25
30
35
40
10 Jun 07 20 Jun 07 30 Jun 07 10 Jul 07 20 Jul 07 30 Jul 07 09 Aug 07 19 Aug 07 29 Aug 07
Date
PM
2.5
Con
cent
ratio
n / µ
g m
-3
NPL weighed Emfab Leckel NPL weighed Emfab Partisol
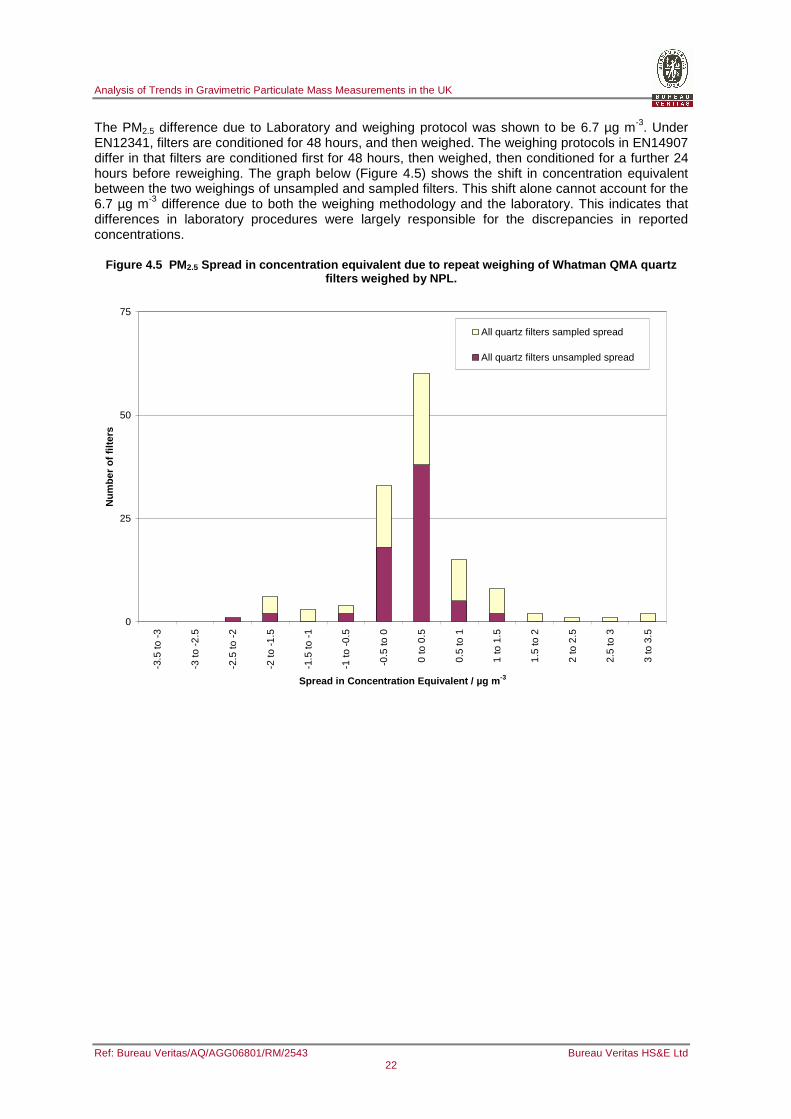
Analysis of Trends in Gravimetric Particulate Mass Measurements in the UK
Ref: Bureau Veritas/AQ/AGG06801/RM/2543 Bureau Veritas HS&E Ltd 22
The PM2.5 difference due to Laboratory and weighing protocol was shown to be 6.7 µg m-3. Under EN12341, filters are conditioned for 48 hours, and then weighed. The weighing protocols in EN14907 differ in that filters are conditioned first for 48 hours, then weighed, then conditioned for a further 24 hours before reweighing. The graph below (Figure 4.5) shows the shift in concentration equivalent between the two weighings of unsampled and sampled filters. This shift alone cannot account for the 6.7 µg m-3 difference due to both the weighing methodology and the laboratory. This indicates that differences in laboratory procedures were largely responsible for the discrepancies in reported concentrations.
Figure 4.5 PM 2.5 Spread in concentration equivalent due to repeat we ighing of Whatman QMA quartz filters weighed by NPL.
0
25
50
75
-3.5
to -
3
-3 to
-2.
5
-2.5
to -
2
-2 to
-1.
5
-1.5
to -
1
-1 to
-0.
5
-0.5
to 0
0 to
0.5
0.5
to 1
1 to
1.5
1.5
to 2
2 to
2.5
2.5
to 3
3 to
3.5
Spread in Concentration Equivalent / µg m -3
Num
ber
of fi
lters
All quartz filters sampled spread
All quartz filters unsampled spread
Analysis of Trends in Gravimetric Particulate Mass Measurements in the UK
Ref: Bureau Veritas/AQ/AGG06801/RM/2543 Bureau Veritas HS&E Ltd 23
4.1.3 Travel Blank Filters
Day-to-day operation of the Partisol 2025 units deployed in the network requires that pre-conditioned and weighed filters are loaded into filter cassettes. Fortnightly dispatch of filters is made through the supply of 14 loaded filter cassettes into a filter magazine, sent to the local site operator. Occasionally filters are not sampled (i.e. do not have ambient air drawn through them for any period of time) due to over supply or instrument failure, and these are returned to the weighing facility as field or travel blanks. It is not possible to say definitively which travel blanks have been through the sampling mechanism, and which have not, only that none of the filters have had ambient air drawn through them, and that the vast majority will have remained in the un-sampled filter magazine within the instrument, and will never have been through the sampling mechanism. For the two instruments located at Auchencorth Moss (PM10 and PM2.5), and a non AURN site in Derby, 15 filters have been supplied routinely with one being designated as a “travel blank” per fortnight dispatch. As the filters from Derby are treated in an identical fashion to those for the Defra sites, and there is a good coverage of travel blank filters, these filters are covered in the statistical analyses presented herein.
Figure 4.6 shows the variation in travel blanks for all the Partisols operating Bureau Veritas weighed Whatman QMA Quartz filters. The blanks are weighed and reported as PM mass concentrations, by dividing the volume that would have been sampled had they not been blanks. Partisols run at 16.7 l min-1 for 24 hours, which gives a volume of 24 m3 for a 24 hour sample. As the flow rate is both controlled and reported to ambient conditions, the volume is always exactly 24 m3. There is evidence of an increased travel blank in 2006 and 2007. Figure 4.7 shows the monthly average variation for PM10 and PM2.5 Partisols separated. There is no clear difference for the two size fractions except during February 2007. This month had only one filter for PM2.5 which was post weighed just before the laboratory move from Glasgow to Runcorn. The implications of the move are discussed in Section 4.2.2.7.
Figure 4.8 shows the variation of the travel blank concentration equivalent for Emfab filters weighed by Bureau Veritas Laboratories and deployed in a Partisol 2025 located Earls Court Road in London. In contrast to the quartz filters there is no evidence for an increased travel blank concentration equivalent to that shown above in recent years.
Figure 4.9 shows the variation for the travel blank concentration equivalent for Whatman quartz QMA filters weighed by Bureau Veritas Laboratories and deployed in a KFG. Note that the KFG has a flow rate 2.3 times greater than the Partisol, though is assumed to have the same flow rate when calculating the blank concentration equivalent for ease of comparison. There is limited evidence for increased travel blank mass in recent years, although there are a very limited number of travel blanks and it is hard to draw definitive conclusion from this comparison.
Figure 4.10 shows the variation for the blank concentration equivalent for Whatman quartz QMA filters weighed by AEA and deployed in Partisols. These are largely laboratory blanks rather than field blanks. The protocols employed by AEA have changed over time. Initially, there was a laboratory blank, and all filters were weighed relative to this blank. Later, there was no laboratory blank, and absolute weights are reported. Both laboratory blanks (45 filters) and field blanks (33 filters) were available for 2001-2 for research Partisols in London Marylebone Road, Glasgow, Belfast, Northants, Bournemouth, Inverness, Wrexham and Dumfries. It is interesting to note that the field blanks weight more than the laboratory blanks (1.7 vs. 0.1 µg m-3). However, in some cases, the travel blanks have been weighed relative to the lab blanks, and in some cases the travel blanks are based on absolute weights. As such, these data should be treated with caution.
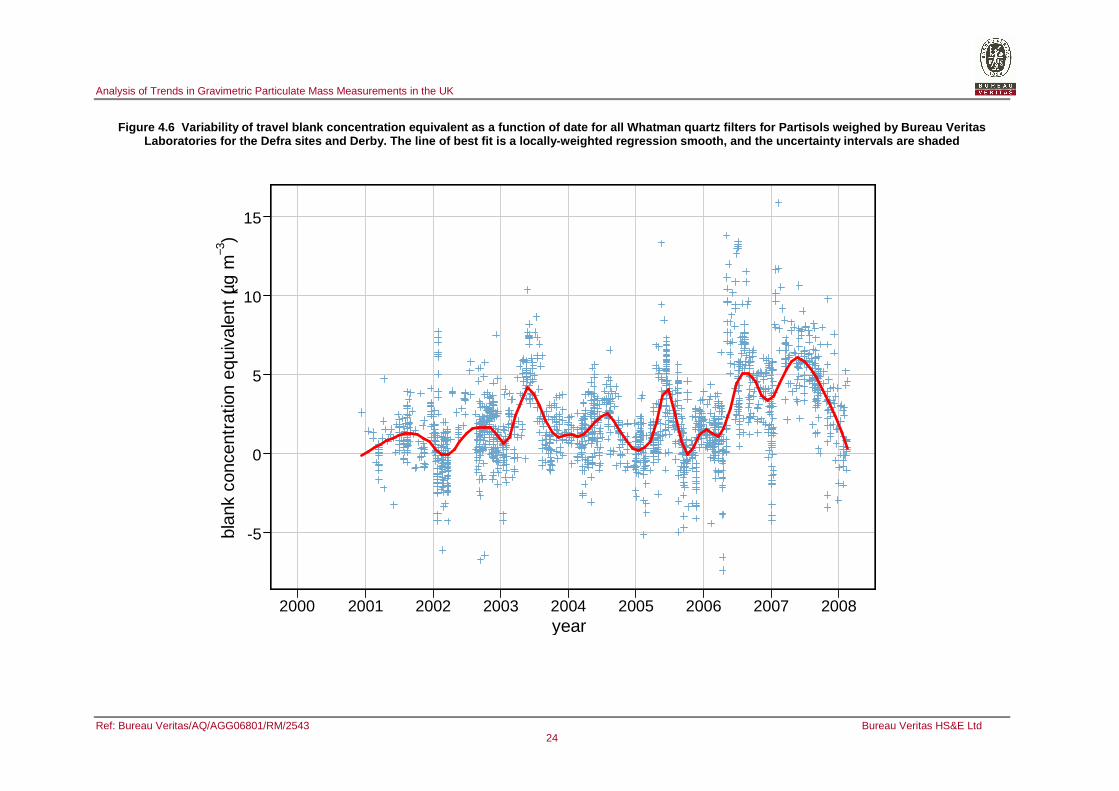
Analysis of Trends in Gravimetric Particulate Mass Measurements in the UK
Ref: Bureau Veritas/AQ/AGG06801/RM/2543 Bureau Veritas HS&E Ltd 24
Figure 4.6 Variability of travel blank concentrati on equivalent as a function of date for all Whatman quartz filters for Partisols weighed by Bureau Ver itas Laboratories for the Defra sites and Derby. The lin e of best fit is a locally-weighted regression smoo th, and the uncertainty intervals are shaded
-5
0
5
10
15
2000 2001 2002 2003 2004 2005 2006 2007 2008
blan
k co
ncen
trat
ion
equi
vale
nt (µ
g m
−3)
year
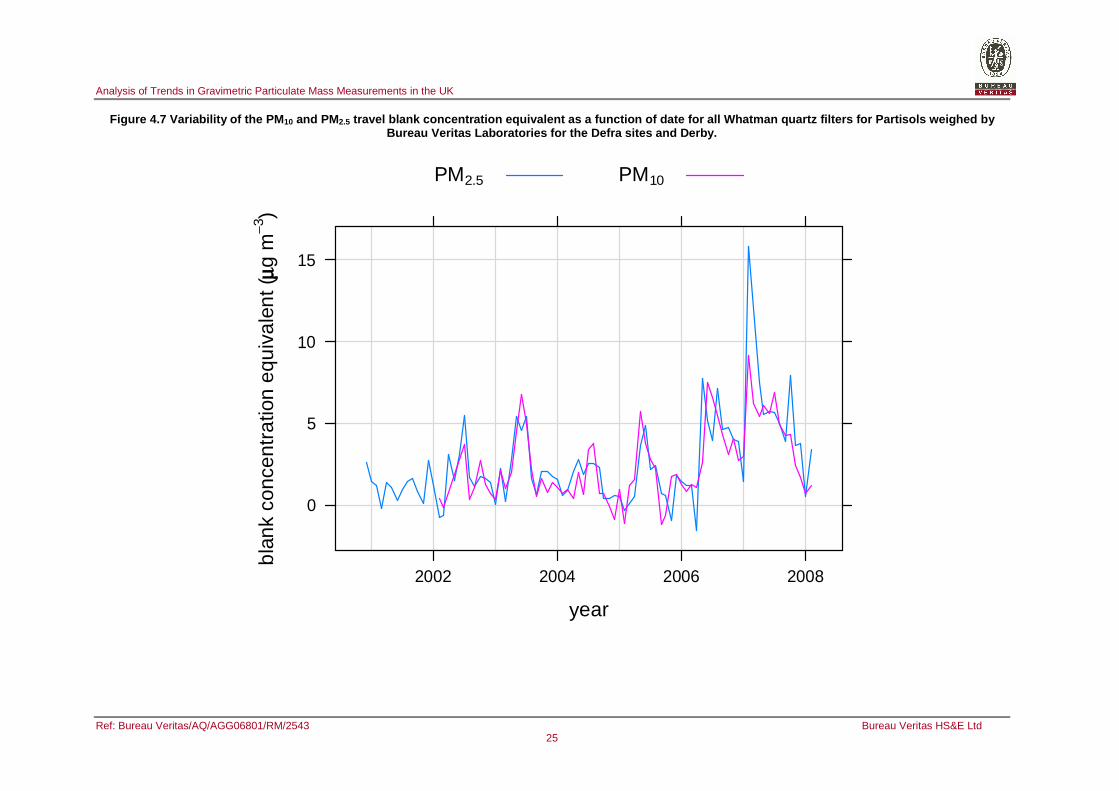
Analysis of Trends in Gravimetric Particulate Mass Measurements in the UK
Ref: Bureau Veritas/AQ/AGG06801/RM/2543 Bureau Veritas HS&E Ltd 25
Figure 4.7 Variability of the PM 10 and PM2.5 travel blank concentration equivalent as a functio n of date for all Whatman quartz filters for Partis ols weighed by Bureau Veritas Laboratories for the Defra sites and Derby.
year
bla
nk c
once
ntra
tion
equi
vale
nt (
g m
3 )
0
5
10
15
2002 2004 2006 2008
PM2.5 PM10
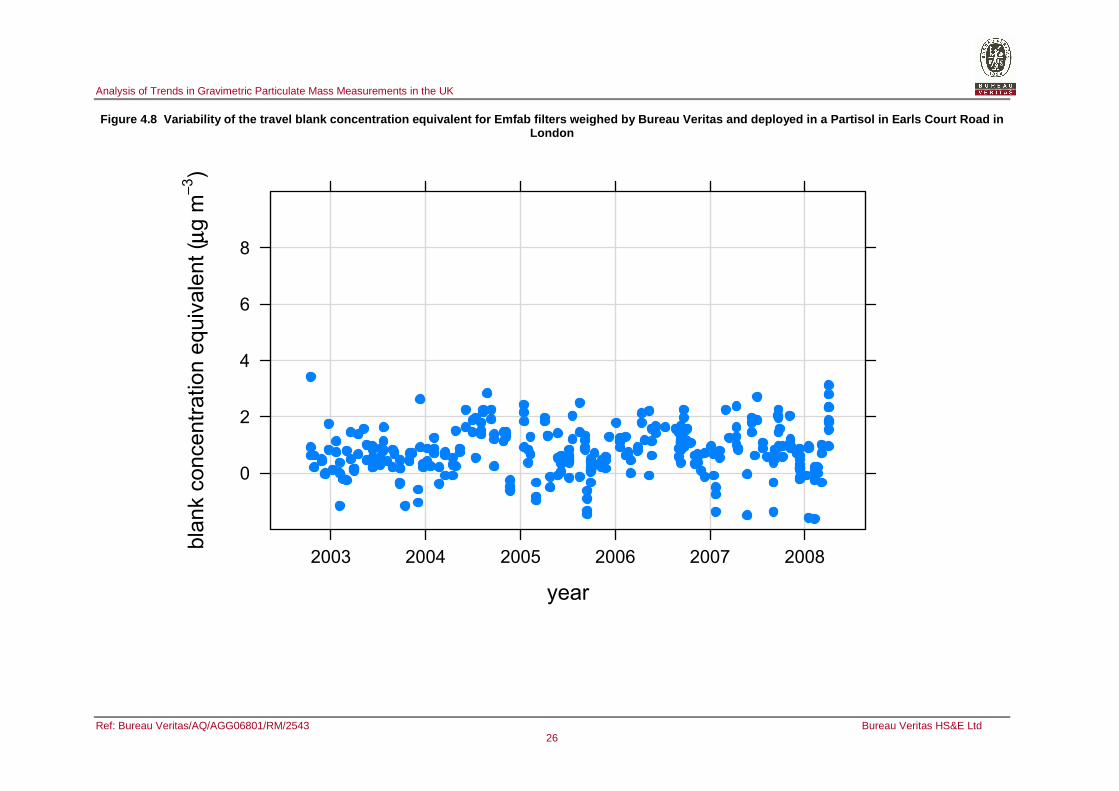
Analysis of Trends in Gravimetric Particulate Mass Measurements in the UK
Ref: Bureau Veritas/AQ/AGG06801/RM/2543 Bureau Veritas HS&E Ltd 26
Figure 4.8 Variability of the travel blank concent ration equivalent for Emfab filters weighed by Bure au Veritas and deployed in a Partisol in Earls Cour t Road in London
year
bla
nk c
on
ce
ntr
atio
n e
qu
iva
len
t (µµ
g m
−−3)
0
2
4
6
8
2003 2004 2005 2006 2007 2008
●
●●
●
●●●
●●
●
●
●
●●
●
●●●
●
●
●
●
●●●
●
●●
●
●
●●●●●●
●●●●
●●●
●
●●
●●●
●●
●●●
●
●●●●
●
●
●
●
●●●
●
●
●●
●
●
●●
●●●●●●●
●
●●
●
●●
●
●
●●
●●
●●
●
●●
●●
●
●●●●
●●●
●●
●
●
●
●●
●
●
●●
●●
●●
●●
●
●
●
●●●
●
●
●●●●●
●
●
●
●
●
●●
●●
●●
●●
●●●●
●
●
●●
●●●●●●
●●
●
●
●●●●●
●
●
●●●
●
●●
●●
●
●
●
●
●
●
●●●●
●●
●
●●●
●●●
●●
●●●●●●●
●
●●
●
●
●●
●
●
●
●●●●●●●
●●
●
●
●
●●
●●
●
●●●●
●
●●
●
●
●●●
●
●
●
●●●
●
●
●
●●●
●
●
●
●
●●●
●●
●●
●
●●●●●
●
●●
●
●●●
●
●●●
●
●
●
●●
●
●●●
●
●
●
●
●
●●
●●
●●
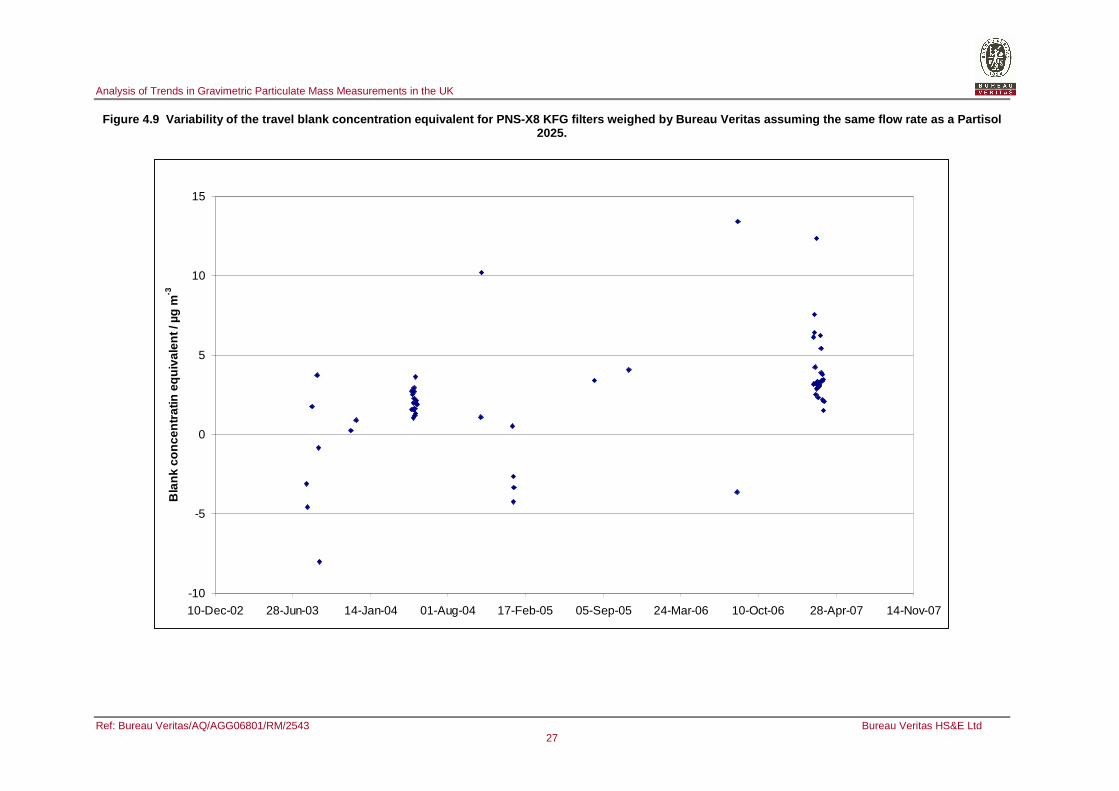
Analysis of Trends in Gravimetric Particulate Mass Measurements in the UK
Ref: Bureau Veritas/AQ/AGG06801/RM/2543 Bureau Veritas HS&E Ltd 27
Figure 4.9 Variability of the travel blank concent ration equivalent for PNS-X8 KFG filters weighed by Bureau Veritas assuming the same flow rate as a Pa rtisol 2025.
-10
-5
0
5
10
15
10-Dec-02 28-Jun-03 14-Jan-04 01-Aug-04 17-Feb-05 05-Sep-05 24-Mar-06 10-Oct-06 28-Apr-07 14-Nov-07
Bla
nk c
once
ntra
tin e
quiv
alen
t / µ
g m
-3
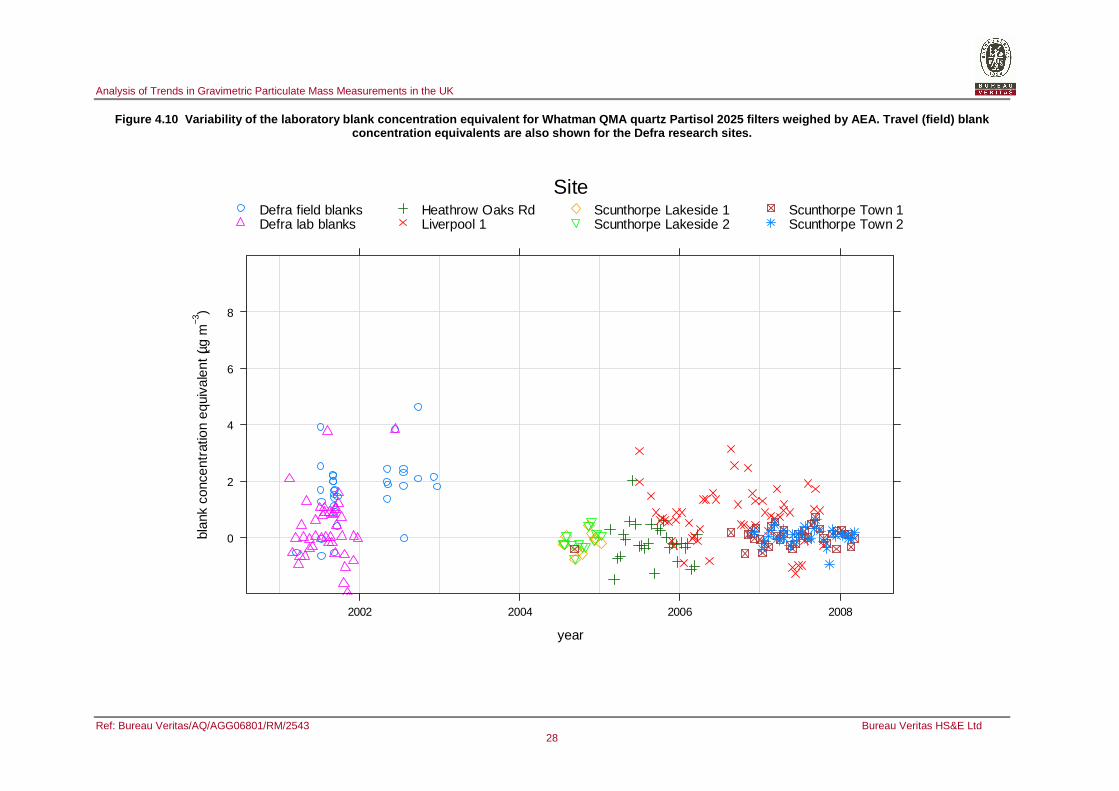
Analysis of Trends in Gravimetric Particulate Mass Measurements in the UK
Ref: Bureau Veritas/AQ/AGG06801/RM/2543 Bureau Veritas HS&E Ltd 28
Figure 4.10 Variability of the laboratory blank co ncentration equivalent for Whatman QMA quartz Parti sol 2025 filters weighed by AEA. Travel (field) bla nk concentration equivalents are also shown for the De fra research sites.
year
blan
k co
ncen
trat
ion
equi
vale
nt (µ
g m
−3)
0
2
4
6
8
2002 2004 2006 2008
SiteDefra field blanksDefra lab blanks
Heathrow Oaks RdLiverpool 1
Scunthorpe Lakeside 1Scunthorpe Lakeside 2
Scunthorpe Town 1Scunthorpe Town 2
Analysis of Trends in Gravimetric Particulate Mass Measurements in the UK
Ref: Bureau Veritas/AQ/AGG06801/RM/2543 Bureau Veritas UK Ltd 29
4.1.4 Summary of evidence for an overestimation
Ambient PM2.5 concentrations measured using Whatman QMA quartz filters weighed to EN14907 by NPL show significantly lower concentrations than those weighed to EN12341 by BV. The only significant difference between the EN14907 and EN12341 protocols is that in the former the filters are weighed twice. The reweighing of filters was shown to have little effect on concentrations, and as such, this indicates that quartz filters may be affected by the weighing protocols employed by BV.
This overestimation appears to be associated with mass increases in travel blanks and this is independent of particulate size fraction. The collective evidence suggests that there is an overestimation primarily in 2006 and 2007 of PM concentrations measured by Partisols operating with Whatman QMA quartz filters as weighed by Bureau Veritas Laboratories.
There is limited evidence to suggest that there is an increase in travel blank concentration equivalent for Bureau Veritas Laboratories weighed Whatman QMA quartz filters deployed in the PNS-X8 KFG (Figure 4.9). This impacts the concentration measured by the KFG to a lesser extent than the Partisol 2025, as the KFG has a flow rate 2.3 times greater. This may account for the discrepancies observed in Figure 4.2.
Emfab travel blank filters weighed by Bureau Veritas Laboratories show no evidence of increased concentration equivalent. NPL have previously studied the effect of humidity on different filter media [9], and showed that Emfab was much less susceptible to humidity effects than quartz. This highlights the hydrophilic nature of quartz, and the humidity within the Bureau Veritas Laboratories as the potential problem.
For filters weighed by Bureau Veritas Laboratories, concentrations reported on the national database have not previously been corrected for the travel blank or laboratory blank mass. For filters weighed by AEA, concentrations reported on the national database have never been corrected for travel blanks, but have occasionally been corrected for laboratory blanks.
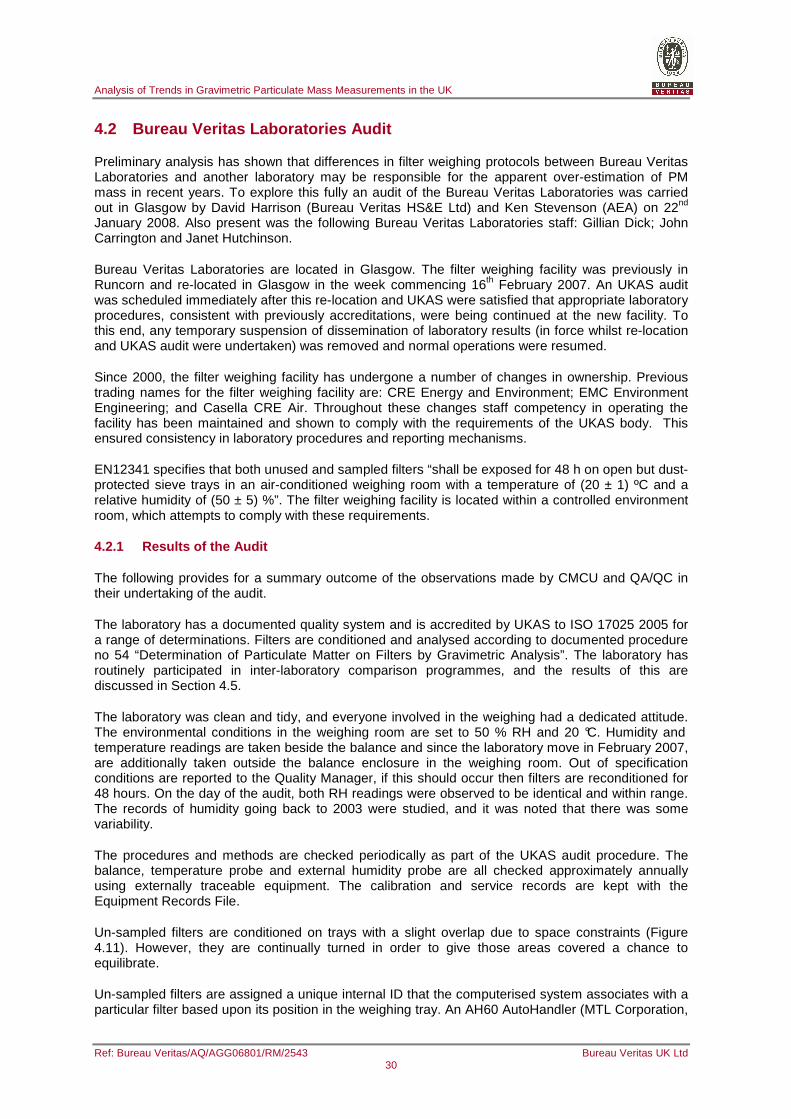
Analysis of Trends in Gravimetric Particulate Mass Measurements in the UK
Ref: Bureau Veritas/AQ/AGG06801/RM/2543 Bureau Veritas UK Ltd 30
4.2 Bureau Veritas Laboratories Audit
Preliminary analysis has shown that differences in filter weighing protocols between Bureau Veritas Laboratories and another laboratory may be responsible for the apparent over-estimation of PM mass in recent years. To explore this fully an audit of the Bureau Veritas Laboratories was carried out in Glasgow by David Harrison (Bureau Veritas HS&E Ltd) and Ken Stevenson (AEA) on 22nd January 2008. Also present was the following Bureau Veritas Laboratories staff: Gillian Dick; John Carrington and Janet Hutchinson.
Bureau Veritas Laboratories are located in Glasgow. The filter weighing facility was previously in Runcorn and re-located in Glasgow in the week commencing 16th February 2007. An UKAS audit was scheduled immediately after this re-location and UKAS were satisfied that appropriate laboratory procedures, consistent with previously accreditations, were being continued at the new facility. To this end, any temporary suspension of dissemination of laboratory results (in force whilst re-location and UKAS audit were undertaken) was removed and normal operations were resumed.
Since 2000, the filter weighing facility has undergone a number of changes in ownership. Previous trading names for the filter weighing facility are: CRE Energy and Environment; EMC Environment Engineering; and Casella CRE Air. Throughout these changes staff competency in operating the facility has been maintained and shown to comply with the requirements of the UKAS body. This ensured consistency in laboratory procedures and reporting mechanisms.
EN12341 specifies that both unused and sampled filters “shall be exposed for 48 h on open but dust-protected sieve trays in an air-conditioned weighing room with a temperature of (20 ± 1) ºC and a relative humidity of (50 ± 5) %”. The filter weighing facility is located within a controlled environment room, which attempts to comply with these requirements.
4.2.1 Results of the Audit
The following provides for a summary outcome of the observations made by CMCU and QA/QC in their undertaking of the audit.
The laboratory has a documented quality system and is accredited by UKAS to ISO 17025 2005 for a range of determinations. Filters are conditioned and analysed according to documented procedure no 54 “Determination of Particulate Matter on Filters by Gravimetric Analysis”. The laboratory has routinely participated in inter-laboratory comparison programmes, and the results of this are discussed in Section 4.5.
The laboratory was clean and tidy, and everyone involved in the weighing had a dedicated attitude. The environmental conditions in the weighing room are set to 50 % RH and 20 °C. Humidity and temperature readings are taken beside the balance and since the laboratory move in February 2007, are additionally taken outside the balance enclosure in the weighing room. Out of specification conditions are reported to the Quality Manager, if this should occur then filters are reconditioned for 48 hours. On the day of the audit, both RH readings were observed to be identical and within range. The records of humidity going back to 2003 were studied, and it was noted that there was some variability.
The procedures and methods are checked periodically as part of the UKAS audit procedure. The balance, temperature probe and external humidity probe are all checked approximately annually using externally traceable equipment. The calibration and service records are kept with the Equipment Records File.
Un-sampled filters are conditioned on trays with a slight overlap due to space constraints (Figure 4.11). However, they are continually turned in order to give those areas covered a chance to equilibrate.
Un-sampled filters are assigned a unique internal ID that the computerised system associates with a particular filter based upon its position in the weighing tray. An AH60 AutoHandler (MTL Corporation,
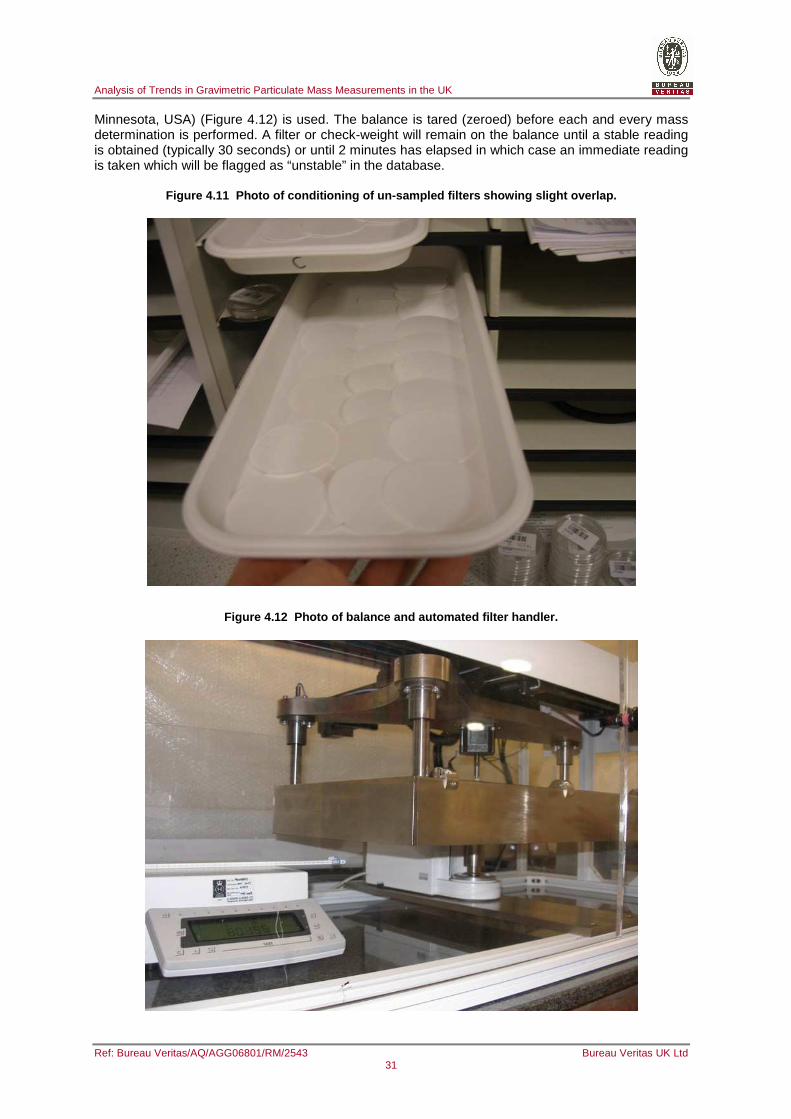
Analysis of Trends in Gravimetric Particulate Mass Measurements in the UK
Ref: Bureau Veritas/AQ/AGG06801/RM/2543 Bureau Veritas UK Ltd 31
Minnesota, USA) (Figure 4.12) is used. The balance is tared (zeroed) before each and every mass determination is performed. A filter or check-weight will remain on the balance until a stable reading is obtained (typically 30 seconds) or until 2 minutes has elapsed in which case an immediate reading is taken which will be flagged as “unstable” in the database.
Figure 4.11 Photo of conditioning of un-sampled fil ters showing slight overlap.
Figure 4.12 Photo of balance and automated filter h andler.
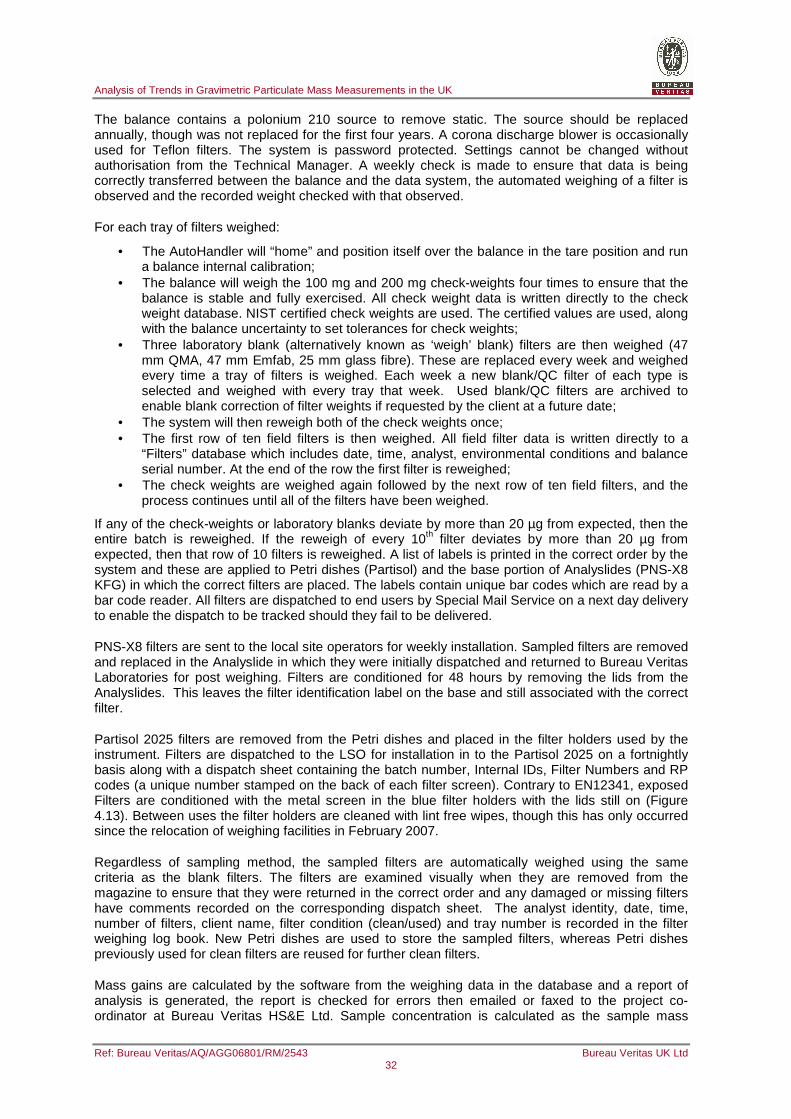
Analysis of Trends in Gravimetric Particulate Mass Measurements in the UK
Ref: Bureau Veritas/AQ/AGG06801/RM/2543 Bureau Veritas UK Ltd 32
The balance contains a polonium 210 source to remove static. The source should be replaced annually, though was not replaced for the first four years. A corona discharge blower is occasionally used for Teflon filters. The system is password protected. Settings cannot be changed without authorisation from the Technical Manager. A weekly check is made to ensure that data is being correctly transferred between the balance and the data system, the automated weighing of a filter is observed and the recorded weight checked with that observed.
For each tray of filters weighed:
• The AutoHandler will “home” and position itself over the balance in the tare position and run a balance internal calibration;
• The balance will weigh the 100 mg and 200 mg check-weights four times to ensure that the balance is stable and fully exercised. All check weight data is written directly to the check weight database. NIST certified check weights are used. The certified values are used, along with the balance uncertainty to set tolerances for check weights;
• Three laboratory blank (alternatively known as ‘weigh’ blank) filters are then weighed (47 mm QMA, 47 mm Emfab, 25 mm glass fibre). These are replaced every week and weighed every time a tray of filters is weighed. Each week a new blank/QC filter of each type is selected and weighed with every tray that week. Used blank/QC filters are archived to enable blank correction of filter weights if requested by the client at a future date;
• The system will then reweigh both of the check weights once; • The first row of ten field filters is then weighed. All field filter data is written directly to a
“Filters” database which includes date, time, analyst, environmental conditions and balance serial number. At the end of the row the first filter is reweighed;
• The check weights are weighed again followed by the next row of ten field filters, and the process continues until all of the filters have been weighed.
If any of the check-weights or laboratory blanks deviate by more than 20 µg from expected, then the entire batch is reweighed. If the reweigh of every 10th filter deviates by more than 20 µg from expected, then that row of 10 filters is reweighed. A list of labels is printed in the correct order by the system and these are applied to Petri dishes (Partisol) and the base portion of Analyslides (PNS-X8 KFG) in which the correct filters are placed. The labels contain unique bar codes which are read by a bar code reader. All filters are dispatched to end users by Special Mail Service on a next day delivery to enable the dispatch to be tracked should they fail to be delivered.
PNS-X8 filters are sent to the local site operators for weekly installation. Sampled filters are removed and replaced in the Analyslide in which they were initially dispatched and returned to Bureau Veritas Laboratories for post weighing. Filters are conditioned for 48 hours by removing the lids from the Analyslides. This leaves the filter identification label on the base and still associated with the correct filter.
Partisol 2025 filters are removed from the Petri dishes and placed in the filter holders used by the instrument. Filters are dispatched to the LSO for installation in to the Partisol 2025 on a fortnightly basis along with a dispatch sheet containing the batch number, Internal IDs, Filter Numbers and RP codes (a unique number stamped on the back of each filter screen). Contrary to EN12341, exposed Filters are conditioned with the metal screen in the blue filter holders with the lids still on (Figure 4.13). Between uses the filter holders are cleaned with lint free wipes, though this has only occurred since the relocation of weighing facilities in February 2007.
Regardless of sampling method, the sampled filters are automatically weighed using the same criteria as the blank filters. The filters are examined visually when they are removed from the magazine to ensure that they were returned in the correct order and any damaged or missing filters have comments recorded on the corresponding dispatch sheet. The analyst identity, date, time, number of filters, client name, filter condition (clean/used) and tray number is recorded in the filter weighing log book. New Petri dishes are used to store the sampled filters, whereas Petri dishes previously used for clean filters are reused for further clean filters.
Mass gains are calculated by the software from the weighing data in the database and a report of analysis is generated, the report is checked for errors then emailed or faxed to the project co-ordinator at Bureau Veritas HS&E Ltd. Sample concentration is calculated as the sample mass
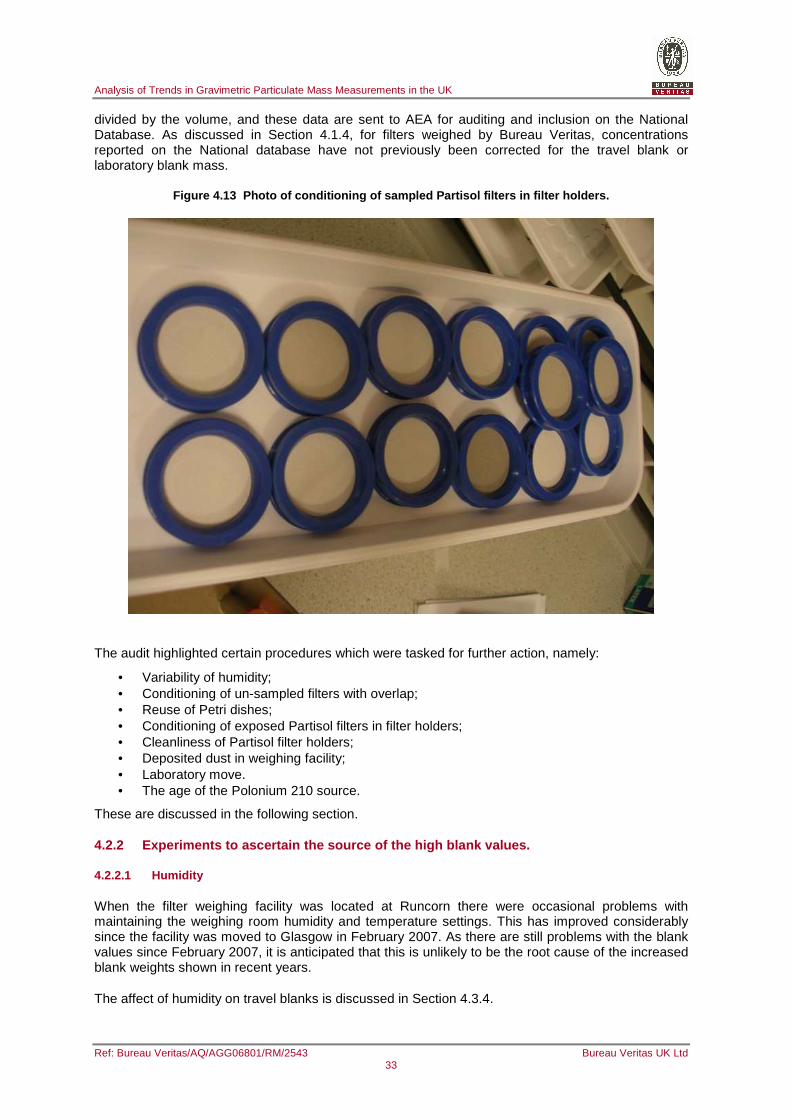
Analysis of Trends in Gravimetric Particulate Mass Measurements in the UK
Ref: Bureau Veritas/AQ/AGG06801/RM/2543 Bureau Veritas UK Ltd 33
divided by the volume, and these data are sent to AEA for auditing and inclusion on the National Database. As discussed in Section 4.1.4, for filters weighed by Bureau Veritas, concentrations reported on the National database have not previously been corrected for the travel blank or laboratory blank mass.
Figure 4.13 Photo of conditioning of sampled Partis ol filters in filter holders.
The audit highlighted certain procedures which were tasked for further action, namely:
• Variability of humidity; • Conditioning of un-sampled filters with overlap; • Reuse of Petri dishes; • Conditioning of exposed Partisol filters in filter holders; • Cleanliness of Partisol filter holders; • Deposited dust in weighing facility; • Laboratory move. • The age of the Polonium 210 source.
These are discussed in the following section.
4.2.2 Experiments to ascertain the source of the hi gh blank values.
4.2.2.1 Humidity
When the filter weighing facility was located at Runcorn there were occasional problems with maintaining the weighing room humidity and temperature settings. This has improved considerably since the facility was moved to Glasgow in February 2007. As there are still problems with the blank values since February 2007, it is anticipated that this is unlikely to be the root cause of the increased blank weights shown in recent years.
The affect of humidity on travel blanks is discussed in Section 4.3.4.
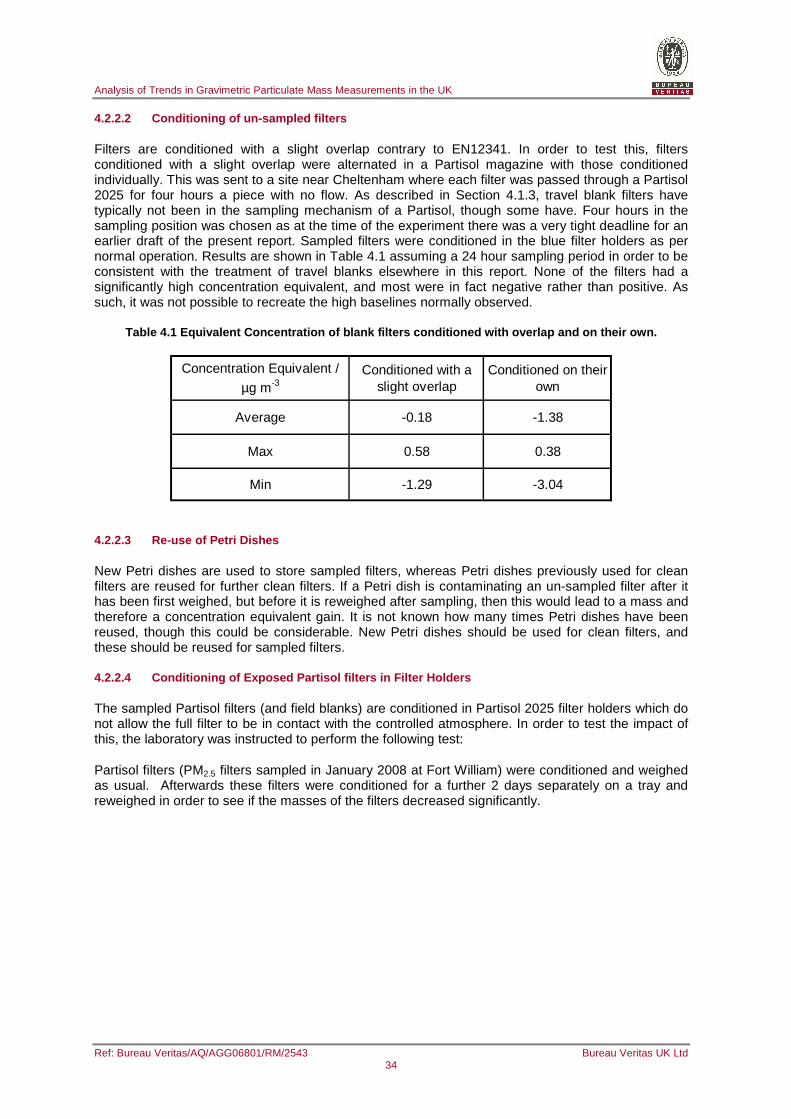
Analysis of Trends in Gravimetric Particulate Mass Measurements in the UK
Ref: Bureau Veritas/AQ/AGG06801/RM/2543 Bureau Veritas UK Ltd 34
4.2.2.2 Conditioning of un-sampled filters
Filters are conditioned with a slight overlap contrary to EN12341. In order to test this, filters conditioned with a slight overlap were alternated in a Partisol magazine with those conditioned individually. This was sent to a site near Cheltenham where each filter was passed through a Partisol 2025 for four hours a piece with no flow. As described in Section 4.1.3, travel blank filters have typically not been in the sampling mechanism of a Partisol, though some have. Four hours in the sampling position was chosen as at the time of the experiment there was a very tight deadline for an earlier draft of the present report. Sampled filters were conditioned in the blue filter holders as per normal operation. Results are shown in Table 4.1 assuming a 24 hour sampling period in order to be consistent with the treatment of travel blanks elsewhere in this report. None of the filters had a significantly high concentration equivalent, and most were in fact negative rather than positive. As such, it was not possible to recreate the high baselines normally observed.
Table 4.1 Equivalent Concentration of blank filters conditioned with overlap and on their own.
Concentration Equivalent /
µg m-3Conditioned with a
slight overlapConditioned on their
own
Average -0.18 -1.38
Max 0.58 0.38
Min -1.29 -3.04
4.2.2.3 Re-use of Petri Dishes
New Petri dishes are used to store sampled filters, whereas Petri dishes previously used for clean filters are reused for further clean filters. If a Petri dish is contaminating an un-sampled filter after it has been first weighed, but before it is reweighed after sampling, then this would lead to a mass and therefore a concentration equivalent gain. It is not known how many times Petri dishes have been reused, though this could be considerable. New Petri dishes should be used for clean filters, and these should be reused for sampled filters.
4.2.2.4 Conditioning of Exposed Partisol filters in F ilter Holders
The sampled Partisol filters (and field blanks) are conditioned in Partisol 2025 filter holders which do not allow the full filter to be in contact with the controlled atmosphere. In order to test the impact of this, the laboratory was instructed to perform the following test:
Partisol filters (PM2.5 filters sampled in January 2008 at Fort William) were conditioned and weighed as usual. Afterwards these filters were conditioned for a further 2 days separately on a tray and reweighed in order to see if the masses of the filters decreased significantly.
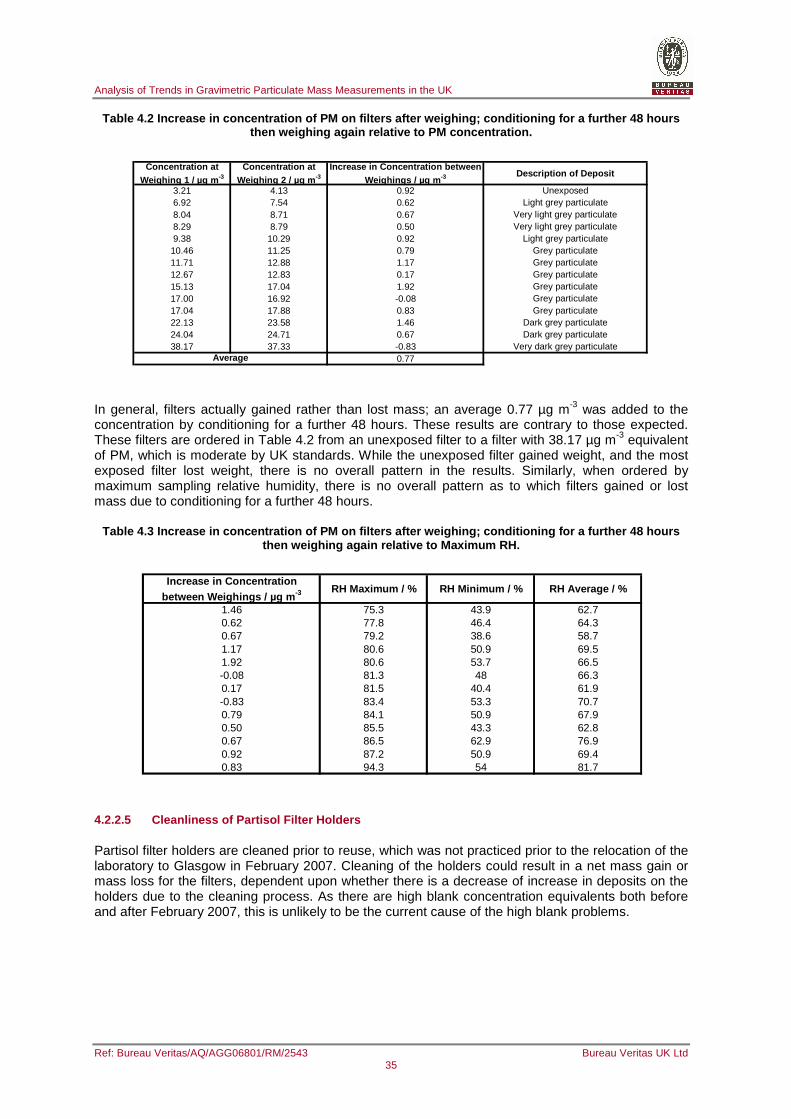
Analysis of Trends in Gravimetric Particulate Mass Measurements in the UK
Ref: Bureau Veritas/AQ/AGG06801/RM/2543 Bureau Veritas UK Ltd 35
Table 4.2 Increase in concentration of PM on filter s after weighing; conditioning for a further 48 hou rs then weighing again relative to PM concentration.
Concentration at Weighing 1 / µg m -3
Concentration at Weighing 2 / µg m -3
Increase in Concentration between Weighings / µg m -3 Description of Deposit
3.21 4.13 0.92 Unexposed6.92 7.54 0.62 Light grey particulate8.04 8.71 0.67 Very light grey particulate8.29 8.79 0.50 Very light grey particulate9.38 10.29 0.92 Light grey particulate
10.46 11.25 0.79 Grey particulate11.71 12.88 1.17 Grey particulate12.67 12.83 0.17 Grey particulate15.13 17.04 1.92 Grey particulate17.00 16.92 -0.08 Grey particulate17.04 17.88 0.83 Grey particulate22.13 23.58 1.46 Dark grey particulate24.04 24.71 0.67 Dark grey particulate38.17 37.33 -0.83 Very dark grey particulate
0.77Average
In general, filters actually gained rather than lost mass; an average 0.77 µg m-3 was added to the concentration by conditioning for a further 48 hours. These results are contrary to those expected. These filters are ordered in Table 4.2 from an unexposed filter to a filter with 38.17 µg m-3 equivalent of PM, which is moderate by UK standards. While the unexposed filter gained weight, and the most exposed filter lost weight, there is no overall pattern in the results. Similarly, when ordered by maximum sampling relative humidity, there is no overall pattern as to which filters gained or lost mass due to conditioning for a further 48 hours.
Table 4.3 Increase in concentration of PM on filter s after weighing; conditioning for a further 48 hou rs then weighing again relative to Maximum RH.
Increase in Concentration between Weighings / µg m -3 RH Maximum / % RH Minimum / % RH Average / %
1.46 75.3 43.9 62.70.62 77.8 46.4 64.30.67 79.2 38.6 58.71.17 80.6 50.9 69.51.92 80.6 53.7 66.5-0.08 81.3 48 66.30.17 81.5 40.4 61.9-0.83 83.4 53.3 70.70.79 84.1 50.9 67.90.50 85.5 43.3 62.80.67 86.5 62.9 76.90.92 87.2 50.9 69.40.83 94.3 54 81.7
4.2.2.5 Cleanliness of Partisol Filter Holders
Partisol filter holders are cleaned prior to reuse, which was not practiced prior to the relocation of the laboratory to Glasgow in February 2007. Cleaning of the holders could result in a net mass gain or mass loss for the filters, dependent upon whether there is a decrease of increase in deposits on the holders due to the cleaning process. As there are high blank concentration equivalents both before and after February 2007, this is unlikely to be the current cause of the high blank problems.
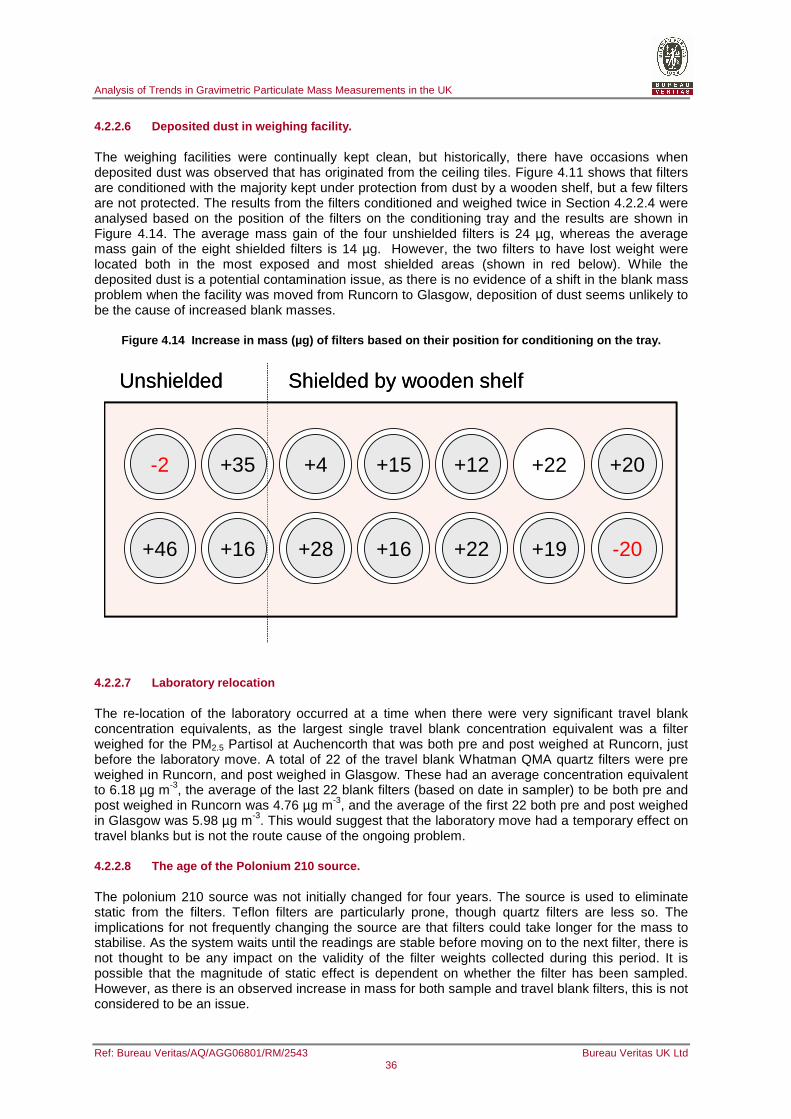
Analysis of Trends in Gravimetric Particulate Mass Measurements in the UK
Ref: Bureau Veritas/AQ/AGG06801/RM/2543 Bureau Veritas UK Ltd 36
4.2.2.6 Deposited dust in weighing facility.
The weighing facilities were continually kept clean, but historically, there have occasions when deposited dust was observed that has originated from the ceiling tiles. Figure 4.11 shows that filters are conditioned with the majority kept under protection from dust by a wooden shelf, but a few filters are not protected. The results from the filters conditioned and weighed twice in Section 4.2.2.4 were analysed based on the position of the filters on the conditioning tray and the results are shown in Figure 4.14. The average mass gain of the four unshielded filters is 24 µg, whereas the average mass gain of the eight shielded filters is 14 µg. However, the two filters to have lost weight were located both in the most exposed and most shielded areas (shown in red below). While the deposited dust is a potential contamination issue, as there is no evidence of a shift in the blank mass problem when the facility was moved from Runcorn to Glasgow, deposition of dust seems unlikely to be the cause of increased blank masses.
Figure 4.14 Increase in mass (µg) of filters based on their position for conditioning on the tray.
-20
+20
+19
+22
+22
+12
+16
+15
+28
+4
+16
+35
+46
-2
Shielded by wooden shelfUnshielded
-20
+20
+19
+22
+22
+12
+16
+15
+28
+4
+16
+35
+46
-2
Shielded by wooden shelfUnshielded
4.2.2.7 Laboratory relocation
The re-location of the laboratory occurred at a time when there were very significant travel blank concentration equivalents, as the largest single travel blank concentration equivalent was a filter weighed for the PM2.5 Partisol at Auchencorth that was both pre and post weighed at Runcorn, just before the laboratory move. A total of 22 of the travel blank Whatman QMA quartz filters were pre weighed in Runcorn, and post weighed in Glasgow. These had an average concentration equivalent to 6.18 µg m-3, the average of the last 22 blank filters (based on date in sampler) to be both pre and post weighed in Runcorn was 4.76 µg m-3, and the average of the first 22 both pre and post weighed in Glasgow was 5.98 µg m-3. This would suggest that the laboratory move had a temporary effect on travel blanks but is not the route cause of the ongoing problem.
4.2.2.8 The age of the Polonium 210 source.
The polonium 210 source was not initially changed for four years. The source is used to eliminate static from the filters. Teflon filters are particularly prone, though quartz filters are less so. The implications for not frequently changing the source are that filters could take longer for the mass to stabilise. As the system waits until the readings are stable before moving on to the next filter, there is not thought to be any impact on the validity of the filter weights collected during this period. It is possible that the magnitude of static effect is dependent on whether the filter has been sampled. However, as there is an observed increase in mass for both sample and travel blank filters, this is not considered to be an issue.
Analysis of Trends in Gravimetric Particulate Mass Measurements in the UK
Ref: Bureau Veritas/AQ/AGG06801/RM/2543 Bureau Veritas UK Ltd 37
4.2.3 Conclusions of Laboratory Audit
Tests performed in response to an audit of the laboratories were unable to identify a clear possible cause for the increase filter blanks in recent years. The following two issues were identified that should be rectified. However, it is not recommended that the methodology is changed at this point until the cause of the problem is identified:
• Sampled Partisol filters should be removed from the filter holders prior to conditioning.
• New Petri dishes should be used for un-sampled filters.
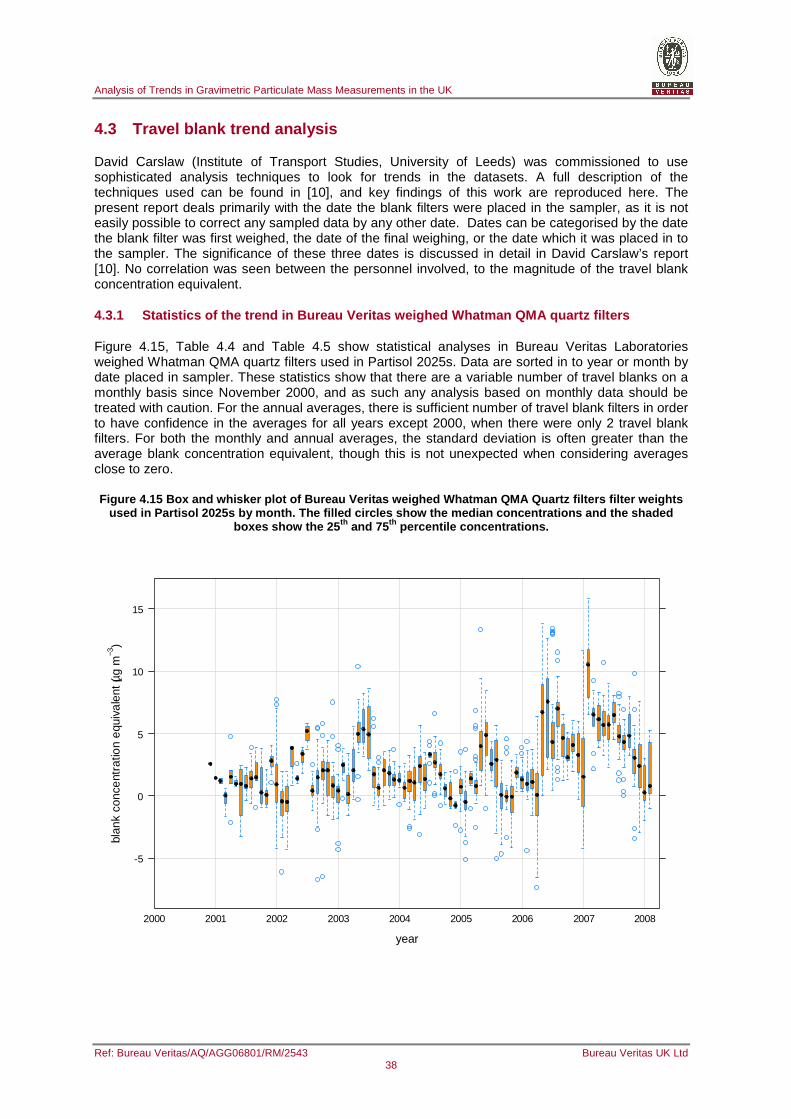
Analysis of Trends in Gravimetric Particulate Mass Measurements in the UK
Ref: Bureau Veritas/AQ/AGG06801/RM/2543 Bureau Veritas UK Ltd 38
4.3 Travel blank trend analysis
David Carslaw (Institute of Transport Studies, University of Leeds) was commissioned to use sophisticated analysis techniques to look for trends in the datasets. A full description of the techniques used can be found in [10], and key findings of this work are reproduced here. The present report deals primarily with the date the blank filters were placed in the sampler, as it is not easily possible to correct any sampled data by any other date. Dates can be categorised by the date the blank filter was first weighed, the date of the final weighing, or the date which it was placed in to the sampler. The significance of these three dates is discussed in detail in David Carslaw’s report [10]. No correlation was seen between the personnel involved, to the magnitude of the travel blank concentration equivalent.
4.3.1 Statistics of the trend in Bureau Veritas wei ghed Whatman QMA quartz filters
Figure 4.15, Table 4.4 and Table 4.5 show statistical analyses in Bureau Veritas Laboratories weighed Whatman QMA quartz filters used in Partisol 2025s. Data are sorted in to year or month by date placed in sampler. These statistics show that there are a variable number of travel blanks on a monthly basis since November 2000, and as such any analysis based on monthly data should be treated with caution. For the annual averages, there is sufficient number of travel blank filters in order to have confidence in the averages for all years except 2000, when there were only 2 travel blank filters. For both the monthly and annual averages, the standard deviation is often greater than the average blank concentration equivalent, though this is not unexpected when considering averages close to zero.
Figure 4.15 Box and whisker plot of Bureau Veritas w eighed Whatman QMA Quartz filters filter weights used in Partisol 2025s by month. The filled circles show the median concentrations and the shaded
boxes show the 25 th and 75 th percentile concentrations.
year
blan
k co
ncen
trat
ion
equi
vale
nt (µ
g m
−3)
-5
0
5
10
15
2000 2001 2002 2003 2004 2005 2006 2007 2008
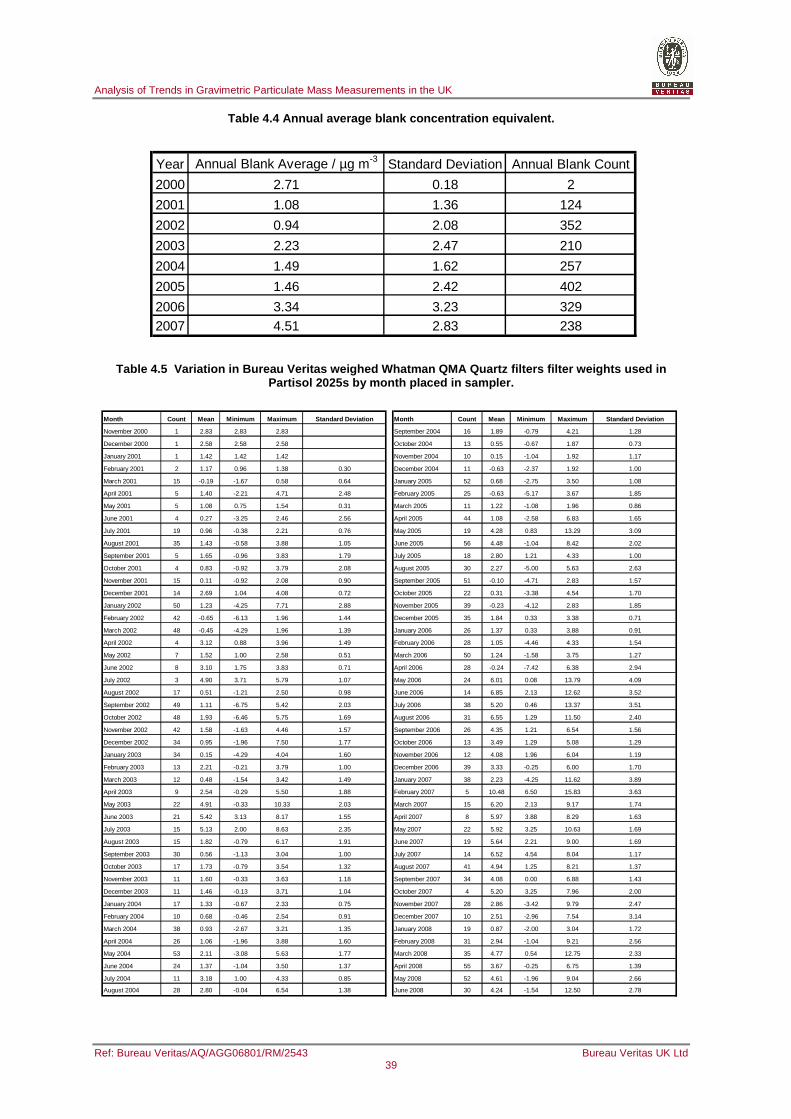
Analysis of Trends in Gravimetric Particulate Mass Measurements in the UK
Ref: Bureau Veritas/AQ/AGG06801/RM/2543 Bureau Veritas UK Ltd 39
Table 4.4 Annual average blank concentration equiva lent.
Year Annual Blank Average / µg m-3 Standard Deviation Annual Blank Count
2000 2.71 0.18 2
2001 1.08 1.36 124
2002 0.94 2.08 352
2003 2.23 2.47 210
2004 1.49 1.62 257
2005 1.46 2.42 402
2006 3.34 3.23 3292007 4.51 2.83 238
Table 4.5 Variation in Bureau Veritas weighed Whatm an QMA Quartz filters filter weights used in Partisol 2025s by month placed in sampler.
Month Count Mean Minimum Maximum Standard Deviation Month Count Mean Minimum Maximum Standard Deviation
November 2000 1 2.83 2.83 2.83 September 2004 16 1.89 -0.79 4.21 1.28
December 2000 1 2.58 2.58 2.58 October 2004 13 0.55 -0.67 1.87 0.73
January 2001 1 1.42 1.42 1.42 November 2004 10 0.15 -1.04 1.92 1.17
February 2001 2 1.17 0.96 1.38 0.30 December 2004 11 -0.63 -2.37 1.92 1.00
March 2001 15 -0.19 -1.67 0.58 0.64 January 2005 52 0.68 -2.75 3.50 1.08
April 2001 5 1.40 -2.21 4.71 2.48 February 2005 25 -0.63 -5.17 3.67 1.85
May 2001 5 1.08 0.75 1.54 0.31 March 2005 11 1.22 -1.08 1.96 0.86
June 2001 4 0.27 -3.25 2.46 2.56 April 2005 44 1.08 -2.58 6.83 1.65
July 2001 19 0.96 -0.38 2.21 0.76 May 2005 19 4.28 0.83 13.29 3.09
August 2001 35 1.43 -0.58 3.88 1.05 June 2005 56 4.48 -1.04 8.42 2.02
September 2001 5 1.65 -0.96 3.83 1.79 July 2005 18 2.80 1.21 4.33 1.00
October 2001 4 0.83 -0.92 3.79 2.08 August 2005 30 2.27 -5.00 5.63 2.63
November 2001 15 0.11 -0.92 2.08 0.90 September 2005 51 -0.10 -4.71 2.83 1.57
December 2001 14 2.69 1.04 4.08 0.72 October 2005 22 0.31 -3.38 4.54 1.70
January 2002 50 1.23 -4.25 7.71 2.88 November 2005 39 -0.23 -4.12 2.83 1.85
February 2002 42 -0.65 -6.13 1.96 1.44 December 2005 35 1.84 0.33 3.38 0.71
March 2002 48 -0.45 -4.29 1.96 1.39 January 2006 26 1.37 0.33 3.88 0.91
April 2002 4 3.12 0.88 3.96 1.49 February 2006 28 1.05 -4.46 4.33 1.54
May 2002 7 1.52 1.00 2.58 0.51 March 2006 50 1.24 -1.58 3.75 1.27
June 2002 8 3.10 1.75 3.83 0.71 April 2006 28 -0.24 -7.42 6.38 2.94
July 2002 3 4.90 3.71 5.79 1.07 May 2006 24 6.01 0.08 13.79 4.09
August 2002 17 0.51 -1.21 2.50 0.98 June 2006 14 6.85 2.13 12.62 3.52
September 2002 49 1.11 -6.75 5.42 2.03 July 2006 38 5.20 0.46 13.37 3.51
October 2002 48 1.93 -6.46 5.75 1.69 August 2006 31 6.55 1.29 11.50 2.40
November 2002 42 1.58 -1.63 4.46 1.57 September 2006 26 4.35 1.21 6.54 1.56
December 2002 34 0.95 -1.96 7.50 1.77 October 2006 13 3.49 1.29 5.08 1.29
January 2003 34 0.15 -4.29 4.04 1.60 November 2006 12 4.08 1.96 6.04 1.19
February 2003 13 2.21 -0.21 3.79 1.00 December 2006 39 3.33 -0.25 6.00 1.70
March 2003 12 0.48 -1.54 3.42 1.49 January 2007 38 2.23 -4.25 11.62 3.89
April 2003 9 2.54 -0.29 5.50 1.88 February 2007 5 10.48 6.50 15.83 3.63
May 2003 22 4.91 -0.33 10.33 2.03 March 2007 15 6.20 2.13 9.17 1.74
June 2003 21 5.42 3.13 8.17 1.55 April 2007 8 5.97 3.88 8.29 1.63
July 2003 15 5.13 2.00 8.63 2.35 May 2007 22 5.92 3.25 10.63 1.69
August 2003 15 1.82 -0.79 6.17 1.91 June 2007 19 5.64 2.21 9.00 1.69
September 2003 30 0.56 -1.13 3.04 1.00 July 2007 14 6.52 4.54 8.04 1.17
October 2003 17 1.73 -0.79 3.54 1.32 August 2007 41 4.94 1.25 8.21 1.37
November 2003 11 1.60 -0.33 3.63 1.18 September 2007 34 4.08 0.00 6.88 1.43
December 2003 11 1.46 -0.13 3.71 1.04 October 2007 4 5.20 3.25 7.96 2.00
January 2004 17 1.33 -0.67 2.33 0.75 November 2007 28 2.86 -3.42 9.79 2.47
February 2004 10 0.68 -0.46 2.54 0.91 December 2007 10 2.51 -2.96 7.54 3.14
March 2004 38 0.93 -2.67 3.21 1.35 January 2008 19 0.87 -2.00 3.04 1.72
April 2004 26 1.06 -1.96 3.88 1.60 February 2008 31 2.94 -1.04 9.21 2.56
May 2004 53 2.11 -3.08 5.63 1.77 March 2008 35 4.77 0.54 12.75 2.33
June 2004 24 1.37 -1.04 3.50 1.37 April 2008 55 3.67 -0.25 6.75 1.39
July 2004 11 3.18 1.00 4.33 0.85 May 2008 52 4.61 -1.96 9.04 2.66
August 2004 28 2.80 -0.04 6.54 1.38 June 2008 30 4.24 -1.54 12.50 2.78
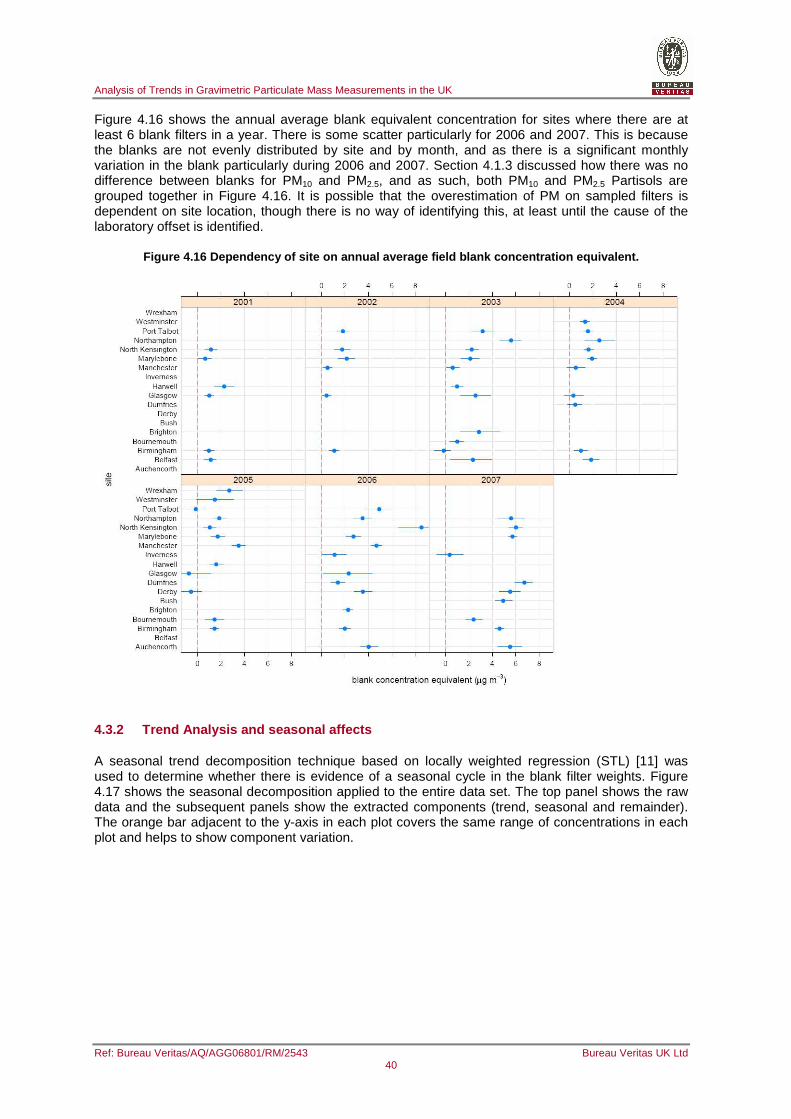
Analysis of Trends in Gravimetric Particulate Mass Measurements in the UK
Ref: Bureau Veritas/AQ/AGG06801/RM/2543 Bureau Veritas UK Ltd 40
Figure 4.16 shows the annual average blank equivalent concentration for sites where there are at least 6 blank filters in a year. There is some scatter particularly for 2006 and 2007. This is because the blanks are not evenly distributed by site and by month, and as there is a significant monthly variation in the blank particularly during 2006 and 2007. Section 4.1.3 discussed how there was no difference between blanks for PM10 and PM2.5, and as such, both PM10 and PM2.5 Partisols are grouped together in Figure 4.16. It is possible that the overestimation of PM on sampled filters is dependent on site location, though there is no way of identifying this, at least until the cause of the laboratory offset is identified.
Figure 4.16 Dependency of site on annual average fi eld blank concentration equivalent.
4.3.2 Trend Analysis and seasonal affects
A seasonal trend decomposition technique based on locally weighted regression (STL) [11] was used to determine whether there is evidence of a seasonal cycle in the blank filter weights. Figure 4.17 shows the seasonal decomposition applied to the entire data set. The top panel shows the raw data and the subsequent panels show the extracted components (trend, seasonal and remainder). The orange bar adjacent to the y-axis in each plot covers the same range of concentrations in each plot and helps to show component variation.
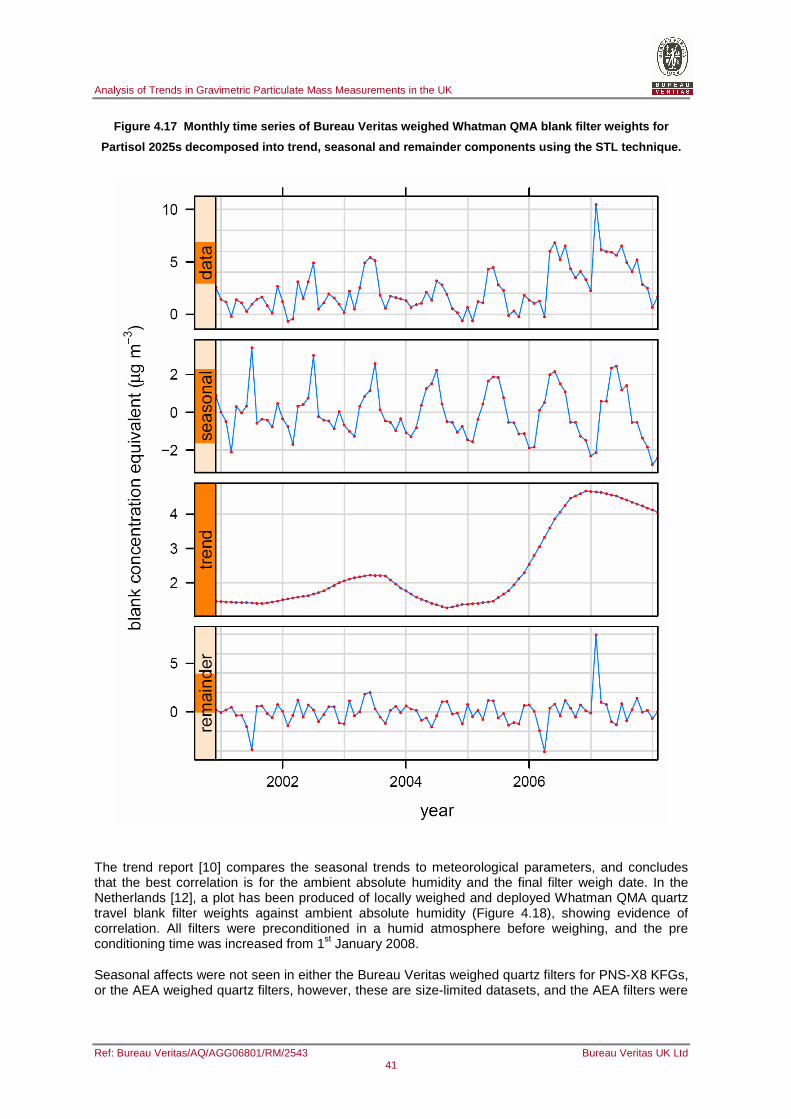
Analysis of Trends in Gravimetric Particulate Mass Measurements in the UK
Ref: Bureau Veritas/AQ/AGG06801/RM/2543 Bureau Veritas UK Ltd 41
Figure 4.17 Monthly time series of Bureau Veritas w eighed Whatman QMA blank filter weights for
Partisol 2025s decomposed into trend, seasonal and r emainder components using the STL technique.
The trend report [10] compares the seasonal trends to meteorological parameters, and concludes that the best correlation is for the ambient absolute humidity and the final filter weigh date. In the Netherlands [12], a plot has been produced of locally weighed and deployed Whatman QMA quartz travel blank filter weights against ambient absolute humidity (Figure 4.18), showing evidence of correlation. All filters were preconditioned in a humid atmosphere before weighing, and the pre conditioning time was increased from 1st January 2008.
Seasonal affects were not seen in either the Bureau Veritas weighed quartz filters for PNS-X8 KFGs, or the AEA weighed quartz filters, however, these are size-limited datasets, and the AEA filters were
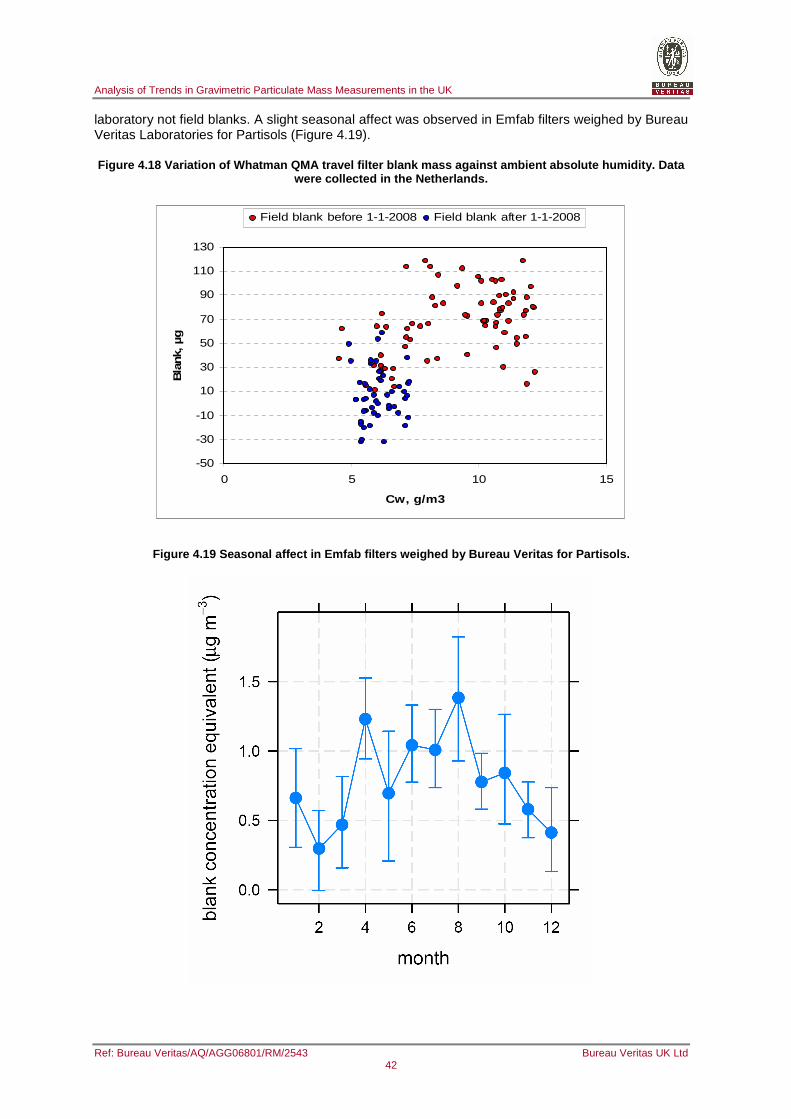
Analysis of Trends in Gravimetric Particulate Mass Measurements in the UK
Ref: Bureau Veritas/AQ/AGG06801/RM/2543 Bureau Veritas UK Ltd 42
laboratory not field blanks. A slight seasonal affect was observed in Emfab filters weighed by Bureau Veritas Laboratories for Partisols (Figure 4.19).
Figure 4.18 Variation of Whatman QMA travel filter b lank mass against ambient absolute humidity. Data were collected in the Netherlands.
-50
-30
-10
10
30
50
70
90
110
130
0 5 10 15
Cw, g/m3
Bla
nk, µg
Field blank before 1-1-2008 Field blank after 1-1-2008
Figure 4.19 Seasonal affect in Emfab filters weighed by Bureau Veritas for Partisols.
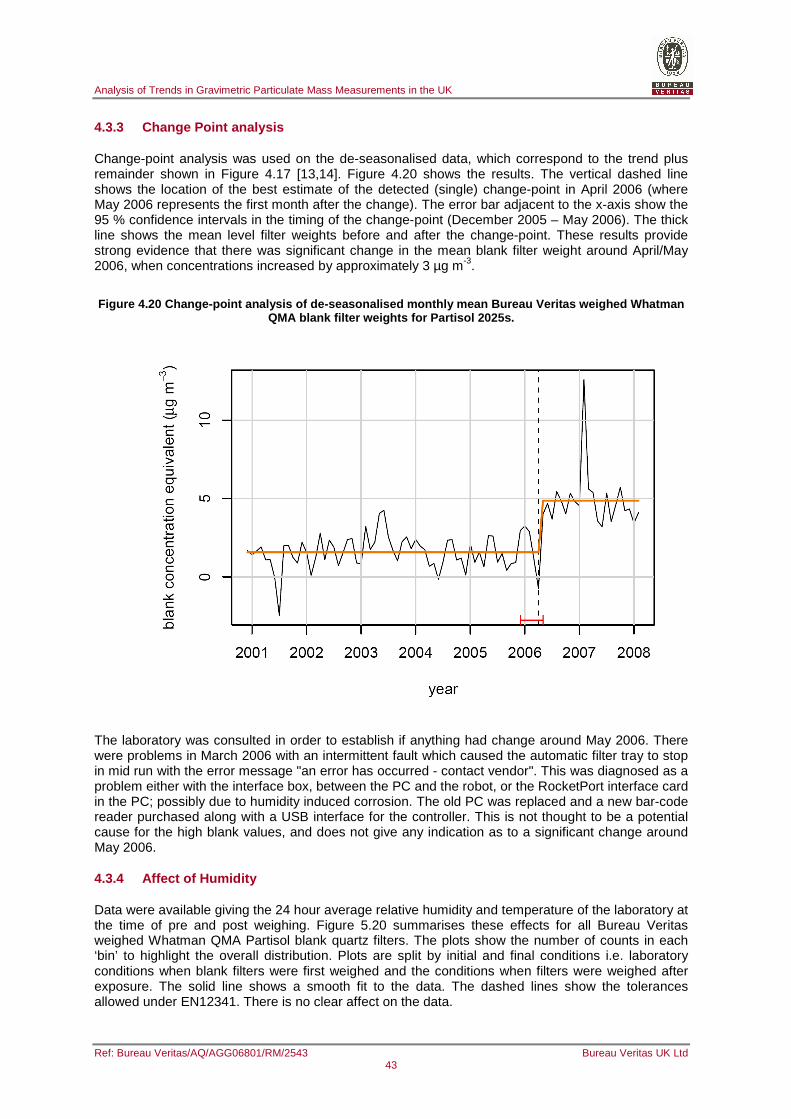
Analysis of Trends in Gravimetric Particulate Mass Measurements in the UK
Ref: Bureau Veritas/AQ/AGG06801/RM/2543 Bureau Veritas UK Ltd 43
4.3.3 Change Point analysis
Change-point analysis was used on the de-seasonalised data, which correspond to the trend plus remainder shown in Figure 4.17 [13,14]. Figure 4.20 shows the results. The vertical dashed line shows the location of the best estimate of the detected (single) change-point in April 2006 (where May 2006 represents the first month after the change). The error bar adjacent to the x-axis show the 95 % confidence intervals in the timing of the change-point (December 2005 – May 2006). The thick line shows the mean level filter weights before and after the change-point. These results provide strong evidence that there was significant change in the mean blank filter weight around April/May 2006, when concentrations increased by approximately 3 µg m-3.
Figure 4.20 Change-point analysis of de-seasonalise d monthly mean Bureau Veritas weighed Whatman QMA blank filter weights for Partisol 2025s.
The laboratory was consulted in order to establish if anything had change around May 2006. There were problems in March 2006 with an intermittent fault which caused the automatic filter tray to stop in mid run with the error message "an error has occurred - contact vendor". This was diagnosed as a problem either with the interface box, between the PC and the robot, or the RocketPort interface card in the PC; possibly due to humidity induced corrosion. The old PC was replaced and a new bar-code reader purchased along with a USB interface for the controller. This is not thought to be a potential cause for the high blank values, and does not give any indication as to a significant change around May 2006.
4.3.4 Affect of Humidity
Data were available giving the 24 hour average relative humidity and temperature of the laboratory at the time of pre and post weighing. Figure 5.20 summarises these effects for all Bureau Veritas weighed Whatman QMA Partisol blank quartz filters. The plots show the number of counts in each ‘bin’ to highlight the overall distribution. Plots are split by initial and final conditions i.e. laboratory conditions when blank filters were first weighed and the conditions when filters were weighed after exposure. The solid line shows a smooth fit to the data. The dashed lines show the tolerances allowed under EN12341. There is no clear affect on the data.
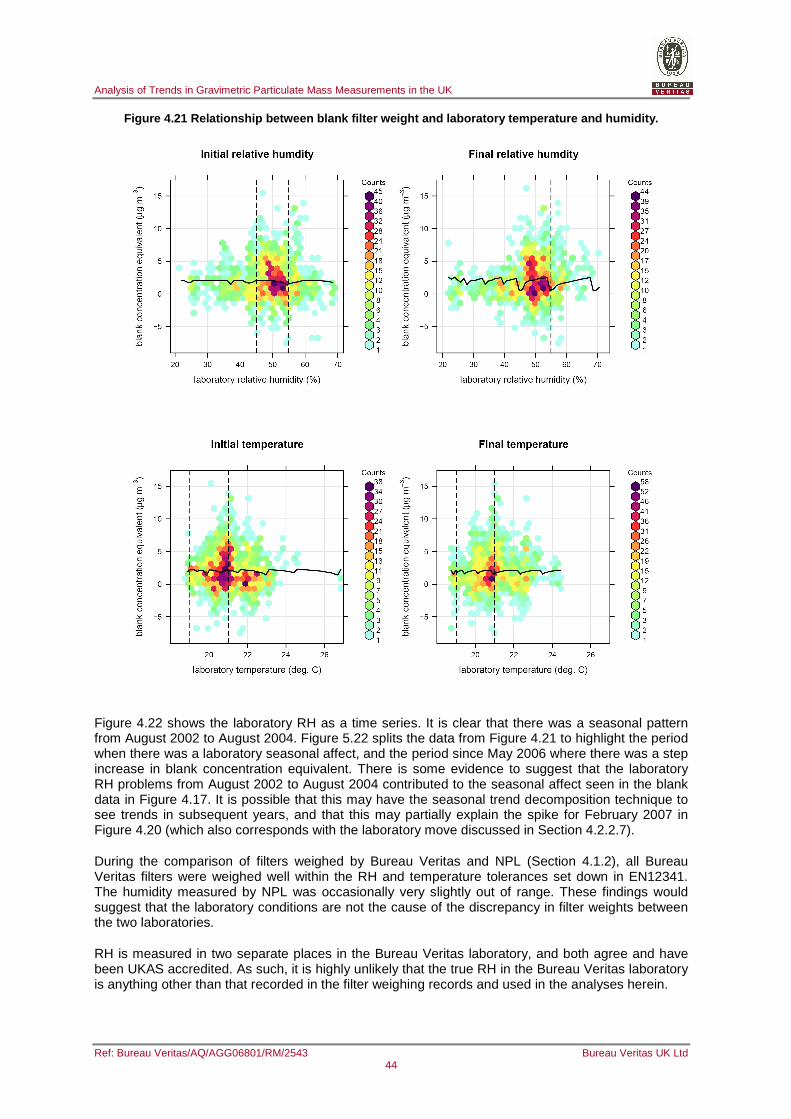
Analysis of Trends in Gravimetric Particulate Mass Measurements in the UK
Ref: Bureau Veritas/AQ/AGG06801/RM/2543 Bureau Veritas UK Ltd 44
Figure 4.21 Relationship between blank filter weigh t and laboratory temperature and humidity.
Figure 4.22 shows the laboratory RH as a time series. It is clear that there was a seasonal pattern from August 2002 to August 2004. Figure 5.22 splits the data from Figure 4.21 to highlight the period when there was a laboratory seasonal affect, and the period since May 2006 where there was a step increase in blank concentration equivalent. There is some evidence to suggest that the laboratory RH problems from August 2002 to August 2004 contributed to the seasonal affect seen in the blank data in Figure 4.17. It is possible that this may have the seasonal trend decomposition technique to see trends in subsequent years, and that this may partially explain the spike for February 2007 in Figure 4.20 (which also corresponds with the laboratory move discussed in Section 4.2.2.7).
During the comparison of filters weighed by Bureau Veritas and NPL (Section 4.1.2), all Bureau Veritas filters were weighed well within the RH and temperature tolerances set down in EN12341. The humidity measured by NPL was occasionally very slightly out of range. These findings would suggest that the laboratory conditions are not the cause of the discrepancy in filter weights between the two laboratories.
RH is measured in two separate places in the Bureau Veritas laboratory, and both agree and have been UKAS accredited. As such, it is highly unlikely that the true RH in the Bureau Veritas laboratory is anything other than that recorded in the filter weighing records and used in the analyses herein.
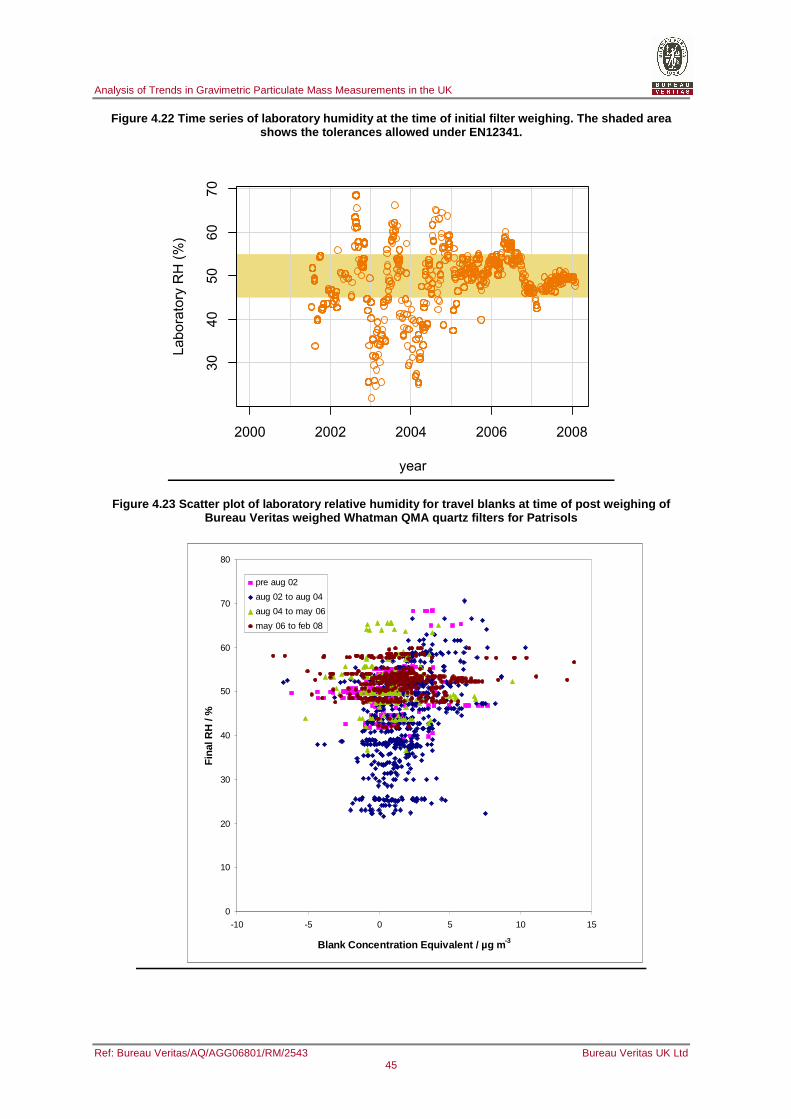
Analysis of Trends in Gravimetric Particulate Mass Measurements in the UK
Ref: Bureau Veritas/AQ/AGG06801/RM/2543 Bureau Veritas UK Ltd 45
Figure 4.22 Time series of laboratory humidity at t he time of initial filter weighing. The shaded area shows the tolerances allowed under EN12341.
30
40
50
60
70
year
La
bo
rato
ry R
H (
%)
2000 2002 2004 2006 2008
Figure 4.23 Scatter plot of laboratory relative humi dity for travel blanks at time of post weighing of Bureau Veritas weighed Whatman QMA quartz filters fo r Patrisols
0
10
20
30
40
50
60
70
80
-10 -5 0 5 10 15
Blank Concentration Equivalent / µg m -3
Fin
al R
H /
%
pre aug 02
aug 02 to aug 04
aug 04 to may 06
may 06 to feb 08
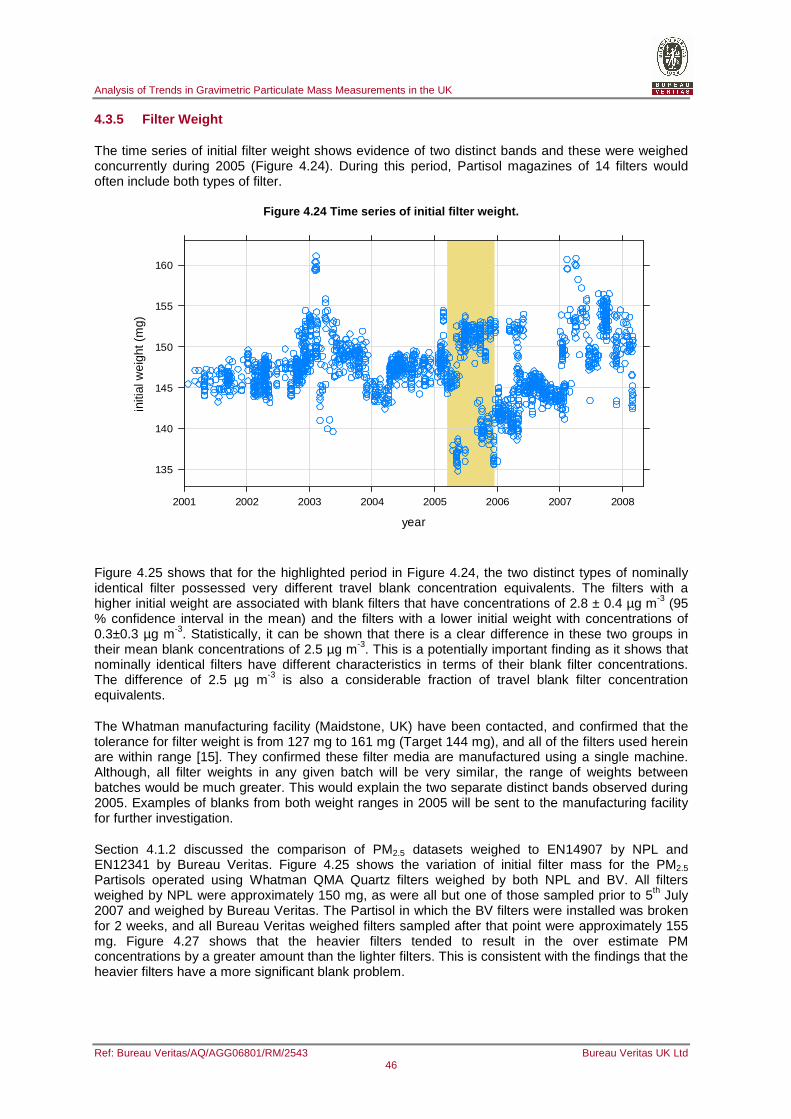
Analysis of Trends in Gravimetric Particulate Mass Measurements in the UK
Ref: Bureau Veritas/AQ/AGG06801/RM/2543 Bureau Veritas UK Ltd 46
4.3.5 Filter Weight
The time series of initial filter weight shows evidence of two distinct bands and these were weighed concurrently during 2005 (Figure 4.24). During this period, Partisol magazines of 14 filters would often include both types of filter.
Figure 4.24 Time series of initial filter weight.
year
initi
al w
eigh
t (m
g)
135
140
145
150
155
160
2001 2002 2003 2004 2005 2006 2007 2008
Figure 4.25 shows that for the highlighted period in Figure 4.24, the two distinct types of nominally identical filter possessed very different travel blank concentration equivalents. The filters with a higher initial weight are associated with blank filters that have concentrations of 2.8 ± 0.4 µg m-3 (95 % confidence interval in the mean) and the filters with a lower initial weight with concentrations of 0.3±0.3 µg m-3. Statistically, it can be shown that there is a clear difference in these two groups in their mean blank concentrations of 2.5 µg m-3. This is a potentially important finding as it shows that nominally identical filters have different characteristics in terms of their blank filter concentrations. The difference of 2.5 µg m-3 is also a considerable fraction of travel blank filter concentration equivalents.
The Whatman manufacturing facility (Maidstone, UK) have been contacted, and confirmed that the tolerance for filter weight is from 127 mg to 161 mg (Target 144 mg), and all of the filters used herein are within range [15]. They confirmed these filter media are manufactured using a single machine. Although, all filter weights in any given batch will be very similar, the range of weights between batches would be much greater. This would explain the two separate distinct bands observed during 2005. Examples of blanks from both weight ranges in 2005 will be sent to the manufacturing facility for further investigation.
Section 4.1.2 discussed the comparison of PM2.5 datasets weighed to EN14907 by NPL and EN12341 by Bureau Veritas. Figure 4.25 shows the variation of initial filter mass for the PM2.5 Partisols operated using Whatman QMA Quartz filters weighed by both NPL and BV. All filters weighed by NPL were approximately 150 mg, as were all but one of those sampled prior to 5th July 2007 and weighed by Bureau Veritas. The Partisol in which the BV filters were installed was broken for 2 weeks, and all Bureau Veritas weighed filters sampled after that point were approximately 155 mg. Figure 4.27 shows that the heavier filters tended to result in the over estimate PM concentrations by a greater amount than the lighter filters. This is consistent with the findings that the heavier filters have a more significant blank problem.
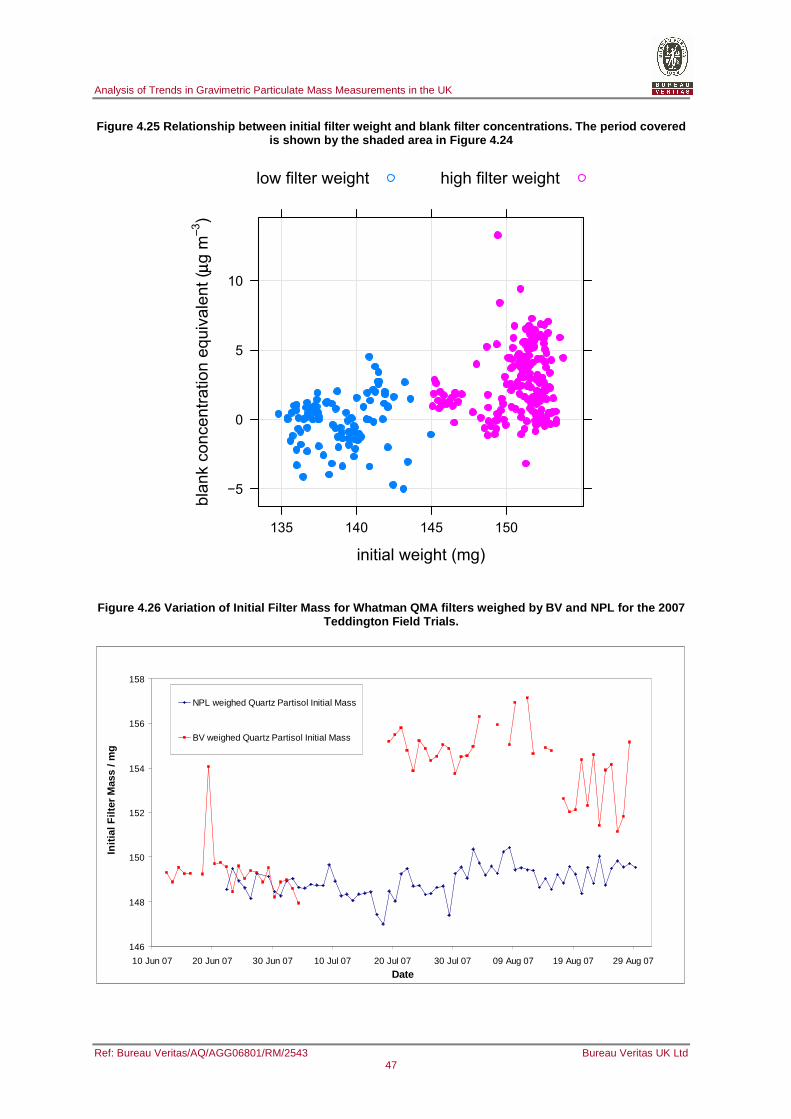
Analysis of Trends in Gravimetric Particulate Mass Measurements in the UK
Ref: Bureau Veritas/AQ/AGG06801/RM/2543 Bureau Veritas UK Ltd 47
Figure 4.25 Relationship between initial filter wei ght and blank filter concentrations. The period cov ered is shown by the shaded area in Figure 4.24
initial weight (mg)
bla
nk c
on
ce
ntr
atio
n e
qu
iva
len
t (µµ
g m
−−3)
−5
0
5
10
135 140 145 150
●
●●
●
●●●
●●●●●●
●
●●
●●●●●
●
●
● ● ●
●
●●●
●●●
●
●●
●
●
●
●
●
●
●
●
●
●●
●
●
●
●
●
●●●
●
●●
●
●
●●
●●●
●
●●●
●
●
●
●
●
●
●●
●●
●
●
●
●●
●
●
●
●
●
●
●
●
●
●
●
●●
●
●
●
●
● ●
●
●
●
●●
●
●
●● ●
●
●
●
●●
●●●
●
●
●●
●
●
●
●
●
●
●
●
●
●●
●
●
●●
● ●
●●
●●
●●
●
●
●
●
●
● ●
●●
●
●●●●●
● ●
●
●
●
●
●●
●●
●●
●
●●●
●
●● ●
●
●
●
●
●
●
●
●
● ●
●
●
●
●
●
●● ●●
●
●
●●●
●●
●● ● ●
●●
● ●●●
●
●●●
●
●●
●●●
●●●
●
●●●
●
● ●
●
●
●
●
●●
●
●●
●●
●
●●
●
●●
●
●●
●
●●
●●
●
●
●●●●
●●●●●
●
●
●
●●
●
●
●●
●●●●
●●
●
●
●●
●
●
●
●●
●
●
●
low filter weight high filter weight
Figure 4.26 Variation of Initial Filter Mass for Wha tman QMA filters weighed by BV and NPL for the 2007 Teddington Field Trials.
146
148
150
152
154
156
158
10 Jun 07 20 Jun 07 30 Jun 07 10 Jul 07 20 Jul 07 30 Jul 07 09 Aug 07 19 Aug 07 29 Aug 07
Date
Initi
al F
ilter
Mas
s / m
g
NPL weighed Quartz Partisol Initial Mass
BV weighed Quartz Partisol Initial Mass
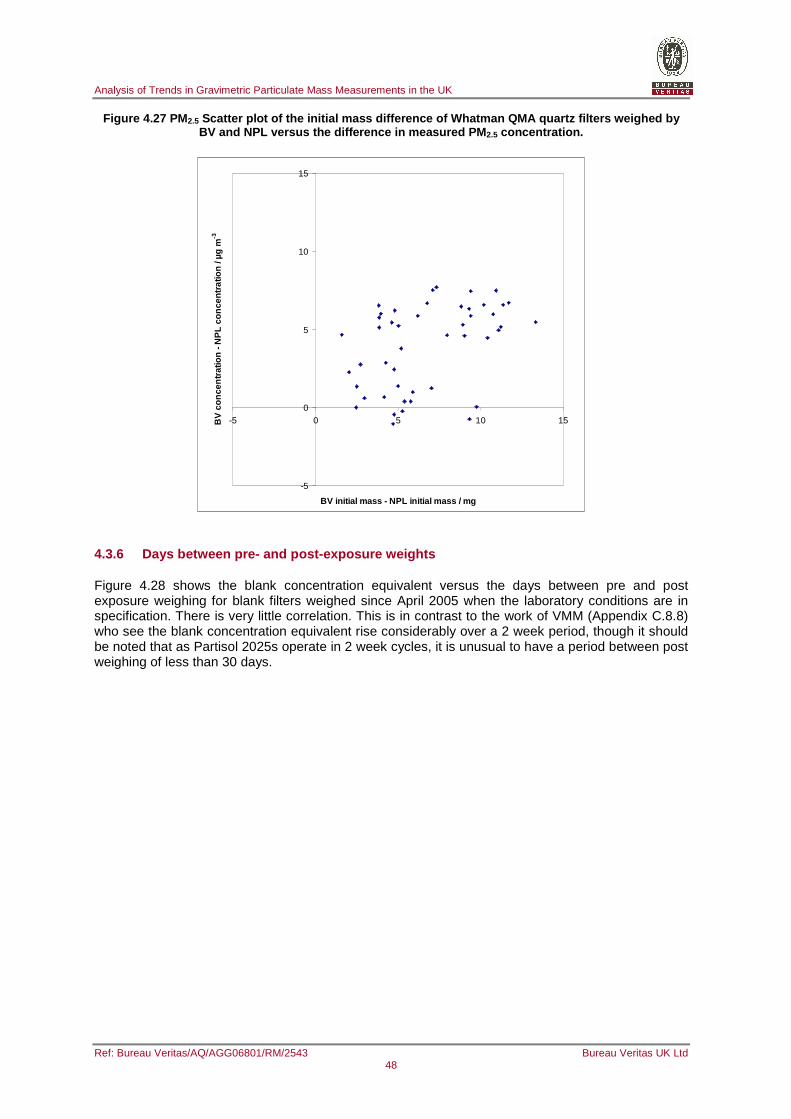
Analysis of Trends in Gravimetric Particulate Mass Measurements in the UK
Ref: Bureau Veritas/AQ/AGG06801/RM/2543 Bureau Veritas UK Ltd 48
Figure 4.27 PM 2.5 Scatter plot of the initial mass difference of Wha tman QMA quartz filters weighed by BV and NPL versus the difference in measured PM 2.5 concentration.
-5
0
5
10
15
-5 0 5 10 15
BV initial mass - NPL initial mass / mg
BV
con
cent
ratio
n - N
PL
conc
entra
tion
/ µg
m-3
4.3.6 Days between pre- and post-exposure weights
Figure 4.28 shows the blank concentration equivalent versus the days between pre and post exposure weighing for blank filters weighed since April 2005 when the laboratory conditions are in specification. There is very little correlation. This is in contrast to the work of VMM (Appendix C.8.8) who see the blank concentration equivalent rise considerably over a 2 week period, though it should be noted that as Partisol 2025s operate in 2 week cycles, it is unusual to have a period between post weighing of less than 30 days.
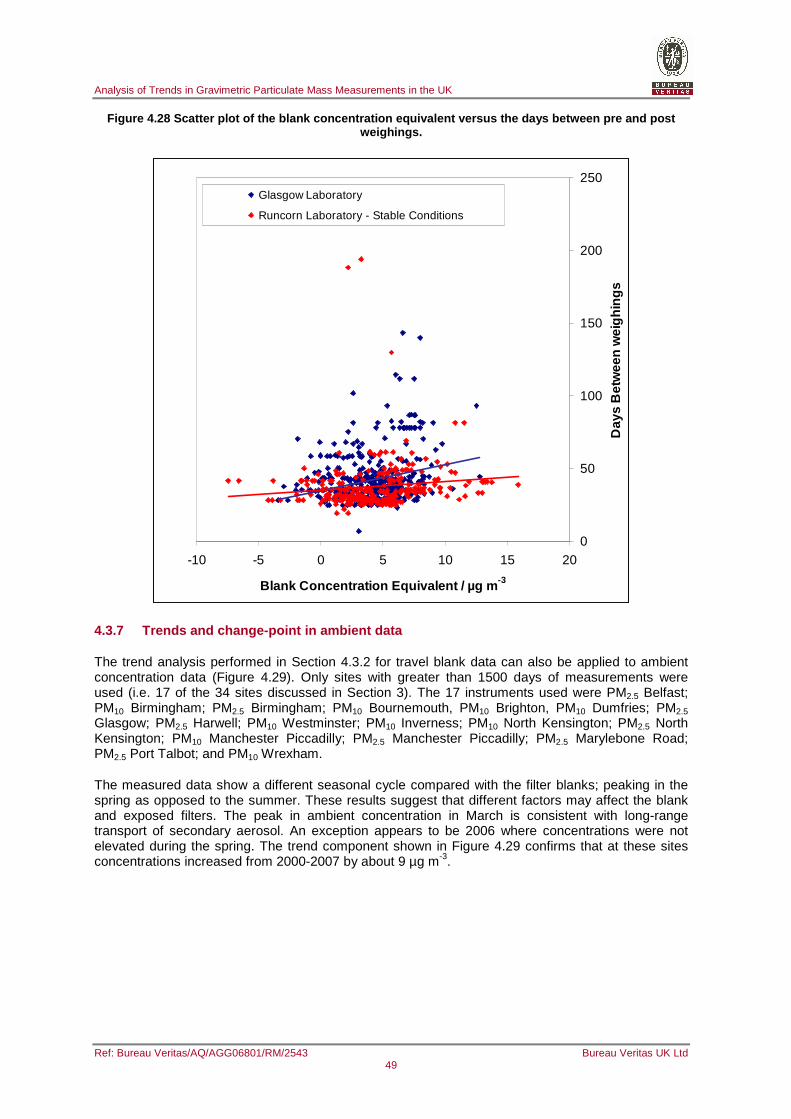
Analysis of Trends in Gravimetric Particulate Mass Measurements in the UK
Ref: Bureau Veritas/AQ/AGG06801/RM/2543 Bureau Veritas UK Ltd 49
Figure 4.28 Scatter plot of the blank concentration equivalent versus the days between pre and post weighings.
0
50
100
150
200
250
-10 -5 0 5 10 15 20
Blank Concentration Equivalent / µg m -3
Day
s B
etw
een
wei
ghin
gs
Glasgow Laboratory
Runcorn Laboratory - Stable Conditions
4.3.7 Trends and change-point in ambient data
The trend analysis performed in Section 4.3.2 for travel blank data can also be applied to ambient concentration data (Figure 4.29). Only sites with greater than 1500 days of measurements were used (i.e. 17 of the 34 sites discussed in Section 3). The 17 instruments used were PM2.5 Belfast; PM10 Birmingham; PM2.5 Birmingham; PM10 Bournemouth, PM10 Brighton, PM10 Dumfries; PM2.5 Glasgow; PM2.5 Harwell; PM10 Westminster; PM10 Inverness; PM10 North Kensington; PM2.5 North Kensington; PM10 Manchester Piccadilly; PM2.5 Manchester Piccadilly; PM2.5 Marylebone Road; PM2.5 Port Talbot; and PM10 Wrexham.
The measured data show a different seasonal cycle compared with the filter blanks; peaking in the spring as opposed to the summer. These results suggest that different factors may affect the blank and exposed filters. The peak in ambient concentration in March is consistent with long-range transport of secondary aerosol. An exception appears to be 2006 where concentrations were not elevated during the spring. The trend component shown in Figure 4.29 confirms that at these sites concentrations increased from 2000-2007 by about 9 µg m-3.

Analysis of Trends in Gravimetric Particulate Mass Measurements in the UK
Ref: Bureau Veritas/AQ/AGG06801/RM/2543 Bureau Veritas UK Ltd 50
Figure 4.29 Monthly time series of mean PM 10 and PM 2.5 concentrations decomposed into trend, seasonal and remainder components using the STL tech nique. Data are for the 17 sites where there
were at least 1500 days of valid measurements.
Change point analysis was applied to the site-averaged monthly measurements of PM10 and PM2.5
for all sites, though no significant change points could be detected. This finding is not unexpected because measured particle concentrations are affected by a wide range of sources and "real" effects tend to dominate. The analysis was therefore refined to individual sites; namely: PM2.5 concentrations at Harwell and at North Kensington. The subtraction of TEOM data from gravimetric concentrations were used to account for a large fraction of particle mass concentration. The remainder would thus consist of particle mass not detected by TEOMs (Section 2.2) and any artefact due to filter issues.
The Harwell site was chosen as it is rural, has no dominant local particle sources and has good data capture for both gravimetric and TEOM concentration measurements. The greatest difference in
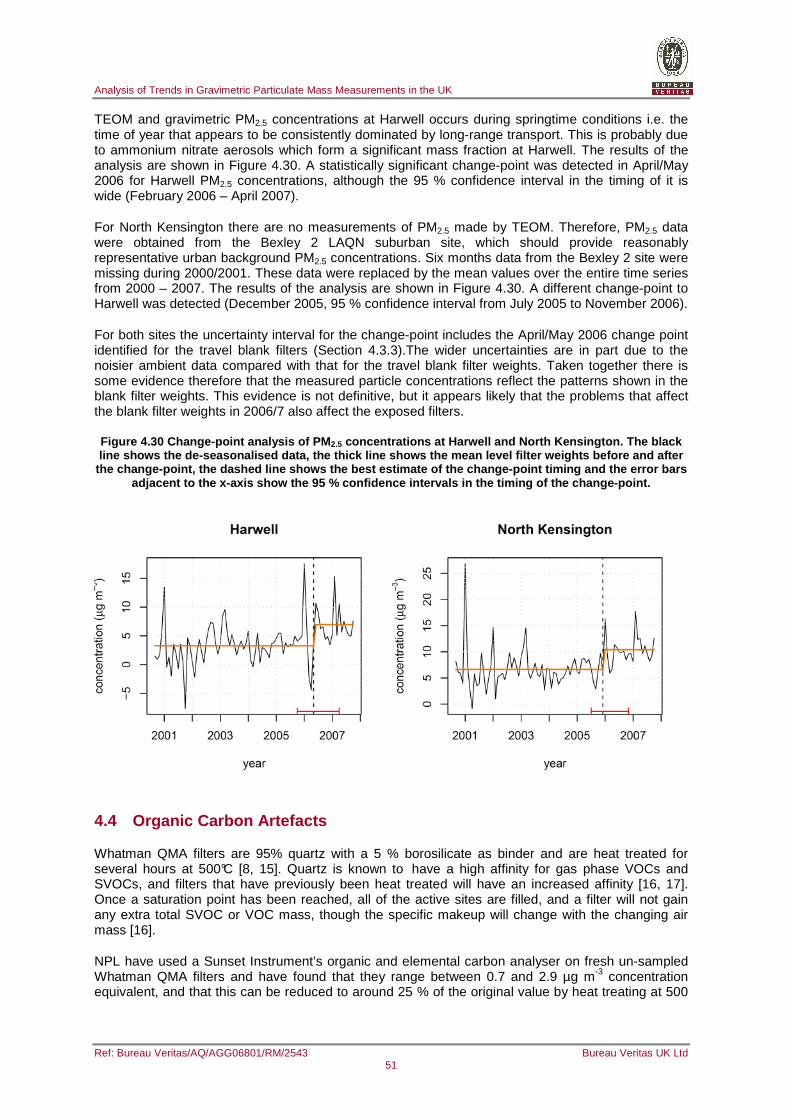
Analysis of Trends in Gravimetric Particulate Mass Measurements in the UK
Ref: Bureau Veritas/AQ/AGG06801/RM/2543 Bureau Veritas UK Ltd 51
TEOM and gravimetric PM2.5 concentrations at Harwell occurs during springtime conditions i.e. the time of year that appears to be consistently dominated by long-range transport. This is probably due to ammonium nitrate aerosols which form a significant mass fraction at Harwell. The results of the analysis are shown in Figure 4.30. A statistically significant change-point was detected in April/May 2006 for Harwell PM2.5 concentrations, although the 95 % confidence interval in the timing of it is wide (February 2006 – April 2007).
For North Kensington there are no measurements of PM2.5 made by TEOM. Therefore, PM2.5 data were obtained from the Bexley 2 LAQN suburban site, which should provide reasonably representative urban background PM2.5 concentrations. Six months data from the Bexley 2 site were missing during 2000/2001. These data were replaced by the mean values over the entire time series from 2000 – 2007. The results of the analysis are shown in Figure 4.30. A different change-point to Harwell was detected (December 2005, 95 % confidence interval from July 2005 to November 2006).
For both sites the uncertainty interval for the change-point includes the April/May 2006 change point identified for the travel blank filters (Section 4.3.3).The wider uncertainties are in part due to the noisier ambient data compared with that for the travel blank filter weights. Taken together there is some evidence therefore that the measured particle concentrations reflect the patterns shown in the blank filter weights. This evidence is not definitive, but it appears likely that the problems that affect the blank filter weights in 2006/7 also affect the exposed filters.
Figure 4.30 Change-point analysis of PM 2.5 concentrations at Harwell and North Kensington. Th e black line shows the de-seasonalised data, the thick line shows the mean level filter weights before and aft er
the change-point, the dashed line shows the best es timate of the change-point timing and the error bar s adjacent to the x-axis show the 95 % confidence int ervals in the timing of the change-point.
4.4 Organic Carbon Artefacts
Whatman QMA filters are 95% quartz with a 5 % borosilicate as binder and are heat treated for several hours at 500°C [8, 15]. Quartz is known to have a high affinity for gas phase VOCs and SVOCs, and filters that have previously been heat treated will have an increased affinity [16, 17]. Once a saturation point has been reached, all of the active sites are filled, and a filter will not gain any extra total SVOC or VOC mass, though the specific makeup will change with the changing air mass [16].
NPL have used a Sunset Instrument’s organic and elemental carbon analyser on fresh un-sampled Whatman QMA filters and have found that they range between 0.7 and 2.9 µg m-3 concentration equivalent, and that this can be reduced to around 25 % of the original value by heat treating at 500
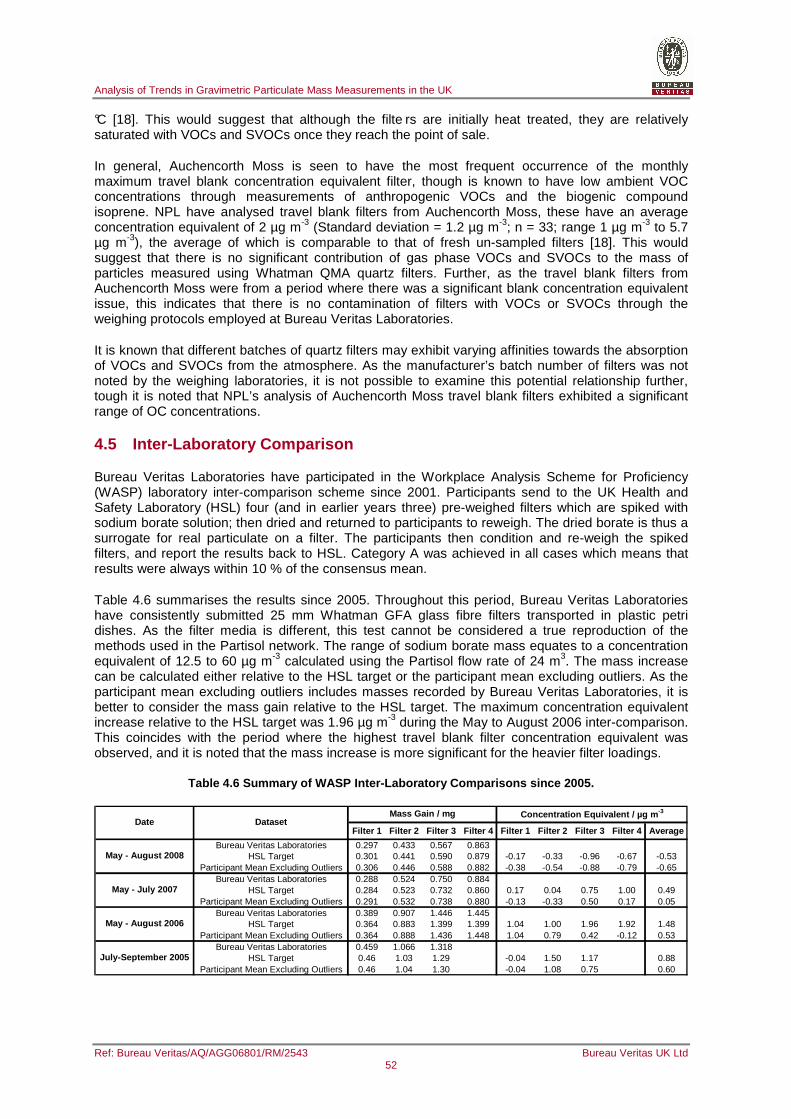
Analysis of Trends in Gravimetric Particulate Mass Measurements in the UK
Ref: Bureau Veritas/AQ/AGG06801/RM/2543 Bureau Veritas UK Ltd 52
°C [18]. This would suggest that although the filte rs are initially heat treated, they are relatively saturated with VOCs and SVOCs once they reach the point of sale.
In general, Auchencorth Moss is seen to have the most frequent occurrence of the monthly maximum travel blank concentration equivalent filter, though is known to have low ambient VOC concentrations through measurements of anthropogenic VOCs and the biogenic compound isoprene. NPL have analysed travel blank filters from Auchencorth Moss, these have an average concentration equivalent of 2 µg m-3 (Standard deviation = 1.2 µg m-3; n = 33; range 1 µg m-3 to 5.7 µg m-3), the average of which is comparable to that of fresh un-sampled filters [18]. This would suggest that there is no significant contribution of gas phase VOCs and SVOCs to the mass of particles measured using Whatman QMA quartz filters. Further, as the travel blank filters from Auchencorth Moss were from a period where there was a significant blank concentration equivalent issue, this indicates that there is no contamination of filters with VOCs or SVOCs through the weighing protocols employed at Bureau Veritas Laboratories.
It is known that different batches of quartz filters may exhibit varying affinities towards the absorption of VOCs and SVOCs from the atmosphere. As the manufacturer’s batch number of filters was not noted by the weighing laboratories, it is not possible to examine this potential relationship further, tough it is noted that NPL’s analysis of Auchencorth Moss travel blank filters exhibited a significant range of OC concentrations.
4.5 Inter-Laboratory Comparison
Bureau Veritas Laboratories have participated in the Workplace Analysis Scheme for Proficiency (WASP) laboratory inter-comparison scheme since 2001. Participants send to the UK Health and Safety Laboratory (HSL) four (and in earlier years three) pre-weighed filters which are spiked with sodium borate solution; then dried and returned to participants to reweigh. The dried borate is thus a surrogate for real particulate on a filter. The participants then condition and re-weigh the spiked filters, and report the results back to HSL. Category A was achieved in all cases which means that results were always within 10 % of the consensus mean.
Table 4.6 summarises the results since 2005. Throughout this period, Bureau Veritas Laboratories have consistently submitted 25 mm Whatman GFA glass fibre filters transported in plastic petri dishes. As the filter media is different, this test cannot be considered a true reproduction of the methods used in the Partisol network. The range of sodium borate mass equates to a concentration equivalent of 12.5 to 60 µg m-3 calculated using the Partisol flow rate of 24 m3. The mass increase can be calculated either relative to the HSL target or the participant mean excluding outliers. As the participant mean excluding outliers includes masses recorded by Bureau Veritas Laboratories, it is better to consider the mass gain relative to the HSL target. The maximum concentration equivalent increase relative to the HSL target was 1.96 µg m-3 during the May to August 2006 inter-comparison. This coincides with the period where the highest travel blank filter concentration equivalent was observed, and it is noted that the mass increase is more significant for the heavier filter loadings.
Table 4.6 Summary of WASP Inter-Laboratory Comparison s since 2005.
Filter 1 Filter 2 Filter 3 Filter 4 Filter 1 Filter 2 Fil ter 3 Filter 4 Average
Bureau Veritas Laboratories 0.297 0.433 0.567 0.863HSL Target 0.301 0.441 0.590 0.879 -0.17 -0.33 -0.96 -0.67 -0.53
Participant Mean Excluding Outliers 0.306 0.446 0.588 0.882 -0.38 -0.54 -0.88 -0.79 -0.65Bureau Veritas Laboratories 0.288 0.524 0.750 0.884
HSL Target 0.284 0.523 0.732 0.860 0.17 0.04 0.75 1.00 0.49Participant Mean Excluding Outliers 0.291 0.532 0.738 0.880 -0.13 -0.33 0.50 0.17 0.05
Bureau Veritas Laboratories 0.389 0.907 1.446 1.445HSL Target 0.364 0.883 1.399 1.399 1.04 1.00 1.96 1.92 1.48
Participant Mean Excluding Outliers 0.364 0.888 1.436 1.448 1.04 0.79 0.42 -0.12 0.53Bureau Veritas Laboratories 0.459 1.066 1.318
HSL Target 0.46 1.03 1.29 -0.04 1.50 1.17 0.88Participant Mean Excluding Outliers 0.46 1.04 1.30 -0.04 1.08 0.75 0.60
July-September 2005
May - August 2006
May - July 2007
May - August 2008
Mass Gain / mg Concentration Equivalent / µg m -3
Date Dataset
Analysis of Trends in Gravimetric Particulate Mass Measurements in the UK
Ref: Bureau Veritas/AQ/AGG06801/RM/2543 Bureau Veritas UK Ltd 53
4.6 Summary of main findings
In depth analysis of trends in PM data acquired from gravimetric samplers has shown discrepancies between the measured concentrations of PM10 undertaken using quartz filters in Partisol equipment, when compared to the EU reference method. The comparison is particularly stark at a rural site in Scotland (Auchencorth Moss) where low levels of PM10 are expected to occur.
Investigation of the influencing factors of filter media and laboratory weighing procedures (between two key providers in the UK) show that both have a contributing influence to the apparent over-estimation of PM2.5 concentrations. It is therefore anticipated that similar impacts would be observed for PM10 measurements based on the same filter media and using the same laboratory filter weighing procedures.
Increases in the mass of travel blanks appears to be the strongest influencing factor in discrepancies between filter-based methods with non-filter based methods for PM measurements. Specifically, a significant increase in the mass of travel blank filters appears evident in the last two years (2006/2007).
An audit of the current UKAS accredited provider on filter mass measurements to the UK network has considered issues around the stability of the environmental conditions in which filters are conditioned; the procedures for conditioning filters; the re-use of storage containers (i.e. cleanliness); the potential for deposited dust occurring within the filter conditioning room and the impact of the re-location of the facility from Runcorn to Glasgow. The audit has shown areas of minor improvement in procedures associated with the provision of filter weighing services, but nothing substantial that may otherwise provide for assurance that an impact on travel blank filter weights is expected.
Statistical analysis of the trends in filter blank mass have considered hidden trends within the data set, which appear to highlight the presence of a strong seasonal affect within the overall trend in filter blanks over 2001 – 2007. This seasonal affect is shown to correlate well with ambient absolute humidity. Change-point analysis on de-seasonalised data has confirmed the presence of a statistically significant step change in the data set around April 2006, when measured concentrations appeared to increase by approximately 3 µg m-3. The laboratory audit and further consultation have not as yet elucidated the precise reasons for such a change.
Analysis of initial blank filter weights has shown that there appears to be two distinct types of nominally identical filters within the dataset, providing for a difference of approximately 2.5 µg m-3, although it would appear that these filters comply with the margins of tolerance (127 mg to 144 mg) in weight to comply with the equipment manufacturers quality criteria.
Statistical analysis of the trends in ambient concentrations confirms that a seasonal cycle exists within the reported concentrations data, albeit with a different pattern of occurrence. The peak in ambient concentrations of PM in March is consistent with long-range transport of secondary aerosol. Considering all instruments for which there are greater than 1500 days of data, no significant change-point was found within the trend analysis, although concentrations were shown to increase from 2000 – 2007 by approximately 9 µg m-3. It is thought the lack of significant change-point in the ambient data is attributed to over-riding impacts of real effects – such as peak occurrence in March. Further analysis on ambient data (through subtraction of TEOM data from the Partisol data) has confirmed that significant change-points are found, albeit at differing times (April/May 2006 at Harwell and December 2005 at North Kensington). This suggests that the increase in travel blank mass is having an effect on ambient concentrations.
Inter-laboratory comparison results have been consistently within recognised HSL tolerance levels throughout the period of operation of the Partisol networks. The most significant mass differences were consistent with the timing of the highest travel blank filter concentration equivalent. However, it should be noted that the sodium borate mass was highest in this WASP study, and that the concentration equivalent was much lower in magnitude than that of the quartz travel blanks weighed in this period.
Analysis of Trends in Gravimetric Particulate Mass Measurements in the UK
Ref: Bureau Veritas/AQ/AGG06801/RM/2543 Bureau Veritas UK Ltd 54
5 Consultation and Response Summaries
As part of the need to seek wider opinion on the issues around gravimetric analysis of particulate matter included in this report, a consultation exercise was undertaken on the May 2008 draft version of the report through and open letter to UK and European experts. Consultation was undertaken by Defra on behalf of the devolved administrations with the view to inviting opinion on a number of questions:
1. Do you think the arguments as set out in the paper adequately demonstrate that there is a problem?
2. Are there any further analyses which could be carried out to elucidate the reasons behind the field blank issue?
3. Should the annual mean gravimetric concentrations be corrected for the blank concentrations as described in Table 4.4?
4. Should the daily gravimetric concentrations be corrected for the blank concentrations as described in Table 4.4?
5. In the future should the daily gravimetric concentrations be corrected for the field blank concentrations?
6. Should the difference between quartz and Teflon coated glass fibre be taken into account in the daily/annual mean gravimetric concentrations reported data and as the basis for modelling?
7. Do you have any data which you could contribute which may add to the elucidation of this issue?
Responses were drawn from a wide range of experts, bodies and organisations involved in ambient pollution monitoring, including the following:
1. Jan Matthijsen, Netherlands Environmental Assessment Agency (PBL).
2. Anonymous
3. Theo Hafkenscheid, RIVM (2 sets of responses)
4. Shaun Drummond, SEPA
5. Jaap Visser, GGD, Amsterdam
6. Ulrich Pfeffer, LANUV NRW
7. Luisa Marelli, JRC
8. Richard Turle, AAQD, ESTC
9. Jordy Vercauteren, VMM
10. Mat Heal, University of Edinburgh
The general consensus is that the report adequately demonstrates a problem. However, the majority of respondents felt that correction should not be carried out until after the outcome of Working Group 15, which continues to investigate issues around methods and uncertainty in gravimetric analysis. Most felt that as it is not definitive that the field blank is of the same magnitude as the overestimation, it is essential that the cause of the overestimation is identified before any corrections are applied. The authors continue to investigate the root cause of the issue. However, having identified the issue, a procedure for correcting field data using blank filters is proposed on the basis that future data still requires consideration to the application of tightened QA/QC procedures.
Analysis of Trends in Gravimetric Particulate Mass Measurements in the UK
Ref: Bureau Veritas/AQ/AGG06801/RM/2543 Bureau Veritas UK Ltd 55
JRC suggests the application of daily correction factors which, while statistically valid, pose problems in relation to the shortage of filter blank measurements. It is possible that calculations may be done on a monthly basis in order to correct by monthly factors and then use these to calculate the annual averages. Sites where data capture is significantly less than 90% may benefit from an approach as it allows for the fact that the correction factor varies over the course of the year.
Examples of supporting data were presented and these are included in the fuller consultation included in Appendix C. Evidence provided in support of consultation responses highlight clear problems with the use of quartz used elsewhere, though not always to the same magnitude.
The views on whether the difference between quartz and Emfab should be taken in to account in connections with modelling assessment work were highly mixed. On the basis that modelling work has been compared with known over-estimated PM10 and PM2.5 concentrations the modelling assessment has been corrected for the reports against UK compliance with the PM10 Limit Values for 2005 and 2006. It is understood that deployment of additional EN12341 compliant equipment in recent years in the UK affords the potential for further comparison against the Filter Dynamic Measurement System (FDMS), which does not show the same artefacts associated with the filter use that are reported here.
In order to identify the cause of the overestimation, research to date has focused on assessing the laboratory and attempting to find a cause. It is suggested that further work be done on the catalogue of filters that weigh higher than expected. For example, if humidity is the problem, then if field blanks were to be put into a desiccator it should be possible to remove the extra mass. One reviewer mentioned using a mass balance technique on sampled filters. This can be considered in more detail, though it should be noted that Quartz filters provide for limitations on the applicability of some analytical methods. Similar suggestions for widening the scope of work to include issues such as health affects and steps to be taken on a European and National level to improve reduce health risks, whilst undertaking further analysis on trends in emissions and modelling, were made. The authors feel that this greatly extends the scope of the existing report and, as such, feel that an inherent risk to diluting the key messages on problems around gravimetric monitoring would be diluted. However, it is accepted that the primary findings of this report could be used in a second report that widens its scope to include these issues.
A copy of the full consultation responses to the questions posed are shown in Appendix C.
Analysis of Trends in Gravimetric Particulate Mass Measurements in the UK
Ref: Bureau Veritas/AQ/AGG06801/RM/2543 Bureau Veritas UK Ltd 56
6 Correction of Partisol Data
Section 3 discussed trends in the annual average PM10 and PM2.5 concentrations for Partisols operating with Bureau Veritas Laboratories weighed Whatman QMA quartz filters. It is desired to correct these data for a more accurate interpretation of trends.
A previous draft for consultation of this report (published May 2008) proposed correction by subtracting the average blank concentration equivalent from the annual mean data (Table 4.4). These values have to be calculated using the date that the blank filter was placed in to the sampler, as it is not possible to match up historical sampled filters by the date they were pre or post weighed. Note that on Table 4.4, there are only 2 data points for the year 2000, and so confidence in the average concentration is very low. Section 4.3.1 discussed that it is possible that the overestimation of PM on sampled filters is dependent on site location, though there is no way of identifying this, at least until the cause of the laboratory offset is identified. Section 4.1.3 discussed how there was no difference between blanks for PM10 and PM2.5, and as such, both PM10 and PM2.5 instruments are corrected by an identical factor.
After consultation, it was decided that the daily data should be corrected by subtraction of the monthly correction factor for the month in which the filter was sampled (Table 4.5), and to use these data to calculate annual averages. For 2000, there were only 2 blank filters, and so the annual average is used for filters sampled in this year. Use of this method has the advantage in that sites with less than 100 % data capture are corrected more accurately; and as the seasonal variation is corrected for, the daily data are valid, and so the link between daily and annual averages is maintained. The annual correction method proposed in the previous draft was calculated using the average rounded (to zero decimal places) daily data on the National database. The monthly corrected method used the raw un-rounded daily concentration data, and so is more accurate.
Use of this method results in occasional days when the corrected daily concentrations are less than zero. For the calculation of the annual averages, these negative values are left in as their removal would inaccurately bias the average. However, for daily data included in the National database and archive, it is proposed to remove days when corrected concentrations are less than zero. It is also proposed to retain the uncorrected dataset in addition to the corrected dataset. Figure 6.1 and Figure 6.2 show the corrected trends in PM10 and PM2.5 for sites previously shown uncorrected in Figure 3.5 and Figure 3.6. Appendix B shows graphs each site individually; with error bars corresponding to one standard deviation of the annual mean travel blank (Table 4.4). After correction, there is increased evidence for reducing concentrations, though PM10 concentrations are still rising at Westminster. Appendix B also summarises the uncorrected and corrected concentrations for each site, along with available TEOM and FDMS data.
The EC Directive [19] specifies a Data Quality Objective of 25% for individual PM10 and PM2.5 measurements averaged over the period considered by the limit value, for a 95 % confidence interval, and interpreted as being applicable in the region of the appropriate limit value. Hence, it is important to consider the expanded uncertainty of Partisol data corrected by this method relative to the reference methods. The limit values in the EC Directive apply throughout the UK (and to all other Member States of the European Union). However, within the UK Air Quality Strategy [20] the Scottish Government has set Air Quality Objectives at lower concentrations than the limit values set in the EC Directive. There is no specific data uncertainty requirement associated with the Scottish Air Quality Objectives, but for information, we have also assessed the Partisol data uncertainty at these values. Table 6.1 shows the error calculation for different Limit Values. For PM10, the 2006 equivalence report [2] calculated an expanded uncertainty of 7.99 % at a daily limit value of 50 µg m-
3; 9.93 % at an annual limit value of 40 µg m-3; and 21.84 % if the results are recalculated to the proposed Scottish annual Objective of 18 µg m-3 [3]. The primary differences between EN12341 and the approach used in the equivalence study were that Emfab filters were used instead of quartz, and that filters were weighed to the more rigorous EN14907 standard. As both the reference and candidate methods were operated as such, the errors due to these deviations cancel each other out. As such, it is necessary to add the error due to the correction of data by the monthly average blank concentration equivalent to those found in the equivalence studies.
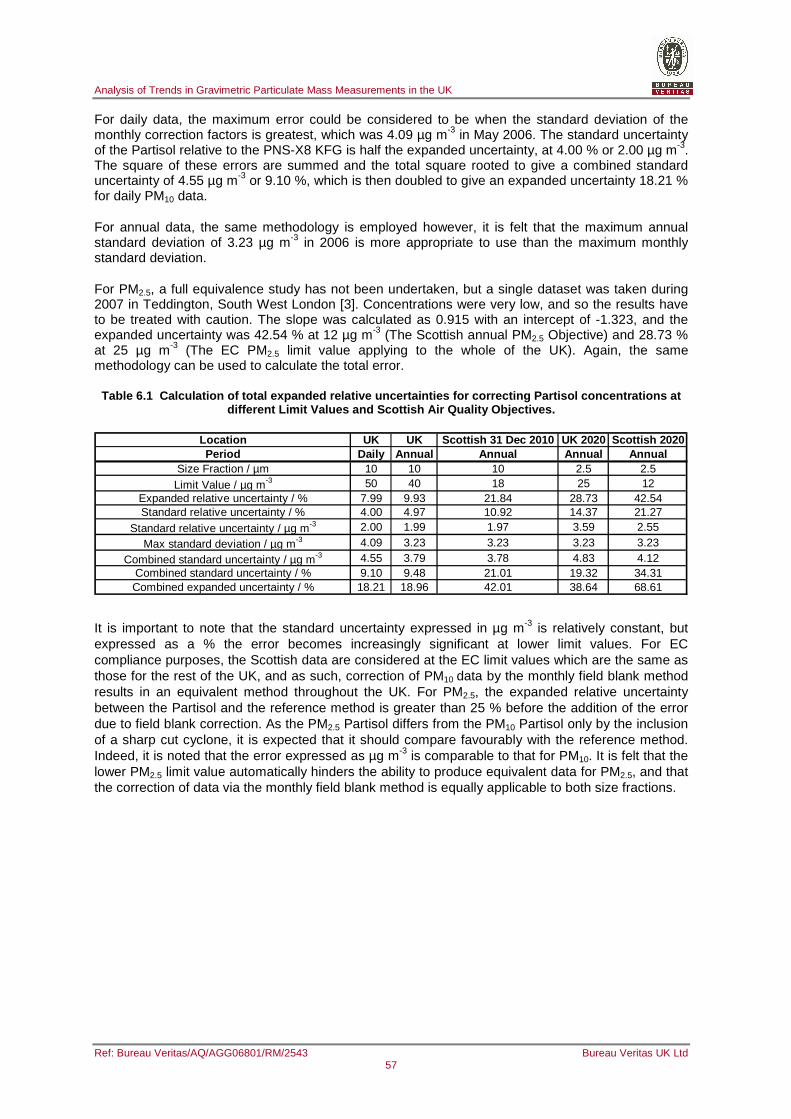
Analysis of Trends in Gravimetric Particulate Mass Measurements in the UK
Ref: Bureau Veritas/AQ/AGG06801/RM/2543 Bureau Veritas UK Ltd 57
For daily data, the maximum error could be considered to be when the standard deviation of the monthly correction factors is greatest, which was 4.09 µg m-3 in May 2006. The standard uncertainty of the Partisol relative to the PNS-X8 KFG is half the expanded uncertainty, at 4.00 % or 2.00 µg m-3. The square of these errors are summed and the total square rooted to give a combined standard uncertainty of 4.55 µg m-3 or 9.10 %, which is then doubled to give an expanded uncertainty 18.21 % for daily PM10 data.
For annual data, the same methodology is employed however, it is felt that the maximum annual standard deviation of 3.23 µg m-3 in 2006 is more appropriate to use than the maximum monthly standard deviation.
For PM2.5, a full equivalence study has not been undertaken, but a single dataset was taken during 2007 in Teddington, South West London [3]. Concentrations were very low, and so the results have to be treated with caution. The slope was calculated as 0.915 with an intercept of -1.323, and the expanded uncertainty was 42.54 % at 12 µg m-3 (The Scottish annual PM2.5 Objective) and 28.73 % at 25 µg m-3 (The EC PM2.5 limit value applying to the whole of the UK). Again, the same methodology can be used to calculate the total error.
Table 6.1 Calculation of total expanded relative u ncertainties for correcting Partisol concentrations at different Limit Values and Scottish Air Quality Obje ctives.
Location UK UK Scottish 31 Dec 2010 UK 2020 Scottish 202 0Period Daily Annual Annual Annual Annual
Size Fraction / µm 10 10 10 2.5 2.5Limit Value / µg m-3 50 40 18 25 12
Expanded relative uncertainty / % 7.99 9.93 21.84 28.73 42.54Standard relative uncertainty / % 4.00 4.97 10.92 14.37 21.27
Standard relative uncertainty / µg m-3 2.00 1.99 1.97 3.59 2.55
Max standard deviation / µg m-3 4.09 3.23 3.23 3.23 3.23
Combined standard uncertainty / µg m-3 4.55 3.79 3.78 4.83 4.12Combined standard uncertainty / % 9.10 9.48 21.01 19.32 34.31Combined expanded uncertainty / % 18.21 18.96 42.01 38.64 68.61
It is important to note that the standard uncertainty expressed in µg m-3 is relatively constant, but expressed as a % the error becomes increasingly significant at lower limit values. For EC compliance purposes, the Scottish data are considered at the EC limit values which are the same as those for the rest of the UK, and as such, correction of PM10 data by the monthly field blank method results in an equivalent method throughout the UK. For PM2.5, the expanded relative uncertainty between the Partisol and the reference method is greater than 25 % before the addition of the error due to field blank correction. As the PM2.5 Partisol differs from the PM10 Partisol only by the inclusion of a sharp cut cyclone, it is expected that it should compare favourably with the reference method. Indeed, it is noted that the error expressed as µg m-3 is comparable to that for PM10. It is felt that the lower PM2.5 limit value automatically hinders the ability to produce equivalent data for PM2.5, and that the correction of data via the monthly field blank method is equally applicable to both size fractions.
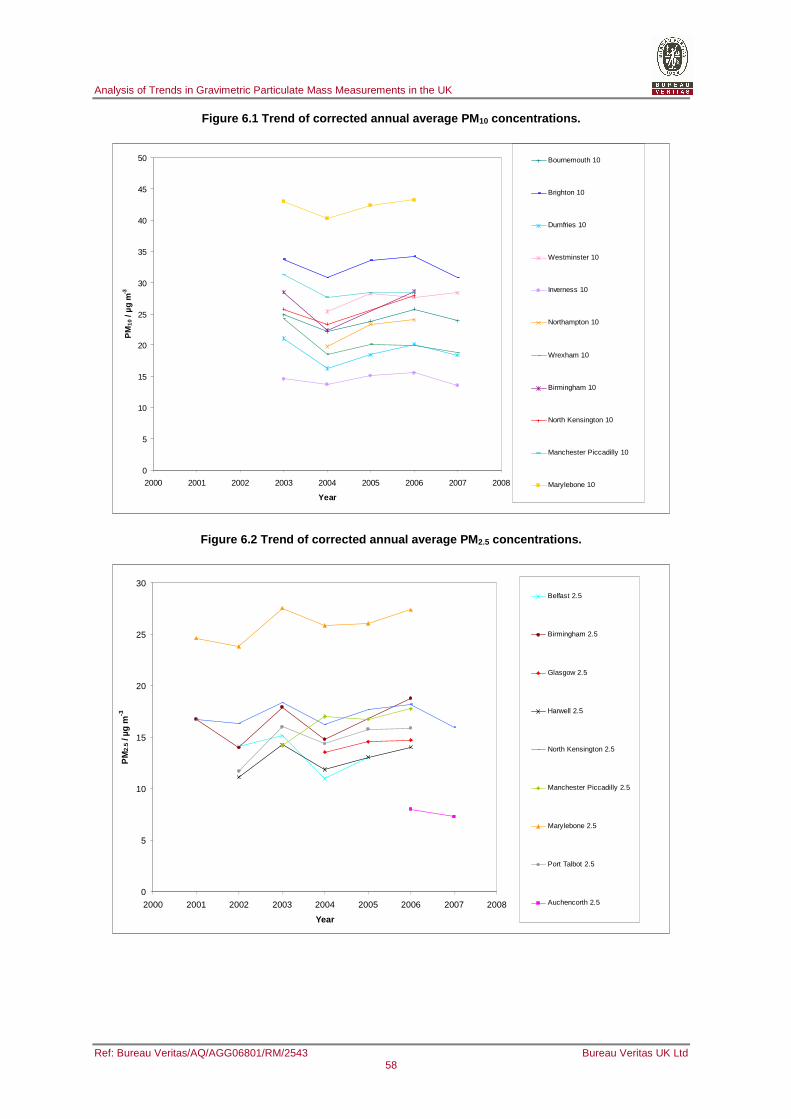
Analysis of Trends in Gravimetric Particulate Mass Measurements in the UK
Ref: Bureau Veritas/AQ/AGG06801/RM/2543 Bureau Veritas UK Ltd 58
Figure 6.1 Trend of corrected annual average PM 10 concentrations.
0
5
10
15
20
25
30
35
40
45
50
2000 2001 2002 2003 2004 2005 2006 2007 2008
Year
PM
10 /
µg m
-3
Bournemouth 10
Brighton 10
Dumfries 10
Westminster 10
Inverness 10
Northampton 10
Wrexham 10
Birmingham 10
North Kensington 10
Manchester Piccadilly 10
Marylebone 10
Figure 6.2 Trend of corrected annual average PM 2.5 concentrations.
0
5
10
15
20
25
30
2000 2001 2002 2003 2004 2005 2006 2007 2008
Year
PM
2.5
/ µg
m-3
Belfast 2.5
Birmingham 2.5
Glasgow 2.5
Harwell 2.5
North Kensington 2.5
Manchester Piccadilly 2.5
Marylebone 2.5
Port Talbot 2.5
Auchencorth 2.5
Analysis of Trends in Gravimetric Particulate Mass Measurements in the UK
Ref: Bureau Veritas/AQ/AGG06801/RM/2543 Bureau Veritas UK Ltd 59
7 Implications for compliance with EU Directives
Within the UK, compliance with the EU Air Quality Directive for PM is based on both modelling (the Pollution Climate Mapping (PCM) model) and monitoring within the AURN. The PCM model uses monitoring data and the UK disaggregated emission inventory along with measurements and models for other PM components, including secondary PM to map estimated ambient pollutant concentrations on a 1x1km scale and for individual urban road links throughout the UK. Up to 2003, the PCM model was based on TEOMx1.3 measurements – as these were the best available measurements of gravimetric PM at the time.
However since the results of the PM Equivalence Programme showed that TEOM measurements were not equivalent to the EU reference method (even when multiplied by 1.3) a new approach was needed. Although Partisol measurement was limited to relatively few locations, these were the only data measured by an EU Equivalent methodology in the UK and hence, the PCM maps were based on these Partisol measurements.
Therefore, it follows that if there is a bias in the Partisol data, this is reflected in the PCM model data for the whole of the UK and, if the bias is positive this may be leading to the UK reporting more exceedences of the Directive than would be the case for unbiased data.
For 2007, a body of FDMS PM10 data are also available and PCM maps based on these data have been produced. Figure 7.1 and Figure 7.2 show how the PCM model and AURN TEOM FDMS data compare at background and roadside sites respectively. Agreement for the FDMS is, of course, good as the model used was scaled to this dataset. The figures also show that the model provides good agreement with TEOM data from the AURN as adjusted using the Volatile Correction Model (VCM). The plot shows how the Partisol data as measured appears to be higher than the corresponding TEOM FDMS data. Much better agreement between Partisol and FDMS data is achieved if the Partisol data are corrected by the monthly correction method detailed in Section 6. An additional bias of 2.5 µg m-3 has also been subtracted to account for the difference between quartz filter media and the Emfab filter media used in the UK equivalence trials. This value of 2.5 µg m-3 was chosen to provide the best model calibration for the PCM models for PM10 and PM2.5 for 2005 and 2006. This is somewhat smaller than the 3.8 µg m-3 bias for difference between the two filter types shown in Figure 4.4.
This analysis indicates that there could be significant discontinuity between the 2006 and earlier maps based on Partisol data and the 2007 map based on FDMS data, unless the appropriate annual Partisol bias is removed. This is particularly important for 2005 as this is defined, by the EU, as the base year for Member States applying for a time extension for compliance with the Directive limit values for PM10.
The UK is split into 43 geographical zones for EU reporting. Analysis for 2007 using a combination of the PCM models calibrated using FDMS data and monitoring data suggests that a total of 6 zones will be reported as exceeding the 24-hour limit value (3 zones measured and 3 additional zones modelled). This can be compared with total of 29 zones (3 measured and 26 modelled) for 2005 and 30 zones (5 measured and 25 modelled) for 2006 for PCM models calibrated using the Partisol data as measured or 8 zones (3 measured and 5 modelled) for 2005 and 15 zones (5 measured and 10 modelled) for 2006 using PCM models calibrated using the corrected Partisol data. Thus the analyses for 2005 and 2006 based on the corrected data are much more consistent with the analysis for 2007.
The modelling analyses for 2005 and 2006 were carried out using the annual correction method from the previous version of this report dated May 2008. A comparison of the results from the monthly and annual correction methods for the sites used in the models shows little difference between the methods used to correct the annual means (Table 7.1 and Table 7.2), and this is not thought to change the validity of the2005 and 2006 model results.
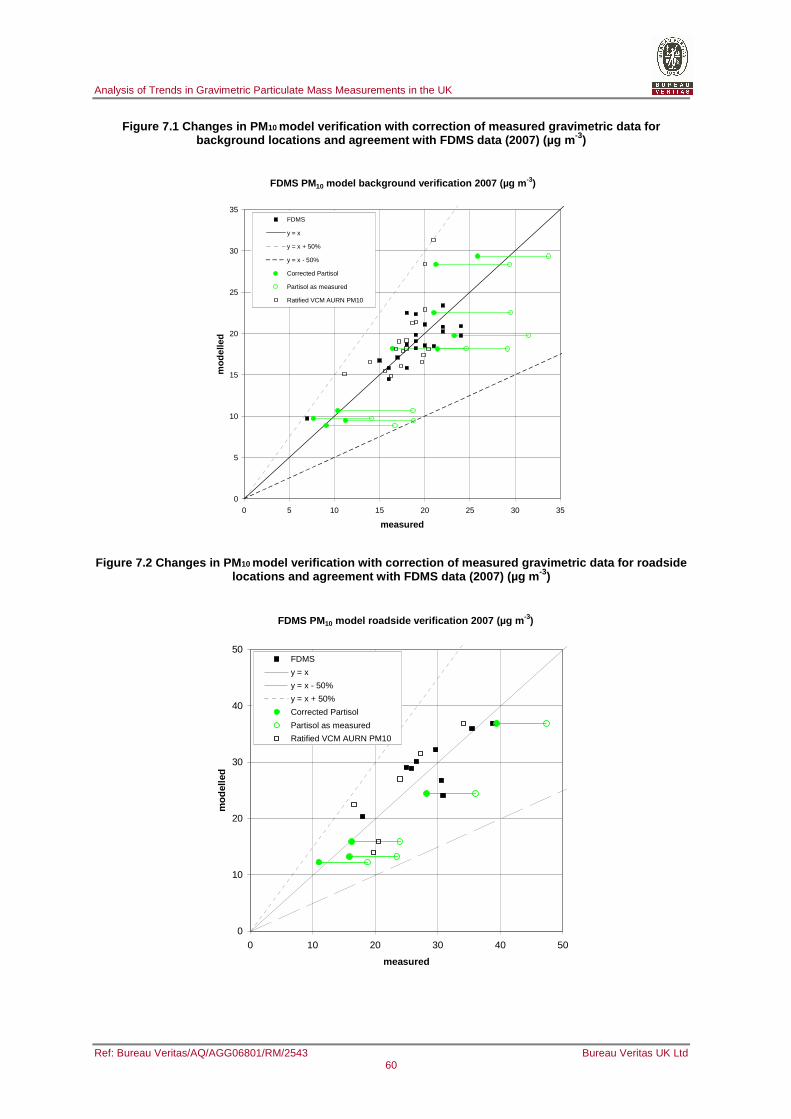
Analysis of Trends in Gravimetric Particulate Mass Measurements in the UK
Ref: Bureau Veritas/AQ/AGG06801/RM/2543 Bureau Veritas UK Ltd 60
Figure 7.1 Changes in PM 10 model verification with correction of measured grav imetric data for background locations and agreement with FDMS data (2 007) (µg m -3)
FDMS PM10 model background verification 2007 (µg m -3)
0
5
10
15
20
25
30
35
0 5 10 15 20 25 30 35
measured
mod
elle
dFDMS
y = x
y = x + 50%
y = x - 50%
Corrected Partisol
Partisol as measured
Ratified VCM AURN PM10
Figure 7.2 Changes in PM 10 model verification with correction of measured grav imetric data for roadside locations and agreement with FDMS data (2007) (µg m -3)
FDMS PM10 model roadside verification 2007 (µg m -3)
0
10
20
30
40
50
0 10 20 30 40 50
measured
mod
elle
d
FDMS
y = x
y = x - 50%
y = x + 50%
Corrected Partisol
Partisol as measured
Ratified VCM AURN PM10
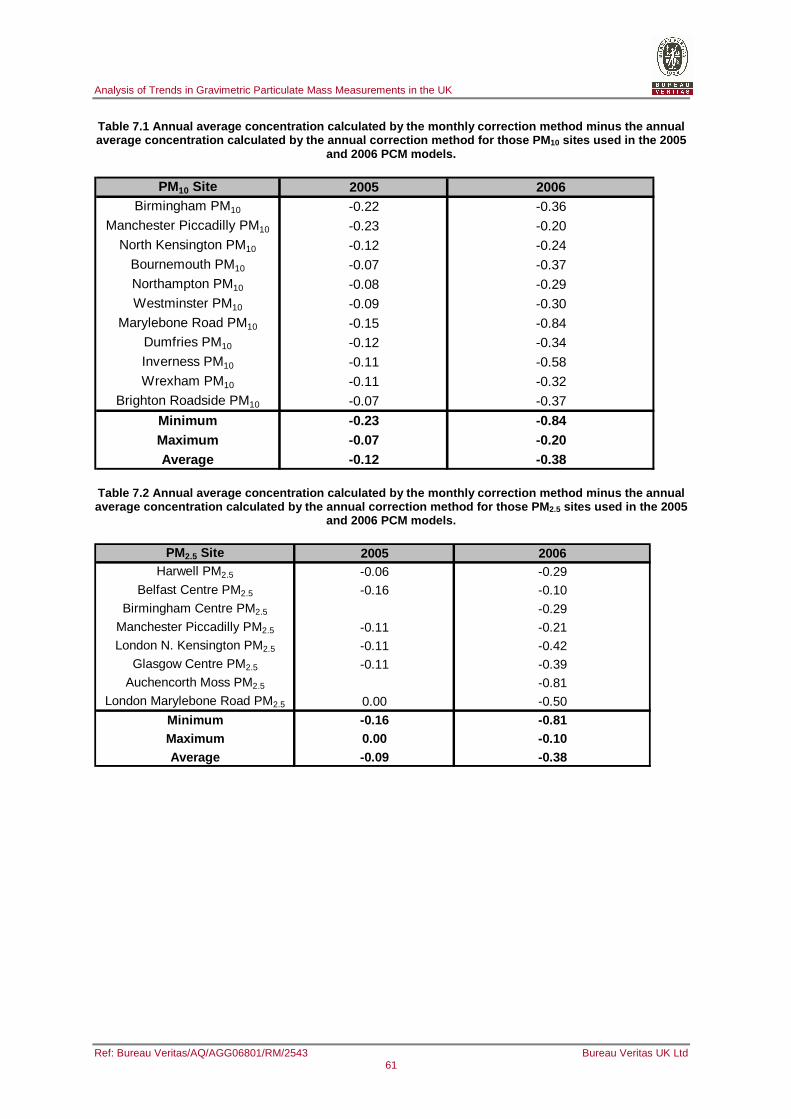
Analysis of Trends in Gravimetric Particulate Mass Measurements in the UK
Ref: Bureau Veritas/AQ/AGG06801/RM/2543 Bureau Veritas UK Ltd 61
Table 7.1 Annual average concentration calculated b y the monthly correction method minus the annual average concentration calculated by the annual corr ection method for those PM 10 sites used in the 2005
and 2006 PCM models.
PM10 Site 2005 2006Birmingham PM10 -0.22 -0.36
Manchester Piccadilly PM10 -0.23 -0.20North Kensington PM10 -0.12 -0.24
Bournemouth PM10 -0.07 -0.37Northampton PM10 -0.08 -0.29Westminster PM10 -0.09 -0.30
Marylebone Road PM10 -0.15 -0.84Dumfries PM10 -0.12 -0.34Inverness PM10 -0.11 -0.58Wrexham PM10 -0.11 -0.32
Brighton Roadside PM10 -0.07 -0.37
Minimum -0.23 -0.84Maximum -0.07 -0.20Average -0.12 -0.38
Table 7.2 Annual average concentration calculated b y the monthly correction method minus the annual average concentration calculated by the annual corr ection method for those PM 2.5 sites used in the 2005
and 2006 PCM models.
PM2.5 Site 2005 2006Harwell PM2.5 -0.06 -0.29
Belfast Centre PM2.5 -0.16 -0.10Birmingham Centre PM2.5 -0.29
Manchester Piccadilly PM2.5 -0.11 -0.21London N. Kensington PM2.5 -0.11 -0.42
Glasgow Centre PM2.5 -0.11 -0.39Auchencorth Moss PM2.5 -0.81
London Marylebone Road PM2.5 0.00 -0.50
Minimum -0.16 -0.81Maximum 0.00 -0.10Average -0.09 -0.38
Analysis of Trends in Gravimetric Particulate Mass Measurements in the UK
Ref: Bureau Veritas/AQ/AGG06801/RM/2543 Bureau Veritas UK Ltd 62
8 Future Considerations and Mitigation Plans
Clearly, going forward, filter weighing issues need to be more tightly controlled. Bureau Veritas has already initiated the use of a blank filter with every cassette of 14 filters used at all sites. This will mean that, in future, there will be a blank value associated with every filter batch. This will provide much better data on the magnitude of the blank value and quickly highlight any seasonal change, drift or sudden change in this value. Initial studies in to the use of this blank to correct the data on a fortnightly per site basis indicate that this approach is less reliable than the monthly correction method, particularly as occasionally the designated field blank will occasionally be sampled, and so no correction can be made.
We are currently undergoing a system of regular laboratory weighing inter-comparisons to monitor laboratory weighing performance, and the results from these will provide valuable insight in to any potential laboratory biases. The issue of laboratory blanks in addition to "travel" blanks also needs to be assessed and possibly trialled to see if this provides additional useful information. It is intended to test historic travel blank filters in order to identify any contamination upon them. Methods could involve mass balance techniques or placing filters in desiccators or passing clean air through them in order to observe if the mass can be significantly reduced by the removal of water and/or volatile organics from the filters. The very recent research by VMM on the time the filters are left in the instrument may provide valuable insight in to the problem, and highlights the potential to use techniques to analyse the amount of water in filters. Further, the potential for individual filter magazines to be contaminated has not yet been investigated.
The present report proposes a correction factor for Partisol 2025 data collected using Whatman QMA quartz filters weighed by Bureau Veritas Laboratories. It is important to reiterate that this report does not propose a correction factor for Partisol 2025 data collected prior to February 2003 where the filters were Teflon (as weighed by Bureau Veritas or AEA) or quartz (as weighed by AEA). Distinction in the data set in relation to the use of Teflon and quartz filters is therefore recommended in order to inform users of the end data that differences exist.
Previously, not all of the instruments discussed in this report were incorporated in to the AURN. Those that were part of a research project were not audited to the same high standards associated with the AURN. As part of the CMCU and QAQC contract renewals beginning April 2008, all Partisols are incorporated into the AURN and the same quality standards apply.
It is proposed that regular comparison with results reported by FDMS analysers will be more easily facilitated and will become a routine quality check on both monitoring methods.
Analysis of Trends in Gravimetric Particulate Mass Measurements in the UK
Ref: Bureau Veritas/AQ/AGG06801/RM/2543 Bureau Veritas UK Ltd 63
Acknowledgements
The authors are grateful to a large number of people, bodies and organisations for their cooperation during the course of this work, including the following:
Members of the Government Air Quality Expert Group for their consideration to the preliminary outcomes of the work and for their guidance on further work included here, including: Prof. Roy Harrison, Dr Paul Quincey, Dr Mathew Heal, Prof. Duncan Laxen, and Dr Dick Derwent.
Special thanks to Dr Tim Murrells, from AEA for his contribution to trends in emissions. To David Djonge of the Municipal Health Service, Amsterdam, The Netherlands, for his provision of data and to Tony Clark and David Butterfield for their comments and suggestions throughout the formulation of this analysis.
Thanks also to all those who responded to the questions raised in the second consultation document:
Jan Matthijsen, Netherlands Environmental Assessment Agency (PBL).
Theo Hafkenscheid, RIVM (2 sets of responses)
Shaun Drummond, SEPA
Jaap Visser, GGD, Amsterdam
Ulrich Pfeffer, LANUV NRW
Luisa Marelli, JRC
Richard Turle, AAQD, ESTC
Jordy Vercauteren, VMM
Thanks to Gary Fuller and David Green for their comments and provision of Emfab filter data.
Additional thanks go to the following local authorities for the provision of additional data on field blanks through gravimetric measurements made via locally operated networks: Derby City Council; BAA; North Lincolnshire Council; and Liverpool City Council.
Analysis of Trends in Gravimetric Particulate Mass Measurements in the UK
Ref: Bureau Veritas/AQ/AGG06801/RM/2543 Bureau Veritas UK Ltd 64
References [1] Demonstration of Equivalence of Ambient Air Monitoring Methods (Version 3). http://europa.eu.int/comm/environment/air/pdf/equivalence_report3.pdf
[2] Harrison D., UK Equivalence Programme for Monitoring of Particulate Matter, Bureau Veritas Report No. Bureau Veritas/AQ/AD202209/DH/2396, http://www.airquality.co.uk/archive/reports/cat05/0606130952_UKPMEquivalence.pdf
[3] Bureau Veritas Draft Report for: Department for Environment, Food and Rural Affairs; Welsh Assembly Government; Scottish Executive; Department of Environment for Northern Ireland. UK Particulate Matter Monitoring: Further Comparative Study and Re-Analysis of 2006 Report Results Ref: Bureau Veritas/AQ/AD202209/DH/2519 DATE 9th January 2008
[4] www.naei.org.uk/index.php
[5] www.defra.gov.uk/environment/statistics/airqual/download/xls/aqtb11.xls
[6] Particulate Matter in the UK”. Report of the Air Quality Expert Group, Defra (2005). www.defra.gov.uk/environment/airquality/publications/particulate-matter/index.htm
[7] The influence of airborne particles composition and size on in vitro and in vivo biological models. EPG 1/3/147. www.airquality.co.uk/archive/contracts/project1.php?action=project&project_id=65 [8] Comparative PM10 Measurements in Flanders. Period: 2005 – 2006, Flemish Environment Agency - Air Quality Monitoring Networks
[9] A.S. Brown, R.E. Yardley, P.G. Quincey and D.M. Butterfield. Studies of the effect of humidity and other factors on some different filter materials use for gravimetric meaasurementsof ambient particulate matter. Atmos. Env., 40, 467-4678, 2006.
[10] D.C. Carslaw, Analysis of Partisol blank filter weights, (Version 23rd May 2008)
[11] R. B. Cleveland, W. S. Cleveland, J.E. McRae, and I Terpenning. STL: A seasonal-trend decomposition procedure based on loess. Journal of Official Statistics, 6(1):3–73, 1990.
[12] Work carried out by Theo Hafkenscheid, RIVM; and kindly provided by Dave Djonge, GGD.
[13] D.C. Carslaw, K. Ropkins, and M.C. Bell. Change-point detection of gaseous and particulate traffic-related pollutants at a roadside location. Environ. Sci. Technol., 40(22):6912–6918, 2006.
[14] H.R. Kunsch. The jackknife and the bootstrap for general stationary observations. Annals of Statistics, 17(3):1217–1241, 1989.
[15] Giles Barton, Whatman, personal communication.
[16] Brian T. Mader and James F. Pankow, Gas/Solid Partitioning of Semivolatile Organic Compounds (SOCs) to Air Filters. 3. An Analysis of Gas Adsorption Artifacts in Measurements of Atmospheric SOCs and Organic Carbon (OC) When Using Teflon Membrane Filters and Quartz Fiber Filters Environ. Sci. Technol., 35 (17), 3422 -3432, 2001.
[17] David Smith, Sunset Instruments, personal communication.
[18] David Butterfield, NPL, personal communication.
[19] Council Directive 2008/50/EC of 21 May 2008 on ambient air quality and cleaner air for Europe Official Journal L 152-1, 11/06/2008 http://eur-lex.europa.eu/en/index.htm
[20] Air Quality Strategy for England, Scotland, Wales and Northern Ireland, 17 July 2007 (Cmd paper No. 7169). http://www.defra.gov.uk/environment/airquality/strategy/index.htm
Analysis of Trends in Gravimetric Particulate Mass Measurements in the UK
Ref: Bureau Veritas/AQ/AGG06801/RM/2543 Bureau Veritas UK Ltd 65
Glossary AQEG Air Quality Expert Group AQUILA Air QUalIty LAboratories AURN Automated Urban and Rural Network BAM Beta Attenuation Monitor CEN European Committee for Normalization CERC Cambridge Environmental Research Consultants CMCU Central Management and Co-ordination Unit of the AURN CRE Previous trading name for the Bureau Veritas filter weighing facility Defra Department for the Environment, Food and Rural Affairs EMC Previous trading name for the Bureau Veritas filter weighing facility EMEP European Monitoring and Evaluation Programme ERG Environmental Research Group ERLAP European Reference Laboratory of Air Pollution EU European Union FDMS Filter Dynamics Measurement System HGV Heavy Goods Vehicle HSL UK Health and Safety Laboratory ISO International Organization for Standardization ITS Institute of Transport Studies JRC Joint Research Centre KCL Kings College London KFG Klein Filtergerat LAQN London Air Quality Network LGV Light Goods Vehicle NAEI National Atmospheric Emissions Inventory NIST National Institute of Standards and Technology NPL National Physical Laboratory PC Personal Computer PCM Pollution Climate Mapping PM Particulate Matter PM10 Concentration of particles less than 10 microns in diameter PM2.5 Concentration of particles less than 2.5 microns in diameter PNS-X8 The European PM10 reference method QA Quality Assurance QC Quality Control QMA Quartz filter material manufactured by Whatman RH Relative Humidity RP Rupprecht & Patashnick STL a Seasonal Trend decomposition procedure based on Loess SVOC Semi Volatile Organic Compound TEOM Tapered Element Oscillating Microbalance TRL Transport Research Laboratory UK United Kingdom UKAS United Kingdom Accreditation service USA United states of America USB Universal Serial Bus WASP Workplace Analysis Scheme for Proficiency VOC Volatile Organic Compound
Analysis of Trends in Gravimetric Particulate Mass Measurements in the UK
Ref: Bureau Veritas/AQ/AGG06801/RM/2543 Bureau Veritas UK Ltd 66
Appendix A - Policy Context
The Air Quality Framework Directive (96/62/EC) and its four daughter directives (1999/30/EC, 2000/69/EC, 2002/3/EC, and 2004/107/EC) set concentration limit values or target values for a range of air pollutants such as sulphur dioxide; nitrogen oxides; particulate matter (PM10); carbon monoxide; ozone; benzene; lead; and polycyclic aromatic hydrocarbons. These laws require the monitoring of a number of air pollutants. If monitoring shows that the target values are exceeded, Member States are obliged to set up, implement and report on abatement plans. The set of laws has been developed over time in response to emerging scientific knowledge. Some of the limit values have already entered into force – such as those on particulate matter – while others will only come into effect in 2010 (e.g. nitrogen dioxide).
The Directives require that Member States report to the Commission each year whether or not the limit values set in the Directive have been achieved. Council Decision 97/101/EC introduces a Community-wide procedure for the exchange of information and data on ambient air quality, whilst the Public Participation Directive (2003/35/EC) sets the legislative framework to ensure that the public is given early and effective opportunity to participate in the preparation and modification or review of the plans or programmes drawn up under the Air Quality Framework Directive and the daughter directives.
Whilst overall air quality trends in the European Community are encouraging, continued efforts and vigilance are still required. To this end, air pollution remains the focus of attention under a new Thematic Strategy – a new generation of environmental policy with focus on the medium term requirements for environmental improvement up to 2020. The policy areas work around themes rather than specific pollutants under the Thematic Strategy approach and, to this end, the Thematic Strategy on Air Pollution was adopted by the Commission in September 2005, jointly with a proposal for a new Ambient Air Quality Directive.
The need for a new directive arose as a consequence of Thematic Strategy on Air Pollution identifying the requirement to set new objectives for fine particles (PM2.5). Additionally, experience with implementation of existing regulations – such as those around PM10 and NO2 – has shown that there is a need for increased flexibility around achieving environmental standards. Consequently, the existing statutes have been merged into a single legal text and the reporting requirements have been modernised in line with the Commission’s initiatives on better regulation.
Existing limit values set down in previously individual directives remain unchanged in the new consolidated directive. For PM10, these include the following:
• Annual mean limit value of 40 µgm³ to be achieved by 31 December 2004;
• Daily mean limit value of 50 µgm³ (not to be exceeded more than 35 days in a year) to be achieved by 31 December 2004.
In the case of the existing adopted limit values for PM10, the primary focus on compliance relates to assessment of the UK in 2005, which is discussed in Section 6.
The key elements of the new directive are:
• the introduction of a limit value of 25µgm³ to be met everywhere by 2015 (with a target date of 2010), with a second stage ‘indicative’ limit value of 20 µgm³ to be met by 2020.
• The driver for reductions in PM2.5 is intended to be the Exposure Reduction target for urban background areas to be achieved by 2020. The percentage reduction required is expected to depend upon the baseline concentration established by Member States at urban background locations (expressed as an average). For the UK it is currently expected to be 15% based on current figures.
• an Exposure Concentration obligation of 20µgm³ to be met as an average across urban background by 2015.
Analysis of Trends in Gravimetric Particulate Mass Measurements in the UK
Ref: Bureau Veritas/AQ/AGG06801/RM/2543 Bureau Veritas UK Ltd 67
• compliance flexibilities for PM10 (3 years from coming into force, i.e. to 2011) and NO2 (5 years from coming into force, i.e. 2015) subject to Member States putting forward detailed plans set out on how the limit values will be achieved with the extended time frames.
• clarification that only man-made sources of pollution can be addressed, through allowing reductions for natural sources
• compliance with the limit values will not need to be assessed where the public does not have access and there is no fixed habitation, or on a carriageway and central reservation;
On the 14th April the European Commission welcomed the final adoption of the new Ambient Air Quality directive. The directive will be published in the EU’s official journal in May 2008.
The monitoring of PM metric is therefore an essential element of establishing compliance against the existing and forthcoming legislation on pollutant levels. Specifically, this report provides for a clearer understanding of the key challenges facing Member States in relation to the measurement of particulate matter (PM), which varies considerably across Europe and the difficulties in adherence to harmonized methods.
Elsewhere in Europe the following instruments are anticipated to bring about significant improvements in ambient air quality in future years:
• the Auto-Oil Programme which sets tightening emissions standards for vehicles in future years and the banning of leaded petrol from 1 Jan 2000;
• the Acidification Strategy which aims to reduce emissions of SO2, NOx and ammonia in order to reduce the risk to ecosystems;
• the Sulphur Content of Certain Liquid Fuels Directive, which sets a maximum value of sulphur content of heavy fuel oil and for gas;
• the EC Large Combustion Plant Directive, which sets emissions limit values from new large combustion plants, taking in to account technological advances in future years;
• the National Emissions Ceiling Directive which sets ceilings for national emissions of a number of pollutants to be attained by 2010;
• the Solvents Directive aims to reduce emissions of volatile organic compounds, which are involved as a precursor to the formation of tropospheric ozone;
• the Integrated Pollution Prevention and Control Directive which requires specific permits for industrial sites and limit their emissions to air, and;
• We understand that a Commission statement, to be published at the same time as the new Directive, sets out Commission proposals that are expected to be published in 2008.
Analysis of long-term trends in monitored data provides for a means of understanding whether overall environmental policy improvements such as those listed above, are working, whilst additionally providing a means by which additional policy formulation may be required.
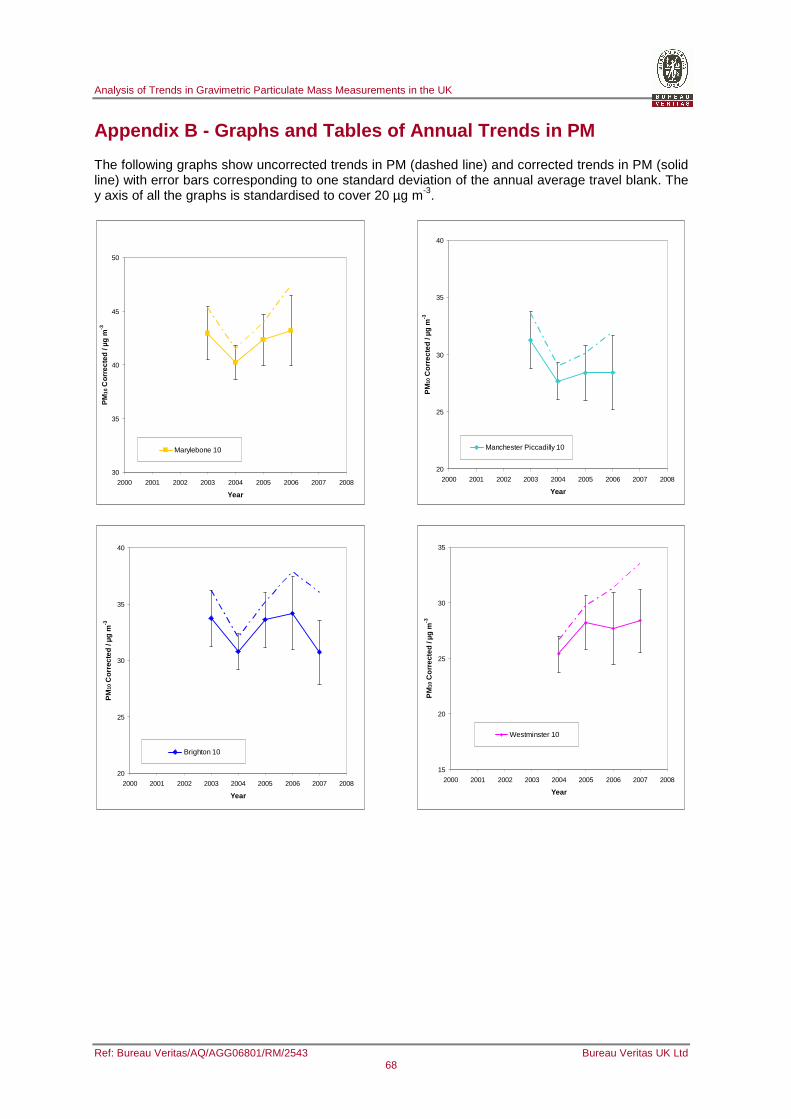
Analysis of Trends in Gravimetric Particulate Mass Measurements in the UK
Ref: Bureau Veritas/AQ/AGG06801/RM/2543 Bureau Veritas UK Ltd 68
Appendix B - Graphs and Tables of Annual Trends in PM
The following graphs show uncorrected trends in PM (dashed line) and corrected trends in PM (solid line) with error bars corresponding to one standard deviation of the annual average travel blank. The y axis of all the graphs is standardised to cover 20 µg m-3.
30
35
40
45
50
2000 2001 2002 2003 2004 2005 2006 2007 2008
Year
PM
10 C
orre
cted
/ µg
m-3
Marylebone 10
20
25
30
35
40
2000 2001 2002 2003 2004 2005 2006 2007 2008
Year
PM
10 C
orre
cted
/ µg
m-3
Brighton 10
20
25
30
35
40
2000 2001 2002 2003 2004 2005 2006 2007 2008
Year
PM
10 C
orre
cted
/ µg
m-3
Manchester Piccadilly 10
15
20
25
30
35
2000 2001 2002 2003 2004 2005 2006 2007 2008
Year
PM
10 C
orre
cted
/ µg
m-3
Westminster 10
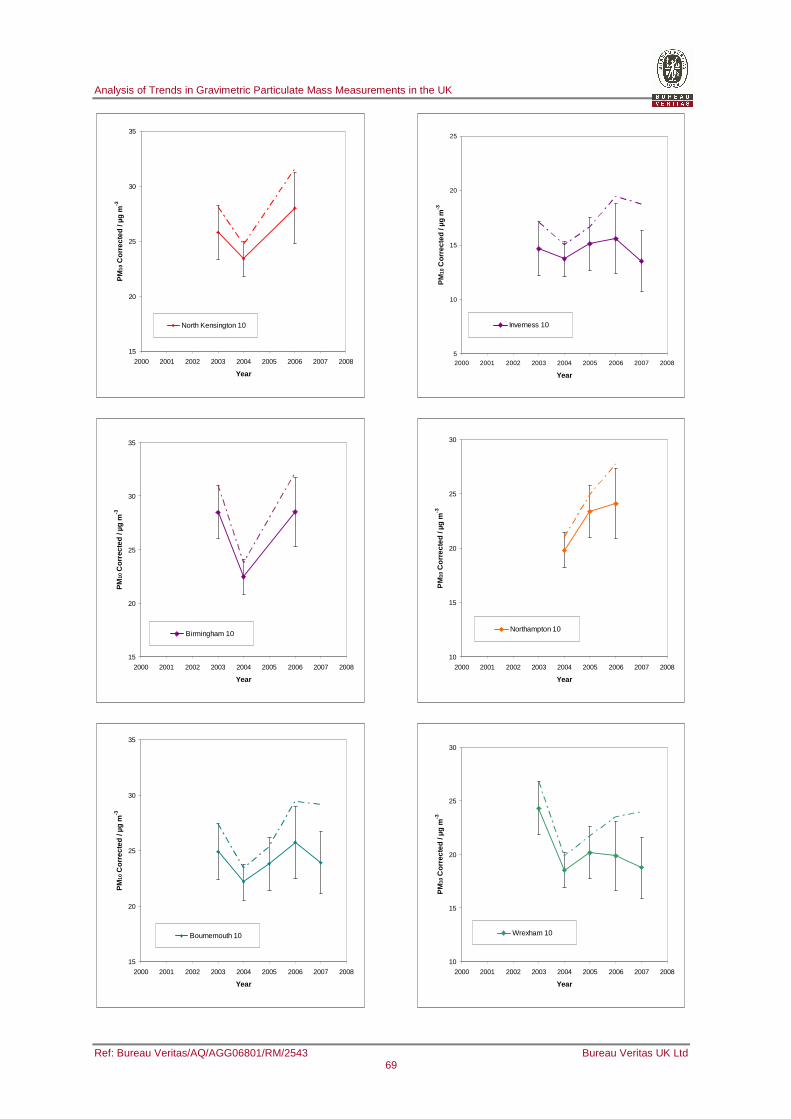
Analysis of Trends in Gravimetric Particulate Mass Measurements in the UK
Ref: Bureau Veritas/AQ/AGG06801/RM/2543 Bureau Veritas UK Ltd 69
15
20
25
30
35
2000 2001 2002 2003 2004 2005 2006 2007 2008
Year
PM
10 C
orre
cted
/ µg
m-3
North Kensington 10
15
20
25
30
35
2000 2001 2002 2003 2004 2005 2006 2007 2008
Year
PM
10 C
orre
cted
/ µg
m-3
Birmingham 10
15
20
25
30
35
2000 2001 2002 2003 2004 2005 2006 2007 2008
Year
PM
10 C
orre
cted
/ µg
m-3
Bournemouth 10
5
10
15
20
25
2000 2001 2002 2003 2004 2005 2006 2007 2008
Year
PM
10 C
orre
cted
/ µg
m-3
Inverness 10
10
15
20
25
30
2000 2001 2002 2003 2004 2005 2006 2007 2008
Year
PM
10 C
orre
cted
/ µg
m-3
Northampton 10
10
15
20
25
30
2000 2001 2002 2003 2004 2005 2006 2007 2008
Year
PM
10 C
orre
cted
/ µg
m-3
Wrexham 10
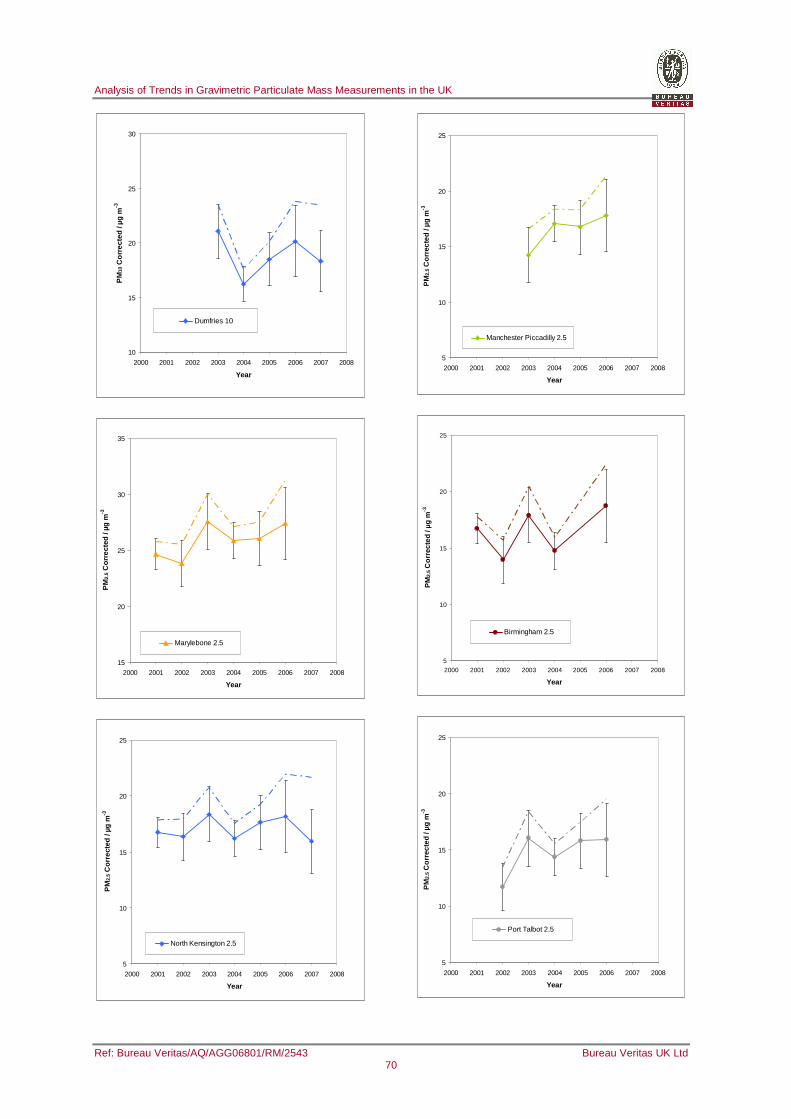
Analysis of Trends in Gravimetric Particulate Mass Measurements in the UK
Ref: Bureau Veritas/AQ/AGG06801/RM/2543 Bureau Veritas UK Ltd 70
10
15
20
25
30
2000 2001 2002 2003 2004 2005 2006 2007 2008
Year
PM
10 C
orre
cted
/ µg
m-3
Dumfries 10
15
20
25
30
35
2000 2001 2002 2003 2004 2005 2006 2007 2008
Year
PM
2.5
Cor
rect
ed /
µg m
-3
Marylebone 2.5
5
10
15
20
25
2000 2001 2002 2003 2004 2005 2006 2007 2008
Year
PM
2.5
Cor
rect
ed /
µg m
-3
North Kensington 2.5
5
10
15
20
25
2000 2001 2002 2003 2004 2005 2006 2007 2008
Year
PM
2.5
Cor
rect
ed /
µg m
-3
Manchester Piccadilly 2.5
5
10
15
20
25
2000 2001 2002 2003 2004 2005 2006 2007 2008
Year
PM
2.5
Cor
rect
ed /
µg m
-3
Birmingham 2.5
5
10
15
20
25
2000 2001 2002 2003 2004 2005 2006 2007 2008
Year
PM
2.5
Cor
rect
ed /
µg m
-3
Port Talbot 2.5
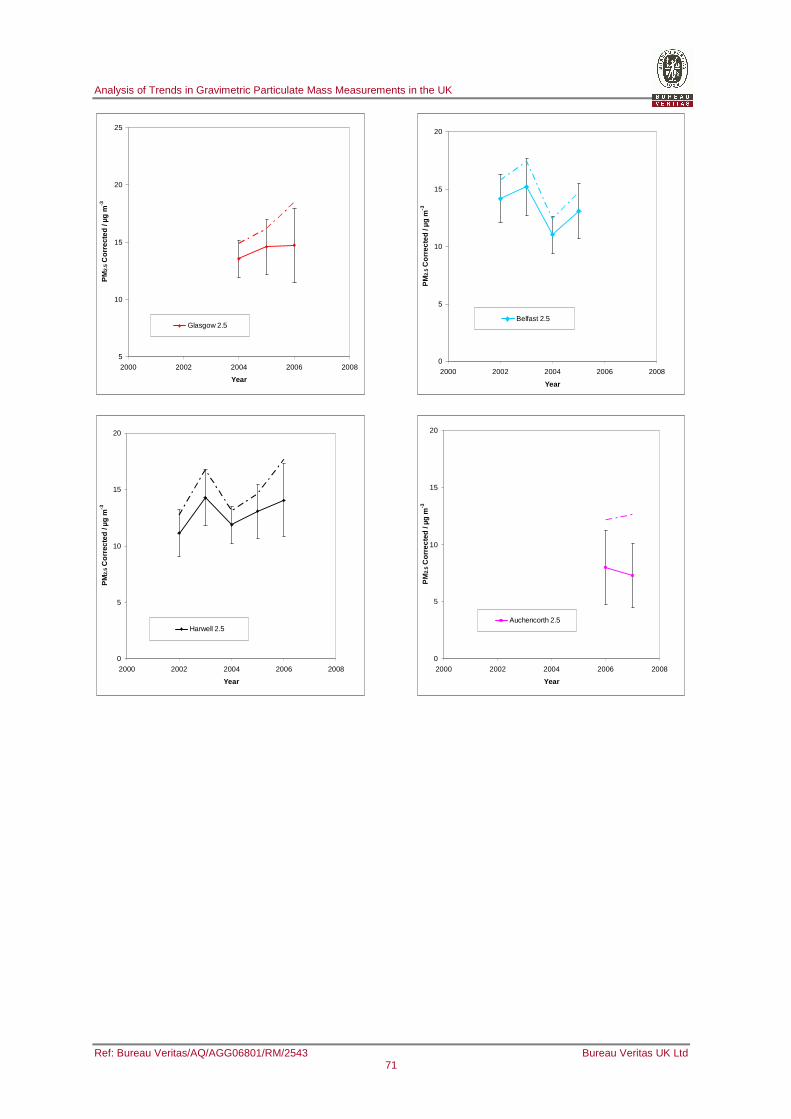
Analysis of Trends in Gravimetric Particulate Mass Measurements in the UK
Ref: Bureau Veritas/AQ/AGG06801/RM/2543 Bureau Veritas UK Ltd 71
5
10
15
20
25
2000 2002 2004 2006 2008
Year
PM
2.5
Cor
rect
ed /
µg m
-3
Glasgow 2.5
0
5
10
15
20
2000 2002 2004 2006 2008
Year
PM
2.5
Cor
rect
ed /
µg m
-3
Harwell 2.5
0
5
10
15
20
2000 2002 2004 2006 2008
Year
PM
2.5
Cor
rect
ed /
µg m
-3
Belfast 2.5
0
5
10
15
20
2000 2002 2004 2006 2008
Year
PM
2.5
Cor
rect
ed /
µg m
-3
Auchencorth 2.5
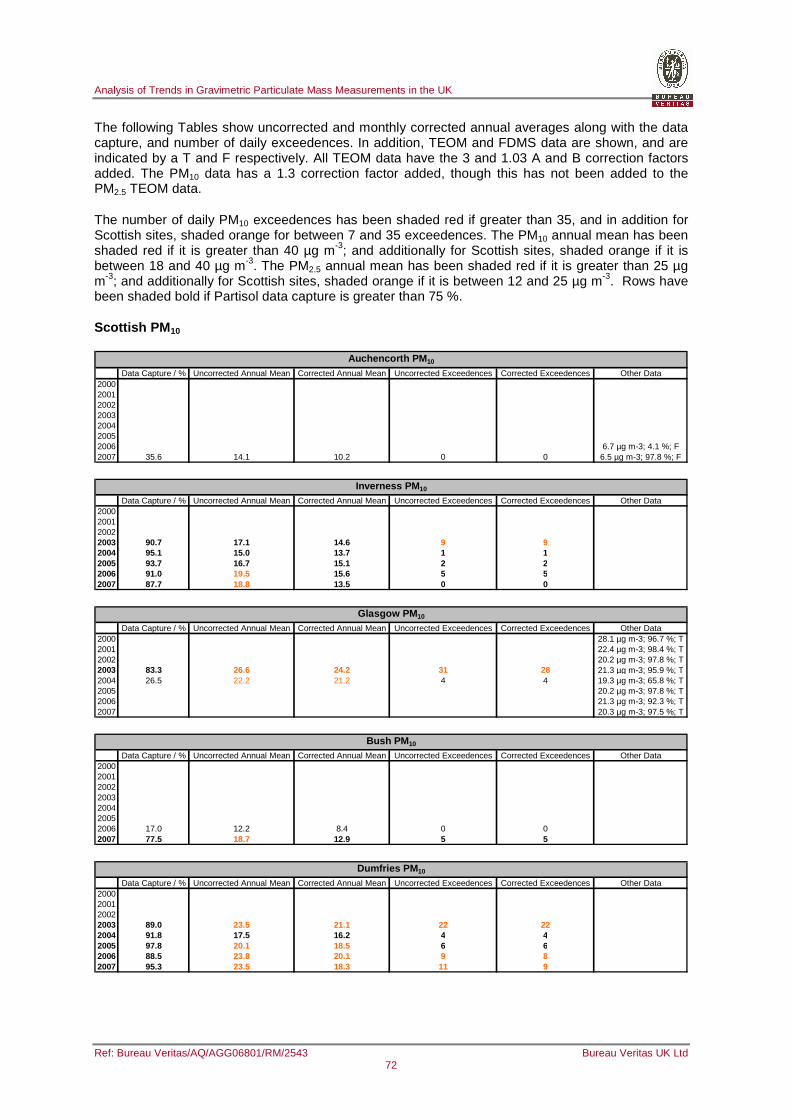
Analysis of Trends in Gravimetric Particulate Mass Measurements in the UK
Ref: Bureau Veritas/AQ/AGG06801/RM/2543 Bureau Veritas UK Ltd 72
The following Tables show uncorrected and monthly corrected annual averages along with the data capture, and number of daily exceedences. In addition, TEOM and FDMS data are shown, and are indicated by a T and F respectively. All TEOM data have the 3 and 1.03 A and B correction factors added. The PM10 data has a 1.3 correction factor added, though this has not been added to the PM2.5 TEOM data.
The number of daily PM10 exceedences has been shaded red if greater than 35, and in addition for Scottish sites, shaded orange for between 7 and 35 exceedences. The PM10 annual mean has been shaded red if it is greater than 40 µg m-3; and additionally for Scottish sites, shaded orange if it is between 18 and 40 µg m-3. The PM2.5 annual mean has been shaded red if it is greater than 25 µg m-3; and additionally for Scottish sites, shaded orange if it is between 12 and 25 µg m-3. Rows have been shaded bold if Partisol data capture is greater than 75 %.
Scottish PM 10
Data Capture / % Uncorrected Annual Mean Corrected Annual Mean Uncorrected Exceedences Corrected Exceedences Other Data2000200120022003200420052006 6.7 µg m-3; 4.1 %; F2007 35.6 14.1 10.2 0 0 6.5 µg m-3; 97.8 %; F
Auchencorth PM 10
Data Capture / % Uncorrected Annual Mean Corrected Annual Mean Uncorrected Exceedences Corrected Exceedences Other Data2000200120022003 90.7 17.1 14.6 9 92004 95.1 15.0 13.7 1 12005 93.7 16.7 15.1 2 22006 91.0 19.5 15.6 5 52007 87.7 18.8 13.5 0 0
Inverness PM 10
Data Capture / % Uncorrected Annual Mean Corrected Annual Mean Uncorrected Exceedences Corrected Exceedences Other Data2000 28.1 µg m-3; 96.7 %; T2001 22.4 µg m-3; 98.4 %; T2002 20.2 µg m-3; 97.8 %; T2003 83.3 26.6 24.2 31 28 21.3 µg m-3; 95.9 %; T2004 26.5 22.2 21.2 4 4 19.3 µg m-3; 65.8 %; T2005 20.2 µg m-3; 97.8 %; T2006 21.3 µg m-3; 92.3 %; T2007 20.3 µg m-3; 97.5 %; T
Glasgow PM 10
Data Capture / % Uncorrected Annual Mean Corrected Annual Mean Uncorrected Exceedences Corrected Exceedences Other Data2000200120022003200420052006 17.0 12.2 8.4 0 02007 77.5 18.7 12.9 5 5
Bush PM 10
Data Capture / % Uncorrected Annual Mean Corrected Annual Mean Uncorrected Exceedences Corrected Exceedences Other Data2000200120022003 89.0 23.5 21.1 22 222004 91.8 17.5 16.2 4 42005 97.8 20.1 18.5 6 62006 88.5 23.8 20.1 9 82007 95.3 23.5 18.3 11 9
Dumfries PM 10
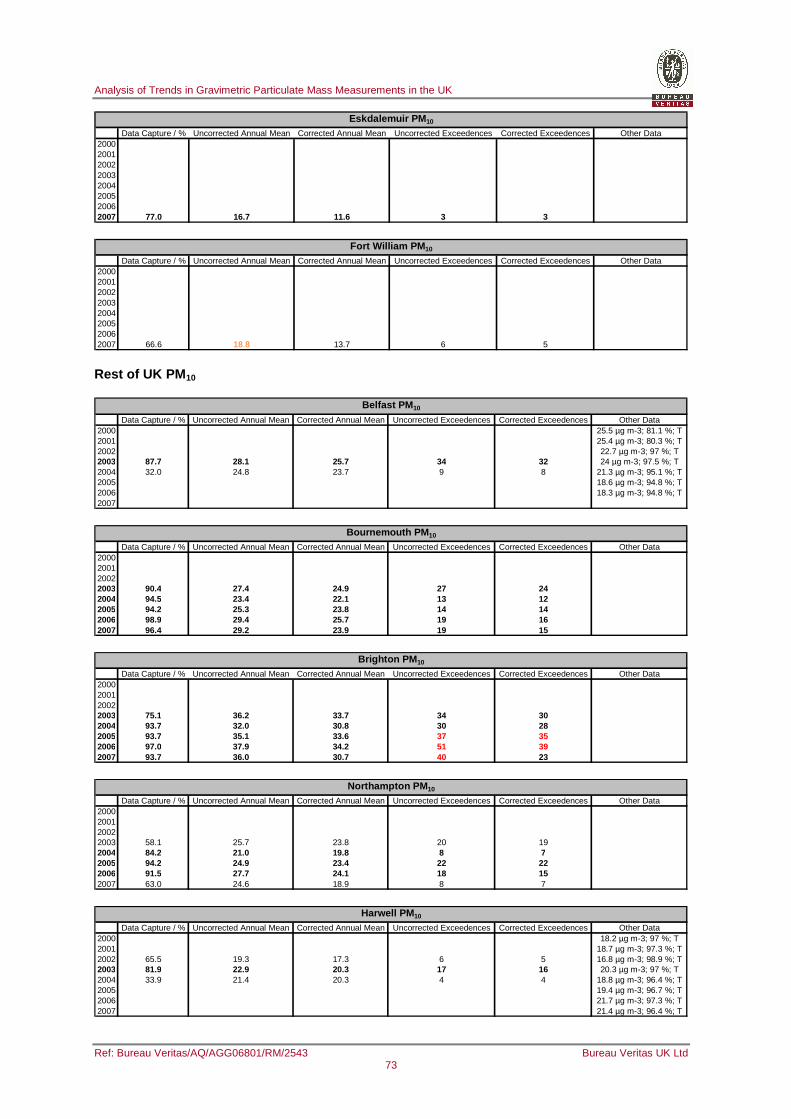
Analysis of Trends in Gravimetric Particulate Mass Measurements in the UK
Ref: Bureau Veritas/AQ/AGG06801/RM/2543 Bureau Veritas UK Ltd 73
Data Capture / % Uncorrected Annual Mean Corrected Annual Mean Uncorrected Exceedences Corrected Exceedences Other Data20002001200220032004200520062007 77.0 16.7 11.6 3 3
Eskdalemuir PM 10
Data Capture / % Uncorrected Annual Mean Corrected Annual Mean Uncorrected Exceedences Corrected Exceedences Other Data20002001200220032004200520062007 66.6 18.8 13.7 6 5
Fort William PM 10
Rest of UK PM 10
Data Capture / % Uncorrected Annual Mean Corrected Annual Mean Uncorrected Exceedences Corrected Exceedences Other Data2000 25.5 µg m-3; 81.1 %; T2001 25.4 µg m-3; 80.3 %; T2002 22.7 µg m-3; 97 %; T2003 87.7 28.1 25.7 34 32 24 µg m-3; 97.5 %; T2004 32.0 24.8 23.7 9 8 21.3 µg m-3; 95.1 %; T2005 18.6 µg m-3; 94.8 %; T2006 18.3 µg m-3; 94.8 %; T2007
Belfast PM 10
Data Capture / % Uncorrected Annual Mean Corrected Annual Mean Uncorrected Exceedences Corrected Exceedences Other Data2000200120022003 90.4 27.4 24.9 27 242004 94.5 23.4 22.1 13 122005 94.2 25.3 23.8 14 142006 98.9 29.4 25.7 19 162007 96.4 29.2 23.9 19 15
Bournemouth PM 10
Data Capture / % Uncorrected Annual Mean Corrected Annual Mean Uncorrected Exceedences Corrected Exceedences Other Data2000200120022003 75.1 36.2 33.7 34 302004 93.7 32.0 30.8 30 282005 93.7 35.1 33.6 37 352006 97.0 37.9 34.2 51 392007 93.7 36.0 30.7 40 23
Brighton PM 10
Data Capture / % Uncorrected Annual Mean Corrected Annual Mean Uncorrected Exceedences Corrected Exceedences Other Data2000200120022003 58.1 25.7 23.8 20 192004 84.2 21.0 19.8 8 72005 94.2 24.9 23.4 22 222006 91.5 27.7 24.1 18 152007 63.0 24.6 18.9 8 7
Northampton PM 10
Data Capture / % Uncorrected Annual Mean Corrected Annual Mean Uncorrected Exceedences Corrected Exceedences Other Data2000 18.2 µg m-3; 97 %; T2001 18.7 µg m-3; 97.3 %; T2002 65.5 19.3 17.3 6 5 16.8 µg m-3; 98.9 %; T2003 81.9 22.9 20.3 17 16 20.3 µg m-3; 97 %; T2004 33.9 21.4 20.3 4 4 18.8 µg m-3; 96.4 %; T2005 19.4 µg m-3; 96.7 %; T2006 21.7 µg m-3; 97.3 %; T2007 21.4 µg m-3; 96.4 %; T
Harwell PM 10
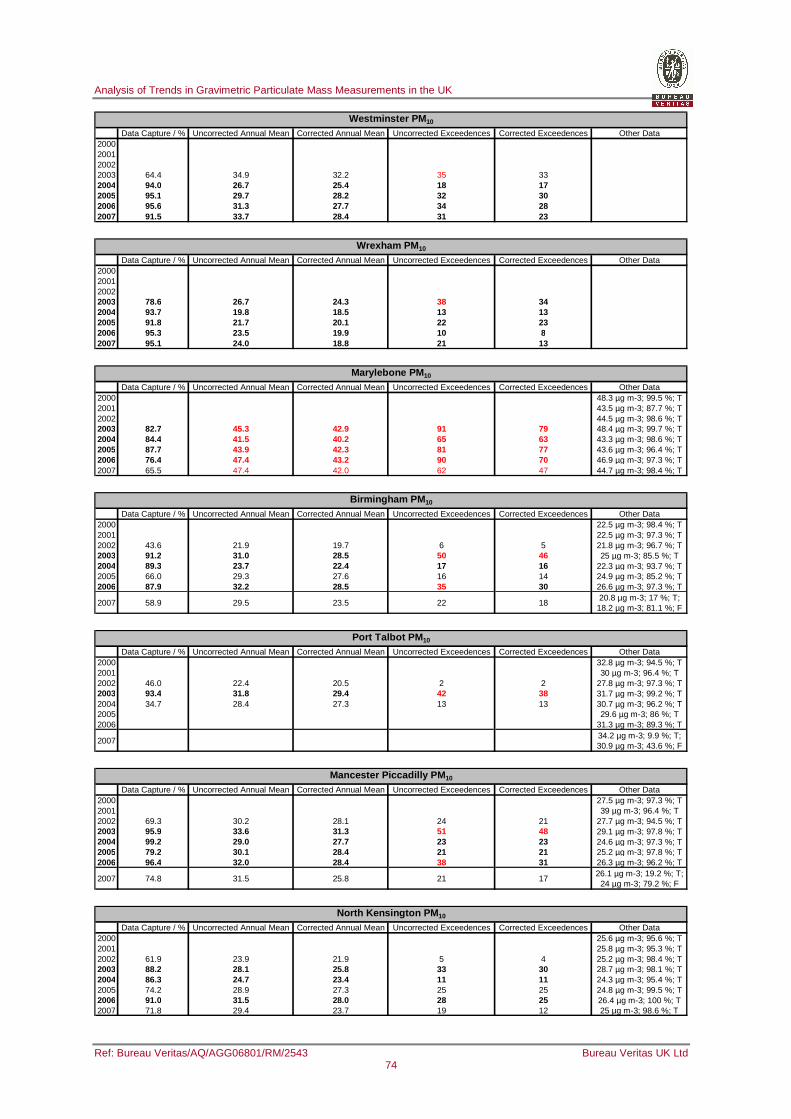
Analysis of Trends in Gravimetric Particulate Mass Measurements in the UK
Ref: Bureau Veritas/AQ/AGG06801/RM/2543 Bureau Veritas UK Ltd 74
Data Capture / % Uncorrected Annual Mean Corrected Annual Mean Uncorrected Exceedences Corrected Exceedences Other Data2000200120022003 64.4 34.9 32.2 35 332004 94.0 26.7 25.4 18 172005 95.1 29.7 28.2 32 302006 95.6 31.3 27.7 34 282007 91.5 33.7 28.4 31 23
Westminster PM 10
Data Capture / % Uncorrected Annual Mean Corrected Annual Mean Uncorrected Exceedences Corrected Exceedences Other Data2000200120022003 78.6 26.7 24.3 38 342004 93.7 19.8 18.5 13 132005 91.8 21.7 20.1 22 232006 95.3 23.5 19.9 10 82007 95.1 24.0 18.8 21 13
Wrexham PM 10
Data Capture / % Uncorrected Annual Mean Corrected Annual Mean Uncorrected Exceedences Corrected Exceedences Other Data2000 48.3 µg m-3; 99.5 %; T2001 43.5 µg m-3; 87.7 %; T2002 44.5 µg m-3; 98.6 %; T2003 82.7 45.3 42.9 91 79 48.4 µg m-3; 99.7 %; T2004 84.4 41.5 40.2 65 63 43.3 µg m-3; 98.6 %; T2005 87.7 43.9 42.3 81 77 43.6 µg m-3; 96.4 %; T2006 76.4 47.4 43.2 90 70 46.9 µg m-3; 97.3 %; T2007 65.5 47.4 42.0 62 47 44.7 µg m-3; 98.4 %; T
Marylebone PM 10
Data Capture / % Uncorrected Annual Mean Corrected Annual Mean Uncorrected Exceedences Corrected Exceedences Other Data2000 22.5 µg m-3; 98.4 %; T2001 22.5 µg m-3; 97.3 %; T2002 43.6 21.9 19.7 6 5 21.8 µg m-3; 96.7 %; T2003 91.2 31.0 28.5 50 46 25 µg m-3; 85.5 %; T2004 89.3 23.7 22.4 17 16 22.3 µg m-3; 93.7 %; T2005 66.0 29.3 27.6 16 14 24.9 µg m-3; 85.2 %; T2006 87.9 32.2 28.5 35 30 26.6 µg m-3; 97.3 %; T
2007 58.9 29.5 23.5 22 1820.8 µg m-3; 17 %; T;
18.2 µg m-3; 81.1 %; F
Birmingham PM 10
Data Capture / % Uncorrected Annual Mean Corrected Annual Mean Uncorrected Exceedences Corrected Exceedences Other Data2000 32.8 µg m-3; 94.5 %; T2001 30 µg m-3; 96.4 %; T2002 46.0 22.4 20.5 2 2 27.8 µg m-3; 97.3 %; T2003 93.4 31.8 29.4 42 38 31.7 µg m-3; 99.2 %; T2004 34.7 28.4 27.3 13 13 30.7 µg m-3; 96.2 %; T2005 29.6 µg m-3; 86 %; T2006 31.3 µg m-3; 89.3 %; T
200734.2 µg m-3; 9.9 %; T; 30.9 µg m-3; 43.6 %; F
Port Talbot PM 10
Data Capture / % Uncorrected Annual Mean Corrected Annual Mean Uncorrected Exceedences Corrected Exceedences Other Data2000 27.5 µg m-3; 97.3 %; T2001 39 µg m-3; 96.4 %; T2002 69.3 30.2 28.1 24 21 27.7 µg m-3; 94.5 %; T2003 95.9 33.6 31.3 51 48 29.1 µg m-3; 97.8 %; T2004 99.2 29.0 27.7 23 23 24.6 µg m-3; 97.3 %; T2005 79.2 30.1 28.4 21 21 25.2 µg m-3; 97.8 %; T2006 96.4 32.0 28.4 38 31 26.3 µg m-3; 96.2 %; T
2007 74.8 31.5 25.8 21 1726.1 µg m-3; 19.2 %; T;
24 µg m-3; 79.2 %; F
Mancester Piccadilly PM 10
Data Capture / % Uncorrected Annual Mean Corrected Annual Mean Uncorrected Exceedences Corrected Exceedences Other Data2000 25.6 µg m-3; 95.6 %; T2001 25.8 µg m-3; 95.3 %; T2002 61.9 23.9 21.9 5 4 25.2 µg m-3; 98.4 %; T2003 88.2 28.1 25.8 33 30 28.7 µg m-3; 98.1 %; T2004 86.3 24.7 23.4 11 11 24.3 µg m-3; 95.4 %; T2005 74.2 28.9 27.3 25 25 24.8 µg m-3; 99.5 %; T2006 91.0 31.5 28.0 28 25 26.4 µg m-3; 100 %; T2007 71.8 29.4 23.7 19 12 25 µg m-3; 98.6 %; T
North Kensington PM 10
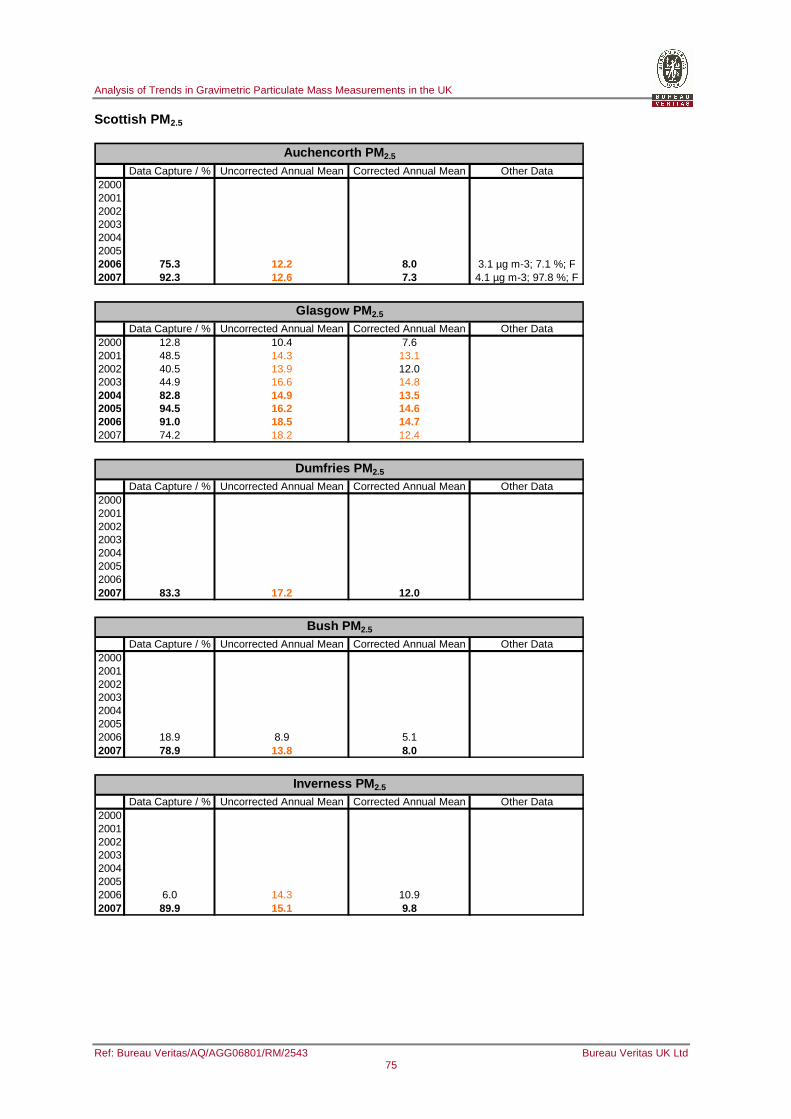
Analysis of Trends in Gravimetric Particulate Mass Measurements in the UK
Ref: Bureau Veritas/AQ/AGG06801/RM/2543 Bureau Veritas UK Ltd 75
Scottish PM 2.5
Data Capture / % Uncorrected Annual Mean Corrected Annual Mean Other Data2000200120022003200420052006 75.3 12.2 8.0 3.1 µg m-3; 7.1 %; F2007 92.3 12.6 7.3 4.1 µg m-3; 97.8 %; F
Auchencorth PM 2.5
Data Capture / % Uncorrected Annual Mean Corrected Annual Mean Other Data2000 12.8 10.4 7.62001 48.5 14.3 13.12002 40.5 13.9 12.02003 44.9 16.6 14.82004 82.8 14.9 13.52005 94.5 16.2 14.62006 91.0 18.5 14.72007 74.2 18.2 12.4
Glasgow PM 2.5
Data Capture / % Uncorrected Annual Mean Corrected Annual Mean Other Data20002001200220032004200520062007 83.3 17.2 12.0
Dumfries PM 2.5
Data Capture / % Uncorrected Annual Mean Corrected Annual Mean Other Data2000200120022003200420052006 18.9 8.9 5.12007 78.9 13.8 8.0
Bush PM 2.5
Data Capture / % Uncorrected Annual Mean Corrected Annual Mean Other Data2000200120022003200420052006 6.0 14.3 10.92007 89.9 15.1 9.8
Inverness PM 2.5
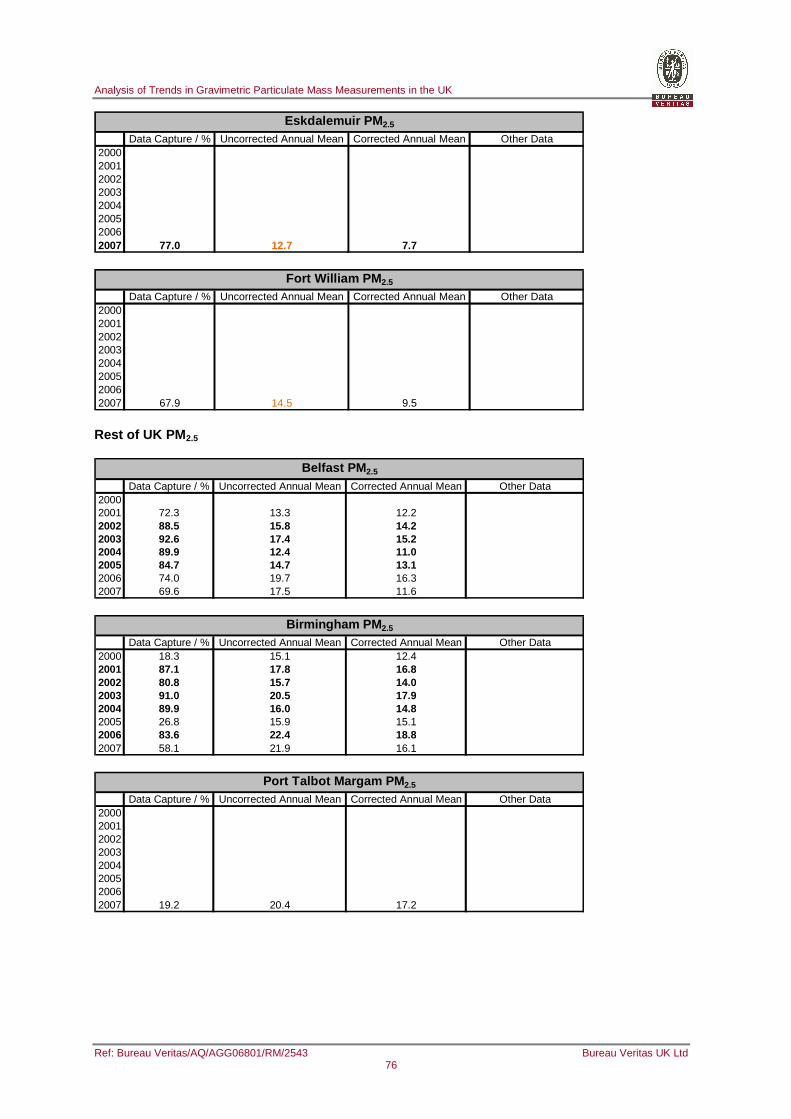
Analysis of Trends in Gravimetric Particulate Mass Measurements in the UK
Ref: Bureau Veritas/AQ/AGG06801/RM/2543 Bureau Veritas UK Ltd 76
Data Capture / % Uncorrected Annual Mean Corrected Annual Mean Other Data20002001200220032004200520062007 77.0 12.7 7.7
Eskdalemuir PM 2.5
Data Capture / % Uncorrected Annual Mean Corrected Annual Mean Other Data20002001200220032004200520062007 67.9 14.5 9.5
Fort William PM 2.5
Rest of UK PM 2.5
Data Capture / % Uncorrected Annual Mean Corrected Annual Mean Other Data20002001 72.3 13.3 12.22002 88.5 15.8 14.22003 92.6 17.4 15.22004 89.9 12.4 11.02005 84.7 14.7 13.12006 74.0 19.7 16.32007 69.6 17.5 11.6
Belfast PM 2.5
Data Capture / % Uncorrected Annual Mean Corrected Annual Mean Other Data2000 18.3 15.1 12.42001 87.1 17.8 16.82002 80.8 15.7 14.02003 91.0 20.5 17.92004 89.9 16.0 14.82005 26.8 15.9 15.12006 83.6 22.4 18.82007 58.1 21.9 16.1
Birmingham PM 2.5
Data Capture / % Uncorrected Annual Mean Corrected Annual Mean Other Data20002001200220032004200520062007 19.2 20.4 17.2
Port Talbot Margam PM 2.5
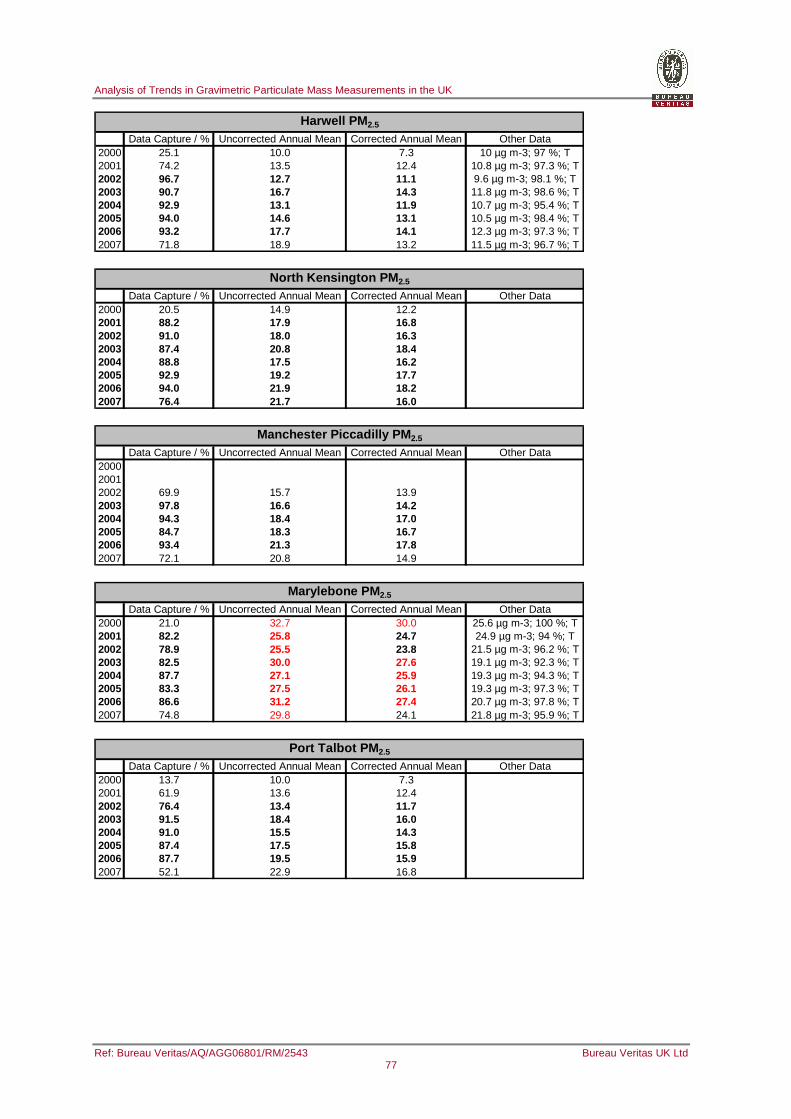
Analysis of Trends in Gravimetric Particulate Mass Measurements in the UK
Ref: Bureau Veritas/AQ/AGG06801/RM/2543 Bureau Veritas UK Ltd 77
Data Capture / % Uncorrected Annual Mean Corrected Annual Mean Other Data2000 25.1 10.0 7.3 10 µg m-3; 97 %; T2001 74.2 13.5 12.4 10.8 µg m-3; 97.3 %; T2002 96.7 12.7 11.1 9.6 µg m-3; 98.1 %; T2003 90.7 16.7 14.3 11.8 µg m-3; 98.6 %; T2004 92.9 13.1 11.9 10.7 µg m-3; 95.4 %; T2005 94.0 14.6 13.1 10.5 µg m-3; 98.4 %; T2006 93.2 17.7 14.1 12.3 µg m-3; 97.3 %; T2007 71.8 18.9 13.2 11.5 µg m-3; 96.7 %; T
Harwell PM 2.5
Data Capture / % Uncorrected Annual Mean Corrected Annual Mean Other Data2000 20.5 14.9 12.22001 88.2 17.9 16.82002 91.0 18.0 16.32003 87.4 20.8 18.42004 88.8 17.5 16.22005 92.9 19.2 17.72006 94.0 21.9 18.22007 76.4 21.7 16.0
North Kensington PM 2.5
Data Capture / % Uncorrected Annual Mean Corrected Annual Mean Other Data200020012002 69.9 15.7 13.92003 97.8 16.6 14.22004 94.3 18.4 17.02005 84.7 18.3 16.72006 93.4 21.3 17.82007 72.1 20.8 14.9
Manchester Piccadilly PM 2.5
Data Capture / % Uncorrected Annual Mean Corrected Annual Mean Other Data2000 21.0 32.7 30.0 25.6 µg m-3; 100 %; T2001 82.2 25.8 24.7 24.9 µg m-3; 94 %; T2002 78.9 25.5 23.8 21.5 µg m-3; 96.2 %; T2003 82.5 30.0 27.6 19.1 µg m-3; 92.3 %; T2004 87.7 27.1 25.9 19.3 µg m-3; 94.3 %; T2005 83.3 27.5 26.1 19.3 µg m-3; 97.3 %; T2006 86.6 31.2 27.4 20.7 µg m-3; 97.8 %; T2007 74.8 29.8 24.1 21.8 µg m-3; 95.9 %; T
Marylebone PM 2.5
Data Capture / % Uncorrected Annual Mean Corrected Annual Mean Other Data2000 13.7 10.0 7.32001 61.9 13.6 12.42002 76.4 13.4 11.72003 91.5 18.4 16.02004 91.0 15.5 14.32005 87.4 17.5 15.82006 87.7 19.5 15.92007 52.1 22.9 16.8
Port Talbot PM 2.5
Analysis of Trends in Gravimetric Particulate Mass Measurements in the UK
Ref: Bureau Veritas/AQ/AGG06801/RM/2543 Bureau Veritas UK Ltd 78
Appendix C – Consultees Responses
C.1 Introduction
Responses were received from the following, and the number below corresponds to the reference in the forthcoming sections.
1. Jan Matthijsen, Netherlands Environmental Assessment Agency (PBL).
2. Anonymous
3. Theo Hafkenscheid, RIVM (2 sets of responses)
4. Shaun Drummond, SEPA
5. Jaap Visser, GGD, Amsterdam
6. Ulrich Pfeffer, LANUV NRW
7. Luisa Marelli, JRC
8. Richard Turle, AAQD, ESTC
9. Jordy Vercauteren, VMM
10. Mat Heal, University of Edinburgh
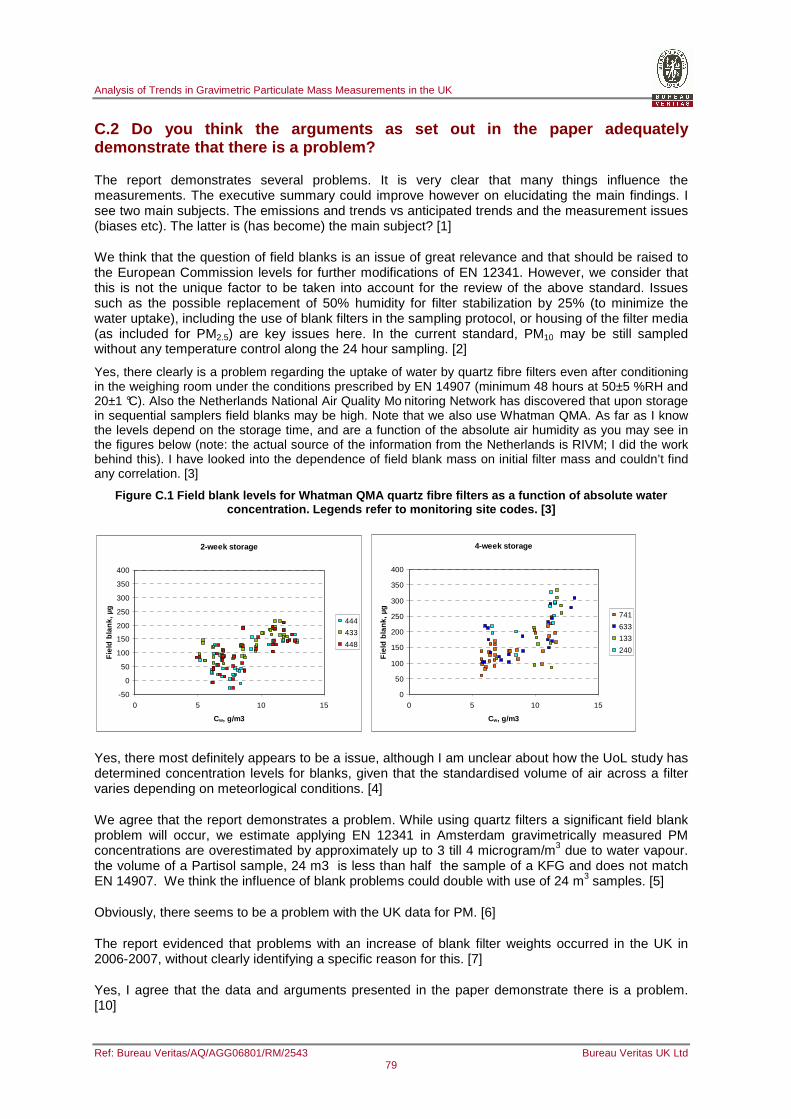
Analysis of Trends in Gravimetric Particulate Mass Measurements in the UK
Ref: Bureau Veritas/AQ/AGG06801/RM/2543 Bureau Veritas UK Ltd 79
C.2 Do you think the arguments as set out in the pa per adequately demonstrate that there is a problem?
The report demonstrates several problems. It is very clear that many things influence the measurements. The executive summary could improve however on elucidating the main findings. I see two main subjects. The emissions and trends vs anticipated trends and the measurement issues (biases etc). The latter is (has become) the main subject? [1]
We think that the question of field blanks is an issue of great relevance and that should be raised to the European Commission levels for further modifications of EN 12341. However, we consider that this is not the unique factor to be taken into account for the review of the above standard. Issues such as the possible replacement of 50% humidity for filter stabilization by 25% (to minimize the water uptake), including the use of blank filters in the sampling protocol, or housing of the filter media (as included for PM2.5) are key issues here. In the current standard, PM10 may be still sampled without any temperature control along the 24 hour sampling. [2]
Yes, there clearly is a problem regarding the uptake of water by quartz fibre filters even after conditioning in the weighing room under the conditions prescribed by EN 14907 (minimum 48 hours at 50±5 %RH and 20±1 °C). Also the Netherlands National Air Quality Mo nitoring Network has discovered that upon storage in sequential samplers field blanks may be high. Note that we also use Whatman QMA. As far as I know the levels depend on the storage time, and are a function of the absolute air humidity as you may see in the figures below (note: the actual source of the information from the Netherlands is RIVM; I did the work behind this). I have looked into the dependence of field blank mass on initial filter mass and couldn’t find any correlation. [3]
Figure C.1 Field blank levels for Whatman QMA quart z fibre filters as a function of absolute water concentration. Legends refer to monitoring site cod es. [3]
2-week storage
-50
0
50
100
150
200
250
300
350
400
0 5 10 15
Cw, g/m3
Fie
ld b
lank
, µg
444
433
448
4-week storage
0
50
100
150
200
250
300
350
400
0 5 10 15
Cw, g/m3
Fie
ld b
lank
, µg 741
633
133
240
Yes, there most definitely appears to be a issue, although I am unclear about how the UoL study has determined concentration levels for blanks, given that the standardised volume of air across a filter varies depending on meteorlogical conditions. [4]
We agree that the report demonstrates a problem. While using quartz filters a significant field blank problem will occur, we estimate applying EN 12341 in Amsterdam gravimetrically measured PM concentrations are overestimated by approximately up to 3 till 4 microgram/m3 due to water vapour. the volume of a Partisol sample, 24 m3 is less than half the sample of a KFG and does not match EN 14907. We think the influence of blank problems could double with use of 24 m3 samples. [5]
Obviously, there seems to be a problem with the UK data for PM. [6]
The report evidenced that problems with an increase of blank filter weights occurred in the UK in 2006-2007, without clearly identifying a specific reason for this. [7]
Yes, I agree that the data and arguments presented in the paper demonstrate there is a problem. [10]
Analysis of Trends in Gravimetric Particulate Mass Measurements in the UK
Ref: Bureau Veritas/AQ/AGG06801/RM/2543 Bureau Veritas UK Ltd 80
C.3 Are there any further analyses which could be c arried out to elucidate the reasons behind the field blank issue?
Yes, from a scientific point of view (find the mechanism behind the findings) but also from a more policy, administrative point of view. Although it seems that using Teflon (coated) filters may be a step towards a solution to the main problem(s), the use of quartz filters will still be necessary in the future. First because EN 12341 says so and it will take a while before that could be changed, if at all. Second, in the future EC/OC measurements may very well become more and more important because of their supposedly strong relation with health effects. In order to measure EC/OC - Teflon (coated) filters can not be used. The use of quartz filters will stay important and therefore the need to know all possible artefacts related to quartz filters [1].
Experiments to find out more about the relation between field blanks of quartz filters and absolute humidity. An other issue is to find out more about the role of (organic) carbon. The data that suggest that organic carbon artefacts are small are from an area where VOC and SVOC gas phase concentrations are generally low. Other areas in the UK and abroad with higher background carbon concentrations may very well have significant organic carbon artefacts. Do the water and carbon artefacts influence each other and if so how? [1]
We also consider that it is very relevant to use the data from complete PM chemical speciation (including analysis of sample and blank and field blank filters) to add all the PM components and try to identify the causes of the artefacts. [2]
Is it possible that all or most of the site operators bought from a specific batch of filters? Is data available on the specific conditioning regimes which indicates a pattern? [4]
The adsorption of water can be reduced if quartz fibre filters are pre treated in a 100%RH surrounding for some time (more weeks till a few months). The field blank’s mass increase will be reduced, but still a seasonal effect will remain depending on the prevailing ambient RH and temperature. Further investigation on this reduction and on the remaining seasonal variance of the blank weight increase would be desirable since quartz filters are the only type of filters also applicable for EC/OC analyses. [5]
CEN WG 15 will perform a large programme evaluating effects of various filter materials, brands, weighing room conditions, hysteresis effects, field blanks etc. Results of this programme will – hopefully – answer most questions. [6]
Concerning blank instability, WG 15 currently investigates more aspects on blank filters, conditioning and hysterisis effects. [7]
I agree that a long-term cumulative acquisition by the quartz filters of water vapour, and perhaps also of SVOC, that does not return to a fixed equilibrium adsorbed amount during the standard pre-weighing equilibration conditions, is likely to be a major explanatory factor for the field blank values. However, there seems also to be as yet unexplained discrepancy in the magnitude of field blank values obtained by the BV and NPL weighing labs. Has a data analysis been undertaken of the relationship, if any, between the filter blank mass change and the duration of the interval between the first filter weighing and the second filter weighing? [10]
Analysis of Trends in Gravimetric Particulate Mass Measurements in the UK
Ref: Bureau Veritas/AQ/AGG06801/RM/2543 Bureau Veritas UK Ltd 81
C.4 Should the annual mean gravimetric concentratio ns be corrected for the blank concentrations as described in Table 4.4?
Yes, as long as this can be done in agreement with EN12341 and EN14907. At the same time it is important to understand the reasons behind the behaviour. Can it be reproduced? [1]
In our opinion, these studies highlighted the relevance of the blank subtraction problem, but did not report enough consistent results to defend the subtraction values suggested by the BVHS&E report. We see this report as a good evaluation of the data available to reply a problem found: the higher concentrations obtained by Partisol using specific filters. As the design of the measurements was not specifically built from the beginning to address the blank problem, the results are not always consistent (as an example some labs found seasonal trends, others didn’t). Furthermore, in our opinion, you should not subtract the above PM10 bias values when this is not allowed or even discussed in the reference or equivalence protocols. This would result on a different implementation of the reference or non reference PM measurement systems across Europe. We appreciate that this might be an issue in all PM measurements across Europe but it is the reference method which should be used following current legislation [2].
CEN/TC 264 WG15 will perform research into this. [3]
I would be very wary about attempting to use "correction factors" here given the TEOM experience. In addition, there doesn't appear to be a systematic trend, which, given how relatively close a number of LA's are to NAQS limits, could be very problematic. [4]
In our opinion only for PM2.5 there should be a blank correction on the annual mean gravimetrical PM concentration for the past and in future. For PM10 a correction in future on the daily mean could be considered, for instance based on a “seasonal blank average” per location. [5]
No, but this has to be decided by Defra. I would recommend waiting at least for the results of experimental work in CEN WG 15. [6]
Blank subtraction should not correct annual concentrations. A correction of daily averages, subtracting from each mass concentration the equivalent field blank mass concentration of the “simultaneously” exposed blank would be more appropriate. Nevertheless the outcome of WG 15 studies should be taken into consideration before taking a decision on subtracting blanks. [7]
(N.B. I answer this question in respect of gravimetric data already obtained, not in respect of future practice.) At present, I do not have confidence in the accuracy of the uncorrected gravimetric concentrations derived using the quartz filters weighed by the BV labs. However, the application of the suggested correction procedure of subtracting annual average filter blank values from annual mean gravimetric concentrations has the effect of replacing one uncertain value with another uncertain value, albeit to give values that as a combined dataset one believes are closer to the “true” value (on average across all gravimetric monitors) than the uncorrected value. Obviously the application of a blanket network-wide average correction value will mean that some gravimetric monitor data will be over-corrected and some under-corrected and one can never know which is the situation in reality for individual sites. On balance, I think I would favour retention of the original data as has already been provided but with a prominent and substantive caveat indicating that correction of the values by the appropriate annual average blank may give a better measure of the closeness to the true gravimetric concentration. [10]
Analysis of Trends in Gravimetric Particulate Mass Measurements in the UK
Ref: Bureau Veritas/AQ/AGG06801/RM/2543 Bureau Veritas UK Ltd 82
C.5 Should the daily gravimetric concentrations be corr ected for the blank concentrations as described in Table 4.4?
Probably not very useful, because of the large uncertainties. [1]
Not until more is known about the behaviour of filters that have actually been sampled. The field blank filters take up water (and volatiles) by diffusion. The sampled filters have 24 or 55 m3 of air passed through them and are then stored for a period ranging from 1 to 14 days (depending on the position in the sample holder). Hence, the behaviour of the field blanks may not be representative of that of the sampled filters. [3]
I would be very wary about attempting to use "correction factors" here given the TEOM experience. In addition, there doesn't appear to be a systematic trend, which, given how relatively close a number of LA's are to NAQS limits, could be very problematic. [4]
In our opinion only for PM2.5 there should be a blank correction on the annual mean gravimetrical PM concentration for the past and in future. For PM10 a correction in future on the daily mean could be considered, for instance based on a “seasonal blank average” per location. [5]
No, but this has to be decided by Defra. I would recommend waiting at least for the results of experimental work in CEN WG 15. [6]
Blank subtraction should not correct annual concentrations. A correction of daily averages, subtracting from each mass concentration the equivalent field blank mass concentration of the “simultaneously” exposed blank would be more appropriate. Nevertheless the outcome of WG 15 studies should be taken into consideration before taking a decision on subtracting blanks. [7]
(N.B. I likewise answer this question in respect of gravimetric data already obtained, not in respect of future practice.) If the final decision is that annual averages are to be corrected using the correction factors specified, then my opinion is YES all daily values in that year should be corrected by the same correction factor. It would be utterly confusing, for anyone except those few experts intimately involved in the current discussion, to have archived daily values for a site that when averaged did not give the archived annual average for that site. I entirely understand that there is even more uncertainty in applying a blanket correction value to daily data but I believe my previous comment over-rides this. A compromise alternative might be to use the monthly correction factors presented in the paper to correct all daily values in that month. This would both allow for the observation that correction values vary between months (and therefore perhaps provide for “better” correction of daily data) and still ensure that the archived daily data were consistent with the archived annual average data. [10]
Analysis of Trends in Gravimetric Particulate Mass Measurements in the UK
Ref: Bureau Veritas/AQ/AGG06801/RM/2543 Bureau Veritas UK Ltd 83
C.6 In the future should the daily gravimetric concentr ations be corrected for the field blank concentrations?
Probably not very useful, because of the large uncertainties. I do not expect the uncertainties to become much smaller in the future. [1]
Not until more is known about the behaviour of filters that have actually been sampled. The field blank filters take up water (and volatiles) by diffusion. The sampled filters have 24 or 55 m3 of air passed through them and are then stored for a period ranging from 1 to 14 days (depending on the position in the sample holder). Hence, the behaviour of the field blanks may not be representative of that of the sampled filters. [3]
I don't see how this is feasible: it seems to assume that any blank artefact in a batch can be neatly averaged to reflect the "experience" of each exposed filter and still be a valid correction. In addition, if there is a very discernible, non-systematic artefact effect occurring with blanks, there can be no guarantee that applying correction factors to actual samples isn't "double correcting" in either direction. [4]
In our opinion only for PM2.5 there should be a blank correction on the annual mean gravimetrical PM concentration for the past and in future. For PM10 a correction in future on the daily mean could be considered, for instance based on a “seasonal blank average” per location. [5]
No, but this has to be decided by Defra. I would recommend waiting at least for the results of experimental work in CEN WG 15. [6]
Blank subtraction should not correct annual concentrations. A correction of daily averages, subtracting from each mass concentration the equivalent field blank mass concentration of the “simultaneously” exposed blank would be more appropriate. Nevertheless the outcome of WG 15 studies should be taken into consideration before taking a decision on subtracting blanks. [7]
The correct way forward is to ensure that the field blank “issue” is identified and solved and/or brought down to a magnitude where it is comparable to other uncertainties inherent in the process of PM mass determination by filter weighing. My view, as stated in (2) above, is that field blank values are determined as a matter of course and used to correct the masses of sample filters from the same cartridge, and that a note is made if the blank is higher than a pre-determined acceptable tolerance (to be decided). [10]
Analysis of Trends in Gravimetric Particulate Mass Measurements in the UK
Ref: Bureau Veritas/AQ/AGG06801/RM/2543 Bureau Veritas UK Ltd 84
C.7 Should the difference between quartz and Teflon coa ted glass fibre be taken into account in the daily/annual mean gravime tric concentrations reported data and as the basis for modelling?
Yes this is important for model versus measurement studies. [1]
You have to bear in mind all the sampling/analysis PM requirements when suggesting changing types of filters for sampling. For example, one type of filter media would reduce the blank artefacts, but may not be suitable for the analysis of metals or carbon. [2]
No. Also Teflon filters have been reported to suffer from artefacts. Reports from the US (where Teflon is the FRM reference filter) suggest that semi-volatile material is lost from these filters during sampling. This will occur particularly when samples are changed around midnight. [3]
It would seem to be that this akin to attaching a health warning to certain data sets. I would suggest it would make more sense to set an acceptability limit on blank artefact discrepancy. [4]
Since there is a significant difference this should be taken into account. [5]
No, but this has to be decided by Defra. I would recommend waiting at least for the results of experimental work in CEN WG 15. [6]
We suggest waiting until ongoing experimental studies carried out within WG15 of TC264 will be completed. [7]
Yes, until such time as the discrepancies are pinned down and eliminated, there should be distinction in reporting and modelling based on which filter media were used to obtain the gravimetric data. The situation has parallels here with the previous debate over whether to use raw TEOM data or the (now discredited) 1.3x corrected “GRAV EQ” data. [10]
Analysis of Trends in Gravimetric Particulate Mass Measurements in the UK
Ref: Bureau Veritas/AQ/AGG06801/RM/2543 Bureau Veritas UK Ltd 85
C.8 Do you have any data which you could contribute whi ch may add to the elucidation of this issue?
C.8.1 Jan Matthijsen, Netherlands Environmental Ass essment Agency (PBL)
Different Dutch institutes (RIVM, GGD-Amsterdam) have has performed or are performing experiments to find out more about water uptake by quartz filters. The results of these experiments have not yet been published as far as I know. For the RIVM results please contact Theo Hafkenscheid. [1]
C.8.2 Anonymous - PM 2.5: HIGH VOL. SAMPLER vs. TEOM
Dataset
Simultaneous records of PM2.5 levels measured with a TEOM monitor and a DIGITEL high vol. sampler (30m3/h), and chemical composition of PM2.5 samples (collected on quartz filters with DIGITEL). This data set, based on 24-h averages, was collected at Bloomsbury (LONDON).
Results
PM2.5 levels recorded with TEOM are 58% lower than those recorded with the high volume sampler (Figure C.2).
The “PM2.5-deficit” (high.vol minus TEOM) exhibits the highest correlation with nitrate and ammonium (Figures C.3A and C.3B). Moreover, the “PM2.5 deficit” is also positively correlated with organic carbon, although there is a relatively higher scattering (Figure C.3D).
The fact that the “PM2.5-deficit” is very well correlated with ammonium-nitrate (Figures C.3C and C.4A), strongly suggest that the PM2.5 underestimation in TEOM is being caused by the evaporation of a very high fraction of ammonium-nitrate (probably almost all ammonium-nitrate). Notice in Figure 3A how the slope of the “PM2.5-deficit minus its background (12.9µg/m3)” versus ammonium-nitrate levels is slightly higher than 1.0. This suggests that the PM2.5 underestimation in the TEOM measurements is being caused by the volatilisation of almost all the ammonium-nitrate and a relatively small fraction of the organic matter. The latter is also supported by the results shown in Figure C.4B. Notice how the slope of “PM2.5 (TEOM)+ammonium-nitrate plus its background (9µg/m3)” versus PM2.5 (high.vol) is ~0.85, slightly smaller than 1. The amount of PM2.5 matter necessary to raise the slope from 0.85 to 1.0 (in Figure 3B) is attributed to a fraction of organic matter. The term 9.0µg/m3 is interpreted as water collected by the filter. This is supported by the fact that the unaccounted fraction in PM2.5 (gravimetric concentration minus sum of chemistry) is very close: 10µg/m3.
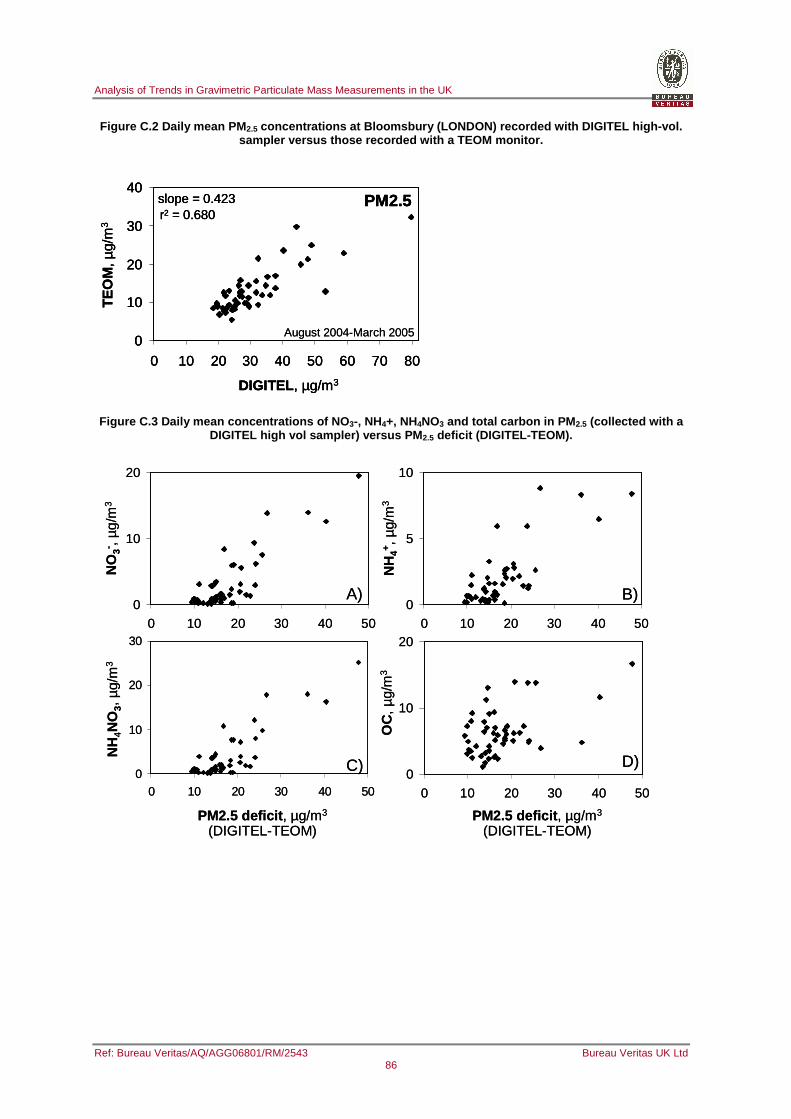
Analysis of Trends in Gravimetric Particulate Mass Measurements in the UK
Ref: Bureau Veritas/AQ/AGG06801/RM/2543 Bureau Veritas UK Ltd 86
Figure C.2 Daily mean PM 2.5 concentrations at Bloomsbury (LONDON) recorded wit h DIGITEL high-vol. sampler versus those recorded with a TEOM monitor.
0
10
20
30
40
0 10 20 30 40 50 60 70 80
DIGITEL, µg/m3
TE
OM
, µg/
m3
slope = 0.423 PM2.5r2 = 0.680
August 2004-March 20050
10
20
30
40
0 10 20 30 40 50 60 70 80
DIGITEL, µg/m3
TE
OM
, µg/
m3
slope = 0.423 PM2.5r2 = 0.680
0
10
20
30
40
0 10 20 30 40 50 60 70 80
DIGITEL, µg/m3
TE
OM
, µg/
m3
slope = 0.423 PM2.5r2 = 0.680
August 2004-March 2005
Figure C.3 Daily mean concentrations of NO 3-, NH4+, NH4NO3 and total carbon in PM 2.5 (collected with a DIGITEL high vol sampler) versus PM 2.5 deficit (DIGITEL-TEOM).
0
10
20
0 10 20 30 40 50
0
10
20
0 10 20 30 40 50
PM2.5 deficit , µg/m3
(DIGITEL-TEOM)
NH
4+ , µ
g/m
3
NO
3- , µ
g/m
3
PM2.5 deficit , µg/m3
(DIGITEL-TEOM)
NH
4NO
3, µ
g/m
3
OC
, µg/
m3
0
5
10
0 10 20 30 40 50
0
10
20
30
0 10 20 30 40 50
A)
D)
B)
C)0
10
20
0 10 20 30 40 50
0
10
20
0 10 20 30 40 50
PM2.5 deficit , µg/m3
(DIGITEL-TEOM)
NH
4+ , µ
g/m
3
NO
3- , µ
g/m
3
PM2.5 deficit , µg/m3
(DIGITEL-TEOM)
NH
4NO
3, µ
g/m
3
OC
, µg/
m3
0
5
10
0 10 20 30 40 50
0
10
20
30
0 10 20 30 40 50
A)
D)
B)
C)
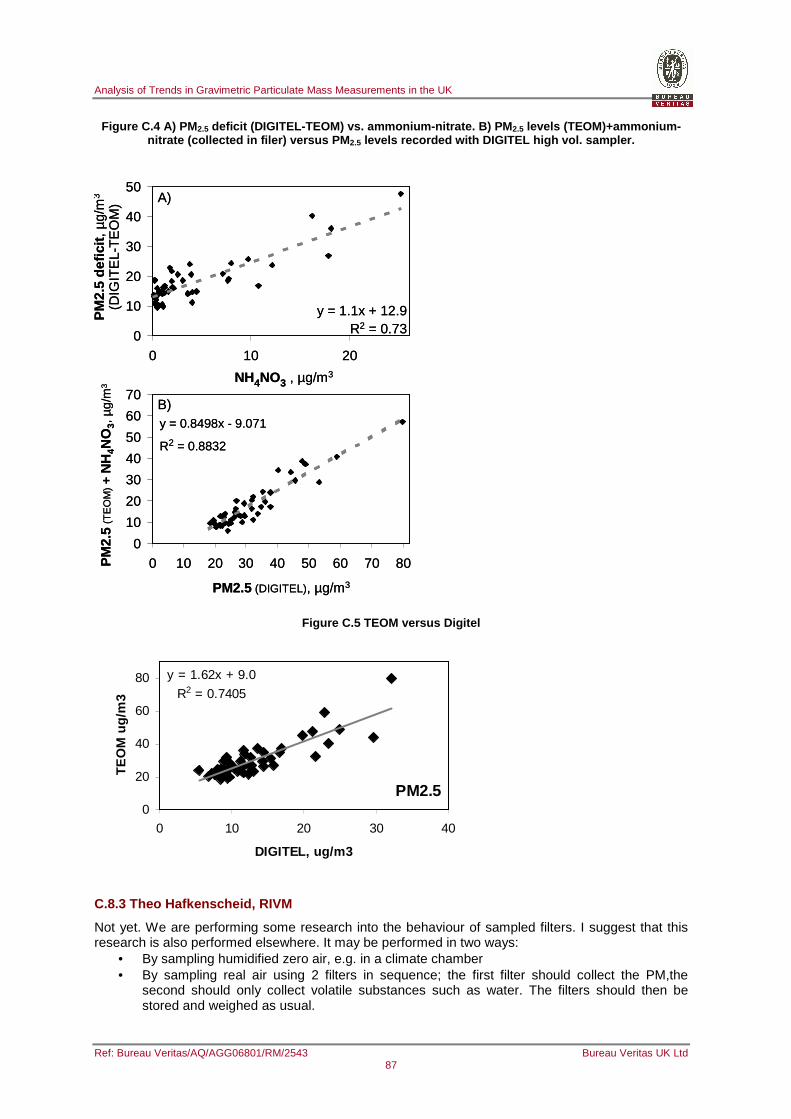
Analysis of Trends in Gravimetric Particulate Mass Measurements in the UK
Ref: Bureau Veritas/AQ/AGG06801/RM/2543 Bureau Veritas UK Ltd 87
Figure C.4 A) PM 2.5 deficit (DIGITEL-TEOM) vs. ammonium-nitrate. B) PM 2.5 levels (TEOM)+ammonium-nitrate (collected in filer) versus PM 2.5 levels recorded with DIGITEL high vol. sampler.
0
10
20
30
40
50
60
70
0 10 20 30 40 50 60 70 80
NH4NO3 , µg/m3
PM
2.5
(TE
OM
)+
NH
4NO
3, µ
g/m
3
0
10
20
30
40
50
0 10 20
y = 1.1x + 12.9R2 = 0.73
PM
2.5
defic
it, µ
g/m
3
(DIG
ITE
L-T
EO
M)
y = 0.8498x - 9.071
R2 = 0.8832
PM2.5 (DIGITEL), µg/m3
A)
B)
0
10
20
30
40
50
60
70
0 10 20 30 40 50 60 70 80
NH4NO3 , µg/m3
PM
2.5
(TE
OM
)+
NH
4NO
3, µ
g/m
3
0
10
20
30
40
50
0 10 20
y = 1.1x + 12.9R2 = 0.73
PM
2.5
defic
it, µ
g/m
3
(DIG
ITE
L-T
EO
M)
y = 0.8498x - 9.071
R2 = 0.8832
PM2.5 (DIGITEL), µg/m3
A)
B)
Figure C.5 TEOM versus Digitel
PM2.5
y = 1.62x + 9.0
R2 = 0.7405
0
20
40
60
80
0 10 20 30 40
DIGITEL, ug/m3
TE
OM
ug/
m3
C.8.3 Theo Hafkenscheid, RIVM
Not yet. We are performing some research into the behaviour of sampled filters. I suggest that this research is also performed elsewhere. It may be performed in two ways:
• By sampling humidified zero air, e.g. in a climate chamber • By sampling real air using 2 filters in sequence; the first filter should collect the PM,the
second should only collect volatile substances such as water. The filters should then be stored and weighed as usual.
Analysis of Trends in Gravimetric Particulate Mass Measurements in the UK
Ref: Bureau Veritas/AQ/AGG06801/RM/2543 Bureau Veritas UK Ltd 88
C.8.4 Shaun Drummond, SEPA
We have used Rupprecht and Pataschnik Model 2000 and later Model 2025 gravimetric samplers within SEPA now for some eigth years plus and have never experienced the problems outlined in the two papers (University of Leeds and Bureau Veritas). It should be noted that we do undertake ambient particulate monitoring on very much a "stop-start" basis in response to complaints regarding emissions from industrial processes rather than longer term Local Authoirty type studies as part of the LAQM regime.
We have consistently used Pall Life Sciences "Pallflex" membrane filters (Teflon coated glass fibre, TX40 "EMFAB") 47 mm filters and we have never experienced a problem in their use. We routinely use "true" field / travel blanks i.e. the filters are inspected, handled, weighed, conditioned, taken to site, loaded into the unit and processed subsequently in exactly the same way as "real samples", the only difference being that no air is sampled through them.
Typically the pre-exposure filters weigh approx 85-92 mg: we have never had a blank filter change weight by more than +/-0.02 mg bewteen pre and post exposure weighing and is commonly less than this, which we have considered acceptable. Thus, in effect, we consider the results of the field blank to be a check on filter stability, rather than a value to be subtracted (or added) to sample results.
There were a few reasons why we went for the Pallflex filters: They came with the R & P unit initially, so we chose to stick with this. I noted at the time that the USEPA required Teflon only for PM2.5, but allowed a wider range of materials for PM10 measurements, including quartz fibre. I reasoned that as the fraction size collected decreased, the filter weight and it's hygroscopic effect became increasingly important, hence it was necessary to spend the extra for "better" filters. This seemed to be reinforced for me by a simple visual examination of the two filter types: the quartz fibre papers we use for some other routine work are relatively thick (possibly prone to blinding) and have a spongy (potentially hygroscopic) feel. In addition, the quartz papers we had were almost twice the weight of the teflon coated one, meaning the weight increase due to the collected material would be relatively much lower. Finally, I have noticed that flaws appear to be more common in quartz filter papers than with the Teflon coated filters: most often this is manifest by an area on the paper where the filter material appears non-uniform, whether that be thicker or thinner, which is apparent on visual inspection.
I'm not sure if you've seen this, but a talk given to the RSC-AAMG by Paul Quincey of NPL may be of use (filter material choice and effects are discussed).
http://rsc-aamg.org/Documents/Papers/Prague/PaulQuincey.pdf
Data can be provided if required.
C.8.5 Jaap Visser, GGD, Amsterdam
Other data of our blank experiences can be provided by our senior project manager Dave de Jonge; [email protected]
C.8.6 Ulrich Pfeffer, LANUV NRW
We (LANUV NRW, Germany) perform gravimetric PM measurement since about 35 years with various filter materials. We use quartz type filters for mass measurements and subsequent analysis (metals, PAH) since more than 10 years. There are enormous differences between different brands of the same filter type (quartz). Any selection has to be made very carefully (especially regarding blanks for metals). The following picture shows monthly running annual means for PM10 over the last ten years at different types of stations (traffic: DDCS; urban background: CHOR, LISE; industry: MEID; rural background: EIFE). Clear trends can be detected at some of these sites. Thesemeasurements were performed with Digitel HVS.
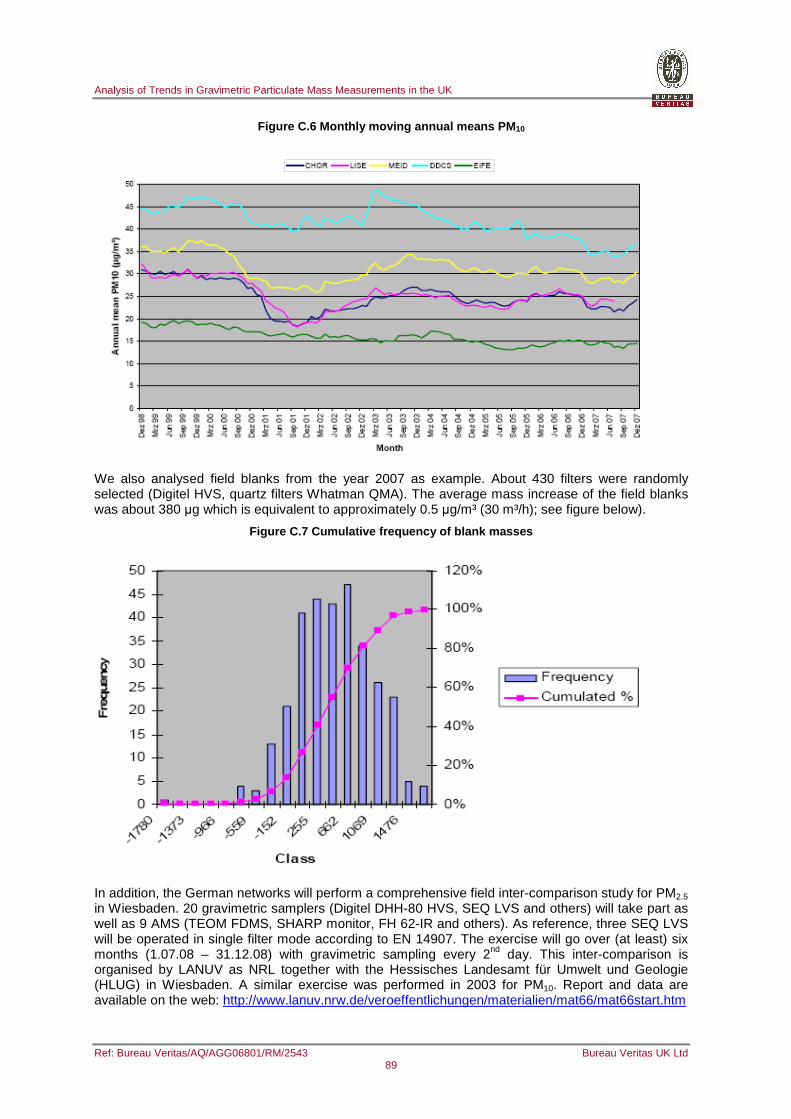
Analysis of Trends in Gravimetric Particulate Mass Measurements in the UK
Ref: Bureau Veritas/AQ/AGG06801/RM/2543 Bureau Veritas UK Ltd 89
Figure C.6 Monthly moving annual means PM 10
We also analysed field blanks from the year 2007 as example. About 430 filters were randomly selected (Digitel HVS, quartz filters Whatman QMA). The average mass increase of the field blanks was about 380 µg which is equivalent to approximately 0.5 µg/m³ (30 m³/h); see figure below).
Figure C.7 Cumulative frequency of blank masses
In addition, the German networks will perform a comprehensive field inter-comparison study for PM2.5 in Wiesbaden. 20 gravimetric samplers (Digitel DHH-80 HVS, SEQ LVS and others) will take part as well as 9 AMS (TEOM FDMS, SHARP monitor, FH 62-IR and others). As reference, three SEQ LVS will be operated in single filter mode according to EN 14907. The exercise will go over (at least) six months (1.07.08 – 31.12.08) with gravimetric sampling every 2nd day. This inter-comparison is organised by LANUV as NRL together with the Hessisches Landesamt für Umwelt und Geologie (HLUG) in Wiesbaden. A similar exercise was performed in 2003 for PM10. Report and data are available on the web: http://www.lanuv.nrw.de/veroeffentlichungen/materialien/mat66/mat66start.htm
Analysis of Trends in Gravimetric Particulate Mass Measurements in the UK
Ref: Bureau Veritas/AQ/AGG06801/RM/2543 Bureau Veritas UK Ltd 90
C.8.7 Luisa Marelli, JRC
JRC tested during 2004 “heated” quartz filters and untreated quartz filters for their weight stability. The weight of the “heated” filter increased by about 250 mg during a period of 4 months, whereas the untreated filter weight increased by only 50 mg during the same period.
Further we could provide data of field blanks exposed during the European QA/QC campaigns carried out by JRC in 15 Member States. Indicating that in some cases the subtraction/non subtraction of field blanks may bring to non-negligible changes in mass concentration (up to 20-30% for low PM10 values).
If relevant for you we can also provide data of laboratory blank filters stored in weighing room under controlled conditions (RH 50% - T 20ºC) for the last three years
C.8.8 Mat Heal, University of Edinburgh
Blank filter weighing data from a gravimetric PM project in Edinburgh
• M.R. Heal, L.R. Hibbs and I.J. Beverland
• Filter media: Gelman Zefluor, 47 mm diameter, 2 µm pore.
• Instruments: Two Partisol 2025 sequential samplers, one with PM10 inlet, one with PM2.5 inlet.
Filter batch protocol: Each batch of filters were weighted with pre- and post-weighings separated by approximately 3 weeks. For each set of 28 sample filters (14 for each Partisol) there were a further 2 “machine blanks”, one in each Partisol (i.e. handled in the same way as sample filters by being added to each Partisol cartridge and passed automatically through the Partisol sample change without actual exposure), and a further 6 “weigh blank” filters that were left in the weighing laboratory. All filters were left to equilibrate in acid-washed Petri dishes for at least 24 h adjacent to the balance before weighing. A Sartorius MC5 6-place balance equipped with anti-static ionisation blower was used for weighing, with traceable standard weights. The weigh laboratory was an otherwise entirely unused room, without through drafts, etc., but was not specifically humidity and temperature controlled. Temperature and RH were measured and generally remained in the ranges 17 ± 3°C and 53 ± 7%, respectively. Some larger excursions in both T and RH did occur.
The graphs shown below illustrate data from 26 separate filter weighing batches, i.e. 26 sets of 6 “weigh blank” filters and 2 x 26 “machine” blank filters. The blank filter data demonstrate an impact of change in pre- and post-RH on weigh blank and machine blank filter masses, the latter of which was entirely eliminated by use of the former as a correction process. It should also be noted that the largest of the filter blank mass changes in the data below are ~15 µg which at a Partisol 24 h flow volume of 24 m3 even if uncorrected equates to an uncertainty in PM concentration-equivalent of only ~0.6 µg m-3. (The mean filter blank mass change equates to ~0.2 µg m-3). This demonstrates the superiority of Teflon filters over quartz filters for gravimetric work, where these can be used.
Note that none of these data illuminate whether unintended mass changes occur to loaded sample filters.
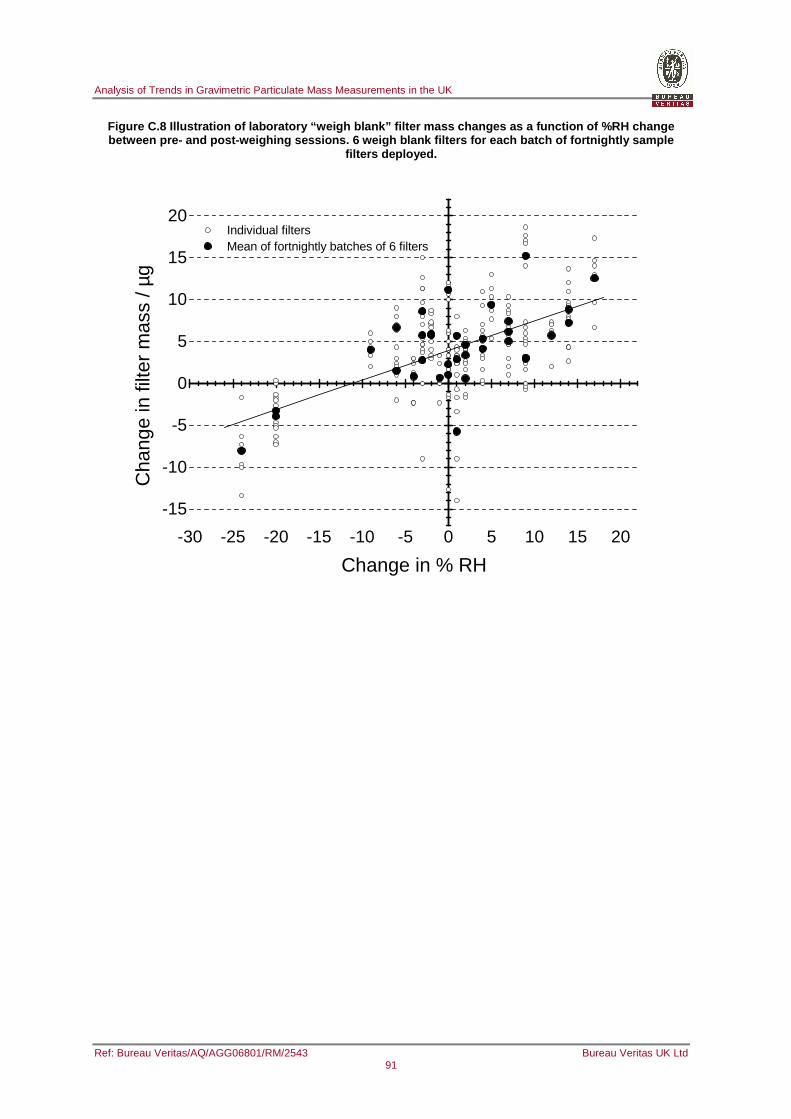
Analysis of Trends in Gravimetric Particulate Mass Measurements in the UK
Ref: Bureau Veritas/AQ/AGG06801/RM/2543 Bureau Veritas UK Ltd 91
Figure C.8 Illustration of laboratory “weigh blank” filter mass changes as a function of %RH change between pre- and post-weighing sessions. 6 weigh bl ank filters for each batch of fortnightly sample
filters deployed.
-30 -25 -20 -15 -10 -5 0 5 10 15 20
-15
-10
-5
0
5
10
15
20 Individual filters Mean of fortnightly batches of 6 filters
Cha
nge
in fi
lter
mas
s / µ
g
Change in % RH
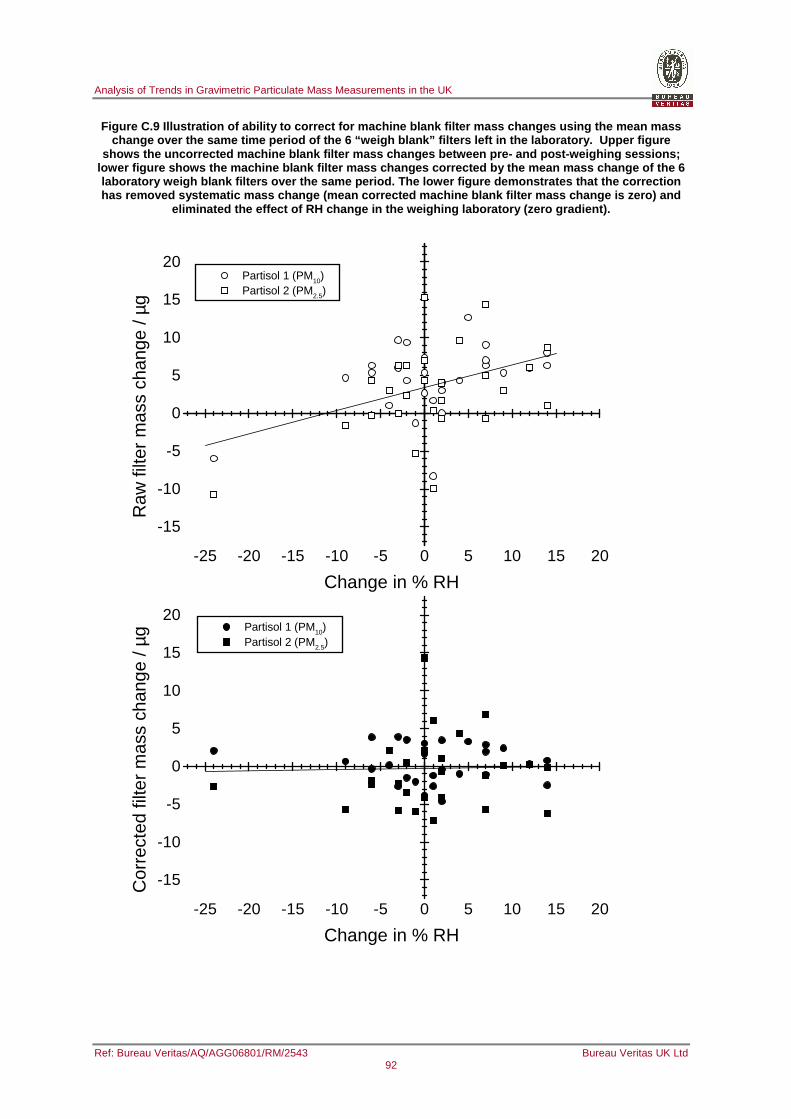
Analysis of Trends in Gravimetric Particulate Mass Measurements in the UK
Ref: Bureau Veritas/AQ/AGG06801/RM/2543 Bureau Veritas UK Ltd 92
Figure C.9 Illustration of ability to correct for m achine blank filter mass changes using the mean mas s change over the same time period of the 6 “weigh bl ank” filters left in the laboratory. Upper figure
shows the uncorrected machine blank filter mass cha nges between pre- and post-weighing sessions; lower figure shows the machine blank filter mass ch anges corrected by the mean mass change of the 6 laboratory weigh blank filters over the same period . The lower figure demonstrates that the correction has removed systematic mass change (mean corrected machine blank filter mass change is zero) and
eliminated the effect of RH change in the weighing laboratory (zero gradient).
-25 -20 -15 -10 -5 0 5 10 15 20
-15
-10
-5
0
5
10
15
20 Partisol 1 (PM10) Partisol 2 (PM2.5)
Raw
filte
r m
ass
chan
ge /
µg
Change in % RH
-25 -20 -15 -10 -5 0 5 10 15 20
-15
-10
-5
0
5
10
15
20 Partisol 1 (PM10) Partisol 2 (PM2.5)
Change in % RH
Cor
rect
ed fi
lter
mas
s ch
ange
/ µg
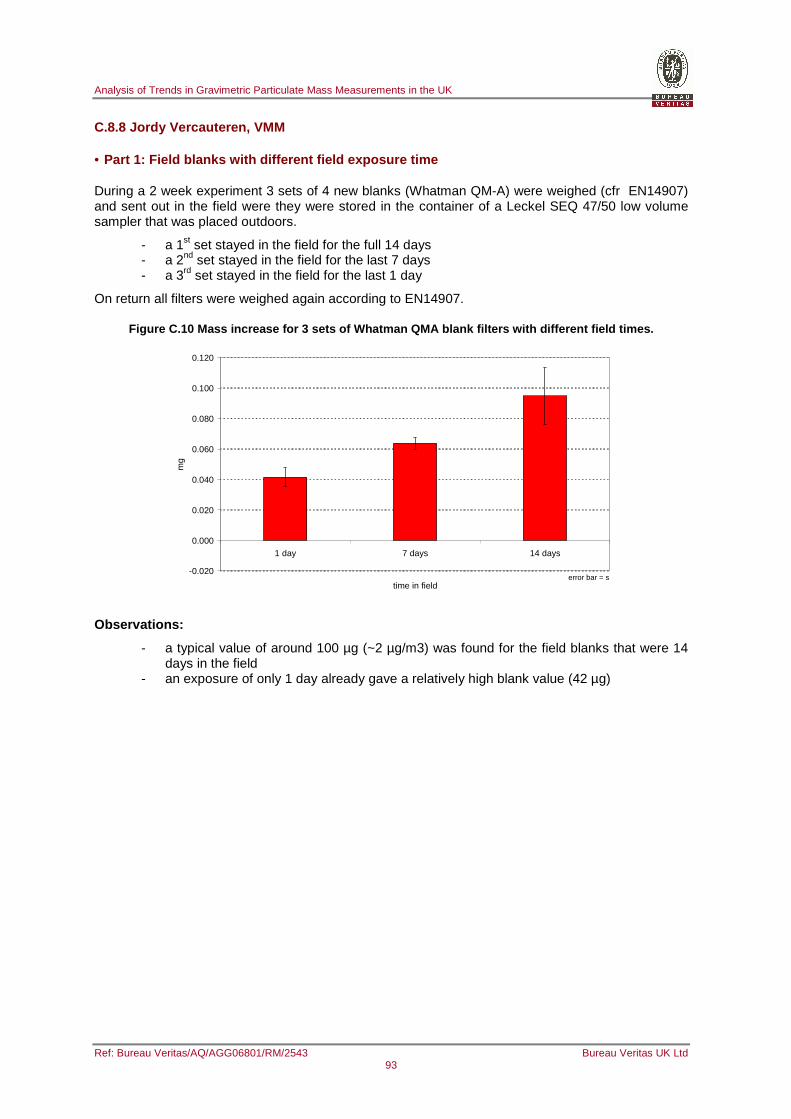
Analysis of Trends in Gravimetric Particulate Mass Measurements in the UK
Ref: Bureau Veritas/AQ/AGG06801/RM/2543 Bureau Veritas UK Ltd 93
C.8.8 Jordy Vercauteren, VMM
• Part 1: Field blanks with different field exposure time
During a 2 week experiment 3 sets of 4 new blanks (Whatman QM-A) were weighed (cfr EN14907) and sent out in the field were they were stored in the container of a Leckel SEQ 47/50 low volume sampler that was placed outdoors.
- a 1st set stayed in the field for the full 14 days - a 2nd set stayed in the field for the last 7 days - a 3rd set stayed in the field for the last 1 day
On return all filters were weighed again according to EN14907.
Figure C.10 Mass increase for 3 sets of Whatman QMA blank filters with different field times.
-0.020
0.000
0.020
0.040
0.060
0.080
0.100
0.120
1 day 7 days 14 days
time in field
mg
error bar = s
Observations:
- a typical value of around 100 µg (~2 µg/m3) was found for the field blanks that were 14 days in the field
- an exposure of only 1 day already gave a relatively high blank value (42 µg)
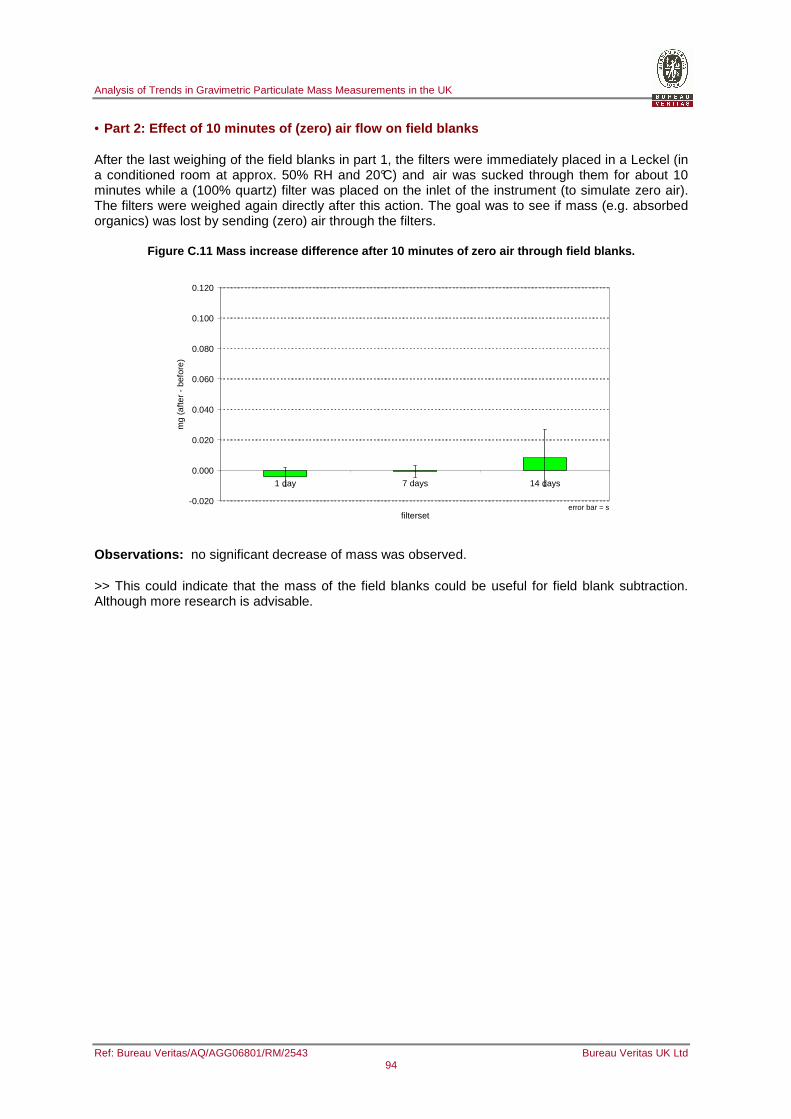
Analysis of Trends in Gravimetric Particulate Mass Measurements in the UK
Ref: Bureau Veritas/AQ/AGG06801/RM/2543 Bureau Veritas UK Ltd 94
• Part 2: Effect of 10 minutes of (zero) air flow on field blanks
After the last weighing of the field blanks in part 1, the filters were immediately placed in a Leckel (in a conditioned room at approx. 50% RH and 20°C) and air was sucked through them for about 10 minutes while a (100% quartz) filter was placed on the inlet of the instrument (to simulate zero air). The filters were weighed again directly after this action. The goal was to see if mass (e.g. absorbed organics) was lost by sending (zero) air through the filters.
Figure C.11 Mass increase difference after 10 minut es of zero air through field blanks.
-0.020
0.000
0.020
0.040
0.060
0.080
0.100
0.120
1 day 7 days 14 days
filterset
mg
(afte
r -
befo
re)
error bar = s
Observations: no significant decrease of mass was observed.
>> This could indicate that the mass of the field blanks could be useful for field blank subtraction. Although more research is advisable.
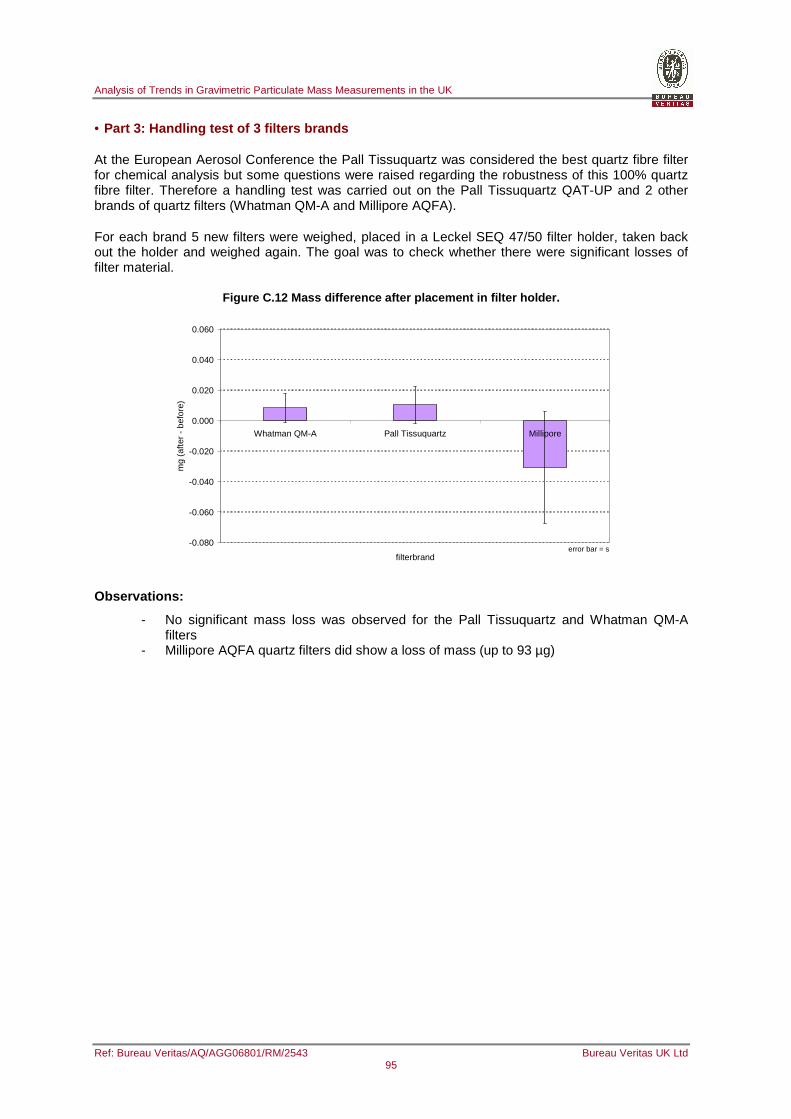
Analysis of Trends in Gravimetric Particulate Mass Measurements in the UK
Ref: Bureau Veritas/AQ/AGG06801/RM/2543 Bureau Veritas UK Ltd 95
• Part 3: Handling test of 3 filters brands
At the European Aerosol Conference the Pall Tissuquartz was considered the best quartz fibre filter for chemical analysis but some questions were raised regarding the robustness of this 100% quartz fibre filter. Therefore a handling test was carried out on the Pall Tissuquartz QAT-UP and 2 other brands of quartz filters (Whatman QM-A and Millipore AQFA).
For each brand 5 new filters were weighed, placed in a Leckel SEQ 47/50 filter holder, taken back out the holder and weighed again. The goal was to check whether there were significant losses of filter material.
Figure C.12 Mass difference after placement in filt er holder.
-0.080
-0.060
-0.040
-0.020
0.000
0.020
0.040
0.060
Whatman QM-A Pall Tissuquartz Millipore
filterbrand
mg
(afte
r -
befo
re)
error bar = s
Observations:
- No significant mass loss was observed for the Pall Tissuquartz and Whatman QM-A filters
- Millipore AQFA quartz filters did show a loss of mass (up to 93 µg)
Analysis of Trends in Gravimetric Particulate Mass Measurements in the UK
Ref: Bureau Veritas/AQ/AGG06801/RM/2543 Bureau Veritas UK Ltd 96
C.9 Other Comments
Further, measurement issues and compliance to limit values is one thing. Another is the real consequences for public health. It would be good to introduce the health aspect somewhere in the report. That’s the reason why all this is done after all. While reading the report questions arise like:
• Did we miss important PM fractions in the past while assessing the health effects and would therefore affect the relative risks found? And,
• Do we overestimate the health effects of PM when we consider the present PM concentrations based on the presently allowed reference methods? [1]
Also, the report focuses on compliance checking and the influences of measurement issues. It has therefore a natural tendency towards measuring the lowest PM concentration possible. The fact that you want to improve the assessment of PM levels is a bit lost. This point could be made more clearly. If not the impression stays that you are only looking for the lowest PM concentration allowed, due to administrative pressure. Whereas the public knows very well that changing measurement techniques does not change the air outside and does not improve public health. [1]
The executive summary could be sharper (text and layout); a more staccato text could help to get the message across more effectively. It now seems to reflect the research history rather than the most important findings. For instance, I found the “primary focus” on page two of the exec sum in stead of the first paragraph. The exec sum contains quite many details which unnecessarily burden the mind. For instance, I found seemingly contradictory details (e.g. page ix, 4th paragraph: partisol overestimation versus end of 5th paragraph: partisol consistently reading lower than …). [1]
Further the report leaves questions on how to continue. It could improve when it elaborates more on: What’s next?; Steps to be taken on a national and/or European level and Most urgent matters. [1]
The European context could be given some more attention. Is there evidence that other countries experience similar problems? What are the possible consequences on European scale? [1]
There is little about modeling in relation to measurements in the report. Models generally do not take any bias into account. A model result is in a way a “measurement” on itself. When comparing PM model results with real measurements. The model conditions which determine the ground based results should be evaluated with regard to the relevant measurements. [1]
Finally, I wondered are the PM trends in Britain in line with the emission trends, when the measurements are corrected according to your best knowledge of the biases. Or is it too early to say? In the Netherlands PM levels do not show a significant trend since 2000. We anticipate however a measurable drop in the coming years (significant change in 10 years). So far we argue that measurements are too uncertain to tell: uncertain due to year-to-year variability induced by meteo and measurement uncertainties. [1]
Why was Partisol selected instead of the widely used method of the low volume PM10 reference method? The use of the reference method would avoid possible interferences from the instrument itself. [2]
We think it would have been of interest if the TEOM / Partisol ratios for all the stations where both methods are available were supplier in this report (even as an annex). This would benefit the reader in identifying quantitatively the difference between the two methods in terms of absolute µg/m3. This would allow evaluating relatively the differences of the artefacts of all the methods used. [2]
At the beginning of executive summary/report, it is stated that the Partisol and the FDMS were found to be equivalent with the reference instrumentation. However, it is latter pointed out that Partisol overestimates FDMS. An evaluation of these discrepancies would help to understand what is happening here (i.e. were the filter media the same?, were quartz filters used?, were blanks treated in the same way?,….) [2]
It would help to understand the problem further if at the end of the report a summary of the possible artefact values is supplied. In the report, a number of possible sources of artefact measurements are given, but one does not understand if these are exclusive or inclusive causes. What are the absolute
Analysis of Trends in Gravimetric Particulate Mass Measurements in the UK
Ref: Bureau Veritas/AQ/AGG06801/RM/2543 Bureau Veritas UK Ltd 97
differences found between the FDMS-Partisol measurements, and what are the artefact values found by blank field filters, differences of use of type of filters, differences in humidity control,….?? Could all these artefact values be added or not? Are the final differences between FDMS and Partisol or between the reference method and the Partisol accounted by the artefact values found??? [2]
As previously mentioned, it is stated that FDMS and Partisol are equivalent to the reference method, but latter: a) it is stated that there are differences in terms of comparison modelling/FDMS and modelling/Partisol, b) It is suggested to eliminate the bias from Partisol because FDMS is an equivalent method. [2]
Recent studies by Robinson et al., 2007, published in Science, highlighted the large differences between PM modelling and experimental measurements in urban areas, with a large underestimation of modelling. Recent results show that the factors for secondary OC production seem to be much higher than those used by most models in the world. [2]
We found that when using quartz filters we measured very high OC (organic carbon) levels in specific sets of blank filters, but very low in most of the sets used. It is well known that quartz filters are subject to positive sampling artefacts due to adsorption of volatile or semi-volatile organic compounds (McDow & Huntzicker, 1990; Turpin et al., 2000; Mader et al., 2001; Maenhaut et al., 2003 and 2004). If a specific batch of filters shows a higher adsorption of volatile OC and is therefore more influenced by positive artefacts, the blank field filters will yield higher total mass and OC levels. We estimated in our lab that in some cases the difference between blank filters may reach 2 µg/m3, however the occurrence of this artefact was found to occur very randomly in our studies. We mention this because not only water vapour may account for the differences found in the blanks. It is for this reason that filters for carbon sampling are recommended to be pre-baked at high temperatures (>500 ºC overnight before use).[2]
It is widely accepted that the best ways to correct positive OC artefacts from quartz filter media are the use of 2 filters, a front and a back filter, or the use of denuder sampling trains. In the 2-filter setup, the back filter adsorbs water vapour and the artefact OC but no particulate material, and the front filter may be corrected accordingly. With the denuder setup, volatile and semi-volatile OC is removed from the air-stream before it reaches the filter substrate. Why were these methods not tested ? This would help to correct blank artefacts but also to check the suitability of different types of filters. [2]
We consider that the suggestion made on making the evaluation of the attainability of the PM limit values with modelling or with FDMS methods, or by subtracting the possible bias introduced by Partisol is not adequate since it is mentioned that Partisol was found to be equivalent with the reference EU sampling equipment. Again this would result on a different implementation of the reference or non reference PM measurement systems across Europe. [2]
When describing the increasing trends for PM10 and PM2.5 found with the Partisol, it would be interesting to mention if these increasing were found with the TEOM and the FDMS measurements for all the studied sites. [2]
It is widely accepted that the positive artefacts in the gravimetric methods are highly influenced by face velocity of the sampling system, which is the volumetric flow rate divided by the exposed area of the filter. As the face velocity decreases, the OC and PM concentrations increase due to the higher influence of positive sampling artefacts (McDow and Huntzicker, 1990, Turpin et al., 2000). Collection of elemental carbon, which is not volatile and therefore not susceptible to adsorption and volatilisation errors, is unaffected by face velocity. As a result, the use of different sampling instruments, operating at different face velocities, is expected to yield significantly different results with regard to PM mass, OC and TC levels. Typical values of face velocity are 74 cm/s for high-volume samplers (e.g., 30 m3/h, 15 cm diameter filters), and 22 cm/s for low-volume samplers (approx. 1 m3/h, 47 mm diameter). Consequently, low-volume samples are subject to higher positive artefacts than the reference high-volume samplers (see as examples papers by Turpin et al., 2000; Maenhaut et al., 2003 and 2004; Viana et al., 2006) This also means that the conclusions obtained for Partisol samplers (low-volume) cannot be completely extrapolated to high-volume reference systems. Finally, lower face velocities may also contribute to the higher retention of inorganic volatile species (such as nitric acid) with respect to the high-volume sampler [2]
Analysis of Trends in Gravimetric Particulate Mass Measurements in the UK
Ref: Bureau Veritas/AQ/AGG06801/RM/2543 Bureau Veritas UK Ltd 98
We suggest to make filter pre-treatment and (statistical) analyses of field blank’s as well as correction methods part of EN 14907. [5]
Generally, it should be born in mind that PM trends seem to be very flat in the UK (and other countries in Western Europe) in the first decade of the 21st century. This is obvious also when looking only at TEOM data (see Harrison et al., Atmospheric Environment 42 (2008), 603-608). These observations form the background for the analytical issues discussed here. [6]
It can be seen from the BV report that various companies, institutions, instruments, filter materials, laboratories etc. are involved in the whole PM monitoring process in the UK. This makes it difficult to locate sources of potential errors and/or uncertainties. As underpinned in the summary on page 29 (4.1.4) problems mainly seem to occur in the following combination:
• Years 2006/2007 • Partisol samplers • Quartz filters Whatman QMA • Weighing by Bureau Veritas (BV) [6]
It may be true that quartz filters accumulate more water than some other filter types. This is especially relevant with the Partisol sampler which has the highest relationship between filter area and volume flow (50 mm, 1 m³/h). So the effects are respectively lower using a standard LVS with 2.3 m³/h. My interpretation of figure 4.4 on page 21 is that the highest differences observed for PM2.5
concentration measured with the gravimetric method are linked to the laboratories involved. [6]
The central point is that obviously things have changed over the years, especially in 2006/2007 (see figures 4.17 and 4.20). As a consequence, the main reason for all effects observed cannot be linked to the filter material or the instruments unless there is evidence that filters and/or instruments were subject to change during this time. [6]
In my view, a possible conclusion (as implied in the letter of 6 June) that quartz filters are unsuitable for mass measurements is rash, or even wrong. Admittedly, there are some problems with this type of filters. On the other hand, quartz filters offer the valuable advantage that subsequent analysis is possible which is NOT the case e.g. for Emfab filters. [6]
I have been trying to understand your report and I was wondering did you check differences between lots from the same manufacturer. Years ago we noticed substantial chemical differences between blanks, especially for Fluoride. This led us to check carefully when new lost numbers were used to see if there were any differences. [8]
I will try to read the report thoroughly asap but I just wanted to ask whether you are aware of the work that we are planning in CEN working group 15 regarding the field blanks and the problems regarding the conditioning of (quartz) filters? (the latter is sort of a repetition of the work of VMM and GGD Amsterdam). [9]
We at VMM will also carry out another experiment in which quartz field blanks will first be weighed (after having spent 2 weeks in the field) and than we’ll pump clean air through them for 5 minutes and weigh them again. This is to investigate whether some of the adsorbed material is lost at the start of sampling (if so, the normal field blank would be an overestimate of the real situation) [9]
I’m almost sure it a combination of water and organics… we find that a total PM10 blank is around 2 µg/m3 and an OC blank is around 1 µg/m3 (many people find the latter value). So that would make the problem 50% water and 50% organics. [9]
As you might know in the Netherlands they now ‘wet’ the filters prior to sending them to the field and this significantly lowers the field blank. On the other hand, a blank subtraction might have just the same effect without the hassle of wetting each filter. Anyway, their results show that water is certainly involved. [9]
One thing I’ve been looking into is an analysis of the filters with the Karl-Fischer method. From what I’ve found out, it should be possible to determine the water content of filter and PM. [9]
Analysis of Trends in Gravimetric Particulate Mass Measurements in the UK
Ref: Bureau Veritas/AQ/AGG06801/RM/2543 Bureau Veritas UK Ltd 99
2 things that certainly have an effect on blanks are
• the purity of the quartz: e.g. Whatman QM-A contains 5 % glass and I’m almost certain this has an effect (it also causes problems for EC/OC and element analysis) [9]
• and probably the most important factor: the pre-heating of the quartz filter: almost all filters are pre-heated at the factory which means they are often received by the customer in a very dry form…48h at 50 % is than far from enough to bring the filters to equilibrium. I guess the absorption curve at 50 % is quite similar (but less steep) than the one at 100 %. It would take months to equilibrate the filters using the normal procedure. With the wetting at 100 % RH it could be done in a couple of weeks. [9]
But I’m afraid it could be even more complicated, in our 2007 experiments we saw that the Whatman QM-A started gaining mass again after the initial drop in mass when the filter was brought from 100 % RH to 50 % RH. [9]
I also recently read an article which showed that the pre-heating of the Whatman QM-A filters changes the activity of the filters (but I unfortunately can’t seem to find the publication right now). [9]
Anyway, it’s a good thing people are starting to focus on this issue. At the European Aerosol Conference in Greece last month the PM working group discussion was all about these blanks and artefacts, but it turned out that the scientific community only had a real knowledge about OC blanks. Nobody had information about the uptake of water. Of course you can’t blame than as from a scientific point of view it’s not very important… [9]
It remains unclear to me from the updated paper whether laboratory “weigh blanks” (i.e. filters taken out of the same packet as sample filters but which are left undisturbed in the weighing laboratory or elsewhere) were routinely included in the filter-weighing protocol? Such weigh blank filters would be weighed in the same pre and post weighing sessions as for a given set of sample filters and any changes in the weigh blank filters monitored and potentially used as a correction (positive or negative) to the sample filters weighed in the same sessions. I do not know the exact detail of the EN standard for filter weighing, but as a measurement scientist I would find it hard to understand if a proper QA/QC process did not include as routine some form of control filter(s), whether that was a set of in-lab “weigh blank” filters or the relevant Partisol “machine blank” filter or both. As a minimum I would expect a weighing of and probably routine sample-mass correction by, the relevant “machine blank” filter. The whole point of inclusion of controls in any analytical process is to highlight unexpected issues as fast as possible. [10]
References
Mader B.T., Flagan R.C. and Seinfeld J.H. (2001) Sampling atmospheric carbonaceous aerosols using a particle trap impactor/denuder sampler. Environmental Science and Technology 35, 4857-4867.
Maenhaut W., Chi X., Cafmeyer J., Mikuška P., Večeřa Z. and Broškovičová A. (2003) Field investigations with a diffusion denuder for the elimination of sampling artifacts for carbonaceous aerosols. Journal of Aerosol Science, Abstracts of the European Aerosol Conference 2003, S1171-S1172.
Maenhaut W., Chi X., Cafmeyer J., Salma I., Mikuška P., Večeřa Z. and Broškovičová A. (2004) Investigations during summer field campaigns in central Europe on the performance of a diffusion denuder for the elimination of sampling artifacts for carbonaceous aerosols. Journal of Aerosol Science, Abstracts of the European Aerosol Conference 2004, S1069-S1070.
McDow S.R. and Huntzicker J.J. (1990) Vapor adsorption artifact in the sampling of organic aerosol: face velocity effects. Atmospheric Environment 24, 2563-2571.
Robinson A.L., Donahue N.M., Shrivastava M.K., Weitkamp E.A., Sage A.M., Grieshop A.P., Lane T.E., Pierce J.R., Pandis S.N., 2007. Rethinking Organic Aerosols: Semivolatile Emissions and Photochemical Aging. Science 315, 5816, 1259–1262. DOI: 10.1126/science.1133061.
Analysis of Trends in Gravimetric Particulate Mass Measurements in the UK
Ref: Bureau Veritas/AQ/AGG06801/RM/2543 Bureau Veritas UK Ltd 100
Turpin B.J., Hering S.V. and Huntzicker, J.J. (1994) Investigation of organic aerosol sampling artifacts in the Los Angeles Basin. Atmospheric Environment 28, 3061-3071.
Turpin B.J., Saxena P. and Andrews E. (2000) Measuring and simulating particulate organics in the atmosphere: problems and prospects. Atmospheric Environment 34, 2983-3013.
Viana M., Chi X., Maenhaut W., Mikuska P., Vecera Z. (2006) Influence of Sampling Artefacts on Measured PM, OC, and EC Levels in Carbonaceous Aerosols in an Urban Area. Aerosol Science and Technology, 40:107-117. DOI:10.1080/02786820500484388.