Embed Size (px)
Citation preview

NCES 2015-015 U . S . D E P AR T M E N T O F E D U C A T I O N
Trends in High School Dropout and Completion Rates in the United States: 1972–2012 Compendium Report

Trends in High School Dropout and Completion Rates in the United States: 1972–2012 Compendium Report
JUNE 2015
Patrick Stark Amber M. Noel American Institutes for Research
Joel McFarland Project Officer National Center for Education Statistics
NCES 2015-015
U.S. DEPARTMENT OF EDUCATION

U.S. Department of Education Arne Duncan Secretary
Institute of Education Sciences Sue Betka Acting Director
National Center for Education Statistics Peggy Carr Acting Commissioner
The National Center for Education Statistics (NCES) is the primary federal entity for collecting, analyzing, and reporting data related to education in the United States and other nations. It fulfills a congressional mandate to collect, collate, analyze, and report full and complete statistics on the condition of education in the United States; conduct and publish reports and specialized analyses of the meaning and significance of such statistics; assist state and local education agencies in improving their statistical systems; and review and report on education activities in foreign countries.
NCES activities are designed to address high-priority education data needs; provide consistent, reliable, complete, and accurate indicators of education status and trends; and report timely, useful, and high-quality data to the U.S. Department of Education, the Congress, the states, other education policymakers, practitioners, data users, and the general public. Unless specifically noted, all information contained herein is in the public domain.
We strive to make our products available in a variety of formats and in language that is appropriate to a variety of audiences. You, as our customer, are the best judge of our success in communicating information effectively. If you have any comments or suggestions about this or any other NCES product or report, we would like to hear from you. Please direct your comments to
NCES, IES, U.S. Department of Education 1990 K Street NW Washington, DC 20006-5651
June 2015
The NCES Home Page address is http://nces.ed.gov. The NCES Publications and Products address is http://nces.ed.gov/pubsearch.
This publication is only available online. To download, view, and print the report as a PDF file, go to the NCES Publications and Products address shown above.
This report was prepared in part under Contract No. ED-IES-12-D-0002 with the American Institutes for Research. Mention of trade names, commercial products, or organizations does not imply endorsement by the U.S. Government.
Suggested Citation Stark, P., and Noel, A.M. (2015). Trends in High School Dropout and Completion Rates in the United States: 1972–2012 (NCES 2015-015). U.S. Department of Education. Washington, DC: National Center for Education Statistics. Retrieved [date] from http://nces.ed.gov/pubsearch.
Content Contact Joel McFarland (202) 502-7609 [email protected]

iii
Acknowledgments
The authors would like to recognize the time and effort volunteered by household respondents to the Current Population Survey and to the American Community Survey. The report also relies on voluntary reporting by local and state officials to compile the rates reported through the Common Core of Data on public schools.

THIS PAGE INTENTIONALLY LEFT BLANK

v
Contents
Page
Acknowledgments ...................................................................................................................... iii List of Tables .............................................................................................................................. viList of Figures............................................................................................................................. ix
Introduction................................................................................................................................ 1
Findings....................................................................................................................................... 5National Event Dropout Rates ............................................................................................... 5State Event Dropout Rates for Public High School Students ................................................ 7National Status Dropout Rates.............................................................................................. 8 National Status Completion Rates ......................................................................................... 9
General Educational Development (GED) Credentials and National Status Completion Rates..................................................................................................................................... 11Adjusted Cohort Graduation Rates for Public School Students............................................ 12
References ................................................................................................................................. 14
Figures....................................................................................................................................... 19
Tables......................................................................................................................................... 26Appendix A—Technical Notes ................................................................................................. A-1
Appendix B—Glossary ............................................................................................................. B-1
Appendix C—Standard Error Tables..................................................................................... C-1

vi
List of Tables
Table Page
1 Event dropout rates and number and distribution of 15- through 24-year-olds who dropped out of grades 10–12, by selected characteristics: October 2012 ........................ 28
2 Event dropout rates of 15- through 24-year-olds who dropped out of grades 10–12, and number of dropouts and population of 15- through 24-year-olds who were enrolled: October 1972 through October 2012 ................................................................ 30
3 Event dropout rates of 15- through 24-year-olds who dropped out of grades 10–12, by sex and race/ethnicity: October 1972 through October 2012 ..................................... 32
4 Event dropout rates of 15- through 24-year-olds who dropped out of grades 10–12, by family income: October 1972 through October 2012 ................................................. 34
5 Event dropout rates for public school students in grades 9–12, by state: School years 1995–96 through 2011–12...................................................................................... 36
6 Status dropout rates and number and distribution of dropouts of 16- through 24-year-olds, by selected characteristics: October 2012.................................................. 38
7 Status dropout rates, number of status dropouts, and population of 16- through 24-year-olds: October 1972 through October 2012 ......................................................... 40
8 Status dropout rates of 16- through 24-year-olds, by sex and race/ethnicity: October 1972 through October 2012 ............................................................................................. 42
9 Number of status dropouts and status dropout rates of 16- through 24-year-olds in the institutionalized group quarters and the noninstitutionalized group quarters and household population, by school and student characteristics: American Community Survey (ACS) 2012…………….……………………………………………………….. 44
10 Status completion rates, and number and distribution of completers ages 18–24 not currently enrolled in high school or below, by selected characteristics: October 2012.................................................................................................................................. 46
11 Status completion rates, number of completers, and population of 18- through 24-year-olds not currently enrolled in high school or below: October 1972 through October 2012 ...................................................................................................... 48
12 Status completion rates of 18- through 24-year-olds not currently enrolled in high school or below, by sex and race/ethnicity: October 1972 through October 2012.......... 50

List of Tables
vii
Table Page
13 Adjusted cohort graduation rates of public high school students and change in rates, by state: School years 2010–11 through 2011–12............................................................ 52
Appendix A
A-1 Summary table of high school dropout, completion, and graduation rates .................. A-1
A-2 Percentage distribution of the U.S. population who passed the General Educational Development (GED) exam outside of federal and state contract facilities, by age group: 1998–2012 .......................................................................................................... A-18
A-3 Percentage distribution of the U.S. population who passed the General Educational Development (GED) exam in federal or state contract facilities, by age group: 1998–2012...................................................................................................................... A-19
A-4 Averaged freshman graduation rates of public high school students and change in rates, by state: School years 2002–03 through 2011–12.................................................. A-20
Appendix C
C-1 Standard errors for table 1: Event dropout rates and number and distribution of 15- through 24-year-olds who dropped out of grades 10–12, by selected characteristics: October 2012......................................................................................... C-2
C-2 Standard errors for table 2: Event dropout rates of 15- through 24-year-olds who dropped out of grades 10–12, and number of dropouts and population of 15- through 24-year-olds who were enrolled: October 1972 through October 2012........... C-4
C-3 Standard errors for table 3: Event dropout rates of 15- through 24-year-olds who dropped out of grades 10–12, by sex and race/ethnicity: October 1972 through October 2012................................................................................................................. C-6
C-4 Standard errors for table 4: Event dropout rates of 15- through 24-year-olds who dropped out of grades 10–12, by family income: October 1972 through October 2012................................................................................................................................ C-8
C-5 Standard errors for table 6: Status dropout rates and number and distribution of dropouts of 16- through 24-year-olds, by selected characteristics: October 2012 ....... C-10
C-6 Standard errors for table 7: Status dropout rates, number of status dropouts, and population of 16- through 24-year-olds: October 1972 through October 2012 ............ C-12

List of Tables
viii
Table Page
Appendix C
C-7 Standard errors for table 8: Status dropout rates of 16- through 24-year-olds, by sex and race/ethnicity: October 1972 through October 2012 ....................................... C-14
C-8 Standard errors for table 9: Number of status dropouts and status dropout rates of 16- through 24-year olds in the institutionalized group quarters and the noninstitutionalized group quarters and household population, by school and student characteristics: American Community Survey (ACS) 2012…………………. C-16
C-9 Standard errors for table 10: Status completion rates, and number and distribution of completers ages 18–24 not currently enrolled in high school or below, by selected characteristics: October 2012……...……………………………………….. C-18
C-10 Standard errors for table 11: Status completion rates, number of completers, and population of 18- through 24-year-olds not currently enrolled in high school or below: October 1972 through October 2012 ................................................................ C-20
C-11 Standard errors for table 12: Status completion rates of 18- through 24-year-olds not currently enrolled in high school or below, by sex and race/ethnicity: October 1972 through October 2012 .......................................................................................... C-22
C-12 Standard errors for figure 3: Status dropout rates of 16- through 24-year-olds, by race/ethnicity and sex: October 2012............................................................................ C-24
C-13 Standard errors for figure 5: Status completion rates of 18- through 24-year-olds not currently enrolled in high school or below, by race/ethnicity and sex: October 2012............................................................................................................................... C-24

ix
List of Figures
Figure Page
1 Event dropout rates of 15- through 24-year-olds who dropped out of grades 10–12, by family income: October 1972 through October 2012 .................................................... 20
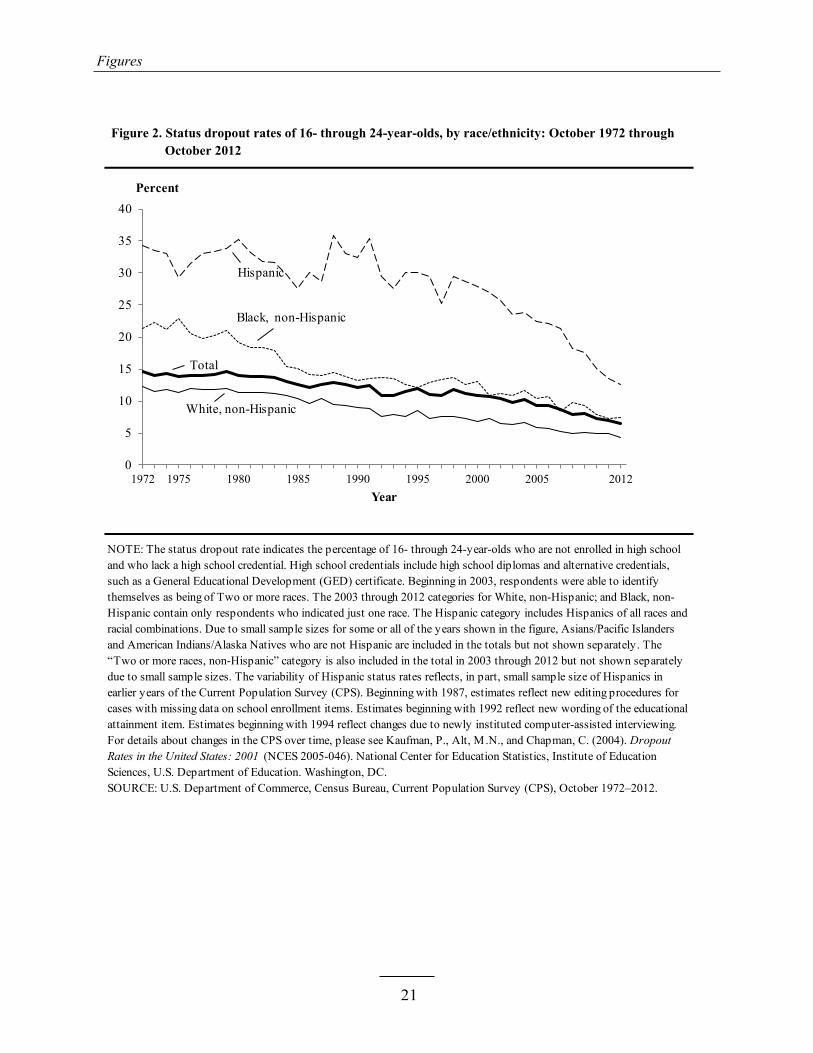
2 Status dropout rates of 16- through 24-year-olds, by race/ethnicity: October 1972 through October 2012 ......................................................................................................... 21
3 Status dropout rates of 16- through 24-year-olds, by race/ethnicity and sex: October 2012 ........................................................................................................................ 22
4 Status completion rates of 18- through 24-year-olds not currently enrolled in high school or below, by race/ethnicity: October 1972 through October 2012 ............................ 23
5 Status completion rates of 18- through 24-year-olds not currently enrolled in high school or below, by race/ethnicity and sex: October 2012 ................................................... 24
6 Adjusted cohort graduation rates of public high school students, by state: School year 2011–12 ............................................................................................................ 25

THIS PAGE INTENTIONALLY LEFT BLANK

1
Introduction
Dropping out of high school is related to a number of negative outcomes. For example, the median income of persons ages 18 through 67 who had not completed high school was roughly $25,000 in 2012.1 By comparison, the median income of persons ages 18 through 67 who completed their education with at least a high school credential, including a General Educational Development (GED) certificate, was approximately $46,000. Over a person’s lifetime, this translates into a loss of approximately $670,000 in income for a person who did not complete high school compared to a person with at least a high school credential (Rouse 2007).2 Among adults age 25 and older, a lower percentage of dropouts are in the labor force than are adults who earned a high school credential. Similarly, among adults in the labor force, a higher percentage of dropouts are unemployed than are adults who earned a high school credential (U.S. Department of Labor 2013). In addition, dropouts age 25 and older reported being in worse health than adults who are not dropouts, regardless of income (Pleis, Ward, and Lucas 2010). Dropouts also make up disproportionately higher percentages of the nation’s institutionalized population.3 In a comparison of those who drop out of high school and those who complete high school, the average high school dropout costs the economy approximately $250,000 over his or her lifetime in terms of lower tax contributions, higher reliance on Medicaid and Medicare, higher rates of criminal activity, and higher reliance on welfare (Levin and Belfield 2007).4
This report builds upon a series of National Center for Education Statistics (NCES) reports on high school dropout and completion rates that began in 1988. It presents estimates of rates in 2012, provides data about trends in dropout and completion rates over the last four decades (1972–2012),5 and examines the characteristics of high school dropouts and high school completers in 2012. Four rates are presented to provide a broad picture of high school dropouts and completers in the United States, including the event dropout rate, the status dropout rate, the status completion rate, and the adjusted cohort graduation rate. Each rate contributes unique information. Information about individuals who pass the GED exam is provided to place the different rates into context relative to this widely used alternative high school credential. The appendices also include information on the averaged freshman graduation rate. In addition, Appendix Table A-4 presents Averaged Freshman Graduation Rate (AFGR) data. The AFGR is
1 U.S. Department of Commerce, Census Bureau, Current Population Survey (CPS), March 2013. However, these are not all high school dropouts: 1.0 percent of persons ages 18 through 67 were enrolled in high school in 2012 (U.S. Department of Commerce, Census Bureau, Current Population Survey, October 2012). 2 Rouse estimates a lifetime loss of $550,000 using 2004 March CPS data. The estimate here is adjusted for inflation between March 2004 and March 2012 using March-to-March consumer price index adjustments. 3 See discussion later in this report. 4 Levin and Belfield estimate costs at $209,000 as of 2004. The estimate here is adjusted for inflation between March 2004 and March 2012 using March 2004 and March 2012 consumer price index adjustments. 5 Trend analyses show a pattern of decline in event dropout rates prior to 1990, a brief upward trend from 1990 through 1995, and then another decline through 2012. As a result, in this report, overall trends from 1972 to 2012 are reported, as well as separate trends from 1972 through 1990, 1990 through 1995, and 1995 through 2012, to increase the understanding of patterns over time in these rates.

Introduction
2
a proxy indicator for cohort rates such as the Adjusted Cohort Graduation Rate (ACGR). The AFGR uses aggregated counts of students by grade and the overall diploma count, as opposed to individual student-level data, to estimate an on-time graduation rate. While the AFGR is not as accurate as the ACGR, it can be estimated annually as far back as the 1960s.
• The event dropout rate estimates the percentage of high school students who left highschool between the beginning of one school year and the beginning of the next withoutearning a high school diploma or an alternative credential (e.g., a GED). This report presentsa national event dropout rate for students attending public or private schools using theCurrent Population Survey (CPS) and state event dropout rates for public high schoolstudents using the Common Core of Data (CCD). Event dropout rates can be used to trackannual changes in the dropout behavior of students in the U.S. school system.
• The status dropout rate reports the percentage of individuals in a given age range who arenot in school (public or private) and have not earned a high school diploma or an alternativecredential. The rate is calculated using CPS data. Supplemental data are also presented fromthe American Community Survey (ACS), which allows analyses of those in institutionalizedgroup quarters. The status dropout rate focuses on an overall age group as opposed toindividuals in the U.S. school system, so it can be used to study general population issues.
• The status completion rate indicates the percentage of individuals in a given age range whoare not currently enrolled in high school and who have earned a high school diploma or analternative credential, irrespective of when or where the credential was earned.6 The rate iscalculated using CPS data. It focuses on an overall age group as opposed to individuals in theU.S. school system, so it can be used to study general population issues.7
• The adjusted cohort graduation rate (ACGR) indicates the proportion of public highschool freshmen who graduate with a regular diploma 4 years after starting 9th grade. Therate is calculated by state education agencies (SEAs) and submitted to the U.S. Departmentof Education through the EDFacts submission system. It focuses on public high schoolstudents as opposed to all high school students or the general population. It provides ameasure of the extent to which public high schools are graduating students within theexpected period of 4 years after initially starting 9th grade. The ACGR also accounts forstudents who transfer in from another state, immigrate to the United States and enroll inpublic school, transfer out to another state, emigrate to another country, or die.
More information about how the rates are derived and about the data that are used for these rates is provided briefly in the body of the report, with more detail provided in appendix A.
As noted in the rate descriptions, data presented in this report are drawn from the annual October CPS, the annual CCD collections, EDFacts, the annual ACS, and the annual General Educational Development Testing Service (GEDTS) statistical reports. Data in the CPS files are collected through household interviews and are representative of the civilian, noninstitutionalized population in the United States, including students attending public and private schools. The CCD
6 The status completion rate is not the inverse of the status dropout rate (i.e., status completion does not equal 100 minus the status dropout rate). The rates are based on different age ranges, and the completion rate excludes high school students from its denominator, whereas high school students are included in the denominator of the status dropout rate. 7 Seastrom et al. (2006a) refer to this rate as the “Current Population Survey High School Completion Indicator.”

Introduction
3
and EDFacts data are collected from SEAs about all public schools and school systems in the United States, and contain aggregates of administrative record data kept by these agencies that include all public school students in this country. The ACS collects data on the U.S. resident population through interviews with households and persons in group quarters facilities. The individuals in group quarters facilities surveyed in the ACS include incarcerated persons, institutionalized persons, and the active duty military who are residing in the United States. The GEDTS data are also built from administrative record data kept by the testing service, and contain information about all GED test takers (data presented in this report are restricted to individuals in the 50 states and the District of Columbia).8
As with all data collections, those used in this report are useful for calculating some types of estimates, but poorly suited for calculating other types. For example, CPS data are well suited for studying the civilian, noninstitutionalized population in the United States, including students attending public and private schools, but do not provide information about military personnel or individuals residing in institutionalized group quarters, such as prison inmates or patients in long-term medical or custodial facilities. Data from CPS cannot produce estimates below regional levels of geography for the age groups used in this report. Data from the CCD are appropriate for studying public school students in a given year, but do not provide information on private school students or young people who did not attend school in the United States. Other datasets can provide more detailed information on the processes and precise timelines associated with completing high school or dropping out.9
Though capable of generating estimates for smaller levels of geography and for individuals in a wider range of group quarter settings than CPS data, ACS data are not available for longer trend analyses and lack many demographic and income details available in CPS. GEDTS data are helpful for identifying the number of people who take and pass the GED examination in a given year, but do not contain information about schools that GED test takers attended before taking the GED test. In addition, the EDFacts adjusted cohort graduation rate (ACGR) is based on records for individual students and measures the percentage of students who graduate within 4 years of starting 9th grade.
Differences between individuals who completed high school with a regular high school diploma and those who completed high school with alternative credentials such as a GED are discussed in the report. Because the GED is the primary option available to individuals to complete high school outside of a regular high school curriculum and because of limitations with CPS and ACS data in terms of being able to effectively identify GED and other
8 Appendix A contains information about the data collections and describes in detail how the rates are computed. 9 Many states have student-level administrative record systems that follow student progress over time that can be used for this kind of analysis. NCES is supporting the development of similar systems across additional states (see http://nces.ed.gov/programs/slds/ for details) and periodically conducts national-level longitudinal studies of high school students that can be used for such analysis (e.g., the High School Longitudinal Study of 2009).

Introduction
4
alternative credential holders,10 alternative credential recipients are not included in dropout counts and are not separated from regular diploma holders in the status completion rates. Separate estimates of GED recipients are provided, however, based on GEDTS data. Published data from GEDTS do not allow age-specific estimates by any other characteristics (e.g., 18- to 24-year-olds by sex), so details provided in this report are limited to age range information.
All changes or differences noted in this report were tested using Student’s t statistic and are statistically significant at the p ≤ .05 level. Two-tailed t-tests are used throughout. Analyses did not include adjustments for multiple comparisons. When significance tests fail to meet the p ≤ .05 criterion and the comparison is of substantive interest, terminology such as “no measurable difference was found” is used in this report. Regression analysis was used to test for trends across age groups and over time. Standard error tables are available in appendix C.
10 GED recipients are combined in the CPS and ACS data with other alternative credential holders, and the estimates of all alternative credential holders from the CPS and ACS tend to be lower than GEDTS-estimated counts of GED recipients alone.

5
Findings
National Event Dropout Rates
The national event dropout rate presented here is based on data from the CPS and is an estimate of the percentage of both private and public high school students who left high school between the beginning of one school year and the beginning of the next without earning a high school diploma or an alternative credential, such as a GED. Specifically, the rate describes the percentage of youth ages 15 through 24 in the United States who dropped out of grades 10–12 from either public or private schools in the 12 months between one October and the next (e.g., October 2011 to October 2012).11 The measure provides information about the rate at which U.S. high school students are leaving school without receiving a high school credential. As such, it can be used to study student experiences in the U.S. secondary school system in a given year. It is not well suited for studying how many people in the country lack a high school credential irrespective of whether they attended U.S. high schools, nor does it provide a picture of the dropout problem more generally because it only measures how many students dropped out in a single year, and students may reenter the school system after that time. More detail about the definition and computation of the event dropout rate and other rates along with a summary table of how rates in this report relate to each other can be found in appendix A.
• Event dropout rates: On average, 3.4 percent of students who were enrolled in public orprivate high schools in October 2011 left school before October 2012 without completing ahigh school program (table 1). No measurable change was detected in the event dropout ratebetween 2011 and 2012 (3.4 percent in 2011); however, since 1972, event dropout rates havetrended downward, from 6.1 percent in 1972 to 3.4 percent in 2012 (figure 1 and table 2).12
The rate declined through the 1970s and 1980s reaching 4.0 percent in 1990. Between 1990and 1995, the rate increased to 5.7 percent. The rate then declined again, reaching 3.4percent in 2009, and has remained around this rate through 2012. These fluctuations between1990 and 2012 resulted in no measurable difference between the 1990 and 2012 eventdropout rates.
• Event dropout rates by sex: There was no measurable difference in the 2012 event dropoutrates for males and females, a pattern generally found since 1972 (table 3). Exceptions to thispattern occurred in 4 years—1974, 1976, 1978, and 2000—when males had measurablyhigher event dropout rates than females.
11 Data on 9th-grade dropouts are not available in the Current Population Survey (see appendix A for more information). The state event dropout rates for public high school students presented later in this report are based on the Common Core of Data, which includes 9th-graders. 12 Trend analyses were conducted using regressions. See appendix A for more details.

Findings
6
• Event dropout rates by race/ethnicity:13 Black and Hispanic students had higher event dropout rates than White students in 2012 (6.8 percent vs. 5.4 percent vs. 1.6 percent) (table 1). The general downward trend in event dropout rates over the 4-decade period from 1972 through 2012 observed in the overall population was also found among White, Black, and Hispanic students (table 3).14 However, the decreases happened at different times over this 40-year period for these racial/ethnic groups. The pattern found among White students mirrored that in the overall population: a decrease in event rates from 1972 through 1990, an increase from 1990 through 1995, and another decrease from 1995 through 2012. Black students also experienced a decline from 1972 through 1990 and an increase from 1990 through 1995, but their event dropout rates fluctuated and no measurable trend was found between 1995 and 2012. Hispanic students, on the other hand, experienced no measurable change in their event dropout rates from 1972 through 1990 or from 1990 through 1995, but did experience a decline from 1995 through 2012.
• Event dropout rates by family income: In 2012, the event dropout rate of students living in low-income families was greater than the rate of their peers from high-income families (5.9 percent vs. 1.3 percent) (table 1).15 Students from low-, middle-, and high-income families experienced an overall decline in event dropout rates during the nearly 4-decade period of the mid-1970s through 2012 (figure 1 and table 4). Comparable income data are not available for 1974, so trend analyses were conducted from 1975 onward. All three groups of students experienced declines in event dropout rates from 1975 through 1990. Rates for those from low-income families fell from 15.7 percent to 9.5 percent. Rates for students from middle-income families fell from 6.0 percent to 4.3 percent, and rates for those from high-income families fell from 2.6 percent to 1.1 percent. From 1990 to 1995, event dropout rates for students from low-, middle-, and high-income families trended upward. Between 1995 and 2012, the event rates for students from low-, middle-, and high-income families trended downward.
• Event dropout rates by age: Students who pursued a high school education past the typical high school age were at higher risk than others of becoming an event dropout (table 1). The 2012 event dropout rates for students in the typical age range for fall high school enrollment (ages 15 through 17) were lower than those for older students (ages 20 through 24). Specifically, 2.2 percent of 15- through 16-year-olds and 1.9 percent of 17-year-olds
13 All of the 2012 tables report data for the following four racial/ethnic categories: White, non-Hispanic; Black, non-Hispanic; Asian/Pacific Islander, non-Hispanic; and Hispanic. The first three categories consist of individuals who identified as only one race and who did not identify as Hispanic. The fourth category consists of Hispanics of all races and racial combinations. For 2012 status dropout and status completion rates (tables 6, 9, and 10, respectively), results for two additional racial/ethnic groups are presented: American Indian/Alaska Natives and persons of Two or more races are included in the total, but not shown separately for 2012 event dropout rates and for event dropout, status dropout, and status completion results for prior years. For simplicity, the terms “White,” “Black,” “Asian/Pacific Islander,” “American Indian/Alaska Natives,” and “Two or more races” are used in the text of this report without the “non-Hispanic” label. 14 The trend analyses conducted to examine this four-decade period are based on annual rate estimates for each year from 1972 through 2012. Separate trend analyses were also conducted for each racial/ethnic group separately for trends across the three shorter time periods indicated in the bullet: 1972–1990, 1990–1995, and 1995–2012. Because of small sample sizes for many of the earlier years, reliable trend analyses could not be conducted for Asian Pacific Islanders, American Indians/Alaska Natives, and persons of Two or more races. 15 “Low income” is defined here as the lowest 20 percent of all family incomes, while “high income” refers to the top 20 percent of all family incomes. In 2012, low-income families included those with $18,400 or less in family income, while high-income families included those with $90,824 or more in family income. For respondents missing data for family income (20.4 percent of the weighted sample in table 1), cold-deck procedures were used to impute data.

Findings
7
dropped out in the 1-year reference period, compared to 14.9 percent of 20- through 24-year-olds.
• Event dropout rates by disability status: In 2012 students with disabilities had higher event dropout rates compared to students without disabilities (10.0 percent vs. 3.2 percent) (table 1).16
• Event dropout rates by geographic region: There were no measurable differences found in the event dropout rates for high school students across regions for 2012 (table 1).
State Event Dropout Rates for Public High School Students
State-level event dropout rates for public high school students are calculated using data from 1993 through 2012 from the CCD. The 2012 rate reported in this publication reflects the percentage of public school students who were enrolled in grades 9–12 at some point during the 2011–12 school year, but were not enrolled in school in October 2012 and had not earned a high school diploma or completed a state- or district-approved education program.17 Rates for prior years were calculated in a similar manner.18 State event dropout rates are useful for evaluating the performance of public high school systems in reporting states. They do not include information about individuals outside the public school system. Rates are presented for the District of Columbia and the 50 states for the 2011–12 school year (table 5).
• State event dropout rates for 9th- through 12th-grade public high school students: The 2011–12 CCD event dropout rates ranged from 1.3 percent in New Hampshire to 7.0 percent in Alaska (table 5). In all, event dropout rates for public high school students in grades 9–12 were lower than 2.0 percent in eight states: New Hampshire, 1.3 percent; Alabama, 1.4 percent; New Jersey, 1.4 percent; Utah, 1.5 percent; Idaho, 1.9 percent; Minnesota, 1.9 percent; Virginia, 1.9 percent; Wisconsin, 1.9 percent. Three states had event dropout rates of 6.0 percent or more: New Mexico, 6.4 percent; Michigan, 6.9 percent; Alaska, 7.0 percent.
• Combining data from the 50 states and the District of Columbia, approximately 3.3 percent of public high school students dropped out of grades 9–12 during the 2011–12 school year.
16 Individuals identified in this report as having a disability were reported to have difficulty with at least one of the following: hearing, seeing even when wearing glasses, walking or climbing stairs, dressing or bathing, doing errands alone, concentrating, remembering, or making decisions. 17 State and local policies can affect the numbers of graduates reported in the CCD. For example, some states have in-school General Education Development (GED) programs that require fewer credit hours than a regular high school track, but lead to the award of regular diplomas. 18 Some states report using an alternative 1-year period from one July to the next. Rates for those states are presented because event dropout rates based on the July-July calendar are comparable to those calculated using an October-to-October calendar (Winglee et al. 2000).

Findings
8
National Status Dropout Rates
The status dropout rate measures the percentage of individuals who are not enrolled in high school and who do not have a high school credential. The status dropout rate is higher than the event rate in a given year because the status dropout rate includes all dropouts in a particular age range, regardless of when or where they last attended school, including individuals who may have never attended school in the United States. Based on the 16- through 24-year-old age range, the measure provides an indicator of the percentage of young people who lack a high school credential. While useful for measuring overall educational attainment among young adults in the United States, the status dropout rate is not useful as an indicator of the performance of schools because it includes those who never attended school in the United States. Using data from the CPS, the status dropout rates in this report show the percentage of young people ages 16 through 24 who are out of school and who have not earned a high school diploma or alternative credential, such as a GED.
• Status dropout rates: In October 2012, approximately 2.6 million 16- through 24-year-olds were not enrolled in high school and had not earned a high school diploma or alternative credential (table 6). These status dropouts accounted for 6.6 percent of the 39 million noninstitutionalized, civilian 16- through 24-year-olds living in the United States. Among all individuals in this age group, status dropout rates trended downward between 1972 and 2012, declining from 14.6 percent to 6.6 percent (figure 2 and table 7). The status dropout rate trended downward between 1972 and 1990, fluctuated between 1990 and 1995, and then trended downward again between 1995 and 2012.
• Status dropout rates by sex: Males ages 16–24 had a higher status dropout rate than females in 2012 (7.3 vs. 5.9 percent) (table 6).
• Status dropout rates by race/ethnicity: The 2012 status dropout rates for Asian/Pacific Islander (3.3 percent) and White (4.3 percent) 16- to 24-year olds were lower than those for Black (7.5 percent), Hispanic (12.7 percent), and American Indian/Alaska Native (14.6 percent) 16- to 24-year-olds.
The status dropout rate for Black (7.5 percent) 16- to 24-year olds was lower than the rate for Hispanics (12.7 percent) and for American Indians/Alaska Natives (14.6 percent) (table 6). The status dropout rate for persons of Two or more races (5.5 percent) was lower than the rate for Hispanics (12.7 percent), but not measurably different from the rates for White, Black, Asian/Pacific Islander, or American Indian/Alaska Native 16- to 24-year olds.
In the past two decades since 1990, the White-Black gap in status dropout rates has narrowed (figure 2 and table 8).
The percentage of Hispanics ages 16–24 who were dropouts was consistently higher than that of Black and White 16- to 24-year-olds throughout the 40-year period of 1972–2012 (figure 2 and table 8). White and Black status dropout rates fell from 1972 to 2012, from 12.3 to 4.3 percent and from 21.3 to 7.5 percent, respectively. Between 1972 and 1990, Hispanic status dropout rates showed no clear trend, but since 1990 they have demonstrated a downward trend, falling from 32.4 percent in 1990 to 12.7 percent in 2012.

Findings
9
In 2012, some 24.7 percent of Hispanic 16- through 24-year-olds born outside the United States were status high school dropouts (table 6). Hispanics born in the United States had lower status dropout rates than immigrant Hispanics (8.8 percent and 8.6 percent for “first generation” and “second generation or higher,” respectively).19 In each “recency of immigration” category in table 6, Hispanic youth had higher status dropout rates than non- Hispanic youth.
• (Status dropout rates by age: Persons ages 16 and 17 had lower status dropout rates in 2012 2.2 percent and 3.5 percent, respectively) than 18, 19, and 20- through 24-year-olds (5.5
percent, 8.8 percent, and 7.8 percent, respectively), at least in part because most 16- and 17-year-olds were still actively pursuing a high school diploma (table 6).20
• Status dropout rates by disability status: Sixteen- through 24-year-olds with disabilities had a status dropout in 2012 that was about twice as large as the rate for their peers without disabilities (14.4 vs. 6.3 percent) (table 6).
Estimates in the preceding discussion of status dropout rates focused on the civilian, noninstitutionalized population. Data from the American Community Survey are available to provide comparable estimates for those in institutionalized group quarters largely composed of the incarcerated population.
• Status dropout rates by institutionalized group quarter setting: In 2012, approximately 35.4 percent of 16- to 24-year-olds in institutionalized group quarters were status dropouts (table 9). This compares to a status dropout rate of 6.6 percent among 16- to 24-year-olds in the noninstitutionalized population.21
National Status Completion Rates
The status completion rate indicates the percentage of young people who have left high school and who hold a high school credential. The rate reported here is based on CPS data and represents the percentage of 18- through 24-year-olds who are not enrolled in high school and who have earned a high school diploma or an alternative credential, including a GED certificate.22 The status completion rate includes individuals who may have completed their education outside the United States, so the rate is not suited for measuring the performance of the education system in this country. The status completion rate is not the inverse of the status dropout rate (i.e., status completion does not equal 100 minus the status dropout rate). The
19 Individuals defined as “first generation” were born in the 50 states or the District of Columbia, but one or both of their parents were born outside the 50 states or the District of Columbia. Individuals defined as “second generation or higher” were born in the 50 states or the District of Columbia, as were both of their parents. 20 In 2012, data from the CPS show that high school enrollment rates by age group were 95.4 percent for 16-year-olds, and 90.1 percent for 17-year-olds (estimates not shown in tables). 21 While the CPS and ACS status dropout rates for the overall noninstitutionalized population of 16- through 24-year-olds are both 6.6 percent, differences between the sources by demographic characteristics differ. Moreover, differences in design features of the ACS and CPS such as item wording and periodicity lead to somewhat different status dropout counts and rates from the two data sources. 22 Appendix A provides information about alternative credentials in the CPS data.

Findings
10
rates are based on different age ranges, with the status dropout rate reported for 16- through 24-year-olds and the status completion rate reported for 18- through 24-year-olds. The completion rate excludes high school students from its denominator, whereas high school students are included in the denominator of the status dropout rate.
• Status completion rates: In 2012, some 91.3 percent of 18- through 24-year-olds not enrolled in high school had received a high school diploma or alternative credential (table 10).23 Overall, status completion rates have increased since 1972 (figure 4 and table 11), but during the 1970s they exhibited no consistent trend. Since 1980, the rate has shown an upward trend, starting at 83.9 percent in 1980 and rising to 91.3 percent in 2012.
• Status completion rates by sex: Females ages 18–24 who were not enrolled in high school in 2012 had a higher status completion rate (92.3 percent) than their male counterparts (90.3 percent) (table 10).
• Status completion rates by race/ethnicity: In 2012, among 18- through 24-year-olds not currently enrolled in high school, Asian/Pacific Islander (94.9 percent) and White (94.6 percent) young adults had status completion rates greater than 90 percent. Both had rates that were higher than Black (90.0 percent), Hispanic (82.8 percent), and American Indian/Alaska Native (79.0 percent) young adults (table 9). The status completion rate for persons of Two or more races (91.9 percent) did not measurably differ from the rates for White or Asian/Pacific Islander young adults.
Status completion rates for White, Black, and Hispanic young adults exhibited no general patterns of change during the 1970s, but rates trended upward for each group between 1980 and 2012 (figure 4 and table 12).
In 2012, some 69.3 percent of Hispanic 18- to 24-year-olds born outside the United States and not currently enrolled in high school were status high school completers (table 10). In comparison, status completion rates were higher for Hispanics born in the United States (87.5 percent for “first generation” and 88.3 percent for “second generation or higher”), although in each immigrant category Hispanics had lower status completion rates than non-Hispanics. No measureable differences were detected between first generation and second generation Hispanic 18- to 24-year olds.
• Status completion rates by sex and race/ethnicity: For Hispanic 18- to 24-year-olds, status completion rates differed by sex (figure 5). In 2012, females (84.8 percent) had higher status completion rates than their male (80.8 percent) counterparts. No measurable differences by sex were detected in the status completion rates of White, Black, American Indian/Alaska Native, Asian/Pacific Islander, or Two or more races young adults.
• Status completion rate by disability status: In 2012, persons ages 18–24 with disabilities and who were not enrolled in high school had a lower status completion rate (81.5 percent) than their peers without disabilities (91.7 percent) (table 10).
• Status completion rates by geographic region: Among 18- through 24-year-olds, those in the West had lower status completion rates (90.5 percent) in 2012 than their counterparts in the Midwest (92.6 percent) (table 10).
23 Considering all 18- through 24-year-olds, irrespective of enrollment status, 85.3 percent held a high school credential in October 2012 (estimate not show in tables).

Findings
11
General Educational Development (GED) Credentials and National Status Completion Rates
GED programs allow individuals who would otherwise lack a high school credential, because they did not complete a regular high school program of study, to obtain an alternative credential. Not completing a regular high school program can occur for several reasons, including dropping out of high school and immigrating into the country without ever enrolling in U.S. high schools. The GED is accepted by most colleges and universities that require a high school diploma for admission, and most companies that have positions requiring a high school diploma accept the GED as an alternative credential (American Council on Education 2009).
While GEDs provide an important opportunity for those who do not earn a regular high school diploma to obtain a high school credential, GED recipients tend to fare significantly worse than those holding regular diplomas across a range of measures. For example, while GED recipients who go on to postsecondary education experience the same economic benefits as regular high school diploma earners who access postsecondary education, GED recipients attend postsecondary programs at much lower rates than regular high school diploma earners (American Council on Education 2010).
Once in postsecondary education programs, completion rates are much lower for GED recipients than for those holding regular high school diplomas. Also, while high school dropouts with relatively low cognitive skills experience improved incomes if they earn a GED, dropouts with relatively high cognitive skills do not experience increased earnings after earning a GED (see Boesel, Alsalam, and Smith [1998] and Tyler [2003] for overviews of GED research).
To better understand how the number and rate of young people passing the GED exam relate to different estimates presented in this report, data from the GED Testing Service are used to estimate the number of GED holders in the civilian, noninstitutionalized population in 2012.24 Estimates of those passing the exams provide an approximation of those being awarded GEDs. It is possible to pass the tests and not meet additional criteria required to obtain the credential in some states. Data on GED credential issuance are not consistently available across the United States. Estimates are provided for 18- through 24-year-olds to correspond to the age range used for the status completion rates.25
24 To determine how many people in a given age range passed the GED exam requires summation of reported data over multiple years of GEDTS reports. For example, the number of 18- through 24-years-olds in 2012 who passed the GED exam was estimated by taking the sum of those who passed the exam in 2012 at ages 18-24 plus those who passed the exam in 2011 at ages 17 through 23 plus those who passed the exam in 2010 at ages 16-22, and so on. See appendix A of this report for details of this calculation. 25 Civilians in the noninstitutionalized population are the focus of the status dropout and completion rates. To align the GED estimates with this population, data from the Survey of Inmates in State and Federal Correctional Facilities, 2004 (U.S. Department of Justice 2004) prorated to 2012 and data provided by the Defense Manpower Data Center for active-duty military personnel in 2012 were used. See appendix A of this report for details of how the GED estimates were aligned with the noninstitutionalized population.

Findings
12
• National estimates of 18- through 24-year-olds with a GED in 2012: There were approximately 1,620,000 persons ages 18 through 24 in 2012 who had passed the GED exam in 2012 or in prior years (data not shown in tables). This represents 5.3 percent of the civilian, noninstitutionalized population of 18- through 24-year-olds who were not in high school in 2012.
• Status completion rates for 18- through 24-year-olds and the GED in 2012: Among 18- through 24-year-olds who were high school completers in 2012, approximately 6.0 percent had passed the GED exam. Subtracting out those who passed the GED exam, the status completion rate in 2012 for regular high school diploma holders and those holding alternative credentials other than a GED was 85.3 percent (data not shown in tables).26
Focusing on the 18- through 24-year-old population without consideration of high school enrollment, approximately 84.7 percent held some form of high school credential in 2012, with 5.3 percent holding a GED and 79.4 percent holding a regular high school diploma or other alternative credential (data not shown in tables).27
Adjusted Cohort Graduation Rates for Public School Students
The adjusted cohort graduation rate (ACGR) provides information about the percentage of public high school students who graduate on time—that is, 4 years after starting 9th grade for the first time—with a regular diploma. Regular diploma earners are individuals who are awarded a regular high school diploma or a diploma that recognizes some higher level of academic achievement. They can be considered as students who meet or exceed the coursework and performance standards for high school graduation established by a state or other relevant authority. Other high school completers who were awarded alternate credentials such as a certificate of completion or GED are not included in the ACGR calculations because they are not considered regular graduates.
The rate follows the progress of a cohort of first-time 9th graders over the 4 school years between the time they start high school through the school year in which they are scheduled to graduate assuming a standard 4-year high school experience. The denominator of the rate is the number of 9th graders in the cohort, adjusted for students moving into and out of the school or jurisdiction to attend a high school elsewhere. The numerator is the number of students in the adjusted cohort who hold a regular or advanced high school diploma 4 years after starting 9th
26 The CPS data used for the status completion rate include those holding alternative credentials (such as a GED) in the count of completers. Other alternative credentials exist, so removing the GED count from the count of completers does not result in a count of regular high school diploma holders. For discussion of alternative credentials offered by public school systems, please see Thurlow, Vang, and Cormier (2010). 27 Similar estimates could be made in reference to the 16- through 24-year-old population, which is the focus of the status dropout rate. There were approximately 1,559,000 persons ages 16 through 24 in 2012 who had passed the GED exam in 2012 or prior years (data not shown in tables). This represents 4.1 percent of the civilian, noninstitutionalized population of 16- through 24-year-olds in 2012.

Findings
13
grade for the first time.28
• National adjusted cohort graduation rate for public school students: For SY 2010–11, the estimated national 4-year ACGR for public high school students was 79 percent, and for SY 2011–12 it was 80 percent. This indicates that nearly 4 out of 5 students receive a regular high school diploma within 4 years of starting 9th grade for the first time (table 13).29
• State adjusted cohort graduation rates for public school students: For the class of 2011–12, the ACGR ranged from 59 percent in the District of Columbia to 89 percent in Iowa (figure 6 and table 13). Fifteen states had rates of 85 percent or higher: Connecticut, 85 percent; Kansas, 85 percent; Maine, 85 percent; Massachusetts, 85 percent; Indiana, 86 percent; Missouri, 86 percent; New Hampshire, 86 percent; New Jersey, 86 percent; North Dakota, 87 percent; Tennessee, 87 percent; Nebraska, 88 percent; Texas, 88 percent; Vermont, 88 percent; Wisconsin, 88 percent; Iowa, 89 percent. Only two states and the District of Columbia had rates below 70 percent: The District of Columbia, 59 percent; Nevada, 63 percent; Oregon, 68 percent. Finally, three states did not report ACGR data for 2011–12: Idaho, Oklahoma, and Kentucky. These states have approved timeline extension requests to delay reporting of the ACGR.
28 The disclosure mitigation methods applied to the 2011–12 ACGR and AFGR data require that rates be rounded to whole numbers. 29 The United States 4-year ACGR was estimated using both the reported 4-year ACGR data from 47 states and the District of Columbia and using imputed data for Idaho, Kentucky, and Oklahoma. The Bureau of Indian Education and Puerto Rico were not included in the United States 4-year ACGR estimate.

14
References
Adams, P., Kirzinger, W., and Martinez, M. (2013). Vital and Health Statistics: Summary Health Statistics for the U.S. Population: National Health Interview Survey, 2011. Series 10: No. 255. Hyattsville, MD: U.S. Department of Health and Human Services, Centers for Disease Control and Prevention, National Center for Health Statistics.
American Council on Education, GED Testing Service. (1991–2002). Who Took the GED? GED Annual Statistical Report. Washington, DC: Author.
American Council on Education, GED Testing Service. (2003–06). Who Passed the GED Tests? Annual Statistical Report. Washington, DC: Author.
American Council on Education, GED Testing Service. (2007). 2006 GED Testing Program Statistical Report. Washington, DC: Author.
American Council on Education, GED Testing Service. (2008). 2007 GED Testing Program Statistical Report. Washington, DC: Author.
American Council on Education, GED Testing Service. (2009). 2008 GED Testing Program Statistical Report. Washington, DC: Author.
American Council on Education, GED Testing Service. (2010). 2009 GED Testing Program Statistical Report. Washington, DC: Author.
American Council on Education, GED Testing Service. (2010). From GED Credential to College: Patterns of Participation in Postsecondary Education Programs. Washington, DC: Author.
American Council on Education, GED Testing Service. (2011). 2010 GED Testing Program Statistical Report. Washington, DC: Author.
American Council on Education, GED Testing Service. (2012). 2011 Annual Statistical Report on the GED Test. Washington, DC: Author.
American Council on Education, GED Testing Service. (2013). 2012 Annual Statistical Report on the GED Test. Washington, DC: Author.
Boesel, D., Alsalam, N., and Smith, T.M. (1998). Educational and Labor Market Performance of GED Recipients. Washington, DC: U.S. Department of Education.

References
15
Cahoon, L. (2005). Source and Accuracy Statement for the October 2004 CPS Microdata File on School Enrollment. Washington, DC: U.S. Department of Commerce, Census Bureau.
Elementary and Secondary Education Act, as amended by the No Child Left Behind Act of 2001, P.L. 107–110, 115 Stat. 1425 (2002).
Gujarati, D. (1998). Basic Econometrics (2nd ed.). New York: McGraw Hill.
Kaufman, P., Alt, M.N., and Chapman, C. (2004). Dropout Rates in the United States: 2001 (NCES 2005-046). National Center for Education Statistics, Institute of Education Sciences, U.S. Department of Education. Washington, DC.
Laird, J., DeBell, M., Kienzl, G., and Chapman, C. (2007). Dropout Rates in the United States: 2005 (NCES 2007-059). National Center for Education Statistics, Institute of Education Sciences, U.S. Department of Education. Washington, DC.
Levin, H.M., and Belfield, C.R. (2007). Educational Interventions to Raise High School Graduation Rates. In C.R. Belfield and H.M. Levin (Eds.), The Price We Pay: Economic and Social Consequences of Inadequate Education (pp. 177–199). Washington, DC: Brookings Institution Press.
Mishel, L., and Roy, J. (2006). Rethinking High School Graduation Rates and Trends. Washington, DC: Economic Policy Institute.
National Institute of Statistical Sciences and Education Statistics Services Institute. (2004). National Institute of Statistical Sciences/Education Statistics Services Institute Task Force on Graduation, Completion, and Dropout Indicators (NCES 2005-105). U.S. Department of Education. Washington, DC: National Center for Education Statistics.
Rouse, C.E. (2007). Quantifying the Costs of Inadequate Education: Consequences of the Labor Market. In C.R. Belfield and H.M. Levin (Eds.), The Price We Pay: Economic and Social Consequences of Inadequate Education (pp. 99–124). Washington, DC: Brookings Institution Press.
Pleis, J.R., Ward, B.W., and Lucas, J.W. (2010). Vital and Health Statistics: Summary Health Statistics for U.S. Adults: National Health Interview Survey, 2009. Series 10: No. 249. Hyattsville, MD: U.S. Department of Health and Human Services, Centers for Disease Control and Prevention, National Center for Health Statistics.
Sable, J., and Naum, J. (2004a). Documentation to the NCES Common Core of Data Local Education Agency Universe Survey Dropout and Completion Data File: School Year

References
16
1997–98 (NCES 2001-302R). National Center for Education Statistics, Institute of Education Sciences, U.S. Department of Education. Washington, DC.
Sable, J., and Naum, J. (2004b). Documentation to the NCES Common Core of Data Local Education Agency Universe Survey Dropout and Completion Data File: School Year 1998–99 (NCES 2002-310R). National Center for Education Statistics, Institute of Education Sciences, U.S. Department of Education. Washington, DC.
Sable, J., and Naum, J. (2004c). Documentation to the NCES Common Core of Data Local Education Agency Universe Survey Dropout and Completion Data File: School Year 1999–2000 (NCES 2002-384R). National Center for Education Statistics, Institute of Education Sciences, U.S. Department of Education. Washington, DC.
Sable, J., and Naum, J. (2004d). Documentation to the NCES Common Core of Data Local Education Agency Universe Survey Dropout and Completion Data File: School Year 2000–01 (NCES 2002-315R). National Center for Education Statistics, Institute of Education Sciences, U.S. Department of Education. Washington, DC.
Sable, J., Naum, J., and Thomas, J.M. (2004). Documentation to the NCES Common Core of Data Local Education Agency Universe Survey Dropout and Completion Data File: School Year 2001–02 (NCES 2005-349). National Center for Education Statistics, Institute of Education Sciences, U.S. Department of Education. Washington, DC.
Seastrom, M., Chapman, C., Stillwell, R., McGrath, D., Peltola, P., Dinkes, R., and Xu, Z. (2006a). User’s Guide to Computing High School Graduation Rates, Volume 1: Review of Current and Proposed Graduation Indicators (NCES 2006-604). National Center for Education Statistics, Institute of Education Sciences, U.S. Department of Education. Washington, DC.
Seastrom, M., Chapman, C., Stillwell, R., McGrath, D., Peltola, P., Dinkes, R., and Xu, Z. (2006b). User’s Guide to Computing High School Graduation Rates, Volume 2: Technical Evaluation of Proxy Graduation Indicators (NCES 2006-605). National Center for Education Statistics, Institute of Education Sciences, U.S. Department of Education. Washington, DC.

References
17
Seastrom, M., Hoffman, L., Chapman, C., and Stillwell, R. (2005). The Averaged Freshman Graduation Rate for Public High Schools From the Common Core of Data: School Years 2001–02 and 2002–03 (NCES 2006-601). National Center for Education Statistics, Institute of Education Sciences, U.S. Department of Education. Washington, DC.
Stillwell, R., and Sable, J., (2013). Public School Graduates and Dropouts From the Common Core of Data: School Year 2009–10. First Look (NCES 2013-309rev). National Center for Education Statistics, Institute of Education Sciences, U.S. Department of Education. Washington, DC.
Stillwell, R., Sable, J., and Plotts, C. (2011). Public School Graduates and Dropouts From the Common Core of Data: School Year 2008–09. First Look (NCES 2011-312). National Center for Education Statistics, Institute of Education Sciences, U.S. Department of Education. Washington, DC.
Stetser, M.C., and Stillwell, R. (2014). Public High School Four-Year On-Time Graduation Rates and Event Dropout Rates: School Years 2010–11 and 2011–12. First Look (NCES 2014-391). National Center for Education Statistics, Institute of Education Sciences, U.S. Department of Education. Washington, DC.
Thurlow, M., Vang, M., and Cormier, D. (2010). Earning a High School Diploma Through Alternative Routes (Synthesis Report 76). Minneapolis, MN: University of Minnesota, National Center on Educational Outcomes.
Tyler, J. (2003). Economic Benefits of the GED: Lessons From Recent Research. Review of Educational Research, 73(3): 369–403.
U.S. Department of Commerce, Census Bureau. (n.d.). American Community Survey – Puerto Rico Community Survey: 2009 Code List. Washington, DC. Retrieved June 21, 2011, from http://www.census.gov/acs/www/Downloads/data_documentation/CodeLists/2009_ACS_Code_Lists.pdf.
U.S. Department of Commerce, Census Bureau. (2013). Current Population Survey, October 2012: School Enrollment and Internet Use Supplement File (Technical Documentation CPS-12). Washington, DC: Author.
U.S. Department of Commerce, Census Bureau, Current Population Survey (CPS), October 1972–2012.

References
18
U.S. Department of Commerce, Census Bureau, Current Population Survey (CPS), March 2013.
U.S. Department of Education, National Center for Education Statistics. (n.d.) Documentation to the NCES Common Core of Data Local Education Agency Universe Dropout and Completion Data File: School Years 1991–92 through 1996–97. Washington, DC. Retrieved August 6, 2007, from http://www.nces.ed.gov/ccd/drp7yrag.asp.
U.S. Department of Justice, Bureau of Justice Statistics. (2004). Survey of Inmates in State and Federal Correctional Facilities, 2004. Unpublished estimates (ICPSR04572-v1). Ann Arbor, MI: Inter-University Consortium for Political and Social Research.
U.S. Department of Justice, Bureau of Justice Statistics. (2013). Prison Inmates at Midyear – 2012 (NCJ-241264). Washington, DC. Retrieved December 19, 2013, from http://www.bjs.gov/content/pub/pdf/jim12st.pdf.
U.S. Department of Labor, Bureau of Labor Statistics. (2013). Tabulations retrieved November 22, 2013, from http://www.bls.gov/cps/cpsaat07.htm.
Winglee, M., Marker, D., Henderson, A., Aronstamm Young, B., and Hoffman, L. (2000). A Recommended Approach to Providing High School Dropout and Completion Rates at the State Level (NCES 2000-305). National Center for Education Statistics, U.S. Department of Education. Washington, DC.

19
Figures

Figures
20
Figure 1. Event dropout rates of 15- through 24-year-olds who dropped out of grades 10–12, by family income: October 1972 through October 2012
0
2
4
6
8
10
12
14
16
18
20
1972 1975 1980 1985 1990 1995 2000 2005 2012
Percent
Year
Low income
Middle income
Total
High income
NOTE: The event dropout rate indicates the percentage of youth ages 15 through 24 who dropped out of grades 10–12 between one October and the next (e.g., October 2011 to October 2012). Dropping out is defined as leaving school without a high school diploma or alternative credential, such as a General Educational Development (GED) certificate. Low income is defined as the bottom 20 percent of all family incomes for the year; middle income is between 20 and 80 percent of all family incomes; and high income is the top 20 percent of all family incomes. Data on family income are missing for 1974. Estimates beginning with 1987 reflect new editing procedures for cases with missing data on school enrollment items. Estimates beginning with 1992 reflect new wording of the educational attainment item. Estimates beginning with 1994 reflect changes due to newly instituted computer-assisted interviewing. For details about changes in the Current Population Survey (CPS) over time, please see Kaufman, P., Alt, M.N., and Chapman, C. (2004). Dropout Rates in the United States: 2001 (NCES 2005-046). National Center for Education Statistics, Institute of Education Sciences, U.S. Department of Education. Washington, DC.SOURCE: U.S. Department of Commerce, Census Bureau, Current Population Survey (CPS), October (1972–2012).
Figures
21
Figure 2. Status dropout rates of 16- through 24-year-olds, by race/ethnicity: October 1972 through October 2012
Hispanic
Black, non-Hispanic
Total
White, non-Hispanic
0
5
10
15
20
25
30
35
40
1972 1975 1980 1985 1990 1995 2000 2005 2012Year
Percent
NOTE: The status dropout rate indicates the percentage of 16- through 24-year-olds who are not enrolled in high school and who lack a high school credential. High school credentials include high school diplomas and alternative credentials, such as a General Educational Development (GED) certificate. Beginning in 2003, respondents were able to identify themselves as being of Two or more races. The 2003 through 2012 categories for White, non-Hispanic; and Black, non-Hispanic contain only respondents who indicated just one race. The Hispanic category includes Hispanics of all races and racial combinations. Due to small sample sizes for some or all of the years shown in the figure, Asians/Pacific Islanders and American Indians/Alaska Natives who are not Hispanic are included in the totals but not shown separately. The “Two or more races, non-Hispanic” category is also included in the total in 2003 through 2012 but not shown separately due to small sample sizes. The variability of Hispanic status rates reflects, in part, small sample size of Hispanics in earlier years of the Current Population Survey (CPS). Beginning with 1987, estimates reflect new editing procedures for cases with missing data on school enrollment items. Estimates beginning with 1992 reflect new wording of the educational attainment item. Estimates beginning with 1994 reflect changes due to newly instituted computer-assisted interviewing. For details about changes in the CPS over time, please see Kaufman, P., Alt, M.N., and Chapman, C. (2004). Dropout Rates in the United States: 2001 (NCES 2005-046). National Center for Education Statistics, Institute of Education Sciences, U.S. Department of Education. Washington, DC.SOURCE: U.S. Department of Commerce, Census Bureau, Current Population Survey (CPS), October 1972–2012.

Figures
22
Figure 3. Status dropout rates of 16- through 24-year-olds, by race/ethnicity and sex: October 2012
7.34.8
8.1
13.9
2.5!
15.8!
8.1!5.9
3.87.0
11.3
4.0!
13.5!
3.0!
0
5
10
15
20
25
30
35
40
Total White,non-Hispanic
Black,non-Hispanic
Hispanic Asian/Pacific
Islander,non-Hispanic
AmericanIndian/AlaskaNative,
non-Hispanic
Two ormore races,
non-Hispanic
Percent
Race/ethnicity
Male Female
! Interpret data with caution. The coefficient of variation (CV) for this estimate is 30 percent or greater.NOTE: The status dropout rate indicates the percentage of 16- through 24-year-olds who are not enrolled in high school and who lack a high school credential. High school credentials include high school diplomas and alternative credentials, such as a General Educational Development (GED) certificate. Respondents were able to identify themselves as being of Two or more races. The White, non-Hispanic; Black, non-Hispanic; Asian/Pacific Islander, non-Hispanic; and American Indian/Alaska Native, non-Hispanic categories consist of individuals who considered themselves to be one race and who did not identify as Hispanic. Non-Hispanics who identified themselves as multiracial are included in the “Two or more races, non-Hispanic” category. The Hispanic category consists of Hispanics of all races and racial combinations. SOURCE: U.S. Department of Commerce, Census Bureau, Current Population Survey (CPS), October 2012.

Figures
23
Figure 4. Status completion rates of 18- through 24-year-olds not currently enrolled in high school or below, by race/ethnicity: October 1972 through October 2012
0
20
40
60
80
100
1972 1975 1980 1985 1990 1995 2000 2005 2012
Percent
Year
Hispanic
Black, non-HispanicTotal
White, non-Hispanic
NOTE: Status completion rates measure the percentage of 18- through 24-year-olds who are not enrolled in high school and who also hold a high school diploma or alternative credential, such as a General Educational Development (GED) certificate. Those still enrolled in high school are excluded from the analysis. Beginning in 2003, respondents were able to identify themselves as being of Two or more races. The 2003 through 2012 categories for White, non-Hispanic; and Black, non-Hispanic contain only respondents who indicated just one race. The Hispanic category includes Hispanics of all races and racial combinations. Due to small sample sizes for some or all of the years shown in the figure, Asians/Pacific Islanders and American Indians/Alaska Natives who are not Hispanic are included in the totals but not shown separately. The “Two or more races, non-Hispanic” category is also included in the total in 2003 through 2012 but not shown separately due to small sample sizes. The variability of Hispanic status rates reflects, in part, small sample size of Hispanics in earlier years of the Current Popluation Survey (CPS). Beginning with 1987, estimates reflect new editing procedures for cases missing school enrollment item data. Estimates beginning with 1992 reflect new wording of the educational attainment item. Estimates beginning with 1994 reflect changes due to newly instituted computer-assisted interviewing. For details about changes in the CPS over time, please see Kaufman, P., Alt, M.N., and Chapman, C. (2004). Dropout Rates in the United States: 2001 (NCES 2005-046). National Center for Education Statistics, Institute of Education Sciences, U.S. Department of Education. Washington, DC.SOURCE: U.S. Department of Commerce, Census Bureau, Current Population Survey (CPS), October 1972–2012.

Figures
24
Figure 5. Status completion rates of 18- through 24-year-olds not currently enrolled in high school or below, by race/ethnicity and sex: October 2012
90.3 94.1 88.280.8
96.6
81.388.3
92.3 95.2 91.784.8
93.3
77.2
95.6
0
20
40
60
80
100
Total White,non-Hispanic
Black,non-Hispanic
Hispanic Asian/Pacific
Islander,non-Hispanic
AmericanIndian/AlaskaNative,
non-Hispanic
Two ormore races,
non-Hispanic
Race/ethnicity
Male Female
Percent
NOTE: Status completion rates measure the percentage of 18- through 24-year-olds who are not enrolled in high school and who also hold a high school diploma or alternative credential, such as a General Educational Development (GED) certificate. Those still enrolled in high school are excluded from the analysis. Respondents were able to identify themselves as being of Two or more races. The White, non-Hispanic; Black, non-Hispanic; Asian/Pacific Islander, non-Hispanic; and American Indian/Alaska Native, non-Hispanic categories consist of individuals who considered themselves to be one race and who did not identify as Hispanic. Non-Hispanics who identified themselves as multiracial are included in the “Two or more races, non-Hispanic” category. The Hispanic category consists of Hispanics of all races and racial combinations. SOURCE: U.S. Department of Commerce, Census Bureau, Current Population Survey (CPS), October 2012.

Figures
25
Figure 6. Adjusted cohort graduation rates of public high school students, by state: School year 2011–12
— Not available. The Department of Education's Office of Elementary and Secondary Education approved a timeline extension for these states to begin reporting 4-year ACGR data, resulting in the 4-year ACGR not being available for these states in SY 2011-12.NOTE: The adjusted cohort graduation rate (ACGR) is an estimate of the percentage students graduating on time, that is, within 4 years of entering 9th grade for the first time. SOURCE: Stetser, M.C. and Stillwell, R. (2014). Public High School Four-Year On-Time Graduation Rates and Event Dropout Rates: School Years 2010-11 and 2011-12. First Look. (NCES 2014-391), table 3.

26
Tables

Tables
27
Table 1. Event dropout rates and number and distribution of 15- through 24-year-olds who dropped out of grades 10–12, by selected characteristics: October 2012
Characteristic
Event dropout
rate (percent)
Number of event
dropouts (thousands)
Population enrolled1
(thousands)
Percent of all
dropouts
Percent of population
enrolled
Total 3.4
386
11,261 100.0
100.0
SexMale 3.6
201
5,650 52.2
50.2
Female 3.3
184
5,610 47.8
49.8
Race/Ethnicity White, non-Hispanic 1.6
95
6,105 24.6
54.2
Black, non-Hispanic 6.8
114
1,667 29.5
14.8 Hispanic 5.4
136
2,495 35.2
22.2
Asian/Pacific Islander, non-Hispanic 3.4 ! 19 ! 562 5.0 ! 5.0 !
Family income3 Low income 5.9
106
1,815 27.6
16.1
Middle income 3.7
241
6,534 62.6
58.0 High income 1.3 ! 38 ! 2,912 9.8 ! 25.9 !
Age4 15–16 2.2
64
2,927 16.6
26.0
17 1.9
73
3,843 19.0
34.1 18 3.2
96
3,026 24.9
26.9
19 8.2
82
994 21.2
8.8 20–24 14.9
70
471 18.2
4.2
Recency of immigration
Born outside the 50 states and District of Columbia
Hispanic 10.1
51
506 13.2
4.5 Non-Hispanic 2.3 ! 12 ! 533 3.1 ! 4.7 !
First generation5 Hispanic 5.6
69
1,237 17.9
11.0
Non-Hispanic 2.0 ! 16 ! 811 4.2 ! 7.2 ! Second generation or higher5
Hispanic 2.1 ! 16 ! 752 4.0 ! 6.7 ! Non-Hispanic 3.0
222
7,421 57.5
65.9
Disability
With a disability6 10.0
42
422 11.0
3.7 Without a disability 3.2 343 10,838 89.0 96.2
See notes at end of table.

Tables
28
Table 1. Event dropout rates and number and distribution of 15- through 24-year-olds who dropped out of grades 10–12, by selected characteristics: October 2012—Continued
Characteristic
Event dropout
rate (percent)
Number of event
dropouts (thousands)
Population enrolled1
(thousands)
Percent of all
dropouts
Percent of population
enrolled
Geographic region Northeast 3.3
62
1,903 16.1
16.9
Midwest 2.7
69
2,546 17.9
22.6 South 3.7
152
4,090 39.4
36.3
West 3.8 103 2,722 26.6 24.2
! Interpret data with caution. The coefficient of variation (CV) for this estimate is 30 percent or greater. 1 This is an estimate of the population of 15- through 24-year-olds enrolled during the previous year in high school based on the number of students still enrolled in the current year and the number of students who either graduated or dropped out the previous year. 2 Respondents were able to identify themselves as being of Two or more races. The White, non-Hispanic; Black, non-Hispanic; and Asian/Pacific Islander, non-Hispanic categories consist of individuals who considered themselves to be one race and who did not identify as Hispanic. The Hispanic category consists of Hispanics of all races and racial combinations. Due to small sample size, American Indians/Alaska Natives and those who identified themselves as being of Two or more races, non-Hipanic are included in the total but are not shown separately. 3 Low income is defined as the bottom 20 percent of all family incomes for the year; middle income is between 20 and 80 percent of all family incomes; and high income is the top 20 percent of all family incomes. In 2012, low income was defined as $18,400 or less, and high income was defined as $90,824 or more. Cold deck imputation was used for families with missing income data (20.36 percent of the weighted sample). 4 Age when a person dropped out may be 1 year younger, because the dropout event could occur at any time over a 12-month period. 5 Individuals defined as “first generation” were born in the 50 states or the District of Columbia, but one or both of their parents were born outside the 50 states or the District of Columbia. Individuals defined as “second generation or higher” were born in the 50 states or the District of Columbia, as were both of their parents. 6 Individuals identified as having a disability reported at least one of the following: difficulty hearing, seeing even when wearing glasses, walking or climbing stairs, dressing or bathing, doing errands alone, concentrating, remembering, or making decisions. NOTE: The event dropout rate indicates the percentage of youth ages 15 through 24 who dropped out of grades 10–12 between one October and the next (e.g., October 2011 to October 2012). Dropping out is defined as leaving school without a high school diploma or alternative credential, such as a General Educational Development (GED) certificate. Detail may not sum to totals because of rounding. SOURCE: U.S. Department of Commerce, Census Bureau, Current Population Survey (CPS), October 2012.

Tables
29
Table 2. Event dropout rates of 15- through 24-year-olds who dropped out of grades 10–12, and number of dropouts and population of 15- through 24-year-olds who were enrolled: October 1972 through October 2012
Year2
Event dropout rate
(percent)
Number of event dropouts
(thousands)
Population enrolled1
(thousands)
1972 6.1 647 10,550 1973 6.3 674 10,736 1974 6.7 735 10,894 1975 5.8 631 10,875 1976 5.9 641 10,844
1977 6.5 729 11,178 1978 6.7 739 11,012 1979 6.7 745 11,044 1980 6.1 655 10,758 1981 5.9 636 10,746
1982 5.5 573 10,435 1983 5.2 531 10,146 1984 5.1 504 9,828 1985 5.3 501 9,531 1986 4.7 462 9,828
1987 4.1 405 9,819 1988 4.8 460 9,613 1989 4.5 403 9,001 1990 4.0 347 8,675 1991 4.0 348 8,700
1992 4.4 383 8,716 1993 4.5 381 8,549 1994 5.3 497 9,374 1995 5.7 544 9,509 1996 5.0 485 9,612
1997 4.6 454 9,984 1998 4.8 479 10,079 1999 5.0 519 10,464 2000 4.8 488 10,126 2001 5.0 505 10,187
2002 3.5 365 10,337 2003 4.0 429 10,698 2004 4.7 486 10,385 2005 3.8 414 10,870 2006 3.8 407 10,849 See notes at end of table.

Tables
30
Table 2.—Event dropout rates of 15- through 24-year-olds who dropped out of grades 10–12, and number of dropouts and population of 15- through 24-year-olds who were enrolled: October 1972 through October 2012—Continued
Year2
Event dropout rate
(percent)
Number of event dropouts
(thousands)
Population enrolled1
(thousands)
2007 3.5 383 10,967 2008 3.5 390 11,058 2009 3.4 373 10,920 2010 3.0 326 10,929 2011 3.4 375 11,065 2012 3.4 386 11,261
1 This is an estimate of the population of 15- through 24-year-olds enrolled during the previous year in high school based on the number of students still enrolled in the current year and the number of students who either graduated or dropped out the previous year. 2 Estimates beginning in 1987 reflect new editing procedures for cases with missing data on school enrollment items. Estimates beginning in 1992 reflect new wording of the educational attainment item. Estimates beginning in 1994 reflect changes due to newly instituted computer-assisted interviewing. For details about changes in the Current Population Survey (CPS) over time, please see Kaufman, P., Alt, M.N., and Chapman, C. (2004). Dropout Rates in the United States: 2001 (NCES 2005-046). National Center for Education Statistics, Institute of Education Sciences, U.S. Department of Education. Washington, DC. NOTE: The event dropout rate indicates the percentage of youth ages 15 through 24 who dropped out of grades 10–12 between one October and the next (e.g., October 2011 to October 2012). Dropping out is defined as leaving school without a high school diploma or alternative credential, such as a General Educational Development (GED) certificate. SOURCE: U.S. Department of Commerce, Census Bureau, Current Population Survey (CPS), October 1972–2012.

Tables
31
Table 3. Event dropout rates of 15- through 24-year-olds who dropped out of grades 10–12, by sex and race/ethnicity: October 1972 through October 2012
Year2 Total
(percent)
Sex (percent) Race/ethnicity (percent)1 Male Female
White, non-Hispanic
Black, non-Hispanic Hispanic
1972 6.1 5.9 6.3 5.3 9.6 11.2 ! 1973 6.3 6.8 5.7 5.5 10.0 10.0 ! 1974 6.7 7.4 6.0 5.8 11.6 9.9 ! 1975 5.8 5.4 6.1 5.1 8.7 10.9 ! 1976 5.9 6.6 5.2 5.6 7.4 7.3 !
1977 6.5 6.9 6.1 6.1 8.6 7.8 ! 1978 6.7 7.5 5.9 5.8 10.2 12.3 1979 6.7 6.8 6.7 6.1 10.0 9.8 ! 1980 6.1 6.7 5.5 5.3 8.3 11.7 1981 5.9 6.0 5.8 4.9 9.7 10.7
1982 5.5 5.8 5.2 4.8 7.8 9.2 ! 1983 5.2 5.8 4.7 4.4 7.0 10.1
1984 5.1 5.5 4.8 4.5 5.8 11.1 1985 5.3 5.4 5.1 4.4 7.8 9.8 1986 4.7 4.7 4.7 3.8 5.5 11.9
1987 4.1 4.4 3.8 3.6 6.4 5.6 ! 1988 4.8 5.4 4.6 4.4 6.3 11.0 1989 4.5 4.6 4.6 3.6 8.2 8.1 1990 4.0 4.2 4.1 3.5 5.2 8.4 1991 4.0 3.9 4.4 3.3 6.4 7.8
1992 4.4 3.9 4.9 3.7 5.0 8.2 1993 4.5 4.6 4.3 3.9 5.8 6.7 ! 1994 5.3 5.2 5.4 4.2 6.6 10.0 1995 5.7 6.2 5.3 4.5 6.4 12.4 1996 5.0 5.0 5.1 4.1 6.7 9.0
1997 4.6 5.0 4.1 3.6 5.0 9.5 1998 4.8 4.6 4.9 3.9 5.2 9.4 1999 5.0 4.6 5.4 4.0 6.5 7.8 2000 4.8 5.5 4.1 4.1 6.1 7.4 2001 5.0 5.6 4.3 4.1 6.3 8.8
2002 3.5 3.7 3.4 2.6 4.9 5.8 2003 4.0 4.2 3.8 3.2 4.8 7.1 2004 4.7 5.1 4.3 3.7 5.7 8.9 2005 3.8 4.2 3.4 2.8 7.3 5.0 2006 3.8 4.1 3.4 2.9 3.8 7.0 See notes at end of table.
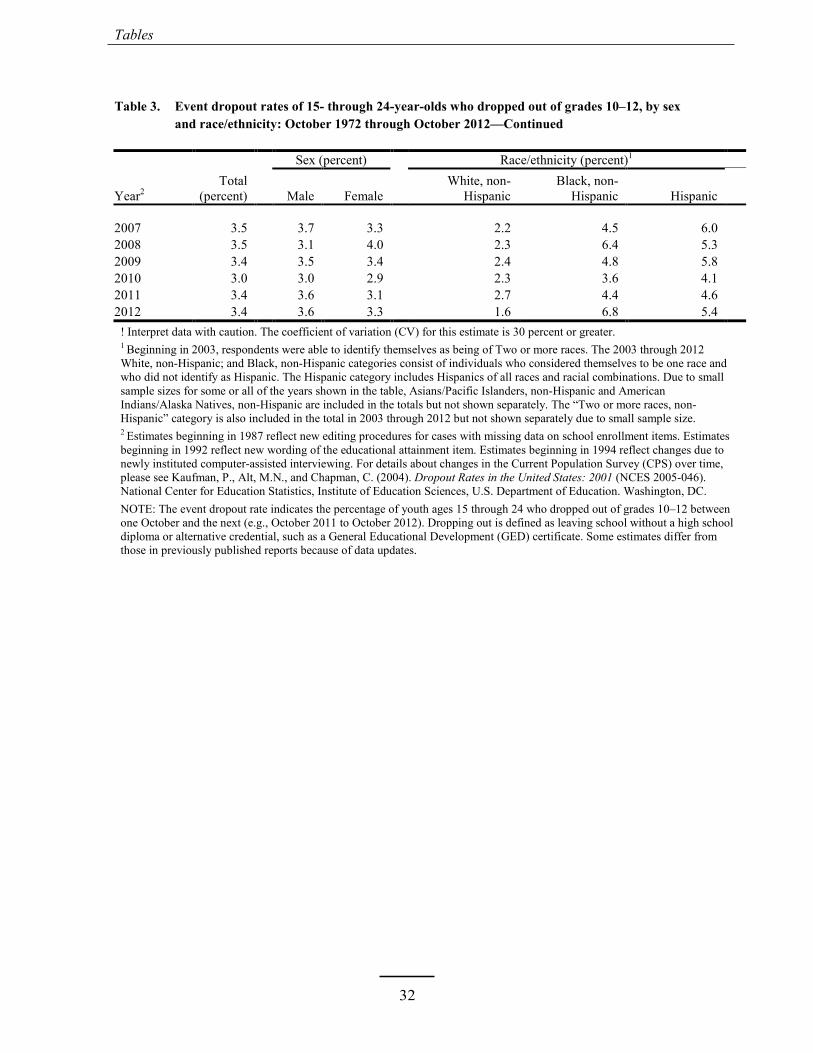
Tables
32
Table 3. Event dropout rates of 15- through 24-year-olds who dropped out of grades 10–12, by sex and race/ethnicity: October 1972 through October 2012—Continued
Year2 Total
(percent)
Sex (percent) Race/ethnicity (percent)1 Male Female
White, non-Hispanic
Black, non-Hispanic Hispanic
2007 3.5 3.7 3.3 2.2 4.5 6.0 2008 3.5 3.1 4.0 2.3 6.4 5.3 2009 3.4 3.5 3.4 2.4 4.8 5.8 2010 3.0 3.0 2.9 2.3 3.6 4.1 2011 3.4 3.6 3.1 2.7 4.4 4.6 2012 3.4 3.6 3.3 1.6 6.8 5.4
! Interpret data with caution. The coefficient of variation (CV) for this estimate is 30 percent or greater. 1 Beginning in 2003, respondents were able to identify themselves as being of Two or more races. The 2003 through 2012 White, non-Hispanic; and Black, non-Hispanic categories consist of individuals who considered themselves to be one race and who did not identify as Hispanic. The Hispanic category includes Hispanics of all races and racial combinations. Due to small sample sizes for some or all of the years shown in the table, Asians/Pacific Islanders, non-Hispanic and American Indians/Alaska Natives, non-Hispanic are included in the totals but not shown separately. The “Two or more races, non-Hispanic” category is also included in the total in 2003 through 2012 but not shown separately due to small sample size. 2 Estimates beginning in 1987 reflect new editing procedures for cases with missing data on school enrollment items. Estimates beginning in 1992 reflect new wording of the educational attainment item. Estimates beginning in 1994 reflect changes due to newly instituted computer-assisted interviewing. For details about changes in the Current Population Survey (CPS) over time, please see Kaufman, P., Alt, M.N., and Chapman, C. (2004). Dropout Rates in the United States: 2001 (NCES 2005-046). National Center for Education Statistics, Institute of Education Sciences, U.S. Department of Education. Washington, DC. NOTE: The event dropout rate indicates the percentage of youth ages 15 through 24 who dropped out of grades 10–12 between one October and the next (e.g., October 2011 to October 2012). Dropping out is defined as leaving school without a high school diploma or alternative credential, such as a General Educational Development (GED) certificate. Some estimates differ from those in previously published reports because of data updates.

Tables
33
Table 4.—Event dropout rates of 15- through 24-year-olds who dropped out of grades 10–12, by family income: October 1972 through October 2012
Year2 Total
(percent) Family income (percent)1 Low income Middle income High income
1972 6.1 14.1 6.7 2.5 1973 6.3 17.3 7.0 1.8 1974 6.7 — — — 1975 5.8 15.7 6.0 2.6 1976 5.9 15.4 6.8 2.1
1977 6.5 15.5 7.6 2.2 1978 6.7 17.4 7.3 3.0 1979 6.7 17.1 6.9 3.6 1980 6.1 15.8 6.4 2.5 1981 5.9 14.4 6.2 2.8
1982 5.5 15.2 5.6 1.8 1983 5.2 10.4 6.0 2.2 1984 5.1 13.9 5.1 1.8 1985 5.2 14.2 5.2 2.1 1986 4.7 10.9 5.1 1.6
1987 4.1 10.3 4.7 1.0 1988 4.8 13.7 4.7 1.3 1989 4.5 10.0 5.0 1.1 ! 1990 4.0 9.5 4.3 1.1 ! 1991 4.0 10.6 4.0 1.0 !
1992 4.4 10.9 4.4 1.3 1993 4.5 12.3 4.3 1.3 1994 5.3 13.0 5.2 2.1 1995 5.7 13.3 5.7 2.0 1996 5.0 11.1 5.1 2.1
1997 4.6 12.3 4.1 1.8 1998 4.8 12.7 3.8 2.7 1999 5.0 11.0 5.0 2.1 2000 4.8 10.0 5.2 1.6 2001 5.0 10.7 5.4 1.7
2002 3.6 7.7 3.6 1.7 2003 4.0 7.5 4.6 1.4 2004 4.7 10.4 4.6 2.5 2005 3.8 8.9 3.8 1.5 2006 3.8 9.0 3.5 2.0 See notes at end of table.

Tables
34
Table 4.—Event dropout rates of 15- through 24-year-olds who dropped out of grades 10–12, by family income: October 1972 through October 2012—Continued
Year2 Total
(percent) Family income (percent)1 Low income Middle income High income
2007 3.5 8.8 3.5 0.9 2008 3.5 8.7 3.0 2.0 2009 3.4 7.4 3.4 1.4 2010 3.0 5.6 3.0 1.4 2011 3.4 6.3 3.5 1.7 2012 3.4 5.9 3.7 1.3 !
— Not available. ! Interpret data with caution. The coefficient of variation (CV) for this estimate is 30 percent or greater. 1 Low income is defined as the bottom 20 percent of all family incomes for the year; middle income is between 20 and 80 percent of all family incomes; and high income is the top 20 percent of all family incomes. In 2012, low income was defined as $18,400 or less, and high income was defined as $90,824 or more. Cold deck imputation was used for families with missing income data (20.36 percent of the weighted sample). 2 Estimates beginning in 1987 reflect new editing procedures for cases with missing data on school enrollment items. Estimatesbeginning in 1992 reflect new wording of the educational attainment item. Estimates beginning in 1994 reflect changes due to newly instituted computer-assisted interviewing. For details about changes in the Current Population Survey (CPS) over time, please see Kaufman, P., Alt, M.N., and Chapman, C. (2004). Dropout Rates in the United States: 2001 (NCES 2005-046). National Center for Education Statistics, Institute of Education Sciences, U.S. Department of Education. Washington, DC. NOTE: The event dropout rate indicates the percentage of youth ages 15 through 24 who dropped out of grades 10–12 between one October and the next (e.g., October 2011 to October 2012). Dropping out is defined as leaving school without a high school one October and the next (e.g., October 2011 to October 2012). Dropping out is defined as leaving school without a high school diploma or alternative credential, such as a General Educational Development (GED) certificate. SOURCE: U.S. Department of Commerce, Census Bureau, Current Population Survey (CPS), October 1972–2012.

Tables
35
Table 5.—Event dropout rates for public school students in grades 9–12, by state: School years 1995–96 through 2011–12
State
Event dropout rate (percent)
1995 –96
1996 –97
1997 –98
1998 –99
1999 –2000
2000 –01
2001 –02
2002 –03
2003 –04
2004 –05
2005 –06
2006 –07
2007 –08
2008 –09
2009 –10
2010 –11
2011 –12
Reporting states1 — — — — — — — 3.9 4.1 3.9 3.9 4.4 4.1 4.1 3.4 3.3 3.3
Alabama2 5.6 5.3 4.8 4.4 4.5 4.1 3.7 3.5 3.3 2.8 2.5 2.3 2.2 1.5 1.8 1.4 1.4 Alaska3 5.6 4.9 4.6 5.3 5.5 8.2 8.1 7.6 7.0 8.2 8.0 7.3 7.3 7.0 6.9 6.9 7.0
Arizona2 10.2 10.0 9.4 8.4 — 10.9 10.5 8.5 6.7 6.2 7.6 7.6 6.7 8.3 7.8 5.0 5.9 Arkansas 4.1 5.0 5.4 6.0 5.7 5.3 5.3 4.6 4.7 4.3 3.1 4.6 4.7 4.1 3.6 3.5 3.2 California4 — — — — — — — 3.2 3.3 3.1 3.7 5.5 5.0 5.0 4.6 4.2 4.0
Colorado — — — — — — — 3.5 5.4 7.8 7.8 6.9 6.4 6.1 5.3 5.1 4.9 Connecticut 4.8 3.9 3.5 3.3 3.1 3.0 2.6 2.1 ‡ ‡ 2.0 2.1 2.8 3.1 3.0 1.9 2.1 Delaware 4.5 4.5 4.7 4.1 4.1 4.2 6.2 5.5 6.1 5.3 5.5 5.5 6.0 5.1 3.9 3.6 3.5 District of Columbia — — 12.8 8.2 7.2 — — — — — ‡ 7.1 5.5 7.0 7.0 6.1 5.8 Florida2 — — — — — 4.4 3.7 3.4 3.4 3.5 4.1 3.8 3.3 2.6 2.3 2.1 2.1
Georgia 8.5 8.2 7.3 7.4 7.2 7.2 6.5 5.8 5.4 5.6 5.2 4.6 4.3 4.2 3.8 3.9 3.9 Hawaii3 — — 5.2 5.3 5.3 5.7 5.1 4.7 4.8 4.7 4.7 5.4 5.4 4.9 5.2 5.1 4.7 Idaho3 8.0 7.2 6.7 6.9 — 5.6 3.9 3.9 3.1 3.0 2.7 2.6 2.0 1.6 1.4 1.6 1.9 Illinois2 6.4 6.6 6.9 6.5 6.2 6.0 6.4 5.7 5.3 4.5 4.0 4.0 5.2 11.5 2.9 2.9 2.4 Indiana — — — — — — 2.3 2.2 2.5 2.5 2.9 2.7 1.7 1.7 1.6 1.8 2.1
Iowa 3.1 2.9 2.9 2.5 2.5 2.7 2.4 1.9 ‡ 2.2 2.2 2.3 2.9 3.1 3.4 3.4 3.2 Kansas — — — — — 3.2 3.1 2.4 2.2 2.1 2.4 2.7 2.5 2.1 2.1 2.3 2.1 Kentucky — — 5.2 4.9 5.0 4.6 4.0 3.3 3.3 3.5 3.3 3.0 2.8 2.9 3.2 2.5 2.5 Louisiana5 11.6 11.6 11.4 10.0 9.2 8.3 7.0 7.5 7.9 7.5 8.4 7.4 7.5 6.8 4.8 3.9 5.7 Maine 3.1 3.2 3.2 3.3 3.3 3.1 2.8 2.8 2.7 2.8 5.4 5.3 4.4 3.6 4.2 3.5 3.2
Maryland2 4.8 4.9 4.3 4.4 4.1 4.1 3.9 3.6 4.1 3.9 3.9 3.8 3.6 3.0 2.7 3.3 3.8 Massachusetts 3.4 3.4 3.2 3.6 3.5 3.4 — 3.3 3.7 3.8 3.4 3.8 3.4 2.9 2.8 2.7 2.5 Michigan — — — — — — — 4.5 4.6 3.9 3.5 7.4 6.2 3.8 4.3 7.2 6.9 Minnesota 5.2 5.5 4.9 4.5 4.3 4.0 3.8 3.8 ‡ ‡ 3.1 3.0 2.8 1.9 1.6 1.8 1.9 Mississippi 6.2 6.0 5.8 5.0 4.9 4.6 3.9 3.7 2.9 2.8 3.0 4.3 4.6 4.2 7.4 3.2 3.2
Missouri 6.5 5.8 5.2 4.8 4.4 4.2 3.6 3.3 3.3 3.7 4.1 3.7 4.9 4.3 3.5 3.4 2.9 Montana 5.6 5.1 4.4 4.5 4.2 4.2 3.9 3.6 3.4 3.4 3.7 3.7 5.2 5.0 4.3 4.3 4.1 Nebraska 4.5 4.3 4.4 4.2 4.0 4.0 4.2 3.1 2.8 2.7 2.8 2.8 2.5 2.4 2.2 2.1 2.2 Nevada4 9.6 10.2 10.1 7.9 6.2 5.2 6.4 6.1 6.0 5.8 7.7 4.5 5.1 5.1 4.5 4.1 3.9 New Hampshire — — — — — 5.4 4.0 3.8 3.8 3.5 3.2 3.2 3.0 1.7 1.2 1.3 1.3
New Jersey2 4.1 3.7 3.5 3.1 3.1 2.8 2.5 1.8 ‡ ‡ 1.7 2.0 1.7 1.6 1.6 1.4 1.4 New Mexico 8.3 7.5 7.1 6.7 6.0 5.3 5.2 4.7 5.2 4.2 5.5 6.1 5.2 4.9 6.9 6.6 6.4 New York3 — — 3.2 4.0 4.1 3.8 7.1 5.5 5.6 5.7 4.4 5.3 3.9 4.2 3.6 3.6 3.8 North Carolina — — — — — 6.3 5.7 5.2 5.2 5.2 ‡ 5.7 5.2 5.3 4.7 3.9 3.1 North Dakota 2.5 2.7 2.8 2.4 2.7 2.2 2.0 2.2 2.0 1.9 2.1 2.3 2.4 2.5 2.2 3.3 3.0
See notes at end of table.

Tables
36
Table 5.—Event dropout rates for public school students in grades 9–12, by state: School years 1995–96 through 2011–12—Continued
State
Event dropout rate (percent)
1995 –96
1996 –97
1997 –98
1998 –99
1999 –2000
2000 –01
2001 –02
2002 –03
2003 –04
2004 –05
2005 –06
2006 –07
2007 –08
2008 –09
2009 –10
2010 –11
2011 –12
Ohio3 5.4 5.2 5.1 — — — 3.1 3.0 3.3 3.5 4.1 4.5 4.3 4.2 4.2 4.4 4.6 Oklahoma3 5.7 5.9 5.8 5.2 5.4 5.2 4.4 4.0 3.9 3.5 3.6 3.5 3.1 2.5 2.4 2.5 2.5 Oregon 7.0 — 6.8 6.3 6.2 5.3 4.9 4.4 — — 4.6 4.6 3.8 3.4 3.4 3.2 3.4 Pennsylvania 4.0 3.9 3.9 3.7 4.0 3.6 3.3 3.2 2.9 2.9 2.8 — 2.6 2.3 2.1 2.2 2.8 Rhode Island 4.6 4.7 4.9 4.5 4.8 5.0 4.3 4.0 3.4 4.1 4.1 5.8 5.3 4.4 4.6 5.2 4.2
South Carolina — — — — — 3.3 3.3 3.2 3.4 3.3 — 3.9 3.9 3.4 3.0 2.8 2.5 South Dakota3 5.7 4.5 3.1 4.5 3.5 3.9 2.8 3.3 4.2 4.4 4.4 3.9 2.3 1.8 2.6 2.6 3.1 Tennessee2 4.9 5.1 5.0 4.6 4.2 4.3 3.8 3.2 3.3 2.7 2.8 3.1 3.9 3.2 2.7 3.6 3.7 Texas — — — — 5.0 4.2 3.8 3.6 3.6 3.6 4.3 4.0 4.0 3.2 2.7 2.4 2.5 Utah 4.4 4.5 5.2 4.7 4.1 3.7 3.7 3.9 3.8 3.7 3.3 3.1 4.2 3.3 2.6 1.5 1.5
Vermont2 5.3 5.0 5.2 4.6 4.7 4.7 4.0 3.5 2.8 2.6 ‡ — — 2.6 2.4 2.5 2.5 Virginia3 4.7 4.6 4.8 4.5 3.9 3.5 2.9 3.0 2.8 2.5 2.7 2.6 2.7 2.5 2.1 2.3 1.9
Washington — — — — — — 7.1 6.2 6.5 4.5 5.6 5.1 5.7 4.7 4.2 4.0 3.8
West Virginia 3.8 4.1 4.1 4.9 4.2 4.2 3.7 3.7 4.3 4.1 3.9 4.0 4.4 4.1 4.0 3.4 2.7
Wisconsin3 2.4 2.7 2.8 1.8 2.6 2.3 1.9 2.0 ‡ 2.4 2.2 2.2 2.3 2.3 2.2 2.0 1.9
Wyoming3 5.7 6.2 6.4 5.1 5.7 6.4 5.8 4.5 4.6 4.8 5.7 5.1 5.0 1.1 6.0 5.4 4.3
— Not available. These states do not report dropouts that are consistent with the NCES definition. ‡ Reporting standards not met. Dropout data were missing for more than 20 percent of grade total membership. 1 Average event dropout rate for all reporting states. Prior to 2002–03, too few states reported to calculate a reporting states total. 2 These states used an alternative calendar for each year shown, reporting students who drop out between one July and the next. The rates from both calendar approaches are comparable (see Winglee et al. 2000). 3 The following states reported data using the alternative calendar of one July to the next in the years indicated: Alaska (1995–96 and 1999–2000 through 2001–02); Hawaii (2000–01); Idaho (1993–94 through 1998–99); New York (1998–99 and 2000–01 through 2003–04); Ohio (1993–94); Oklahoma (1993–94 through 2000–01); South Dakota (1993–94 through 1998–99); Virginia (1993–94 through 1999–2000); Wisconsin (1993–94 through 1996–97 and 1998–99); and Wyoming (1993–94). 4 Data for 2008–09 for California and Nevada were imputed, due to item non-response, based on the prior year reported data. 5 Effective in the 1995–96 school year, Louisiana changed its dropout data collection from school-level aggregate counts reported to districts to an individual student-record system. The apparent increase in the dropout rate is partly due to the resulting increased ability to track students. NOTE: These event dropout rates measure the percentage of public school students in grades 9–12 who dropped out of school between one October and the next (e.g., October 2011 to October 2012). Data are reported by states to the U.S. Department of Education, National Center for Education Statistics. The Common Core of Data (CCD) includes public school students only. Some estimates differ from those in previously published reports because of updates to the estimates. SOURCE: U.S. Department of Education, National Center for Education Statistics. (2002) Public High School Dropouts and Completers From the Common Core of Data: School Years 1991–92 Through 1997–98, table 2; Sable, J., and Naum, J. (2004a). Documentation to the NCES Common Core of Data Local Education Agency Universe Survey Dropout and Completion Data File: School Year 1997–98 (NCES 2001-302R), table E-1; Sable, J., and Naum, J. (2004b). Documentation to the NCES Common Core of Data Local Education Agency Universe Survey Dropout and Completion Data File: School Year 1998–99 (NCES 2002-310R), table E-3; Sable, J., and Naum, J. (2004c). Documentation to the NCES Common Core of Data Local Education Agency Universe Survey Dropout and Completion Data File: School Year 1999–2000 (NCES 2002-384R), table E-3; Sable, J., and Naum, J. (2004d). Documentation to the NCES Common Core of Data Local Education Agency Universe Survey Dropout and Completion Data File: School Year 2000–01 (NCES 2002-315R), table E-3; Sable, J., Naum, J., and Thomas, J.M. (2004). Documentation to the NCES Common Core of Data Local Education Agency Universe Survey Dropout and Completion Data File: School Year 2001–02 (NCES 2005-349), table E-2; Stillwell, R., Sable, J., and Plotts, C. (2011). Public School Graduates and Dropouts From the Common Core of Data: School Year 2008–09 (NCES 2011-312), table 7; Stillwell, R., and Sable, J. (2013). Public School Graduates and Dropouts From the Common Core of Data: School Year 2009–10 (NCES 2012-309rev), table 5; Stetser, M.C., and Stillwell, R. (2013). Public High School Four-Year On-Time Graduation Rates and Event Dropout Rates: School Years 2010–11 and 2011–12. First Look (NCES 2014-391), table 5.

Tables
37
Table 6.—Status dropout rates and number and distribution of dropouts of 16- through 24-year-olds, by selected characteristics: October 2012
Characteristic
Status dropout
rate (percent)
Number of status
dropouts (thousands)
Population (thousands)
Percent of all
dropouts Percent of population
Total 6.6 2,562 38,800 100.0 100.0
Sex Male 7.3 1,427 19,557 55.7 50.4 Female 5.9 1,135 19,243 44.3 49.6
Race/ethnicity1 White, non-Hispanic 4.3 930 21,708 36.3 55.9 Black, non-Hispanic 7.5 418 5,540 16.3 14.3 Hispanic 12.7 1,040 8,201 40.6 21.1 Asian/Pacific Islander, non-
Hispanic 3.3 66 2,013 2.6 5.2 American Indian/Alaska
Native, non-Hispanic 14.6 ! 56 ! 382 2.2 ! 1.0 ! Two or more races,
non-Hispanic 5.5 53 956 2.1 2.5
Age 16 2.2 90 4,078 3.5 10.5 17 3.5 154 4,345 6.0 11.2 18 5.5 234 4,256 9.1 11.0 19 8.8 370 4,228 14.5 10.9 20–24 7.8 1,715 21,893 66.9 56.4
Recency of immigration Born outside the 50 states
and District of Columbia Hispanic 24.7 504 2,042 19.7 5.3 Non-Hispanic 4.4 93 2,116 3.6 5.5
First generation2 Hispanic 8.8 317 3,618 12.4 9.3 Non-Hispanic 2.7 72 2,628 2.8 6.8
Second generation or higher2 Hispanic 8.6 219 2,541 8.6 6.5 Non-Hispanic 5.3 1,358 25,855 53.0 66.6
Disability With a disability3 14.4 200 1,390 7.8 3.6 Without a disability 6.3 2,362 37,410 92.2 96.4
See notes at end of table.

Tables
38
Table 6. Status dropout rates and number and distribution of dropouts of 16- through 24-year-olds, by selected characteristics: October 2012—Continued
Characteristic
Status dropout
rate (percent)
Number of status dropouts
(thousands) Population
(thousands)
Percent of all
dropouts Percent of population
Geographic region Northeast 6.7 471 7,033 18.4 18.1 Midwest 5.6 459 8,173 17.9 21.1 South 6.9 976 14,187 38.1 36.6 West 7.0 657 9,408 25.6 24.2
1 Respondents were able to identify themselves as being of Two or more races. The White, non-Hispanic; Black, non-Hispanic; Asian/Pacific Islander, non-Hispanic; and American Indian/Alaska Native, non-Hispanic categories consist of individuals who considered themselves to be one race and who did not identify as Hispanic. Non-Hispanics who identified themselves as multiracial are included in the “Two or more races, non-Hispanic” category. The Hispanic category consists of Hispanics of all races and racial combinations. 2 Individuals defined as “first generation” were born in the 50 states or the District of Columbia, but one or both of their parents were born outside the 50 states or the District of Columbia. Individuals defined as “second generation or higher” were born in the 50 states or the District of Columbia, as were both of their parents. 3 Individuals identified as having a disability reported at least one of the following: difficulty hearing, seeing even when wearing glasses, walking or climbing stairs, dressing or bathing, doing errands alone, concentrating, remembering, or making decisions. NOTE: The status dropout rate indicates the percentage of 16- through 24-year-olds who are not enrolled in high school and who lack a high school credential. High school credentials include high school diplomas and alternative credentials, such as a General Educational Development (GED) certificate. Detail may not sum to totals because of rounding. SOURCE: U.S. Department of Commerce, Census Bureau, Current Population Survey (CPS), October 2012.

Tables
39
Table 7.—Status dropout rates, number of status dropouts, and population of 16- through 24-year-olds: October 1972 through October 2012
Year1
Status dropout rate
(percent)
Number of status dropouts
(thousands) Population
(thousands)
1972 14.6 4,770 32,643 1973 14.1 4,716 33,430 1974 14.3 4,849 33,968 1975 13.9 4,824 34,700 1976 14.1 4,981 35,222
1977 14.1 5,031 35,658 1978 14.2 5,114 35,931 1979 14.6 5,265 36,131 1980 14.1 5,085 36,143 1981 13.9 5,143 36,945
1982 13.9 5,055 36,452 1983 13.7 4,905 35,884 1984 13.1 4,626 35,204 1985 12.6 4,324 34,382 1986 12.2 4,142 33,945
1987 12.6 4,230 33,452 1988 12.9 4,232 32,893 1989 12.6 4,038 32,007 1990 12.1 3,797 31,443 1991 12.5 3,881 31,171
1992 11.0 3,410 30,944 1993 11.0 3,396 30,845 1994 11.4 3,727 32,560 1995 12.0 3,876 32,379 1996 11.1 3,611 32,452
1997 11.0 3,624 32,960 1998 11.8 3,942 33,445 1999 11.2 3,829 34,173 2000 10.9 3,776 34,568 2001 10.7 3,774 35,195
2002 10.0 3,551 35,598 2003 9.9 3,552 36,017 2004 10.3 3,766 36,504 2005 9.4 3,458 36,761 2006 9.3 3,462 37,047 See notes at end of table.
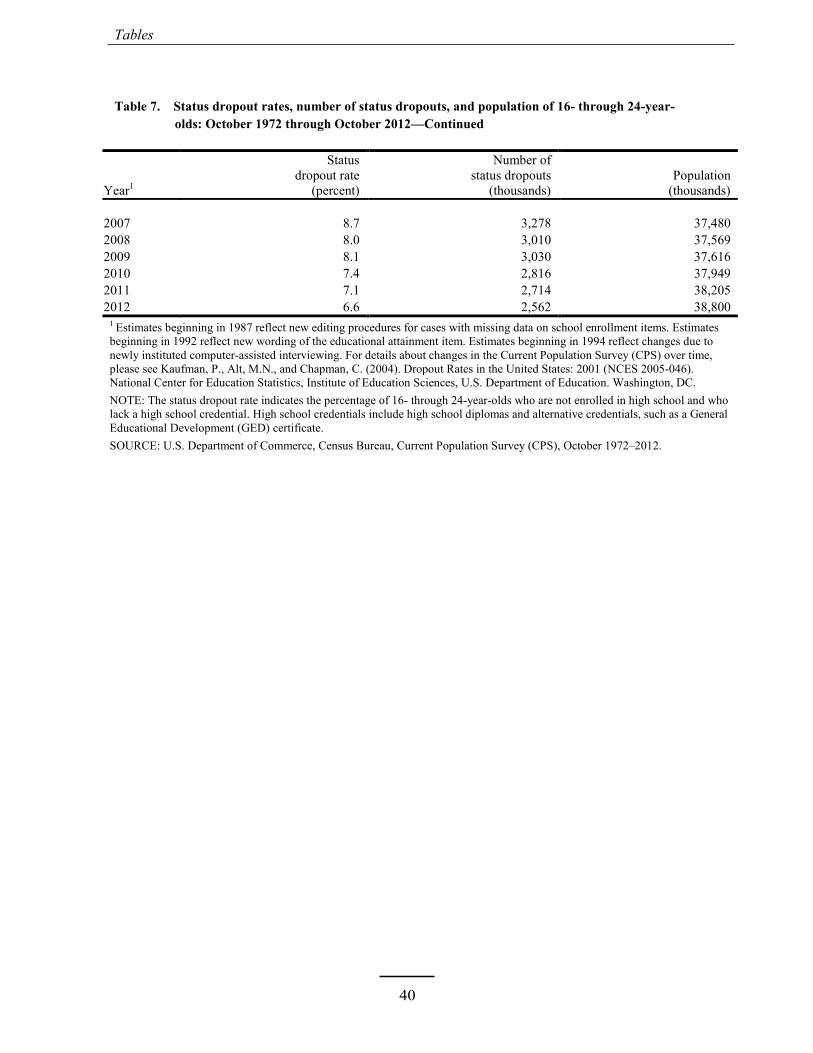
Tables
40
Table 7.—Status dropout rates, number of status dropouts, and population of 16- through 24-year-olds: October 1972 through October 2012—Continued
Year1
Status dropout rate
(percent)
Number of status dropouts
(thousands) Population
(thousands)
2007 8.7 3,278 37,480 2008 8.0 3,010 37,569 2009 8.1 3,030 37,616 2010 7.4 2,816 37,949 2011 7.1 2,714 38,205 2012 6.6 2,562 38,800
1 Estimates beginning in 1987 reflect new editing procedures for cases with missing data on school enrollment items. Estimates beginning in 1992 reflect new wording of the educational attainment item. Estimates beginning in 1994 reflect changes due to newly instituted computer-assisted interviewing. For details about changes in the Current Population Survey (CPS) over time, please see Kaufman, P., Alt, M.N., and Chapman, C. (2004). Dropout Rates in the United States: 2001 (NCES 2005-046). National Center for Education Statistics, Institute of Education Sciences, U.S. Department of Education. Washington, DC. NOTE: The status dropout rate indicates the percentage of 16- through 24-year-olds who are not enrolled in high school and who lack a high school credential. High school credentials include high school diplomas and alternative credentials, such as a General Educational Development (GED) certificate. SOURCE: U.S. Department of Commerce, Census Bureau, Current Population Survey (CPS), October 1972–2012.

Tables
41
Table 8.—Status dropout rates of 16- through 24-year-olds, by sex and race/ethnicity: October 1972 through October 2012—Continued
Year2 Total
(percent)
Sex (percent)
Race/ethnicity (percent)1
Male Female White, non-
Hispanic Black, non-
Hispanic Hispanic
1972 14.6 14.1 15.1 12.3 21.3 34.3 1973 14.1 13.7 14.5 11.6 22.2 33.5 1974 14.3 14.2 14.4 11.9 21.2 33.0 1975 13.9 13.3 14.5 11.4 22.9 29.2 1976 14.1 14.1 14.2 12.0 20.5 31.4
1977 14.1 14.5 13.8 11.9 19.8 33.0 1978 14.2 14.6 13.9 11.9 20.2 33.3 1979 14.6 15.0 14.2 12.0 21.1 33.8 1980 14.1 15.1 13.1 11.4 19.1 35.2 1981 13.9 15.1 12.8 11.4 18.4 33.2
1982 13.9 14.5 13.3 11.4 18.4 31.7 1983 13.7 14.9 12.5 11.2 18.0 31.6 1984 13.1 14.0 12.3 11.0 15.5 29.8 1985 12.6 13.4 11.8 10.4 15.2 27.6 1986 12.2 13.1 11.4 9.7 14.2 30.1
1987 12.6 13.2 12.1 10.4 14.1 28.6 1988 12.9 13.5 12.2 9.6 14.5 35.8 1989 12.6 13.6 11.7 9.4 13.9 33.0 1990 12.1 12.3 11.8 9.0 13.2 32.4 1991 12.5 13.0 11.9 8.9 13.6 35.3
1992 11.0 11.3 10.7 7.7 13.7 29.4 1993 11.0 11.2 10.9 7.9 13.6 27.5 1994 11.4 12.3 10.6 7.7 12.6 30.0 1995 12.0 12.2 11.7 8.6 12.1 30.0 1996 11.1 11.4 10.9 7.3 13.0 29.4
1997 11.0 11.9 10.1 7.6 13.4 25.3 1998 11.8 13.3 10.3 7.7 13.8 29.5 1999 11.2 11.9 10.5 7.3 12.6 28.6 2000 10.9 12.0 9.9 6.9 13.1 27.8 2001 10.7 12.2 9.3 7.3 10.9 27.0
2002 10.0 11.8 9.2 6.5 11.3 25.7 2003 9.9 11.3 8.4 6.3 10.9 23.5 2004 10.3 11.6 9.0 6.8 11.8 23.8 2005 9.4 10.8 8.0 6.0 10.4 22.4 2006 9.3 10.3 8.3 5.8 10.7 22.1 See notes at end of table.

Tables
42
Table 8.—Status dropout rates of 16- through 24-year-olds, by sex and race/ethnicity: October 1972 through October 2012
Year2 Total
(percent)
Sex (percent) Race/ethnicity (percent)1
Male Female White, non-
Hispanic Black, non-
Hispanic Hispanic
2007 8.7 9.8 7.7 5.3 8.4 21.4 2008 8.0 8.5 7.5 4.8 9.9 18.3 2009 8.1 9.1 7.0 5.2 9.3 17.6 2010 7.4 8.5 6.3 5.1 8.0 15.1 2011 7.1 7.7 6.5 5.0 7.3 13.6 2012 6.6 7.3 5.9 4.3 7.5 12.7
1 Beginning in 2003, respondents were able to identify themselves as being of Two or more races. The 2003 through 2012 White, non-Hispanic; and Black, non-Hispanic categories consist of individuals who considered themselves to be one race and who did not identify as Hispanic. The Hispanic category includes Hispanics of all races and racial combinations. Due to small sample sizes for some or all of the years shown in the table, Asians/Pacific Islanders, non-Hispanic and American Indians/Alaska Natives, non-Hispanic are included in the totals but not shown separately. The “Two or more races, non-Hispanic” category is also included in the total in 2003 through 2012 but not shown separately due to small sample size. 2 Estimates beginning in 1987 reflect new editing procedures for cases with missing data on school enrollment items. Estimates beginning in 1992 reflect new wording of the educational attainment item. Estimates beginning in 1994 reflect changes due to newly instituted computer-assisted interviewing. For details about changes in the Current Population Survey (CPS) over time, please see Kaufman, P., Alt, M.N., and Chapman, C. (2004). Dropout Rates in the United States: 2001 (NCES 2005-046). National Center for Education Statistics, Institute of Education Sciences, U.S. Department of Education. Washington, DC. NOTE: The status dropout rate indicates the percentage of 16- through 24-year-olds who are not enrolled in high school and who lack a high school credential. High school credentials include high school diplomas and alternative credentials, such as a General Educational Development (GED) certificate. Some estimates differ from those in previously published reports because of data updates. SOURCE: U.S. Department of Commerce, Census Bureau, Current Population Survey (CPS), October 1972–2012.

Tables
43
Table 9.—Number of status dropouts and status dropout rates of 16- through 24-year-olds in the institutionalized group quarters and noninstitutionalized group quarters and household population, by school and student characteristics: American Community Survey (ACS) 2012
School and student characteristic
Total status
dropout rate
(percent)
Institutionalized group quarters1
Noninstitutionalized group quarters and households2
Number of status dropouts
(thousands)
Status dropout
rate (percent)
Number of status dropouts
(thousands)
Status dropout
rate (percent)
Total3 7.0 173 35.4 2,611 6.6
Sex Male 8.2 160.1 36.8 1,509.9 7.6 Female 5.7 12.8 23.9 1,101.6 5.7
Race/ethnicity White, non-Hispanic 4.7 39.1 25.9 1,004.1 4.5 Black, non-Hispanic 9.0 80.3 41.1 441.3 7.9 Hispanic 12.8 47.6 40.9 1,007.4 12.4 Asian, non-Hispanic 2.6 ‡ 17.5 ! 48.6 2.6 Native Hawaiian/Pacific
Islander, non-Hispanic 9.1 ‡ 39.8 ! 6.3 8.8 American Indian/Alaska
Native, non-Hispanic 12.8 2.0 31.4 37.4 12.4 Two or more races,
non-Hispanic 5.6 2.9 19.0 60.6 5.5
Race/ethnicity by sex
Male 8.2 160.1 36.8 1,509.9 7.6 White, non-Hispanic 5.4 34.2 26.7 577.2 5.1 Black, non-Hispanic 10.9 75.4 42.0 243.1 8.9 Hispanic 15.0 45.1 42.2 600.3 14.3 Asian, non-Hispanic 2.8 ‡ 19.9 ! 25.9 2.7 Native Hawaiian/Pacific
Islander, non-Hispanic 10.0 ‡ ‡ 3.7 9.5 American Indian/Alaska
Native, non-Hispanic 14.8 1.9 35.2 21.4 14.0 Two or more races,
non-Hispanic 6.7 2.7 22.0 34.2 6.3
Female 5.7 12.8 23.9 1,101.6 5.7 White, non-Hispanic 4.0 5.0 21.4 426.9 3.9 Black, non-Hispanic 7.0 4.9 31.0 198.2 6.9 Hispanic 10.4 2.5 26.1 407.2 10.4 Asian, non-Hispanic 2.4 # # 22.7 2.4 Native Hawaiian/Pacific
Islander, non-Hispanic 8.0 ! # # 2.6 ! 8.0 ! American Indian/Alaska
Native, non-Hispanic 10.8 ‡ ‡ 16.1 10.8 Two or more races,
non-Hispanic 4.7 ‡ ‡ 26.4 4.6 See notes at end of table.

Tables
44
Table 9. Number of status dropouts and status dropout rates of 16- through 24-year-olds in the institutionalized group quarters and noninstitutionalized group quarters and household population, by school and student characteristics: American Community Survey (ACS) 2012—Continued
School and student characteristic
Total status
dropout rate
(percent)
Institutionalized group quarters1
Noninstitutionalized group quarters and households2
Number of status dropouts (thousands)
Status dropout
rate (percent)
Number of status dropouts (thousands)
Status dropout
rate (percent)
Age 16 2.1 3.3 10.2 83.0 2.0 17 3.3 4.5 13.1 133.6 3.2 18 5.4 12.2 32.1 235.6 5.2 19 6.8 19.4 42.7 273.8 6.4 20–24 9.0 133.5 39.4 1,885.6 8.5
Region Northeast 5.6 23.7 30.7 370.0 5.4 Midwest 6.0 30.3 31.6 479.8 5.7 South 7.8 83.4 39.1 1,076.3 7.4 West 7.6 35.5 34.8 685.3 7.3
# Rounds to zero. ! Interpret with caution. The standard error of the estimate is equal to 30 percent or more of the estimate’s value.‡ Reporting standards not met (Either there are too few cases or the coefficient of variation (CV) is 50 percent or greater). 1 Institutionalized group quarters include adult and juvenile correctional facilities, nursing facilities, and other health care facilities. 2 Noninstitutionalized group quarters include college and university housing, military quarters, facilities for workers and religious groups, and temporary shelters for the homeless. Among those counted in noninstitutionalized group quarters in the ACS, only the residents of military barracks are not included in the civilian noninstitutionalized population in the Current Population Survey. 3 Total includes other race/ethnicity categories not separately shown. NOTE: This table uses a different data source than tables 6, 7, and 8; therefore, total status dropout rate estimates are not directly comparable to the 2012 estimates in tables 6, 7, and 8. SOURCE: U.S. Department of Commerce, Census Bureau, American Community Survey (ACS), 2012.

Tables
45
Table 10.—Status completion rates, and number and distribution of completers ages 18–24 not currently enrolled in high school or below, by selected characteristics: October 2012
Characteristic
Completion rate
(percent)
Number of completers
(thousands) Population
(thousands)
Percent of all
completers Percent of population
Total 91.3 25,739 28,185 100.0 100.0
Sex Male 90.3 12,695 14,054 49.3 49.9 Female 92.3 13,044 14,132 50.7 50.1
Race/ethnicity1 White, non-Hispanic 94.6 15,170 16,035 58.9 56.9 Black, non-Hispanic 90.0 3,496 3,884 13.6 13.8 Hispanic 82.8 4,862 5,874 18.9 20.8 Native Hawaiian/Pacific Islander,
non-Hispanic 94.9 1,394 1,468 5.4 5.2 American Indian/Alaska Native,
non-Hispanic 79.0 201 254 0.8 0.9 Two or more races, non-Hispanic 91.9 616 670 2.4 2.4
Age 18–19 89.9 5,976 6,644 23.2 23.6 20–21 92.8 8,024 8,643 31.2 30.7 22–24 91.0 11,738 12,897 45.6 45.8
Recency of immigration Born outside the 50 states
and District of Columbia Hispanic 69.3 1,110 1,602 4.3 5.7 Non-Hispanic 94.0 1,524 1,621 5.9 5.7
First generation2 Hispanic 87.5 2,203 2,518 8.6 8.9 Non-Hispanic 95.7 1,789 1,869 6.9 6.6
Second generation or higher2 Hispanic 88.3 1,549 1,754 6.0 6.2 Non-Hispanic 93.3 17,564 18,821 68.2 66.8
Disability With a disability3 81.5 803 985 3.1 3.5 Without a disability 91.7 24,936 27,200 96.9 96.5
See notes at end of table.

Tables
46
Table 10.—Status completion rates, and number and distribution of completers ages 18–24 not currently enrolled in high school or below, by selected characteristics: October 2012—Continued
Characteristic
Completion rate
(percent)
Number of completers
(thousands) Population
(thousands)
Percent of all
completers Percent of population
Geographic region Northeast 91.3 4,754 5,205 18.5 18.5 Midwest 92.6 5,453 5,887 21.2 20.9 South 91.1 9,283 10,187 36.1 36.1 West 90.5 6,248 6,906 24.3 24.5
1 Respondents were able to identify themselves as being of Two or more races. The White, non-Hispanic; Black, non-Hispanic; Asian/Pacific Islander, non-Hispanic; and American Indian/Alaska Native, non-Hispanic categories consist of individuals who considered themselves to be one race and who did not identify as Hispanic. Non-Hispanics who identified themselves as multiracial are included in the “Two or more races, non-Hispanic” category. The Hispanic category consists of Hispanics of all races and racial combinations. 2 Individuals defined as “first generation” were born in the 50 states or the District of Columbia, but one or both of their parents were born outside the 50 states or the District of Columbia. Individuals defined as “second generation or higher” were born in the 50 states or the District of Columbia, as were both of their parents. 3 Individuals identified as having a disability reported at least one of the following: difficulty hearing, seeing even when wearing glasses, walking or climbing stairs, dressing or bathing, doing errands alone, concentrating, remembering, or making decisions. NOTE: Status completion rates measure the percentage of 18- through 24-year-olds who are not enrolled in high school and who also hold a high school diploma or alternative credential, such as a General Educational Development (GED) certificate. Excludes those enrolled in high school or a lower education level. Detail may not sum to totals because of rounding. SOURCE: U.S. Department of Commerce, Census Bureau, Current Population Survey (CPS), October 2012.

Tables
47
Table 11. Status completion rates, number of completers, and population of 18- through 24-year-olds not currently enrolled in high school or below: October 1972 through October 2012
Year1
Completion rate
(percent)
Number of completers
(thousands) Population
(thousands)
1972 82.8 19,618 23,686 1973 83.7 20,377 24,349 1974 83.6 20,724 24,794 1975 83.8 21,326 25,436 1976 83.5 21,677 25,953
1977 83.6 22,008 26,321 1978 83.6 22,308 26,697 1979 83.1 22,421 26,982 1980 83.9 22,746 27,122 1981 83.8 23,342 27,863
1982 83.8 23,290 27,790 1983 83.9 22,988 27,399 1984 84.7 22,871 27,014 1985 85.4 22,349 26,168 1986 85.5 21,766 25,453
1987 84.7 21,071 24,869 1988 84.5 20,838 24,650 1989 84.7 20,420 24,102 1990 85.6 20,269 23,689 1991 84.9 19,831 23,369
1992 86.4 19,874 23,004 1993 86.2 19,682 22,842 1994 85.8 20,539 23,946 1995 85.0 20,051 23,595 1996 86.2 20,074 23,278
1997 85.9 20,241 23,569 1998 84.8 20,451 24,113 1999 85.9 21,091 24,540 2000 86.5 21,743 25,138 2001 86.5 22,084 25,543
2002 87.2 22,444 25,725 2003 87.1 22,508 25,831 2004 86.8 22,991 26,476 2005 87.6 23,010 26,270 2006 87.8 23,331 26,568 See notes at end of table.

Tables
48
Table 11. Status completion rates, number of completers, and population of 18- through 24-year-olds not currently enrolled in high school or below: October 1972 through October 2012—Continued
Year1
Completion rate
(percent)
Number of completers
(thousands) Population
(thousands)
2007 89.0 24,100 27,086 2008 89.9 24,518 27,270 2009 89.8 24,579 27,380 2010 90.4 25,146 27,814 2011 90.8 25,361 27,916 2012 91.3 25,739 28,185 1 Estimates beginning in 1987 reflect new editing procedures for cases with missing data on school enrollment items. Estimates beginning in 1992 reflect new wording of the educational attainment item. Estimates beginning in 1994 reflect changes due to newly instituted computer-assisted interviewing. For details about changes in the Current Population Survey (CPS) over time, please see Kaufman, P., Alt, M.N., and Chapman, C. (2004). Dropout Rates in the United States: 2001 (NCES 2005-046). National Center for Education Statistics, Institute of Education Sciences, U.S. Department of Education. Washington, DC. NOTE: Status completion rates measure the percentage of 18- through 24-year-olds who are not enrolled in high school and who also hold a high school diploma or alternative credential, such as a General Educational Development (GED) certificate. Excludes those enrolled in high school or a lower education level.
SOURCE: U.S. Department of Commerce, Census Bureau, Current Population Survey (CPS), October 1972–2012.

Tables
49
Table 12. Status completion rates of 18- through 24-year-olds not currently enrolled in high school or below, by sex and race/ethnicity: October 1972 through October 2012
Year2 Total
(percent)
Sex (percent) Race/ethnicity (percent)1
Male Female White, non-
Hispanic Black, non-
Hispanic Hispanic
1972 82.8 83.0 82.7 86.0 72.1 56.2 1973 83.7 84.0 83.4 87.0 71.6 58.7 1974 83.6 83.4 83.8 86.7 72.9 60.1 1975 83.8 84.1 83.6 87.2 70.2 62.2 1976 83.5 83.0 84.0 86.4 73.5 60.3
1977 83.6 82.8 84.4 86.7 73.9 58.6 1978 83.6 82.8 84.2 86.9 73.4 58.8 1979 83.1 82.1 84.0 86.5 72.6 58.5 1980 83.9 82.3 85.3 87.5 75.2 57.1 1981 83.8 82.0 85.4 87.1 76.7 59.1
1982 83.8 82.7 84.9 87.0 76.4 60.9 1983 83.9 82.1 85.6 87.4 76.8 59.4 1984 84.7 83.3 85.9 87.5 80.3 63.7 1985 85.4 84.0 86.7 88.2 81.0 66.6 1986 85.5 84.2 86.7 88.8 81.8 63.5
1987 84.7 83.6 85.8 87.7 81.9 65.1 1988 84.5 83.2 85.8 88.6 80.9 58.2 1989 84.7 83.2 86.2 89.0 81.9 59.4 1990 85.6 85.1 86.0 89.6 83.2 59.1 1991 84.9 83.8 85.9 89.4 82.5 56.5
1992 86.4 85.3 87.4 90.7 82.0 62.1 1993 86.2 85.4 86.9 90.1 81.9 64.4 1994 85.8 84.5 87.0 90.7 83.3 61.8 1995 85.0 84.3 85.7 89.5 84.1 62.6 1996 86.2 85.7 86.8 91.5 83.0 61.9
1997 85.9 84.6 87.2 90.5 82.0 66.7 1998 84.8 82.6 87.0 90.2 81.4 62.8 1999 85.9 84.8 87.1 91.2 83.5 63.4 2000 86.5 84.9 88.1 91.8 83.7 64.1 2001 86.5 84.6 88.3 91.0 85.6 65.7
2002 87.2 84.8 88.8 91.8 84.7 67.3 2003 87.1 85.1 89.2 91.9 85.0 69.2 2004 86.8 84.9 88.8 91.7 83.4 69.8 2005 87.6 85.4 89.8 92.3 85.9 70.2 2006 87.8 86.5 89.1 92.6 84.8 70.9 See notes at end of table.

Tables
50
Table 12. Status completion rates of 18- through 24-year-olds not currently enrolled in high school or below, by sex and race/ethnicity: October 1972 through October 2012—Continued
Year2 Total
(percent)
Sex (percent) Race/ethnicity (percent)1
Male Female White, non-
Hispanic Black, non-
Hispanic Hispanic
2007 89.0 87.4 90.6 93.5 88.8 72.7 2008 89.9 89.3 90.5 94.2 86.9 75.5 2009 89.8 88.3 91.2 93.8 87.1 76.8 2010 90.4 89.2 91.6 93.7 89.2 79.4 2011 90.8 89.9 91.8 93.8 90.1 82.2 2012 91.3 90.3 92.3 94.6 90.0 82.8
1 Beginning in 2003, respondents were able to identify themselves as being of Two or more races. The 2003 through 2012 White, non-Hispanic; and Black, non-Hispanic categories consist of individuals who considered themselves to be one race and who did not identify themselves as Hispanic. The Hispanic category includes Hispanics of all races and racial combinations. Due to small sample sizes for some or all of the years shown in the table, Asians/Pacific Islanders, non-Hispanic and American Indians/Alaska Natives, non-Hispanic are included in the totals but not shown separately. The “Two or more races, non-Hispanic” category is also included in the total in 2003 through 2012 but not shown separately due to small sample size. 2 Estimates beginning in 1987 reflect new editing procedures for cases with missing data on school enrollment items. Estimates beginning in 1992 reflect new wording of the educational attainment item. Estimates beginning in 1994 reflect changes due to newly instituted computer-assisted interviewing. For details about changes in the Current Population Survey (CPS) over time, please see Kaufman, P., Alt, M.N., and Chapman, C. (2004). Dropout Rates in the United States: 2001 (NCES 2005-046). National Center for Education Statistics, Institute of Education Sciences, U.S. Department of Education. Washington, DC. NOTE: Status completion rates measure the percentage of 18- through 24-year-olds who are not enrolled in high school and who also hold a high school diploma or alternative credential, such as a General Educational Development (GED) certificate. Excludes those enrolled in high school or a lower education level. Some estimates differ from those in previously published reports because of data updates. SOURCE: U.S. Department of Commerce, Census Bureau, Current Population Survey (CPS), October 1972–2012.

Tables
51
Table 13. Adjusted cohort graduation rates of public high school students and change in rates, by state: School years 2010–11 through 2011–12
State
Adjusted cohort graduation rate (percent)
2010–11 2011–12
Reporting states1 79 80
Alabama 72 75 Alaska 68 70 Arizona 78 76 Arkansas 81 84 California 76 78
Colorado 74 75 Connecticut 83 85 Delaware 78 80 District of Columbia 59 59 Florida 71 75
Georgia 67 70 Hawaii 80 82 Idaho2 — — Illinois 84 82 Indiana 86 86
Iowa 88 89 Kansas 83 85 Kentucky2 — — Louisiana 71 72 Maine 84 85
Maryland 83 84 Massachusetts 83 85 Michigan 74 76 Minnesota 77 78 Mississippi 75 75
Missouri 81 86 Montana 82 84 Nebraska 86 88 Nevada 62 63 New Hampshire 86 86
New Jersey 83 86 New Mexico 63 70 New York 77 77 North Carolina 78 80 North Dakota 86 87 See notes at end of table.

Tables
52
Table 13. Adjusted cohort graduation rates of public high school students and change in rates, by state: School years 2010–11 through 2011–12—Continued
State
Adjusted cohort graduation rate (percent)
2010–11 2011–12
Ohio 80 81 Oklahoma2 — — Oregon 68 68 Pennsylvania 83 84 Rhode Island 77 77
South Carolina 74 75 South Dakota 83 83 Tennessee 86 87 Texas 86 88 Utah 76 80
Vermont 87 88 Virginia 82 83 Washington 76 77 West Virginia 78 79 Wisconsin 87 88 Wyoming 80 79
— Not available. 1The United States 4-year ACGR was estimated using both the reported 4-year ACGR data from 47 states and the District of Columbia and using imputed data for Idaho, Kentucky, and Oklahoma. The Bureau of Indian Education and Puerto Rico were not included in the United States 4-year ACGR estimate. 2The Department of Education’s Office of Elementary and Secondary Education approved a timeline extension for these states to begin reporting 4-year ACGR data, resulting in the 4-year ACGR not being available for these states in SY 2011–12. NOTE: The adjusted cohort graduation rate indicates the proportion of public high school freshmen who graduate with a regular diploma 4 years after starting 9th grade. SOURCE: Stetser, M.C., and Stillwell, R. (2014). Public High School Four-Year On-Time Graduation Rates and Event Dropout Rates: School Years 2010–11 and 2011–12. First Look (NCES 2014-391), table 2.

THIS PAGE INTENTIONALLY LEFT BLANK

A-1
Appendix A—Technical Notes
Table A-1 summarizes the different rates reported in this compendium. Immediately after the table, additional details about the sources of data and computational approaches to generating the different rates are provided.
Table A-1. Summary table of high school dropout, completion, and graduation rates
Rate
Current statistic
(year)
Age group/ grades Description Purpose
Alternative credential
status Data
Sources
Event dropout rate 3.4 percent (2012)
15–24 Percentage of high school
students who have dropped out of grades 10–12 in the
past year
Indicator of the annual rate at
which U.S. high school students
are leaving school without
receiving a high school diploma
Students who get an alternative credential
do not count as dropouts.
Current Population
Survey (CPS)
Event dropout rate (public school students)
3.3 percent (2011–12)
Grades 9–12
Percentage of public high
school students who have
dropped out of grades 9–12 in a
given year
State-level indicator of the
annual rate at which public high
school students are leaving school without receiving
a high school diploma
Students who get a state- recognized alternative
credential do not count
as dropouts.
Common Core of Data
(CCD)
Status dropout rate 6.6 percent (2012)
16–24 Percentage of young adults
whoare not enrolled in high school and who
do not have a high school
credential
Indicator of the percentage of
young adults who lack a
high school credential
Young adults who have earned an
alternative credential do not count as
dropouts.
Current Population
Survey (CPS)
Status completion rate
91.3 percent (2012)
18–24 Percentage of young adults
who have left high school and who hold a high
school credential
Indicator of the percentage of
young adults who have a basic high
school education
People who have earned an
alternative credential count
as completers.
Current Population
Survey (CPS)
See notes at end of table.

Appendix A—Technical Notes
A-2
Table A-1. Summary table of high school dropout, completion, and graduation rates—Continued
Rate Current
statistic (year)
Age group/ grades Description Purpose
Alternative credential
status Data
Sources
Adjusted cohort graduation rate (public school students)
80 percent (2011–12)
Grades 9–12
Percentage of public high
school students who graduate with a regular
diploma 4 years after starting
9th grade
Indicator of on-time grad-
uation rate from public schools
High school alternative
credentials are not counted as “graduation.”
EdFacts Collection
System
SOURCE: Stetser, M.C., and Stillwell, R. (2013). Public High School Four-Year On-Time Graduation Rates and Event Dropout Rates: School Years 2010–11 and 2011–12. First Look. (NCES 2014-391), tables 1, 2, 3, 4, and 5. U.S. Department of Commerce, Census Bureau, Current Population Survey (CPS), October 2012.
Common Core of Data
The Common Core of Data (CCD) is NCES’s primary database on public elementary and secondary education in the United States. It is a comprehensive, annual, national statistical database of all public elementary and secondary schools and school districts containing data designed to be comparable across all states. This database can be used to select samples for other NCES surveys and provide basic information and descriptive statistics on public elementary and secondary schools and schooling in general.
The CCD collects statistical information annually from approximately 100,000 public elementary and secondary schools and approximately 18,000 public school districts (including supervisory unions and regional education service agencies) in the 50 states, the District of Columbia, Department of Defense (DoD) dependents schools, the Bureau of Indian Education, Puerto Rico, American Samoa, Guam, the Northern Mariana Islands, and the U.S. Virgin Islands. Three categories of information are collected in the CCD survey: general descriptive information on schools and school districts; data on students and staff; and fiscal data. The general descriptive information includes name, address, phone number, and type of locale; the data on students and staff include selected demographic characteristics; and the fiscal data pertain to revenues and current expenditures.
The EDFacts data collection system is the primary collection tool for the CCD. Coordinators from state education agencies (SEAs) submit the CCD data at different levels (school, agency, and state) to the EDFacts collection system. Prior to submitting CCD files to EDFacts, SEAs must collect and compile information from their respective local education agencies (LEAs) through established administrative records systems within their state or jurisdiction.
Once SEAs have completed their submissions, the CCD survey staff analyzes and verifies the data for quality assurance. Even though the CCD is a universe collection and thus not subject to sampling errors, nonsampling errors can occur. The two potential sources of nonsampling errors

Appendix A—Technical Notes
A-3
are nonresponse and inaccurate reporting. NCES attempts to minimize nonsampling errors through the use of annual training of SEA coordinators, extensive quality reviews, and survey editing procedures. In addition, each year, SEAs are given the opportunity to revise their state-level aggregates from the previous survey cycle.
NCES uses data from the CCD to calculate event dropout rates and averaged freshman graduation rates (AFGRs). The event dropout rate uses CCD enrollment data collected through EDFacts data group 39 within file 052 and CCD dropout counts collected through EDFacts data group 326 within file 032. The AFGR also uses CCD enrollment data as well as CCD graduate counts collected through EDFacts data group 306 within file 040. For more information about these data groups, please see file specifications 052, 032, and 040 for the relevant school years, available at http://www2.ed.gov/about/inits/ed/edfacts/file-specifications.html.
Defining and Calculating Event Dropout Rates Using the CCD
In calculating the event dropout rate, high school dropouts for a given school year include students who were
• enrolled in school at some time during the school year;• expected to be in membership the following school year; and• not enrolled in grades 9–12 by October 1 of the following year.
Dropouts do not include students who were
• reported as a dropout the year before;• among students who graduated high school by completing the state graduation
requirements, receiving a high school equivalency credential without dropping out ofschool, or completing a state or district-approved educational program;
• confirmed as having transferred to another public school district, private school, or stateor district-approved educational program;
• temporarily absent due to suspension or illness; or• deceased.
The high school event dropout rate is the number of dropouts divided by the number of students enrolled in grades 9–12 at the beginning of that school year. In cases where LEAs or SEAs report students and dropouts in an ungraded category, the National Center for Education Statistics (NCES) prorates ungraded students and dropouts into grades in order to calculate an aggregated dropout rate for 9th- through 12th-grade students.
Not all states follow a fall-to-fall school year. The Common Core of Data (CCD) dropout count is based on an October–September school year in which a student’s dropout status is determined at the beginning of the year. Some states follow a July–June calendar in

Appendix A—Technical Notes
A-4
which a student’s dropout status is determined at the end of the school year. Dropout rates in states that follow an alternative reporting calendar are comparable with rates for states that follow the October–September calendar (Winglee et al. 2000) and are included in the CCD data files.
The CCD definition attributes dropouts to the grade and school year for which they do not meet their obligation. Students who complete 1 school year but fail to enroll in the next school year are counted as dropouts from the school year and grade for which they failed to return. For example, a student completing 10th grade in SY 2008–09 who does not enroll the next year would be reported as an 11th grade dropout for SY 2009–10.
Students who leave high school to enroll in high school equivalency preparation programs are reported as dropouts, unless the district tracks these students and reports as dropouts those who fail to complete the program. If a high school equivalency program is an accepted high school credential in the state’s Data Usage and Availability, students who have received a high school equivalency by October 1 are not considered dropouts, regardless of where they prepared for the test.
Defining and Calculating Averaged Freshman Graduation Rates Using the CCD
The AFGR provides an estimate of the percentage of high school students who graduate within 4 years of first starting 9th grade. The rate uses aggregate student enrollment data to estimate the size of an incoming freshman class and counts of the number of diplomas awarded 4 years later. The incoming freshman class size is estimated by summing the enrollment in 8th grade in year one, 9th grade for the next year, and 10th grade for the year after, and then dividing by three. The averaging has a smoothing effect that helps compensate for prior year retentions in the 8th-, 9th-, and 10th-grade enrollment counts. Although not as accurate as a 4-year graduation rate computed from a cohort of students using student record data like the ACGR, the AFGR can be computed with widely available cross-sectional data. Based on a technical review and analysis of several 4-year graduation rates, the AFGR was selected as the most accurate indicator, excepting only the ACGR, from a number of alternative estimates that can be calculated using available cross-sectional data (Seastrom et al. 2006a, 2006b).

Appendix A—Technical Notes
A-5
The following formula provides an example of how the AFGR would be calculated for the graduating class of 2012:1
Number of regular high school diplomas awarded in SY 2010–12
(The number or 8th-graders enrolled in the fall 2007 plus the number of 9th-graders enrolled in the fall 2008 plus the number
of 10th-graders enrolled in the fall of 2009) divided by 3
The AFGR was intended to address a lack of regular information about timeliness of graduating from public high schools. Precise measures of how long it takes for a student to graduate high school require data sources that follow the progress of each individual student over time. Until recently, most states lacked data systems that captured individual public-school student-level data over time. The AFGR was developed to utilize data that were available across the 50 states on a regular basis to provide a general and comparable measure of the percentage of public high school students who graduate with a regular high school diploma within 4 years of first entering 9th grade. The AFGR is useful for longitudinal analysis of graduation rates since the data used to generate the AFGR are available going back in time to at least the 1960s.
State and local policies can affect the numbers of regular high school diploma recipients (REGDIP) reported. There are differences in what a regular high school diploma represents across states. EDFacts file specifications for both annual and cohort REGDIP define a regular diploma as the high school completion credential awarded to students who meet or exceed coursework and performance standards set by the state or other approving authority. While this language provides a definition of common intent, the requirements required to earn a high school diploma varies among states. States therefore have differing requirements for REGDIP in terms of required attendance, coursework requirements (Carnegie Units), and exit exams.
EDFacts
EDFacts is a centralized data collection through which SEAs submit K-12 education data to the U.S. Department of Education (ED). All data in EDFacts are organized into “data groups” and reported to ED using defined file specifications. Depending on the data group, SEAs may submit aggregate counts for the state as a whole, or detailed counts for individual schools or school districts. EDFacts does not collect student-level records. The entities that are required to report EDFacts data vary by data group, but may include the 50 states, District of Columbia, Department of Defense (DoD) dependent schools, the Bureau of Indian Education, Puerto Rico, American Samoa, Guam, the Northern Mariana Islands, and the U.S. Virgin islands. More information about EDFacts file specifications and data groups can be found at www.ed.gov/edfacts.
1 Eighth-, 9th-, and 10th-grade enrollment was adjusted to include a prorated number of ungraded students using the ratio of the specified grade enrollment to the total graded enrollment. The same ratio was used to prorate ungraded students for the disaggregated enrollment counts (race/ethnicity and gender).

Appendix A—Technical Notes
A-6
EDFacts is a universe collection and is not subject to sampling error, but nonsampling errors such as nonresponse and inaccurate reporting may occur. The U.S. Department of Education attempts to minimize nonsampling errors by training data submission coordinators and reviewing the quality of state data submissions. However, anomalies may still be present in the data.
Differences in state data collection systems may limit the comparability of EDFacts data across states and across time. To build EDFacts files, SEAs rely on data that were reported by their schools and school districts. The systems used to collect these data are evolving rapidly and differ from state to state.
In some cases EDFacts data may not align with data reported on SEA websites. States may update their websites on different schedules than they use to report to ED. Further, ED may use methods to protect the privacy of individuals represented within the data that could be different from the methods used by an individual state.
EDFacts Four-Year adjusted cohort graduation rate (ACGR) data are collected in data groups 695 and 696 within files 150 and 151, respectively. EDFacts collects these data groups on behalf of the Office of Elementary and Secondary Education. For more information about these data groups, please see file specifications 150 and 151 for the relevant school year, available at http://www2.ed.gov/about/inits/ed/edfacts/file-specifications.html.
Defining and Calculating Adjusted Cohort Graduation Rates
The ACGR is calculated based on the number of students who graduate in 4 years or less with a regular high school diploma divided by the number of students who form the adjusted cohort for the graduating class. In order to calculate and report the 4-year ACGR states must follow the progress of each individual 9–12 grade student over time and maintain documentation of students who enter or leave schools or districts within their state. From the beginning of ninth grade (or the earliest high school grade) students who are entering that grade for the first time form a cohort that is “adjusted” by adding any students who subsequently transfer into the cohort from another state and subtracting any students who subsequently transfer out, emigrate to another country, or die. The following formula provides an example of how the 4-year adjusted cohort
The ACGR rate for the 2011–12 class is formulated as follows:
Number of cohort members who earned a regular high school diploma by the end of SY 2011–12
Number of first-time 9th-graders in fall 2008 (starting cohort) plus students who transferred in, minus students who transferred out, emigrated, or died
during school years 2008–09, 2009–10, 2010–11, and 2011–12

Appendix A—Technical Notes
A-7
SEAs report ACGR data for each school, LEA, and for the state total cohort rate. The methodology of the ACGR, as it was designed, allows for the movement or transfer of students from one school to another, while only counting each student once. A student may change schools and thus exit their prior school’s cohort and enter their new school’s cohort, but stay in the same district and state cohort. Similarly, a student who changes districts within a state will move to the new school and district for the ACGR, but will stay in the state’s cohort. In order to subtract or transfer a student out of a cohort, the school or LEA must have official written documentation that the student enrolled in another school or in an educational program that culminates in the award of a regular high school diploma.
Unless specified, the ACGR data in this report and the associated data files reflect the data as reported by each SEA. The ACGRs required under the current Title I regulations are more comparable across states than were graduation rates submitted by SEAs under prior regulations. However, there has been some variation in the way that individual states have interpreted and understood the methodology specified in the statute. Examples of ways the calculated ACGR may vary among states include
• how students are identified for inclusion in certain subgroups;
• how the beginning of the cohort is defined;
• whether summer school students are included; and
• the criteria of what constitutes a diploma that meet the regulatory definition of a regularhigh school diploma.2
Current Population Survey
The Current Population Survey (CPS) provides nationally representative data for the civilian, noninstitutionalized population of the United States. The survey is conducted in a sample of 50,000–60,000 households each month. Households are interviewed for four successive monthly interviews, are not interviewed for the next 8 months, and then are reinterviewed for the following 4 months. Typically, the first and the fifth interviews are conducted in person, with the remaining conducted via computer-assisted telephone interviewing. The sample frame is a complete list of dwelling-unit addresses at the time of the decennial Census updated by demolition and new construction listings. The population surveyed excludes members of the armed forces, inmates of correctional institutions, and patients in long-term medical or custodial facilities; it is referred to as the civilian, noninstitutionalized population. The household-level nonresponse rate was 9.6 percent in the 2012 October basic CPS, and the person-level nonresponse rate for the school enrollment supplement was an additional 9.2 percent. These
2 Under 34 C.F.R. § 200.19(b)(1)(iv) a regular high school diploma is defined as “the standard high school diploma that is awarded to students in the State and that is fully aligned with the State’s academic content standards or a higher diploma and does not include a high school equivalency credential, certificate of attendance, or any alternative award.”

Appendix A—Technical Notes
A-8
rates cannot be combined to derive an overall person-level response rate. For more information, please see Current Population Survey, October 2012: School Enrollment and Internet Use Supplement File (U.S. Department of Commerce 2013). An adult member of each household serves as the respondent for that household, supplying basic monthly data for each member of the household. In addition, in October of each year, supplementary questions regarding school enrollment are asked about eligible household members age 3 and older. Data are collected about individuals who attend or attended public schools and private schools, who were homeschooled, or who never attended school in the United States.
CPS data on educational attainment and enrollment status in the current year and prior year are used to identify dropouts and completers, and additional items in the CPS data are used to describe some of their basic characteristics. The CPS is the only source of national time series data on dropout and completion rates. However, because the CPS collects no information on school characteristics and experiences, its usefulness in addressing dropout and completion issues is primarily for providing insights on who drops out and who completes school. Sample sizes in the CPS collections do not support stable state-level estimates.
There are important differences in data collection procedures between the CPS and the CCD. First, the CCD collection includes only data for public schools, whereas the CPS countsinclude students who were enrolled in either public or private schools and some individuals whowere never enrolled in school in the United States. Second, the CCD collects data about studentsfrom a given state’s public school system. CPS data are based on where individuals currentlyreside, so the state of residence may differ from the state or country of earlier school attendance.Third, the CCD collection includes dropouts in grades 7–12, versus grades 10–12 in the CPS(although the CCD event rates are reported only for grades 9–12 in this report). Fourth, the CCDcollection is based on administrative records rather than on individual self-reports based onhousehold surveys, as in the CPS. Finally, data in the CCD are collected from the full universe ofpublic schools, whereas data in the CPS are collected from a sample of households, not the fulluniverse of households. As a result, CPS data have sampling errors associated with estimates,whereas CCD data do not. For more information on CPS sampling errors and how to interpretthem, see “Statistical Procedures for Analyzing CPS-Based Estimates” below.
Defining and Calculating Dropout and Completion Rates Using the CPS
Event Dropout Rates
The October Supplement to the CPS is the only national data source that currently can be used to estimate annual national dropout rates. As a measure of recent dropout experiences, the event dropout rate measures the proportion of students who dropped out over a 1-year interval.

Appendix A—Technical Notes
A-9
The numerator of the event dropout rate for 2012 is the number of persons ages 15–243
surveyed in October 2012 who were enrolled in grades 10–12 in October 2011, who were not enrolled in high school in October 2012, and who also did not complete high school (that is, had not received a high school diploma or an alternative credential such as a GED) between October 2011 and October 2012.
The denominator of the event dropout rate for 2012 is the sum of the dropouts (that is, the numerator) and all persons ages 15–24 who were attending grades 10–12 in October 2011, who were still enrolled in October 2012, or who graduated or completed high school between October 2011 and October 2012.
The dropout interval is defined to include the previous summer (in this case, the summer of 2012) and the previous school year (in this case, the 2011 school year), so that once a grade is completed, the student is then at risk of dropping out of the next grade. Given that the data collection is tied to each person’s enrollment status in October of 2 consecutive years, any student who drops out and returns within the 12-month period is not counted as a dropout.
Status Dropout Rates
The status dropout rate reflects the percentage of individuals who are dropouts, regardless of when they dropped out. The numerator of the status dropout rate for 2012 is the number of individuals ages 16–244 who, as of October 2012, had not completed high school and were not currently enrolled. The denominator is the total number of 16- through 24-year-olds in October 2012.
Status Completion Rates
The numerator of the high school status completion rate is the number of 18- through 24- year-olds5 who had received a high school diploma or an alternative credential such as a GED. The denominator is the number of 18- through 24-year-olds who are no longer in elementary or secondary school.
GED Credentials and the Status Completion Rate. Prior to 2000, editions of this series of high school completion and dropout reports presented estimates of overall status completion rates and estimates of the method of completion—graduation by diploma or completion
3 This age range was chosen in an effort to include as many students in grades 10-12 as possible. Because the rate is based on retrospective data, it is lagged 1 year, meaning that some 15-year-olds have turned age 16 by the time of the interview. 4 Age 16 was chosen as the lower age limit because, in some states, compulsory education is not required after age 16. Age 24 was chosen as the upper limit because it is the age at which free secondary education is no longer available and the age at which the average person who is going to obtain a GED does so. 5 Age 18 was chosen as the lower age limit because most diploma holders earn their diploma by this age. Age 24 was chosen as the upper limit because it is the age at which free secondary education is no longer available and the age at which the average person who is going to obtain a GED does so.

Appendix A—Technical Notes
A-10
through an alternative credential such as the GED—based on data obtained through CPS reporting. Because of changes in the CPS introduced in 2000, data on the method of completion were not comparable with prior-year CPS estimates and the method-of-completion data were no longer reported in NCES reports generally. Please see the discussion of the GED Testing Service data below for further information.
Data Considerations for the CPS
Over the last several decades, data collection procedures, items, and data preparation processes have changed in the CPS. Some of these changes were introduced to ensure that CPS estimates were comparable to those from decennial Census collections, some were introduced to reflect changes in the concepts under study, some were introduced to improve upon measures, and some were introduced to develop measures for new phenomena. The effects of the various changes have been studied to help ensure they do not disrupt trend data from the CPS. For a summary of the changes and studies of their effects, please see appendix C of Dropout Rates in the United States: 2001 (Kaufman, Alt, and Chapman 2004).
CPS data include weights to help make estimates from the data representative of the civilian, noninstitutionalized population in the United States. These weights are based on decennial Census data that are adjusted for births, deaths, immigration, emigration, etc., over time.
Imputation for Item Nonresponse in the CPS. For many key items in the October CPS, the U.S. Census Bureau imputes data for cases with missing data due to item nonresponse. However, the U.S. Census Bureau did not impute data regarding the method of high school completion before 1997. Special imputations were conducted for these items using a sequential hot deck procedure implemented through the PROC IMPUTE computer program developed by the American Institutes for Research. The hot-deck method assigns imputed values from survey respondents who answered an item (donors) to similar survey respondents who did not (recipients). Donors and recipients are matched based on various respondent characteristics. For the CPS data, three categories of age, two categories of race, two categories of sex, and two categories of citizenship were used to match donors with recipients for any given item. The procedure ensures that information from one donor is not used for a large number of recipients. This prevents bias from being introduced into the data set if all the recipients were imputed from one donor.
Age and Grade Ranges in CPS Estimates. The age and grade ranges used in the CPS measures of dropout rates are constrained by available data. Ideally, the estimates would be able to capture reliable estimates of children in grades as low as grade 9. However, the CPS asks the question about enrollment in the previous October only about individuals age 15 and older. Many 9th-graders are younger than age 15, so 10th grade was selected as the lower boundary of

Appendix A—Technical Notes
A-11
grade ranges in the event dropout rate.
Accuracy of CPS Estimates. CPS estimates in this report are derived from samples and are subject to two broad classes of error—sampling and nonsampling error. Sampling errors occur because the data are collected from a sample of a population rather than from the entire population. Estimates based on a sample will differ to some degree (dependent largely on sample size and coverage) from the values that would have been obtained from a universe survey using the same instruments, instructions, and procedures. Nonsampling errors come from a variety of sources and affect all types of surveys—universe as well as sample surveys. Examples of sources of nonsampling error include design, reporting, and processing errors and errors due to nonresponse. The effects of nonsampling errors are more difficult to evaluate than those that result from sampling variability. As much as possible, procedures are built into surveys in order to minimize nonsampling errors.
The standard error is a measure of the variability due to sampling when estimating a parameter. It indicates how much variance there is in the population of possible estimates of a parameter for a given sample size. Standard errors can be used as a measure of the precision expected from a particular sample. The probability that a sample statistic would differ from a population parameter by less than the standard error is about 68 percent. The chances that the difference would be less than 1.65 times the standard error are about 90 out of 100, and the chances that the difference would be less than 1.96 times the standard error are about 95 out of 100.
Prior to 2010, standard errors for percentages and numbers of persons based on CPS data were calculated using the following formulas:
Percentage:
where p = the percentage (0 < p < 100), N = the population on which the percentage is based, and b = the regression parameter, which is based on a generalized
variance formula and is associated with the characteristic.
Number of persons:
where x = the number of persons (i.e., dropouts), T = population in the category (e.g., Black 16- to 24-year-olds), and b = as above.

Appendix A—Technical Notes
A-12
For instance, in 2009, b is equal to 2,131 for the total and White population, 2,410 for the Black population, 2,744 for the Hispanic population, and 2,410 for the Asian/Pacific Islander population ages 14–24. For regional estimates, b is equal to 1.06 for the Northeast, 1.06 for the Midwest, 1.07 for the South, and 1.02 for the West.
CPS documentation explains the purpose and process for the generalized variance parameter:
Experience has shown that certain groups of estimates have similar relations between their variances and expected values. Modeling or generalizing may provide more stable variance estimates by taking advantage of these similarities. The generalized variance function is a simple model that expresses the variance as a function of the expected value of a survey estimate. The parameters of the generalized variance function are estimated using direct replicate variances. (Cahoon 2005, p. 7)
Beginning with the 2010 CPS data, standard errors were estimated using Fay’s Balanced Repeated Replication (Fay-BRR). While the generalized variance model provides a comprehensive calculation for standard errors, BRR better accounts for the two-stage stratified sampling process of the CPS; where the first stage of the CPS Primary Sampling Unit (PSU) is the geographic area, such as a metropolitan area, county, or group of counties. The second stage is households within these geographic areas. By its use alone, BRR estimates standard errors using half sample variance calculations; where half of the weights are multiplied by zero and the other half are multiplied by two. With Fay-BRR, estimates are provided through a perturbation factor, where ƒ (0 ≤ ƒ < 1). One half of the sample is weighted by a specified factor and the second half is multiplied by 2 minus that factor. For the CPS October supplement, 160 replicate weights were used in Fay-BRR calculations.
American Community Survey
The Census Bureau began fielding the American Community Survey (ACS) in 1996, testing various data collection and sampling options. Data necessary to generate national level statistics for households and individuals not living in group quarters became available with the 2000 collection. Full data collection for the U.S. population outside of group quarters began with the 2005 ACS collections. Beginning that year and continuing through the present, the survey has been mailed to approximately 250,000 residential addresses in the United States and Puerto Rico each month. The survey collects household and individual demographic, socioeconomic, and housing data comparable in content to the Long Form of the Decennial Census. Survey content is primarily determined by federal law, federal regulations, and court decisions. Monthly data are aggregated to provide annual estimates. Estimates for single months are not supported.

Appendix A—Technical Notes
A-13
In 2006, ACS sampling was expanded to include those living in group quarters. Annual results are available for areas with populations of 65,000 or more beginning with the 2006 data. Estimates for populations and areas with populations of 20,000 or more require 3 years of aggregated ACS data. The first such estimates became possible with the 2008 collections. Estimates for smaller populations and geographic areas the size of Census tracts require 5 years of aggregated ACS data and first became possible with the 2010 ACS collections. Note that estimates of the population not in group quarters can be generated beginning with the 2005 data for populations and areas with 65,000 or more members, and one year earlier for estimates requiring 3 and 5 years of data, respectively (U.S. Department of Commerce 2009).
Data Considerations for the ACS
Estimates in this report from the ACS focus on status dropout rates for the institutionalized population, and for the noninstitutionalized population. The rates are derived using the same approach as that used for estimating status dropout rates from the CPS data. ACS data include weights to make estimates from the data representative of households and individuals in the United States. These weights are based on annual population updates generated by the Census Bureau to be representative of the U.S. population as of July 1. Replicate weights are also developed for use in derivation of variance estimates that account for the complex sample design of the study. Data are fully imputed before release to the public and flags are available to identify which values have been imputed for which cases.
Statistical Procedures for Analyzing CPS- and ACS-Based Estimates
Because CPS and ACS data are collected from samples of the population, statistical tests are employed to measure differences between estimates to help ensure they are taking into account possible sampling error.6 The descriptive comparisons in this report were tested using Student’s t statistic. Differences between estimates are tested against the probability of a type I error,7 or significance level. The significance levels were determined by calculating the Student’s t values for the differences between each pair of means or proportions and comparing these with published tables of significance levels for two-tailed hypothesis testing.
Student’s t values may be computed to test the difference between percentages with the following formula:
6 The CCD and GEDTS data are universe data collections and therefore do not require statistical testing, such as that used for estimates from the CPS sample survey data. 7 A Type I error occurs when one concludes that a difference observed in a sample reflects a true difference in the population from which the sample was drawn, when no such difference is present. It is sometimes referred to as a “false positive.”

Appendix A—Technical Notes
A-14
where P1 and P2 are the estimates to be compared and se1 and se2 are their corresponding standard errors.
Several points should be considered when interpreting t statistics. First, comparisons based on large t statistics may appear to merit special attention. This can be misleading since the magnitude of the t statistic is related not only to the observed differences in means or proportions but also to the number of respondents in the specific categories used for comparison. Hence, a small difference compared across a large number of respondents would produce a large t statistic.
Second, there is a possibility that one can report a “false positive” or type I error. In the case of a t statistic, this false positive would result when a difference measured with a particular sample showed a statistically significant difference when there was no difference in the underlying population. Statistical tests are designed to control this type of error. These tests are set to different levels of tolerance or risk, known as alphas. The alpha level of .05 selected for findings in this report indicates that a difference of a certain magnitude or larger would be produced no more than 1 time out of 20 when there was no actual difference between the quantities in the underlying population. When p values are smaller than the .05 level, the null hypothesis that there is no difference between the two quantities is rejected. Finding no difference, however, does not necessarily imply that the values are the same or equivalent.
Third, the probability of a type I error increases with the number of comparisons being made. Bonferroni adjustments are sometimes used to correct for this problem. Bonferroni adjustments do this by reducing the alpha level for each individual test in proportion to the number of tests being done. However, while Bonferroni adjustments help avoid type I errors, they increase the chance of making type II errors. Type II errors occur when there actually is a difference present in a population, but a statistical test applied to estimates from a sample indicates that no difference exists. Prior to the 2001 report in this series, Bonferroni adjustments were employed. Because of changes in NCES reporting standards, Bonferroni adjustments are not employed in this report.
Regression analysis was used to test for trends across age groups and over time. Regression analysis assesses the degree to which one variable (the dependent variable) is related to one or more other variables (the independent variables). The estimation procedure most commonly used in regression analysis is ordinary least squares (OLS). When studying changes in rates over time, the rates were used as dependent measures in the regressions, with a variable representing time and a dummy variable controlling for changes in the educational attainment item in 1992 (= 0 for years 1972 to 1991, = 1 after 1992) used as independent variables. Significant and positive slope coefficients suggest that rates increased over time. Conversely, significant and negative coefficients suggest that rates decreased over time. Because of varying sample sizes over time, some of the estimates were less reliable than others (i.e., some years’ standard errors were larger than those for other years). In such cases, OLS estimation procedures do not apply, and it is necessary to modify the regression procedures to obtain unbiased regression parameters. This is

Appendix A—Technical Notes
A-15
accomplished by using weighted least squares regressions.8 Each variable in the analysis was transformed by dividing by the standard error of the relevant year’s rate. The new dependent variable was then regressed on the new time variable, a variable for 1 divided by the standard
error for the year’s rate, and the new editing-change dummy variable. All statements about trend changes in this report are statistically significant at the .05 level.
GED Testing Service
The GED Testing Service (GEDTS) collects data on individuals who take the GED exam each year and on individuals who pass the exam each year. These data are collected from test sites both in the United States and internationally. The GEDTS releases the data in aggregate form in annual statistical reports. The reports are organized to allow readers to differentiate between those individuals taking and passing the exam in the United States and those taking and passing the exam outside of the United States. Though GEDTS designs and administers the exams, many related policies are set by states and sometimes jurisdictions within a state. For example, determinations of who can take the exam, how much preparation is required, how and when the exam can be retaken, how much the exam costs, and the official name of the resulting credential is set by states and sometimes jurisdictions within a state (see http://www.gedtestingservice.com/testers/2014policypages for details).
Prior to 2000, NCES completion and dropout reports presented estimates of those holding alternative credentials, such as GEDs, directly from CPS data as part of the status completion rate. Examination of the changes in the CPS alternative credential items in the October 2000 and subsequent surveys has indicated that these estimates may not be reliable estimates of alternative high school completions.9 Therefore, CPS estimates of the method of alternative high school completion are no longer presented in NCES reports. Because GED recipients do have notably different life experiences than those with no high school credential and those with a regular high school diploma, the loss of information about alternative credential holders was an important measurement problem. In response, NCES developed an approach for using GEDTS to estimate how many young people in the civilian, noninstitutionalized population in a given age range had earned a GED by passing the GED exam. It is important to acknowledge here that Mishel and Roy (2006) simultaneously and independently developed a similar approach for research that they were conducting.
Table A-2 provides a summary of the data released by GEDTS on the number of people passing the exam each year and the age distribution of those passing the exam (American
8 For general discussion of weighted least squares analysis please see Gujarati, D. (1998). Basic Econometrics (2nd ed.). New York: McGraw Hill. 9 For a comparison of estimates from the CPS and the GED Testing Service of the number of 18- through 24-year-olds who have received a GED, see table A-1 in Laird, J., DeBell, M., Kienzl, G., and Chapman, C. (2007). Dropout Rates in the United States: 2005 (NCES 2007-059). National Center for Education Statistics, Institute of Education Sciences, U.S. Department of Education. Washington, DC.

Appendix A—Technical Notes
A-16
Council on Education, GED Testing Service 1991–2002, 2003–06, 2007, 2008, 2009, 2010, 2011, 2012). Data from GEDTS are provided for those in the general population for the 50 states and the District of Columbia, and separately for facilities that would not be included in the CPS sampling frame (referred to as state and federal contract facilities in the table title). For the U.S. population, GEDTS indicates that approximately 205,000 persons ages 18–24 passed the GED in 2012. The GED status rate indicates the percentage of individuals in a given age range who passed the GED exam irrespective of when they passed the exam.10 In order to derive the GED status rate, data from several GEDTS reports were combined. For 18- through 24-year-olds, this was done by adding the count of 18- through 24-year-olds whopassed the exam in 2012 to counts of people who were ages 18–24 in 2012, but who passedthe exam in earlier years. The number of 18- through 24-year-olds who passed the exam in2012 was added to the number of 17- through 23-year-olds who passed the exam in 2011.That sum was added to the number of 16- through 22-year-olds who passed the exam in2010, the number of 16- through 21-year-olds who passed the exam in 2009, the number of16- through 20-year-olds who passed the exam in 2008, the number of 16- through 19-year-olds who passed the exam in 2007, the number of 16- through 18-year-olds who passed theexam in 2006, the number of 16- and 17-year-olds who passed the exam in 2005, and thenumber of 16-year-olds who passed the exam in 2004. Sixteen-year-olds in 2004 would havebeen 24 in 2012. Based on this approach, approximately 1,618,000 persons ages 18 through24 held a GED in 2012.
Because the CPS-based status rates developed for this report focus on individuals in the civilian, noninstitutionalized population, adjustments were made to the GED count estimates. GED count data are reported by year the GED was earned, whereas the status rates reflect the experience of individuals over multiple-year periods. As such, individuals might have been part of the civilian, noninstitutionalized population when they earned a GED, and subsequently joined the military or the prison populations. Alternatively, individuals might have been in the military or in prison when they earned a GED and subsequently reentered the civilian, noninstitutionalized population. To account for both possibilities, information for those passing the exams in facilities that are not part of the CPS sampling frame were drawn from GEDTS reports (table A-3), adjusted in the same way as the data from table A-2 and combined with those data. Combining information from tables A-2 and A-3 provides counts of individuals who were 18–24-years-old in 2012, irrespective of where they were when they took the exams.
The combined data were then adjusted to account for the possibility that by 2012, those who passed the GED in civilian, noninstitutionalized settings might no longer be in that population, and those who passed the exams while on active duty military or while in institutionalized group quarters might now be in the civilian noninstitutionalized population. To make these adjustments, data for current active-duty military personnel for 2012 were obtained
10 The GED Testing Service reports 20- through 24-year-olds as one age group. Single year of age data for those in the 20- to 24-year-old group was estimated by dividing the group count by 5 in a given year.

Appendix A—Technical Notes
A-17
from the Defense Manpower Data Center, and data for those in prisons and jails were estimated from the Survey of Inmates in State and Federal Correctional Facilities, 2004 (U.S. Department of Justice 2004). More recent prison data, including inmate educational attainment, were not available. Rates of inmates holding GEDs was derived from the 2004 correctional facility data. The rates were then applied to 2012 prison data that contained prison inmate age distributions (table A-3). Prison data for 2012 were drawn from the Bureau of Justice Statistics’ Prison Inmates at Midyear–2012 (U.S. Department of Justice 2013). After these adjustments, the estimated number of 18- through 24-year-old individuals in the civilian, noninstitutionalized population holding a GED in 2012 was approximately 1,540,000. A similar approach was used to estimate the number of 16- to 24-year-olds in the civilian, noninstitutionalized population holding a GED in 2012. Note, adjustments for other institutionalized group quarters that might affect the relationship between the GEDTS and CPS data could not be directly estimated.

Appendix A—Technical Notes
A-18
Table A-2. Percentage distribution of the U.S. population who passed the General Educational Development (GED) exam outside of federal and state contract facilities, by age group: 1998–2012
Year1 Number passed
Age group 16 17 18 19 20–24 25 or older
1998 480,947 2.8 11.8 19.1 12.2 24.1 30.0 1999 498,015 3.3 12.9 16.1 12.3 24.3 31.1 2000 486,997 3.2 13.0 16.5 12.2 24.9 30.2 2001 648,022 2.9 11.5 14.7 11.5 26.4 33.0 2002 329,515 4.4 15.8 17.4 11.6 24.6 26.2 2003 387,470 3.9 14.6 16.8 11.4 25.9 27.4 2004 405,724 4.0 14.0 16.8 11.4 26.2 27.6 2005 423,714 3.9 13.7 16.1 10.9 25.6 29.8 2006 398,045 4.1 14.4 16.7 10.9 24.9 29.0 2007 428,840 4.0 14.3 17.0 10.9 24.1 29.7 2008 467,994 3.6 13.5 16.9 11.1 24.0 30.9 2009 447,885 3.2 11.9 15.9 11.3 24.9 32.8 20102 451,777 2.7 10.2 14.5 11.6 25.4 35.6 20112 433,990 2.6 10.0 14.2 11.6 25.5 36.1 20122 401,143 2.6 9.8 13.9 11.7 25.6 36.4
1 Prior to 2002, those passing GED exams in federal or state contract facilities were issued GEDs in their state of residence. Contract facilities include military installations and prisons. 2 In 2010, 2011 and 2012, the percentages of 16, 17, 18, 19, and 20- to 24-year-olds who passed the GED were adjusted from totals for 16- to 18-year-olds and 19- to 24-year-olds based on percentages in prior years. NOTE: Data apply to the 50 states and the District of Columbia. The numbers and percentage distributions for 1998–2001 were reported in the original source as the number receiving a credential. SOURCE: American Council on Education, GED Testing Service. (1991–2002). Who Took the GED? GED Annual Statistical Report. Washington, DC: Author; American Council on Education, GED Testing Service. (2003–06). Who Passed the GED Tests? Annual Statistical Report. Washington, DC: Author; American Council on Education, GED Testing Service. (2007). 2006 GED Testing Program Statistical Report. Washington, DC: Author; American Council on Education, GED Testing Service. (2008). 2007 GED Testing Program Statistical Report. Washington, DC: Author; American Council on Education, GED Testing Service. (2009). 2008 GED Testing Program Statistical Report. Washington, DC: Author; American Council on Education, GED Testing Service. (2010). 2009 GED Testing Program Statistical Report. Washington, DC: Author; American Council on Education, GED Testing Service. (2011). 2010 GED Testing Program Statistical Report. Washington, DC: Author; American Council on Education, GED Testing Service. (2012). 2011 Annual Statistical Report on the GED Test. Washington, DC: Author; and American Council on Education, GED Testing Service. (2013). 2012 Annual Statistical Report on the GED Test. Washington, DC: Author.

Appendix A—Technical Notes
A-19
Table A-3. Percentage distribution of the U.S. population who passed the General Educational Development (GED) exam in federal or state contract facilities, by age group: 1998–2012
Year1 Number passed
Age group 16 17 18 19 20–24 25 or older
1998 † † † † † † † 1999 † † † † † † † 2000 † † † † † † † 2001 † † † † † † † 2002 4,414 0.0 0.4 1.6 3.8 26.8 67.4 2003 6,332 0.3 1.0 1.7 2.7 27.9 66.4 2004 8,644 0.4 1.0 2.0 2.9 25.4 68.3 2005 10,591 0.3 3.1 4.0 4.1 23.9 64.6 2006 10,143 0.4 3.5 5.5 6.1 23.8 60.7 2007 11,741 0.3 3.0 7.5 7.1 25.0 57.1 2008 14,727 1.0 5.8 10.9 9.1 23.5 49.7 2009 13,951 1.3 5.0 11.7 10.1 24.5 47.4 2010 12,885 1.0 3.9 9.0 9.5 23.0 54.0 2011 18,541 0.9 3.4 7.8 8.2 20.0 59.7 2012 16,689 1.1 4.4 10.1 7.6 18.4 58.4
† Not applicable. 1 Prior to 2002, people passing exams in federal or state contract facilities were issued GEDs in their state of residence. Contract facilities include military installations and prisons. NOTE: Data apply to the 50 states and the District of Columbia. The numbers and percentage distributions for 1998–2001 were reported in the original source as the number receiving a credential. SOURCE: American Council on Education, GED Testing Service. (1991–2002). Who Took the GED? GED Annual Statistical Report. Washington, DC: Author; American Council on Education, GED Testing Service. (2003–06). Who Passed the GED Tests? Annual Statistical Report. Washington, DC: Author; American Council on Education, GED Testing Service. (2007). 2006 GED Testing Program Statistical Report. Washington, DC: Author; American Council on Education, GED Testing Service. (2008). 2007 GED Testing Program Statistical Report. Washington, DC: Author; American Council on Education,GED Testing Service. (2009). 2008 GED Testing Program Statistical Report. Washington, DC: Author; American Council on Education, GED Testing Service. (2010). 2009 GED Testing Program Statistical Report. Washington, DC: Author; American Council on Education, GED Testing Service. (2011). 2010 GED Testing Program Statistical Report. Washington, DC: Author; American Council on Education, GED Testing Service. (2012). 2011 Annual Statistical Report on the GED Test. Washington, DC: Author; and American Council on Education, GED Testing Service. (2013). 2012 Annual Statistical Report on the GED Test. Washington, DC: Author.

Appendix A—Technical Notes
A-20
Table A-4. Averaged freshman graduation rates of public high school students and change in rates, by state:School years 2002–03 through 2011–12
State
Averaged freshman graduation rate (percent) 2002
–032003
–042004
–052005
–062006
–072007
–082008
–092009
–102010
–112011
–12
Reporting states1 73.9 75.0 74.7 73.2 73.9 74.9 75.5 78.2 80 81
Alaska 68.0 67.2 64.1 66.5 69.1 69.1 72.6 75.5 78 79 Arizona 75.9 66.8 84.7 70.5 69.6 70.7 72.5 74.7 79 77 Arkansas 76.6 76.8 75.7 80.4 74.4 76.4 74.0 75.0 77 78 California 74.1 73.9 74.6 69.2 70.7 71.2 71.0 2 78.2 80 82
Colorado 76.4 78.7 76.7 75.5 76.6 75.4 77.6 79.8 82 82 Connecticut 80.9 80.7 80.9 80.9 81.8 82.2 75.4 75.1 4 85 86 Delaware 73.0 72.9 73.1 76.3 71.9 72.1 73.7 75.5 76 77 District of Columbia 59.6 68.2 68.8 ‡ 54.9 56.0 62.4 59.9 61 71 Florida 66.7 66.4 64.6 63.6 65.0 66.9 68.9 70.8 72 75
Georgia 60.8 61.2 61.7 62.4 64.1 65.4 67.8 69.9 70 70 Hawaii 71.3 72.6 75.1 75.5 75.4 76.0 75.3 75.4 74 78 Idaho 81.4 81.5 81.0 80.5 80.4 80.1 80.6 84.0 83 84 Illinois 75.9 80.3 79.4 79.7 79.5 80.4 77.7 81.9 80 82 Indiana 75.5 73.5 73.2 73.3 73.9 74.1 75.2 77.2 80 80
Iowa 85.3 85.8 86.6 86.9 86.5 86.4 85.7 87.9 89 89 Kansas 76.9 77.9 79.2 77.6 78.9 79.1 80.2 84.5 87 89 Kentucky 71.7 73.0 75.9 77.2 76.4 74.4 77.6 79.9 81 82 Louisiana 64.1 69.4 63.9 59.5 61.3 63.5 67.3 68.8 71 72
Maine 76.3 77.6 78.6 76.3 78.5 79.1 79.9 2 82.8 5 86 87 Maryland 79.2 79.5 79.3 79.9 80.0 80.4 80.1 82.2 84 84 Massachusetts 75.7 79.3 78.7 79.5 80.8 81.5 83.3 82.6 85 86 Michigan 74.0 72.5 73.0 72.2 77.0 76.3 75.3 75.9 75 77 Minnesota 84.8 84.7 85.9 86.2 86.5 86.4 87.4 88.2 89 88 Mississippi 62.7 62.7 63.3 63.5 63.6 63.9 62.0 63.8 69 68
Missouri 78.3 80.4 80.6 81.0 81.9 82.4 83.1 83.7 85 86 Montana 81.0 80.4 81.5 81.9 81.5 82.0 82.0 81.9 84 86 Nebraska 85.2 87.6 87.8 87.0 86.3 83.8 82.9 83.8 90 93 Nevada 72.3 57.4 55.8 55.8 52.0 51.3 56.3 2 57.8 59 60 New Hampshire3 78.2 78.7 80.1 81.1 81.7 83.4 84.3 86.3 87 87
New Jersey 87.0 86.3 85.1 84.8 84.4 84.6 85.3 87.2 87 87 New Mexico 63.1 67.0 65.4 67.3 59.1 66.8 64.8 67.3 71 74 New York 60.9 — 65.3 67.4 68.8 70.8 73.5 76.0 78 78 North Carolina 70.1 71.4 72.6 71.8 68.6 72.8 75.1 76.9 77 79 North Dakota 86.4 86.1 86.3 82.1 83.1 83.8 87.4 88.4 90 91 See notes at end of table.

Appendix A—Technical Notes
A-21
Table A-4. Averaged freshman graduation rates of public high school students and change in rates, bystate: School years 2002–03 through 2011–12—Continued
State
Averaged freshman graduation rate (percent) 2002
–032003
–042004
–052005
–062006
–072007
–082008
–092009
–102010
–112011
–12
Ohio 79.0 81.3 80.2 79.2 78.7 79.0 79.6 81.4 82 84 Oklahoma 76.0 77.0 76.9 77.8 77.8 78.0 77.3 78.5 80 79 Oregon 73.7 74.2 74.2 73.0 73.8 76.7 76.5 76.3 78 78 Pennsylvania 81.7 82.2 82.5 — 83.0 82.7 80.5 84.1 86 88 Rhode Island 77.7 75.9 78.4 77.8 78.4 76.4 75.3 76.4 77 76
South Carolina 59.7 60.6 60.1 — 58.9 — 66.0 68.2 69 72 South Dakota 83.0 83.7 82.3 84.5 82.5 84.4 81.7 81.8 82 83 Tennessee 63.4 66.1 68.5 70.6 72.6 74.9 77.4 80.4 81 83 Texas 75.5 76.7 74.0 72.5 71.9 73.1 75.4 78.9 81 82 Utah 80.2 83.0 84.4 78.6 76.6 74.3 79.4 78.6 78 78
Vermont 83.6 85.4 86.5 82.3 88.6 89.3 89.6 91.4 93 93 Virginia 80.6 79.3 79.6 74.5 75.5 77.0 78.4 81.2 83 84 Washington 74.2 74.6 75.0 72.9 74.8 71.9 73.7 77.2 79 79 West Virginia 75.7 76.9 77.3 76.9 78.2 77.3 77.0 78.3 78 80 Wisconsin 85.8 — 86.7 87.5 88.5 89.6 90.7 91.1 92 92 Wyoming 73.9 76.0 76.7 76.1 75.8 76.0 75.2 80.3 80 80
— Not available. ‡ Reporting standards not met. Reported number of graduates exceeded grade 12 membership. 1 Reporting states totals include any of the 50 states and the District of Columbia that reported all data elements. 2 Due to item non-response, data for California and Nevada were imputed based on prior year reported data. 3 New Hampshire included homeschooled students in reported membership in 2000–01. This could inflate the denominator for the AFGR in 2002–03, 2003–04, and 2004–05 slightly. 4 Data for Connecticut are imputed due to unusually high diploma counts that were unconfirmed by the state. 5 Maine’s estimated first-time 9th graders were edited to include 1,419 9th grade, publicly funded private school students that were not reported as 9th graders on the 2006–07 Common Core of Data (CCD) but were reported as 10th graders in 2007–08 and as diploma recipients in 2009–10. NOTE: The averaged freshman graduation rate (AFGR) is an estimate of the percentage of an entering freshman class graduating in 4 years. For 2011–12, it equals the total number of diploma recipients in 2011–12 divided by the average membership of the 8th-grade class in 2007–08, the 9th-grade class in 2008–09, and the 10th-grade class in 2009–10. Ungraded students were allocated to individual grades proportionally to the reported enrollments by grade. SOURCE: Seastrom, M., Hoffman, L., Chapman, C., and Stillwell, R. (2005). The Averaged Freshman Graduation Rate for Public High Schools From the Common Core of Data: School Years 2001–02 and 2002–03 (NCES 2006-601), table 1; Stillwell, R., Sable, J., and Plotts, C. (2011). Public School Graduates and Dropouts From the Common Core of Data: School Year 2008–09 (NCES 2011-312), table 3; Stillwell, R., and Sable, J., (2013). Public School Graduates and Dropouts From the Common Core of Data: School Year 2009–10 (NCES 2013-309rev), table 1; Stetser, M.C., and Stillwell, R. (2014). Public High School Four-Year On-Time Graduation Rates and Event Dropout Rates: School Years 2010–11 and 2011–12. First Look. (NCES 2014-391), tables 3 and 4.

THIS PAGE INTENTIONALLY LEFT BLANK

Appendix B—Glossary
B-1
Appendix B—Glossary
For definitions of dropout and completion rate estimates, please see the discussions above and table A-1.
Age. This represents the age of the subject at the time of data collection.
Disability. In the Current Population Survey (CPS), individuals are identified as having a disability if they were reported to have difficulty with at least one of the following: hearing, seeing even when wearing glasses, walking or climbing stairs, dressing or bathing, doing errands alone, concentrating, remembering, or making decisions.
Family income. In the Current Population Survey (CPS), family income is derived from a single question asked of the household respondent. Income includes money income from all sources, including jobs, business, interest, rent, and social security payments. The income of nonrelatives living in the household is excluded, but the income of all family members 14 years old and older, including those temporarily living away, is included. Family income refers to receipts over a 12-month period.
There are several issues that affect the interpretation of dropout rates by family income using the CPS. First, it is possible that the family income of the students at the time they dropped out was somewhat different from their family income at the time of the CPS interview. Furthermore, family income is derived from a single question asked of the household respondent in the October CPS. In some cases, there are persons ages 15–24 living in the household who are unrelated to the household respondent, yet whose family income is defined as the income of the family of the household respondent. Therefore, the current family income of the respondent may not accurately reflect that person’s family background. In particular, some of the young adults in the 15- through 24-year age range do not live in a family unit with a parent present.
GED, or General Educational Development. General Educational Development (GED) tests are standardized tests designed to measure the skills and knowledge that students normally acquire by the end of high school. The tests are developed by the American Council on Education’s GED Testing Service. People who pass may receive an alternative high school credential.
Geographic regions. There are four Census regions used in this report: Northeast, Midwest, South, and West. The Northeast consists of Maine, New Hampshire, Vermont, Massachusetts, Connecticut, Rhode Island, New York, New Jersey, and Pennsylvania. The Midwest consists of Ohio, Indiana, Illinois, Michigan, Wisconsin, Iowa, Minnesota, Missouri, North Dakota, South Dakota, Nebraska, and Kansas. The

Appendix B—Glossary
B-2
South consists of Delaware, Maryland, the District of Columbia, Virginia, West Virginia, North Carolina, South Carolina, Georgia, Florida, Kentucky, Tennessee, Alabama, Mississippi, Arkansas, Louisiana, Oklahoma, and Texas. The West consists of Montana, Idaho, Wyoming, Colorado, New Mexico, Arizona, Utah, Nevada, Washington, Oregon, California, Alaska, and Hawaii.
Recency of immigration. Recency of immigration was derived from a set of questions on the CPS survey inquiring about the country of birth of the reference person and his or her mother and father. From these questions, the following three categories were constructed: (1) born outside the 50 states and the District of Columbia, (2) first generation, and (3) second generation or higher. “First generation” is defined as individuals who were born in one of the 50 states or the District of Columbia, but who had at least one parent who was not. “Second generation or higher” refers to individuals who themselves, as well as both of their parents, were born in one of the 50 states or the District of Columbia. These three categories were subdivided using the variable for the subject’s race/ethnicity (see below), so that there were six categories: the three immigration categories plus a Hispanic and non-Hispanic category for each of the three immigration categories.
Race/ethnicity. This variable is constructed from two variables in the CPS. One asks about the subject’s ethnic background and the second asks about the subject’s race. Those reported as being of Hispanic background on the ethnic background question are categorized as Hispanic, irrespective of race. Non-Hispanics are then categorized by race. Beginning in 2003, respondents were able to indicate two or more races. Those who indicated two or more races and who did not indicate that they were Hispanic are categorized as “Two or more races, non-Hispanic.”
Sex. This represents the sex of the subject.

C-1
Appendix C—Standard Error Tables

Appendix C—Standard Error Tables
C-2
Table C-1. Standard errors for table 1: Event dropout rates and number and distribution of 15- through 24-year-olds who dropped out of grades 10–12, by selected characteristics: October 2012
Characteristic
Event dropout
rate (percent)
Number of event
dropouts (thousands)
Population enrolled
(thousands)
Percent of all
dropouts
Percent of population
enrolled
Total 0.32 37.1 120.5 † †
Sex Male 0.48 27.8 84.5 5.39 0.57 Female 0.49 27.6 92.3 5.39 0.57
Race/ethnicity White, non-Hispanic 0.24 15.1 97.8 4.04 0.68 Black, non-Hispanic 1.35 22.9 53.3 4.86 0.41 Hispanic 0.93 24.2 70.2 4.84 0.59 Asian/Pacific Islander,
non-Hispanic 1.07 6.0 34.3 1.53 0.30
Family income Low income 1.26 23.4 81.5 5.07 0.66 Middle income 0.45 29.5 108.4 5.43 0.86 High income 0.41 12.1 94.7 3.04 0.79
Age 15–16 0.42 12.8 93.4 3.39 0.75 17 0.36 14.0 65.3 3.36 0.58 18 0.71 21.8 68.1 4.88 0.53 19 1.74 18.1 54.2 4.16 0.45 20–24 3.61 19.3 50.1 4.55 0.44
Recency of immigration Born outside the 50 states and
District of Columbia Hispanic 2.27 12.0 44.6 2.83 0.39 Non-Hispanic 1.05 5.6 46.8 1.47 0.41
First generation Hispanic 1.46 19.1 70.2 4.40 0.60 Non-Hispanic 0.89 7.2 56.0 1.84 0.50
Second generation or higher Hispanic 0.87 6.7 48.2 1.70 0.43 Non-Hispanic 0.37 27.5 129.6 5.17 0.81
Disability With a disability 2.81 12.4 37.7 3.09 0.33 Without a disability 0.33 35.8 122.3 3.09 0.33
See notes at end of table.

Appendix C—Standard Error Tables
C-3
Table C-1. Standard errors for table 1: Event dropout rates and number and distribution of 15- through 24-year-olds who dropped out of grades 10–12, by selected characteristics: October 2012—Continued
Characteristic
Event dropout
rate (percent)
Number of event
dropouts (thousands)
Population enrolled
(thousands)
Percent of all
dropouts
Percent of population
enrolled
Region Northeast 0.67 12.8 72.9 3.23 0.60 Midwest 0.56 14.6 75.0 3.45 0.64 South 0.60 24.9 106.1 5.19 0.84 West 0.76 21.4 84.8 4.62 0.72
† Not applicable. Either the corresponding statistic refers to the total population, which is, by definition, 100 percent of the distribution, or reporting standards are not met because the coefficient of variation (CV) for this estimate is 50 percent or greater. SOURCE: U.S. Department of Commerce, Census Bureau, Current Population Survey (CPS), October 2012.

Appendix C—Standard Error Tables
C-4
Table C-2. Standard errors for table 2: Event dropout rates of 15- through 24-year-olds who dropped out of grades 10–12, and number of dropouts and population of 15- through 24-year-olds who were enrolled: October 1972 through October 2012
Year
Event dropout rate
(percent)
Number of event dropouts
(thousands)
Population enrolled
(thousands)
1972 0.34 35.8 126.0 1973 0.34 36.5 127.2 1974 0.35 38.0 128.2 1975 0.32 35.4 128.6 1976 0.33 35.7 128.8
1977 0.34 37.9 130.2 1978 0.35 38.1 129.8 1979 0.35 38.3 130.0 1980 0.33 36.0 128.8 1981 0.33 35.5 129.2
1982 0.34 35.8 135.1 1983 0.34 34.5 133.5 1984 0.34 33.6 131.7 1985 0.35 33.5 130.0 1986 0.33 32.3 131.1
1987 0.31 30.3 130.6 1988 0.37 35.1 140.9 1989 0.35 31.2 130.4 1990 0.33 29.1 128.5 1991 0.33 29.1 128.4
1992 0.35 30.5 128.5 1993 0.36 30.4 127.6 1994 0.37 34.5 132.8 1995 0.35 33.6 124.1 1996 0.34 33.0 129.3
1997 0.32 32.0 131.3 1998 0.33 32.9 131.9 1999 0.33 34.2 134.0 2000 0.33 33.1 132.9 2001 0.32 32.0 126.8
2002 0.27 27.4 127.6 2003 0.28 29.6 129.3 2004 0.30 31.4 128.4 2005 0.27 29.1 130.5 2006 0.27 28.9 130.6 See notes at end of table.

Appendix C—Standard Error Tables
C-5
Table C-2. Standard errors for table 2: Event dropout rates of 15- through 24-year-olds who dropped out of grades 10–12, and number of dropouts and population of 15- through 24-year-olds who were enrolled: October 1972 through October 2012—Continued
Year
Event dropout rate
(percent)
Number of event dropouts
(thousands)
Population enrolled
(thousands)
2007 0.26 28.1 131.2 2008 0.26 28.3 131.6 2009 0.25 27.7 131.0 2010 0.26 28.6 97.9 2011 0.30 32.9 109.5 2012 0.32 37.1 120.5
NOTE: Some of the standard error estimates in this table may differ from those previously published due to changes in the generalized variance parameters developed by the U.S. Census Bureau. SOURCE: U.S. Department of Commerce, Census Bureau, Current Population Survey (CPS), October 1972–2012.

Appendix C—Standard Error Tables
C-6
Table C-3. Standard errors for table 3: Event dropout rates of 15- through 24-year-olds who dropped out of grades 10–12, by sex and race/ethnicity: October 1972 through October 2012
Year Total
(percent)
Sex (percent) Race/ethnicity (percent)
Male Female White, non-
Hispanic Black, non-
Hispanic Hispanic
1972 0.34 0.47 0.49 0.35 1.36 3.70 1973 0.34 0.50 0.46 0.35 1.39 3.50 1974 0.35 0.52 0.47 0.36 1.44 3.34 1975 0.32 0.45 0.47 0.34 1.28 3.30 1976 0.33 0.49 0.44 0.36 1.18 2.71
1977 0.34 0.49 0.47 0.37 1.21 2.79 1978 0.35 0.52 0.46 0.36 1.32 3.60 1979 0.35 0.50 0.49 0.37 1.34 3.20 1980 0.33 0.49 0.45 0.35 1.22 3.36 1981 0.33 0.47 0.46 0.34 1.30 3.00
1982 0.34 0.50 0.47 0.37 1.23 3.04 1983 0.34 0.50 0.46 0.36 1.20 3.18 1984 0.34 0.50 0.47 0.37 1.08 3.28 1985 0.35 0.51 0.49 0.37 1.29 2.58 1986 0.33 0.46 0.46 0.34 1.08 2.70
1987 0.31 0.45 0.42 0.33 1.16 1.94 1988 0.37 0.55 0.53 0.42 1.28 3.08 1989 0.35 0.50 0.50 0.37 1.40 2.43 1990 0.33 0.49 0.49 0.37 1.17 2.41 1991 0.33 0.47 0.51 0.37 1.27 2.33
1992 0.35 0.46 0.53 0.38 1.09 2.23 1993 0.36 0.51 0.50 0.40 1.20 2.02 1994 0.37 0.51 0.53 0.40 1.21 2.18 1995 0.35 0.51 0.48 0.38 1.01 1.62 1996 0.34 0.48 0.49 0.38 1.05 1.49
1997 0.32 0.47 0.43 0.35 0.91 1.45 1998 0.33 0.45 0.47 0.36 0.91 1.46 1999 0.33 0.44 0.49 0.36 0.99 1.27 2000 0.33 0.49 0.43 0.37 1.00 1.24 2001 0.32 0.46 0.42 0.35 0.96 1.31
2002 0.27 0.39 0.37 0.28 0.87 1.01 2003 0.28 0.40 0.38 0.31 0.85 1.06 2004 0.30 0.44 0.41 0.34 0.94 1.20 2005 0.27 0.40 0.36 0.29 1.03 0.87 2006 0.27 0.39 0.36 0.30 0.77 1.01 See notes at end of table.

Appendix C—Standard Error Tables
C-7
Table C-3. Standard errors for table 3: Event dropout rates of 15- through 24-year-olds who dropped out of grades 10–12, by sex and race/ethnicity: October 1972 through October 2012—Continued
Year Total
(percent)
Sex (percent) Race/ethnicity (percent)
Male Female White, non-
Hispanic Black, non-
Hispanic Hispanic
2007 0.26 0.37 0.35 0.26 0.80 0.98 2008 0.26 0.34 0.39 0.27 0.94 0.85 2009 0.25 0.36 0.35 0.28 0.83 0.87 2010 0.26 0.36 0.35 0.29 0.88 0.73 2011 0.30 0.44 0.37 0.38 0.87 0.81 2012 0.32 0.48 0.49 0.24 1.35 0.93
NOTE: Some of the standard error estimates in this table may differ from those previously published due to changes in the generalized variance parameters developed by the U.S. Census Bureau. SOURCE: U.S. Department of Commerce, Census Bureau, Current Population Survey (CPS), October 1972–2012.
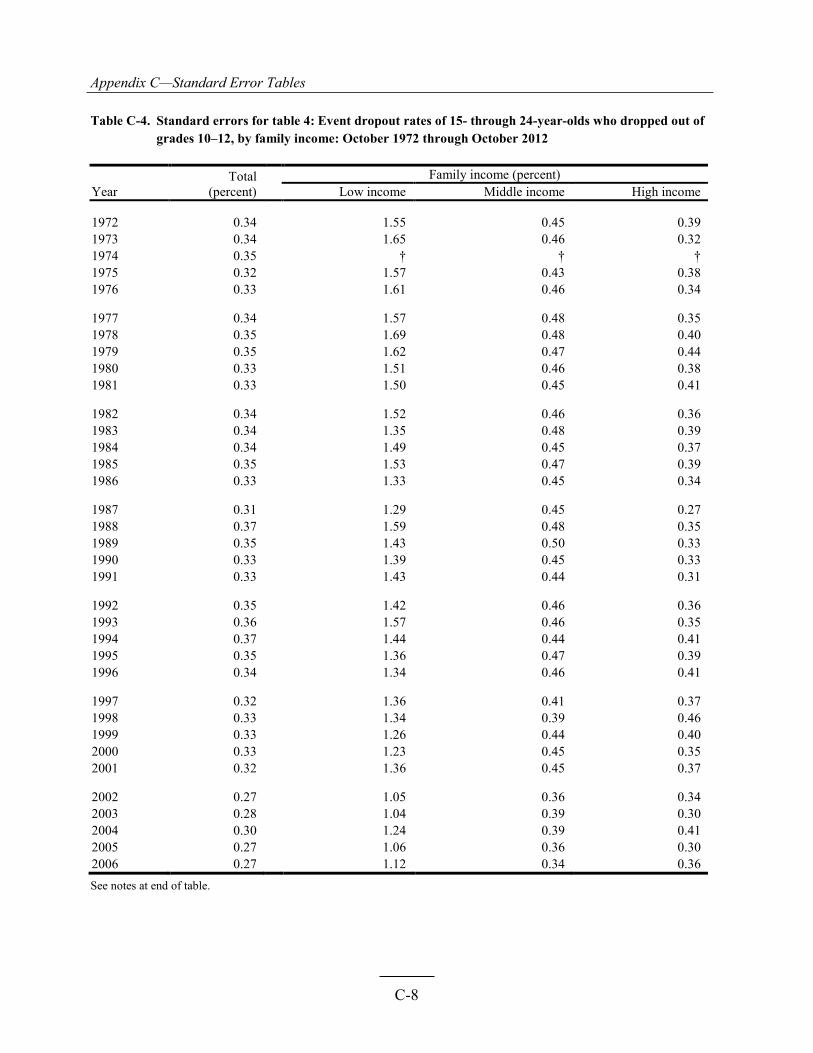
Appendix C—Standard Error Tables
C-8
Table C-4. Standard errors for table 4: Event dropout rates of 15- through 24-year-olds who dropped out of grades 10–12, by family income: October 1972 through October 2012
Year Total
(percent) Family income (percent)
Low income Middle income High income
1972 0.34 1.55 0.45 0.39 1973 0.34 1.65 0.46 0.32 1974 0.35 † † † 1975 0.32 1.57 0.43 0.38 1976 0.33 1.61 0.46 0.34
1977 0.34 1.57 0.48 0.35 1978 0.35 1.69 0.48 0.40 1979 0.35 1.62 0.47 0.44 1980 0.33 1.51 0.46 0.38 1981 0.33 1.50 0.45 0.41
1982 0.34 1.52 0.46 0.36 1983 0.34 1.35 0.48 0.39 1984 0.34 1.49 0.45 0.37 1985 0.35 1.53 0.47 0.39 1986 0.33 1.33 0.45 0.34
1987 0.31 1.29 0.45 0.27 1988 0.37 1.59 0.48 0.35 1989 0.35 1.43 0.50 0.33 1990 0.33 1.39 0.45 0.33 1991 0.33 1.43 0.44 0.31
1992 0.35 1.42 0.46 0.36 1993 0.36 1.57 0.46 0.35 1994 0.37 1.44 0.44 0.41 1995 0.35 1.36 0.47 0.39 1996 0.34 1.34 0.46 0.41
1997 0.32 1.36 0.41 0.37 1998 0.33 1.34 0.39 0.46 1999 0.33 1.26 0.44 0.40 2000 0.33 1.23 0.45 0.35 2001 0.32 1.36 0.45 0.37
2002 0.27 1.05 0.36 0.34 2003 0.28 1.04 0.39 0.30 2004 0.30 1.24 0.39 0.41 2005 0.27 1.06 0.36 0.30 2006 0.27 1.12 0.34 0.36 See notes at end of table.

Appendix C—Standard Error Tables
C-9
Table C-4. Standard errors for table 4: Event dropout rates of 15- through 24-year-olds who dropped out of grades 10–12, by family income: October 1972 through October 2012—Continued
Year Total
(percent) Family income (percent)
Low income Middle income High income
2007 0.26 1.07 0.34 0.25 2008 0.26 1.05 0.31 0.37 2009 0.25 0.98 0.33 0.32 2010 0.26 1.01 0.36 0.41 2011 0.30 1.12 0.37 0.47 2012 0.32 1.26 0.45 0.41 † Not applicable. Data for family income are not available for 1974. NOTE: Some of the standard error estimates in this table may differ from those previously published due to changes in the generalized variance parameters developed by the U.S. Census Bureau. SOURCE: U.S. Department of Commerce, Census Bureau, Current Population Survey (CPS), October 1972–2012.

Appendix C—Standard Error Tables
C-10
Table C-5. Standard errors for table 6: Status dropout rates and number and distribution of dropouts of 16- through 24-year-olds, by selected characteristics: October 2012
Characteristic
Status dropout
rate (percent)
Number of status dropouts
(thousands) Population
(thousands)
Percent of all
dropouts
Percent of
population
Total 0.25 101.1 — † †
Sex Male 0.36 74.2 — 1.84 0.30 Female 0.33 63.8 — 1.84 0.30
Race/ethnicity White, non-Hispanic 0.31 67.7 — 1.97 0.18 Black, non-Hispanic 0.76 42.3 — 1.61 0.12 Hispanic 0.72 59.0 — 1.91 0.07 Native Hawaiian/Pacific Islander,
non-Hispanic 0.76 15.3 — 0.59 0.11 American Indian/Alaska Native,
non-Hispanic 4.66 18.4 — 0.71 0.14 Two or more races, non-Hispanic 1.47 14.3 — 0.55 0.13
Age 16 0.40 16.2 — 0.62 0.13 17 0.54 23.5 — 0.89 0.16 18 0.73 31.2 — 1.18 0.16 19 0.82 35.1 — 1.26 0.15 20–24 0.35 81.7 — 1.73 0.27
Recency of immigration Born outside the 50 states and
District of Columbia Hispanic 2.02 45.3 — 1.69 0.23 Non-Hispanic 1.01 21.6 — 0.81 0.23
First generation Hispanic 0.99 37.3 — 1.41 0.26 Non-Hispanic 0.59 15.7 — 0.62 0.26
Second generation or higher Hispanic 1.14 30.0 — 1.13 0.25 Non-Hispanic 0.29 76.6 — 1.94 0.33
Disability With a disability 1.69 25.1 — 0.99 0.18 Without a disability 0.26 100.5 — 0.99 0.18
See notes at end of table.

Appendix C—Standard Error Tables
C-11
Table C-5. Standard errors for table 6: Status dropout rates and number and distribution of dropouts of 16- through 24-year-olds, by selected characteristics: October 2012—Continued
Characteristic
Status dropout
rate (percent)
Number of status dropouts
(thousands) Population
(thousands)
Percent of all
dropouts
Percent of
population
Region Northeast 0.63 43.8 — 1.63 0.34 Midwest 0.57 47.6 — 1.64 0.34 South 0.42 59.6 — 1.93 0.41 West 0.56 53.9 — 1.79 0.41
— Not available. † Not applicable. The corresponding statistic refers to the total population, which is, by definition, 100 percent of the distribution. SOURCE: U.S. Department of Commerce, Census Bureau, Current Population Survey (CPS), October 2012.

Appendix C—Standard Error Tables
C-12
Table C-6. Standard errors for table 7: Status dropout rates, number of status dropouts, and population of 16- through 24-year-olds: October 1972 through October 2012
Year Status dropout rate
(percent) Number of status dropouts
(thousands) Population
(thousands)
1972 0.28 92.7 — 1973 0.28 92.4 — 1974 0.28 93.6 — 1975 0.27 93.6 — 1976 0.27 95.0 —
1977 0.27 95.5 — 1978 0.27 96.2 — 1979 0.27 97.4 — 1980 0.27 96.0 — 1981 0.26 96.6 —
1982 0.28 101.5 — 1983 0.28 100.1 — 1984 0.28 97.5 — 1985 0.28 94.6 — 1986 0.27 92.8 —
1987 0.28 93.5 — 1988 0.31 101.8 — 1989 0.30 94.6 — 1990 0.29 92.0 — 1991 0.30 92.8 —
1992 0.28 87.7 — 1993 0.28 87.5 — 1994 0.28 91.5 — 1995 0.27 86.5 — 1996 0.27 87.1 —
1997 0.27 87.4 — 1998 0.27 90.7 — 1999 0.26 89.7 — 2000 0.26 89.2 — 2001 0.24 84.7 —
2002 0.24 82.5 — 2003 0.23 82.6 — 2004 0.23 84.8 — 2005 0.22 81.7 — 2006 0.22 81.8 —
See notes at end of table.

Appendix C—Standard Error Tables
C-13
Table C-6. Standard errors for table 7: Status dropout rates, number of status dropouts, and population of 16- through 24-year-olds: October 1972 through October 2012—Continued
Year Status dropout rate
(percent) Number of status dropouts
(thousands) Population
(thousands)
2007 0.21 79.8 — 2008 0.20 76.8 — 2009 0.21 77.1 — 2010 0.27 100.8 — 2011 0.26 99.1 — 2012 0.25 101.1 — — Not available. NOTE: Some of the standard error estimates in this table may differ from those previously published due to changes in the generalized variance parameters developed by the U.S. Census Bureau. SOURCE: U.S. Department of Commerce, Census Bureau, Current Population Survey (CPS), October 1972–2012.

Appendix C—Standard Error Tables
C-14
Table C-7. Standard errors for table 8: Status dropout rates of 16- through 24-year-olds, by sex and race/ethnicity: October 1972 through October 2012
Year Total
(percent)
Sex (percent) Race/ethnicity (percent)
Male Female White, non-
Hispanic Black, non-
Hispanic Hispanic
1972 0.28 0.40 0.40 0.29 1.09 2.93 1973 0.28 0.39 0.39 0.28 1.09 2.96 1974 0.28 0.39 0.39 0.28 1.07 2.74 1975 0.27 0.38 0.38 0.28 1.08 2.67 1976 0.27 0.39 0.38 0.28 1.03 2.66
1977 0.27 0.39 0.37 0.28 1.00 2.65 1978 0.27 0.39 0.37 0.28 1.01 2.62 1979 0.27 0.39 0.37 0.28 1.02 2.60 1980 0.27 0.39 0.36 0.27 0.98 2.47 1981 0.26 0.39 0.35 0.27 0.94 2.36
1982 0.28 0.40 0.38 0.29 0.99 2.51 1983 0.28 0.41 0.38 0.29 0.98 2.51 1984 0.28 0.41 0.38 0.29 0.93 2.49 1985 0.28 0.40 0.37 0.29 0.93 1.93 1986 0.27 0.40 0.37 0.29 0.91 1.88
1987 0.28 0.41 0.39 0.30 0.92 1.85 1988 0.31 0.45 0.42 0.32 1.01 2.17 1989 0.30 0.43 0.40 0.31 0.94 1.92 1990 0.29 0.42 0.41 0.30 0.94 1.91 1991 0.30 0.43 0.41 0.31 0.95 1.93
1992 0.28 0.41 0.39 0.29 0.95 1.86 1993 0.28 0.40 0.40 0.29 0.94 1.79 1994 0.28 0.41 0.38 0.29 0.89 1.66 1995 0.27 0.38 0.37 0.28 0.75 1.15 1996 0.27 0.38 0.38 0.27 0.80 1.19
1997 0.27 0.39 0.36 0.28 0.80 1.11 1998 0.27 0.40 0.36 0.28 0.81 1.12 1999 0.26 0.38 0.36 0.27 0.77 1.11 2000 0.26 0.38 0.35 0.26 0.78 1.08 2001 0.24 0.36 0.32 0.25 0.68 1.01
2002 0.24 0.35 0.32 0.24 0.70 0.93 2003 0.23 0.34 0.30 0.24 0.69 0.90 2004 0.23 0.34 0.31 0.24 0.70 0.89 2005 0.22 0.33 0.29 0.23 0.66 0.87 2006 0.22 0.33 0.30 0.23 0.66 0.86 See notes at end of table.

Appendix C—Standard Error Tables
C-15
Table C-7. Standard errors for table 8: Status dropout rates of 16- through 24-year-olds, by sex and race/ethnicity: October 1972 through October 2012 —Continued
Year Total
(percent)
Sex (percent) Race/ethnicity (percent)
Male Female White, non-
Hispanic Black, non-
Hispanic Hispanic
2007 0.21 0.32 0.29 0.22 0.59 0.83 2008 0.20 0.30 0.28 0.21 0.63 0.78 2009 0.21 0.31 0.27 0.21 0.61 0.76 2010 0.27 0.40 0.28 0.30 0.76 0.87 2011 0.26 0.36 0.34 0.31 0.67 0.78 2012 0.25 0.36 0.33 0.31 0.76 0.72
NOTE: Some of the standard error estimates in this table may differ from those previously published due to changes in the generalized variance parameters developed by the U.S. Census Bureau. SOURCE: U.S. Department of Commerce, Census Bureau, Current Population Survey (CPS), October 1972–2012.

Appendix C—Standard Error Tables
C-16
Table C-8. Standard errors for table 9: Number of status dropouts and status dropout rates of 16- through 24-year-olds in the institutionalized group quarters and noninstitutionalized group quarters andhousehold population, by school or student characteristics: American Community Survey (ACS)2012
School or student characteristic
Total status
dropout rate
(percent)
Institutionalized group quarters
Noninstitutionalized group quarters and households
Number of status dropouts
(thousands)
Status dropout
rate (percent)
Number of status dropouts
(thousands)
Status dropout
rate (percent)
Total 0.07 4.3 0.73
26.9 0.07
Sex Male 0.08 3.9 0.78 17.2 0.09 Female 0.08 1.3 2.02 16.4 0.08
Race/ethnicity White, non-Hispanic 0.06 1.9 0.97 13.9 0.06 Black, non-Hispanic 0.18 2.7 1.17 10.3 0.18 Hispanic 0.18 2.3 1.55 15.7 0.19 Asian, non-Hispanic 0.14 † 7.42 2.6 0.14 Native Hawaiian/Pacific Islander,
non-Hispanic 1.45 † 20.39
1.1 1.45
American Indian/Alaska Native, non-Hispanic
0.71 0.4
5.39 2.2
0.72
Two or more races, non-Hispanic 0.25 0.5 3.16 2.8 0.25
Race/ethnicity by sex Male 0.08 3.9 0.78 17.2 0.09
White, non-Hispanic 0.09 1.7 1.07 10.3 0.09 Black, non-Hispanic 0.26 2.5 1.21 7.3 0.27 Hispanic 0.23 2.1 1.60 10.3 0.24 Asian, non-Hispanic 0.24 † 8.44 2.3 0.24 Native Hawaiian/Pacific
Islander, non-Hispanic 1.74 † †
0.7 1.73
American Indian/Alaska Native, non-Hispanic
1.06 0.4
5.94 1.6
1.08
Two or more races, non-Hispanic
0.43 0.5
3.80 2.4
0.42
Female 0.08 1.3 2.02
16.4 0.08 White, non-Hispanic 0.08 0.7 2.64 9.1 0.08 Black, non-Hispanic 0.21 0.7 3.98 5.9 0.21 Hispanic 0.23 0.5 4.73 9.4 0.24 Asian, non-Hispanic 0.20 † † 1.9 0.20 Native Hawaiian/Pacific
Islander, non-Hispanic 2.41 † †
0.8 2.41
American Indian/Alaska Native, non-Hispanic
0.95 † † 1.4
0.95
Two or more races, non-Hispanic
0.34 † † 2.0
0.34
See notes at end of table.

Appendix C—Standard Error Tables
C-17
Table C-8. Standard errors for table 9: Number of status dropouts and status dropout rates of 16- through 24-year-olds in the institutionalized group quarters and noninstitutionalized group quarters andhousehold population, by school or student characteristics: American Community Survey (ACS)2012
School or student characteristic
Total status
dropout rate
(percent)
Institutionalized group quarters
Noninstitutionalized group quarters and households
Number of status dropouts
(thousands)
Status dropout
rate (percent)
Number of status dropouts
(thousands)
Status dropout
rate (percent)
Age 16 0.08 0.5 1.50 3.3 0.08 17 0.12 0.5 1.45 4.7 0.12 18 0.14 1.1 2.50 6.1 0.13 19 0.13 1.3 2.32 5.8 0.13 20–24 0.09 3.8 0.90 20.7 0.09
Region Northeast 0.11 1.3 1.52 7.7 0.11 Midwest 0.12 1.6 1.38 9.8 0.12 South 0.10 3.0 1.13 15.1 0.10 West 0.10 2.0 1.55 9.8 0.10
† Not applicable. SOURCE: U.S. Department of Commerce, Census Bureau, American Community Survey (ACS), 2012.

Appendix C—Standard Error Tables
C-18
Table C-9. Standard errors for table 10: Status completion rates, and number and distribution of completers ages 18–24 not currently enrolled in high school or below, by selected characteristics: October 2012
Characteristic
Completion rate
(percent)
Number of completers
(thousands) Population
(thousands) Percent of all
completers Percent of population
Total 0.33 270.3 — † †
Sex Male 0.47 215.7 — 0.38 0.36 Female 0.45 94.0 — 0.38 0.36
Race/ethnicity White, non-Hispanic 0.38 164.0 — 0.36 0.28 Black, non-Hispanic 1.01 75.3 — 0.23 0.19 Hispanic 1.02 85.0 — 0.29 0.21 Asian/Pacific Islander, non-
Hispanic 1.23 50.6 — 0.19 0.17 American Indian/Alaska
Native, non-Hispanic 6.77 36.2 — 0.14 0.14 Two or more races,
non-Hispanic 2.07 47.1 — 0.17 0.17
Age 18–19 0.74 80.3 — 0.31 0.28 20–21 0.56 184.1 — 0.55 0.52 22–24 0.51 180.9 — 0.55 0.50
Recency of immigration Born outside the 50 states and
District of Columbia Hispanic 2.36 64.3 — 0.25 0.28 Non-Hispanic 1.38 79.2 — 0.30 0.28
First generation Hispanic 1.39 83.3 — 0.31 0.32 Non-Hispanic 0.87 83.3 — 0.31 0.28
Second generation or higher Hispanic 1.53 73.0 — 0.28 0.28 Non-Hispanic 0.38 216.5 — 0.46 0.40
Disability With a disability 2.16 49.9 — 0.19 0.20 Without a disability 0.35 267.7 — 0.19 0.20
See notes at end of table.

Appendix C—Standard Error Tables
C-19
Table C-9. Standard errors for table 10: Status completion rates, and number and distribution of completers ages 18–24 not currently enrolled in high school or below, by selected characteristics: October 2012
Characteristic
Completion rate
(percent)
Number of completers
(thousands) Population
(thousands) Percent of all
completers Percent of population
Region Northeast 0.79 120.4 — 0.44 0.39 Midwest 0.70 117.1 — 0.45 0.42 South 0.56 185.3 — 0.59 0.55 West 0.80 173.2 — 0.59 0.54
— Not available. † Not applicable. The corresponding statistic refers to the total population, which is, by definition, 100 percent of the distribution. SOURCE: U.S. Department of Commerce, Census Bureau, Current Population Survey (CPS), October 2012.

Appendix C—Standard Error Tables
C-20
Table C-10. Standard errors for table 11: Status completion rates, number of completers, population of 18- through 24-year-olds not currently enrolled in high school or below: October 1972through October 2012
Year Completion rate
(percent) Number of completers
(thousands) Population
(thousands)
1972 0.36 84.3 — 1973 0.34 83.7 — 1974 0.34 84.7 — 1975 0.34 85.3 — 1976 0.33 86.8 —
1977 0.33 87.2 — 1978 0.33 88.0 — 1979 0.33 89.4 — 1980 0.32 88.0 — 1981 0.32 89.4 —
1982 0.34 94.4 — 1983 0.34 93.6 — 1984 0.34 91.1 — 1985 0.34 87.8 — 1986 0.34 86.4 —
1987 0.35 87.2 — 1988 0.39 95.2 — 1989 0.37 88.9 — 1990 0.36 86.2 — 1991 0.37 87.3 —
1992 0.36 82.8 — 1993 0.36 83.1 — 1994 0.36 86.1 — 1995 0.34 81.3 — 1996 0.35 80.8 —
1997 0.35 82.2 — 1998 0.36 85.7 — 1999 0.34 83.7 — 2000 0.33 83.3 — 2001 0.31 79.8 —
2002 0.30 78.1 — 2003 0.30 78.6 — 2004 0.30 80.3 — 2005 0.30 78.0 — 2006 0.29 77.8 — See notes at end of table.

Appendix C—Standard Error Tables
C-21
Table C-10. Standard errors for table 11: Status completion rates, number of completers, population of 18- through 24-year-olds not currently enrolled in high school or below: October 1972through October 2012—Continued
Year Completion rate
(percent) Number of completers
(thousands) Population
(thousands)
2007 0.28 75.2 — 2008 0.27 72.6 — 2009 0.27 73.2 — 2010 0.35 116.5 — 2011 0.35 154.5 — 2012 0.33 270.3 — — Not available. NOTE: Some of the standard error estimates in this table may differ from those previously published due to changes in the generalized variance parameters developed by the U.S. Census Bureau. SOURCE: U.S. Department of Commerce, Census Bureau, Current Population Survey (CPS), October 1972–2012.

Appendix C—Standard Error Tables
C-22
Table C-11.—Standard errors for table 12: Status completion rates of 18- through 24-year-olds not currently enrolled in high school or below, by sex and race/ethnicity: October 1972 through October 2012
Year Total
(percent)
Sex (percent) Race/ethnicity (percent)
Male Female White, non-
Hispanic Black, non-
Hispanic Hispanic
1972 0.36 0.52 0.49 0.36 1.45 3.67 1973 0.34 0.50 0.48 0.35 1.42 3.68 1974 0.34 0.50 0.47 0.35 1.41 3.40 1975 0.34 0.48 0.47 0.34 1.43 3.45 1976 0.33 0.49 0.46 0.34 1.36 3.36
1977 0.33 0.49 0.45 0.34 1.34 3.30 1978 0.33 0.48 0.45 0.34 1.33 3.21 1979 0.33 0.49 0.45 0.34 1.33 3.15 1980 0.32 0.48 0.43 0.33 1.28 2.99 1981 0.32 0.48 0.43 0.33 1.22 2.90
1982 0.34 0.50 0.46 0.35 1.28 3.09 1983 0.34 0.51 0.45 0.35 1.27 3.13 1984 0.34 0.50 0.45 0.35 1.19 3.03 1985 0.34 0.50 0.45 0.35 1.20 2.40 1986 0.34 0.51 0.45 0.35 1.19 2.30
1987 0.35 0.52 0.47 0.37 1.20 2.24 1988 0.39 0.58 0.52 0.40 1.35 2.56 1989 0.37 0.55 0.49 0.38 1.25 2.29 1990 0.36 0.53 0.50 0.37 1.22 2.35 1991 0.37 0.55 0.51 0.38 1.26 2.32
1992 0.36 0.53 0.49 0.36 1.26 2.32 1993 0.36 0.53 0.50 0.37 1.27 2.26 1994 0.36 0.53 0.49 0.36 1.19 2.06 1995 0.34 0.50 0.47 0.36 1.01 1.40 1996 0.35 0.50 0.48 0.34 1.08 1.49
1997 0.35 0.51 0.47 0.36 1.10 1.42 1998 0.36 0.53 0.47 0.36 1.11 1.37 1999 0.34 0.50 0.46 0.34 1.04 1.39 2000 0.33 0.49 0.44 0.33 1.01 1.36 2001 0.31 0.47 0.41 0.32 0.92 1.24
2002 0.30 0.46 0.40 0.31 0.95 1.15 2003 0.30 0.46 0.40 0.31 0.96 1.15 2004 0.30 0.46 0.40 0.31 0.98 1.12 2005 0.30 0.45 0.38 0.30 0.91 1.12 2006 0.29 0.43 0.39 0.30 0.93 1.11 See notes at end of table.

Appendix C—Standard Error Tables
C-23
Table C-11.—Standard errors for table 12: Status completion rates of 18- through 24-year-olds not currently enrolled in high school or below, by sex and race/ethnicity: October 1972 through October 2012—Continued
Year Total
(percent)
Sex (percent) Race/ethnicity (percent)
Male Female White, non-
Hispanic Black, non-
Hispanic Hispanic
2007 0.28 0.42 0.37 0.28 0.80 1.07 2008 0.27 0.39 0.37 0.26 0.86 1.03 2009 0.27 0.40 0.35 0.27 0.84 1.00 2010 0.35 0.53 0.38 0.38 1.08 1.21 2011 0.35 0.50 0.46 0.39 0.98 1.04 2012 0.33 0.47 0.45 0.38 1.01 1.02
NOTE: Some of the standard error estimates in this table may differ from those previously published due to changes in the generalized variance parameters developed by the U.S. Census Bureau. SOURCE: U.S. Department of Commerce, Census Bureau, Current Population Survey (CPS), October 1972–2012.

Appendix C—Standard Error Tables
C-24
Table C-12. Standard errors for figure 3: Status dropout rates of 16- through 24-year-olds, by race/ethnicity and sex: October 2012
Male (percent) Female (percent)
Total 0.36 0.33
Race/ethnicity White, non-Hispanic 0.40 0.37 Black, non-Hispanic 1.15 1.01 Hispanic 1.04 1.00 Asian/Pacific Islander, non-Hispanic 0.75 1.27 American Indian/Alaska Native, non-Hispanic 5.77 5.41 Two or more races, non-Hispanic 2.63 1.46
SOURCE: U.S. Department of Commerce, Census Bureau, Current Population Survey (CPS), October 2012.
Table C-13. Standard errors for figure 5: Status completion rates of 18- through 24-year-olds not currently enrolled in high school or below, by race/ethnicity and sex: October 2012
Male (percent) Female (percent)
Total 0.47 0.45
Race/ethnicity White, non-Hispanic 0.51 0.48 Black, non-Hispanic 1.57 1.34 Hispanic 1.48 1.34 Asian/Pacific Islander, non-Hispanic 1.18 2.02 American Indian/Alaska Native, non-Hispanic 7.98 8.41 Two or more races, non-Hispanic 3.57 2.11
SOURCE: U.S. Department of Commerce, Census Bureau, Current Population Survey (CPS), October 2012.


![Combating the High School Dropout Crisis [Infographic]](https://img.pdfslide.net/doc/110x75/55391679550346bf308b4914/combating-the-high-school-dropout-crisis-infographic.jpg)