Embed Size (px)
Citation preview

VARIABLES THAT IMPACT HIGH-SCHOOL DROPOUT RATES
IN A LARGE METROPOLITAN AREA
by
DAVID BISHOP COLLINS
(Under the direction of John Schell)
ABSTRACT
This dissertation investigated the variables associated with high-school dropout rates in a
large metropolitan area in the southeastern United States. Data from 143 high schools with a
combined population of 269,290 students was included. Variables included ethnicity, gender,
school size, school location, special education status, limited English Proficiency status, and
socioeconomic status. Multiple regression analysis was used to answer the following research
questions.
1. Which variables—ethnicity, gender, school size, school location, special education
status, socioeconomic status, and limited English proficiency status—are more likely to predict
higher dropout rates among students who attend school in the large metropolitan area studied?
2. Which variables — ethnicity, gender, school size, school location, special education
status, socioeconomic status, and limited English proficiency status —have the greatest impact
on dropout rates?
Results from the multiple regression analysis revealed the variables gender, ethnicity, and
school size are more likely to predict dropout rates. Furthermore, the variables having the

greatest impact on dropout rates in the school districts included in this study were, in rank order,
gender (male), ethnicity (Black and Hispanic), and school size (medium).
Since the results of this quantitative research study provide a means to predict dropout
rates, legislators and school system personnel can use the regression formula to predict school
dropout rates in order to prioritize the allocation of resources and focus on intervention efforts.
Additionally, education specialists, practitioners, and school system personnel will have a better
understanding of which student groups have the greatest impact on dropout rates and can tailor
intervention strategies designed to help reduce the dropout rate.
INDEX WORDS: Dropout, At risk, Urban, Suburban, Rural, Metropolitan Statistical Area, Workforce Education, Intervention strategies, High School

VARIABLES THAT IMPACT HIGH-SCHOOL DROPOUT RATES
IN A LARGE METROPOLITAN AREA
by
DAVID BISHOP COLLINS
B.S., The University of Georgia, 1994
M.Ed., The University of Georgia, 1995
A Dissertation Submitted to the Graduate Faculty of The University of Georgia in Partial
Fulfillment of the Requirements for the Degree
DOCTOR OF EDUCATION
ATHENS, GEORGIA
2009

© 2009
David Collins
All Rights Reserved

VARIABLES THAT IMPACT HIGH-SCHOOL DROPOUT RATES
IN A LARGE METROPOLITAN AREA
by
DAVID BISHOP COLLINS
Major Professor: John Schell Committee: Karen Jones Jay Rojewski Electronic Version Approved: Maureen Grasso Dean of the Graduate School The University of Georgia December 2009

iv
ACKNOWLEDGEMENTS
I would like to thank my family and friends for all of the support provided me while
obtaining this degree. Most importantly, I would like to thank my beautiful wife for her support
and devotion, as I could not have accomplished this dream had it not been for her.
I would also like to thank the committee members for guiding me through the process. Dr. John
Schell, Dr. Karen Jones and Dr. Jay Rojewski thanks for providing support, leadership, direction,
and setting a high standard throughout the course of this study.
I would also like to thank the Lord for seeing me through this endeavor and ask for His
continued guidance in the chapters of my life yet to be written.

v
TABLE OF CONTENTS
Page ACKNOWLEDGEMENTS........................................................................................................... iv LIST OF TABLES....................................................................................................................... viii LIST OF FIGURES ....................................................................................................................... ix CHAPTER
1 INTRODUCTION........................................................................................................1
Statement of the Problem .............................................................................................7
Purpose of Study ..........................................................................................................9
Research Questions ......................................................................................................9
Conceptual Framework ..............................................................................................10
Significance of Study .................................................................................................12
2 REVIEW OF LITERATURE.....................................................................................13
Introduction ................................................................................................................13
School Climate ...........................................................................................................15
School Organizational Structure ................................................................................16
Theories on Dropping Out of School .........................................................................27
Theory of Urbanism ...................................................................................................29
Theory of Anomie ......................................................................................................30
Strain Theory..............................................................................................................31
Alienation Theory.......................................................................................................31
Self Determination Theory.........................................................................................33

vi
Theory of Engagement ...............................................................................................35
Attachment Theory.....................................................................................................36
Social Control Theory ................................................................................................38
School Intervention Programs ....................................................................................40
Coca-Cola Valued Youth Program.............................................................................42
Check & Connect .......................................................................................................44
Career Academies.......................................................................................................47
JROTCCA ..................................................................................................................49
Achievement for Latinos through Academic Success................................................50
Summary ....................................................................................................................52
3 METHOD...................................................................................................................53
Background ................................................................................................................53
Purpose of Study ........................................................................................................55
Research Questions ....................................................................................................56
Design.........................................................................................................................56
Participants .................................................................................................................58
Validity.......................................................................................................................58
Data Collection Procedures ........................................................................................61
Procedure....................................................................................................................63
Data Analysis .............................................................................................................64
4 DISCUSSIONS ..........................................................................................................68
Results ........................................................................................................................68
Results for Research Question 1 ................................................................................73

vii
Results for Research Question 2 ................................................................................76
Summary ....................................................................................................................77
5 CONCLUSIONS, LIMITATIONS, AND RECOMMENDATIONS........................78
Introduction ................................................................................................................78
Conclusions ................................................................................................................78
Question 1...................................................................................................................82
Recommendations for Question 1 ..............................................................................83
Question 2...................................................................................................................84
Recommendations for Question 2 ..............................................................................85
Limitations and Future Research................................................................................91
Summary ....................................................................................................................93
REFERENCES ..............................................................................................................................95
APPENDICES .............................................................................................................................119
A. All-Possible-Regressors Model ................................................................................120
B. Variable Correlation Matrix .....................................................................................121
C. Log Transformation (Box-Cox Method) ..................................................................122

viii
LIST OF TABLES
Page
Table 1: Variable Description Table..............................................................................................63
Table 2: Research Questions and Statistical Procedure.................................................................67
Table 3: Data Summary Table .......................................................................................................69
Table 4: Model of Significance Test for Multiple Regression Analysis .......................................73
Table 5: Multiple Regression Analysis Coefficients Table ...........................................................74

ix
LIST OF FIGURES
Page
Figure 1: The Violation of the Assumption of Normality .............................................................70
Figure 2: The Violation of the Assumption of Equal Variance of Residuals ................................71
Figure 3: The Assumption of Normality Is Satisfied.....................................................................72
Figure 4: The Assumption of Equal Variance is Satisfied.............................................................72

1
CHAPTER 1
INTRODUCTION
Every 9 seconds in America, a student drops out of school (Martin & Halperin, 2006).
This statistic supports an urgent clarion call for educators, policymakers, legislators, and
communities to take notice and act. If the issue of high-school dropout is not adequately
addressed, millions of young adults will be destined to a lifestyle disparate from those who do
graduate from high school with a diploma. The financial, social, and economic impact of
students dropping out of school is staggering. According to Muennig (2005), 600,000 students
dropped out of school during the 2004 school year. If these 600,000 students had completed just
one additional year of education, the U.S. would have saved over $41 billion in future health-
care costs.
As a result of high dropout rates among high school students, much information has been
collected and research conducted in an attempt to combat declining graduation rates.
Additionally, much research has been conducted to get a better understanding of the factors
leading to students dropping out of school. Even though research has been conducted, the rate at
which students drop out of high school is still extraordinarily high. Statistics regarding dropout
rates vary but studies indicate that dropout rates in the United States for high school students are
between 25 and 30 percent (Sum & Harrington, 2003).
The crisis of high-school dropouts is a national problem. However, statistics show certain
portions of the U.S. have a greater percentage of dropouts. Balfanz and Legters (2004) report that
“nearly 80 percent of the nation’s high schools that produce the highest number of dropouts can

2
be found in just 15 states” (p. 5), including Georgia. From 2001-2003, Georgia was one of 10
states that produced the lowest percentage of high-school graduates, averaging around 60%
(National Center for Education Statistics [NCES], 2005). Greene and Winters (2006) estimated
Georgia had the second lowest percentage of high school graduates in the U.S. in 2003, with a
graduation rate of 56 percent.
Dropout rates are consistently high among each grade level in Georgia high schools as
well. The most recent data available shows dropout rates to be 6.5 percent for grade 9, 7.3
percent for grade 10, 7.2 percent for grade 11, and 8.1 percent for grade 12 (NCES, 2005).
Therefore, given the relatively high dropout rates in all four grades in Georgia high schools, the
study focused on students who dropped out at any point during high school.
The dropout crisis is problematic for large school districts in metropolitan areas,
specifically urban school districts (Montecel, Cortez, & Cortez, 2004). Greene and Winters
(2006) report that “only one of the nation’s ten largest public high school districts in the nation—
where more than 8 percent of all students attend school—graduates more than 60 percent of its
students” (p. 8). Furthermore, research indicates that schools systems that have high student
populations have been linked with higher dropout rates (Lehr, Johnson, Bremer, Cosio, &
Thompson, 2004). School location and school size were also two of the variables selected for
this study.
Even though students from all demographic categories are affected by the dropout
problem, certain groups of students are more likely to drop out than others. Students who are
most likely to drop out of school include Hispanic, Native American, and African American
students. For example, the graduation rate is 55 percent for African American students and 53
percent for Hispanic students but 72 percent for Asian students and 78 percent for White, non-

3
Hispanic students (Janosz, LeBlanc, Boulerice, & Tremblay, 1997). More recent data supports
the previous statistics by showing dropout rates for high school students during the 2006 school
year as 23 percent for Hispanic students, 11 percent for African American students, and 6
percent for White, non-Hispanic students (NCES, 2007). In addition, students with special needs
are more at risk of dropping out than the general population (Blackorby & Wagner, 1996;
Repetto, Pankaskie, De Palma-Hankins, Schwartz, & Perry, 1997). The dropout crisis affects
minority male students to a greater degree than minority female students. African American
males graduate at a rate of 48 percent while African American females graduate at a 59 percent
rate (Green & Winters, 2006). Ethnicity, gender, and special needs status were also included as
variables for the study.
While the dropout crisis affects students from all socioeconomic levels, dropout rates are
higher for students of lower socioeconomic status. (Battin-Pearson, Newcomb, Hill, Catalano, &
Hawkins, 2000). Socioeconomic status was also included as one of the variables for the study.
One of the other leading factors affecting high-school dropout rates is limited English
proficiency. Research indicates those students who are of limited English proficiency are more
likely to drop out of school than those who are not classified as such (Reardon-Anderson, Capps,
& Fix, 2002; Swanson, 2004). Furthermore, recent demographic shifts in Georgia have resulted
in an influx of limited English proficiency students entering Georgia public schools (Capps et al.,
2005). Limited English proficiency status was also included as a variable for the study.
One of the biggest challenges facing researchers today is getting an accurate assessment
of the number of students who drop out of school. With the advent of the No Child Left Behind
Act of 2001([NCLB], 2002), public school systems are being held accountable for completion
rates of students graduating from high school; thus, great pressure is being placed on educators at

4
all levels to get an accurate count of who drops out of school. However, variations among local,
state, and national guidelines make it difficult to get an accurate assessment of the current
number of students who drop out of school. In order to get an accurate dropout rate, efforts have
been made to bring lucidity to the difficult task of classifying who constitutes a dropout (Woods,
2001). However, there continues to be much debate over how to assess dropout rates accurately
at the national level.
Nationally, dropout rates are calculated using several different methods. The National
Center for Education Statistics (NCES) uses two different definitions, including event rate,
which measures the percentage of adults ages 15 to 24 who dropped out over a 1-year interval
and is a measure of recent dropout experiences, and status dropout rate, which reflects the
percentage of young adults ages 16 to 24 who are not enrolled in school and who have not
completed a high-school diploma or obtained a GED (NCES, 2006).
Researchers have disagreed with the accuracy of the true dropout figures using methods
espoused by the NCES (Greene & Forster, 2003). They report that the NCES method for
calculating the dropout rate is unreliable and underreports the true number of dropouts. They
define the dropout rate by looking at the overall graduation rate. In calculating high school
graduation rates, they use enrollment data and diploma counts using the Common Core of Data
(CCD) that is gathered by the United States Department of Education. Graduation rates are
defined as the number of students in a cohort who graduate with a regular diploma divided by the
number of students in the cohort who should have graduated. Greene and Forster contended that,
by calculating the number of students who graduated with a diploma compared to the overall
population in a cohort, one is able to better determine an accurate dropout rate.

5
The Georgia Department of Education defines a student as a dropout if he or she leaves
school for any of the following reasons: pursuing adult education or postsecondary degree,
expelled from school, financial hardship/job, incarceration/under jurisdiction of juvenile or
criminal justice authority, low grades/school failure, marriage, military, pregnant/parent,
removed for lack of attendance, serious illness/accident, and unknown reasons (Governor’s
Office of Student Achievement, 2005). To get an accurate assessment of the dropout rate, the
state of Georgia calculates the number of students with a withdrawal code corresponding to a
dropout divided by the number of students who attended the school (Governor’s Office of
Student Achievement, 2005). School districts for which data were collected utilized the same
definition for dropout as the Department of Education of Georgia.
Another area of incongruence among researchers concerns accurately defining the term
at-risk. Various definitions of the term at-risk can be found throughout literature. Suh, Suh, and
Houston (2007) define at-risk as those “aspects of a student’s background and environment that
may lead to a higher risk of her or his educational failure” (p. 196). McMillan and Reed (1993)
define at-risk as “those who are in danger of dropping out of school because of academic failure
or other problems. Educators tend to use the term to refer to school and academic failure,
potential dropouts, the educationally disadvantaged, and under achievement” (p. 12).
The Georgia Department of Education does not recognize a single definition to identify a
student who is at risk of dropping out of school. However, a list of variables is used to identify
which students are susceptible to dropping out of school, including a history of school failure,
retention, and/or over-age for grade; disengagement from school or lack of involvement in
extracurricular activities; designated for special education; behavioral problems, repeated
suspensions, involvement in high-risk peer group; attendance problems/truancy; low
6
achievement in reading or math or low CRCT scores; and family status or other risk factors
including high mobility, nonnative English speakers, or economically disadvantaged (Georgia
Department of Education, 2006).
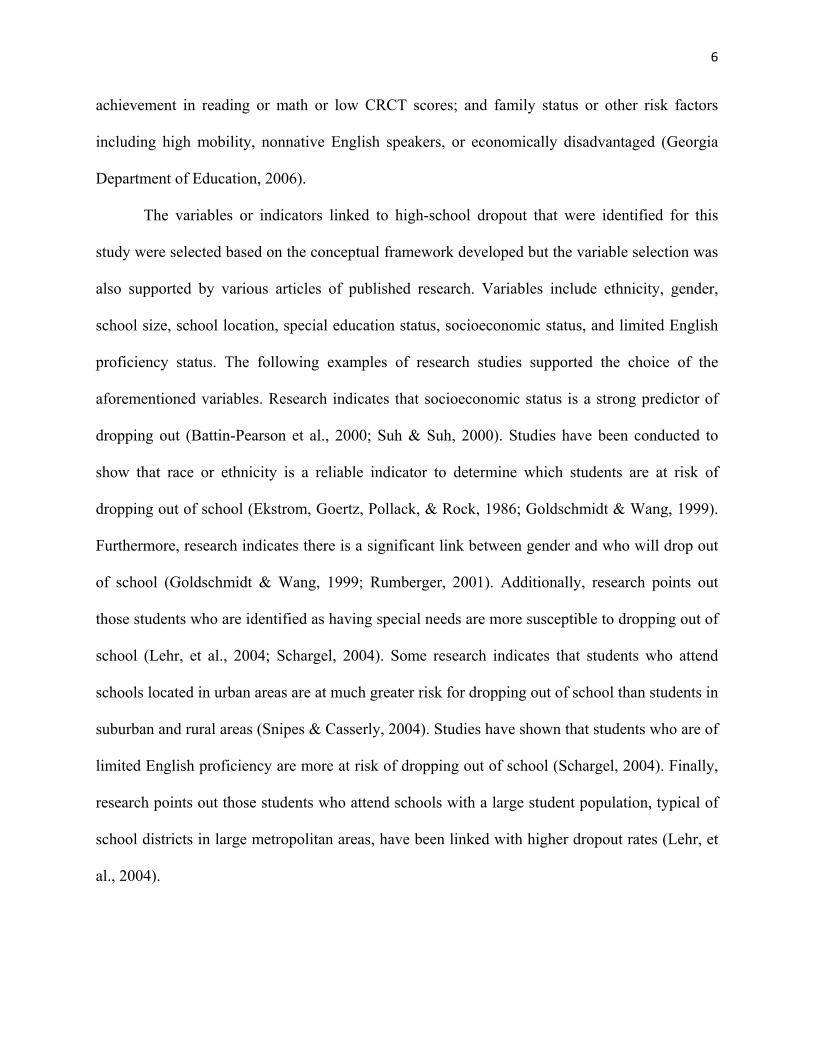
The variables or indicators linked to high-school dropout that were identified for this
study were selected based on the conceptual framework developed but the variable selection was
also supported by various articles of published research. Variables include ethnicity, gender,
school size, school location, special education status, socioeconomic status, and limited English
proficiency status. The following examples of research studies supported the choice of the
aforementioned variables. Research indicates that socioeconomic status is a strong predictor of
dropping out (Battin-Pearson et al., 2000; Suh & Suh, 2000). Studies have been conducted to
show that race or ethnicity is a reliable indicator to determine which students are at risk of
dropping out of school (Ekstrom, Goertz, Pollack, & Rock, 1986; Goldschmidt & Wang, 1999).
Furthermore, research indicates there is a significant link between gender and who will drop out
of school (Goldschmidt & Wang, 1999; Rumberger, 2001). Additionally, research points out
those students who are identified as having special needs are more susceptible to dropping out of
school (Lehr, et al., 2004; Schargel, 2004). Some research indicates that students who attend
schools located in urban areas are at much greater risk for dropping out of school than students in
suburban and rural areas (Snipes & Casserly, 2004). Studies have shown that students who are of
limited English proficiency are more at risk of dropping out of school (Schargel, 2004). Finally,
research points out those students who attend schools with a large student population, typical of
school districts in large metropolitan areas, have been linked with higher dropout rates (Lehr, et
al., 2004).
7
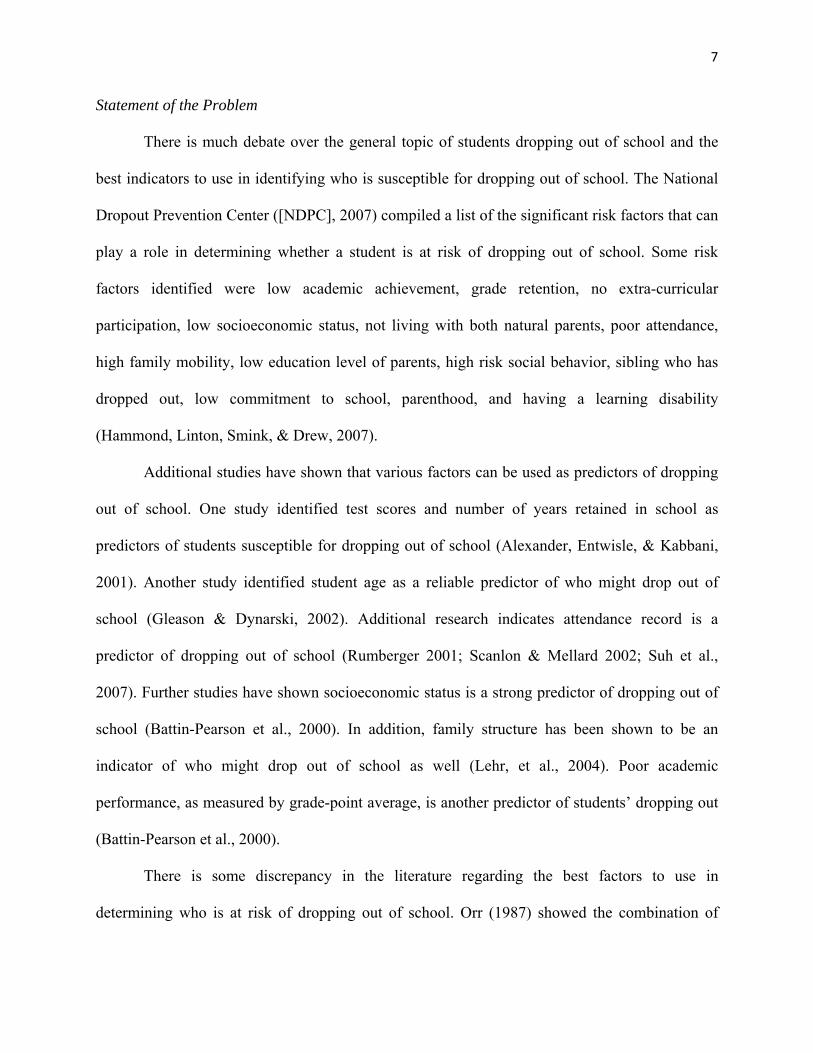
Statement of the Problem
There is much debate over the general topic of students dropping out of school and the
best indicators to use in identifying who is susceptible for dropping out of school. The National
Dropout Prevention Center ([NDPC], 2007) compiled a list of the significant risk factors that can
play a role in determining whether a student is at risk of dropping out of school. Some risk
factors identified were low academic achievement, grade retention, no extra-curricular
participation, low socioeconomic status, not living with both natural parents, poor attendance,
high family mobility, low education level of parents, high risk social behavior, sibling who has
dropped out, low commitment to school, parenthood, and having a learning disability
(Hammond, Linton, Smink, & Drew, 2007).
Additional studies have shown that various factors can be used as predictors of dropping
out of school. One study identified test scores and number of years retained in school as
predictors of students susceptible for dropping out of school (Alexander, Entwisle, & Kabbani,
2001). Another study identified student age as a reliable predictor of who might drop out of
school (Gleason & Dynarski, 2002). Additional research indicates attendance record is a
predictor of dropping out of school (Rumberger 2001; Scanlon & Mellard 2002; Suh et al.,
2007). Further studies have shown socioeconomic status is a strong predictor of dropping out of
school (Battin-Pearson et al., 2000). In addition, family structure has been shown to be an
indicator of who might drop out of school as well (Lehr, et al., 2004). Poor academic
performance, as measured by grade-point average, is another predictor of students’ dropping out
(Battin-Pearson et al., 2000).
There is some discrepancy in the literature regarding the best factors to use in
determining who is at risk of dropping out of school. Orr (1987) showed the combination of

8
socioeconomic status and educational attainment levels was the best predictor of who would
drop out of school. Poor academic performance alone has been shown to be the best predictor of
who will not graduate (Woods, 1995). On the other hand, school-related variables have been
reported as the best predictors of who is susceptible for dropping out of school (Janosz et al.,
1997). One study suggested that students who repeat a grade in elementary and middle school are
the best predictor of who would not complete school (Viadero, 2006). Finally, results from a
study conducted by Gleason and Dynarski (2002), which is often cited in literature, found most
of the predictors used to determine which students are going to drop out of school do not do an
adequate job of actually predicting the right students who eventually wind up dropping out of
school.
There are three reasons for conducting further research in the area of high-school
dropouts. First, even though research has been conducted to help identify possible factors that
might predict future dropout rates, there remains much discrepancy in literature (Alexander et al.,
2001; Scanlon & Mellard 2002; Lehr, et al., 2004). Second, limited research has focused on
dropout rates in large metropolitan areas that include urban, suburban and rural areas; thus, there
appears to be room for further analysis of variables associated with high-school dropout rates in
these areas. Third, research should be conducted on a local basis to determine which factors are
most important in predicting student dropout rates in a particular locale (Hammond et al., 2007).
Therefore, research was conducted in a specific locale in the southeastern United States to better
determine the variables associated with high-school dropout rates in this part of the country.
The objectives of this study are two-fold. First, this study provides information regarding
which variables are useful in predicting school dropout rates. By developing the ability to predict
dropout rates, specifically among schools in the large metropolitan area studied, legislators and

9
school system personnel can use this information to prioritize the allocation of resources across
schools and focus intervention efforts. Second, it provides additional information to help school
systems determine which segment within a school’s student population needs the greatest focus
and enables them to make more educated decisions about the most appropriate intervention
strategies or programs to implement to combat the dropout problem.
Purpose of Study
The purpose of this study was to determine the variables associated with higher dropout
rates in high schools in a large metropolitan area in the southeastern U.S. Variables identified
were selected based on the conceptual framework developed and supported by current research
focused on identifying students at risk of dropping out of school. These variables include
ethnicity, gender, school size, special educations status, socioeconomic status, school location,
and limited English proficiency status. The dependent variable was the rate at which students
drop out of school.
Research Questions
The study was guided by the following research questions:
1. Which variables — ethnicity, gender, school size, school location, special education
status, socioeconomic status, and limited English proficiency status —are more likely to predict
higher dropout rates among students who attend school in a large metropolitan area?
2. Which variables— ethnicity, gender, school size, school location, special education
status, socioeconomic status, and limited English proficiency status — have the greatest impact
on dropout rates?

10
Conceptual Framework
A conceptual framework was developed to help guide the selection of the specific
variables used. This framework involves focusing on those areas in which the education system
is failing students. The conceptual framework is based on the assumption that identifying the
areas in which the education system is failing is useful in determining where to focus efforts to
reduce dropout rates.
One area in which school systems are failing to meet the needs of students is in school
districts with large minority populations. For example, a study conducted by Fenwick (2001)
revealed that, of the school systems that have 90% or higher enrollment of minority students,
approximately 50% of the math and science teachers have not met their state’s minimum
certification requirements (Barr & Parrett, 2007). Furthermore, research has indicated that a
disproportionate number of students who drop out of school are Black male students (Sum &
Harrington, 2007). Some of the prevailing research indicates that schools do not offer enough
programs or support mechanisms to meet the needs of Black students (Mitchell, Bush, & Lawson
Bush, 2002). Therefore, ethnicity and gender were included as variables to evaluate which
specific ethnicity group and which gender had the greatest impact on dropout rates.
Further research indicates that students who do not speak English fluently are often
underserved by the school system and not given the tools necessary to ensure success (Velasco,
Fix, & Clewell, 2000). Therefore, it was determined that limited English proficiency status
would be included as a variable.
The inadequate use of funds by school systems has led to a higher dropout rate among the
students who need the most help, those students who are of low socioeconomic status (Liu,
2006). The dropout rate is higher in school districts with a large number of students classified as

11
having a low socioeconomic status (Barr & Parrett, 2007). Research attributes this high dropout
rate among students of low socioeconomic status to a lack of education among parents and the
need to leave school early for familial support (Rumberger, 2001). Therefore, socioeconomic
status was included to determine whether low socioeconomic status significantly impacted
dropout rates.
Research indicates a community’s makeup can have a negative influence on a student’s
behavior and can have an impact on a student’s decision to drop out of school (Crowder &
South, 2003). Furthermore, students who attend schools in urban districts are not given adequate
resources compared to suburban and rural school districts (Dill & Stafford-Johnson, 2003). For
example, consistent teacher shortages and higher rates of unqualified teachers in the classroom
are more common in urban school districts than in suburban areas (Ingersoll, 2003; McDonnell,
2005). Therefore, school location, classified as suburban, rural, and urban, was included as a
variable to ascertain whether school location significantly impacted dropout rates.
In recent years, the practice of consolidating schools into large schools has become
commonplace; however, research shows that many schools are overcrowded and, by reducing
school size, the dropout rate can be reduced (Kuziemko, 2006; McNeal 1997; Rumberger 1995).
Therefore, school size was included to establish whether this variable significantly impacted
dropout rates.
Another reason the correct selection of variables is important is that the wrong students
can be placed in specific intervention strategies or programs. In some cases, the wrong
intervention strategies are put in place because the rationale used to select the strategy or
program is based on results from the selection of the wrong variables (Gleason & Dynarski,
2002). Research indicates that schools oftentimes do not select the right students for the

12
appropriate intervention strategy or program (Gleason & Dynarski, 2002). Therefore, it was
imperative that the appropriate variables were selected so that intervention recommendations
would be focused on the right students.
Significance of Study
Research is needed to expand the current field of knowledge dealing with the issue of
students who drop out of high school. As mentioned previously, a large percentage of students
who drop out of high school in Georgia do so in large metropolitan areas that include urban
regions (Wheelcock & Miao, 2005). Therefore, an empirical study focusing on variables
associated with higher dropout rates in high schools in a large metropolitan area will add to the
current literature pertaining to high-school dropout rates.
Practitioners at the school level will be able to utilize the results of this study to
implement intervention strategies that will reduce the dropout rate for schools in the large
metropolitan area in the southeastern United States included in this study. More specifically, by
learning which variables had the greatest impact on school dropout rates, school system
personnel, counselors, and teachers will be able to implement intervention strategies that target
those variables. Furthermore, by developing a regression model designed to predict dropout
rates, schools can predict their expected dropout rates once projected enrollment for a given
group of students is known. In addition, policymakers will have a better understanding of the
high-school dropout issue pertaining to urbanized areas and, as a result, can tailor policies to help
school systems become more compliant with the federal No Child Left Behind Act of
2001([NCLB], 2002).

13
CHAPTER 2
REVIEW OF LITERATURE
This literature review begins with a brief history of the development and the current
status of the education system in the United States. The rest of the chapter will focus on different
topics related to the issue of dropping out of school including school climate, school
organizational structure, and various theories related to dropping out of school. Finally, this
chapter highlights examples of successful intervention programs such as the Coca-Cola Valued
Youth Program, Check & Connect, Career Academies, JROTCCA, and ALAS that are designed
to help diminish the risk of dropping out of school.
Introduction
One of the earliest attempts at developing a formal education system in the United States
can be traced back to the late 1700s (Padover, 1952). Thomas Jefferson was one of the early
pioneers who influenced the process of creating a formal education system in the United States.
Jefferson was so concerned about the necessity of education in the everyday lives of people that
he made attempts to add an amendment to the United States constitution to legalize federal
support for education (Padover, 1952). After initial attempts by Jefferson to add an amendment
to the constitution failed, he proposed a two-track educational system which included
elementary, secondary and post secondary levels of education for the people of the state of
Virginia (Padover, 1952).
Formal high school education has been a more recent development compared to the
overall education system first proposed by Thomas Jefferson in the late 1700’s. Even though the

14
first and oldest high school in the United States opened in 1821, it wasn’t until 1874, when a
Michigan Supreme Court ruling established the precedent that every student had a basic right to
a comprehensive education, that high schools became an integral component of the education
system in the United States (Gordon, 2005). As a result of the ruling handed down by the
Michigan Supreme court, the United States educational system has evolved into a two-track
system whereby students have the opportunity to attend a comprehensive high school that offers
the choice between vocational and liberal arts classes (Gordon, 2005). Ever since Thomas
Jefferson’s initial attempts at establishing a formal education system for the people of Virginia,
education in America has slowly evolved to the modern form of education as a result of
philosophical beliefs, theoretical frameworks, historical positions, and legislative practices.
Modern day schools, including high schools, are faced with many issues that did not exist
100 years ago. A review of the current and projected demographics indicate that, going forward,
schools will not be able to operate as they have over the last 150 plus years utilizing the
European model of education. Demographic changes alone will necessitate a different approach.
For example, it is projected that the Hispanic population will triple to over 102 million people, or
24% of the total U.S. population, by the year 2050 (Buchanan, 2006). In addition, it is projected
that, by the year 2050, Americans of European decent will no longer be the majority.
Furthermore, many immigrants who enter the U.S. are coming from third world countries,
hanging on to the traditions and customs of their heritage and are not assimilating to the degree
that past immigrants assimilated into Western culture (Buchanan, 2006). As a result, the United
States education model, established so many years ago, is now being tested in many ways
(Buchanan, 2006; Snipes & Casserly, 2004).

15
Modern day school systems in urban areas face many challenges. Demographic shifts
will compel urban school systems to adapt and accommodate more diversity and cultural
differences than ever before (Snipes & Casserly, 2004). Other contemporary challenges that
urban school systems face include teacher shortages (Dill & Stafford-Johnson, 2003),
unqualified teachers (Lankford, Loeb, & Wyckoff, 2002), achievement gaps (Anyon, 1997),
inadequate curriculum (Hale, 2001), ineffective teaching practices (Bost & Riccomini, 2006),
overcrowded schools (Driscoll, Halcuissis, & Svorny, 2002), increased poverty rates (Peterson,
1991), and high dropout rates (Green, 2001; Montecel et al., 2004).
In efforts to help combat the issues facing modern day schools, much research is being
conducted to determine the best reform policies to implement in order to improve student success
(e.g. Lewis, James, Hancock, & Hill-Jackson, 2008; Margolis, 2006). A great deal of research
already has been conducted and will continue in order to determine the best way to tackle these
modern day issues facing public school systems.
School Climate
One of the ways in which school systems can improve graduation rates is through the
adoption of a philosophical viewpoint that promotes a positive school climate or school culture
through academic excellence (Lee & Burkham, 2003). Definitions of the term “school climate”
vary considerably among researchers, scholars, and practitioners (Cohen, 2006). One definition
given for school climate, provided by Freiberg and Stein (1999), is “the heart and soul of a
school” (p.11). Vang (2006) defines school culture as “hegemonic value systems under which
schools operate” (p. 20). Furthermore, Goldring (2003) identifies shared vision, traditions,
collaboration, shared decision making, communication, and innovation as key characteristics of

16
schools that have been recognized as promoting excellent school culture in which students were
achieving academically at a higher rate than other school systems.
Various studies have been conducted that support the philosophical approach that a
positive school climate, culture, or organizational structure produces academic achievement
which, ultimately, improves graduation rates (e.g. Bulach, & Malone, 1994; Deal & Peterson,
1999; Hartnett, 2008; Stewart, 2008; Sweetland & Hoy, 2000; Towns, Cole-Henderson, &
Serpell, 2001; Van Der Westhuizen, Mosoge, Swanepoel, & Coestsee, 2005).
One example of a school system that promotes a positive school climate is in Queens,
New York. The principal of this school emphasizes a positive school culture through building
personal relationships with students and teachers as well as a focus on character development
and has had remarkable success in reducing the dropout rate at Elmont Memorial Junior-Senior
High School in Queens New York (Jerald, 2006). Statistics released by the New York
Department of Education show that 97% of ninth grade students who attend Elmont Memorial
Junior Senior-High School graduate on time with a high school diploma (Jerald, 2006).
School Organizational Structure
School organizational structure, which is often measured by the size of the school or
class, can influence the rate of student achievement and affect the dropout rate (Kuziemko,
2006). A reduction in class size can have positive effects on student achievement and reduce the
dropout rate (Kuziemko, 2006; McNeal, 1997; Rumberger, 1995). In addition, it has been shown
that large school districts, typical of many urban school systems, have higher dropout rates than
smaller school districts (Fetler, 1989; Finn & Voekl, 1993).
School organizational structure and culture can have a negative effect on the rate of
student absenteeism and truancy (Epstein & Sheldon, 2002). This is of particular importance

17
since it is well documented in the literature that absenteeism is one of the key variables
associated with dropping out of school (Allensworth & Easton, 2005; Jerald, 2006; Neild &
Balfanz, 2006).
One study explored the role of peer group identity and delved into how the organizational
school structure endorses certain peer groups while overlooking other peer groups, thus
influencing the rate of absenteeism among high school students (Hartnett, 2008). Two ways in
which certain peer groups are rejected by the school culture include simple peer group identity as
well as attendance policies that reject certain peer groups while allowing and accommodating for
others (Hartnett, 2008). Policy recommendations that can be implemented to improve absentee
rates by changing the school culture include not making distinctions between unexcused and
excused absences, thereby limiting the chances for favoritism, including every peer identity
group in school assemblies so as to not show favoritism among certain groups, and by limiting
the number of acceptable excused absences (Hartnett, 2008). Epstein and Sheldon, (2002) note
that, to improve attendance rates, “schools need to change the way they are structured, improve
the quality of courses, and intensify interpersonal relationships between students and teachers”
(p. 309).
The inadequate distribution of funds is one way school districts can affect the school
organizational structure which can, in turn, affect the dropout rate in high schools. For example,
many schools that have needed the most funding have typically operated on the least amount of
money and these schools are often found in America’s poor inner cities (Barr & Parrett, 2007).
Proof of inadequate funding levels can be found in the results of a recent lawsuit in the state of
California. The state of California has to pay $188 million as a result of a class action lawsuit

18
brought against the state for unequally funding schools with low-income students (Barr &
Parrett, 2007).
Each year The Education Trust [TET, (2006)] compiles a report to determine the
disparities or funding gaps that exist between high and low poverty and high and low minority
school districts. The research is based on a review from the U.S. Census Bureau which details
school level district financial data. Results from the most recent report indicate that huge
disparities still exist between and within school districts (Liu, 2006). Formulas used to calculate
Title I funds, one component of the Elementary and Secondary Education Act of 1965, are
problematic and result in inadequate funding for school systems that need the money the most,
urban school systems with high rates of poverty and high numbers of minority students (Alliance
for Excellent Education, 2001; Liu, 2006). Furthermore, Wiener and Pristoop (2006) note “in 28
states, high minority districts receive less state and local money for each child than low minority
districts. Across the country, $908 less per student is spent on students in the districts educating
the most students of color, as compared to the districts educating the fewest students of color” (p.
6).
The practice of placing poorly trained and under-qualified teachers in school systems that
can afford it the least is yet another example of a way school districts can affect the school
organizational structure. It is well documented that many urban school systems often place the
least qualified teachers in low performing schools that oftentimes have the highest rates of
poverty and minority students (Lankford et al., 2002). Furthermore, many urban school systems
face a greater teacher shortage compared to the suburban school systems due to high teacher
turnover rates (Dill & Stafford-Johnson, 2003; Ingersoll, 2003; McDonnell, 2005). In addition,
research indicates that many teachers leave schools with high numbers of low achieving students

19
for school systems that have a higher achieving student population, which often results in school
systems being left with teacher vacancies and individuals who are unqualified to teach (Betts,
Rueben, & Danenberg, 2000).
Studies have shown that schools that do not actively promote a positive school structure
or culture often create an environment that engenders student failure and increased dropout rates
(Gottfredson, G. & Gottfredson, D., 1989; Lee & Burkham, 2003).
One qualitative study investigated how school structure and culture influenced the
instructional practices of teachers in a given school and contributed to decreased high school
graduation rates and increased dropout rates (Patterson, Hale, & Stessman, 2007). As a result of
the instructional practices of the teachers, contradictions between the school structure and culture
led to contradictions with the home culture of many of the students, which, ultimately,
contributed to the dropout rate (Patterson et al., 2007).
The setting in which the qualitative case study took place is typical of many urban school
systems in the United States. The school, once dominated by White middle class families, has
experienced a recent influx of immigrants from Mexico and Central America. Statistics for the
school show that, during the time the case study was conducted, the student demographic
composition was 39.7 percent Hispanic, 36.5 percent White, 17.6 percent African American, 1.9
percent American Indian, and 4.4 percent Asian (Patterson et al., 2007).
The study documented many examples of the degree to which teacher values and
attitudes toward certain demographic groups within the school actually influenced the
instructional practices of the teachers. Patterson et al. (2007) point out that “faculty and staff
often stated one value but then described actions that were inconsistent with that stated value” (p.
6). Furthermore, many of the faculty and staff viewed the minority students as lacking the ability

20
to achieve simply because of their minority status or family background. Patterson et al. (2007)
notes that “we found contradictions between the faculty and staff’s valuing of diversity and the
beliefs they expressed about many of their students” (p.7). Furthermore, the study revealed
contradictory beliefs among teachers regarding the expectations of parents and families for
student achievement. The researchers noted that some of the teachers perceived the parents of
many of the Latino students as not valuing education since they were not as involved in the
school, even though factors such as “parent work schedules, and needs for transportation and
childcare make it difficult for them to be involved in school in ways the dominant culture
expects” (p.7).
Historically, the impact of instructional methods and best practices on graduation rates
has been a source of disagreement among researchers (Ornstein & Hunkins, 1997; Tanner &
Tanner, 2007). One of the earliest pioneers who influenced the development of instruction was
Joseph Lancaster. He devised a system whereby more educated students taught poor and
uneducated students under the guidance of one master teacher, which enabled large numbers of
students to receive instruction at one time (Raymen, 1981). This form of instruction allowed for
more rote memorization through a process of monitorial instruction (Tanner & Tanner, 2007). As
a result of monitorial instruction, schools were allowed to teach large numbers of students at one
time. Raymen, (1981) notes that the United States adopted the Lancasterian method because
the rise of urbanization, cities, and the working class fomented a groundless paranoia that
rebellion of some description was imminent from landless wage earners unless they were
educated. Schools modeled on the plan soon opened in Philadelphia, New Haven,
Pittsburgh, and Washington City (later Washington, District of Columbia) and the plan

21
was employed from the founding of the New York City public school system in 1806 (p.
397)
This approach to instruction differed greatly from the philosophical approach of John
Dewey (Tanner & Tanner, 2007). He espoused the philosophy that all students learn better in
smaller classes that offer face-to-face contact between the student and the teacher (Tanner &
Tanner, 2007).
Research indicates that the curriculum utilized by school districts can affect graduation
rates (Minhui, 2007). Posner (2004) identifies five different curricula that often exist within
school systems including official, hidden, operational, null, and extra curriculum. Posner (2004)
defines each of the concurrent curricula as
official curriculum, or written curriculum, is documented in scope and sequence charts,
syllabi, curriculum guides course outlines, standards, and lists of objectives. Operational
curriculum consists of what is actually taught by the teachers and how its importance is
communicated to the students. Its purpose is to give teachers a basis for planning lessons
and evaluating students, and administrators a basis for supervising and holding them
accountable for their practices and results. The hidden curriculum is not generally
acknowledged by school officials but may have a deeper impact and more durable impact
on students than the official or operational curriculum. Null curriculum consists of those
subject matters not taught, and any consideration of it must focus on why these subjects
are ignored. Extra curriculum comprises all those planned experiences outside of the
school subjects. It contrasts with the official curriculum by virtue of its nature and its
responsiveness of students (pp. 12-13)

22
Vang (2006) notes that “the hidden curriculum is an underlying agenda that affects
students of low socioeconomic status, particularly language-minority students” (p. 20).
Furthermore, social control through the hidden curriculum also places students at a disadvantage
and inhibits academic success (Minhui, 2007). It has been asserted that social control of the
curriculum influences students to be unsuccessful in school through the “language of class” that
orients students into certain groups which oftentimes puts them at a disadvantage for school
completion (Minhui, 2007).
Historically, curriculum development has been influenced and shaped by a number of
educators including Johann Pestalozzi, Johann Friedrich, Madeline Hunter (Tanner & Tanner,
2007). A more recent educator whose theory and philosophical approach to curriculum
development still impacts education today is Ralph Tyler (Hunkins & Hammill, 1994). Tyler’s
book, Basic Principles of Curriculum and Instruction (1949), is still read in education classes to
get an understanding of curriculum development from Tyler’s philosophical viewpoint. Tyler
espoused the belief that curriculum should be based on four fundamental questions when
developing any curriculum. Tyler’s four questions include
1. What educational purposes should the school seek to attain?
2. What educational experiences can be provided that are likely to attain these purposes?
3. How can these educational experiences be effectively organized?
4. How can we determine whether these purposes are being attained? (p. 1)
It is important to highlight Tyler’s basic questions since the content of the curriculum is
the driving force used to educate students and the development of the curriculum is the
foundation on which the content is based. Since the development of curriculum is so important to
educational success, there is much debate among educators regarding the usefulness of Tyler’s

23
philosophical approach to curriculum development. The following paragraphs will highlight an
example of contemporary thought that is in direct contrast to what Tyler espoused in his book,
Basic Principles of Curriculum and Instruction (1949).
One of the topics covered in Tyler’s book is the development of objectives for the
curriculum. Tyler’s approach to building objectives is grounded in the belief that “no single
source of information is adequate to provide a basis for wise and comprehensive decisions about
the objectives of the school….Each source should be given some consideration in planning any
comprehensive curriculum program” (p.5). Tyler examines four different sources to determine
what “kinds of information can be obtained from the source and how this source may suggest
significant educational objectives” (p.5). One of the sources Tyler considers as necessary when
building objectives for a curriculum is the identification of a student’s “needs.” Other sources
that need to be considered when developing objectives for curriculum include contemporary life
or what may be relevant to the time period and subject specialists as resources to develop the
objectives. In addition, one must have a philosophical framework to guide the three sources in
order to develop a quality curriculum. In a broader sense, Tyler believes that objectives should
be kept general rather than specific so that the objectives can be a tool to selecting learning
experiences. For example, Tyler states “In organizing a single list of important objectives it is
desirable to state these objectives in a form which makes them most helpful in selecting learning
experiences and in guiding teaching” (p. 44).
One contemporary author of curriculum development is Allan Glatthorn (2001). His
approach to curriculum development is often in contrast to what Tyler purported throughout his
career. Whereas Tyler believed in general objectives, Glatthorn takes a more targeted approach
to developing objectives within curriculum development. Glatthorn states “First, classify the

24
objectives as either mastery, organic, or enriched” (p. 50). Glatthorn emphasizes the importance
of mastery learning and ultimately this emphasis on mastery learning proves to be a targeted
approach to the development of the objectives for the curriculum.
Another philosophical disagreement regarding curriculum is the approach taken to
determine what curriculum should be taught. For example Orenstein and Hunkins (1997) state
the following regarding an educators approach to curriculum
A curriculum approach reflects a holistic position or a metaorientation, encompassing the
foundations of curriculum (the person’s philosophy, view of history, view of psychology
and learning theory, and view of social issues), domains of curriculum (common and
important knowledge within the field), and the theoretical and practical principles of
curriculum (p. 2).
Ornstein and Hunkins (1997) classify the curriculum development approach into five
different approaches using a scientific or non-scientific categorization. Scientific approaches
“coincide with traditional theories and models of education and reflect established and formal
methods of schooling” (p. 3). Whereas, non-scientific approaches are defined as having “evolved
as part of avant-garde and experimental philosophies and policies of education; they tend to
challenge established and formalized practices of education. Furthermore, non-technical
approaches reflect the views of postposivitists or postmodernists” (p. 3). The five different
techniques that drive how educators determine what should be included in curriculum include
behavioral, managerial, systems, academic, and humanistic approaches (Ornstein & Hunkins,
1997). This is important to point out because the curriculum that educators adopt, based on their
worldview, greatly influences what is taught in schools today. For example, it is documented that
urban school systems do a poor job of teaching culturally current curriculum in schools (Hale,
25
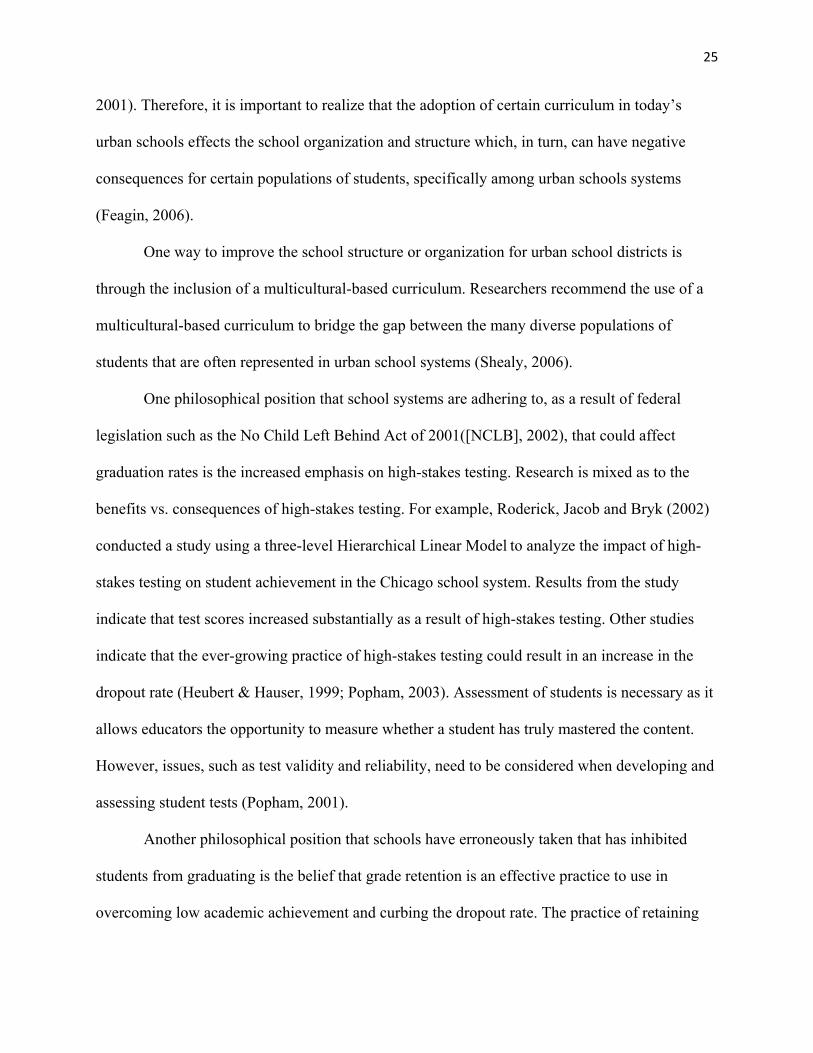
2001). Therefore, it is important to realize that the adoption of certain curriculum in today’s
urban schools effects the school organization and structure which, in turn, can have negative
consequences for certain populations of students, specifically among urban schools systems
(Feagin, 2006).
One way to improve the school structure or organization for urban school districts is
through the inclusion of a multicultural-based curriculum. Researchers recommend the use of a
multicultural-based curriculum to bridge the gap between the many diverse populations of
students that are often represented in urban school systems (Shealy, 2006).
One philosophical position that school systems are adhering to, as a result of federal
legislation such as the No Child Left Behind Act of 2001([NCLB], 2002), that could affect
graduation rates is the increased emphasis on high-stakes testing. Research is mixed as to the
benefits vs. consequences of high-stakes testing. For example, Roderick, Jacob and Bryk (2002)
conducted a study using a three-level Hierarchical Linear Model to analyze the impact of high-
stakes testing on student achievement in the Chicago school system. Results from the study
indicate that test scores increased substantially as a result of high-stakes testing. Other studies
indicate that the ever-growing practice of high-stakes testing could result in an increase in the
dropout rate (Heubert & Hauser, 1999; Popham, 2003). Assessment of students is necessary as it
allows educators the opportunity to measure whether a student has truly mastered the content.
However, issues, such as test validity and reliability, need to be considered when developing and
assessing student tests (Popham, 2001).
Another philosophical position that schools have erroneously taken that has inhibited
students from graduating is the belief that grade retention is an effective practice to use in
overcoming low academic achievement and curbing the dropout rate. The practice of retaining

26
students has been around for many decades (Dawson, 1998). The number of students retained
each year in schools across the United States is estimated to be around 10% or approximately 2.5
million students (Dawson, 1998). Research shows that many urban school districts retain large
numbers of students, specifically during their 9th grade year (Neild & Balfanz, 2006).
One of the reasons often cited in the literature as a reason why students are retained is to
improve academic performance (Neild, Stoner-Eby, &Furstenberg, 2008; Natale, 1991; McCoy
& Reynolds, 1999). However, as early as 1975, Jackson concluded, as a result of a meta-analysis
of research regarding grade retention, that grade retention was not appropriate for improving
academic performance (Jimerson, 2001). More importantly, there is a correlation between
student retention and dropping out of school (Alexander et al., 2001; Roderick, 1995; Rumberger
& Larson, 1998).
Allowing students to become disengaged in the educational process is another
philosophical position, albeit an unintentional one, that school systems have taken in the past that
can affect the student dropout rate. Finn (1989) characterized the process of dropping out of
school as a “gradual one” that culminated in the final act of a student withdrawing from school.
The two models proposed by Finn (1989) for viewing dropping out of school as a developmental
process are the frustration-self-esteem model and the participation-identification model.
The frustration-self-esteem model, originally developed by Bernstein & Rulo (1976),
highlights the consequences of a school’s continued mishandling of a students misbehavior
which allows a student to become disengaged in the academic process (Finn, 1989). For
example, the frustration-self-esteem model purports that a schools deficient handling of
problematic behavior leads students to develop a reduced level of self-esteem which, in turn, can
produce unsuccessful school outcomes including dropping out of school (Finn, 1989).

27
A study conducted by Croninger & Lee (2001) revealed that teachers were an important
source of “social capital” and that students who had academic difficulties and were from
disadvantaged backgrounds benefited from the guidance and assistance from teachers and that
“teacher-based forms of social capital reduce the probability of dropping out by nearly half” (p.
548). The implications from this study are that teachers can have a profound effect on a student’s
level of achievement. As part of the disengagement process, students who feel alienated from
school are more likely to drop out (Bridgeland, Dilulio, & Morison, 2006) and school structure
and social organization have an effect on alienation and dropping out of school (Byrk & Thum,
1989).
Further evidence can be found, based on a review of the literature, regarding the
devastating impacts of a lack of engagement on students as they transition from middle school to
high school. One research study noted that African American male students in Chicago were
50% more likely to fail a major subject during their 9th grade year during the first semester than
9th grade African American females (Roderick & Camburn, 1999). The lack of engagement by
the African American males was attributed to the environment of the school’s organizational
structure (Roderick & Camburn, 1999).
Theories on Dropping Out of School
Currently, there is a gap in the literature on theories put forward to explain why students
drop out of school. Researchers have noted most of the studies conducted regarding the issue of
why students drop out of school are “atheoretical” (Holland & Andre, 1987).
To further complicate the challenge of utilizing theories to help explicate why students
drop out of school, some researchers believe there is no one theory that adequately explains why
students drop out of school (Newcomb et al., 2002). Additionally, Battin-Pearson et al., (2000)

28
conducted a study in which the purpose was to determine which theory adequately predicts
which students are going to drop out of high school. However, the researchers were able to
determine that “none of the theories tested was fully adequate to explain the data, although
partial support was obtained for each theory” (p. 568). As a result of the findings outlined in the
study conducted by Battin-Pearson et al., (2000) it was determined that no single theory was
adequate for the study. Therefore, the study was “atheoretical” since no one theory adequately
encompasses all of the chosen variables. Additionally, in order to demonstrate why no single
theory enables the identification of all of the variables, a review of multiple theories relating to
the subject of dropping out of school was conducted. Some of the theories evaluated were
attachment theory, the classical theory of urbanism, alienation theory, self determination theory,
theory of engagement, and social control theory. Each of the theories listed provided a basis to
select some but not all of the variables to be examined to help predict dropout rates.
Additionally, after an exhaustive review of the literature, no research studies were found in
which the theories reviewed were applied to help explain why students drop out of school or to
help predict dropout rates. Therefore, the study did not use any one theory to assess the impact of
the variables selected on dropout rates.
Over many decades, a vast amount of research has been conducted to get a better
understanding of the origins and causes of deviant behavior among individuals. Typically, in
sociological literature, deviance is classified as “general norm-violating behaviors” (Jessor &
Jessor, 1977) or “specific deviant behaviors” including drug use, sexual involvement, and
delinquency (Newcomb et al., 2002). Regarding the issue of deviant behavior and school dropout
rates, most of the research that has been conducted has looked at specific acts of deviance to
predict student failure in high school (Ellickson, Bui, Bell, & McGurigan, 1998); while fewer

29
studies have been conducted to get a better understanding of a construct of general deviance and
its contribution to the inability to finish school (Newcomb et al., 2002).
There are numerous theories espoused by social psychologists to explain acts of deviant
behavior. Tittle (1995) attempts to lump many of the theories used to elucidate deviant behavior
into seven major categories. He identifies strain, learning, labeling, control, opportunity,
psychodynamic, and biological categories as the major areas within deviance theory. McGee and
Newcomb (1992) categorize different theories of deviance by those that “emphasize common
causes for a variety of deviant behaviors and do not differentiate factors that lead to one type of
deviant behavior from those that lead to another type” (p. 767), including: problem behavior
theory, social learning theory, self derogation theory, social control theory, and strain theory. As
with many other fields of academic research, there is much debate over the best theories to apply
to explain what causes different forms of deviance. Therefore, ongoing empirical studies are
continuously being conducted to refine and support prevailing theories of deviance.
Theory of Urbanism
In addition to the aforementioned theories used to describe deviant behaviors, other
macro-level theories not directly tied to dropping out of school exist. Some of these theories
include components that touch on deviant behavior and, as a result, should be included when
evaluating factors contributing to school dropout. One such theory is the classical theory of
urbanism (Tittle & Stafford, 1992). Classical theory of urbanism suggests that many forms of
deviant behavior occur as a result of urban features (Tittle & Stafford, 1992). This theory
proposes that acts of deviant behavior stem from conditions typically found in urban settings
including overcrowding, ethnically diverse populations, and high rates of poverty. Tittle and
Stafford (1992) note that such conditions foster “large numbers of social interactions, numerous

30
encounters with people not known personally, and the capacity to remain anonymous” (p. 726).
Such conditions can cause “weak social bonds, promote alienation and tolerance, and undermine
social control, permitting deviant behavior” (p. 726). The aforementioned characteristics are
referenced in some theories used to explain deviant behavior and dropping out of school.
Therefore, it is necessary to highlight classical theory of urbanism as a broad, encompassing,
macro-level theory that complements other theories used for explaining the act of dropping out
of high school.
There was one clear limitation in using the theory of urbanism for the study. The primary
reason the theory of urbanism was not adequate is that the study included school systems that are
located in both suburban and rural areas in addition to including schools in urban areas.
Therefore, the theory of urbanism might partially explain why some students drop out of school
in an urban setting but it would not be applicable for students who live in suburban or rural areas,
such as the ones found in the large metropolitan area selected for the study.
Theory of Anomie
Many contemporary sociologists have developed theories of deviance based on the work
of Emile Durkheim’s theory of anomie. Use of the influential work done by Durkheim (1933) is
still prevalent today in existing theories used to explain why individuals adopt various forms of
deviant behaviors including those that can lead an individual to drop out of school (LeCompte &
Dworkin, 1991). Durkheim’s book, The Division of Labor in Society (1933), espouses the role
anomie plays in the breakdown of society. “The state of anomie is impossible whenever
interdependent organs are sufficiently in contact to each other, they are readily aware, in every
situation, of the need which they have an active and permanent feeling of mutual dependence”
(p. 184). As the state of society becomes more complex, a development that can happen during

31
times of rapid social change or political upheaval, the social bonds that exist tend to break down,
causing individuals to practice various forms of deviant behavior.
Strain Theory
Robert Merton (1968) built upon Durkheim’s theory of anomie and conceptualized strain
theory as a way to explain why individuals adopt certain forms of deviant behavior. Merton’s
strain theory is described as “a gap between culturally prescribed goals and structurally or
institutionally available means to attaining such goals” (LeCompte & Dworkin, 1991, p. 146). In
addition, Merton’s strain theory purports that those individuals who commit deviant acts do so as
a form of adaptation to bridge the gap between society’s norms and the individual’s inability to
achieve those socioeconomic goals (Siegel, 2003).
Alienation Theory
Alienation theory, which is used to explain why students drop out of school, is derived
from Merton’s strain theory (LeCompte & Dworkin, 1991). Alienation theory has been utilized
to gain a better understanding of why students become disengaged from the academic process
and eventually drop out of school (Fine, 1986). When individuals feel the strain of not closing
the gap between their experiences or capabilities and cultural norms, one response these
individuals may have is to alienate themselves from society (Fine, 1986).
In reference to dropping out of school, alienation theory suggest that students who drop
out of school do so because they lack positive relationships with teachers and peers, resulting in
an individual alienating himself from school, thus creating an environment that provides a reason
for a student to withdraw from school (Newmann, 1981). Studies have shown that some students
leave school primarily because they feel that the teachers did not care about them or viewed them
as troublemakers and were not supportive of them (e.g. Fine, 1986). In addition to student-

32
teacher relationships, other factors that affect a student’s decision to alienate and eventually
withdraw from school include school structure and social organization (Bryk & Thum, 1989).
Alienation theory has its own limitations when it comes to explaining why students drop
out of school. Croninger and Lee (2001) assert that, although a theory of alienation can explain
why some students drop out of school as a result of poor student-teacher relationships, a theory
of social capital might be needed to explain why students drop out of school as a result of poor
relationship development within the entire school organization. Croninger and Lee (2001)
maintain that social capital, defined as “small networks of relationships and broad societal
patterns of interactions” (p.553) enables individuals to be productive in school and that, without
these positive relationships that exist within the overall school organization, adolescents are
more likely to drop out of school. As a result, Croninger and Lee (2001) contend that a theory of
social capital is better suited to explain why students drop out of school as a result of poor
relationships within school organizations. Croninger and Lee (2001) write
although alienation theory goes beyond a narrow focus on social control as an
explanation for why some students drop out of school rather than others, such theories
shed little light on the ways in which students and teachers negotiate access to valued
social resources…. Whereas alienation theory tends to focus on the absence of positive
ties between students and teachers in explaining student outcomes, we believe that it
would be more useful to focus on the nature of social ties that different groups of
students have with their teachers. (p. 553-554)
While Croniger and Lee (2001) suggest investigating the application of social capital theory, this
theory cannot be connected to all variables selected in the study as well so, similarly, the theory
was not a candidate for providing a theoretical basis for the study.

33
Motivation, or lack thereof, has been shown to be a possible reason why students drop
out of school (Tidwell, 1988). One theory found in the literature studying the motivational
influences that determine whether or not a student will drop out of school is self determination
theory (Deci &Ryan, 1985).
Self Determination Theory
Self determination theory is a macro theory of human motivation that has evolved over
thirty years of research based on the work of Edward Deci, Richard Ryan and fellow
collaborators (Ryan, Kuhl, & Deci, 1997). The theory has been utilized in various fields of
research and has applications for education, mental health, healthcare, and parenting (Deci &
Ryan, 1985). The theory of self determination is based primarily on three innate needs found in
every individual. The three needs that self determination theory focuses on are competence,
relatedness, and self determination (Deci, Vallerand, Pelletier, & Ryan, 1991). When referring to
self determination theory, Deci et al. (1991), state “competence involves understanding how to
attain various external and internal outcomes and being efficacious in performing the requisite
actions; relatedness involves developing secure and satisfying connections with others in one’s
social milieu; and autonomy refers to being self-initiating and self-regulating of one’s own
actions” (p. 327).
One other defining concept of self determination theory is the view of self determination
related to intrinsic and extrinsic motivation. Intrinsically motivated behaviors are those that are
done without any sort of outside reward or constraint being placed upon the individual to
complete the task (Deci & Ryan, 1985). In contrast, extrinsically motivated behavior is defined
by Deci et al. (1991) as behavior that is “not performed out of interest but because they are
believed to be instrumental to some separable consequence” (p. 328). The four types of extrinsic

34
motivation identified in the literature include external, identified, introjected, and integrated
forms of regulation (Deci et al., 1991).
From an educational perspective, self determination theory is concerned with promoting
in students an interest in learning, a valuing of education, and a confidence in their own
attainable attributes (Deci et al., 1991). Self determination theory contends that students
determine their sense of competence and self determination in school based on the relevance and
the level of interest to the students’ lives (Hardre & Reeve, 2003). Students who fulfill the basic
needs of competence and self determination from school activities are more inclined to find
enjoyment and engagement during the educational process (Ryan & Deci, 2000). If the
individuals do not find enjoyment and engagement during the educational process, then students’
self determination to persist in school declines. This development can result in withdrawing from
the educational process (Hardre & Reeve, 2003).
Two types of milieu can be fostered during a student’s educational career that can have
direct influences on the outcome of the student’s motivational level (Reeve, Bolt, & Cai, 1999).
Autonomy-supportive environments, which support a students’ need for competence and self
determination is one type and controlling environments that do not foster a student’s need for
competence and self regulation is another type of environment (Reeve et al., 1999).
Consequently, motivational models have been created to provide a theoretical framework that
can be used to explain why students drop out of school (Hardre & Reeve, 2003; & Vallerand,
Fortier, & Guay, 1997). One such motivational model is based on a student’s intrinsic or
extrinsic motivation and is grounded in self determination theory (Vallerand et al., 1997). This
model suggests that students’ feelings of competence in determining their own capabilities and
autonomy are influenced by teachers, parents, and school personnel. In effect, the motivational

35
model purports that those students who are treated with less supportive interactions, in turn,
experience decreased levels of competence. As a result, these students begin a downward spiral
into lower levels of self-determined motivation that, ultimately, results in dropping out of school
(Vallerand et al., 1997).
Ultimately, even though self determination theory can be utilized to explain why some
students drop out of school due to a lack of motivation, the theory does not adequately address
all of the variables chosen for the study. For example, even though high school size is related to
increased dropout rates (Lehr, Johnson, et al., 2004), no study was found in the literature review
connecting school size, self determination theory, and dropping out of school. Therefore, it was
determined that self determination theory would not be utilized for the study.
Theory of Engagement
One theory based on a model of social development that is used to explain why students
drop out was developed by Finn (1989) and is referred to as the theory of engagement. Finn
describes the dropout process as a very gradual one that, over time, culminates with a student
dropping out of school. Finn (1989) proposed two models for viewing dropping out of school as
a developmental process. Finn (1989) writes
the “frustration-self-esteem model” has been used frequently to explain schools’ effects
on disruptive behavior and juvenile delinquency; it offers one perspective for
understanding dropping out as well. The “participation-identification model” emphasizes
the importance of youngster’s “bonding” with school; when this does not occur, the
likelihood of problem behavior, including leaving school before graduation, is increased.
(p.118)
36
The frustration self-esteem model, originally developed by Bernstein and Rulo (1976),
purports that a school’s deficient handling of problematic behavior results in students developing
a reduced level of self-esteem which, in turn, can produce unsuccessful school outcomes (Finn,
1989). In addition, negative peer influences further exacerbate the problem (Finn, 1989).
Even though the theory of engagement is useful in explaining why some students drop
out of school due to an inability to conform to societal expectations within school, it did not
adequately address all of the variables associated with the study. For example, there was no
study found in the literature review connecting the theory of engagement to limited English
proficiency and dropping out of school. Therefore, it was determined that the theory of
engagement would not be utilized for the study.
Attachment Theory
Attachment theory is yet another theory that has been cited in the literature as a theory
used to explain why students drop out of school (e.g., Pianta, 1999). Attachment theory was
originally developed and reformulated over many years by the combined work of John Bowlby
and Mary Ainsworth (Ainsworth & Bowlby, 1991). A recent article published by Jimerson,
Coffino, and Sroufe, (2007) lauds the usefulness of the theory of attachment and indicates that,
“because of its salience and precision, the theory has led to an outpouring of research and
application, and the core hypotheses have now been amply supported” (p. 79).
The main tenets behind the theory of attachment are broad and complex. However, a
classification system exists to define the different forms of attachment patterns that a child
develops early in life. Bowlby’s attachment theory was the genesis of later work that was
conducted by Ainsworth in which the Strange Situation Procedure was developed to measure the

37
level of attachment a child has to early caregivers and to assess the impact this attachment has on
the individual the rest of his or her life (Kennedy & Kennedy, 2004).
Using the Strange Situation Procedure, Ainsworth and Bell classified infants into one of
three categories: 1) secure, in which infants use the mother as a secure base for
exploration and seek contact with her after separation; 2) anxious-ambivalent, in which
infants are unable to use the mother as a secure base and are often angry and push her
away upon reunion; 3) anxious-avoidant, in which infants fail to use the mother as a
secure base for exploration and avoid the mother upon reunion or approach her only
indirectly; 4) In more recent work Main & Solomon, (1990) a fourth category was
devised disorganized-disoriented in which there is no predictable or effective pattern of
eliciting care giving behaviors by infants when stressed. (p. 248)
Attachment theory purports that the level of childhood security affects many aspects of a
person’s life, from early childhood throughout his or her adult life. Issues such as infant
temperament and family-and-peer relationships are affected by early levels of secure attachment
(Bowlby, 1988). Therefore, without the appropriate levels of secure attachment, many children
will lack the necessary coping skills to attach to families, teachers, and other pro-social
institutions. Without the ability to attach to these pro-social institutions, students are more likely
not to complete school (Marcus & Sanders-Reio, 2001).
Even though the theory of attachment has been utilized in studies, it cannot adequately
address all of the variables selected for the study. While variables such as ethnicity, gender, and
socioeconomic status are highlighted by Marcus and Sanders-Reio (2001) as examples of
proximal and distal influences of attachment affecting school dropout rates, variables such as

38
school size, school location, and special education status cannot be included as proximal and
distal influences of attachment. Therefore, attachment theory was not utilized for the study.
Jimerson, Egeland, Sroufe, & Carlson (2000) found that, by using a developmental
transaction model based on attachment theory, they were able to conclude that dropping out is a
process that begins early in a child’s life. “The child’s early home environment and quality of
early care giving emerged as powerful predictors of whether a student remained in a traditional
program or dropped out of school” (p. 542). Using this transactional model, they were able to
predict with 77% accuracy which students would drop out of school (Jimerson et al., 2000).
Additional theories advanced to predict which students will drop out of school are
highlighted in a research study conducted by Battin-Pearson et al., (2000). The theories that were
studied include full academic mediation, general deviance, deviant affiliation, poor family
socialization, and structural strain theory.
The purpose of the study conducted by Battin-Pearson et al., (2000) was to determine
which theory adequately predicts which students are going to drop out of high school. Each
theory offers empirical research to support their reasoning as to why students drop out of school.
As a result of this study, the researchers were able to determine that “none of the theories tested
was fully adequate to explain the data, although partial support was obtained for each theory” (p.
568). As a result of the findings outlined in the study conducted by Battin-Pearson et al., (2000),
it was determined that none of the aforementioned theories were adequate for the study.
Social Control Theory
Another theory that is referenced in the literature, albeit on a limited scale, to explain
why a student drops out of school is social control theory, sometimes referred to as social bond
theory (McNeal, 1995). This theory has been used in many empirical studies for decades looking

39
at the issue of deviance and subsequent criminal behavior or activity. The theory of social control
was developed by Travis Hirschi (1969) and it is used to study deviant or delinquent behavior
that stems from a lack of social attachment to positive influences in an individual’s life. Hirschi
proposed that acts of delinquent behavior occur as a result of a lack of bonding to family,
parents, schools, religious institutions, and other areas that promote pro-social bonding (Hirschi,
1969).
With regards to completing school, Marcus & Sanders-Reio (2001) summarized Hirschi’s
social control theory as
a child’s initial attachment to his or her parents as affecting later relationships. Hirschi’s
attachment is more global, a property of an individual’s emotional bonds to society and
institutions such as school. From Hirschi’s perspective, bonds among individuals have
four elements: (a) attachment, or concern with the opinion of others; (b) commitment, or
a rational decision to behave in acceptable ways; (c) involvement, or the expenditure of
time and energy in positively sanctioned behaviors; and (d) belief, a view that the
principles encouraged by social institutions are valid. When attachment is strong, the
child feels emotionally bonded to his or her family, school and community. When the
bonds are weak, the child is free to engage in delinquent behavior. (p. 428)
An exhaustive review of the literature regarding different theories on dropping out
supports the premise that no studies have been conducted using the theory of social control
(McNeal, 1995). Therefore, it was determined that social control theory was inadequate for the
study.
The theories previously covered in the literature review represent several of the
prominent theories that are used to explain why a student might drop out of school. Even though

40
a few studies have applied a theory in a practical manner in an empirical study, difficulty arose in
identifying a single theory to utilize in the selection of variables for the study. As a result, it was
determined that no one theory could encompass all of the variables selected for the study.
School Intervention Programs
There are many ways in which schools encourage students to drop out of school, not
intentionally but unintentionally, through school practices, policies, and program
implementations that push certain outcomes but have inadvertent consequences on school
completion. A brief review of some of the intervention and prevention programs will highlight
some of the ways in which schools either discourage or encourage students to stay in school.
Many school systems unintentionally encourage students to drop out of school by placing
them in intervention programs that are not effective at reducing the dropout rate. There are many
intervention programs that are available to students throughout their academic career that are
intended to assist them in achieving their academic goal of completing high school (Dynarski &
Gleason, 1998). However, many of these intervention programs aimed at preventing students
from dropping out of school are not working or have had very limited success (Dynarski &
Gleason, 1998). Oftentimes, the wrong students are identified for intervention programs as well,
thereby reducing the efficacy of the intervention programs (Gleason & Dynarski, 2002).
Furthermore, there are a limited number of intervention programs that have been tested to prove
their effectiveness in reducing the dropout rate (Montecel et al., 2004). A great deal of
information is available on how to identify potential dropouts; however, less is known about how
to keep at-risk students in school (Christenson & Thurlow, 2004).
Even though there are many programs that do not effectively address the dropout issue,
there are scientifically-based intervention and prevention programs that have shown positive

41
results in reducing the dropout rate and are being adopted by schools to formally encourage
students to graduate from high school. Furthermore, research is continuously being conducted to
gain a better understanding of the most effective dropout prevention programs for school systems
to implement (e.g. Montecel et al., 2004).
The National Dropout Prevention Center (2007), working in conjunction with
Communities in Schools, an organization specializing in dropout prevention, published a
technical report based on an exhaustive review of the literature identifying the risk factors that
can be used to identify students at risk of dropping out of school (Hammond et al., 2007). Some
of the risk factors in the report include low academic achievement, grade retention, no extra-
curricular participation, learning disability, parenthood, low commitment to school, low
education level of parents, sibling had dropped out, low socioeconomic status, not living with
both natural parents, poor attendance, and misbehavior at school (Hammond et al., 2007).
Examples of exemplary programs that are evidence-based are included in the report. The
list of exemplary programs was developed using a matrix tool entitled The Matrix of Prevention
Programs. The exemplary programs were identified using The Matrix of Prevention Programs
for the following reasons (Hammond et al., 2007):
(1) the purpose of the matrix was to help identify effective, evidence-based programs
“designed to reduce or eliminate problem behaviors, such as delinquency, aggression,
violence, substance use, school behavioral problems, and risk factors identified as
predictive of these problems,” including most of the risk factors identified by this project
as keys to school dropout; (2) programs were rated as effective by 12 highly respected
federal and private agencies and several researchers based on an evaluation results
usually from experimental or quasi-experimental designs; (3) program selection was

42
based on relatively stringent criteria, such as the theoretical/research basis for program
components and quality of implementation; and (4) programs were ranked based on the
content, evaluation, and outcome criteria. (p. 49)
As a result of The Matrix of Prevention Program, the NDPC was able to accumulate a list
of 50 exemplary programs that target identified individual and family risk factors (Hammond et
al., 2007). The intervention programs that were highlighted in the study were selected from the
list of exemplary intervention programs in the NDPC technical report.
A closer look at individual dropout intervention programs will highlight some of the
practices that encourage students to remain in school and graduate. The intervention programs
that will be evaluated include Coca-Cola Valued Youth Program (Coca-Cola VYP), Check &
Connect, Career Academies, a modified Career Academy known as Junior Reserve Officer
Training Corp Career Academy (JROTCCA), and Achievement for Latinos through Academic
Success (ALAS).
Coca-Cola Valued Youth Program
The reasons for selecting the Coca-Cola Valued Youth Program (1991) are four-fold.
First, the main objective of the program is to reduce the dropout rates of middle and high school
students who are at risk of school failure (Fashola & Slavin, 1998). Second, the Coca-Cola VYP
has been tested using both qualitative and quantitative research based designs to validate the
effectiveness of the program (National Dropout Prevention Center [NDPC], 2005). Third, the
program bases its selection of at-risk students who get to participate in the program on two of the
variables that had been identified for the study including the following: classified as low
socioeconomic status and school location. The Coca-Cola VYP has been implemented in both
rural and urban school settings.

43
The program was developed over twenty five years ago as a result of a desire by Dr. Jose
Cardenas to help poor, minority, and limited-English proficient students whom he believed were
not getting an adequate education compared to students who attended schools in wealthier
districts (Cardenas, Montecel, Supik, & Harris, 1992; Montecel, Supik, & Montemayor, 1994).
As a result of the work of Dr. Cardenas, the Coca-Cola VYP has succeeded in reducing
dropout rates among at-risk students participating in the program. The latest statistics show that
24 cities in the United States, including 108 schools, have implemented the Coca-Cola VYP
(Hammond et al., 2007). In addition, the Coca-Cola VYP has helped keep approximately 98% of
the program’s participants in school (Hammond et al., 2007) which translates into over 14,000
at-risk students remaining in school (Lehr, Johnson, et al., 2004). Using a quasi-experimental
design, researchers conducted a two year study and concluded that at-risk students who
participated in the Coca-Cola VYP had lower dropout rates, improved reading scores, improved
attitudes toward school, and better self esteem (Montecel et al., 1994).
The basic tenets that articulate the philosophy of the Coca-Cola VYP include the
following: the school must value all students; all students can learn; all students in the school can
actively contribute to their own education and that of others; parents, students, and teachers must
be provided extensive, consistent, support in ways that allow students to learn, teachers to teach,
and parents to be involved; commitment to educational excellence is created by including
students, parents, and teachers in setting goals, making decisions, monitoring progress, and
evaluating outcomes; all students, parents and teachers have a right to participate fully in
creating and maintaining excellent schools; and excellence in schools contributes to individual
and collective economic growth, stability, and advancement (Montecel et al.,1994). In addition,
Montecel et al. (1994) highlight the goals of the program to be “ (a) reduce dropout rates, (b)

44
enhance students’ basic academic skills, (c) strengthen students’ perception of self and school,
(d) decrease student truancy, (e) decrease reduce student disciplinary referrals, and (f) forms
school-home-community partnerships to increase the level of support available to students” (p.
67).
The Coca-Cola VYP program places at-risk students who are in middle or high school
with students who are in elementary school. The students are given the responsibility of tutoring
three elementary students four hours a week and are paid minimum wage for their efforts
(Fashola & Slavin, 1998). The students have to take a class on effective tutoring strategies and
are provided with additional help to improve their own academic skills as well (Fashola &
Slavin, 1998). The approach of giving the students some responsibility, paying them for their
efforts, and helping the students develop their basic skills, has been proven to achieve one of the
primary goals set forth in the program which is to reduce the dropout rate of students,
specifically those students with limited English proficiency (Lehr, Johnson, et al., 2004). The
cost of implementing the program ranges from $150 to $250 per student and is used for staff
training, tutor stipends, evaluation, and awards (Lehr, Johnson, et al., 2004).
Check & Connect
Another way in which students are formally encouraged to stay in school is through the
intervention program known as Check & Connect. This program was first developed at the
University of Minnesota with input from regular education teachers, special education teachers,
students and parents (Lehr, Johnson, et al., 2004). The original intent of the program was to
address the dropout issue among students with emotional and behavioral disabilities but has
since been expanded to include students with and without disabilities and includes their families
(Lehr, Johnson, et al., 2004).

45
The Check & Connect program is relevant to the study for several reasons. First, the
primary goal of Check & Connect is to keep students engaged in school by promoting the
necessity of regular attendance in an effort to decrease the chances of school failure (Lehr,
Sinclair, & Christenson, 2004). Second, the program utilizes a sound theoretical construct and
has been tested using four longitudinal studies to determine the reliability and validity of the
program (Lehr, Sinclair, et al., 2004). Third, the program bases its selection of eligible students
who are asked to participate in the program on one of the variables that have been chosen for the
study including low socioeconomic status. Fourth, Check & Connect has been implemented in
urban school settings with high school students (Lehr, Sinclair, et al., 2004).
Since its inception in 1992, the Check & Connect Program has been very successful in
reducing the dropout rate and reducing the number of absences among students at risk of
dropping out of school (Anderson, Christenson, Sinclair, & Lehr, 2004). Results from one
evaluation of the Check & Connect program revealed a positive impact in the lives of students
who enrolled in the program as measured by the number of students who were still enrolled in
the program at the end of 9th grade compared to the control group (Sinclair, Christenson, Evelo,
& Hurley, 1998). Results from the longitudinal study showed that 68% of the students who were
enrolled in the Check & Connect program were still in school 5 years later and that only 29% of
the students who were in the control group were still on track for graduation (Sinclair et al.,
1998).
Absenteeism is often cited in the literature as one of the leading risk factors used to
determine which students are at risk of dropping out of school (e.g., Suh, Suh, & Houston, 2007).
Consequently, it is important to look at intervention strategies and programs that focus on this
particular risk factor. The Check & Connect program is one of the intervention programs that is

46
designed to reduce the number of absences. One evaluation of the Check & Connect Program
focused on the effectiveness of reducing the rate of truancy among students enrolled in the
program (Sinclair & Kaibel, 2002). The longitudinal study revealed positive results on its
effectiveness in reducing the number of absences (Sinclair & Kaibel, 2002). After attending the
Check & Connect program for 2 years, the percentage of students who were present 95% of the
time rose from 11% to 34%. Additionally, the portion of students who were absent more than
15% of the time was reduced from 45% to 32% (Sinclair & Kaibel, 2002).
The Check & Connect Program is based on three main components that are the
foundation for the program. According to Lehr, Johnson, et al., (2004) the fundamental elements
of the model include
relationship building, routine observations of warning signs of withdrawal, individualized
intervention, promotion of problem solving skills, and encouragement of students’
participation in school activities. These key features are carried out through an individual
referred to as a monitor, who serves essentially as a mentor, case manager, and advocate.
(p. 42)
The designated monitors are assigned to follow a group of students to “check” on them to
make sure they are in school on a daily basis. The people who are employed as monitors are paid
by the district and not by individual schools. This facilitates better follow up with students and
enables continuity throughout the student’s academic career. In addition, allowing the monitors
to follow the students as they progress through the school system enables them to make
adjustments as the student’s needs change (Kennelly & Monrad, 2007).
“Connect” is the other main component of the Check & Connect program. The
connection component of the program is designed to provide the necessary interventions based

47
on the results of the monitors’ “checking” on the students. The monitors are given the task of
providing the necessary interventions based on monthly meetings with the students using a five
step problem solving strategy (Lehr, Johnson, et al., 2004). The cost of implementing the Check
& Connect program was approximately $1,400 per student per year during the 2001-2002 school
year (Sinclair & Kaibel, 2002).
Career Academies
Another practice employed by some school districts to formally encourage students to
stay in school is the implementation of Career Academies. Although results are mixed, Career
Academies represent a potential intervention strategy for students who are at risk of dropping out
of school (Kemple, 2004). Career Academies are highlighted for several reasons. First, the
effectiveness of Career Academies has been tested using various quantitative design methods,
(Kemple, 2004; Kemple & Snipes, 2000). Second, the Career Academy concept was originally
designed to help high school students of low socioeconomic status who were in danger of
dropping out of school (Neubauer, 1986; Stern, Raby, & Dayton, 1992). Third, Career
Academies have been implemented in urban and rural settings that target high school students
(Stern et al., 1992).
Career Academies were developed by Charles Bower and were intended to increase
graduation rates for poor minority inner city youth (Neubauer, 1986; Stern, Dayton, & Raby,
2003). The first Career Academy opened in 1969 at the Thomas Edison High School in
Philadelphia, Pennsylvania. The program was later replicated in San Francisco, California in the
1980’s (Stern et al., 1992).
The results of several studies conducted show largely positive results on the effectiveness
of Career Academies. One study involving a random controlled assignment found that at-risk

48
students who participated in Career Academies remained in school longer than the students
selected in the comparison group; however, the study also discovered that participating students
were not more likely to earn a diploma than the comparison group (Kemple & Snipes, 2000).
The same study also revealed that students who participated in the Career Academies program
had a better attendance record, tended to be more likely to apply to college, and completed more
academic and vocational classes (Kemple & Snipes, 2000). One research study that was
conducted, utilizing both quantitative and qualitative data, indicated that the dropout rate
decreased enough to be statistically significant among students who participated in Career
Academies compared to matched comparison groups (Maxwell & Rubin, 2001).
One study yielding positive results utilized a random assignment research design method
to determine the labor market outcomes and education attainment levels of students who
participated in Career Academies (Kemple & Scott-Clayton, 2004). Findings from the study
include the following labor market impacts: Career Academies improved the labor market
prospects for men but not women, Career Academies provided pathways into post-secondary
education, and Career Academies proved to be especially helpful to students who were classified
as at risk of dropping out of school (Kemple & Scott-Clayton, 2004).
One possible drawback of instituting Career Academies is the cost of the program. Even
though there is often outside financial support from local businesses, grants, and community
agencies, school districts are frequently faced with the challenge of paying the increased
financial cost of running the program. Studies show that the cost of effectively implementing a
Career Academy is highs but, compared to the social costs the United States incurs as a result of
students dropping out of school, the cost is not prohibitive (Levin, Belfield, Muennig, & Rouse,
2007).

49
Career Academies offer unique features for students that would not be offered in a
traditional classroom setting. The Career Academy focuses on small learning environments that
are set up as schools within schools (Stern et al., 1992). Typically, the classes are designed as
cohorts that allow a certain number of students in each year, thus allowing for smaller class sizes
and more focused teacher attention for each student. The students choose a particular career
focus (e.g. business technology, agribusiness, communication and video technology) to study
and then learn both career and academic skills based on the chosen content area (Stern et al.,
1992). In addition, students who do well in the program are afforded the opportunity to work
with local employers to gain additional training and skills needed to succeed in the workforce.
Furthermore, local businesses are considered an integral component of Career Academies and
offer support through supplemental teaching, mentors, and part-time work for students (Stern et
al., 1992).
JROTCCA
Another practice that some school districts engage in to promote high school graduation
among students is the implementation of a modified type of career academy known as
JROTCCA (Elliot, Hanser, & Gilroy, 2002). This type of Career Academy adds one incremental
component to the career academy model by including the Junior Reserved Officer Training Corp
(JROTC). By combining the Career Academy model with JROTC, it came to be known as Junior
Reserved Officer Training Corp Career Academy (JROTCCA). The program was developed by
the Department of Defense and the Department of Education (Elliot et al., 2002). The main
difference between the traditional Career Academy and the modified Career Academy is the
required participation in the JROTC program. Additionally, as pointed out by Elliot et al. (2002),
the designers of JROTCCA “retained the original emphasis on at-risk students” p. 73.

50
Elliot, Hanser, & Gilroy (2002) conducted a quantitative study that examined the
effectiveness in generating various outcomes for students who were enrolled in JROTCCA
compared to students not enrolled in the Academy. Variables that were studied to prove the
effectiveness of JROTCCA programs include grades, attendance, and graduation status. The
study was focused on urban school districts and included 18 different cohorts from JROTCCA
programs across the United States. Results of the study indicated that students who were enrolled
in the JROTCCA had better attendance rates, higher graduation rates, and higher first year
graduation rates compared to students who were not enrolled in Career Academies (Elliot et al.,
2002).
Achievement for Latinos through Academic Success
Another practice some school districts have employed in the past that formally
encouraged students to stay in school was the implementation of a program entitled Achievement
for Latinos through Academic Success (Larson & Rumberger, 1995). This program was first
implemented in 1990 in an urban school district in Los Angeles, California. The program had
several goals but the primary focus of the program was to reduce the dropout rate of Latino
Youth. Even though the program is no longer in existence, it is referred to extensively in the
literature regarding dropout prevention programs. For example, Fashola and Slavin (1998)
highlight the ALAS program for its documented successes and the fact that the program
“demonstrates an effective approach to dropout prevention” (p. 166).
The ALAS program is being highlighted for four specific reasons. First, the ALAS
program worked with students who attended urban school districts. Second, the target population
consisted of those students who were at risk of dropping out of school. Third, even though the
ALAS intervention program started during the seventh grade, the intervention program followed

51
the students until they completed grade 12. Fourth, the program was tested and found reliable in
generating a number of student outcomes including reducing student dropout rate, reducing the
rate of absenteeism, and improved academic achievement (Gandara, Larson, Rumberger, &
Mehan, 1998; Larsen & Rumberger, 1995; Pearson & Banerji, 1993).
The ALAS intervention program was designed for students who were enrolled in school
during grades 7 – 12 and the program endeavored to bring together several different spheres of
influence for at-risk students. Family, school, community, and student were brought together to
form a collaborative approach to provide additional support for the student at risk of dropping
out of school (Fashola & Slavin, 1998; Pearson & Banerji, 1993). The ALAS program focused
on six strategies designed to intervene and to ensure students did not drop out of school (Fashola
& Slavin, 1998). These strategies included the following: monitoring the attendance rate on a
daily basis, remediation of a student’s problem-solving skills, supplemental support for parents
to address student behavior, providing opportunities to bond with peers and school personnel,
providing assistance for families for social services and community support groups, and
providing feedback to parents from teachers and school system personnel (Fashola & Slavin,
1998).
The success of the ALAS program cannot be ignored. One study found remarkable
success for the students who had been enrolled in the program. According to Fashola and Slavin
(1998), several student outcomes were measured to determine the effectiveness of the program
including staying in school, completing school, and progressing in school. Results indicated that
students who were enrolled in the program at the end of grade 9 were more inclined to stay in
school, staying in school at a higher rate than non-participants through grade 11, and were much
more likely to progress in school and graduate on time (Larson & Rumberger, 1995). It was

52
determined that the cost of the program, expressed in 2005 dollars, was approximately $1,185
per student (Gandara et al., 1998).
Summary
The need for an educated workforce is greater now than at any other time in the history of
the United States. The potential standing of the United States as a player in the global market
hinges on having a highly skilled and educated workforce (Gordon, 2005). Therefore, it is
critical that as many students as possible get an adequate high school education. As stated earlier,
the social and economic benefits to having students graduate from high school has been proven
in empirical studies (e.g. Grogger, 2004; Levin et al., 2007).
Intervention and prevention programs have been highlighted that have been proven to be
effective in reducing dropout rates as well as some of the limitations of these programs. With
increased accountability for school systems, it is imperative that every dollar spent is employed
appropriately and effectively. Therefore, school districts should implement only scientifically-
based intervention and prevention programs that have been proven to help reduce the dropout
rate in order to ensure a better educated work force in the 21st Century.

53
CHAPTER 3
METHOD
Background
Growth in immigration, poverty, and special education are a few issues facing many
public school systems throughout America (Johnson & Kritsonis, 2006). Furthermore, many
school systems located in metropolitan areas are not immune to these problems. In fact, some of
the biggest challenges to overcoming these and other issues often occur frequently in school
districts located in large metropolitan areas (Snipes & Casserly, 2004). For example, one of the
biggest challenges urban school districts face is closing the achievement gap among minority
students. Historically, a number of research studies have been conducted to address the issue of
poor academic achievement among minority students in urban schools (e.g., Ladson-Billings,
1994; Towns et al., 2001). However, students in metropolitan areas, particularly in urban school
districts, still lag behind in many areas of educational achievement, based on nationally normed
tests (Olson & Jerald, 1998). One of the consequences of poor academic achievement is dropping
out of school. Much research has been conducted to show that low academic achievement is one
of the leading factors resulting in dropping out of school (e.g., Balfanz & Herzog, 2005; Neild &
Balfanz, 2006 Rumberger, 1995).
Research has identified a number of indicators that lead students to drop out of school
(e.g., Dunn, Chambers, & Rabren, 2004; Goldschmidt & Wang, 1999; Osborne & Raush, 2001;
Swanson & Schnieder, 1999). One potential factor identified that might lead a student to drop
out of school is the need to acquire a job as a source of income for familial support (Gleason &

54
Dynarski, 2002). The National Dropout Prevention Center ([NDPC], 2007), in conjunction with
Communities in Schools (CIS), compiled a list, based on 25 years of academic research, of the
significant risk factors that can play a role in determining whether a student is at risk of dropping
out of school. Risk factors listed in the report include low academic achievement, grade
retention, no extracurricular participation, low socioeconomic status, not living with both natural
parents, poor attendance, and having a learning disability (Hammond et al., 2007).
Some research has been conducted to determine whether school-related activities are
effective in keeping students in school. For example, Mahoney and Cairns (1997) showed school
dropout rates for students classified as at risk of dropping out was lower for those who had
participated in extracurricular activities compared to those who had not.
Research has been conducted to determine whether intervention strategies are effective in
preventing students from dropping out of school. Research indicated many programs aimed at
reducing the dropout rate were not working (Dynarski & Gleason, 1998). Results from the
evaluation of federal dropout prevention programs indicated that many prevention programs
have had very limited success (Gleason & Dynarski, 2002). Therefore, it is important to focus
attention on programs that have delivered proven results.
Even though research has been done to help identify possible factors that might predict
future dropouts (e.g., Alexander et al., 2001; Lehr, Johnson et al., 2004; Scanlon & Mellard,
2002) and possible strategies for lowering dropout rates, students continue to drop out at
alarming rates. Consequently, there appears to be room for further analysis on using variables to
predict dropout rates and determining which variables are most important in explaining dropout
rates, specifically among students who attend school in large metropolitan cities.

55
Purpose of Study
The purpose of this study was to determine the variables most likely to be associated with
higher dropout rates in high schools in a large metropolitan area in the southeastern U.S.
Variables identified for this study were selected based the conceptual framework developed and
further supported by findings from current research regarding how to identify students at risk of
dropping out of school. The independent variables included ethnicity, gender, school size, special
education status, socioeconomic status, school location, and limited English proficiency status.
The dependent variable was the percentage of students who dropped out of high school.
The National Center for Education Statistics (2001) reports 27,543 high-school students
did not complete high school in Georgia during the 2000-2001 school year. Furthermore,
Georgia ranked second in the nation with the lowest percentage of graduates during the 2003
school year, with a graduation rate of 56% (Green & Winters, 2006). This study focused on high-
school dropout rates in the Georgia public school system during the 2007-2008 school year.
The variables or indicators linked to high-school dropout rates identified for this study
were selected based on the conceptual framework which focused on the areas in which the
education system is currently failing students. Additionally, the selection of variables was further
supported by various articles of published research. Variables included ethnicity, gender, school
size, special education status, socioeconomic status, and limited English proficiency status. The
following research study examples supported the choice of the aforementioned variables. Each
variable chosen has been proven statistically significant as an indicator for high-school dropout.
Research indicates that socioeconomic status is a strong predictor of dropping out (Battin-
Pearson et al., 2000; Suh & Suh, 2000). Studies have been conducted to show that race or
ethnicity is a reliable indicator to determine which students are at risk of dropping out of school

56
(Ekstrom et al., 1986). Furthermore, research indicates there is a significant link between gender
and who will drop out of school (Goldschmidt & Wang, 1999; Rumberger, 2001). Additionally,
research points out students who are identified as special needs are more susceptible to dropping
out of school (Lehr, Johnson et al., 2004; Schargel, 2004). Some research indicates students who
attend schools located in urban areas are at much greater risk for dropping out of school than
students in suburban and rural areas (Snipes & Casserly, 2004). Studies have been conducted that
show students who are of limited English proficiency are more at risk of dropping out of school
(Schargel, 2004). Finally, those students who attend schools with a large student population,
typical of school districts in large metropolitan areas, have been linked with higher dropout rates
(Lehr, Johnson et al., 2004).
Research Questions
The study was guided by the following research questions:
1. Which variables — ethnicity, gender, school size, school location, special education
status, socioeconomic status, and limited English proficiency status — are more likely to predict
higher dropout rates among students who attend school in a large metropolitan area?
2. Which variables— ethnicity, gender, school size, school location, special education
status, socioeconomic status, and limited English proficiency status —have the greatest impact
on dropout rates?
Design
This study used a causal-comparative research design. According to Gall, Gall, and Borg
(2007), causal-comparative research is defined as “a type of quantitative investigation that seeks
to discover possible causes and effects of a personal characteristic by comparing individuals in
whom it is present with individuals in whom it is absent or present to a lesser degree” (p. 634).

57
The purpose of this study was to investigate which variables or characteristics are most likely to
be associated with higher dropout rates in high schools in a large metropolitan area in the
southeastern United States. The independent variables were defined as ethnicity, gender, school
size, school location, special education status, socioeconomic status, and limited English
proficiency status. The dependent variable was defined as the rate at which students drop out of
school.
There are advantages and disadvantages to using causal-comparative research design.
The disadvantages of using causal-comparative research design need to be considered when
conducting this form of research. First, according to Cohen, Manion, and Morrison (2003),
because subjects are not randomly assigned to treatments, there will be inherent issues in the
populations studied. For example, the independent variables that might impact whether a student
stays in school or drops out cannot be manipulated. Therefore, one must consider that factors
other than those identified for this study could be influencing students to drop out. Ultimately,
the inability to assign subjects randomly to treatments is one of the greatest threats to the internal
validity of the design. In addition, Gall et al. (2007) stated that a disadvantage to causal-
comparative research designs is “inferences about causality on the basis of the collected data are
necessarily tentative” (p. 310). Therefore, one must recognize that conclusions from collected
data should focus on analytical relationships versus drawing conclusions about cause and effect.
There are advantages to using a causal-comparative research design. According to Gall et
al. (2007),
researchers sometimes prefer to use a causal-comparative design for two reasons:
forming groups to measure the X often is more consistent with how practitioners and

58
other education stakeholders think about the world; and the statistical results typically are
easier to comprehend and interpret. (p. 307)
The causal-comparative research design works well for this form of research because the
researcher will not be able to manipulate the independent variables or the dependent variable.
For example, independent variables, such as gender and special education status cannot be
manipulated. In addition, the students in the data analyzed have already dropped out of school;
therefore, the dependent variable, the dropout rate, cannot be influenced either. Thus, the casual-
comparative research design works well when trying to determine potential factors that influence
students to drop out of school because the variables being investigated were studied after the
fact.
Participants
Participants included all high schools in a metropolitan area in the southeastern United
States during the academic school year of 2007-2008. The metropolitan area included 28
counties with a combined statistical area population of 5,626,400 residents (United States Census
Bureau [USCB], 2007). The school systems that make up the metropolitan area consist of urban,
suburban, and rural school districts as identified by the Governor’s Office of Student
Achievement (GDOE, 2004). The school systems have a total of 143 high schools with a total
student population of 269,290.
Validity
The existence of both internal and external threats had to be accounted for to increase the
probability that the effect under investigation was really due to the cause identified in the
original hypothesis (Gall et al., 2007). The existence of external and internal threats to a study
should not invalidate the study; however, the recognition of these threats must be addressed or

59
the conclusions that were drawn from the study could be considered weak, invalid or unreliable.
When controlling for extraneous variables that might influence a study, Gall et al. (2007) note
that “if this task is accomplished, the researcher can attribute the observed outcomes (the effect)
with a high level of confidence to the treatment variable (the hypothesized cause)” (p. 383).
For the study, it was important to recognize threats to the external validity of the study.
External validity, as defined by Parker (1990), refers “to the degree to which research findings
can be generalized across time, settings, and persons” (p. 615). Similarly, Creswell (2003) points
out that external validity threats can occur “when experimenters draw incorrect inferences from
the sample data to other persons, other settings, and past or future situations” (p. 171). It is
important to understand that virtually every study or experiment has external threats that can
jeopardize the validity of the study (Onwuegbuzie, 2000). Consequently, both recognizing and
controlling for these threats is essential in order to maintain a credible study.
The two broad classifications that researchers use to categorize threats to external validity
are population and ecological validity (Bracht & Glass, 1968). Population validity is defined by
Gall et al. (2007) as “the extent to which the results of an experiment can be generalized from the
sample that was studied to a specified, larger group” (p. 389). The two types of population
validity identified by Bracht and Glass are “experimentally accessible population vs. target
population and interaction of personological variables and treatment effects” (p. 438).
One type of population validity that was a concern for the study is identified by Bracht
and Glass (1968) as the “experimentally accessible population vs. target population” (p. 438).
This type of population validity is further described by Gall et al. (2007) as “the extent to which
one can generalize from the experimental sample to a defined population” (p. 389). To address
this type of population validity, it was important to recognize the limitations regarding making

60
generalizations to a larger target population. Bracht and Glass (1968) define the target population
as “the total group of subjects about whom the experimenter is empirically attempting to learn
something” (p. 440). In the study, the target population was all high schools in metropolitan
areas in the southeastern United States.
In contrast, the experimentally accessible population is a much smaller population
defined by Bracht and Glass (1968) as “the population of subjects that is available to the
experimenter for his study” (p. 440). The experimentally accessible population selected included
all high schools in one metropolitan area in the southeastern United States.
The central concern with this threat to external validity is the conclusion that it is valid to
generalize the results of a given study or experiment to the experimentally accessible population
but it is risky to generalize the results to the broader target population (Gall et al., 2007). In the
context of this study, while it is valid to generalize the results of the study to the experimentally
accessible population of all high schools in this particular metropolitan area in the southeastern
United States, it would be risky to extrapolate the results of the study beyond this group to the
“target population” of all high schools in other metropolitan areas across the southeastern United
States. Extending the generalization of the results beyond that of the study increases the risk of
making generalizations that might not be accurate.
Furthermore, Skidmore (2008) notes “researchers must always remember the context
from which their sample comes from, and take caution not to over generalize beyond that” (p.
15). Therefore, the presence of this external threat impacts the interpretation of the study by
limiting the degree to which the results can be extrapolated to a broader population or a different
group of schools.

61
Data Collection Procedures
The purpose of this study was to determine the variables associated with higher dropout
rates based on school-level data. All data collected came from high schools in a metropolitan
area of the southeastern United States for the 2007-2008 academic school year. The data were
collected from the website for The Governor’s Office of Student Achievement which was
established to meet the requirements of No Child Left Behind legislation (Georgia Department of
Education [GDOE], 2004). The archival data that were collected is public domain; therefore,
anyone can access and review this information for each school system in the entire state of
Georgia. Additionally, all data from each high school is individually verified by the University
System of Georgia, the Professional Standards Commission, and the United States Department of
Education (GDOE, 2004).
The data collection procedures followed were straightforward. By gathering the
information from a public website, no special consideration for confidentiality was required.
None of the data were identified by student name; therefore, the researcher did not have to
ensure that the names of students who dropped out of school remain confidential. Additionally,
only school-level data were collected and no student-level data were included in the data set. The
independent variables, ethnicity, gender, school size, school location, special education status,
socioeconomic status, and limited English proficiency, were classified as either categorical or
continuous (Table 1). Ethnicity was reflected by the percentage of high school students in each
school classified into one of four groups: Black, White, Hispanic, and Other/Multiracial. Gender
was represented by the percentage of high school students in each school classified as male or
female. School size was classified using the following parameters: small school size represented
schools with 1,000 students or fewer, medium school size represented schools with between
62
1,001 and 1,499 students, and large schools were classified as those with greater than or equal to
1,500 students. Socioeconomic status was reflected by the percentage of high school students in
each school classified as economically disadvantaged. Special education status was reflected by
the percentage of high school students in each school classified as with disabilities. School
location was defined as urban, suburban, or rural. Finally, limited English proficiency status was
reflected by the percentage of high school students in each school classified as with limited
English proficiency. The data collection procedure for the dependent variable, the dropout rate,
was the same as for the independent variables, using the data generated from The Governor’s
Office of Student Achievement website. The dependent variable, dropout rate, was classified as
the percentage of high school students in each school who dropped out during the academic year
2007-2008.

63
Table 1
Variable Description Table
Variable Measurement Variable Type
Dropout rate Percentage of high school students in each school who dropped out
Continuous
Ethnicity Percentage of high school students in each school who are Black, Hispanic, White, or Other/Multiracial
Continuous
Gender Percentage of high school students in each school who are male or female
Continuous
School size 1=Small schools with student population of < 1,000; 2=Medium schools with student population >1,000 and < 1,500; 3=Large schools with student population > 1,500
Categorical
School location 1=Urban; 2=Suburban; 3=Rural Categorical
Special education status
Percentage of high school students in each school classified as with disability or without disability
Continuous
Socioeconomic status
Percentage of high school students in each school classified as economically disadvantaged or not economically disadvantaged
Continuous
Limited English proficiency status
Percentage of high school students in each school classified as limited English proficient or not limited English proficient
Continuous
Procedure
The steps that were taken to gain permission to conduct research, outlined by the
University of Georgia Institutional Review Board, were as follows.
1. Obtain Institutional Review Board application from the Office of Human Subjects at
the University of Georgia.
2. Complete the Institutional Review Board application and obtain all necessary
signatures before submitting to the Office of Human Subjects.
3. Submit Institutional Review Board application to the Office of Human Subjects.

64
4. Approval of research is subject to meeting the criteria established in Section IV:
Criteria for IRB Approval of Research of the Institutional Review Board guidelines. Once these
conditions were met, the Institutional Review Board granted permission to conduct research.
The following timeline highlights the major requirements that were necessary to
complete the study.
1. May 2009: Submit Institutional Review Board application to the Office of Human
Subjects. The approval process took approximately eight weeks.
2. July 2009: Once approval was received from the Institutional Review Board of the
University of Georgia, data collection began.
3. August 2009: Collected and analyzed data.
Data Analysis
When comparing a set of independent variables to a dependent variable, two analysis
methods to consider are multiple regression analysis (MRA) and multiple correlation analysis
(MCA). The multiple regression/correlation analysis system, as noted by Cohen, Cohen, West,
and Aiken (2003), is a “highly general and therefore very flexible data analytic system” that is
used in practical prediction or explanation problems and is “broadly applicable to hypotheses
generated by researchers in the behavioral sciences, health sciences, education and business” (p.
2).
An explanation regarding when it is appropriate to use MCA and when it is appropriate to
use MRA has been outlined by Huberty (2003). According to Huberty (2003), “the two analysis
procedures involve different research questions and study designs, different inferential
approaches, different analysis strategies, and different reported information” (p. 271).

65
In order to ascertain whether to use MCA or MRA, one of the first considerations is to
determine the type of questions that should be developed for the study. According to Huberty
(2003), when developing research questions for a given study, MCA is necessary when the
question “pertains to the relationship between a single response variable (Y) on one hand and a
collection of response variables (X’s) on the other hand” (p. 272). However, according to
Huberty and Petoskey (1999), “if the research question pertains to prediction, then an MRA
should be selected” (p. 17).
The study attempted to produce a model designed to predict future dropout rates and
investigated which variables had the greatest impact on dropout rates. Therefore, to effectively
address the questions for this study, MRA was used.
The first question formulated for this study, which independent variables — ethnicity,
gender, school size, school location, special education status, socioeconomic status, and limited
English proficiency status — predict higher dropout rates among students who attend school in a
large metropolitan area, attempted to enable the prediction of dropout rates. Given the predictive
nature of this question, multiple regression analysis (MRA) was used. The second question
attempted to identify which independent variables— ethnicity, gender, school size, school
location, special education status, socioeconomic status, and limited English proficiency status
—have the greatest impact on and are the most important in explaining dropout rates. Given the
explanatory nature of this question, multiple regression analysis was used. Ultimately, it is the
predictive and explanatory nature of the two research questions that necessitated the use of
MRA.
According to Montgomery, Peck, and Vining (2007), the general steps for conducting
multiple regression analysis include variable selection, model adequacy check, running the

66
model, and interpretation of the results. The following list outlines the specific steps that were
taken to conduct the multiple regression analysis of the data set in the study.
1. Selected the independent variables based on the conceptual framework developed for
this study and supported by the prior research related to dropping out highlighted in the
Introduction of Chapter 1. The dependent variable was selected based on the purpose of the
study.
2. Reduced the number of independent variables analyzed by using all-possible-
regressors model in order to determine the combination of independent variables that best
predicted the dependent variable. This analysis was run using the computer program Statistical
Analysis System (SAS).
3. Performed model adequacy check including testing to ensure the assumption of
normality and the assumption of equal variance of residuals were satisfied. As a result of analysis
from this step, the dropout rate was converted to log dropout rate in order to satisfy these
assumptions.
4. Ran the multiple regression analysis on the reduced set of independent variables using
Statistical Package for the Social Sciences (SPSS).
5. Interpreted the results to address the research questions in the study. This step involved
the use of the unstandardized coefficients from the multiple regression analysis output to
determine which independent variables were helpful in predicting dropout rates in a large
metropolitan area of the southeastern U.S. Furthermore, this step included the use of the
standardized coefficients (beta weights) to determine the relative importance of the different
independent variables in explaining the dropout rate. Beta weights is another term used to
describe the standardized coefficients (Huck, 2004). Additionally, Cohen (2003) states that

67
“standardized coefficients are of interpretive interest when the analysis concerns test scores or
indices whose scaling is arbitrary or when the magnitudes of effects of variables in different
units are to be compared” (p. 80). Therefore, since the independent variables selected for the
study included both continuous and categorical variables with differing units of measure such as
percentage of student population as well school size and school location, it was necessary to use
standardized coefficients to determine the relative impact of each variable on the dropout rate.
Table 2
Research Questions and Statistical Procedure Categorical or Continuous
Questions Independent variable Dependent variable Statistical Procedure1. Which variables
are more likely to
predict higher
dropout rates among
students who attend
school in the
metropolitan area
studied?
Ethnicity
Gender
School size
Special Education status
Socioeconomic status
Limited English
Proficiency status
Dropout Rate Multiple
Regression
Analysis
2. Which variables
have the greatest
impact on dropout
rates?
Ethnicity
Gender
School size
Special Education status
Socioeconomic status
Limited English
Proficiency status
Dropout Rate Multiple
Regression
Analysis

68
CHAPTER 4
DISCUSSIONS
Results
The primary goal of this study was to determine the variables that are associated with
higher dropout rates in high schools in a large metropolitan area in the southeastern U.S.
Establishing which variables are associated with higher dropout rates in large metropolitan
school systems will help in the development of intervention strategies focused on lowering
dropout rates.
The study is a secondary analysis of data from public-school districts in a large
metropolitan area in the southeastern U.S. The sample in the study consisted of 143 high schools
with a combined population of 269,290 students who were enrolled in the public-school system
during the academic school year 2007-2008, the most recent year for which data were available.
Chapter 4 is divided into two sections designed to answer each of the research questions
that were proposed for the study. All-possible-regressors model and multiple regression analysis
were used to answer the research questions posited for this study.
Regression analysis examines the connection between a response variable and a set of
explanatory variables (Berenson, Levine, & Krehbiel, 2002). The connection is expressed as an
equation that predicts the response variable from a function of the explanatory variables and a set
of parameters. All-possible-regressors analysis and multiple regression analysis were conducted
to develop a prediction model comprised of the variables most effective in explaining the
dependent variable.

69
Utilizing SAS, the all-possible-regressors analysis was run to test all possible subsets of
variables to determine which subset of variables created the model that best explained the
dependent variable (Appendix A). The all-possible-regressors analysis is run to determine which
group of variables has the highest R-square value, the smallest C(p) value, and the smallest MSE
value, and, as a result, which variables should be included in a multiple regression analysis
(Berenson et al., 2002). From the all-possible-regressors analysis, the variables that were selected
included ethnicity (Black, Hispanic, White), gender (male), disability status (with disability),
limited English proficiency status (with), school size (small, medium), and school location
(rural). These variables are summarized in Table 3 and included in a correlational matrix in
appendix B.
Table 3
Data Summary Table
Variable Minimum Mean Maximum Standard Deviation
Black* 0.1 44.7 99.5 31.8
Hispanic* 0.0 7.8 67.0 9.2
White* 0.0 41.4 95.9 30.2
Male* 44.3 50.4 69.7 2.7
With Disability* 0.1 11.5 88.5 7.3
With Limited English Proficiency* 0.0 3.3 34.0 4.3
School Size 165.0 1,883.1 4,250.0 760.4
School Location 1.0 2.2 3.0 0.6
Dropout Rate* 0.0 3.1 51.6 5.7 *Variables expressed as percentages

70
As a result of the all-possible-regressors analysis, all variables demonstrating a
significant relationship with dropout rates were selected in order to conduct a multiple regression
analysis. However, the assumption of normality and the assumption of equal variance of
residuals must be satisfied first in order to perform multiple regression analysis (Montgomery,
Peck, & Vining, 2007). In order for the model to be adequate, the residuals in the model must be
normally distributed and constant or of equal variance. The residuals represent the difference
between the observed dependent variable value and the predicted dependent variable value based
on the model (Montgomery, Peck, & Vining, 2007). Thus, model-adequacy checking was
performed to see whether the assumptions were satisfied (Figures 1 and 2).
Figure 1. The Violation of the Assumption of Normality.
The model-adequacy check revealed that the normality assumption (Figure 1) and the
equal variance assumption (Figure 2) were both violated. Possible reasons why the model
violated the assumptions included random error, random fluctuations or other situations that
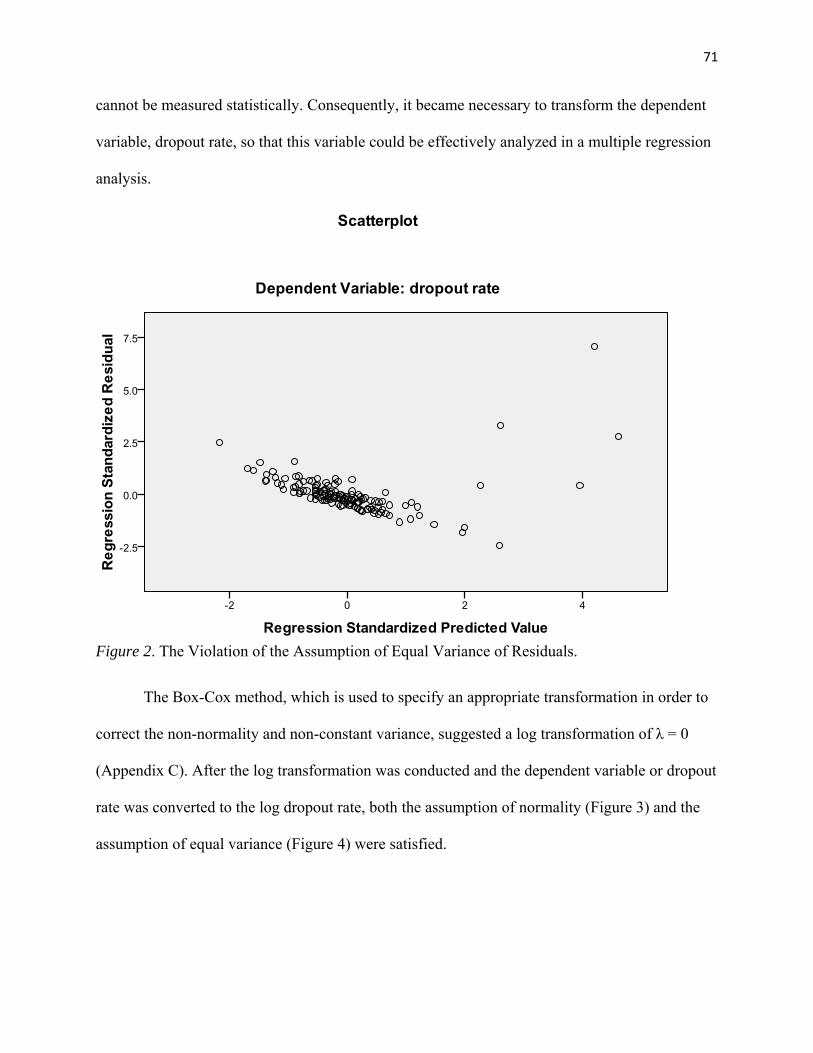
71
cannot be measured statistically. Consequently, it became necessary to transform the dependent
variable, dropout rate, so that this variable could be effectively analyzed in a multiple regression
analysis.
Figure 2. The Violation of the Assumption of Equal Variance of Residuals.
The Box-Cox method, which is used to specify an appropriate transformation in order to
correct the non-normality and non-constant variance, suggested a log transformation of λ = 0
(Appendix C). After the log transformation was conducted and the dependent variable or dropout
rate was converted to the log dropout rate, both the assumption of normality (Figure 3) and the
assumption of equal variance (Figure 4) were satisfied.

72
Figure 3. The Assumption of Normality is Satisfied.
Figure 4. The Assumption of Equal Variance is Satisfied.

73
Once the assumptions of normality and equal variance of residuals were satisfied as a
result of the transformation of the dependent variable to the log dropout rate, the data were
analyzed. Utilizing SPSS, multiple regression analysis was conducted to determine which
variables predicted higher dropout rates among students who attend school in a large
metropolitan area.
Results for Research Question 1
Which variables are more likely to predict higher dropout rates among students who
attend high school in a large metropolitan area?
Results. Because the F-test result from the multiple regression analysis was 3.875 and the
p value was .000 or < .05, it can be concluded that the model was significant and can be used to
predict the outcome variable, the log dropout rate (Table 4).
Table 4
Model of Significance Test for Multiple Regression Analysis
Model Sum of Squares df Mean Square F Sig.
Regression 31.118 10 3.112 3.875 .000a
Residual 102.796 128 .803
Total 133.914 138
a. Predictors: (Constant), medium school size, Black, limited English proficiency, with disability, suburban, small school size, male, urban, Hispanic, White b. Dependent Variable: log Dropout rate.
Using the unstandardized coefficients, the multiple regression analysis indicated that the
variables that would predict higher dropout rates among students who attend schools in the large
metropolitan area studied were gender, ethnicity, and school size (Table 5).

74
Table 5
Multiple Regression Analysis Coefficients Table
Unstandardized coefficients
Standardized coefficients
Variables B Std. Error Beta T Sig.
(Constant) -7.248 2.582 -2.807 .006
Black .039 .019 1.251 2.081 .039
Hispanic .095 .026 .750 3.671 .000
White .039 .020 1.198 1.975 .050
Male .078 .035 .215 2.229 .028
Medium school size .458 .220 .179 2.082 .039 Note: p value is significant if less than .05.
Gender. The proportion of male students had a significant impact on log dropout rate.
Specifically, increasing the percentage of male students by one (1) increased the log dropout rate
by 0.078 (p = 0.028). Thus, increasing the percentage of male students by 1 percentage point will
increase the dropout rate by 1.08 times (e0.078 = 1.08).
Ethnicity. Ethnicity, expressed as the percentage of students who were Hispanic or Black,
had a significant impact on the log dropout rate. Specifically, increasing the percentage of
Hispanic students by 1 percentage point increased the log dropout rate by 0.095 (p < 0.0001).
This result indicates that increasing the percentage of Hispanic students by 1 percentage point
will increase the total dropout rate by 1.1 times (e0.095 = 1.1). Furthermore, increasing the
percentage of Black students by 1 increased the log dropout rate by 0.039 (p = 0.039). This result
can be further elucidated by concluding that increasing the percentage of students who are Black
by 1 percentage point will increase the total dropout rate by 1.04 times (e0.039 = 1.04).

75
School size. Medium school size had a significant impact on log dropout rate compared to
large school size. The log dropout rate in medium schools increased by 0.458 compared to log
dropout rate in large schools (p = 0.039). Thus, the dropout rate in medium schools increases
1.58 times (e0.458 = 1.58) compared to the dropout rate in large schools. Consequently, if the
dropout rate in large schools increases in the future, the dropout rate in medium schools will
likely increase by 1.58 times the revised large-school dropout rate. The log dropout rate for small
schools increased by 0.434 compared to large schools. This result indicates that the dropout rate
in small schools increases by 1.54 times (e0.434 = 1.54) compared to the dropout rates in large
schools. However, the difference between small schools and large schools is not statistically
significant (p = 0.116).
The variables that were considered statistically significant in the multiple regression
analysis can be used in to help predict school dropout rates. Using the following regression
formula, Z = Ln(Y) = -7.248 + 0.039 Black + 0.095 Hispanic + 0.078 male + 0.458 medium
school size and Y=eZ, future dropout rates can be estimated by applying expected changes in the
independent variables.
The multiple regression analysis revealed that ethnicity (Hispanic or Black), gender
(male), and school size (medium) were the variables that were more likely to predict higher
dropout rates among students who attend schools in the large metropolitan area studied. The
unstandardized coefficients were useful to determine which specific segments within each group
were more likely to predict higher dropout rates. However, unstandardized coefficients cannot be
used to compare all variables because each variable is based on a different unit of measure. In
contrast, the standardized coefficients have been adjusted to make them comparable across all
variables and, therefore, provide a means to compare coefficients across all variables, regardless

76
of original unit of measure. Consequently, the standardized coefficients from the multiple
regression analysis were used to determine, across all variables, which groups have the greatest
relative impact on dropout rates.
Results for Research Question 2
Which variables—ethnicity, gender, school size, school location, special education status,
socioeconomic status, and limited English proficiency status—have the greatest impact on
dropout rates?
Results. Using the standardized coefficients, the multiple regression analysis indicated
that the variables most important in determining which attributes have the greatest impact on
dropout rates in the large metropolitan area studied were ethnicity, gender, and school size
(Table 5). Specifically, the standardized coefficients from the multiple regression analysis
indicated the most important variables were ethnicity (Hispanic, Black), gender (male), and
school size (medium).
The standardized coefficients (beta weights) were used to compare which variables had
the greatest impact on dropout rates. Black students had the highest standardized coefficient
(1.251), followed by Hispanic students (.750), male students (.215), and medium-sized schools
(.179). Thus, increasing the standardized percentage of Black students by 1 increases the
standardized log dropout rate by 1.251 and increases the standardized dropout rate by e (1.251) =
3.5. Furthermore, increasing the standardized percentage of Hispanic students by 1 increases the
standardized log dropout rate by 0.75 and increases the standardized dropout rate by e (0.75)
= 2.11. Increasing the standardized percentage of male students by 1 increases the log dropout
rate by 0.215 and increases the standardized dropout rate by e (0.215) = 1.24. Finally, increasing
the proportion of medium schools by 1 percentage point increases the standardized log dropout

77
rate by 0.179 and increases the dropout rate by e (0.179) = 1.20. Therefore, based on the sample
analyzed, increasing the percentage of Black students has the greatest impact on dropout rate,
followed by Hispanic students and male students in general. Finally, compared with large
schools, medium-sized schools have the greatest impact on dropout rates in the metropolitan area
studied.
Summary
Using multiple regression analysis, it was determined which variables were most
important in predicting dropout rates as well as which variables had the greatest impact on
dropout rates. Unstandardized coefficients from the multiple regression analysis revealed that
ethnicity (Hispanic, Black), gender (male), and school size (medium) were the variables more
likely to predict higher dropout rates among students who attend schools in the large
metropolitan area studied. Furthermore, the standardized coefficients from the multiple
regression analysis indicated the percentage of school population that is Black was the variable
with the greatest impact on dropout rates, followed by the percentage of Hispanic students, male
students, and medium-sized schools compared to large schools. With the information collected
from the data, recommendations can be made to help reduce dropout rates in school districts
located in the large metropolitan area in the southeastern U.S.
78
CHAPTER 5
CONCLUSIONS, LIMITATIONS, AND RECOMMENDATIONS
Introduction
The final chapter in this study provides conclusions based on the data analyzed and
illustrates how these results impact our understanding of the issue of high dropout rates for
school districts in a large metropolitan area. Furthermore, this final chapter recognizes
limitations of the study and makes recommendations for further research. Finally, this chapter
provides appropriate recommendations, based on the results of the study, designed to help
improve dropout rates for school districts in a large metropolitan area.
As stated before, much research has been conducted to determine the factors most useful
in predicting high-school dropout rates (e.g., Alexander et al., 2001; Gleason & Dynarski, 2002;
Hammond et al., 2007; Scanlon & Mellard, 2002). However, Hammond et al. (2007) reported in
their landmark study that “it is essential to collect local data to best predict who will drop out in a
particular locality and identify the major contributing factors” (p. 23). Thus, it was determined
the study would focus on school districts in one large metropolitan area in the southeastern U.S.
instead of a more regionally based study that would cover a larger geographical area.
Conclusions
The purpose of this study was to determine the variables associated with higher dropout
rates in high schools in a large metropolitan area in the southeastern U.S. Findings from this
study can influence the actions taken to improve dropout rates for the school districts examined.

79
The study identified variables most useful in predicting high-school dropout rates in the
metropolitan area. Results corroborated other studies conducted on the topic of high-school
dropout rates and the possible variables to use to predict dropout rates by determining which
groups of students affect dropout rates. For example, this study revealed that ethnicity impacts
the dropout rate, a finding that corroborates previous research indicating a students’ race or
ethnicity can be used to identify which student groups are more at risk of dropping out of school
and, therefore, contribute to higher dropout rates (e.g., Ekstrom et al., 1986; Goldschmidt &
Wang, 1999). Furthermore, it was determined that gender has a significant impact on student
dropout rates. More specifically, male students have a significant impact on the dropout rate.
These results affirm previous studies that have concluded that gender can be used to determine
which students are most at risk of dropping out of school, leading to higher dropout rates (e.g.,
Rumberger, 2001; Schargel, 2004).
The results also supported the finding that the National Dropout Prevention Center
(NDPC, 2007) indicated was one of the most important conclusions from its research. This
conclusion was that data must be collected on a local basis to understand which factors have the
greatest impact on dropout rates in that local area. Consequently, the implication is that using
data from national studies to implement intervention strategies designed to reduce dropout rates
locally might result in targeting the wrong students (Gleason & Dynarski, 2002). For example,
this study revealed socioeconomic status was not a significant contributor to predicting dropout
rates. However, previous research has indicated that socioeconomic status can be used to
determine which students are more at risk of dropping out of school and increasing dropout rates
(Battin-Pearson et al., 2000). Furthermore, limited English proficiency classification was not
significantly important in explaining dropout rates. However, previous research has indicated

80
that students with limited English proficiency status are more susceptible to dropping out of
school and increasing dropout rates (Reardon-Anderson, Capps, & Fix, 2002; Swanson, 2004).
Additionally, it was revealed that special education status did not significantly impact dropout
rates for the school districts included in this study, a finding that differs from the results of other
studies indicating that students with special needs are at greater risk of dropping out compared to
those who are not classified as special-needs students (Blackorby & Wagner, 1996; Repetto,
Pankaskie, De Palma-Hankins, Schwartz, & Perry, 1997; Schargel, 2004). Medium school size
classification was more useful in predicting dropout rates than a large or small school size
classification. This conclusion is surprising in light of previous research indicating that students
in large schools are more at risk of dropping out of school (Montecel, Cortez, & Cortez, 2004).
Although the medium school size result is in contrast to other current research regarding
school size and dropout rates (e.g. Lee & Burkham, 2003), an analysis of the data set revealed
factors that may have contributed to this result. First, it was discovered that, on average, medium
schools in the data had a higher percentage of students classified as economically disadvantaged.
While this variable did not surface as significant in predicting dropout rates, it is conceivable that
a higher proportion of economically disadvantaged students in medium schools contributed to
the current results. Additionally, the analysis revealed that a higher proportion of the schools in
the data set classified as medium are also classified as urban. Given the existing research
concluding that students in urban schools have higher dropout rates, the stronger urban presence
in the medium school sample may have contributed to the impact of medium schools on the
dropout rate (Montecel, et al., 2004).
Even though results from this study revealed that some variables identified as important
in previous research did not significantly contribute to dropout rates in the metropolitan area

81
studied, it does not mean that these factors have no impact at all on dropout rates. However, the
impact, if any, of these variables on dropout rates is not strong enough to be considered at a
significant level. By determining which variables have the greatest impact on dropout rates for a
specific locale, the researcher was able to address one of the key findings of previous research
conducted by the National Dropout Prevention Center (2007).
With these results, educators, practitioners, and other school system personnel can predict
school dropout rates in order to prioritize the allocation of resources and attention across schools.
Additionally, these stakeholders can address the dropout issue with greater clarity by developing
a better understanding of the factors that have the greatest impact on dropout rates as well as
determining where to focus efforts to reduce dropout rates. As a result, intervention strategies
can be designed to help reduce the risk of students dropping out of high school in the
metropolitan school districts studied. Furthermore, because the variables chosen for this study
were also the focus of intervention programs outlined in the review of the literature, some of the
programs reviewed are appropriate as recommendations arising from this present analysis.
The importance of research on this topic cannot be overstated because research has
indicated that Georgia ranks near the bottom in graduation rates in the U.S. (Greene & Winters,
2006). Similarly, research has indicated that Georgia has one of the highest dropout rates in the
U.S. (Green & Winters, 2006). The sample used in this study represents schools that are, like
many large metropolitan school districts throughout the U.S., struggling to reduce dropout rates.
In order to determine which factors to use to predict dropout rates and which variables had the
greatest impact on dropout rates, the following two questions were addressed:

82
1. Which variables —ethnicity, gender, school size, school location, special education
status, socioeconomic status, and limited English proficiency status—are more likely to predict
higher dropout rates among students who attend school in a large metropolitan area?
2. Which variables—ethnicity, gender, school size, school location, special education
status, socioeconomic status, and limited English proficiency status—have the greatest impact on
dropout rates?
Question 1
For Question 1, which inquires as to which variables are more likely to predict higher
dropout rates among students who attend school in the large metropolitan area studied, it was
determined that multiple regression analysis would be used to answer this question. Results from
this analysis indicated that gender, ethnicity, and school size were the variables more likely to
predict higher dropout rates among students who attend school districts in the large metropolitan
area studied.
First, results from the gender portion of the analysis revealed that the proportion of male
students had a significant impact on dropout rates. Given the results of this analysis, one can
deduce that, if the percentage of males in the population for a given school increases in the
future, the school dropout rate will increase as well. Additionally, results from the regression
analysis indicate that ethnicity also plays a major role in predicting dropout rates. Specifically,
the proportion of Hispanic and Black students contributes significantly to the prediction of
dropout rates for the school districts included in the study. Furthermore, as school populations
change, if the number of schools that are medium-sized or, more specifically, schools with
populations between 1,001 and 1,500 students increases compared to the number of schools
classified as large schools, the dropout rate will increase as well.

83
Recommendations for Question 1
Given the fact that the multiple regression analysis identified which variables were most
useful in predicting dropout rates, the results of this analysis can be used to help predict school
dropout rates. Using the following regression formula, Z = Ln(Y) = -7.248 + 0.039 Black +
0.095 Hispanic + 0.078 male + 0.458 medium school size and Y=eZ, future dropout rates can be
estimated by applying expected changes in the independent variables. For example, a projected
future dropout rate for a given school can be estimated by inserting the projected future
percentage of population for the specified ethnic groups into the formula.
Using the aforementioned formula, if the percentage of Hispanic students increases by 1
percent in a given school, while the other variables remain fixed, the projected dropout rate can
be estimated by multiplying the existing dropout rate by 1.1 (e0.095 = 1.1). For example, since a
metropolitan area school from the sample, classified in the data as school 71, currently includes a
Hispanic population of 7 percent, the projected dropout rate, assuming the Hispanic percentage
in this school increased by 1 percent, could be calculated by multiplying the current dropout rate
of 1.4 percent times 1.1, for a projected dropout rate of 1.540. This calculation represents a 10%
increase in dropout rate. Furthermore, if, in the same school, the percentage of Black students
increases by 1 percent from 49.3 to 50.3, while the other variables remain fixed, multiplying 1.04
(e0.039 = 1.04) times the current dropout rate of 1.4 results in a predicted total dropout rate for the
school of 1.456, which represents a 4% increase.
The Georgia Department of Education (GADOE; 2007) reports that, during the academic
school year of 2009-2010, Hispanic students make up 7% of the overall k-12 population in the
state. This is the same percentage of students who are Hispanic in school 71 in the data. The
GADOE projects that the state Hispanic population in k-12 will increase to 12% during the

84
2014-2015 school year. Given these statistics, if the population of Hispanic students in school 71
increases at the same rate as in the state of Georgia by increasing from 7 to 12%, the predicted
impact on the dropout rate for school 71 can be calculated by increasing the dropout rate by 10%
for every 1% increase in the Hispanic population. Thus, in this example, the school dropout rate
would be predicted to increase from 1.4 to 2.1%, a 50% increase in the dropout rate.
Similarly, the regression model can be used to predict school dropout rates, given
projected growth rates for the male population and Black student population. With these data,
legislators will be able to direct funds to the appropriate school systems that might need
additional funding based on the projected growth rates of Black, Hispanic, and male student
populations as well as the proportion of schools with a medium-size classification. The results of
this study can be used by school leaders to inform county-level personnel, boards of education,
community leaders, key business persons, and other invested stakeholders. Furthermore, school
leaders will be able to illustrate how the dropout rate will increase based on projected changes in
demographics if the appropriate funding is not provided to deliver the programs necessary to
address the student groups that impact the dropout rate.
Question 2
For Question 2, which asked which variables—ethnicity, gender, school size, school
location, special education status, socioeconomic status, and limited English proficiency status—
have the greatest impact on dropout rates, it was determined the most effective approach in
addressing this question, given the available data, was to use the standardized coefficients from
the multiple regression analysis to rank the relative importance of the variables in explaining
dropout rates. As a result, several recommendations regarding how to help reduce dropout rates
can be made.
85
The standardized coefficients from the regression analysis revealed that the percentage of
Black students, with a standardized coefficient of 1.251, was the most important variable in
explaining dropout rates and, therefore, indicated that Black students represent the group with
the greatest impact on dropout rates in the sample used for this study. The rank order for the rest
of the variables for which the standardized coefficients were statistically significant was
Hispanic (.750), followed by male (.215), and medium-sized schools (.179).
Recommendations for Question 2
As a result of the regression analysis, it was determined which variables had the greatest
impact on dropout rates. Ascertaining which variables influenced dropout rates the most enabled
the recommendation of specific intervention strategies that can be implemented to help reduce
dropout rates.
Before reviewing the recommendations made as a result of the findings from this study,
one aspect of the variables selected needs to be addressed once more. As alluded to in the
introduction of chapter 1 and extensively in the review of literature, it is important to remember
that a school system’s policies and decisions can have a direct impact, positive or negative, on
the issue of dropout rates. Furthermore, the conceptual framework developed to support the
selection of variables analyzed involved focusing on the areas in which the education system is
currently failing students. Consequently, it is important to recognize that, while the vast majority
of decisions made by school system personnel, policymakers and other invested stakeholders are
based on the best intentions and backed by sound research, it should be noted that not every
decision made is in the best interest of all students and particularly for minority students.
Therefore, a more complex, underlying issue may exist that goes beyond the scope of this study
but that needs to be addressed in order to truly combat dropout rates.

86
For State and Federal Policymakers. One aspect of improving dropout rates is to develop
and enact policies and procedures at the state and federal level that ensure every student receives
the support necessary to be successful. The following recommendations could be enacted at the
state or federal level to help reduce dropout rates. First, a uniform definition for dropout and
graduation rates needs to be established. As noted in chapter 1, there exists much discrepancy
over how best to calculate dropout and graduation rates. Without a clear definition of what
constitutes a dropout, no one can definitively assess the dropout issue. Additionally, without a
clear definition of what constitutes a dropout, states are left to develop their own definitions
which can lead to underreporting dropout rates (Green & Forster, 2003). Therefore, a
recommendation would be to adopt uniform definitions for graduation and dropout rates. This
would allow federal and state policymakers to address the issue of dropout rates at a more
consistent level and prevent local school systems from underreporting the dropout rate (Green &
Forster, 2003). Furthermore, state and federal policymakers should develop a system whereby
students are tracked by state and federal statisticians so local school systems and state
policymakers have a better idea of what happens to students who do not graduate and can
pinpoint when they actually stop attending school (Viadero, 2004).
Federal and state policymakers need to address the issue of inadequate funding for
schools (Barr & Parrett, 2007). By addressing the issue of inadequate funding, schools should
become more effective in preventing students from dropping out of school by having the
necessary resources to implement intervention strategies and programs to help reduce dropout
rates (Levin, Belfield, Muennig, & Rouse, 2007).
Further data collection is necessary and additional research needs to be conducted on the
dropout problem and federal and state policymakers should help with the funding of such

87
research. Since research indicates that Georgia is one of the leading states in the country for high
dropout rates, state policymakers should further analyze and investigate what is causing the
dropout rate to be so high.
Another approach to reducing dropout rates that could be addressed by state
policymakers would be to increase the age at which a student may drop out of school legally.
Even though much debate exists about the topic of compulsory attendance laws, recent studies
have demonstrated that raising the age for compulsory attendance can reduce dropout rates and
improve lifetime earnings for those students who stay in school and graduate (Bhanpuri &
Reynolds, 2003; Mingliang, 2006).
For School Systems. There are several recommendations that can be made to local school
system personnel to address the issue of dropouts. Recognizing the impact of ethnicity,
specifically the proportion of Black students, on the overall school dropout rate is important
because the percentage of Black students will likely affect dropout rates in the future, according
to the unstandardized coefficients in the regression analysis. Furthermore, the standardized
coefficients indicated that the percentage of Black students had a greater impact on current
school dropout rates than the other variables. These results are corroborated by other research
studies that have indicated Black students typically have the lowest graduation rates compared to
all other ethnicities (Pinkney, 2000; Roderick, 2003).
Schools need to recognize and respect the cultural diversity that currently exists in so
many school systems located in large metropolitan school districts. For example, schools need to
understand the negative impact that traditional curriculum can have on diverse populations,
including Black students, and recognize the potential for curriculum, if not correctly chosen, to
have an adverse affect on the graduation rate (Gallagher, 2002; Minhui, 2007). In addition, Hale

88
(2001) pointed out that students perform better if they are given culturally relevant educational
materials. The use of a multicultural-based curriculum is needed to bridge the gap between the
many diverse populations of students that are often represented in metropolitan school systems
(Shealy, 2006). Therefore, school system personnel need to be aware that Black students should
be given the opportunity to learn and develop from culturally relevant material and a
multicultural-based curriculum that provides adequate motivation to persist to graduation.
Research has indicated that, oftentimes, schools do not offer enough programs or support
mechanisms to meet the needs of Black students (Mitchell, Bush, & Lawson Bush, 2002).
Therefore, schools need to ameliorate this lack of support mechanisms and programs to reduce
the dropout rate for Black students. For example, schools should team up with local business
leaders, community officials, social service agencies, and other community stakeholders to
develop or replicate successful early intervention programs aimed at reducing the truancy rate for
Black students in order to help reduce the dropout rate (Shore, 2003).
An intervention program that has been implemented and has shown progress in reducing
the dropout rate of Black males is called MAAT (Motivated Action towards Achievement and
Transformation) (Mitchell et al., 2002). The MAAT program was started during the 2000-2001
school year in a large metropolitan city in southern California. This program involves male
mentors who function as positive role models for Black males and serve to help motivate Black
students to finish school. The mentors provide guidance on getting involved in extracurricular
sports, getting parents involved in the education process, engaging in activities that are culturally
relevant and help build self-esteem, and provide additional help with academic lessons (Mitchell,
Bush, & Lawson Bush, 2002). As a result of the success of this program, a parallel program has
been set up that focuses on Black female students; however, it is too early to ascertain the results

89
of this parallel program and, therefore, too early to recommend this strategy. Given the focus on
Black students as a result of this study, the MAAT program would be an appropriate intervention
program to implement to help reduce the dropout rate.
Another recommendation that could be effective in reducing the dropout rate by focusing
on Black students is to make use of the Coca-Cola Valued Youth Program. This program was
examined extensively in the review of literature and is designed to help reduce the risk of
dropping out of school. This program has been in place for a number of years and has been
proven effective in reducing the dropout rate in various school systems throughout the country.
Recognizing the impact that the percentage of the school population that is Hispanic has
on the dropout rate is of particular importance for three reasons. First, according to the data, the
percentage of Hispanic students is the variable with the second greatest impact on dropout rates
in the sample studied. Second, with demographics shifting within the U.S., it is important to
recognize that the number of Hispanics entering school systems is rising and, according to the
NCES (2006), approximately one-third of all Hispanic students do not graduate from high
school. Third, it is reported that Georgia’s school system will see its enrollment of Hispanic
students increasing from 7% during the 2009- 2010 school year to 12% by the year 2015.
Consequently, given the results of this study and the expected increase in the percentage of
Hispanic students in Georgia high schools, it is likely that dropout rates in Georgia high schools
will continue to increase.
A concerted effort must be made by school systems to meet the challenges that come
with educating students from Hispanic backgrounds (Lockwood, 2000). Programs should be put
in place to help parents of Hispanic students become involved in their children’s educational
process because research has shown that lack of parental involvement is one of the biggest

90
challenges in ensuring that Hispanic students succeed in their educational pursuits (Pong &
Dong-Beom, 2000). Another recommendation that could be implemented by school systems to
help reduce the dropout rate for Hispanic students involves the use of counselors with Hispanic
backgrounds. These counselors would provide assistance to high school students who might need
additional help preparing for and navigating the challenges of high school. In addition, Hispanic
counselors could act as liaisons between students, parents, and school system personnel,
especially for those students with parents who do not speak English fluently. Furthermore,
school teachers and administrators should be better trained at the college level on how to meet
the needs of Hispanic students (Lockwood, 2000).
One intervention program that could be implemented by school systems to reduce the
dropout rate for Hispanic students is entitled ALAS (Achievement for Latinos through Academic
Success). This program, highlighted in the review of literature, would be an appropriate program
to implement because it is designed specifically to work with Hispanic/Latino students to help
keep them from dropping out of school. Additional successful programs that should be
considered for implementation in order to help reduce the dropout rate include Achieving a
College Education (ACE), Jobs for America’s Graduates (JAG), and Advancement Via
Individual Determination (Montecel et al., 2004).
As indicated by the results of the regression analysis, the percentage of male students
impacted the current dropout rate more than the percentage of female students. Therefore, an
effort needs to be made by school systems to ensure male students who are at risk of dropping
out of school are given every opportunity to succeed. For example, staff development
opportunities designed to focus on strategies aimed at getting male students integrated into the
school organization in order to help reduce the dropout rate need to be explored and presented to

91
teachers. Research has shown that students who are integrated into the school culture or
organization have lower dropout rates (Cole-Henderson & Serpell, 2001). Additionally, male
teachers and administrators need to be recruited and retained in these school systems so as to be
mentors and provide daily guidance to those male students who are most at risk for dropping out
of school (Cunningham & Watson, 2002).
The research also revealed the medium size school classification, specifically those
schools with a population between 1,001 and 1,500, had a greater impact on dropout rates
compared to the large or small school size classifications. Again, this result was somewhat
surprising because a great deal of research has indicated that students who attend large schools
are more apt to drop out than those students who attend schools with lower populations (Lehr et
al., 2004). However, a review of the data set revealed that, on average, medium schools in the
data had a higher percentage of students classified as economically disadvantaged and a higher
proportion of the medium schools in the data set were also classified as urban. These two factors
might have affected dropout rates for students in medium schools. Therefore, local school
systems can use tax dollars to support the appropriate schools based on the knowledge that the
medium size school classification has a greater impact on dropout rates than the large or small
classifications and that the increased number of economically disadvantaged students in urban
schools might need to be addressed in order to reduce dropout rates for medium sized schools.
Limitations and Future Research
As with any study that is conducted, there are, to some degree, limitations or aspects that
are beyond the scope of a study, and this study is no different in that regard. It is important to
point out that, even though the study has limitations, these limitations do not disqualify it from
being a valid study. However, such limitations do offer an opportunity for exploration of

92
additional areas for further research. Limitations of this study are highlighted along with
suggestions for further areas to study.
Even though the study made an attempt to include as many variables as possible, there
were some limitations in the number of variables selected for the study. Even though this study
included seven different variables that are, based on previous research, considered highly related
to dropout rates, the National Dropout Prevention Center suggested that there are as many as 30
different risk factors associated with students dropping out of school. Furthermore, even though
the seven different variables investigated in this study were further broken into 12 subgroups, the
actual reasons that some of the students dropped out could have been associated with one of the
other risk factors highlighted by the NDPC but not selected for this study. Therefore, one of the
potential areas to explore for further research is a study incorporating additional variables that
were not selected for this study but have been highlighted by research as being associated with
higher dropout rates. Examples of possible risk factors not included in this study but that could
be investigated include low attendance (Rumberger, 2001; Scanlon & Mellard, 2002; Suh et al.,
2007), students being above age for their appropriate grade level (Gleason & Dynarski, 2002),
and number of years retained in school (Alexander et al., 2001).
Another limitation of this study is related to the particular region that was selected. It was
determined that the geography selected for this study would include only one metropolitan area
in the southeastern U.S. to align with the findings of the NDPC (Hammond et al., 2007). As the
metropolitan area examined continues to expand, further studies could be conducted to include
any counties added to the metropolitan statistical area as defined by the U.S. Census Bureau.
Many students drop out of school after the 9th grade. It is estimated that approximately
10% of 9th graders in 2003 did not return to complete grade 10 (NCES, 2005). Enrollment levels

93
for students in Georgia entering grade 10 are as much as 20% lower than grade 9 enrollment
levels (Wheelcock & Miao, 2005). As a result of these findings, research could be conducted on
just one grade level rather than including all four years of high school, the approach taken in the
current study.
An additional limitation of this study that could lead to further research pertains to the
level of data analyzed. Because student level data were not available for analysis in this study,
the information analyzed was at the school level. If student level data could be obtained, student
level analysis could shed more light on which specific students could be classified as most at risk
of dropping out rather than which variables have the greatest impact on dropout rates.
One final limitation of the study that could lead to further research includes the use of a
theory relating to dropping out of school. While it has been referenced in several places in this
study, it is important to reiterate that most studies conducted regarding the issue of dropout rates
are “atheoretical” (Holland & Andre, 1987). One way that further research could be conducted
would be to test one of the many prevailing theories regarding the issue of dropping out. For
example, it has been suggested in the literature that the theory of social control could be used to
explain why a student drops out of school (Marcus & Sanders-Reio, 2001). However, no studies
have been conducted to support this theory (McNeal, 1995). Therefore, many opportunities exist
to conduct research on the topic of dropping out through the lens of the theory of social control
or other contemporary theories.
Summary
This study was designed to help shed more light on the topic of which variables have the
greatest impact on high-school dropout rates, a topic that has been investigated and researched
but remains one of the most challenging issues facing school systems today. As the U.S.
94
becomes part of a more global society, it is more imperative now than ever before to make sure
that students have the tools necessary to compete in the workforce of the 21st century. Therefore,
schools, parents, community members, administrators, school system personnel, and local state
and federal governmental agencies will have to join forces in a collaborative manner if they ever
hope to improve the graduation rate by lowering the dropout rate.
As a result of conducting this quantitative research study, it is hopeful that the findings
can be used to reduce dropout rates. By acquiring the ability to use specific variables to predict
dropout rates, legislators and school system personnel can predict school dropout rates in order
to prioritize the allocation of resources and the focus of intervention efforts. Furthermore, by
developing a better understanding of which variables have the greatest impact on current dropout
rates, schools will have the requisite information necessary to prioritize intervention efforts and,
ultimately, combat this most perplexing issue.

95
REFERENCES
Ainsworth, M. D., & Bowlby, J. (1991). An ethological approach to personality development.
American Psychologist, 46, 331-341.
Alexander, K. L., Entwisle, D. R., & Kabbani, N. S. (2001). The dropout process in life course
perspective: Early risk factors at home and school. Teachers College Record, 103(5),
760-822.
Allensworth, E., & Easton, J. Q. (2005). The on-track indicator as a predictor of high school
graduation. Chicago: Consortium on Chicago School Research.
Alliance for Excellent Education. (2001). Locating the dropout crisis. Baltimore: Johns Hopkins
University, Center for Research on the Education of Students Placed At Risk, Center for
Social Organization of Schools.
Anderson, A. R., Christenson, S. L., Sinclair, M. F., & Lehr, C. A. (2004). Check and Connect:
The importance of relationships for promoting engagement with school. Journal of
School Psychology, 42, 95-113.
Anyon, J. (1997). Ghetto schooling: A political economy of urban educational reform. New
York: Teachers College Press.
Balfanz, R., & Herzog, L. (2005, March). Keeping middle grade students on track to graduation:
Initial analysis and implications. Presentation given at the second Regional Middle
Grades Symposium, Philadelphia, PA.
96
Balfanz, R., & Legters, N. (2004). Locating the dropout crisis. Which high schools produce the
nation's dropouts? where are they located? who attends them? (Report 70). Baltimore,
MD: Center for Research on the Education of Students Placed at Risk.
Barr, R. D., & Parrett, W. H. (2007). The kids left behind: Catching up the underachieving
children of poverty. Bloomington, IN: Solution Tree.
Battin-Pearson, S., Newcomb, M. D., Hill, K. G., Catalano, R. F., & Hawkins, J. D. (2000).
Predictors of early high school dropout: A test of five theories. Journal of Educational
Psychology, 92(3), 568-582.
Bhanpuri, H., & Reynolds, G. M. (2003). Understanding and addressing the issue of the high
school dropout age. Learning Points Associates, North Central Regional Educational
Laboratory. Retrieved October 17, 2009, from www.ncrel.org/policy/pubs/html/
second/index.html
Beresnon, M. L., Levine, D. M., & Krehbiel, T. C. (2002). Basic business statistics: Concepts
and applications. Upper Saddle River, NJ: Prentice Hall.
Bernstein, S., & Rulo, J. H. (1976). Learning disabilities and learning problems: Their
implications for the juvenile justice system. Juvenile Justice 27(4), 43-47.
Betts, J. R., Reuben, K. S., & Danenberg, A. (2000). Equal resources, equal outcomes? The
distribution of school resources and student achievement in California. San Francisco:
Public Policy Institute of California.
Blackorby, J., & Wagner, M. (1996). Longitudinal post-school outcomes of youth with
disabilities: Findings from the national longitudinal transition study. Exceptional
Children, 62(5), 399-413.

97
Bost, L. W., & Riccomini, D. (2006). Effective instruction: An inconspicuous strategy for
dropout prevention. Remedial and Special Education, (5), 301- 311.
Bowlby, J. (1988). A secure base. New York: Basic Books.
Bracht, G. H., & Glass, G. V. (1968). The external validity of experiments. American
Educational Research Journal, 5, 434-474.
Bridgeland, J. M., Dilulio, J. J., & Morrison, K. B. (2006, March). The silent epidemic:
Perspectives of high school dropouts. Washington, DC: Civic Enterprises, LLC, in
association with Peter D. Hart Research Associates for the Bill and Melinda Gates
Foundation.
Bryk, A. S., & Thum, Y. M. (1989). The effects of high school organization on dropping out: An
exploratory investigation. American Education Research Journal, 26(3), 353-383.
Buchanan, P. J. (2006). State of emergency. New York: St. Martin Press.
Bulach, C., & Malone, B. (1994). The relationship of school climate to the implementation of
school reform, ERS Spectrum, 12(4), 3-8.
Capps, R., Fix, M., Murray, J., Ost, J., Passel, J. S., & Herwantoro, S. (2005). The new
demography of America’s schools. Immigration and the No Child Left Behind Act.
Washington, DC: The Urban Institute. Retrieved May 29, 2009, from
http://www.urban.org/UploadedPDF/311230_new_demography.pdf
Cardenas, J. A., Montecel, M. R., Supik, J. D. & Harris, R. J. (1992). The Coca-Cola Valued
Youth Program. Dropout prevention strategies for at-risk students. Texas Researcher, 3,
111-130.
98
Christenson, S. L., & Thurlow, M. L. (2004). School dropouts: Prevention considerations,
interventions, and challenges. Current Directions in Psychological Sciences, 13(1), 36-
39.
Coca-Cola Valued Youth Program. (1991). Proposal submitted to the Program Effectiveness
Panel of the U.S. Department of Education. Washington, DC: US Department of
Education.
Cohen, J. (2006). Social, emotional, ethical and academic education: Creating a climate for
learning, participation in democracy and well-being. Harvard Educational Review, 76(2),
201-237.
Cohen, J., Cohen, P., West, S. G., & Aiken, L. S. (2003). Applied multiple regression/correlation
analysis for the behavioral sciences (3rd ed.). Mahwah, NJ: Erlbaum.
Cohen, L., Manion, L., & Morrison, K. (2003). Research methods in education (5th ed.). Upper
Saddle River, NJ: Routledge & Falmer.
Creswell, J. W. (2003). Research design: Qualitative, quantitative, and mixed methods
approaches (2nd ed.). Thousand Oaks, CA: Sage.
Croninger, R., & Lee, V. E. (2001). Social capital and dropping out of High School: Benefits to
at-risk students of teachers’ support and guidance. Teachers College Record, 103(4), 548-
581.
Crowder, K., & South, S. J. (2003). Neighborhood distress and school dropout: The variable
significance of community context. Social Science Research, 32(4), 659-698. Cunningham, B., & Watson, L. (2002). Recruiting male teachers. Journal of Young Children
57(6), 10-15.

99
Dawson, P. (1998). A primer on student grade retention: What the research says. Communiqué,
26, 28-30.
Deal, T. E., & Peterson, K. D. (1999). Shaping school culture: The heart of leadership. San
Francisco: Jossey-Bass.
Deci, E. L., & Ryan, R. M. (1985). Intrinsic motivation and self determination in human
behavior. New York: Plenum Press.
Deci, E. L., Vallerand, R. J., Pelletier, L. G., & Ryan, R. M. (1991). Motivation and education:
The self-determination perspective. Educational Psychologist, 26(3 & 4), 325-346.
Dill, V., & Stafford-Johnson, D. (2003). Can teachers be found and certified to teach students at
risk? Houston, TX: The Haberman Educational Foundation. Retrieved Novermber 14,
2007, from http://www.habermanfoundation.org
Driscoll, D., Halcoussis, D., & Svorny, S. (2002). School district size and student performance.
Economics of Education Review, 22(2), 193-201.
Dunn, C., Chambers, D., & Rabern, K. (2004). Variables affecting students’ decisions to drop
out of school. Remedial & Special Education, 25(5), 314-324.
Durkheim, E. (1964). The division of labor in society (George Simpson Trans.). New York: The
Free Press. (Original work published 1933).
Dynarski, M., & Gleason, P. (1998). How can we help? What have we learned from evaluations
of federal dropout-prevention programs Princeton, NJ: Mathematica Policy Research.
Ekstrom, R. B., Goertz, M. E., Pollack, J. M., & Rock, D. A. (1986). Who drops out of high
school and why? Findings of a national study. Teachers College Record, 87, 3576-3730.
Ellickson, P. L., Bui, K., Bell, R. M., & McGurigan, K. (1998). Does early drug use increase the
risk of dropping out of high school? Journal of Drug Issues, 28, 357-380.
100
Elliot, M. N., Hanser, L. M., & Gilroy, C. L. (2002). Career Academies: Additional evidence of
positive student outcomes. Journal of Education for Students Placed at Risk, 7(1), 71-90.
Epstein, J. L., & Sheldon, S. B. (2002). Present and accounted for: Improving student attendance
through family and community involvement. The Journal of Educational Research,
95(5), 308-318.
Fashola, O. S. & Slavin, R. E. (1998). Effective dropout prevention and college attendance
programs for students at risk. Journal of Education for Students Placed at Risk, 3(2),
159-183.
Feagin, J. R. (2006). Systematic racism: A theory of oppression. New York: Routledge.
Fenwick, L. T. (2001). Patterns of excellence: Policy perspectives on diversity in teaching and
school leadership. Atlanta, GA: Southern Education Foundation. (ERIC document
Reproduction Service No. ED472206)
Fetler, M. (1989). School dropout rates, academic performance, size, and poverty: Correlates of
educational reform. Educational Evaluation and Policy Analysis, 11, 109-116.
Fine, M. (1986). Why urban students drop into and out of public high school. Teachers College
Record, 87(3), 393-409.
Finn, J. D. (1989). Withdrawing from school. Review of Educational Research, 59(2), 117-142.
Finn, J. D., & Voekl, K. E. (1993). School Characteristics Related to Student Engagement.
Journal of Negro Education, 62(3), 249-268.
Freiberg, H. J., & Stein, T. A. (1999). Measuring, improving, and sustaining healthy
environments. In H. J. Freiberg (Ed.), School climate: Measuring, improving and
sustaining healthy learning environments. London: Falmer Press.

101
Gall, M. D., Gall, J. P., & Borg, W. R. (2007). Educational research: An introduction (8th ed.).
New York: Pearson Education.
Gallagher, C.J. (2002). Stories from strays: What dropouts can teach us about school. American
Education, 30(3), 36-60.
Gandara, P., Larson, K. A., Rumberger, R. W., & Mehan, H. (1998). Capturing Latino students
in the academic pipeline. California Policy Brief Series, 10(3). Berkeley, CA: University
of California, California Policy Research Center.
Georgia Department of Education. (2006, November 5). Georgia Association of Secondary
School Principals. Retrieved September 9, 2008, from http://www.doe.k12.ga.us/
DMGetDocument.aspx/GASSP%20Presentation.pdf?p=6CC6799F8C1371F66BC43F9B
A07211E567C19BED89393C0AD463296E6F26C576&Type=D
Georgia Department of Education (2007, December 10). Knocking at the college door:
Projections of high school graduates by state and race/ethnicity. Retrieved April 25,
2009, from http://public.doe.k12.ga.us/DMGetDocument.aspx/wiche_knocking_georgia
.pdf?p=6CC6799F8C1371F601465A38949E642BCF015BD4A1799A1CB47DC90853A
F2ED8&Type=D
Glatthorn, A. A. (2001). Developing a quality curriculum. Long Grove, IL: Waveland Press.
Gleason, P., & Dynarski, M. (2002). Do we know whom to serve? Issues in using risk factors to
identify dropouts. Journal of Education for Students Placed at Risk, 7(1), 25-41.
Goldring, L. (2003). The power of school culture. Leadership, 32, 32-35.
Goldschmidt, P., & Wang, J. (1999). When can schools affect dropout behavior? A longitudinal
multilevel analysis. American Education Research Journal, 36(4), 715-738.
102
Gordon, E. E. (2005). The 2010 meltdown: Solving the impending jobs crisis. Westport, CT:
Praeger.
Gottfredson, G. D., & Gottfredson, D. C. (1989). School climate, academic performance,
attendance, and dropout. Baltimore: Johns Hopkins University, Center for Social
Organization of Schools. (ERIC Document Reproduction Service No. ED 308 225)
Governor’s Office of Student Achievement. (2005). 2004-2005 annual report cards on K-12
public schools. Retrieved March 13, 2008, from http://reportcard2005.gaosa.org/k12/
about.asp#D9B
Green, J. (2001). High school graduation rates in the United States. Center for Civic Innovation
at the Manhattan Institute. Retrieved October 30, 2007, from http://www.manhattan-
institute.org/html/er%5fbaeo.htm
Greene, J. P. & Forster, G. (2003). Public high school graduation and college readiness rates in
the United States. Education Working Paper 3. Retrieved March 13, 2008, from
http://www .manhattan-institute.org/html/ewp_03.htm
Greene, J. P., & Winters, M. A. (2006). Leaving boys behind: Public high school graduation
rates (Civic Report No. 48). New York: Center for Civic Innovation at the Manhattan
Institute. (ERIC Document Reproduction Service No. ED491633)
Grogger, J. (2004). Welfare transitions in the 1990’s: The economy, welfare policy, and the
EITC. Journal of Policy Analysis and Management, 23, 671-695.
Hale, J. (2001). Learning while black: Creating educational excellence for African American
children. Baltimore: Johns Hopkins University Press.

103
Hammond, C., Linton, D., Smink, J., & Drew, S. (2007). Dropout risk factors and exemplary
programs: A technical report. Clemson, SC: Clemson University, National Dropout
Prevention Center. Retrieved October 9, 2007, from http://www.dropoutprevention.org
Hardre, P. L., & Reeve, J. (2003). A motivational model of rural students’ intentions to persist in,
versus drop out of, high school. Journal of Educational Psychology, 95(2), 347-356.
Hartnett, S. (2008). Does peer group identity influence absenteeism in high school students?
High School Journal, 91(2), 35-44.
Heubert, J., & Hauser, R. (Eds.). (1999). High stakes: Testing for tracking, promotion, and
graduation. Washington, DC: National Academy Press.
Hirschi, T. (1969). Causes of delinquency. Los Angeles: University of California Press.
Holland, A., & Andre, T. (1987). Participation in extracurricular activities in secondary school:
What is known, what needs to be known? Review of Educational Research, 57, 437-466.
http://emsc33.nysed.gov/repcrd2005/cir/280252070002.pdf
Huberty, C. J. (2003). Multiple correlation versus multiple regression. Educational and
Psychological Measurement, 63(2), 271-278.
Huberty, C. J., & Petoskey, M. D. (1999). Use of multiple correlation analysis and multiple
regression analysis. Journal of Vocational Education Research, 24(1), 15-43.
Huck, S. W. (2004). Reading statistics and research (4th ed.). New York: Pearson Education.
Hunkins, F. P., & Hammill, P. A. (1994). Beyond Tyler and Taba: Re-conceptualizing the
curriculum process. Peabody Journal of Education 69(3), 4-8.
Ingersoll, R. (2003). The teacher shortage: Myth or reality? Educational Horizons, 81, 146-152.

104
Janosz, M., Le Blanc, M., Boulerice, B., & Tremblay, R.E. (1997). Disentangling the weight of
school dropout predictors: A test on two longitudinal samples. Journal of Youth and
Adolescence, 26, 733-762.
Jerald, C. D. (2006, December). School culture: The hidden curriculum (Issue Brief).
Washington, D.C.: The Center for Comprehensive School Reform and Improvement.
Retrieved May 20, 2008, from http://www.centerforcsri.org
Jessor, R., & Jessor, S. L. (1977). Problem behavior and psychosocial development. San Diego,
CA: Academic Free Press.
Jimerson, S. R. (2001). Meta-analysis of grade retention research: Implications for practice in the
21st century. School Psychology Review, 3, 420-437.
Jimerson, S., Egeland, B, Sroufe, L. A., & Carlson, E. (2000). A prospective, longitudinal study
of high school dropouts: Examining multiple predictors across development. Journal of
School Psychology, 38(6), 525-549.
Johnson, C. J., & Kritsonis, W. A. (2006). The achievement gap in mathematics: A significant
problem for African American students. Retrieved October 10, 2007, from
http://www.eric
.ed.gov/ERICDocs/data/ericdocs2sql/content_storage_01/0000019b/80/1b/d8/3c.pdf
Kemple, J. J. (2004). Career academies: Impacts on labor market outcomes and educational
attainment. New York: MDRC.
Kemple, J. J., & Scott-Clayton, M. (2004). Career academies: Impacts on labor market
outcomes and educational attainment. Technical Resources. Retrieved May 15, 2008,

105
from http://eric.ed.gov/ERICDocs/data/ericdocs2sql/content_storage_01/
0000019b/80/29/d8/e8.pdf
Kemple, J. J., & Snipes, J. C. (2000). Career Academies: Impacts on students’ engagement and
performance in high school. New York: MDRC.
Kennedy, J. H., & Kennedy, C. E. (2004). Attachment theory: Implications for school
psychology. Psychology in the Schools, 41(2), 247-259.
Kennelly, L., & Monrad, M. (2007, October). Approaches to Dropout Prevention: Heeding early
warning signs with appropriate interventions. National High School Center at the
American Institute for Research. Retrieved February 8, 2008, from http://www
.betterhighschools.org
Kuziemko, I. (2006). Using shocks to school enrollment to estimate the effect of school size on
student achievement. Economics of Education Review, 25, 63-75.
Ladson-Billings, G. (1994). Dreamkeepers: Successful teachers of African American Children.
San Francisco: Jossey-Bass.
Lankford, H., Loeb, S., & Wyckoff, J. (2002). Teacher sorting and the plight of urban schools: A
descriptive analysis. Educational Evaluation and Policy Analysis, 24(1), 37-62.
Larson, K. A., & Rumberger, R. W. (1995). Doubling school success in highest-risk Latino
youth: Results from a middle school intervention study. In R. F. Macías & R. G. García
Ramos (Eds.), Changing schools for changing students. Santa Barbara, CA: University of
California Linguistic Minority Research Institute.
LeCompte, M. D., & Dworkin, A. G. (1991). Giving up on school: Student dropouts and teacher
burnouts. Newbury Park, CA: Corwin.

106
Lee, V. E., & Burkham, D. T. (2003). Dropping out of high school: The role of school
organization and structure. American Educational Research Journal, 40(2), 353-393.
Lehr, C. A., Johnson, D. R., Bremer, C. D., Cosio, A., & Thompson, M. (2004). Increasing rates
of school completion: Moving from policy and research to practice. Minneapolis,
University of Minnesota, National Center on Secondary Education and Transition.
Retrieved December 15, 2007, from
http://www.ncset.org/publications/essentialtools/dropout/dropout.pdf
Lehr, C. A., Sinclair, M. F., & Christenson S. L. (2004). Addressing student engagement and
truancy prevention during the elementary school years: A replication study of the check
and connect model. Journal of Education for Students Placed at Risk 9(3), 279-301.
Levin, H., Belfield, C., Muennig, P., & Rouse, C. (2007). The public returns to public
educational investments in African-American males. Economics of Education Review, 26,
700-709.
Levin, H., Belfield, C., Muennig, P., & Rouse, C. (2006). The Costs and Benefits of an Excellent
Education for All of America’s Children. Paper prepared under grant support from Lilo
and Gerry Leeds to Teachers College, Columbia University. Retrieved December 12,
2008 fromhttp://www.cbcse.org/media/download_gallery/Leeds_Report_Final_Jan2007
Lewis, C. W., James, M., Hancock, S., & Hill-Jackson, V. (2008). Framing African American
students’ success and failure in urban settings. Urban Education, 43(2), 127-153.
Liu, G. (2006). How the federal government makes rich states richer. The Education Trust,
Funding Gaps 2006. Retrieved May 20, 2008, from http://www2.edtrust.org/NR/
rdonlyres/CDEF9403-5A75-437E-93FF-EBF1174181FB/0/FundingGap2006.pdf

107
Lockwood, A. (2000). Transforming education for Hispanic youth: Recommendations for
teachers and program staff (Issue Brief No. 3). Washington, DC: National Clearinghouse
for Bilingual Education, Center for the Study of Language & Education. Retrieved May,
11, 2009, from http://www.ncela.gwu.edu/pubs/issuebriefs/ib3.pdf
Mahoney, J.L., & Cairns, R.B. (1997). Do extracurricular activities protect against early school
dropout? Developmental Psychology, 33(2), 241-253.
Marcus, R. F., & Sanders-Reio, J. (2001). The influence of attachment on school completion.
School Psychology Quarterly, 16(4), 427- 444.
Margolis, J. (2006). New teachers, high stakes diversity, and the performance-based conundrum.
The Urban Review, 38(1), 27-44.
Martin, N., & Halperin, S. (2006). Whatever it takes: How twelve communities are reconnecting
out-of-school youth. Washington, DC: American Youth Policy Forum. Retrieved August
12, 2009, from http://www.aypf.org/publications/WhateverItTakes/WITfull.pdf
Maxwell, N. L., & Rubin, V. (2001). Career Academy Programs in California: Outcomes and
Implementation. University of California, California Policy Research Center. Retrieved
April 30, 2008 from http://www.ucop.edu/cprc/documents/careeracadrpt.pdf
McCoy, A. R., & Reynolds, A. J. (1999). Grade retention and school performance: An extended
investigation. Journal of School Psychology, 37(3), 273-298.
McDonnell, L. (2005). No Child Left Behind and the federal role in education: Evolution or
revolution? Peabody Journal of Education, 80(2), 19-38.
McGee, L., & Newcomb, M. D. (1992). General deviance syndrome: Expanded hierarchical
evaluations at four ages from early adolescence to adulthood. Journal of Consulting and
Clinical Psychology, 60(5), 766-776.

108
McMillan, J., & Reed, D. (1993). Defying the odds: A study of at-risk students. Metropolitan
Educational Research Consortium. Retrieved January30, 2008, from
http://www.eric.ed.gov/ERICDocs/data/ericdocs2sql/content_storage_01/0000019b/80/1
4/49/08.pdf
McNeal, R. B. (1995). Extracurricular activities and high school dropouts. Sociology of
Education, 68, 62-81.
McNeal, R. B. (1997). High school dropouts: A closer examination of school effects. Social
Science Quarterly, 78, 209-222.
Merton, R. K. (Ed.). (1968). Social theory and social structure (Rev. ed.). New York: Free Press.
Mingliang, Li. (2006). High school completion and future youth unemployment: New evidence
from high school and beyond. Journal of Applied Econometrics, 21(1), 23-53.
Minhui,Q. (2007). Discontinuity and reconstruction. The hidden curriculum in schoolroom
instruction in minority-nationality areas. Chinese Education and Society, 40(2), 60-76.
Mitchell, K., Bush, E. C.& Lawson Bush, V. (2002). Standing in the gap: A model for
establishing African-American male intervention programs within public schools.
Educational Horizons, 80, 140-146.
Montecel, M. R., Cortez, J. D., & Cortez, A. (2004). Drop-out prevention programs: Right intent,
wrong focus, and some suggestions on where to go from here. Education and Urban
Society, 36(2), 169-188.
Montecel, M. R., Supik, J. D. & Montemayor, A. (1994). Valued youth program: Dropout
prevention strategies for at-risk youth. In L.M. Malave (Ed.), National Association for
Bilingual Education, Annual Conference Journal, NABE '92-'93 (pp. 65-80).
Washington, DC: National Association for Bilingual Education.

109
Montgomery, D. C., Peck, E. A., & Vining, G. G. (2007). Introduction to linear regression
analysis (4th ed.). New York: Wiley-Interscience.
Muennig, P. (2005). The economic value of health gains associated with education intervention.
Paper prepared at the Equity Symposium on “The Social Costs of Inadequate Education,”
Teachers’ College, Columbia University, October 2005. Retrieved January 22, 2008,
from http://www.schoolfunding.info/news/policy/Muennig - Health and Education.pdf
Natale, J. (1991). Rethinking grade retention. The Education Digest, 56, 30-33.
National Center for Educational Statistics. (2001). Table 1. Dropout numbers and rates in grades
9-12, by state: School year 2000-01. Public high school dropout and completers from the
common core of data: School year 2000-2001. Retrieved October 30, 2007, from http://
nces.ed.gov/pubs2004/dropout00-01/table_1.asp#f1
National Center for Educational Statistics. (2005). Table 12. Average freshman graduation rate
of public high school students, by state: School year 2003–04. Dropout rates in the
United States: 2005. Retrieved February 22, 2009, from http://nces.ed.gov/pubs2007/
dropout05/tables/table_12.asp
National Center for Educational Statistics. (2006). Appendix A-Technical notes: Defining and
calculating dropout and completion rates using the CPS Dropout rates in the United
States: 2002 and 2003, Retrieved March 13, 2008, from http://nces.ed.gov/pubs2006/
dropout/a5.asp
National Center for Educational Statistics. (2006). Table 3. Public school average freshman
graduation rate and components, Hispanic students, by state: School year 2004–05.
Common Core of Data (CCD). State Nonfiscal Survey of Public Elementary/Secondary

110
Education. Retrieved September 12, 2009, from http://nces.ed.gov/ccd/tables/
freshman_03.asp
National Center for Educational Statistics. (2007). Table 1. Percentage of high school dropouts
among persons 16 through 24 years old (status dropout rate), by sex and race/ethnicity:
Selected years, 1960 through 2006. Digest of education statistics, 2007. Retrieved
February, 12, 2009 from http://nces.ed.gov/programs/digest/d07/tables/dt07_105.asp
National Dropout Prevention Center. (2005, January). Big ideas: Dropout prevention strategies.
NDPC-SD eNewsletter, 2(1), 1-10. Retrieved May 8, 2008, from http://www2.edc.org/
ndpc-sd/vol2.htm
Neild, R. C., & Balfanz, R. (2006). An extreme degree of difficulty: The educational
demographics of urban neighborhood high schools. Journal of Education for Students
Placed at Risk, 11(2), 123-141.
Neild, R. C., & Balfanz, R. (2006). Unfilled promise: The dimensions and characteristic’s of
Philadelphia’s dropout crisis, 2000-2005. Baltimore: Center for Social Organization of
Schools, Johns Hopkins University.
Neild, R.C., Stoner-Eby, S., & Furstenberg, F. (2008). Connecting entrance and departure: The
transition to ninth grade and high school dropout. Education and Urban Society, 40(5),
543-569.
Neubauer, A. (1986). Philadelphia high school academies. Education Horizons, 65(1), 16-19.
New York Department of Education. (2006, April). New York state school report card: Elmont
Memorial Junior-Senior High School in Sewanhaka Central High School District, 2004-
05, (p.3). Retrieved May 20, 2008, from
http://www.emsc.nysed.gov/repcrd2005/schools/280252070002.shtml

111
Newcomb, M. D., Abbott, R. D., Catalano, R. F., Hawkins, J. D., Battin-Pearson S., & Hill, K.
(2002). Mediational and deviance theories of late high school failure: Process roles of
structural strains, academic competence, and general versus specific problem behaviors.
Journal of Counseling Psychology, 49(2), 172-186.
Newmann, F. M. (1981). Reducing student alienation in high schools: Implications of theory.
Harvard Educational Review, 51, 546-564.
No Child Left Behind Act of 2001, Pub. L. No. 107-110, 115 Stat. 1425 (2002). Retrieved
December 11, 2007, from http://www.ed.gov/policy/elesc/leg/esea02/index.html
Olson, L., & Jerald, C. (1998). The achievement gap. Education Week: Quality Counts, 17, 11-
13.
Onwuegbuzie, A. J. (2000, November). Expanding the framework of internal and external
validity in quantitative research. Paper presented at the annual meeting of the
Association for the Advancement of Educational Research, Ponte Vedra, FL. (ERIC
Document Reproduction Service No. ED448205)
Ornstein, A. C., & Hunkins, F. P. (1997). Curriculum: Foundations, principles, and issues. (3rd
ed.). Needham Heights, MA: Allyn & Bacon.
Orr, M.T. (1987). Keeping students in school: A guide to effective dropout prevention programs
and services. San Francisco: Jossey-Bass.
Osborne, J., & Raush, J. (2001). Identification with academics and academic outcomes in
secondary students. Oklahoma City: University of Oklahoma Press.
Padover, S. K. (1952). Jefferson: A great American's life and ideas. New York: Harcourt, Brace
& World.

112
Parker, R. M. (1990). Power, control, and validity in research. Journal of Learning Disabilities,
23(10), 613-620.
Patterson, J. A., Hale, D., & Stessman, M. (2007). Cultural contradictions and school leaving: A
case study of an urban high school. High School Journal, 91(2), 1-15.
Pearson, A. & Banerji, S. (1993). Effects of a Ninth-Grade Dropout Prevention Program on
Student Academic Achievement, School Attendance, and Dropout Rate. Journal of
Experimental Education, 61, 247-259.
Peterson, P. (1991). The urban underclass and the poverty paradox. In C. Jenks & P. Peterson
(Eds.), The urban underclass (pp. 3-27). Washington, DC: Brookings.
Pianta, R. (1999). Enhancing relationships between teachers and children. Washington, DC:
American Psychological Association.
Pinkney, A. (2000). Black Americans (5th ed.). Upper Saddle River, NJ: Prentice Hall.
Pong, S. L., & Dong-Beom, J. (2000). The effects of change in family structure and income of
dropping out of middle and high school. Journal of Family Issues, 21(2), 147-169.
Popham, J. (2001). The truth about testing: An educator’s call to action. Alexandria: VA:
Association for Supervision and Curriculum Development.
Popham, J. (2003). Trouble with testing: Why standards-based assessment doesn’t measure up.
American School Board Journal, 190(2), 3-8.
Posner, G. J. (2004). Analyzing the curriculum (3rd ed.). Boston: McGraw-Hill.
Raymen, R. (1981). Joseph Lancaster’s monitorial system of instruction and American Indian
education, 1815-1838. History of Education Quarterly, 21(4), 395-409.

113
Reardon-Anderson, J., Capps, R., & Fix, M. (2002). The health and well-being of children in
immigrant families. Assessing the new federalism (Policy Brief B-52). Washington, DC:
The Urban Institute.
Reeve, J., Bolt, E., & Cai, Y. (1999). Autonomy-supportive teachers: How they teach and
motivate students. Journal of Educational Psychology, 91, 537-548.
Repetto, J.B., Pankaskie, S.A., De Palma-Hawkins, A., Schwartz, S.E., & Perry, L. (1997).
Promising practices in dropout prevention and transition for students with mild
disabilities. The Journal of At-Risk Issues, 4(1), 19-29.
Roderick, M. (2003). What’s happening to the boys? Early high school experiences and school
outcomes among African American male adolescents in Chicago. Urban Education, 38,
538-607.
Roderick, M. (1995). Grade retention and school dropout: Investigating the association.
American Educational Research Journal, 31(4), 729-759.
Roderick, M., & Camburn, E. (1999). Risk and recovery from course failure in the early years of
high school. American Educational Research Journal, 36(2), 303-344.
Roderick, M., Jacob, B. A., & Bryk, A. S. (2002). The impact of high stakes testing in Chicago
on student achievement in promotional gate grades. Educational Evaluation and Policy
Analysis, 24(4), 333-357.
Rumberger, R. W. (1995). Dropping out of middle schools. American Educational Research
Journal, 32, 583-625.
Rumberger, R.W. (2001). Why students drop out of school and what can be done. Santa Barbara,
CA: University of California-Santa Barbara. Retrieved December 10, 2007, from
http://www.civilrightsproject.harvard.edu/research/dropouts/rumberger.pdf

114
Rumberger, R. W., & Larson, K. A. (1998). Student mobility and the increased risk of school
dropout. American Journal of Education, 107, 1-35.
Ryan, R. M., & Deci, E. L. (2000). Self-determination theory and the facilitation of intrinsic
motivation, social development, and well being. American Psychologist, 55, 68-78.
Ryan, R. M., Kuhl, J., & Deci, E. L. (1997). Nature and autonomy: Organizational view of social
and neurobiological aspects of self-regulation in behavior and development. Development
and Psychopathology, 9, 701-728.
Scanlon, D., & Mellard, D. F. (2002). Academic and participation profiles of school-age
dropouts with and without disabilities. Exceptional Children, 68, 239-258.
Schargel, F. P. (2004). Who drops out and why. In J. Smink & F. P. Schargel (Eds.), Helping
students graduate: A strategic approach to dropout prevention. Larchmont, NY: Eye on
Education.
Shealy, M. W. (2006). The promises and perils of “scientifically based” research for urban
schools. Urban Education, 41(5), 5-19.
Shore, R. (2003). Reducing the high school dropout rate. (Kids Count Indicator Brief).
Baltimore, MD: The Annie E. Casey Foundation. Retrieved June 14, 2009, from http://
www.aecf.org/kidscount/indicator_briefs/dropout_rate.pdf.
Siegel, L. J. (2003). Criminology (8th ed.). Toronto, Canada. Thompson Learning.
Sinclair, M. F., & Kaibel, C. (2002). Dakota County: Secondary check & connect program:
Program evaluation final summary report. Minneapolis, MN: University of Minnesota,
Institute on Community Integration.

115
Sinclair, M. F., Christenson, S. L., Evelo, D. L., & Hurely, C. M. (1998). Dropout prevention for
youth with disabilities: Efficacy of a sustained school engagement procedure.
Exceptional Children, 65(1), 7-21.
Skidmore, S. (2008, February). Experimental design and some threats to experimental validity: A
primer. Paper presented at the annual meeting of the Southwest Educational Association,
New Orleans, LA. (ERIC Document Reproduction Service No. ED499991)
Snipes, J. C., & Casserly, M. D. (2004). Urban school systems and education reform: Key
lessons from a case study of large urban school systems. Journal Of Education For Students
Placed at Risk, 9(2), 127-141.
Stern, D., Dayton C., & Raby, M. (2003). Career academies and high school reform before,
during, and after the school-to-work movement. In W. J. Stull & N. M. Sanders (Eds.),
The school-to-work movement: origins and destinations (pp. 239-262). Westport, CT:
Praeger.
Stern, D., Raby, M., & Dayton, C. (1992). Career Academies: Partnerships for Reconstructing
American High Schools. San Francisco: Jossey-Bass.
Stewart, E. B. (2008). Individual and school structural effects on African American high school
students’ academic achievement. High School Journal, 91(2), 16-34.
Suh, S., & Suh, J. (2000). Risk factors and levels of risk for high school dropouts. Professional
School Counseling, 10(3), 297-306.
Suh, S., Suh, J., & Houston, I. (2007). Predictors of categorical at-risk high school dropouts.
Journal of Counseling and Development, 85, 196-203.
Sum, A., & Harrington, P. (2003). The hidden crisis in the high school dropout problems of
young adults in the U.S.: Recent trends in overall school dropout rates and gender

116
differences in dropout behavior. Boston, MA: Northeastern University, Center for Labor
Market Studies. Prepared for The Business Roundtable. Washington DC. Retrieved
January, 2009, from http://www.eric.ed.gov/ERICDocs/data/ericdocs2sql/
content_storage_01/0000019b/80/29/d6/32.pdf
Swanson, C. B. (2004). Who graduates? Who doesn’t? A statistical portrait of public high school
graduation, Class of 2001. Washington, DC: The Urban Institute.
Swanson, C., & Schneider, B. (1999). Students on the move: Residential and educational
mobility in America’s schools. Sociology of Education, 72(1), 54-67.
Sweetland, S. R., & Hoy, W. K. (2000). School characteristics and educational outcomes:
Towards an organizational model of student achievement in middle schools. Educational
Administration Quarterly, 36(5), 703-729.
Tanner, D., & Tanner, L. (2007). Curriculum development. Theory into practice (4th ed.). Upper
Saddle River, NJ: Prentice Hall.
Tidwell, R. (1988). Dropouts speak out: Qualitative data on early school departures.
Adolescence, 23, 939-954.
Tittle C. R., (1995). Control balance: Toward a general theory of deviance. Boulder, CO:
Westview Press.
Tittle, C. R., & Stafford, M. C. (1992). Urban theory, urbanism, and suburban residence. Social
Forces, 70(3), 725-744.
Towns, D., Cole-Henderson, B., & Serpell, Z. (2001). The journey to urban school success:
Going the extra mile. The Journal of Negro Education, 70, 4-19.
Tyler, R. W. (1949). Basic principles of curriculum and instruction. Chicago: University of
Chicago Press.

117
United States Census Bureau (2007, November). Metropolitan and micropolitan statistical areas
and components, November 2007. Retrieved May 12, 2009 from
http://www.census.gov/population/www/metroareas/lists/2007/List1.txt.
Vallerand, R. J., Fortier, M. S., & Guay, F. (1997). Self-determination and persistence in a real-
life setting: Toward a motivational model of high school dropout. Journal of Personality
and Social Psychology, 72(5), 1161-1176.
Van Der Westhuizen, P. C., Mosoge, M. J., Swanepoel, L. H., & Coestsee, L. D. (2005).
Organizational culture and academic achievement in secondary schools. Education and
Urban Society, 38(1), 89-109.
Vang, C. T. (2006). Minority parents should know more about school culture and its impact.
Multicultural Education, 14(1), 20-26.
Velasco, J. R., Fix, M., & Clewell, B. C. (2000). Overlooked and underserved: Immigrant
students in U.S. secondary schools. Washington, DC: The Urban Institute.
Viadero, D. (2006). Signs of early exit for dropouts abound. Education Week 25(41), 20.
Viadero, D. (2004). Panel urges new system for high school data: Graduation, dropout rates
focus of policy concern. Education Week 24(15),1-3.
Wheelcock, A., & Miao, J. (2005). The ninth grade bottleneck. School Administrator, 62(3), 1-7.
Wiener, R., & Pristoop, E. (2006). How states shortchange the districts that need the most help.
The Education Trust: Funding Gaps 2006, 5-9. Retrieved May 20, 2008, from
http://www2.edtrust.org/NR/rdonlyres/CDEF9403-5A75-437E-93FF-
EBF1174181FB/0/FundingGap2006.pdf

118
Woods, E.G. (2001) Reducing the dropout rate. School improvement research series. Retrieved
October 7, 2008, from Northwest Regional Educational Laboratory Web site:
http://www.nwrel.org/scpd/sirs/9/c017.html

119 APPENDICES

120
Appendix A
All-Possible-Regressors Model
Number in Model C(p) R‐Square MSE Variables in Model 8 6.3904 0.3827 21.50208 __hispanic_ __white __male with_disabilities with_ltd_engl_prof size1 size2 sloc1 8 6.6568 0.3815 21.54567 __black __hispanic_ __male with_disabilities with_ltd_engl_prof size1 size2 sloc1 7 7.8573 0.3665 21.90597 __black __hispanic_ __male with_disabilities with_ltd_engl_prof size2 sloc1 7 7.8838 0.3663 21.91027 __hispanic_ __white __male with_disabilities with_ltd_engl_prof size2 sloc1 9 8.0176 0.3845 21.60229 __hispanic_ __white __male with_disabilities with_ltd_engl_prof _econ_disadvantage size1 size2 sloc1 9 8.1118 0.3841 21.61782 __black __hispanic_ __male with_disabilities with_ltd_engl_prof _econ_disadvantage size1 size2 sloc1 9 8.3469 0.3830 21.65659 __black __hispanic_ __white __male with_disabilities with_ltd_engl_prof size1 size2 sloc1 9 8.3484 0.3829 21.65683 __hispanic_ __white __male with_disabilities with_ltd_engl_prof size1 size2 sloc1 sloc2 9 8.5489 0.3820 21.68988 __black __hispanic_ __male with_disabilities with_ltd_engl_prof size1 size2 sloc1 sloc2 6 8.8821 0.3522 22.23261 __black __hispanic_ __male with_disabilities with_ltd_engl_prof sloc1 7 8.9909 0.3611 22.09011 __black __hispanic_ __male with_disabilities with_ltd_engl_prof size1 sloc1 7 9.0224 0.3610 22.09522 __hispanic_ __white __male with_disabilities with_ltd_engl_prof size1 sloc1 6 9.0773 0.3513 22.26409 __hispanic_ __white __male with_disabilities with_ltd_engl_prof sloc1 7 9.4199 0.3591 22.15979 __hispanic_ __male with_disabilities with_ltd_engl_prof _econ_disadvantage size2 sloc1 7 9.5277 0.3586 22.17730 __hispanic_ __male with_disabilities with_ltd_engl_prof size1 size2 sloc1 8 9.6193 0.3676 22.03050 __black __hispanic_ __male with_ltd_engl_prof _econ_disadvantage size1 size2 sloc1 8 9.7158 0.3671 22.04628 __hispanic_ __white __male with_ltd_engl_prof _econ_disadvantage size1 size2 sloc1
The REG Procedure
Model: MODEL1 Dependent Variable: Dropout_rate C(p) Selection Method Number of Observations Read 143 Number of Observations Used 143

121
Appendix B
Variable Correlation Matrix
dropout rate black hispanic White male
with disability
limited english
proficiencyschool location
school size
Pearson Correlation 1 0.073 0.051 -0.064 .397** 0.109 -0.059 -0.102 -.269**
Sig. (2-tailed) 0.395 0.55 0.456 0 0.202 0.491 0.234 0.001
N 139 139 139 139 139 139 139 139 139
Pearson Correlation 0.073 1 -.223** -.921** -.229** 0.125 -0.159 -.415** -0.041
Sig. (2-tailed) 0.395 0.007 0 0.006 0.138 0.058 0 0.624
N 139 143 143 143 143 143 143 143 143
Pearson Correlation 0.051 -.223** 1 -0.141 0.071 -0.108 .935** -0.107 0.046
Sig. (2-tailed) 0.55 0.007 0.093 0.4 0.199 0 0.203 0.584
N 139 143 143 143 143 143 143 143 143
Pearson Correlation -0.064 -.921** -0.141 1 .202* -0.07 -.207* .489** -0.016
Sig. (2-tailed) 0.456 0 0.093 0.016 0.405 0.013 0 0.852
N 139 143 143 143 143 143 143 143 143
Pearson Correlation .397** -.229** 0.071 .202* 1 .473** 0.053 .206* -0.111
Sig. (2-tailed) 0 0.006 0.4 0.016 0 0.529 0.013 0.188
N 139 143 143 143 143 143 143 143 143
Pearson Correlation 0.109 0.125 -0.108 -0.07 .473** 1 -0.115 0.062 -.223**
Sig. (2-tailed) 0.202 0.138 0.199 0.405 0 0.17 0.461 0.008
N 139 143 143 143 143 143 143 143 143
Pearson Correlation -0.059 -0.159 .935** -.207* 0.053 -0.115 1 -0.158 0.025
Sig. (2-tailed) 0.491 0.058 0 0.013 0.529 0.17 0.059 0.769
N 139 143 143 143 143 143 143 143 143
Pearson Correlation -0.102 -.415** -0.107 .489** .206* 0.062 -0.158 1 0.001
Sig. (2-tailed) 0.234 0 0.203 0 0.013 0.461 0.059 0.988
N 139 143 143 143 143 143 143 143 143
Pearson Correlation -.269** -0.041 0.046 -0.016 -0.111 -.223** 0.025 0.001 1
Sig. (2-tailed) 0.001 0.624 0.584 0.852 0.188 0.008 0.769 0.988
N 139 143 143 143 143 143 143 143 143
dropout rate
black
hispanic
white
male
school location
school size
**. Correlation is significant at the 0.01 level (2-tailed).
*. Correlation is significant at the 0.05 level (2-tailed).
with disability
limited english proficiency

122
Appendix C
Log Transformation (Box-Cox Method)
The Box-Cox transformation in SAS The SAS System The TRANSREG Procedure Transformation Information for BoxCox(Dropout_rate) Lambda R‐Square Log Like ‐3.00 0.13 ‐859.249 ‐2.75 0.13 ‐769.817 ‐2.50 0.13 ‐681.752 ‐2.25 0.13 ‐595.408 ‐2.00 0.13 ‐511.285 ‐1.75 0.13 ‐430.091 ‐1.50 0.13 ‐352.837 ‐1.25 0.13 ‐280.925 ‐1.00 0.14 ‐216.198 ‐0.75 0.15 ‐160.858 ‐0.50 0.16 ‐117.206 ‐0.25 0.18 ‐87.419 0.00 + 0.21 ‐73.682 < 0.25 0.26 ‐78.555 0.50 0.32 ‐104.351 0.75 0.37 ‐150.946 1.00 0.39 ‐214.768 1.25 0.39 ‐290.899 1.50 0.38 ‐375.307 1.75 0.37 ‐465.346 2.00 0.35 ‐559.376 2.25 0.34 ‐656.359 2.50 0.32 ‐755.603 2.75 0.31 ‐856.624 3.00 0.30 ‐959.074 < ‐ Best Lambda * ‐ Confidence Interval + ‐ Convenient Lambda
`