Embed Size (px)
Citation preview

www.erdc.wa.gov ERDC Report 2014-07 June 2014
The Washington State Education Research & Data Center (ERDC) in the Washington Office of Financial Management is charged with conducting analyses of early learning, K-12, higher education programs and career and education issues and development of a P20/Workforce (P20W) data system to support these studies. ERDC focuses on longitudinal education studies, particularly those that involve transitions across education sectors and those that involve workforce-education connections.
&
EDUCATION RESEARCH DATA CENTER
Trends in Higher Education Finance Enrollment Patterns, Student Financial Aid, Net Price, and Completions
This study focuses on student financial aid trends in postsecondary education for both the public and private sectors. It is funded by Washington’s ARRA Statewide Longitudinal Data Systems Grant.
Purpose As part of the grant extension for the development of the P-20 data warehouse, the ERDC proposed to develop a second report on trends in higher education finance.1 This report concentrates on the financing of postsecondary education in Washington state from the perspective of the student by looking at student financial aid and the cost of attendance. The institutional-level data reviewed include:
• Enrollments by sector; • The sources of student financial aid – federal, state and institutional; • The type of aid – grants and loans; • The number of students receiving aid and the amounts; • The cost of attendance and net price; and • A measure of completions.
The analysis includes seven sectors of higher education institutions:
• Private for-profit career schools; • Private nonprofit career schools; • Public community and technical colleges (including the Northwest Indian College); • Private nonprofit 4-year institutions; • Private for-profit 4-year institions; • Public comprehensive institutions (including The Evergreen State College); and • Public research universities (including the branch campuses).
A complete listing of institutions included in the analysis by sector can be found in Appendix A.
1 The first was “Report on Higher Education Financials: Utilizing Metrics Developed by the Delta Cost Project,” ERDC Brief 2014-06, Education Research and Data Center, April 2014.
ERDC Report 2014-07 June 2014
2
Method and Data Sources The primary data source is IPEDS (the Integrated Postsecondary Education Data System), the core postsecondary data collection system of the National Center for Education Statistics, U.S. Department of Education. All postsecondary institutions that participate in federal financial aid programs such as Pell grants or Stafford loans are required to provide data to IPEDS. The data is provided through a series of nine interrelated surveys. The surveys cover student financial aid, institutional characteristics, enrollments, program completion and graduation rates, institutional revenues and expenditures, and human resources. The data is provided at the institution level – not at the student level – and is in the public domain. Nationwide about 7,000 institutions participate; in Washington about 125 institutions participate in any given year. Data for the Washington institutions are stored in the ERDC P20W data warehouse.
Data from the IPEDS surveys on student financial aid, institutional characteristics (for cost of attendance information), completions, fall enrollments, and 12-month enrollments are used in this report. Washington institutions that completed all five surveys in a year are included in this report. The years covered are 2009 through 2012. Not all institutions are included in every year. The institution-level data is aggregated to the sector level.
Two groups of students are analyzed in the report:
• Group 1 consists of all undergraduate students – full-time and part-time; new and continuing; degree/certificate-seeking and non-degree/certificate-seeking students.
• Group 2 consists of a subset of Group 1 – all full-time, first-time, degree/certificate seeking undegraduate students.
While Group 1 is a broader group of students, IPEDS collects more detailed information on Group 2 students. All data tables can be found in Appendix B.
All dollar values have been adjusted to 2012 dollars using the implicit price deflator for personal consumption expenditures (IPD-PCE) prepared by the Bureau of Economic Analysis, U.S. Department of Commerce.
ERDC Report 2014-07 June 2014
3
Results and Findings 1. Enrollment Patterns
This section looks at the undergraduate enrollments in the seven sectors of postsecondary education in Washington state. It first looks at the enrollment pattern of all undergraduate students (Group 1) and then the enrollment pattern of a subgroup, the full-time, first-time, degree/certificate-seeking students (Group 2). This is followed by a similar look at the enrollment pattern of low-income students. Students that receive federal Pell grants are used as a proxy for “low-income.”
Group 1: All Undergraduate Students Group 1 includes all undergraduate students enrolled for credit in courses or programs that can be applied towards the requirements for a Bachelor’s degree, an Associate’s degree, or any certificate below the baccalaureate level. The students do not to be seeking a degree or certificate. This includes high school students taking regular college courses for credit; it also includes students taking remedial courses if the students are degree-seeking.
Undergraduate students can be categorized in several ways:
• New, continuing, or transfer students; • Full-time or part-time students; • Degree/certificate-seeking or non-degree/certificate-seeking students.
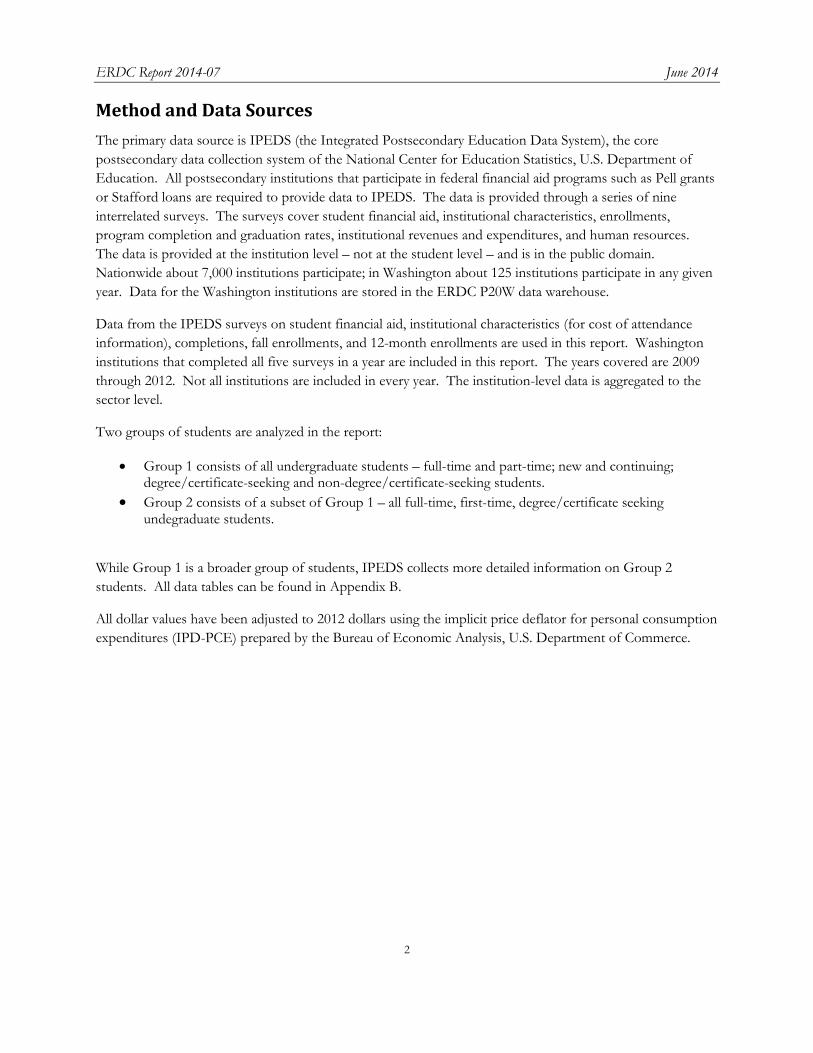
Data source: IPEDS Fall Enrollment Survey
94% 100%
54%
91%
75%
88% 88%
Figure 1a: Percent Full-Time Students (2012)

ERDC Report 2014-07 June 2014
4
The sectors enroll these categories of students in varying amounts (see Figures 1a and 1b and Table 1 in Appendix B). The majority of students in all sectors attend full-time but the range is from 54 percent of the community and technical college students to 100 percent at the nonprofit career schools. At the public 4-year institutions 88 percent of the students are full-time; 91 percent are full-time at the nonprofit 4-year institutions; and 94 percent are full-time at the for-profit career schools. Seventy-five percent of the students at the for-profit 4-year institutions are full-time. At the community and technical colleges 46 percent of the students are attending part-time.
Data source: IPEDS Fall Enrollment Survey
Nearly all of the students attending postsecondary institutions are seeking a degree or certificate with the exception of community and technical college students. At the community and technical college’s 59 percent of the students are seeking a degree or certificate and 41 percent are not.
Over all the sectors 76 percent of the students are seeking a degree or certificate. Forty-nine percent of the students are classified as continuing degree/certificate-seeking students, 15 percent as transfer degree/certificate-seeking students, and 13 percent are first-time degree/certificate-seeking students. These degree/certificate-seeking students include both full-time and part-time students.
The vast majority, 85 percent, of undergraduate college students in Washington state attend public institutions (see Figure 2 and Table 2 in Appendix B). Of the nearly 350,000 enrolled undergraduate students (full-time and part-time, degree/certificate-seeking and non-degree/certificate-seeking) in 2012, 57 percent were enrolled in community and technical colleges. Another 17 percent were enrolled in public research universities and 11 percent in the comprehensive institutions. The remaining 15 percent of the students are enrolled in private institutions with 9 percent in nonprofit 4-year institutions and 4 percent in for-profit career schools. The for-profit 4-year institutions enroll 2 percent of the students and the nonprofit career
100% 100%
59%
98% 100% 98% 97%
Figure 1b: Percent Degree/Certificate-Seeking Students (2012)

ERDC Report 2014-07 June 2014
5
schools less than one-half of one percent. This enrollment pattern among all undergraduates has been relatively stable over the four years 2009 through 2012.
Data source: IPEDS Student Financial Aid Survey
Group 2: Full-Time, First-Time Degree/Certificate-Seeking Students Group 2 consists of full-time, first-time degree/certificate-seeking undergraduate students. These are students with no prior postsecondary experience that have enrolled full-time with the intent to earn a degree, certificate or other formal award. It includes students enrolled in academic and occupational programs. Students enrolled in the fall term who attended college for the first-time in the prior summer session are considered to be first-time students. Students who entered with advanced standing with college credits earned before high school graduation (i.e., Running Start students) are also considered to be first-time students.
Looking at just full-time, first-time degree/certificate-seeking students in 2012, two-thirds were enrolled in public institutions (see Figure 3 and Table 3 in Appendix B). Some 28 percent were enrolled in the community and technical colleges and one-quarter were enrolled in the public research universities. The public comprehensive institutions enrolled another 14 percent of the new full-time students. The for-profit career schools enrolled 16 percent of the new students and the nonprofit 4-year institutions enrolled another 15 percent. The nonprofit career schools and for-profit 4-year schools had tiny slivers of 1 percent each.
Group 2 students as a share of Group 1 students varies by sector depending on program lengths and other factors (see Figure 4 and Table 4 in Appendix B). It should be expected that schools with shorter program lengths enroll a greater share of first-time students than institutions with 4-year programs. One-third to three-fifths of the students at the career schools are first-time students seeking a certificate that takes less than
For-profit Career Schools 15,273
4%
Nonprofit Career Schools 1,061
0%
Community & Technical Colleges
197,064 57%
Nonprofit 4-Years 29,987
9%
For-profit 4-Years 6,422
2%
Public Comprehensives
39,941 11%
Public Research 58,825
17%
Figure 2: Undergraduate Enrollment by Sector (2012)

ERDC Report 2014-07 June 2014
6
two years to earn. At the public and nonprofit 4-year institutions the share of first-time students is much lower, 15 to 21 percent, as the program length is longer with a greater portion of continuing students.
Data source: IPEDS Student Financial Aid Survey
The enrollment pattern at the community and technical colleges is completely different from the other sectors. As noted earlier the community and technical colleges have far a greater share of part-time students and far a greater share of non-degree/certificate-seeking students. Thus the share of Group 2 students at the community and technical colleges is relatively low even with shorter program lengths.
For-profit Career Schools 6,729 16%
Nonprofit Career Schools
350 1% Community &
Technical Colleges 12,259
28%
Nonprofit 4-Years 6,274 15%
For-profit 4-Years 546 1%
Public Comprehensives
6,047 14%
Public Research 10,843
25%
Figure 3: Full-Time, First-Time Degree/Certificate-Seeking Students (2012)

ERDC Report 2014-07 June 2014
7
Data source: IPEDS Student Financial Aid Survey
2. LOW-INCOME STUDENTS
The institutions report family income data on undergraduate students for only a limited subset of full-time, first-time degree/certificate-seeking students. Instead of using family incomes, this report looks at Pell grant recipients. The Federal Pell Grant Program provides need-based grants to financially needy (low-income) undergraduate students.
One of the requirements for a student to receive a Pell grant is to demonstrate financial need. Financial need takes into account the living situation of the student (dependent/independent, single/married), family size and family income, among other things. A calculation is made by using a formula to determine the amount that a family is able to pay toward college expenses. The result is called the Expected Family Contribution. This formula is revised and approved each year by the U.S. Congress. If the Expected Family Contribution is greater than a certain amount ($5,081 in 2013-14) than the student is not eligible for a Pell grant. If a family’s income is below a specified threshold ($24,000 in 2013-14) the student automatically qualifies for an Expected Family Contribution of zero and a Pell grant. The grant amount depends on the Expected Family Contribution, the Cost of Attendance (tuition and fees, room and board, books, and supplies) at the college, and whether the student is full-time or part-time.
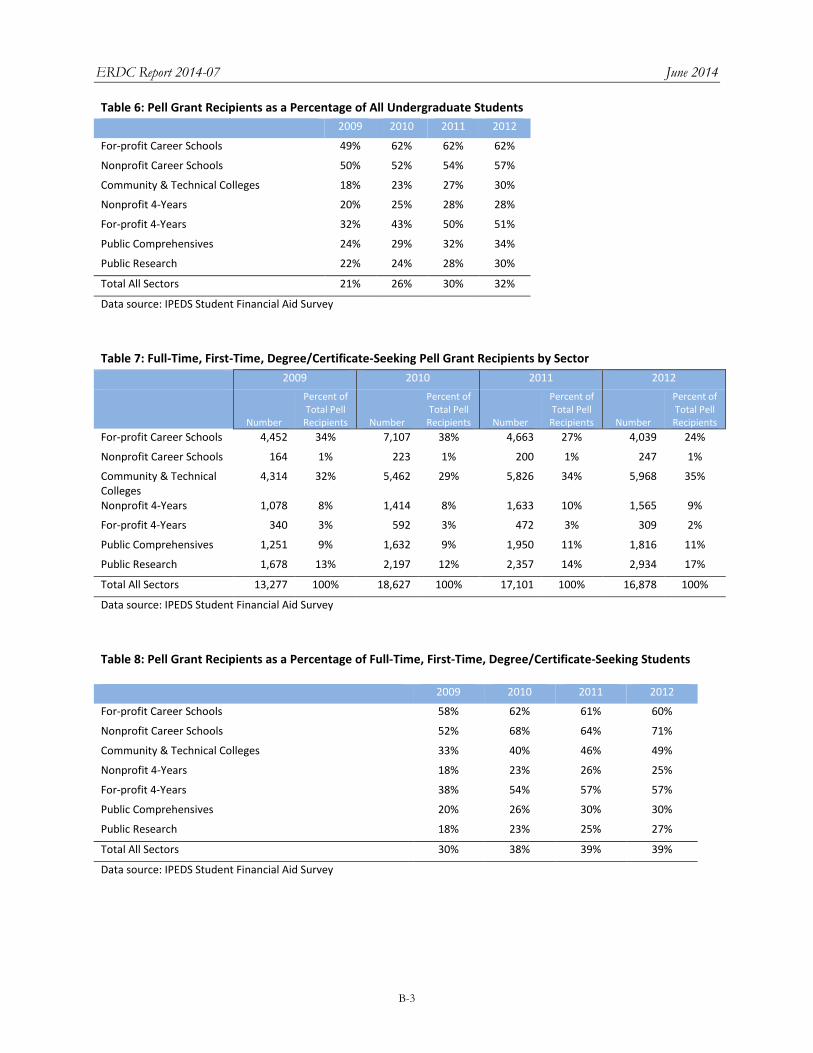
Since Congress revises the Expected Family Contribution formula every year, year-to-year changes in the number of “financially needy students” and Pell grant recipients can vary on things besides an institution’s enrollment policies. Over the study period the eligibility criteria for receiving a Pell grant has been expanded and the number of Pell grant recipients has risen rapidly. In Washington state the number of Pell grant recipients increased 56 percent from 71,000 in 2009 to 110,000 in 2012. The share of all undergraduate students that were Pell grant recipients increased from 21 percent to 32 percent. Reasons for the expanded number of students receiving Pell grants include an increase in college enrollments and Pell grant
44%
33%
6%
21%
9%
15% 18%
Figure 4: Full-Time, First-Time Degree-Seeking Students as Percenatege of All Undergraduate Students (2012)
ERDC Report 2014-07 June 2014
8
applications, the effects of a weak economy on applicant’s incomes and grant eligibility, and broader eligibility rules adopted by Congress. While the definition of “needy” may change from year-to-year, it is possible to see where “low-income” students attend college in a given year.
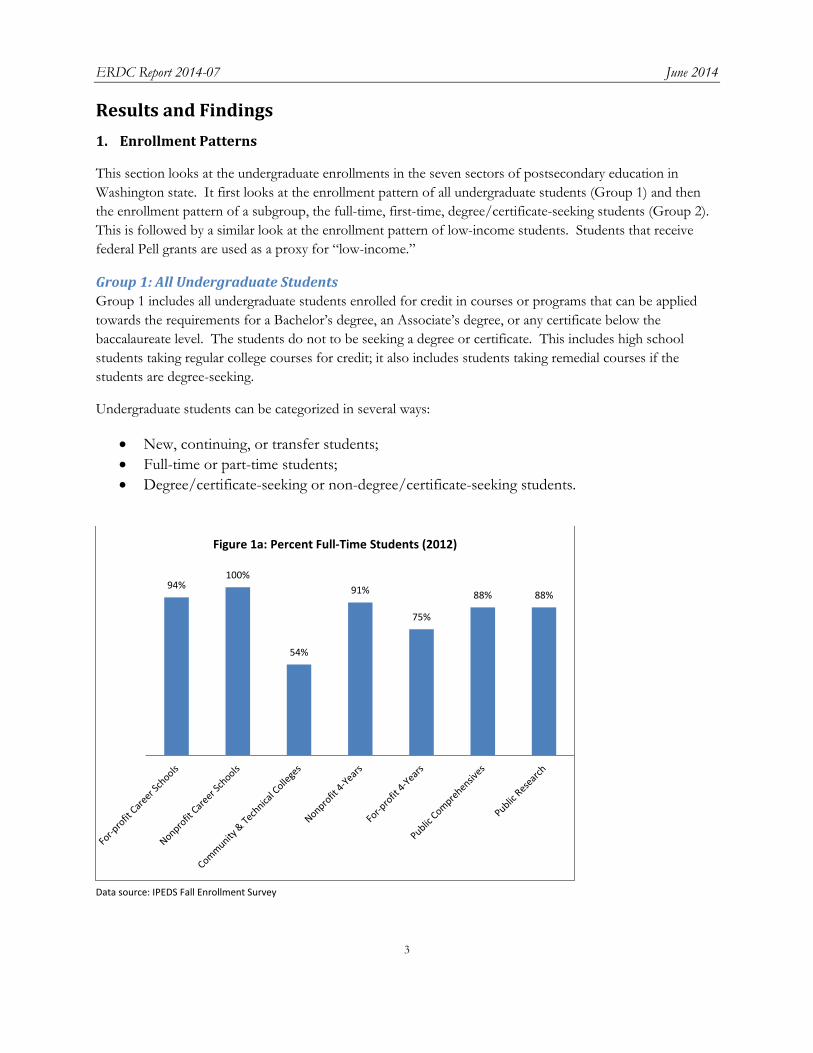
Pell Grant Recipients – All Undergraduate Students While the number of undergraduate Pell grant recipients has increased, the sector shares have remained relatively constant (see Figure 5 and Table 5 in Appendix B). Most of the low-income college students are attending public institutions. In 2012, public institutions enrolled 81 percent of Pell grant recipients with 53 percent attending community and technical colleges, 16 percent research universities, and 12 percent comprehensive institutions. For-profit career schools enrolled 8 percent of the Pell grant recipients and nonprofit 4-year institutions enrolled another 8 percent.
Data source: IPEDS Student Financial Aid Survey
Overall in 2012, Pell grant recipients made up almost one-third of all undergraduate students (see Figure 6 and Table 6 in Appendix B). They constituted more than one-half of the students at the career schools and for-profit 4-year institutions; 62 percent of the undergraduates at the for-profit career schools; 57 percent of the undergraduates at the nonprofit career schools; and 51 percent of the undergraduates at the for-profit 4-year institutions.
For-profit Career Schools 8,696
8% Nonprofit
Career Schools
656 1%
Community & Technical Colleges
58,369 53%
Nonprofit 4-Years 8,372
7%
For-profit 4-Years 3,269
3%
Public Comprehensives
13,474 12%
Public Research 17,667
16%
Figure 5: Undergraduate Pell Grant Recipients by Sector (2012)

ERDC Report 2014-07 June 2014
9
Data source: IPEDS Student Financial Aid Survey
Pell Grant Recipients – Full-Time, First-Time Degree/Certificate-Seeking Students Nearly two-thirds of the Group 2 Pell grant recipients are attending public institutions (see Figure 7 and Table 7 in Appendix B). However, the for-profit career schools enroll a sizable number of low-income students – 24 percent in 2012. The nonprofit 4-year institutions enrolled 9 percent of the Group 2 Pell grant recipients.
Data source: IPEDS Student Financial Aid Survey
Among full-time, first-time degree/certificate-seeking students nearly two out of five students were Pell grant recipients (see Figure 8 and Table 8 in Appendix B). In 2012, Pell grant recipients made up 71 percent of the
62% 57%
30% 28%
51%
34% 30%
Figure 6: Pell Grant Recipients as a Percentage of All Undergraduate Students (2012)
For-profit Career Schools 4,039 24%
Nonprofit Career Schools
247 2%
Community & Technical Colleges
5,968 35% Nonprofit 4-Years
1,565 9%
For-profit 4-Years 309 2%
Public Comprehensives
1,816 11%
Public Research
2,934 17%
Figure 7: Full-Time, First-Time Degree/Certificate-Seeking Pell Grant Recipients by Sector (2012)

ERDC Report 2014-07 June 2014
10
full-time, first-time degree/certificate-seeking students at nonprofit career schools; 60 percent at for-profit career schools; and 57 percent at for-profit 4-year institutions.
Data source: IPEDS Student Financial Aid Survey
3. Student Grant Aid
This section looks at the share of students and the average amounts of student grant aid received by the Group 1 and Group 2 students, by the sources of this grant aid.
Grant aid consists of financial assistance provided to students that does not need to be repaid by the student. These grants include need-based assistance and scholarships or merit-based assistance. Grant aid does not include work study programs, tax credits or student loans. Grant aid includes:
• Federal grants: Grants provided by federal agencies such as Pell grants, Federal Supplemental Educational Opportunity Grants, Academic Competitiveness Grants, National Science and Mathematics Access to Retain Talent Grants, and Teacher Education Assistance for College and Higher Education Grants.
• State grants: Grants and scholarships awarded by the state such as the State Need Grant, College Bound Scholarships, and the Washington Scholars program.
• Institutional grants: Grants, scholarships, fellowships and tuition waivers granted and funded by the institution (or a department within the institution).
• Other sources (known to the institution): Grants and scholarships to students that are awarded and paid by an outside organization (e.g., Rotary Club) but are directed through an institution’s financial aid office.
Group 1: All Undergraduate Students For all undergraduate students data are available only for the sum of all grant aid and Pell grants. In 2012, 46 percent of all Washington undergraduate students received some grant aid (see Figures 9a, 9b, 9c and 9d and
60% 71%
49%
25%
57%
30% 27%
Figure 8: Pell Grant Recipients as a Percentage of Full-Time, First-Time Degree/Certificate-Seeking Students

ERDC Report 2014-07 June 2014
11
Table 9 in Appendix B). This is up from 37 percent in 2009. During this time the number of Pell grant recipients increased from 21 percent of undergraduate students to 32 percent.
In 2012, the sectors ranged from 90 percent of nonprofit 4-year students receiving some form of grant aid to 35 percent of community and technical college students. Three-fifths of the students at for-profit career schools received some grant aid and about half the students at the public 4-year institutions received grant aid.
The average amount of grant aid increased 14 percent (after adjusting for inflation) from $7,500 in 2009 to $8,550 in 2012. At the nonprofit 4-year institutions the average amount of grant increased 22 percent. For the public institutions average grant aid increased 23 percent at the community and technical colleges, 18 percent at the research universities, and 11 percent at the comprehensive institutions. Average grant aid declined 11 percent at the for-profit career schools.
In 2012 the average amount of grant aid ranged from $17,600 at the non-profit 4-years to $4,000 at the for-profit 4-years. For the 50 percent of undergraduate students receiving grant aid at the research universities the average amount of aid was $10,500. At the public comprehensives the average grant aid package was $7,200 and at the for-profit career schools it was $4,600.
Data source: IPEDS Student Financial Aid Survey
37% 38%
43%
46%
2009 2010 2011 2012
Figure 9a: Percent of Undergraduates Receiving Grant Aid

ERDC Report 2014-07 June 2014
12
Data source: IPEDS Student Financial Aid Survey
Data source: IPEDS Student Financial Aid Survey Note: Dollar figures are expressed in constant 2012 dollars.
60%
75%
35%
90%
71%
52% 50%
Figure 9b: Share of Undergraduate Students Receiving Grant Aid (2012)
$7,482 $7,935
$8,263 $8,550
2009 2010 2011 2012
Figure 9c: Average Amount Grant Aid per Undergraduate Student

ERDC Report 2014-07 June 2014
13
Data source: IPEDS Student Financial Aid Survey Note: Dollar figures are expressed in constant 2012 dollars.
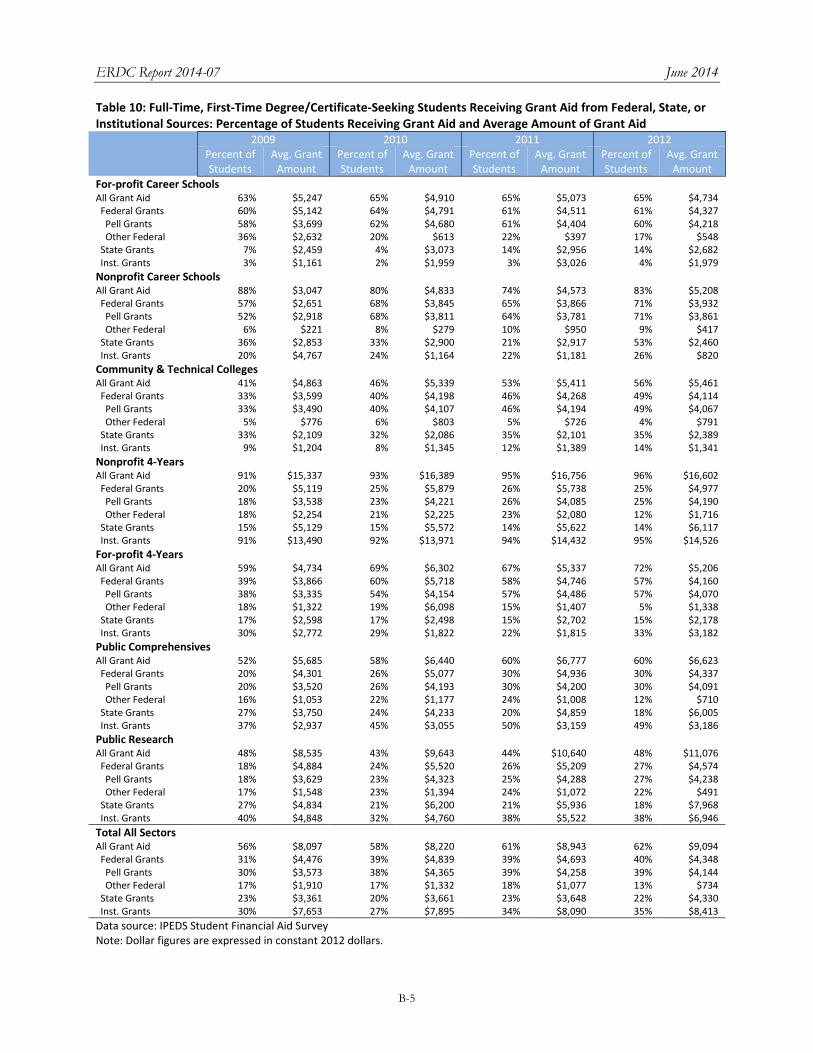
Group 2: Full-Time, First-Time Degree/Certificate-Seeking Students More detail on the sources of grant aid is available for full-time, first-time degree/certificate-seeking students.2 In 2012, 62 percent of Group 2 students received some form of grant aid (see Figures 10a, 10b, 10c and 10d and Table 10 in Appendix B).3 The percentage of students receiving grant aid has increased from 2009 when 56 percent of the full-time, first-time degree/certificate-seeking students received grant aid. During this time the number of Group 2 students receiving Pell grants increased from 30 percent students to 39 percent. Institutional grants went to 30 percent of the students in 2009 and 35 percent in 2012. The share of students receiving state grants stayed relatively constant at 20 to 23 percent of the students.
2 It, however, does not include grant aid from private or other sources. 3 Note that the total number of students and the average amount of all grant aid does not equal the sum of the individual sources of aid. Not all grant-receiving students receive grants from all sources. The average grant by source is calculated from only those students receiving a grant from that source.
$4,635 $6,358
$5,388
$17,646
$3,991
$7,243
$10,451
Figure 9d: Average Amount of Grant Aid per Undergraduate Student (2012)
Note: 2012 dollars

ERDC Report 2014-07 June 2014
14
Data source: IPEDS Student Financial Aid Survey
By sector, the percentage of Group 2 students receiving grant aid ranged from 96 percent at the nonprofit 4-year institutions to 48 percent at the public research universities. Sixty-five percent of the full-time, first-time certificate-seeking students at the for-profit career schools received grant aid in 2012. At the other public institutions, 60 percent of Group 2 students received grant aid and 56 percent of community and technical college students received aid.
56% 58%
61% 62%
2009 2010 2011 2012
Figure 10a: Percent of Full-Time, First-Time Degree/Certificate-Seeking Students Receiving Grant Aid

ERDC Report 2014-07 June 2014
15
Data source: IPEDS Student Financial Aid Survey
The average amount of grant aid for students receiving assistance increased 12 percent to an average amount of $9,100 in 2012. The average amount of grant aid was $8,100 in 2009. The average Pell grant increased from $3,600 to $4,100. The average per student amount of institutional grants increased from $7,700 to $8,400 while the average state grant increased from $3,400 to $4,300.
Data source: IPEDS Student Financial Aid Survey Note: Dollar figures are expressed in constant 2012 dollars.
65%
83%
56%
96%
72%
60%
48%
Figure 10b: Percent of Full-Time, First-Time Degree/Certificate-Seeking Students Receiving Grant Aid
$8,097 $8,220
$8,943 $9,094
2009 2010 2011 2012
Figure 10c: Average Amount of Grant Aid per Full-Time, First-Time Degree/Certificate-Seeking Student

ERDC Report 2014-07 June 2014
16
Data source: IPEDS Student Financial Aid Survey Note: Dollar figures are expressed in constant 2012 dollars.
By sector the amount of grant aid in 2012 ranged from $16,600 at the nonprofit 4-year institutions in 2012 to $4,700 at the for-profit career schools. For public institutions the average amount of grant aid ranged from $11,100 at the research universities, $6,600 at the comprehensives, and $5,500 at the community and technical colleges.
As noted above, nonprofit 4-year institutions provided the largest amount of grant aid to the largest share of full-time, first-time degree-seeking students. Ninety-six percent of these students are receiving grant aid – most of it in the form of institutional aid such as scholarships, tuition waivers or discounts. The average amount of aid increased from $15,300 in 2009 to $16,600 in 2012; institutional aid increased from $13,500 to $14,500.
The public research universities provide nearly one-half of the Group 2 students with grant aid, primarily from institutional sources. In 2012, 48 percent of the students received an average $11,100 in grant aid with 38 percent receiving an average of $7,000 in institutional aid. Pell grant recipients increased from 18 to 27 percent of the students while state grant recipients fell from 27 to 18 percent of the students.
Grant aid in 2012 to full-time, first-time degree-seeking students at the public comprehensive institutions went to 60 percent of the students for an average amount of $6,600. The share of Group 2 students receiving Pell grants increased from 20 to 30 percent and the amount of grant increased from $3,500 to $4,100. The share of students receiving state grants declined from 27 to 18 percent, however, the average grant increased from $3,750 to $6,000. The share of students receiving institutional grants increased from 37 to 49 percent and the grant amount increased from $2,900 to $3,200.
$4,734 $5,208 $5,461
$16,602
$5,206 $6,623
$11,076
Figure 10d: Average Amount Grant Aid per Full-Time, First-Time Degree/Certificate-Seeking Student (2012)
Note: 2012 dollars
ERDC Report 2014-07 June 2014
17
At the community and technical colleges 56 percent of the students received some grant aid in 2012, up from 41 percent in 2009. Again, it appears the increase is due to Pell grants with recipients going from 33 percent of the students to 49 percent. The share of state grants receiving state grants stayed relatively the same at 33 to 35 percent. The share of students receiving institutional grants went from 9 to 14 percent. The average amount of all grants increased from $4,900 to $5,500. The average Pell grant went from $3,500 to $4,100.
Sixty-five percent of the full-time, first-time degree/certificate-seeking students at the for-profit career schools received grant aid in 2012, with an average amount of $4,700. Most of the aid came as Pell grants with 60 percent of the students receiving one with an average amount of $4,200. State grants, averaging $2,700, were given to 14 percent of the students. Institutional grants were few, going to just 4 percent of the students and averaging $2,000.
4. Student Loan Aid
This section looks at the share of students and the average amounts of student loan aid received by the Group 1 and Group 2 students, by the sources of this loan aid. It also looks at default rates on federal student loans by sector.
Information on student loans is limited to the loans of which the institution has knowledge and where the student is the designated borrower. It includes federal subsidized and unsubsidized loans and all institutionally- and privately-sponsored loans. It does not include loans made directly to parents. Nor does it include debt taken on by the student outside of the institution such credit cards or second mortgages. Student loan programs include:
• Federal Perkins Loans – a long-term, low interest loan based on financial need, that must be repaid. • Federal Direct Stafford Loans – includes subsidized loans based on financial need with the federal
government paying interest while the student is in school, after which the loan must be repaid; and unsubsidized loans available to students without financial need with the borrowers paying interst while in school, after which the loan must be repaid.
• Private loans – loans made to students by private banks and lenders, of which the institution is aware.
Federal Direct PLUS loans made to parents of dependent undergraduate students and to students in graduate and professional programs are not included in this analysis.
Group 1: All Undergraduate Students Over all the sectors, federal loans were taken out by 32 percent of undergraduate students in 2012 (see Figures 11a, 11b, 11c and 11d and Table 11 in Appendix B). This is up from 26 percent in 2009. Growth in the percentage of students receiving federal loans occurred at the public institutions share of community and technical college students receiving federal loans increased from 10 percent to 16 percent; comprehensive institution students from 46 percent to 52; and public research university students from 39 to 42 percent. At the nonprofit 4-year institutions the percent of students receiving federal loans increased to 62 percent from 58 percent. The percentage of students at the for-profit career schools taking out federal loans declined from 71 percent in 2009 to 66 percent in 2012.

ERDC Report 2014-07 June 2014
18
Data source: IPEDS Student Financial Aid Survey
Data source: IPEDS Student Financial Aid Survey
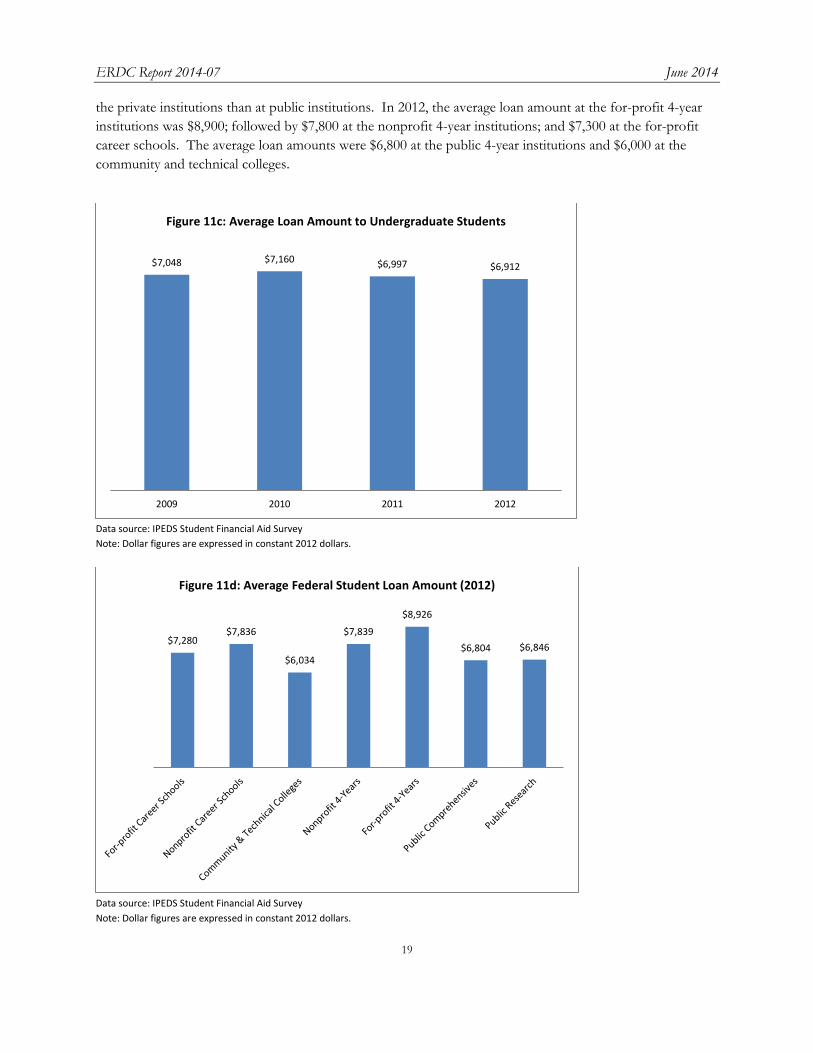
The average loan amount for students receiving loans in 2012 was for $6,900. After adjusting for inflation this almost the same amount as in 2009 when the average was $7,000. Average loan amounts were higher at
26% 28%
29%
32%
2009 2010 2011 2012
Figure 11a: Percent of Undergraduate Students Receiving Federal Student Loans
66%
79%
16%
62%
72%
52%
42%
Figure 11b: Percent of Undergraduate Students Receiving Federal Student Loans (2012)
ERDC Report 2014-07 June 2014
19
the private institutions than at public institutions. In 2012, the average loan amount at the for-profit 4-year institutions was $8,900; followed by $7,800 at the nonprofit 4-year institutions; and $7,300 at the for-profit career schools. The average loan amounts were $6,800 at the public 4-year institutions and $6,000 at the community and technical colleges.
Data source: IPEDS Student Financial Aid Survey Note: Dollar figures are expressed in constant 2012 dollars.
Data source: IPEDS Student Financial Aid Survey Note: Dollar figures are expressed in constant 2012 dollars.
$7,048 $7,160 $6,997 $6,912
2009 2010 2011 2012
Figure 11c: Average Loan Amount to Undergraduate Students
$7,280 $7,836
$6,034
$7,839
$8,926
$6,804 $6,846
Figure 11d: Average Federal Student Loan Amount (2012)
ERDC Report 2014-07 June 2014
20
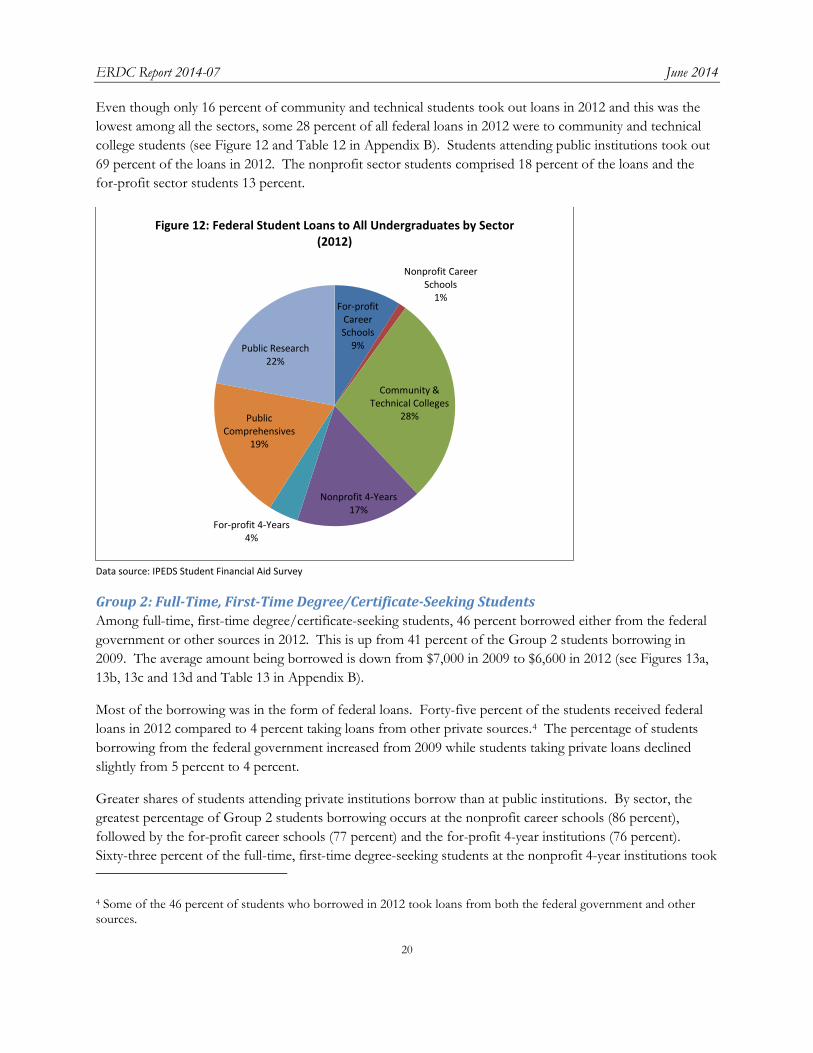
Even though only 16 percent of community and technical students took out loans in 2012 and this was the lowest among all the sectors, some 28 percent of all federal loans in 2012 were to community and technical college students (see Figure 12 and Table 12 in Appendix B). Students attending public institutions took out 69 percent of the loans in 2012. The nonprofit sector students comprised 18 percent of the loans and the for-profit sector students 13 percent.
Data source: IPEDS Student Financial Aid Survey
Group 2: Full-Time, First-Time Degree/Certificate-Seeking Students Among full-time, first-time degree/certificate-seeking students, 46 percent borrowed either from the federal government or other sources in 2012. This is up from 41 percent of the Group 2 students borrowing in 2009. The average amount being borrowed is down from $7,000 in 2009 to $6,600 in 2012 (see Figures 13a, 13b, 13c and 13d and Table 13 in Appendix B).
Most of the borrowing was in the form of federal loans. Forty-five percent of the students received federal loans in 2012 compared to 4 percent taking loans from other private sources.4 The percentage of students borrowing from the federal government increased from 2009 while students taking private loans declined slightly from 5 percent to 4 percent.
Greater shares of students attending private institutions borrow than at public institutions. By sector, the greatest percentage of Group 2 students borrowing occurs at the nonprofit career schools (86 percent), followed by the for-profit career schools (77 percent) and the for-profit 4-year institutions (76 percent). Sixty-three percent of the full-time, first-time degree-seeking students at the nonprofit 4-year institutions took
4 Some of the 46 percent of students who borrowed in 2012 took loans from both the federal government and other sources.
For-profit Career Schools
9%
Nonprofit Career Schools
1%
Community & Technical Colleges
28%
Nonprofit 4-Years 17%
For-profit 4-Years 4%
Public Comprehensives
19%
Public Research 22%
Figure 12: Federal Student Loans to All Undergraduates by Sector (2012)

ERDC Report 2014-07 June 2014
21
out loans in 2012. At the public institutions 54 percent of the Group 2 attending comprehensive institutions borrowed in 2012; followed by students attending the public research universities (41 percent). Only 19 percent of the Group 2 community and technical college students received student loan assistance in 2012.
Data source: IPEDS Student Financial Aid Survey
Data source: IPEDS Student Financial Aid Survey
41%
47% 45% 45%
5% 4% 3% 4%
2009 2010 2011 2012
Figure 13a: Percent of Full-Time, First-Time Degree/Certificate-Seeking Students Receiving Fedaral or Other Loans
Federal Loans
Other Loans
77% 86%
19%
63%
76%
54%
41%
Figure 13b: Percent of Full-Time, First-Time Degree/Certificate-Seeking Students Receiving Student Loans, All Sources (2012)

ERDC Report 2014-07 June 2014
22
While loans from private sources were not nearly as popular as loans from the federal government, the average amount borrowed by students using these loans surpassed the average amount of federal student loans. The average loan from other sources was $8,000 in 2012, up from $7,000 in 2009. The average federal student loan in 2012 was $6,000, down from $6,200 in 2009.
Data source: IPEDS Student Financial Aid Survey Note: Dollar figures are expressed in constant 2012 dollars.
By sector, again the greatest amount of borrowing is being done by students attending private institutions. The average loan amount at the for-profit 4-year institutions in 2012 was $9,600; at the for-profit career schools the average loan amount was $8,000; and at the nonprofit 4-year institutions it was $6,900. Among the students attending the public research universities who borrowed, the average amount was $5,900. At the public comprehensive institutions the average loan amount was $5,700. Community and technical college students borrowed the least with average loan of $5,000.
About three-fourths of the students at the for-profit career schools borrowed at an average of $8,000 per year. This has remained fairly steady over the four years 2009 to 2012. Most of these students are receiving federal student loans with the amount increasing from $6,800 in 2009 to $7,500 in 2012. In addition, 11 percent of the students are taking another $4,300 in other loans.
The percentage of full-time, first-time degree-seeking students attending nonprofit 4-year institutions receiving student loans has been increasing, from 56 percent in 2009 to 63 percent in 2012. The average loan amount, however, has declined, from $7,600 to $6,900. Within this group are 6 percent of the students receiving $10,800 in student loans from other sources.
$6,160
$6,582 $6,254
$6,020
$7,019
$7,467
$8,286 $8,033
2009 2010 2011 2012
Figure 13c: Average Aount of Student Loans to Full-Time, First-Time Degree/Certificate-Seeking Students
Federal Loans
Other Loans

ERDC Report 2014-07 June 2014
23
At the public sector schools the borrowing trend with respect to the percentage of students receiving loans has been increasing while the trend in the amount of loans has been mixed. The share of Group 2 students at the public research universities receiving student loans has increased from 35 percent to 41 percent in the four years from 2009 to 2012. The average amount of the loans has declined from $7,200 to $5,900. However, 2 percent of the students did borrow an average $13,500 from sources other than the federal government. Public comprehensive institution students increased their borrowing from 46 percent to 54 percent with the average loan increasing from $5,100 to $5,700. At the community and technical colleges the percentage of students borrowing went from 13 percent in 2009 to 19 percent in 2012 with the average loan amount increasing from $4,600 to $5,000.
Data source: IPEDS Student Financial Aid Survey Note: Dollar figures are expressed in constant 2012 dollars.
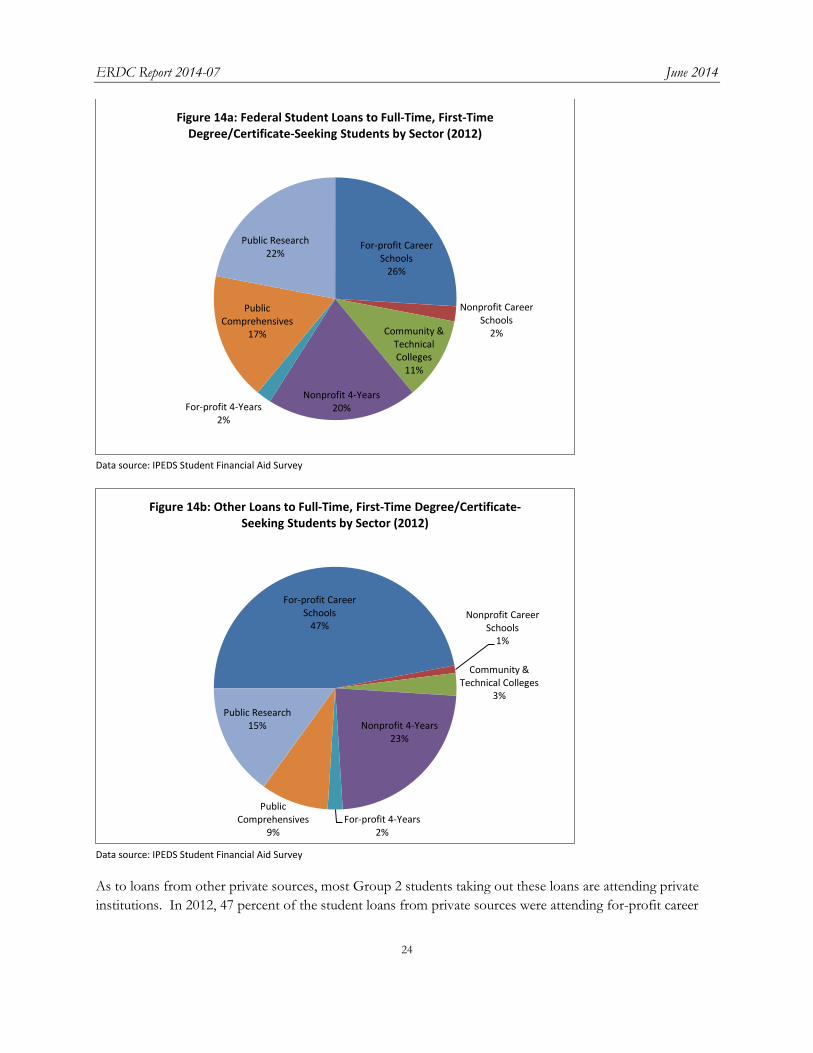
Among the sectors, federal student loans to Group 2 students are spread around with about half going to students at public institutions and the other half to students at private institutions (see Figures 14a and 14b and Table 14 in Appendix B). Public research university Group 2 students accounted for 22 percent of the loans in 2012 followed by the public comprehensive institutions with 17 percent and the community and technical colleges at 11 percent. Students attending for-profit career schools accounted for 26 percent of the loans and students at the nonprofit 4-year institutions made up 20 percent of the federal loans.
$8,046
$6,708
$5,000
$6,874
$9,561
$5,712 $5,920
Figure 13d: Average Aount All Loans Full-Time, First-Time Degree/Certificate-Seeking Students
ERDC Report 2014-07 June 2014
24
Data source: IPEDS Student Financial Aid Survey
Data source: IPEDS Student Financial Aid Survey
As to loans from other private sources, most Group 2 students taking out these loans are attending private institutions. In 2012, 47 percent of the student loans from private sources were attending for-profit career
For-profit Career Schools
26%
Nonprofit Career Schools
2% Community & Technical Colleges
11%
Nonprofit 4-Years 20% For-profit 4-Years
2%
Public Comprehensives
17%
Public Research 22%
Figure 14a: Federal Student Loans to Full-Time, First-Time Degree/Certificate-Seeking Students by Sector (2012)
For-profit Career Schools
47% Nonprofit Career
Schools 1%
Community & Technical Colleges
3%
Nonprofit 4-Years 23%
For-profit 4-Years 2%
Public Comprehensives
9%
Public Research 15%
Figure 14b: Other Loans to Full-Time, First-Time Degree/Certificate-Seeking Students by Sector (2012)

ERDC Report 2014-07 June 2014
25
schools with another 23 percent attending nonprofit 4-year institutions. Altogether the public institutions accounted for 27 of the other loans.
Student Defaults on Federal Loans Defaulting on federal student loans is a national issue. The “cohort default rate” measures the share of federal loan borrowers who default within a specified period of time after entering repayment. The 2010 three-year cohort default rate is for borrowers who entered repayment in 2010 and defaulted in 2010, 2011 or 2012. A student defaults on a federal loan after at least nine months of non-payment.
For Washington institutions the average 2010 3-year cohort default rate was 12 percent – 12 percent of the student borrowers who were to begin repayments of their federal student loans in 2010 missed at least nine month of payments during 2010 to 2012 (see charts 15a and 15b and Table 15 in Appendix B). By sector the higher default rates are in the for-profit 4-year institutions (22 percent), for-profit career schools (19 percent) and the community and technical colleges (19 percent). Lower default rates are found in the nonprofit 4-year institutions (5 percent), public research universities (5 percent) and the public comprehensive institutions (7 percent).
The community and technical colleges provided loans to 46 percent of the defaulters and the for-profit career schools provided loans to 20 percent of the defaulters.
Data source: Federal Student Aid, U.S. Department of Education
19%
15%
19%
5%
22%
7% 5%
Figure 15a: 3-Year Federal Student Loan Default Rates

ERDC Report 2014-07 June 2014
26
Data source: Federal Student Aid, U.S. Department of Education
5. Net Price
This section looks at the cost of attendance and net price after factoring in student grant aid to full-time, first-time degree/certificate-seeking students. It also looks at the amount of grant aid as a share of the cost of attendance.
The net price of attending a postsecondary institution is calculated by subtracting the average amount of federal, state and institutional grant and scholarship aid from the total cost of attendance. The total cost of attendance is the sum of published tuition and required fees (in-state tuition for public institutions), books and supplies, and the weighted average for room and board and other expenses. The average room and board and other expenses are based on the living arrangements of full-time, first-time students at each institution.5
5 The institutions report to IPEDS the estimated room and board expenses and other expenses for full-time, first-time undergraduate students for three living arrangements: (1) on-campus, (2) off-campus (not with family), and (3) off-campus (with family). They also report the number of full-time, first-time students utilizing each of these living arrangements. The institutional or sector weights for determining room and board and other expenses are based on where a majority of these students reside. Room and board and other expenses at for-profit career schools, for-profit 4-year institutions, nonprofit career schools, and four of the nonprofit 4-year institutions are weighted 100 percent to living off-campus (not with family). These expenses at the comprehensive institutions, UW-Seattle, WSU (all campuses), and 12 of the nonprofit 4-year institutions are weighted 100 percent to living on-campus. At the community and
For-profit Career Schools
20% Nonprofit Career Schools
1%
Community & Technical Colleges
46%
Nonprofit 4-Years 8%
For-profit 4-Years 9%
Public Comprehensives
9% Public
Research 8%
Figure 15b: Federal Student Loan 3-Year Defaults by Sector

ERDC Report 2014-07 June 2014
27
Cost of Attendance The annual cost of attendance in 2012 ranged from $12,300 at the community and technical colleges to $54,500 per year at nonprofit career schools (see Figure 16 and Table 16 in Appendix B).6 The cost of attendance at the comprehensive institutions was $20,500 in 2012 and it was $24,100 at the research universities. The private nonprofit 4-year institutions had a cost of attendance of $44,600.
Tuition and fees are a significant portion of the cost, ranging from $3,600 at the community and technical colleges to $31,800 at the nonprofit 4-year institutions. Room and board is the next major expense averaging about $8,000 per year. Books on average add another $1,000 per year and other expenses add $3,000.
Data source: IPEDS Institutional Characteristics Survey Note: Dollar figures are expressed in constant 2012 dollars.
technical colleges and the UW branch campuses the weight is 50 percent off-campus (not with family) and 50 percent off-campus (with family). 6 The nonprofit career school sector is comprised of four schools, one of which has 87% of the full-time, first-time certificate-seeking enrollment. This institute in Yakima reports to IPEDS that off-campus room and board expenses are $26,438 per year. This amount is more than double the room and board expenses in any other sector.
$29,377
$54,510
$12,308
$44,644
$32,293
$20,524 $24,078
Figure 16: Cost of Attendance for Full-Time, Fisrt-Time Undergraduate Students

ERDC Report 2014-07 June 2014
28
Net Price The average amount of grants received by full-time, first-time degree/certificate seeking students is deducted from the cost of attendance to arrive at the net price.
For example, at the nonprofit 4-year institutions the cost of attendance in 2012 was $44,600 (see Figure 16). However, 96 percent of the Group 2 students received an average of $16,600 in grant aid (see Figures 10b and 10d). The net price to these students in 2012 was $28,000 (see Figure 17 and Table 17 in Appendix B). The net price at the nonprofit 4-year institutions increased $1,600, or 6 percent, from 2009 to 2012.
At the public research universities the net price was $13,000 in 2012, an increase of 9 percent or $1,000 from 2009. During this time the cost of attendance increased 17 percent to $24,100. However, the average grant amount increased 30 percent to $11,100 for the 48 percent of the students receiving grants. .
The net price at the comprehensive institutions in 2012 was $13,900. This was an increase of $1,500 or 12 percent over 2009. This sector experienced a 14 percent increase in the cost of attendance rising to $20,500 in 2012. At these institutions 60 percent of the students received grants averaging $6,600. The average grant amount has increased by 16 percent from 2009.
The net price at the community and technical colleges in 2012 was $6,800; an increase of $245 or 4 percent over 2009. During this time the cost of attendance increased 7 percent to $12,300. Fifty-six percent of full-time, first-time degree/certificate-seeking students received grant assistance averaging $5,500, up 12 percent from 2009.
Data source: IPEDS Student Financial Aid and Institutional Characteristics Surveys Note: Dollar figures are expressed in constant 2012 dollars.
$24,642
$49,303
$6,847
$28,042 $27,088
$13,902 $13,002
65%
83%
56%
96%
72%
60%
48%
0%
25%
50%
75%
100%
$0
$10,000
$20,000
$30,000
$40,000
$50,000
Figure 17: Average Net Price for Students Receiving Grant Aid and Percentage of Students Receiving Grant Aid

ERDC Report 2014-07 June 2014
29
The net price at the for-profit career schools to the 65 percent of students receiving grant aid increased $3,400 or 16 percent to $24,600 in 2012. The for-profit career schools saw an increase of 11 percent in the cost of attendance to $29,400 in 2012, up from $26,500 in 2009. During this time the average grant amount to full-time, first-time students declined 10 percent to $4,700 (due to a sharp drop in “other federal grants”).
Grant Aid Compared to the Cost of Attendance With the exception of the for-profit career schools, grant aid as a percentage of the cost of attendance has either been holding steady or increasing. At the for-profit career schools total grant aid relative to the cost of attendance has been declining (see Figure 18 and Table 18 in Appendix B).
Grant aid as a share of the cost of attendance has been increasing at the public research universities, driven by increases in state grants and institutional grants. Total grant aid went from 42 percent of the cost of attendance to 46 percent. State grant aid went from 24 percent to 33 percent and institutional grants from 24 percent to 29 percent. During this time the average Pell grant remained at 18 percent of the cost of attendance.
At the comprehensive institutions, grant aid remained relatively stable at about 32 percent of the cost of attendance. From 2009 to 2012 state grant increased from 21 to 29 percent of the cost of attendance but the average Pell grant and institutional grants remained constant.
Grants as a percent of the cost of attendance also remained steady at the community and technical colleges at around 44 percent. The average Pell grant increased some from 30 to 33 percent of the cost of attendance while the average state grant and institutional grants remained relatively flat.
Data source: IPEDS Student Financial Aid and Institutional Characteristics Surveys
20%
5%
42% 37%
15%
31%
42%
16%
10%
44%
37%
16%
32%
46%
Figure 18: Grant Aid to Full-Time, First-Time Degree/Certificate-Seeking Students as a Share of the Cost of Attendance
2009 - 2012
2009
2010
2011
2012

ERDC Report 2014-07 June 2014
30
Overall grant aid at the nonprofit 4-year institutions also stayed flat at 37 percent of the cost of attendance. State grants increased slightly from 12 to 14 while the average Pell grant held at 9 percent and institutional grants at 33 percent.
Average grants at the for-profit career schools fell from 20 percent to 16 percent of the cost of attendance. While institutional grants increased, the other major sources – Pell grants and state grants – remained constant. Other federal grants declined from 10 percent to 2 percent of the cost of instruction.
6. Completions
This section looks at the number of undergraduate degrees and certificates earned by students attending Washington institutions of higher education. It also compares these completions to the amount of instructional activity (as measured by undergraduate full-time equivalent students) that takes place in each of the sectors.
In 2012 students at Washington state institutions of higher education earned 32,200 Bachelor’s degrees, 29,000 Associate’s degrees, 11,300 long-term certificates (requiring one to four years of study), and 17,800 short-term certificates (requiring less than one year of study) (see Figure 19, Tables 19a and 19b and Table 19 in Appendix B).7 The Bachelor’s degrees were primarily earned at the public and private 4-year institutions. The Associate’s degrees and the long-term and short-term certificates were primarily earned at the community and technical colleges and the career schools.
Data source: IPEDS Completions Survey
7 According to IPEDS data the actual total of Bachelor’s degrees earned from Washington based postsecondary institutions in 2012 was 32,376. Two institutions that awarded Bachelor’s degrees are not included in this study. All institutions that awarded Associate’s degrees and short- and long-term certificates in 2012 are included.
Short-term Certificates
17,762
Long-term Certificates
11,255
Associate's Degrees 28,977
Bachelor's Degrees 32,212
Figure 19: Total Awards Earned by Students (2012)

ERDC Report 2014-07 June 2014
31
Over the study period 2009 through 2012, the mix of awards earned at the community and technical colleges has been 56 percent Associate’s degrees, 12 percent long-term certificates, and 32 percent short-term certificates. There has been tremendous growth in the number of awards earned at the community and technical colleges during this period. The number of short-term certificates awarded at the community and technical colleges grew 53 percent from 2009 to 2012 while the number of long-term certificates and Associate’s degrees each increased by 32 percent. Over all the sectors, students at the community and technical colleges earned 96 percent of the Associate’s degrees awarded in the state; 55 percent of the long-term certificates; and 82 percent of the short-term certificates.
The mix of completions at the for-profit career schools has been 55 percent long-term certificates, 42 percent short-term certificates, and 4 percent Associate’s degrees. From 2009 to 2012 students at the for-profit career schools earned 41 percent of the long-term certificates awarded in Washington state and 17 percent of the short-term certificates. The number of long-term certificates awarded by the for-profit career schools increased by 193 percent during this time while the number of short-term certificates awarded declined by 36 percent. During this time one chain of for-profit career schools switched from primarily awarding short-term certificates to long-term certificates.
The undergraduate awards provided by 4-year institutions are almost entirely Bachelor’s degrees. Nearly 100 percent of the undergraduate awards at the research universities are Bachelor’s degrees, 99 percent at the comprehensive institutions, and 98 percent at the nonprofit 4-year institutions. The relatively few awards at the for-profit 4-year institutions were split 56 percent Bachelor’s degrees (3 percent of all Bachelor’s degrees awarded) and 41 percent Associate’s degrees (2 percent of all Associate’s degrees awarded).
The public research universities provided 46 percent of the Bachelor’s degrees earned from 2009 to 2012. The public comprehensive institution’s share was 28 percent and the nonprofit 4-year institutions provided 22 percent. The sector shares of Bachelor’s degrees earned have been relatively stable over the four study years with slightly more growth occurring at the research universities than at the comprehensive institutions followed by the private nonprofit 4-year institutions.
Table 19a: Completions by Sector by Type of Award (2009-2012) Short-term
Certificates Long-term
Certificates Associate's
Degrees Bachelor's
Degrees Total Awards For-profit Career Schools 42% 55% 4% 100% Nonprofit Career Schools 1% 94% 5% 100% Community & Technical Colleges 32% 12% 56% * 100% Nonprofit 4-Years * 1% 1% 98% 100% For-profit 4-Years 2% 2% 41% 56% 100% Public Comprehensives 1% 99% 100% Public Research * * 100% 100% Total All Sectors 20% 11% 31% 38% 100% * Less than 0.5 percent Data source: IPEDS Completions Survey

ERDC Report 2014-07 June 2014
32
Table 19b: Completions by Type of Award by Sector (2009-2012) Short-term
Certificates Long-term
Certificates Associate's
Degrees Bachelor's
Degrees Total Awards For-profit Career Schools 17% 41% 1% 8% Nonprofit Career Schools * 3% * * Community & Technical Colleges 82% 55% 96% * 52% Nonprofit 4-Years * 1% * 22% 9% For-profit 4-Years * * 2% 3% 2% Public Comprehensives * 28% 11% Public Research * * 46% 17% Total All Sectors 100% 100% 100% 100% 100% * Less than 0.5 percent Data source: IPEDS Completions Survey
Performance Trying to gauge productivity at higher education institutions and the likelihood of students successfully completing a program with a single indicator is problematic. This is truer at the community and technical colleges and the career schools where the awards are a mixture requiring different lengths of study. This is unlike the 4-year institutions where the principal award, a Bachelor’s degree, requires for the most part four years’ worth of credits. Also, at the community and technical colleges a “success” may not even be measured by an award – it could mean a transfer to a 4-year institution. This highlights a problem with cohort graduation rates – the exclusion of transfer students. Transfer students have become quite common as students swirl from one institution to another.
An earlier ERDC report utilizing metrics developed by the Delta Cost Project looked at degrees and completions as a factor of instructional activity (as measured by full-time equivalent (FTE) students) taking place at an institution.8 That report looked at both undergraduate and graduate completions and instructional activity for single years (2002 and 2012). This report looks at undergraduate completions and instructional activity for four years combined, 2009 through 2012.
For a 4-year Bachelor’s degree program, if all students completed on time, there were no dropouts or transfers, and the levels (e.g., freshmen, sophomores, etc.) were evenly distributed, the ratio would be 25 graduates per 100 FTE students. Every year one-quarter of the students would graduate. Students dropping out before completion would lower the rate; transfer students bringing credits with them would increase the rate. For a 2-year Associate’s degree program the “perfect” score would be 50 completions per 100 FTE students.
Among Bachelor’s degree programs, the research universities produce 26 Bachelor’s degrees per 100 FTE students (see Table 20). Transfer students entering as sophomores and juniors are more than offsetting the students who dropout and the lingering students who earn more credits than necessary to graduate. The nonprofit 4-year institutions produce 24 Bachelor’s degrees per 100 FTE students and the public comprehensive institutions 23 Bachelor’s degrees. Completions at the for-profit 4-year institutions are a
8 “Report on Higher Education Financials: Utilizing Metrics Developed by the Delta Cost Project,” ERDC Brief 2014-06, Education Research and Data Center, April 2014.

ERDC Report 2014-07 June 2014
33
mixture of Associate’s and Bachelor’s degrees, which on average should take less than four years of instructional activity to complete. The four year average ratio at the for-profit 4-year institutions is 21 degrees per 100 FTE students.
Among the institutions that specialize in short- and long-term certificates and Associate’s degrees, the for-profit career schools produced an average of 50 certificates per 100 FTE students. The community and technical colleges produce 27 degrees and certificates per 100 FTE students. While these amounts look favorable when compared to four-year programs, the programs at these institutions should generally take either less than four years (long-term certificates), two years (Associate’s degrees), or less than one year (short-term certificates) to complete. The indicated ratios indicate a sizable number of students do not complete the studies required for an award. This is not surprising at the community and technical colleges were only 59 percent of the students are seeking a degree or certificate.
Table 20: Completions Compared to Full-Time Equivalent Undergraduate Students, Four-Year Average 2009 - 2012 Completions per
100 FTE Undergraduate
Students Major Types of Undergraduate Completions
(percent of sector total) For-profit Career Schools Certificates and Associate’s Degrees 50.0 Long-term certificates (55%); short-term certificates (42%) Nonprofit Career Schools Certificates and Associate’s Degrees 24.1 Long-term certificates (94%); AA degrees (5%) Community & Technical Colleges Certificates and Associate’s Degrees 27.0 AA degrees (56%); short-term certificates (32%); long-term
certificates (12%) Nonprofit 4-Years Bachelor’s Degrees 23.6 BA degrees (98%) For-profit 4-Years Associate’s and Bachelor’s Degrees 21.4 BA degrees (56%); AA degrees (41%) Public Comprehensives Bachelor’s Degrees 23.3 BA degrees (99%) Public Research Bachelor’s Degrees 26.2 BA degrees (100%) Data sources: IPEDS Student Financial Aid and Completions Surveys
ERDC Report 2014-07 June 2014
34
Summary • Eighty-five percent of undergraduate students are enrolled in public institutions with 57 percent
enrolled in community and technical colleges; 17 percent in research universities; and 11 percent in comprehensive institutions. The remaining 15 percent are enrolled in private institutions: nonprofit 4-year institutions (9 percent); for-profit career schools (4 percent); for-profit 4-year institutions (2 percent); and nonprofit career schools (less than 0.5 percent).
• Two-thirds of full-time, first-time degree/certificate-seeking students are enrolled in public institutions: community and technical colleges (28 percent); research universities (25 percent); and comprehensive institutions (14 percent). Private institutions enroll one-third of the Group 2 students: for-profit career schools (16 percent); nonprofit 4-year institutions (15 percent); nonprofit career schools (1 percent); and for-profit 4-year institutions (1 percent).
• Among “low-income” undergraduate students, 81 percent attend public institutions with 53 percent enrolled in community and technical colleges. Among the private institutions “low-income” are primarily enrolled in for-profit career schools (8 percent) and nonprofit 4-year institutions (8 percent).
• Overall, “low-income” students were one-third of all students in 2012. Higher concentrations of “low-income” students were found in the for-profit career schools (62 percent); nonprofit career schools (57 percent); and for-profit 4-year institutions (51 percent).
• Nearly two-thirds of “low-income” full-time, first-time degree/certificate-seeking students attend public institutions. Nearly one-quarter attend for-profit career schools.
• In 2012, 46 percent of all undergraduate students received some grant aid, with average award of $8,550. The average amount of grant aid increased 14 percent from 2009 (adjusted for inflation).
• Grant aid went to 62 percent of the full-time, first-time degree/certificate-seeking students in 2012. The average amount was $9,100.
• Nearly one-third of undergraduate students received federal student loans in 2012 for an average amount of $6,900. Students at public institutions accounted for 69 percent of the loans, nonprofit institution students 18 percent and for-profit institution students 13 percent.
• Among full-time, first-time degree/certificate-seeking students, 46 percent borrowed an average $6,600 from the federal government and other sources.
• On average, 12 percent of student borrowers are defaulting on their federal student loans. Default rate range from 5 percent for student borrowers from nonprofit 4-year institutions and public research universities to 19 percent at the community and technical colleges and for-profit career schools and 22 percent at the for-profit 4-year institutions.
• The annual cost of attendance for full-time, first-time students ranges from $12,300 at the community and technical colleges to $54,500 at nonprofit career schools. Over the four years the cost of attendance increased 17 percent at the research universities, 14 percent at the comprehensive institutions, 11 percent at the for-profit career schools, and 7 percent at the community and technical colleges and the nonprofit 4-year institutions.
• After deducting student grant aid going to a portion of the students, the net price increased 4 percent at the community and technical colleges, 6 percent at the nonprofit 4-year institutions, 9 percent at
ERDC Report 2014-07 June 2014
35
the research universities, 12 percent at the comprehensive institutions, and 16 percent at the for-profit career schools.
• Grant aid as a share of the cost of attendance has increased at the public research universities and declined at the for-profit career schools. It has remained relatively flat at the community and technical colleges, the comprehensive institutions and the nonprofit 4-year institutions.
• In 2012 students earned 32,200 Bachelor’s degrees, 29,000 Associate’s degrees, 11,300 long-term certificates, and 17,800 short-term certificates. During 2009 to 2012 the sources were: o Bachelor’s degrees – 46 percent earned at the research universities, 28 percent at the
comprehensive institutions, and 22 percent at the nonprofit 4-year institutions. o Associate’s degrees – 96 percent earned at community and technical colleges. o Long-term certificates – earned at community and technical colleges (55 percent) and for-profit
career schools (41 percent). o Short-term certificates – earned at community and technical colleges (82 percent) and for-profit
career schools (17 percent). • The research universities produce 26 Bachelor’s degrees per 100 undergraduate FTE students; the
nonprofit 4-year institutions produce 24 Bachelor’s degrees per 100 undergraduate FTE students; and the comprehensives institutions produce 23 Bachelor’s degrees per 100 undergraduate FTE students. (A “perfect” score would be 25 Bachelor’s degrees per 100 FTE students.)
• The for-profit career schools produce 50 completions (primarily long-term and short-term certificates) per 100 undergraduate FTE students; and the community and technical colleges produce 27 completions (Associate’s degrees, short-term and long-term certificates) per 100 undergraduate FTE students. (A “perfect” score is difficult to gauge with the range in program lengths and student intentions.)
ERDC Report 2014-07 June 2014
A-1
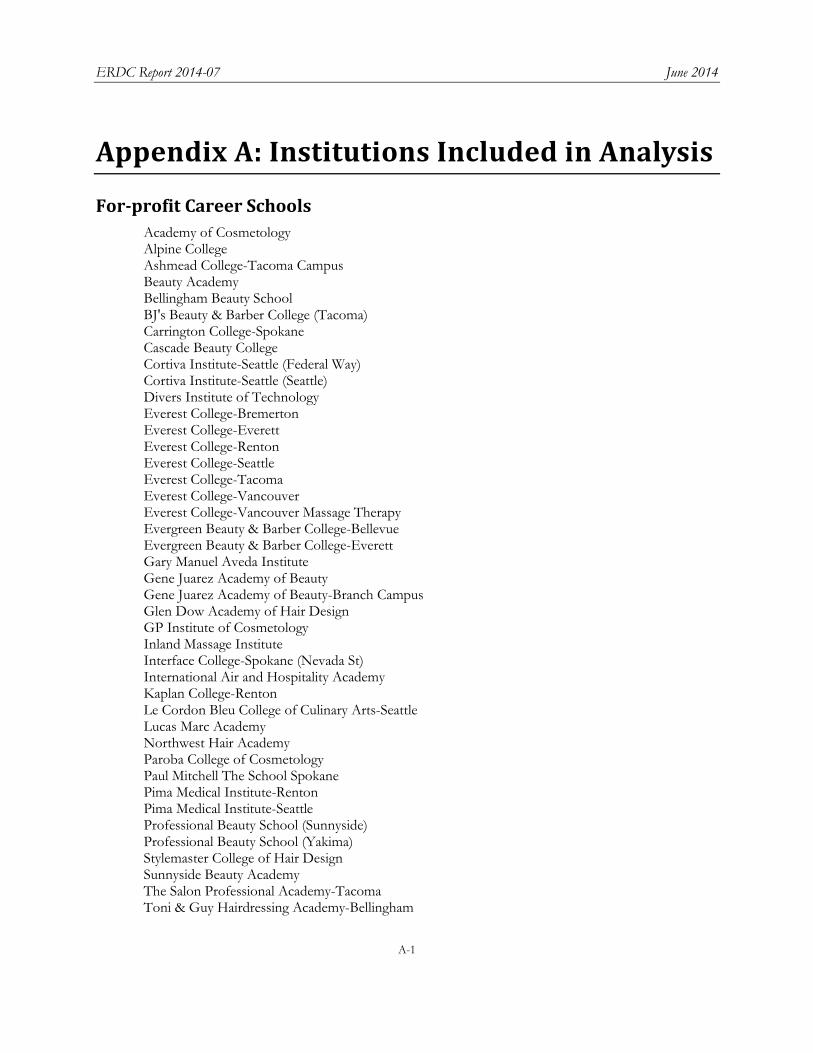
Appendix A: Institutions Included in Analysis
For-profit Career Schools Academy of Cosmetology Alpine College Ashmead College-Tacoma Campus Beauty Academy Bellingham Beauty School BJ's Beauty & Barber College (Tacoma) Carrington College-Spokane Cascade Beauty College Cortiva Institute-Seattle (Federal Way) Cortiva Institute-Seattle (Seattle) Divers Institute of Technology Everest College-Bremerton Everest College-Everett Everest College-Renton Everest College-Seattle Everest College-Tacoma Everest College-Vancouver Everest College-Vancouver Massage Therapy Evergreen Beauty & Barber College-Bellevue Evergreen Beauty & Barber College-Everett Gary Manuel Aveda Institute Gene Juarez Academy of Beauty Gene Juarez Academy of Beauty-Branch Campus Glen Dow Academy of Hair Design GP Institute of Cosmetology Inland Massage Institute Interface College-Spokane (Nevada St) International Air and Hospitality Academy Kaplan College-Renton Le Cordon Bleu College of Culinary Arts-Seattle Lucas Marc Academy Northwest Hair Academy Paroba College of Cosmetology Paul Mitchell The School Spokane Pima Medical Institute-Renton Pima Medical Institute-Seattle Professional Beauty School (Sunnyside) Professional Beauty School (Yakima) Stylemaster College of Hair Design Sunnyside Beauty Academy The Salon Professional Academy-Tacoma Toni & Guy Hairdressing Academy-Bellingham

ERDC Report 2014-07 June 2014
A-2
Toni & Guy Hairdressing Academy-Shoreline Total Cosmetology Training Center Victoria's Academy of Cosmetology Yakima Beauty School Beautyworks
Nonprofit Career Schools Emil Fries Piano Hospital and Training Center Northwest HVAC/R Training Center Northwest School of Wooden Boat Building (Port Hadlock) Perry Technical Institute
Community and Technical Colleges Bates Technical College Bellevue College Bellingham Technical College Big Bend Community College Cascadia Community College Centralia College Clark College Clover Park Technical College Columbia Basin College Edmonds Community College Everett Community College Grays Harbor College Green River Community College Highline Community College Lake Washington Institute of Technology Lower Columbia College Northwest Indian College Olympic College Peninsula College Pierce College at Fort Steilacoom Pierce College at Puyallup Renton Technical College Seattle Community College-Central Campus Seattle Community College-North Campus Seattle Community College-South Campus Seattle Vocational Institute Shoreline Community College Skagit Valley College South Puget Sound Community College Spokane Community College Spokane Falls Community College Tacoma Community College Walla Walla Community College Wenatchee Valley College Whatcom Community College Yakima Valley Community College

ERDC Report 2014-07 June 2014
A-3
Nonprofit 4-Year Institutions Antioch University-Seattle City University of Seattle Cornish College of the Arts Faith Evangelical College & Seminary (Tacoma) Gonzaga University Heritage University Northwest University Pacific Lutheran University Saint Martin's University Seattle Pacific University Seattle University Trinity Lutheran College University of Puget Sound Walla Walla University Whitman College Whitworth University
For-profit 4-Year Institutions Argosy University-Seattle DeVry University-Washington DigiPen Institute of Technology International Academy of Design and Technology-Seattle ITT Technical Institute-Everett ITT Technical Institute-Seattle ITT Technical Institute-Spokane Valley Northwest College of Art & Design The Art Institute of Seattle University of Phoenix-Western Washington Campus
Public Comprehensive Institutions Central Washington University Eastern Washington University The Evergreen State College Western Washington University
Public Research Universities University of Washington-Bothell Campus University of Washington-Seattle Campus University of Washington-Tacoma Campus Washington State University-All Campuses

ERDC Report 2014-07 June 2014
B-1
Appendix B: Data Tables Table 1: Enrollment by Type, Fall 2012
Enrollment Status Degree/Certificate-Seeking Non-Degree/Certificate-
Seeking
Full-Time Part-Time All First-Time Transfer-In Continuing For-profit Career Schools
94% 6% 100% 24% 4% 72% 0%
Nonprofit Career Schools
100% 0% 100% 24% 3% 73% 0%
Community & Technical Colleges
54% 46% 59% 8% 19% 32% 41%
Nonprofit 4-Years
91% 9% 98% 20% 8% 70% 2%
For-profit 4-Years
75% 25% 100% 12% 13% 75% *
Public Comprehensives
88% 12% 98% 16% 12% 71% 2%
Public Research 88% 12% 97% 19% 9% 68% 3% Total All Sectors 69% 31% 76% 13% 15% 49% 24% * Less than 0.5% Data Source: IPEDS Fall Enrollment Survey
Table 2: Enrollment of All Undergraduates Students 2009 2010 2011 2012
Number Percent of Total
Number Percent of Total
Number Percent of Total
Number Percent of Total
For-profit Career Schools 13,018 4% 18,767 5% 16,780 5% 15,273 4%
Nonprofit Career Schools 948 * 1,037 * 1,136 * 1,061 *
Community & Technical Colleges 201,267 59% 208,519 57% 212,891 58% 197,064 57%
Nonprofit 4-Years 28,720 8% 29,442 8% 29,862 8% 29,987 9%
For-profit 4-Years 6,610 2% 7,213 2% 7,433 2% 6,422 2%
Public Comprehensives 37,436 11% 38,931 11% 39,568 11% 39,941 11%
Public Research 53,022 16% 59,427 16% 56,626 16% 58,825 17%
Total All Sectors 341,021 100% 363,036 100% 364,296 100% 348,573 100%
* Less than 0.5%
Data source: IPEDS Student Financial Aid Survey

ERDC Report 2014-07 June 2014
B-2
Table 3: Enrollment of Full-Time, First-Time Degree/Certificate-Seeking Students 2009 2010 2011 2012
Number Percent of Total
Number Percent of Total
Number Percent of Total
Number Percent of Total
For-profit Career Schools 7,706 18% 11,392 24% 7,701 18% 6,729 16%
Nonprofit Career Schools 318 1% 326 1% 312 1% 350 1%
Community & Technical Colleges 13,063 30% 13,750 28% 12,716 29% 12,259 28%
Nonprofit 4-Years 6,071 14% 6,067 13% 6,401 15% 6,274 15%
For-profit 4-Years 892 2% 1,092 2% 825 2% 546 1%
Public Comprehensives 6,369 14% 6,348 13% 6,522 15% 6,047 14%
Public Research 9,560 22% 9,483 20% 9,301 21% 10,843 25%
Total All Sectors 43,979 100% 48,458 100% 43,778 100% 43,048 100%
Data source: IPEDS Student Financial Aid Survey
Table 4: Full-Time, First-Time Degree/Certificate-Seeking Students as a Percentage of All Undergraduate Students
2009 2010 2011 2012
For-profit Career Schools 59% 61% 46% 44%
Nonprofit Career Schools 34% 31% 27% 33%
Community & Technical Colleges 6% 7% 6% 6%
Nonprofit 4-Years 21% 21% 21% 21%
For-profit 4-Years 13% 15% 11% 9%
Public Comprehensives 17% 16% 16% 15%
Public Research 18% 16% 16% 18%
Total All Sectors 13% 13% 12% 12%
Data source: IPEDS Student Financial Aid Survey
Table 5: Undergraduate Pell Grant Recipients by Sector 2009 2010 2011 2012
Number
Percent of Total Pell Recipients Number
Percent of Total Pell Recipients Number
Percent of Total Pell Recipients Number
Percent of Total Pell Recipients
For-profit Career Schools 6,526 9% 9,677 10% 9,094 8% 8,696 8%
Nonprofit Career Schools 462 1% 639 1% 709 1% 656 1%
Community & Technical Colleges
35,357 50% 47,049 51% 56,771 53% 58,369 53%
Nonprofit 4-Years 5,878 8% 7,445 8% 8,395 8% 8,372 8%
For-profit 4-Years 2,109 3% 3,094 3% 3,725 3% 3,269 3%
Public Comprehensives 8,864 13% 11,095 12% 12,786 12% 13,474 12%
Public Research 11,664 16% 14,161 15% 15,989 15% 17,667 16%
Total All Sectors 70,860 100% 93,160 100% 107,469 100% 110,503 100% Data source: IPEDS Student Financial Aid Survey
ERDC Report 2014-07 June 2014
B-3
Table 6: Pell Grant Recipients as a Percentage of All Undergraduate Students 2009 2010 2011 2012
For-profit Career Schools 49% 62% 62% 62%
Nonprofit Career Schools 50% 52% 54% 57%
Community & Technical Colleges 18% 23% 27% 30%
Nonprofit 4-Years 20% 25% 28% 28%
For-profit 4-Years 32% 43% 50% 51%
Public Comprehensives 24% 29% 32% 34%
Public Research 22% 24% 28% 30%
Total All Sectors 21% 26% 30% 32%
Data source: IPEDS Student Financial Aid Survey
Table 7: Full-Time, First-Time, Degree/Certificate-Seeking Pell Grant Recipients by Sector 2009 2010 2011 2012
Number
Percent of Total Pell Recipients Number
Percent of Total Pell Recipients Number
Percent of Total Pell Recipients Number
Percent of Total Pell Recipients
For-profit Career Schools 4,452 34% 7,107 38% 4,663 27% 4,039 24%
Nonprofit Career Schools 164 1% 223 1% 200 1% 247 1%
Community & Technical Colleges
4,314 32% 5,462 29% 5,826 34% 5,968 35%
Nonprofit 4-Years 1,078 8% 1,414 8% 1,633 10% 1,565 9%
For-profit 4-Years 340 3% 592 3% 472 3% 309 2%
Public Comprehensives 1,251 9% 1,632 9% 1,950 11% 1,816 11%
Public Research 1,678 13% 2,197 12% 2,357 14% 2,934 17%
Total All Sectors 13,277 100% 18,627 100% 17,101 100% 16,878 100%
Data source: IPEDS Student Financial Aid Survey
Table 8: Pell Grant Recipients as a Percentage of Full-Time, First-Time, Degree/Certificate-Seeking Students
2009 2010 2011 2012
For-profit Career Schools 58% 62% 61% 60%
Nonprofit Career Schools 52% 68% 64% 71%
Community & Technical Colleges 33% 40% 46% 49%
Nonprofit 4-Years 18% 23% 26% 25%
For-profit 4-Years 38% 54% 57% 57%
Public Comprehensives 20% 26% 30% 30%
Public Research 18% 23% 25% 27%
Total All Sectors 30% 38% 39% 39%
Data source: IPEDS Student Financial Aid Survey

ERDC Report 2014-07 June 2014
B-4
Table 9: All Undergraduate Students Receiving Grant Aid from Federal, State, Institutional or Other Sources: Percentage of Students Receiving Grant Aid and Average Amount of Grant Aid 2009 2010 2011 2012
Percent of Students
Avg. Grant Amount
Percent of Students
Avg. Grant Amount
Percent of Students
Avg. Grant Amount
Percent of Students
Avg. Grant Amount
For-profit Career Schools All Grant Aid 63% $5,185 56% $4,968 58% $4,771 60% $4,635 Nonprofit Career Schools All Grant Aid 66% $4,228 79% $5,563 75% $5,304 75% $6,358 Community & Technical Colleges All Grant Aid 24% $4,392 28% $5,007 32% $5,373 35% $5,388 Nonprofit 4-Years All Grant Aid 81% $14,438 84% $14,833 87% $15,951 90% $17,646 For-profit 4-Years All Grant Aid 51% $4,465 60% $5,937 62% $4,843 71% $3,991 Public Comprehensives All Grant Aid 45% $6,504 47% $7,448 52% $8,358 52% $7,243 Public Research All Grant Aid 46% $8,821 40% $10,016 47% $9,967 50% $10,451 Total All Sectors All Grant Aid 37% $7,482 38% $7,935 43% $8,263 46% $8,550 Data source: IPEDS Student Financial Aid Survey Note: Dollar figures are expressed in constant 2012 dollars.
ERDC Report 2014-07 June 2014
B-5
Table 10: Full-Time, First-Time Degree/Certificate-Seeking Students Receiving Grant Aid from Federal, State, or Institutional Sources: Percentage of Students Receiving Grant Aid and Average Amount of Grant Aid 2009 2010 2011 2012
Percent of Students
Avg. Grant Amount
Percent of Students
Avg. Grant Amount
Percent of Students
Avg. Grant Amount
Percent of Students
Avg. Grant Amount
For-profit Career Schools All Grant Aid Federal Grants Pell Grants Other Federal State Grants Inst. Grants
63% 60% 58% 36%
7% 3%
$5,247 $5,142 $3,699 $2,632 $2,459 $1,161
65% 64% 62% 20%
4% 2%
$4,910 $4,791 $4,680
$613 $3,073 $1,959
65% 61% 61% 22% 14%
3%
$5,073 $4,511 $4,404
$397 $2,956 $3,026
65% 61% 60% 17% 14%
4%
$4,734 $4,327 $4,218
$548 $2,682 $1,979
Nonprofit Career Schools All Grant Aid Federal Grants Pell Grants Other Federal State Grants Inst. Grants
88% 57% 52%
6% 36% 20%
$3,047 $2,651 $2,918
$221 $2,853 $4,767
80% 68% 68%
8% 33% 24%
$4,833 $3,845 $3,811
$279 $2,900 $1,164
74% 65% 64% 10% 21% 22%
$4,573 $3,866 $3,781
$950 $2,917 $1,181
83% 71% 71%
9% 53% 26%
$5,208 $3,932 $3,861
$417 $2,460
$820 Community & Technical Colleges All Grant Aid Federal Grants Pell Grants Other Federal State Grants Inst. Grants
41% 33% 33%
5% 33%
9%
$4,863 $3,599 $3,490
$776 $2,109 $1,204
46% 40% 40%
6% 32%
8%
$5,339 $4,198 $4,107
$803 $2,086 $1,345
53% 46% 46%
5% 35% 12%
$5,411 $4,268 $4,194
$726 $2,101 $1,389
56% 49% 49%
4% 35% 14%
$5,461 $4,114 $4,067
$791 $2,389 $1,341
Nonprofit 4-Years All Grant Aid Federal Grants Pell Grants Other Federal State Grants Inst. Grants
91% 20% 18% 18% 15% 91%
$15,337 $5,119 $3,538 $2,254 $5,129
$13,490
93% 25% 23% 21% 15% 92%
$16,389 $5,879 $4,221 $2,225 $5,572
$13,971
95% 26% 26% 23% 14% 94%
$16,756 $5,738 $4,085 $2,080 $5,622
$14,432
96% 25% 25% 12% 14% 95%
$16,602 $4,977 $4,190 $1,716 $6,117
$14,526 For-profit 4-Years All Grant Aid Federal Grants Pell Grants Other Federal State Grants Inst. Grants
59% 39% 38% 18% 17% 30%
$4,734 $3,866 $3,335 $1,322 $2,598 $2,772
69% 60% 54% 19% 17% 29%
$6,302 $5,718 $4,154 $6,098 $2,498 $1,822
67% 58% 57% 15% 15% 22%
$5,337 $4,746 $4,486 $1,407 $2,702 $1,815
72% 57% 57%
5% 15% 33%
$5,206 $4,160 $4,070 $1,338 $2,178 $3,182
Public Comprehensives All Grant Aid Federal Grants Pell Grants Other Federal State Grants Inst. Grants
52% 20% 20% 16% 27% 37%
$5,685 $4,301 $3,520 $1,053 $3,750 $2,937
58% 26% 26% 22% 24% 45%
$6,440 $5,077 $4,193 $1,177 $4,233 $3,055
60% 30% 30% 24% 20% 50%
$6,777 $4,936 $4,200 $1,008 $4,859 $3,159
60% 30% 30% 12% 18% 49%
$6,623 $4,337 $4,091
$710 $6,005 $3,186
Public Research All Grant Aid Federal Grants Pell Grants Other Federal State Grants Inst. Grants
48% 18% 18% 17% 27% 40%
$8,535 $4,884 $3,629 $1,548 $4,834 $4,848
43% 24% 23% 23% 21% 32%
$9,643 $5,520 $4,323 $1,394 $6,200 $4,760
44% 26% 25% 24% 21% 38%
$10,640 $5,209 $4,288 $1,072 $5,936 $5,522
48% 27% 27% 22% 18% 38%
$11,076 $4,574 $4,238
$491 $7,968 $6,946
Total All Sectors All Grant Aid Federal Grants Pell Grants Other Federal State Grants Inst. Grants
56% 31% 30% 17% 23% 30%
$8,097 $4,476 $3,573 $1,910 $3,361 $7,653
58% 39% 38% 17% 20% 27%
$8,220 $4,839 $4,365 $1,332 $3,661 $7,895
61% 39% 39% 18% 23% 34%
$8,943 $4,693 $4,258 $1,077 $3,648 $8,090
62% 40% 39% 13% 22% 35%
$9,094 $4,348 $4,144
$734 $4,330 $8,413
Data source: IPEDS Student Financial Aid Survey Note: Dollar figures are expressed in constant 2012 dollars.

ERDC Report 2014-07 June 2014
B-6
Table 11: All Undergraduate Students Receiving Federal Student Loans: Percentage of Students Receiving Federal Student Loans and the Average Amount of Federal Loan Aid Received 2009 2010 2011 2012
Percent of Students
Avg. Loan Amount
Percent of Students
Avg. Loan Amount
Percent of Students
Avg. Loan Amount
Percent of Students
Avg. Loan Amount
For-profit Career Schools Federal Loans 71% $6,770 72% $7,729 60% $7,354 66% $7,280 Nonprofit Career Schools Federal Loans 71% $6,591 77% $7,622 76% $7,914 79% $7,836 Community & Technical Colleges Federal Loans 10% $5,286 11% $5,489 13% $6,006 16% $6,034 Nonprofit 4-Years Federal Loans 58% $8,126 60% $7,816 62% $7,718 62% $7,839 For-profit 4-Years Federal Loans 75% $9,591 76% $9,942 77% $9,445 72% $8,926 Public Comprehensives Federal Loans 46% $6,687 49% $7,540 51% $6,821 52% $6,804 Public Research Federal Loans 39% $7,708 38% $7,021 41% $6,984 42% $6,846 Total All Sectors Federal Loans 26% $7,048 28% $7,160 29% $6,997 32% $6,912 Data source: IPEDS Student Financial Aid Survey Note: Dollar figures are expressed in constant 2012 dollars.
Table 12: All Undergraduate Students Receiving Federal Student Loans – Percentage by Sector 2009 2010 2011 2012
For-profit Career Schools 10% 13% 9% 9% Nonprofit Career Schools 1% 1% 1% 1% Community & Technical Colleges 22% 23% 26% 28% Nonprofit 4-Years 19% 17% 17% 17% For-profit 4-Years 6% 5% 5% 4% Public Comprehensives 19% 18% 19% 19% Public Research 23% 22% 22% 22% Total All Sectors 100% 100% 100% 100% Data source: IPEDS Student Financial Aid Survey

ERDC Report 2014-07 June 2014
B-7
Table 13: Full-Time, First-Time Degree/Certificate-Seeking Students Receiving Student Loans: Percentage of Students Receiving Student Loans and the Average Amount of Loan Aid Received 2009 2010 2011 2012
Percent Avg. Loan Percent Avg. Loan Percent Avg. Loan Percent Avg. Loan For-profit Career Schools All Loans Federal Loans Other Loans
75% 73% 16%
$7,544 $6,773 $4,409
79% 78% 10%
$8,407 $7,811 $5,219
75% 74%
9%
$8,203 $7,596 $5,340
77% 76% 11%
$8,046 $7,522 $4,278
Nonprofit Career Schools All Loans Federal Loans Other Loans
75% 75%
2%
$6,683 $6,587 $4,254
85% 85%
4%
$7,291 $7,004 $6,116
78% 78%
3%
$6,937 $6,769 $4,079
86% 86%
6%
$6,708 $6,456 $3,801
Community & Technical Colleges All Loans Federal Loans Other Loans
13% 13%
*
$4,623 $4,519 $4,688
15% 15%
*
$4,876 $4,822 $3,189
17% 17%
*
$5,130 $5,067 $7,336
19% 18%
*
$5,000 $4,965 $6,301
Nonprofit 4-Years All Loans Federal Loans Other Loans
56% 56%
8%
$7,619 $6,264 $9,742
63% 62%
7%
$7,323 $6,276 $9,315
64% 64%
5%
$7,103 $6,184
$10,913
63% 62%
6%
$6,874 $5,901
$10,771 For-profit 4-Years All Loans Federal Loans Other Loans
81% 81% 22%
$11,538 $8,498
$11,331
82% 82% 20%
$11,640 $8,978
$11,065
80% 79% 13%
$10,207 $8,366
$11,053
76% 76%
7%
$9,561 $8,536
$11,848 Public Comprehensives All Loans Federal Loans Other Loans
46% 45%
2%
$5,101 $4,800 $9,639
50% 50%
1%
$5,524 $5,331
$10,437
53% 52%
2%
$5,779 $5,418 $9,805
54% 53%
2%
$5,712 $5,252
$11,491 Public Research All Loans Federal Loans Other Loans
35% 34%
2%
$7,168 $6,515
$11,323
38% 38%
2%
$5,922 $5,320
$11,986
38% 38%
2%
$5,783 $5,255
$12,369
41% 40%
2%
$5,920 $5,212
$13,471 Total All Sectors All Loans Federal Loans Other Loans
41% 41%
5%
$6,968 $6,160 $7,019
47% 47%
4%
$7,228 $6,582 $7,467
45% 45%
3%
$6,843 $6,254 $8,286
46% 45%
4%
$6,614 $6,020 $8,033
* Less than 0.5% Data source: IPEDS Student Financial Aid Survey Note: Dollar figures are expressed in constant 2012 dollars.
Table 14: Full-Time, First-Time Degree/Certificate-Seeking Students Receiving Federal Student Loans – Percentage by Sector 2009 2010 2011 2012 Federal
Loans Other Loans
Federal Loans
Other Loans
Federal Loans
Other Loans
Federal Loans
Other Loans
For-profit Career Schools 32% 54% 39% 54% 29% 46% 26% 47% Nonprofit Career Schools 1% * 1% 1% 1% 1% 2% 1% Community & Technical Colleges 10% 2% 9% 2% 11% 2% 11% 3% Nonprofit 4-Years 19% 22% 17% 21% 21% 23% 20% 23% For-profit 4-Years 4% 9% 4% 10% 4% 7% 2% 2% Public Comprehensives 16% 4% 14% 3% 17% 9% 17% 9% Public Research 18% 9% 16% 9% 18% 11% 22% 15% Total All Sectors 100% 100% 100% 100% 100% 100% 100% 100% * Less than 0.5% Data source: IPEDS Student Financial Aid Survey

ERDC Report 2014-07 June 2014
B-8
Table 15: 3-Year Federal Student Loan Default Rate (FY 2010 Cohort) Default Rate Share of Total For-profit Career Schools 19% 20% Nonprofit Career Schools 15% 1% Community & Technical Colleges 19% 46% Nonprofit 4-Years 5% 8% For-profit 4-Years 22% 9% Public Comprehensives 7% 9% Public Research 5% 8% Total All Sectors 12% 100% Data source: Federal Student Aid, U.S. Department of Education

ERDC Report 2014-07 June 2014
B-9
Table 16: Cost of Attendance for Full-Time, First-Time Undergraduate Students 2009 2010 2011 2012
For-profit Career Schools Cost of Attendance Published Tuition & Fees Books & Supplies Room & Board Other Expenses
$26,518 $12,801
$1,046 $9,043 $3,628
$28,951 $13,539
$1,102 $9,996 $4,314
$29,048 $13,777
$1,223 $10,418
$3,631
$29,377 $13,508
$1,162 $11,099
$3,608
Nonprofit Career Schools Cost of Attendance Published Tuition & Fees Books & Supplies Room & Board Other Expenses
$55,580 $20,934
$3,509 $24,647
$6,491
$53,075 $20,431
$3,232 $23,652
$5,761
$53,599 $21,463
$3,193 $23,259
$5,684
$54,510 $22,495
$3,111 $24,181
$4,723
Community & Technical Colleges Cost of Attendance Published Tuition & Fees Books & Supplies Room & Board Other Expenses
$11,465 $2,928 $1,000 $4,255 $3,282
$11,966 $3,111 $1,035 $4,416 $3,404
$12,072 $3,311 $1,026 $4,339 $3,396
$12,308 $3,605 $1,012 $4,501 $3,189
Nonprofit 4-Years Cost of Attendance Published Tuition & Fees Books & Supplies Room & Board Other Expenses
$41,750 $29,292
$1,119 $8,464 $2,876
$43,049 $30,315
$1,119 $8,746 $2,870
$43,859 $31,051
$1,124 $8,879 $2,805
$44,644 $31,829
$1,097 $9,003 $2,715
For-profit 4-Years Cost of Attendance Published Tuition & Fees Books & Supplies Room & Board Other Expenses
$32,298 $17,439
$1,539 $8,628 $4,692
$32,534 $16,638
$1,224 $8,984 $5,689
$32,174 $17,712
$1,515 $8,754 $4,193
$32,293 $18,948
$864 $8,850 $3,630
Public Comprehensives Cost of Attendance Published Tuition & Fees Books & Supplies Room & Board Other Expenses
$18,058 $5,775 $1,019 $7,887 $3,377
$19,346 $6,398 $1,044 $8,413 $3,491
$20,110 $7,009 $1,031 $8,664 $3,406
$20,524 $7,622 $1,012 $8,793 $3,096
Public Research Cost of Attendance Published Tuition & Fees Books & Supplies Room & Board Other Expenses
$20,498 $7,461 $1,049 $8,831 $3,157
$21,773 $8,324 $1,039 $9,219 $3,192
$22,812 $9,185 $1,024 $9,400 $3,203
$24,078 $10,645
$995 $9,394 $3,045
Data source: IPEDS Institutional Characteristics Survey Note: Dollar figures are expressed in constant 2012 dollars.
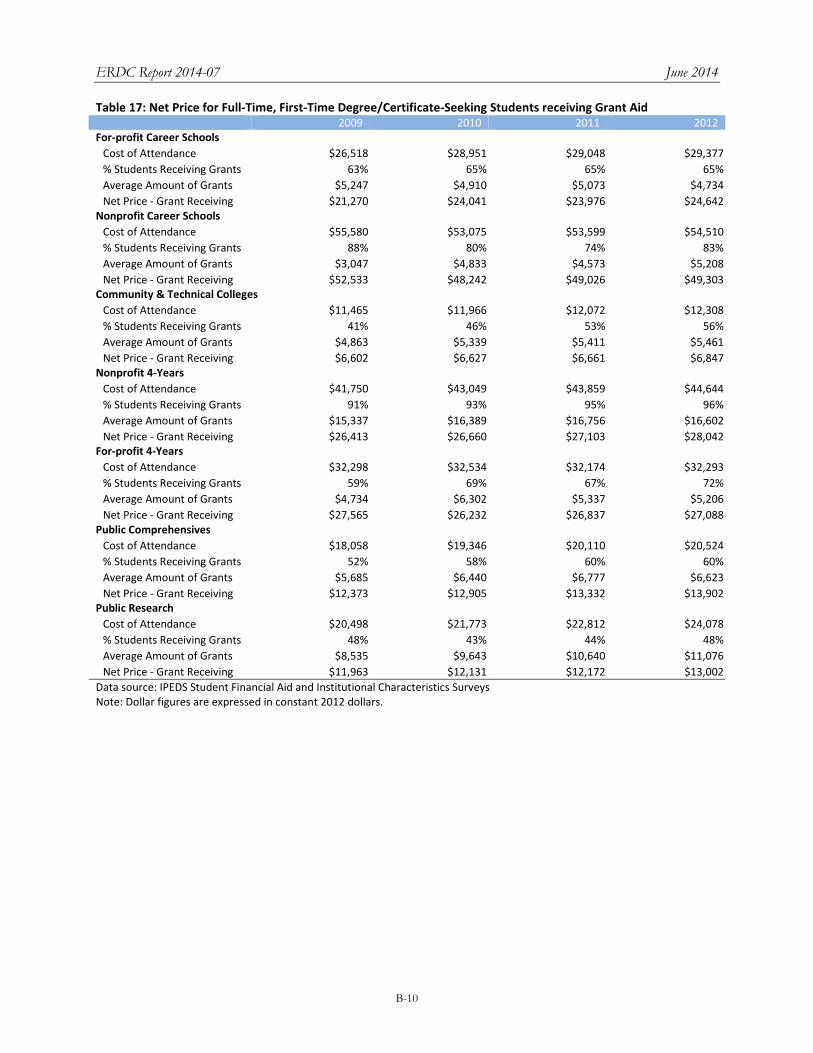
ERDC Report 2014-07 June 2014
B-10
Table 17: Net Price for Full-Time, First-Time Degree/Certificate-Seeking Students receiving Grant Aid 2009 2010 2011 2012
For-profit Career Schools Cost of Attendance % Students Receiving Grants Average Amount of Grants Net Price - Grant Receiving
$26,518 63%
$5,247 $21,270
$28,951 65%
$4,910 $24,041
$29,048 65%
$5,073 $23,976
$29,377 65%
$4,734 $24,642
Nonprofit Career Schools Cost of Attendance % Students Receiving Grants Average Amount of Grants Net Price - Grant Receiving
$55,580 88%
$3,047 $52,533
$53,075 80%
$4,833 $48,242
$53,599 74%
$4,573 $49,026
$54,510 83%
$5,208 $49,303
Community & Technical Colleges Cost of Attendance % Students Receiving Grants Average Amount of Grants Net Price - Grant Receiving
$11,465 41%
$4,863 $6,602
$11,966 46%
$5,339 $6,627
$12,072 53%
$5,411 $6,661
$12,308 56%
$5,461 $6,847
Nonprofit 4-Years Cost of Attendance % Students Receiving Grants Average Amount of Grants Net Price - Grant Receiving
$41,750 91%
$15,337 $26,413
$43,049 93%
$16,389 $26,660
$43,859 95%
$16,756 $27,103
$44,644 96%
$16,602 $28,042
For-profit 4-Years Cost of Attendance % Students Receiving Grants Average Amount of Grants Net Price - Grant Receiving
$32,298 59%
$4,734 $27,565
$32,534 69%
$6,302 $26,232
$32,174 67%
$5,337 $26,837
$32,293 72%
$5,206 $27,088
Public Comprehensives Cost of Attendance % Students Receiving Grants Average Amount of Grants Net Price - Grant Receiving
$18,058 52%
$5,685 $12,373
$19,346 58%
$6,440 $12,905
$20,110 60%
$6,777 $13,332
$20,524 60%
$6,623 $13,902
Public Research Cost of Attendance % Students Receiving Grants Average Amount of Grants Net Price - Grant Receiving
$20,498 48%
$8,535 $11,963
$21,773 43%
$9,643 $12,131
$22,812 44%
$10,640 $12,172
$24,078 48%
$11,076 $13,002
Data source: IPEDS Student Financial Aid and Institutional Characteristics Surveys Note: Dollar figures are expressed in constant 2012 dollars.
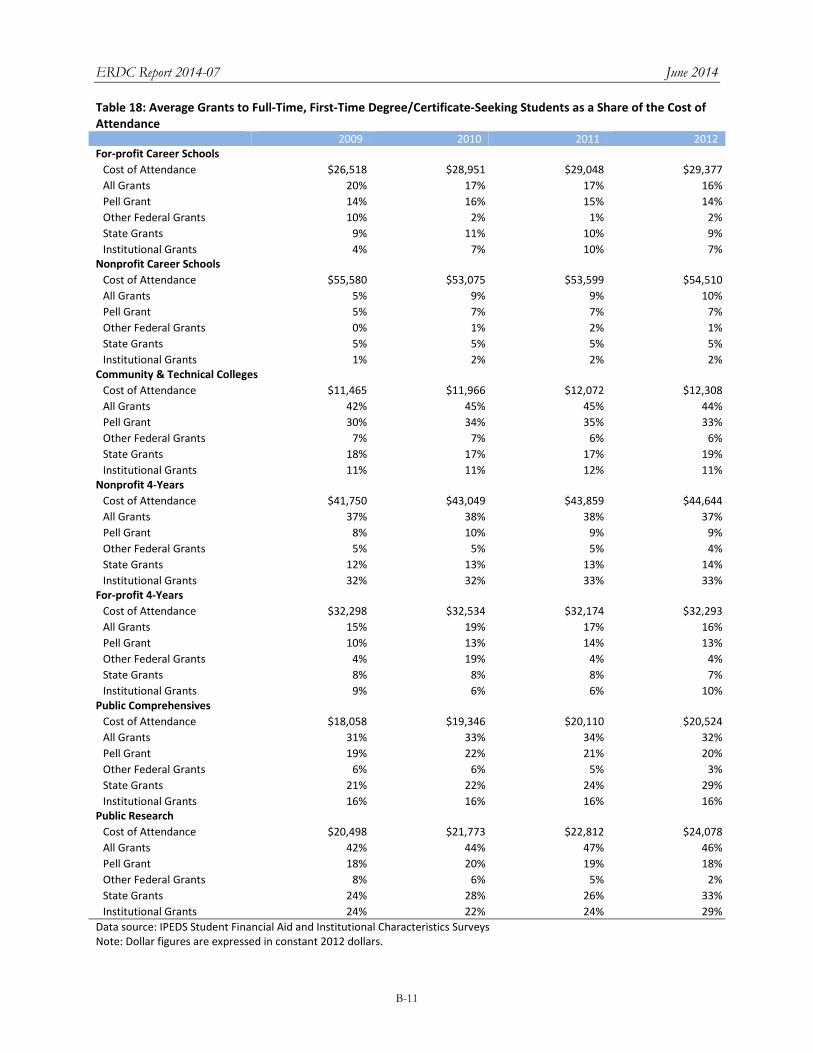
ERDC Report 2014-07 June 2014
B-11
Table 18: Average Grants to Full-Time, First-Time Degree/Certificate-Seeking Students as a Share of the Cost of Attendance
2009 2010 2011 2012 For-profit Career Schools
Cost of Attendance All Grants Pell Grant Other Federal Grants State Grants Institutional Grants
$26,518 20% 14% 10%
9% 4%
$28,951 17% 16%
2% 11%
7%
$29,048 17% 15%
1% 10% 10%
$29,377 16% 14%
2% 9% 7%
Nonprofit Career Schools Cost of Attendance All Grants Pell Grant Other Federal Grants State Grants Institutional Grants
$55,580 5% 5% 0% 5% 1%
$53,075 9% 7% 1% 5% 2%
$53,599 9% 7% 2% 5% 2%
$54,510 10%
7% 1% 5% 2%
Community & Technical Colleges Cost of Attendance All Grants Pell Grant Other Federal Grants State Grants Institutional Grants
$11,465 42% 30%
7% 18% 11%
$11,966 45% 34%
7% 17% 11%
$12,072 45% 35%
6% 17% 12%
$12,308 44% 33%
6% 19% 11%
Nonprofit 4-Years Cost of Attendance All Grants Pell Grant Other Federal Grants State Grants Institutional Grants
$41,750 37%
8% 5%
12% 32%
$43,049 38% 10%
5% 13% 32%
$43,859 38%
9% 5%
13% 33%
$44,644 37%
9% 4%
14% 33%
For-profit 4-Years Cost of Attendance All Grants Pell Grant Other Federal Grants State Grants Institutional Grants
$32,298 15% 10%
4% 8% 9%
$32,534 19% 13% 19%
8% 6%
$32,174 17% 14%
4% 8% 6%
$32,293 16% 13%
4% 7%
10%
Public Comprehensives Cost of Attendance All Grants Pell Grant Other Federal Grants State Grants Institutional Grants
$18,058 31% 19%
6% 21% 16%
$19,346 33% 22%
6% 22% 16%
$20,110 34% 21%
5% 24% 16%
$20,524 32% 20%
3% 29% 16%
Public Research Cost of Attendance All Grants Pell Grant Other Federal Grants State Grants Institutional Grants
$20,498 42% 18%
8% 24% 24%
$21,773 44% 20%
6% 28% 22%
$22,812 47% 19%
5% 26% 24%
$24,078 46% 18%
2% 33% 29%
Data source: IPEDS Student Financial Aid and Institutional Characteristics Surveys Note: Dollar figures are expressed in constant 2012 dollars.

ERDC Report 2014-07 June 2014
B-12
Number Percent of Tota l
Number Percent of Tota l
Number Percent of Tota l
Number Percent of Tota l
Short-term (<1 year) Certi fi cates 3,083 23% 4,279 23% 2,325 13% 1,958 11%
Long-term (1+ years ) Certi fi cates 1,768 27% 2,637 32% 5,705 48% 5,174 46%
Associate's Degrees 85 * 210 1% 339 1% 396 1%
Short-term (<1 year) Certi fi cates 13 *
Long-term (1+ years ) Certi fi cates 298 5% 321 4% 364 3% 335 3%
Associate's Degrees 34 * 17 * 17 *
Short-term (<1 year) Certi fi cates 10,142 76% 14,064 76% 14,950 85% 15,520 87%
Long-term (1+ years ) Certi fi cates 4,269 66% 5,117 63% 5,699 48% 5,656 50%
Associate's Degrees 21,083 96% 22,167 96% 26,014 96% 27,833 96%
Bachelor's Degrees 36 * 53 * 142 * 163 1%
Short-term (<1 year) Certi fi cates 12 * 3 * 6 * 3 *
Long-term (1+ years ) Certi fi cates 50 1% 62 1% 54 * 55 *
Associate's Degrees 77 * 94 * 70 * 49 *
Bachelor's Degrees 6,919 23% 6,767 22% 6,950 22% 7,068 22%
Short-term (<1 year) Certi fi cates 45 * 51 *
Long-term (1+ years ) Certi fi cates 61 1% 35 *
Associate's Degrees 613 3% 535 2% 605 2% 682 2%
Bachelor's Degrees 969 3% 877 3% 760 2% 760 2%
Short-term (<1 year) Certi fi cates 11 * 94 1% 193 1%
Bachelor's Degrees 8,669 29% 8,739 29% 8,739 28% 9,110 28%
Short-term (<1 year) Certi fi cates 33 * 61 * 74 * 88 *
Long-term (1+ years ) Certi fi cates 19 *
Bachelor's Degrees 13,356 45% 14,059 46% 14,530 47% 15,111 47%
Short-term Certi fi cates 13,270 100% 18,476 100% 17,500 100% 17,762 100%
Long-term Certi fi cates 6,465 100% 8,137 100% 11,822 100% 11,255 100%
Associate's Degrees 21,858 100% 23,040 100% 27,045 100% 28,977 100%
Bachelor's Degrees 29,949 100% 30,495 100% 31,121 100% 32,212 100%
Table 19: Undergraduate Awards2009 2010 2011 2012
Data source: IPEDS Completions Survey
For-profit Career Schools
Nonprofit Career Schools
Grand Total
Public Comprehensives
For-profit 4-Years
Nonprofit 4-Years
Community & Technical Colleges
Public Research
* Less than 0.5%
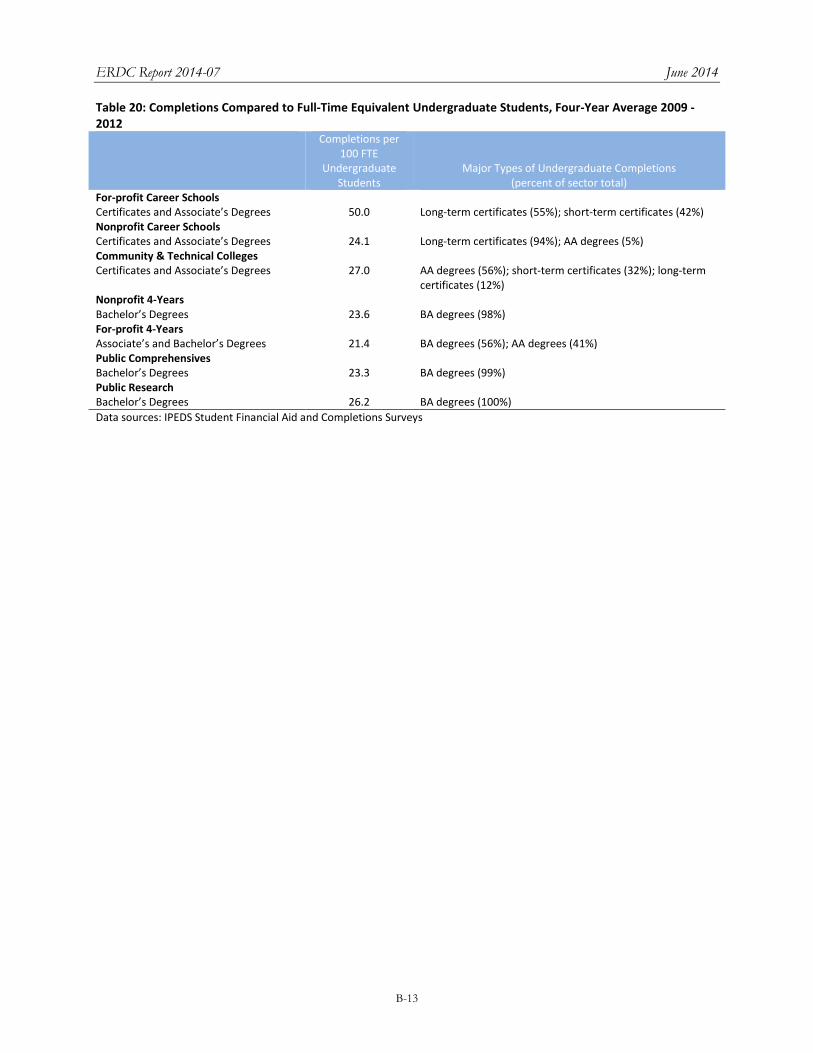
ERDC Report 2014-07 June 2014
B-13
Table 20: Completions Compared to Full-Time Equivalent Undergraduate Students, Four-Year Average 2009 - 2012 Completions per
100 FTE Undergraduate
Students Major Types of Undergraduate Completions
(percent of sector total) For-profit Career Schools Certificates and Associate’s Degrees 50.0 Long-term certificates (55%); short-term certificates (42%) Nonprofit Career Schools Certificates and Associate’s Degrees 24.1 Long-term certificates (94%); AA degrees (5%) Community & Technical Colleges Certificates and Associate’s Degrees 27.0 AA degrees (56%); short-term certificates (32%); long-term
certificates (12%) Nonprofit 4-Years Bachelor’s Degrees 23.6 BA degrees (98%) For-profit 4-Years Associate’s and Bachelor’s Degrees 21.4 BA degrees (56%); AA degrees (41%) Public Comprehensives Bachelor’s Degrees 23.3 BA degrees (99%) Public Research Bachelor’s Degrees 26.2 BA degrees (100%) Data sources: IPEDS Student Financial Aid and Completions Surveys