Embed Size (px)
Citation preview
IJER © Serials Publications11(1), Jan.-June 2014: 15-35
ISSN: 0972-9380
Trends in Poverty and Income Distribution inBangladesh: Which Way?
Abstract: In the 1980s and 1990s Bangladesh implemented various trade liberalisationreforms as part of its Structural Adjustment Programmes. During these periods, thecountry’s growth performance was impressive. Nevertheless, a continuing high prevalenceof poverty and increased income inequality raised concern that the trade liberalisationpolicies may have worked against the poor. From an overview of Bangladesh’s tradeliberalisation, poverty and inequality scenario, it is obvious that in Bangladesh, theincidence of poverty has declined specially in post-reform period, however, it has beenaccompanied with increased inequality. In case of employment also, trade liberalisationduring the 1990s has failed to create enough employment opportunities in agricultural andmanufacturing sector, rather the growth of self employment and wage employment ininformal sector has aggravated the income inequality situation.
Keywords: Poverty, Income distribution, Employment, Trade Liberalisation, Bangladesh
JEL Classification: F13, I32
1. INTRODUCTION
Bangladesh as a contracting party to the GATT since 1972, and as an original memberof the WTO has initiated various policy reforms in order to integrate with the worldeconomy. In the 1980s and 1990s it implemented various trade liberalisation reformsas part of its Structural Adjustment Programmes. During the post-liberalisationperiod, Bangladesh economy has performed well with respect to GDP growth,agricultural output, the services and industrial sector and export earnings. However,whether this growth performance has translated into a reduction in poverty andinequality is a matter of concern. Available estimates indicate that during the 1990sBangladesh succeeded in reducing poverty on average by 1 percent per annum (IMF,2005). A World Bank estimate also suggests that the poverty head-count indexdeclined from 88.15 per cent in 1972-73 to 49.8 per cent in 2000 and 40 per cent in 2005.Yet in spite of this apparent success, Bangladesh still has the highest incidence ofpoverty in South Asia, the third highest absolute number of poor in the world after
* School of Business, Economics and Public Policy, Faculty of the Professions. The University of NewEngland, Armidale, NSW, 2351, Australia, E-mail: [email protected]
16 Bodrun Nahar
India and China, and its per capita GDP ($480 in 2006 at Purchasing Power Parity) isone of the lowest in the world (World Bank, 2007). Furthermore, inequality inBangladesh as a whole increased throughout the entire decade, the overall Gini ratioincreased from 0.30 in 1991-92 to 0.41 in 2000 and 0.47 in 2005. In the case of the urbanareas, the Gini coefficient, after declining during the period 1983-1988, rose sharplyfrom 0.40 in 1991 to 0.50 in 2005. In the case of the rural areas also an upward trendoccurred throughout the 1980s and the 1990s. The concurrent presence of tradeliberalsation, inequality and poverty has raised alarm that trade policies may haveworked against the large poor majority of the country. It is also suspected that tradeliberalisation has failed to align employment with growth. In case of Bangladesh, nosystematic historical study has so far been conducted to relate trade liberalisation,poverty, unemployment and equality.
Through this perspective, the present study provides a historical overview oftrade liberalisation, poverty, inequality and labour market developments inBangladesh. In doing so, section 2 provides a poverty profile of Bangladesh. Section 3presents trends in income inequality in Bangladesh and includes an examination ofthe structure of and changes in income distribution in Bangladesh. Section 4 providesa description of labour force trends and structural changes in employment andSection 5 offers some concluding comments.
2. A POVERTY PROFILE OF BANGLADESH
2.1. Trends in Poverty Incidence in Bangladesh
In Bangladesh, numerous studies have been conducted concerning the incidence ofpoverty. Some of these studies relate trade liberalisation to poverty incidence andconclude that globalisation has contributed positively to poverty reduction eventhough most of them question the uneven distribution across different householdsand urban/rural differences. Some of these studies include Osmani (2005), Mujeriand Khondker (2002), Roy (1996), World Bank (1998), Osmani et al. (2003), Sen et al.(2004) and Annabi et al (2006). Other studies have measured the trends anddeterminants of the current status of poverty in Bangladesh (for example, Hossainand Sen (1992), Khundker et al. (1994), Khan (1990), Osmani (1990), Wodon (1999) andothers). Even though all of the studies used data provided by the HouseholdExpenditure Surveys (HES) conducted by the Bangladesh Bureau of Statistics (BBS),there remains much controversy about the extent of poverty, particularly in the 1970sand 1980s (Ravallion & Sen, 1996).
Most studies have used the head count ratio2 as a measure of poverty; howeverthere are discrepancies among the head count estimates because of differences inunderlying assumptions. According to Ravallion and Sen (1996), the main ingredientsof poverty measures, i.e. calorie requirements and allowances for non-food goods,require judgements. Also, the set of prices used for costing the minimum caloriebundle3 in setting the food poverty line within the Cost of Basic Needs (CBN) method
Trends in Poverty and Income Distribution in Bangladesh: Which Way? 17
constituted a major source of discrepancy amongst various head count estimates.Further, in the case of non-food basic needs, a similar discrepancy arises.
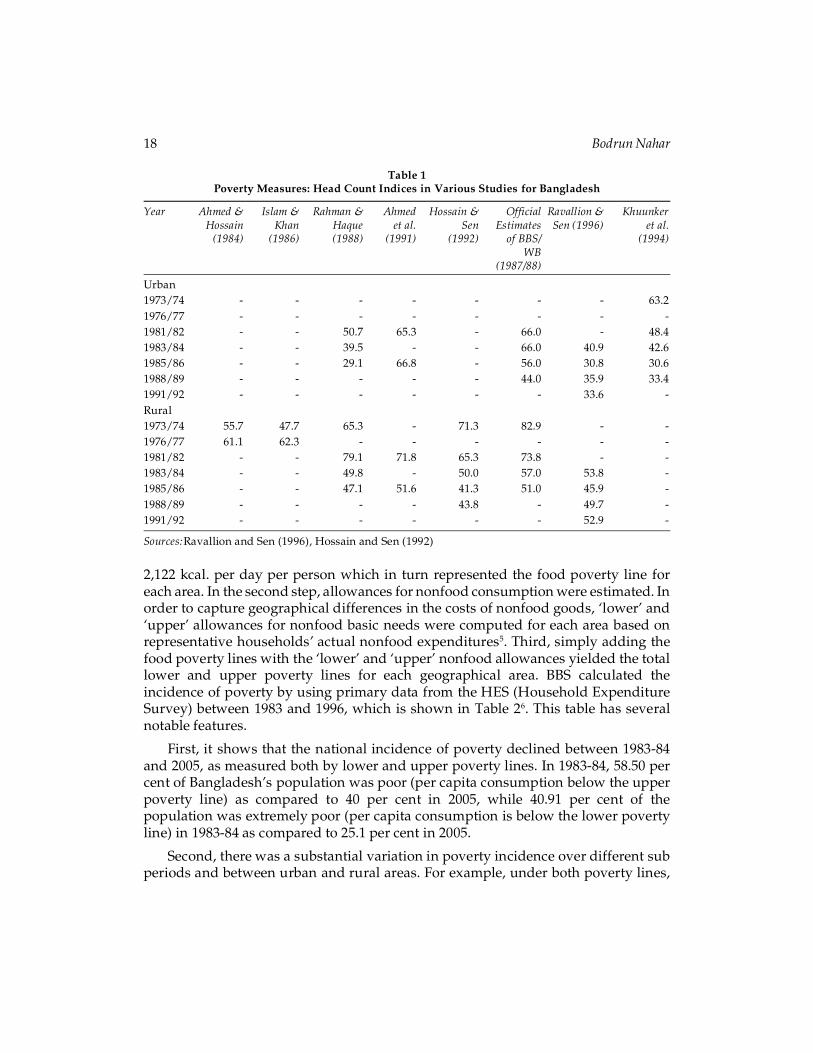
Table 1 presents estimates of the head count index of poverty for various years inthe 1970s and 1980s in Bangladesh. Even though each study used the same primarydata source and the same food energy requirement method, the results differed. Forexample, for urban areas for the year 1981-82, the head count ratio varies from 48.4per cent to 66.0 per cent, similarly, for 1985-86, it ranges between 29.1 per cent and56.0 per cent. For rural areas for 1973-74 the proportion of poor people varies from47.7 per cent to 82.9 per cent. In spite of differences among the estimates for thevarious sub periods, all studies except one (Ahmed, Khan, & Sampath, 1991) suggestthat urban poverty fell during the 1980s. Similarly for rural areas, all studies showpoverty incidence decreased during the 1970s and 1980s, except in the study of Islamand Khan (1986).
Methodological differences may contribute to these observed differences. Forexample, by using a fixed consumption bundle, Rahman and Haque (1988) haveshown that rural poverty rose in the first period and then fell in the second period. Incontrast, Hossain and Sen (1992), using the same minimum consumption bundle,have shown that while head count ratios decreased in the earlier 1980s, theyworsened after the mid 1980s. Khundker et al. (1994) obtained the same result forurban areas. Using a different methodology, the World Bank (1987) and BBS (1988)also have shown that poverty has fallen over all periods for both urban and ruralareas. In fact, the World Bank (WB) and BBS constructed a poverty income line byestimating a relationship between income and consumption of calories in a givenyear. Table 1 also reveals that for 1985-86 the Ahmed et al. (1991) study and the WB/BBS study both show a higher poverty rates in urban areas than in rural areas.According to Ravallion and Sen (1996), this result was due to differences in the realvalue of the urban and rural poverty lines generated by the FEI4 (Food-Energy-Intake)method of setting poverty lines. In fact, the FEI method has deficiencies when usedfor poverty comparison because the poverty lines it generates do not representidentical purchasing power in real terms over time or across sectors or groups (WorldBank, 1998). For example, people in better-off regions (urban) buy more expensivecalories and reach their food energy requirement at higher level of total spending(Ravallion & Sen, 1996) than their rural counterparts. Thus the poverty line of better-off regions will be higher than the worse-off regions (rural) poverty line.
Because of these observed problems with the FEI method, the CBN method isconsidered the standard method for estimating the incidence of poverty. In late 1994,the World Bank in a joint capacity building effort with BBS improved the officialmethodology for measuring poverty. By dropping the FEI method, World Bank (WB)and BBS adopted the cost of basic needs method.
Three steps were followed in estimating this cost. First, a representative, fixedfood bundle was estimated which provided minimal nutritional requirements of
18 Bodrun Nahar
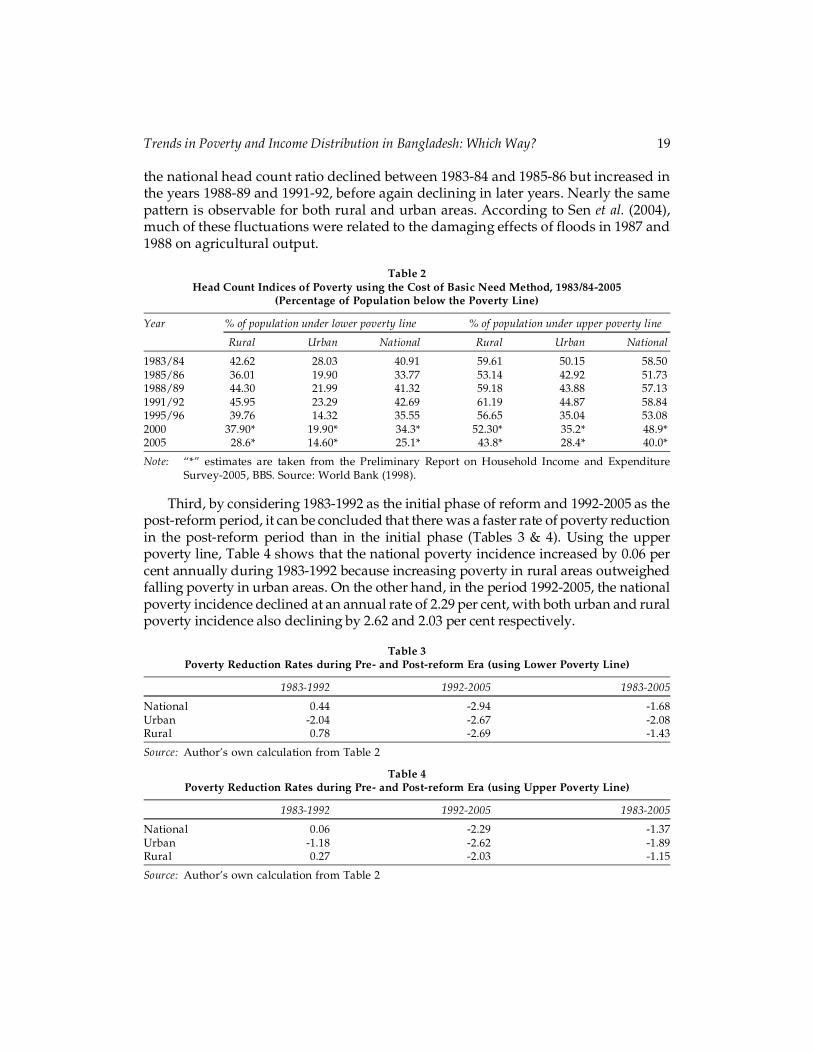
2,122 kcal. per day per person which in turn represented the food poverty line foreach area. In the second step, allowances for nonfood consumption were estimated. Inorder to capture geographical differences in the costs of nonfood goods, ‘lower’ and‘upper’ allowances for nonfood basic needs were computed for each area based onrepresentative households’ actual nonfood expenditures5. Third, simply adding thefood poverty lines with the ‘lower’ and ‘upper’ nonfood allowances yielded the totallower and upper poverty lines for each geographical area. BBS calculated theincidence of poverty by using primary data from the HES (Household ExpenditureSurvey) between 1983 and 1996, which is shown in Table 26. This table has severalnotable features.
First, it shows that the national incidence of poverty declined between 1983-84and 2005, as measured both by lower and upper poverty lines. In 1983-84, 58.50 percent of Bangladesh’s population was poor (per capita consumption below the upperpoverty line) as compared to 40 per cent in 2005, while 40.91 per cent of thepopulation was extremely poor (per capita consumption is below the lower povertyline) in 1983-84 as compared to 25.1 per cent in 2005.
Second, there was a substantial variation in poverty incidence over different subperiods and between urban and rural areas. For example, under both poverty lines,
Table 1Poverty Measures: Head Count Indices in Various Studies for Bangladesh
Year Ahmed & Islam & Rahman & Ahmed Hossain & Official Ravallion & KhuunkerHossain Khan Haque et al. Sen Estimates Sen (1996) et al.
(1984) (1986) (1988) (1991) (1992) of BBS/ (1994)WB
(1987/88)
Urban1973/74 - - - - - - - 63.21976/77 - - - - - - - -1981/82 - - 50.7 65.3 - 66.0 - 48.41983/84 - - 39.5 - - 66.0 40.9 42.61985/86 - - 29.1 66.8 - 56.0 30.8 30.61988/89 - - - - - 44.0 35.9 33.41991/92 - - - - - - 33.6 -Rural1973/74 55.7 47.7 65.3 - 71.3 82.9 - -1976/77 61.1 62.3 - - - - - -1981/82 - - 79.1 71.8 65.3 73.8 - -1983/84 - - 49.8 - 50.0 57.0 53.8 -1985/86 - - 47.1 51.6 41.3 51.0 45.9 -1988/89 - - - - 43.8 - 49.7 -1991/92 - - - - - - 52.9 -
Sources:Ravallion and Sen (1996), Hossain and Sen (1992)
Trends in Poverty and Income Distribution in Bangladesh: Which Way? 19
the national head count ratio declined between 1983-84 and 1985-86 but increased inthe years 1988-89 and 1991-92, before again declining in later years. Nearly the samepattern is observable for both rural and urban areas. According to Sen et al. (2004),much of these fluctuations were related to the damaging effects of floods in 1987 and1988 on agricultural output.
Table 2Head Count Indices of Poverty using the Cost of Basic Need Method, 1983/84-2005
(Percentage of Population below the Poverty Line)
Year % of population under lower poverty line % of population under upper poverty line
Rural Urban National Rural Urban National
1983/84 42.62 28.03 40.91 59.61 50.15 58.501985/86 36.01 19.90 33.77 53.14 42.92 51.731988/89 44.30 21.99 41.32 59.18 43.88 57.131991/92 45.95 23.29 42.69 61.19 44.87 58.841995/96 39.76 14.32 35.55 56.65 35.04 53.082000 37.90* 19.90* 34.3* 52.30* 35.2* 48.9*2005 28.6* 14.60* 25.1* 43.8* 28.4* 40.0*
Note: “*” estimates are taken from the Preliminary Report on Household Income and ExpenditureSurvey-2005, BBS. Source: World Bank (1998).
Third, by considering 1983-1992 as the initial phase of reform and 1992-2005 as thepost-reform period, it can be concluded that there was a faster rate of poverty reductionin the post-reform period than in the initial phase (Tables 3 & 4). Using the upperpoverty line, Table 4 shows that the national poverty incidence increased by 0.06 percent annually during 1983-1992 because increasing poverty in rural areas outweighedfalling poverty in urban areas. On the other hand, in the period 1992-2005, the nationalpoverty incidence declined at an annual rate of 2.29 per cent, with both urban and ruralpoverty incidence also declining by 2.62 and 2.03 per cent respectively.
Table 3Poverty Reduction Rates during Pre- and Post-reform Era (using Lower Poverty Line)
1983-1992 1992-2005 1983-2005
National 0.44 -2.94 -1.68Urban -2.04 -2.67 -2.08Rural 0.78 -2.69 -1.43
Source: Author’s own calculation from Table 2
Table 4Poverty Reduction Rates during Pre- and Post-reform Era (using Upper Poverty Line)
1983-1992 1992-2005 1983-2005
National 0.06 -2.29 -1.37Urban -1.18 -2.62 -1.89Rural 0.27 -2.03 -1.15
Source: Author’s own calculation from Table 2
20 Bodrun Nahar
A fourth notable feature in Table 2 is that the rate of declining poverty incidencefrom 1983 to 2005 was larger in urban areas than in rural areas. As a result, in terms ofthe lower poverty line, the ratio of the rural poverty index to the urban poverty indexwas considerably higher at the end of the period than it had been at the beginning.The same is true for the upper poverty line.
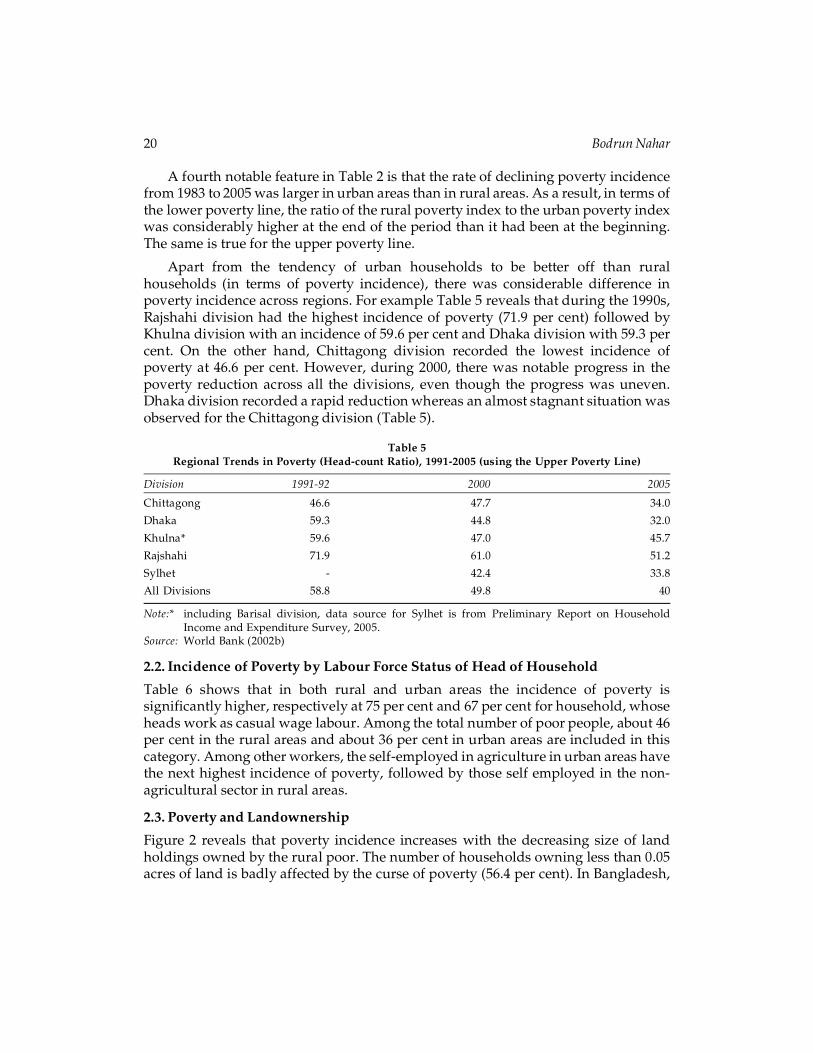
Apart from the tendency of urban households to be better off than ruralhouseholds (in terms of poverty incidence), there was considerable difference inpoverty incidence across regions. For example Table 5 reveals that during the 1990s,Rajshahi division had the highest incidence of poverty (71.9 per cent) followed byKhulna division with an incidence of 59.6 per cent and Dhaka division with 59.3 percent. On the other hand, Chittagong division recorded the lowest incidence ofpoverty at 46.6 per cent. However, during 2000, there was notable progress in thepoverty reduction across all the divisions, even though the progress was uneven.Dhaka division recorded a rapid reduction whereas an almost stagnant situation wasobserved for the Chittagong division (Table 5).
Table 5Regional Trends in Poverty (Head-count Ratio), 1991-2005 (using the Upper Poverty Line)
Division 1991-92 2000 2005
Chittagong 46.6 47.7 34.0
Dhaka 59.3 44.8 32.0
Khulna* 59.6 47.0 45.7
Rajshahi 71.9 61.0 51.2
Sylhet - 42.4 33.8
All Divisions 58.8 49.8 40
Note:* including Barisal division, data source for Sylhet is from Preliminary Report on HouseholdIncome and Expenditure Survey, 2005.
Source: World Bank (2002b)
2.2. Incidence of Poverty by Labour Force Status of Head of Household
Table 6 shows that in both rural and urban areas the incidence of poverty issignificantly higher, respectively at 75 per cent and 67 per cent for household, whoseheads work as casual wage labour. Among the total number of poor people, about 46per cent in the rural areas and about 36 per cent in urban areas are included in thiscategory. Among other workers, the self-employed in agriculture in urban areas havethe next highest incidence of poverty, followed by those self employed in the non-agricultural sector in rural areas.
2.3. Poverty and Landownership
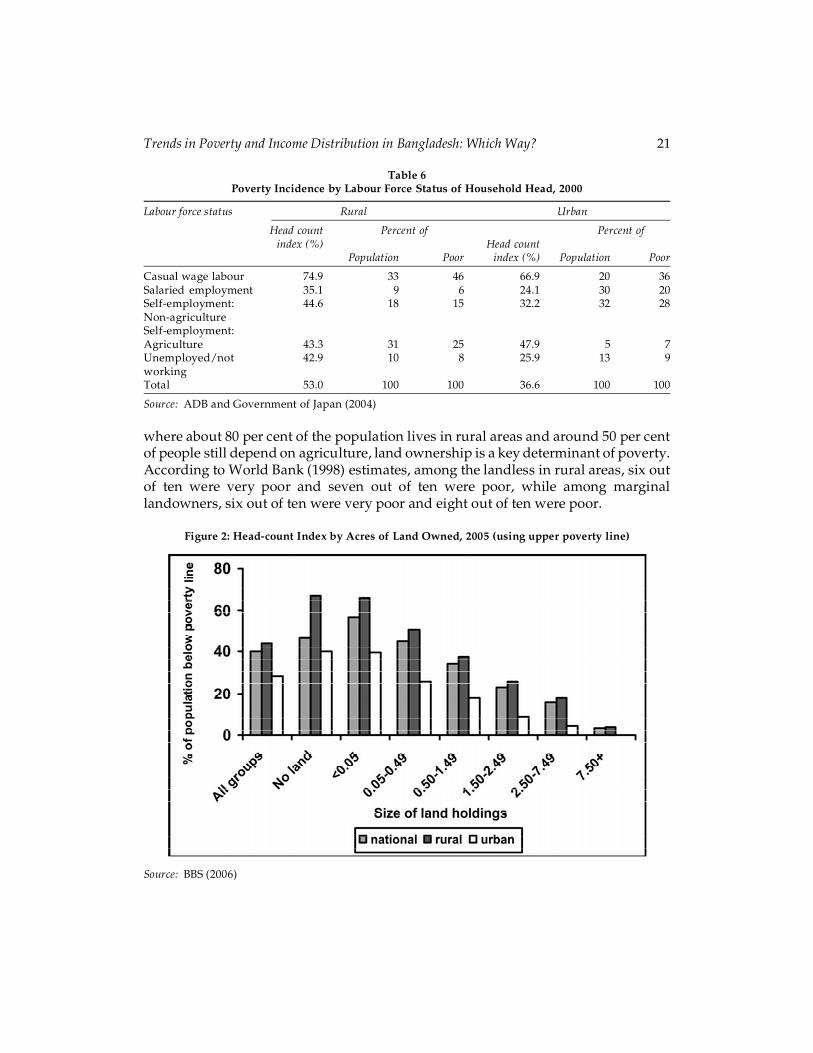
Figure 2 reveals that poverty incidence increases with the decreasing size of landholdings owned by the rural poor. The number of households owning less than 0.05acres of land is badly affected by the curse of poverty (56.4 per cent). In Bangladesh,
Trends in Poverty and Income Distribution in Bangladesh: Which Way? 21
where about 80 per cent of the population lives in rural areas and around 50 per centof people still depend on agriculture, land ownership is a key determinant of poverty.According to World Bank (1998) estimates, among the landless in rural areas, six outof ten were very poor and seven out of ten were poor, while among marginallandowners, six out of ten were very poor and eight out of ten were poor.
Table 6Poverty Incidence by Labour Force Status of Household Head, 2000
Labour force status Rural Urban
Head count Percent of Percent ofindex (%) Head count
Population Poor index (%) Population Poor
Casual wage labour 74.9 33 46 66.9 20 36Salaried employment 35.1 9 6 24.1 30 20Self-employment: 44.6 18 15 32.2 32 28Non-agricultureSelf-employment:Agriculture 43.3 31 25 47.9 5 7Unemployed/not 42.9 10 8 25.9 13 9workingTotal 53.0 100 100 36.6 100 100
Source: ADB and Government of Japan (2004)
Figure 2: Head-count Index by Acres of Land Owned, 2005 (using upper poverty line)
Source: BBS (2006)
22 Bodrun Nahar
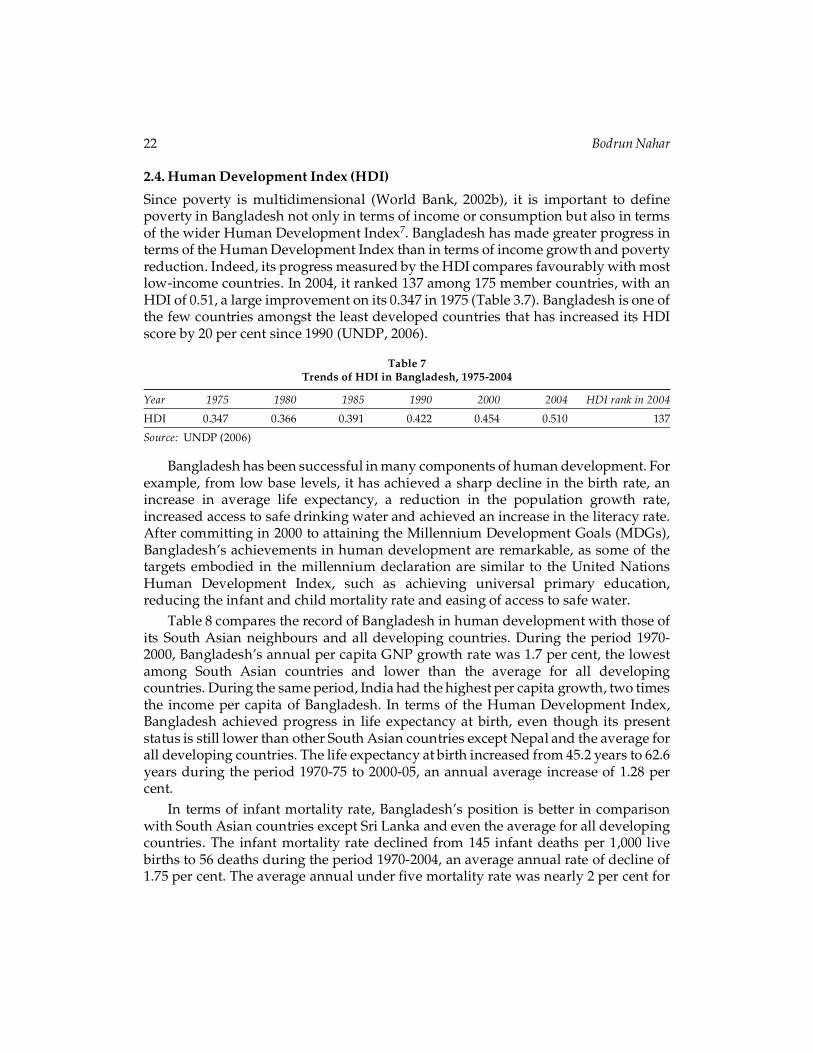
2.4. Human Development Index (HDI)
Since poverty is multidimensional (World Bank, 2002b), it is important to definepoverty in Bangladesh not only in terms of income or consumption but also in termsof the wider Human Development Index7. Bangladesh has made greater progress interms of the Human Development Index than in terms of income growth and povertyreduction. Indeed, its progress measured by the HDI compares favourably with mostlow-income countries. In 2004, it ranked 137 among 175 member countries, with anHDI of 0.51, a large improvement on its 0.347 in 1975 (Table 3.7). Bangladesh is one ofthe few countries amongst the least developed countries that has increased its HDIscore by 20 per cent since 1990 (UNDP, 2006).
Table 7Trends of HDI in Bangladesh, 1975-2004
Year 1975 1980 1985 1990 2000 2004 HDI rank in 2004
HDI 0.347 0.366 0.391 0.422 0.454 0.510 137
Source: UNDP (2006)
Bangladesh has been successful in many components of human development. Forexample, from low base levels, it has achieved a sharp decline in the birth rate, anincrease in average life expectancy, a reduction in the population growth rate,increased access to safe drinking water and achieved an increase in the literacy rate.After committing in 2000 to attaining the Millennium Development Goals (MDGs),Bangladesh’s achievements in human development are remarkable, as some of thetargets embodied in the millennium declaration are similar to the United NationsHuman Development Index, such as achieving universal primary education,reducing the infant and child mortality rate and easing of access to safe water.
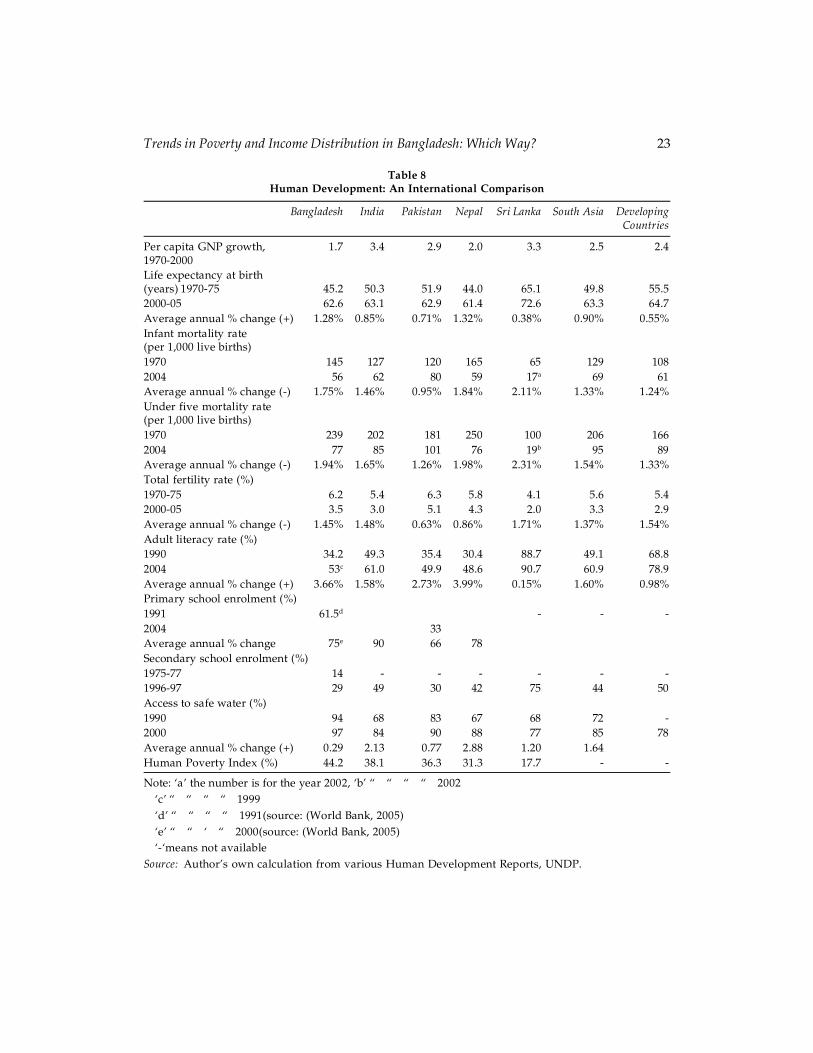
Table 8 compares the record of Bangladesh in human development with those ofits South Asian neighbours and all developing countries. During the period 1970-2000, Bangladesh’s annual per capita GNP growth rate was 1.7 per cent, the lowestamong South Asian countries and lower than the average for all developingcountries. During the same period, India had the highest per capita growth, two timesthe income per capita of Bangladesh. In terms of the Human Development Index,Bangladesh achieved progress in life expectancy at birth, even though its presentstatus is still lower than other South Asian countries except Nepal and the average forall developing countries. The life expectancy at birth increased from 45.2 years to 62.6years during the period 1970-75 to 2000-05, an annual average increase of 1.28 percent.
In terms of infant mortality rate, Bangladesh’s position is better in comparisonwith South Asian countries except Sri Lanka and even the average for all developingcountries. The infant mortality rate declined from 145 infant deaths per 1,000 livebirths to 56 deaths during the period 1970-2004, an average annual rate of decline of1.75 per cent. The average annual under five mortality rate was nearly 2 per cent for
Trends in Poverty and Income Distribution in Bangladesh: Which Way? 23
Table 8Human Development: An International Comparison
Bangladesh India Pakistan Nepal Sri Lanka South Asia DevelopingCountries
Per capita GNP growth, 1.7 3.4 2.9 2.0 3.3 2.5 2.41970-2000Life expectancy at birth(years) 1970-75 45.2 50.3 51.9 44.0 65.1 49.8 55.52000-05 62.6 63.1 62.9 61.4 72.6 63.3 64.7Average annual % change (+) 1.28% 0.85% 0.71% 1.32% 0.38% 0.90% 0.55%Infant mortality rate(per 1,000 live births)1970 145 127 120 165 65 129 1082004 56 62 80 59 17a 69 61Average annual % change (-) 1.75% 1.46% 0.95% 1.84% 2.11% 1.33% 1.24%Under five mortality rate(per 1,000 live births)1970 239 202 181 250 100 206 1662004 77 85 101 76 19b 95 89Average annual % change (-) 1.94% 1.65% 1.26% 1.98% 2.31% 1.54% 1.33%Total fertility rate (%)1970-75 6.2 5.4 6.3 5.8 4.1 5.6 5.42000-05 3.5 3.0 5.1 4.3 2.0 3.3 2.9Average annual % change (-) 1.45% 1.48% 0.63% 0.86% 1.71% 1.37% 1.54%Adult literacy rate (%)1990 34.2 49.3 35.4 30.4 88.7 49.1 68.82004 53c 61.0 49.9 48.6 90.7 60.9 78.9Average annual % change (+) 3.66% 1.58% 2.73% 3.99% 0.15% 1.60% 0.98%Primary school enrolment (%)1991 61.5d - - -2004 33Average annual % change 75e 90 66 78Secondary school enrolment (%)1975-77 14 - - - - - -1996-97 29 49 30 42 75 44 50Access to safe water (%)1990 94 68 83 67 68 72 -2000 97 84 90 88 77 85 78Average annual % change (+) 0.29 2.13 0.77 2.88 1.20 1.64Human Poverty Index (%) 44.2 38.1 36.3 31.3 17.7 - -
Note: ‘a’ the number is for the year 2002, ‘b’ “ “ “ “ 2002‘c’ “ “ “ “ 1999‘d’ “ “ “ “ 1991(source: (World Bank, 2005)‘e’ “ “ ‘ “ 2000(source: (World Bank, 2005)‘-‘means not available
Source: Author’s own calculation from various Human Development Reports, UNDP.
24 Bodrun Nahar
Bangladesh during the period 1970-2004 whereas in the case of South Asia and theaverage for developing countries the rates were 1.54 per cent and 1.36 per centrespectively. Although Bangladesh has made progress with regard to the adultliteracy rate, it seems that in comparison to South Asia and the average fordeveloping countries it has lagged behind. Bangladesh has achieved rapid progress inschooling during the last two decades. The gross primary enrolment rate, which wasonly 61.5 per cent in 1980, increased to 72 per cent by 1990 and 96 per cent by 2000(World Bank, 2005). Access to improved water supply is better in Bangladesh thanother South Asian neighbouring countries and the average for developing countries.However, this success is being threatened by the problem of arsenic contamination ofground water (ADB and Government of Japan, 2004).
3. TRENDS IN INCOME INEQUALITY IN BANGLADESH
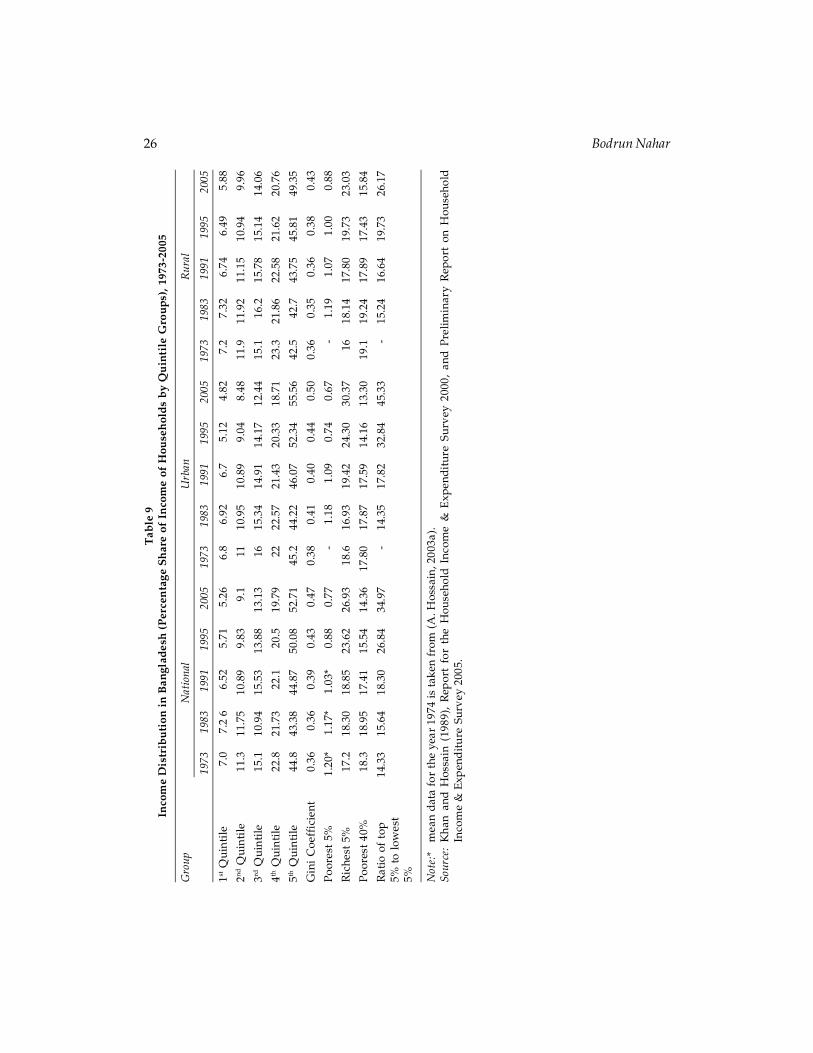
As stated in the previous section, Bangladesh has achieved poverty reduction overthe last decade. Nevertheless the country has the highest incidence of poverty inSouth Asia. About 36 per cent of the population lives below US$1 per day (in 2000)and about 82.8 per cent lives under US$2 per day (World Bank, 2002a). According toKhan (2006), Osmani et al. (2003), Sen et al. (2004), World Bank (2002b) and Wodon(1999), the growing income disparity has offset the potential poverty reducing effectof growth. For instance, according to World Bank (2002b) estimates, had the observedrate of growth during the period between 1991-92 and 2000 been distribution-neutral,poverty would have fallen by 17 percentage points, or almost twice the actualobserved rate. The extent of income inequality in Bangladesh can best be understoodby Table 9. This shows the income shares of segments of the population ranked inascending order of income per household for the years 1973, 1983, 1991, 1995 and2005. Table 9 reveals a clear tendency for the shares of income of the first fourquintiles to decline. For instant, starting from 1983, the income shares of the 1st and2nd quintile declined steadily until 2005. The decrease in the percentage share ofincome is 1.74 percentage points for the first quintile, and 2.2 for the second. In thecase of the third quintile, the percentage share increased by 4.59 in 1991 from the year1983, but after that it declined by 2.4 percentage points between the year 1991 and2005. The fourth quintile also showed the declining trend over the period 1973-2005.The most striking change is in the fifth quintile class, where the share of incomeincreased between 1983 to 2005 by the rate of 9.33 percentage points. In the year 2005,the share of the highest income quintile in total income was 52.71 per cent which wasnearly 10 times higher than the share of the lowest income quintile (Table 9).
Another notable feature is that in 1983, income accruing to the top 5 per cent ofhouseholds increased from 18.30 per cent to 26.93 per cent in 2005, a 47 per centincrease. On the other hand, the share of the lowest 5 per cent declined from 1.17 percent in 1983 to 0.77 per cent in 2005, a 34 per cent decrease. In 2005, the income shareof the highest 5 per cent was thirty five times higher than the share of the lowest 5 percent. Table 9 also reveals that in 2005, the lowest 40 per cent shared only 14.36 per cent
Trends in Poverty and Income Distribution in Bangladesh: Which Way? 25
of total income. Clearly showing that overtime, the rich section of the populationbecame richer while the poor got poorer, as far as income shares are concerned.
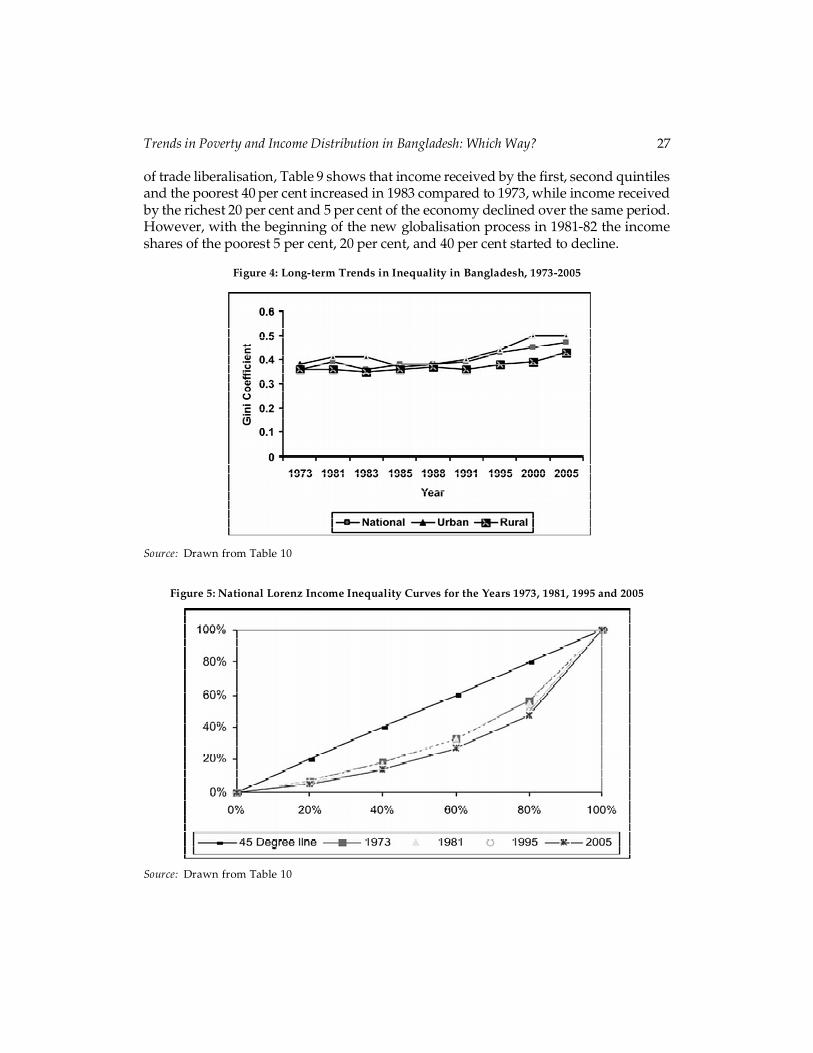
Broadly similar patterns are observed in both rural and urban areas althoughinequality was higher in urban areas than in rural areas. In urban and rural areas theshares of income of the first four quintiles declined gradually from 1983, but the rateof decrease was higher in urban areas compared to rural areas. For instance, in urbanareas between the period 1983 and 2005, the share of income decreased by 2.1percentage points or about 30 per cent for the first quintile, whereas in rural areas thedecline was only 20 per cent between the years 1983-2005. The corresponding figuresfor second, third and fourth quintiles were 2.47, 2.69 and 3.86 percentage points forurban areas and 1.96, 2.14 and 1.1 for rural areas respectively. Furthermore, in ruralareas, the richest/poorest ratio in 2005 was 26.17 compared to 15.24 in 1983. In urbanareas this ratio increased to 45.33 in 2005 from 14.35 in 1983. Furthermore, whereas in1983, the richest quintile’s income share was about 2.47 times higher than the poorest40 percent’s income share in urban areas, it went up to 4.18 times in 2005. Thecorresponding figures for the rural areas were 2.22 and 3.12 respectively. A clearerpicture of increased inequality is obtained from the Gini coefficient8. Figure 4 shows,starting from 1973, the national Gini coefficient increased to 0.39 in 1981 indicating amove towards greater income inequality. However in 1983, it fell to 0.36 whichindicates a reduction in inequality.
During the years 1985 and 1988, income distribution did not vary or remainedstable but the situation has changed in a major way since the early nineties. The Ginicoefficient increased to 0.47 in 2005, from 0.39 in 1991. In the case of urban areas, theGini coefficient rose from 0.38 in 1973 to 0.41 in 1981 and remained stable until 1983and declined thereafter, showing an obvious improvement in income distributionduring the last phase of the 1980s. However, this ratio rose sharply from 0.40 in 1991to 0.44 in 1995 and to 0.50 in 2000 where it remained until 2005. In the case of the ruralareas income inequality remained more or less stable until the year 1991. However,from the year 1995 it increased through to 2005, when it reached 0.43 compared with0.36 in 1991.
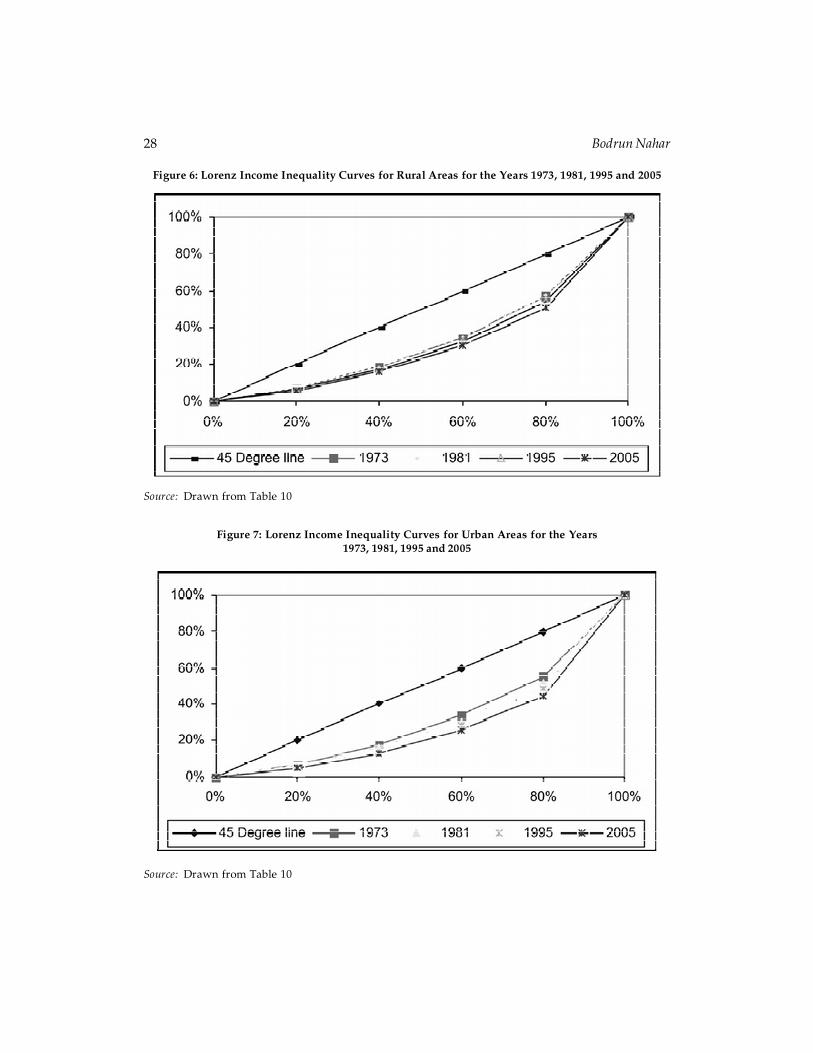
A further perspective on income inequality is provided by the Lorenz curve9 for theyears 1973, 1981, 1995 and 2005 for national, rural and urban areas (Figure 4, 5 and 6). Inthese figures, the 45o line indicates perfect equality in income distribution. The degree ofinequality is measured by how far the Lorenz curve is bowed out from the 45o line. Themore the Lorenz curve bends away from the 45o line of equality, the less equal is thedistribution of income. Thus, from the figures we observe growing inequality across theobservable periods. The deterioration in income equality is greater noticeable duringthe post-liberalisation period compared to the initial phase of trade policy reform. Inaddition, this trend is greater in urban areas in comparison to rural areas.
From the above analysis it is clear that in Bangladesh, inequality worsened duringthe period of policy reform implementation. Taking the year 1983 as the starting point
26 Bodrun NaharT
able
9In
com
e D
istr
ibu
tion
in
Ban
glad
esh
(P
erce
nta
ge S
har
e of
In
com
e of
Hou
seh
old
s b
y Q
uin
tile
Gro
up
s), 1
973-
2005
Gro
upN
atio
nal
Urb
anR
ural
1973
1983
1991
1995
2005
1973
1983
1991
1995
2005
1973
1983
1991
1995
2005
1st Q
uint
ile7.
07.
2 6
6.52
5.71
5.26
6.8
6.92
6.7
5.12
4.82
7.2
7.32
6.74
6.49
5.88
2nd Q
uint
ile11
.311
.75
10.8
99.
839.
111
10.9
510
.89
9.04
8.48
11.9
11.9
211
.15
10.9
49.
96
3rd Q
uint
ile15
.110
.94
15.5
313
.88
13.1
316
15.3
414
.91
14.1
712
.44
15.1
16.2
15.7
815
.14
14.0
6
4th Q
uint
ile22
.821
.73
22.1
20.5
19.7
922
22.5
721
.43
20.3
318
.71
23.3
21.8
622
.58
21.6
220
.76
5th Q
uint
ile44
.843
.38
44.8
750
.08
52.7
145
.244
.22
46.0
752
.34
55.5
642
.542
.743
.75
45.8
149
.35
Gin
i C
oeff
icie
nt0.
360.
360.
390.
430.
470.
380.
410.
400.
440.
500.
360.
350.
360.
380.
43
Poor
est
5%1.
20*
1.17
*1.
03*
0.88
0.77
-1.
181.
090.
740.
67-
1.19
1.07
1.00
0.88
Ric
hest
5%
17.2
18.3
018
.85
23.6
226
.93
18.6
16.9
319
.42
24.3
030
.37
1618
.14
17.8
019
.73
23.0
3
Poor
est
40%
18.3
18.9
517
.41
15.5
414
.36
17.8
017
.87
17.5
914
.16
13.3
019
.119
.24
17.8
917
.43
15.8
4
Rat
io o
f to
p14
.33
15.6
418
.30
26.8
434
.97
-14
.35
17.8
232
.84
45.3
3-
15.2
416
.64
19.7
326
.17
5% t
o lo
wes
t5% N
ote:
*m
ean
data
for
the
year
197
4 is
take
n fr
om (
A. H
ossa
in, 2
003a
).So
urce
:K
han
and
Hos
sain
(19
89),
Rep
ort
for
the
Hou
seho
ld I
ncom
e &
Exp
endi
ture
Sur
vey
2000
, an
d Pr
elim
inar
y R
epor
t on
Hou
seho
ldIn
com
e &
Exp
end
iture
Sur
vey
2005
.
Trends in Poverty and Income Distribution in Bangladesh: Which Way? 27
of trade liberalisation, Table 9 shows that income received by the first, second quintilesand the poorest 40 per cent increased in 1983 compared to 1973, while income receivedby the richest 20 per cent and 5 per cent of the economy declined over the same period.However, with the beginning of the new globalisation process in 1981-82 the incomeshares of the poorest 5 per cent, 20 per cent, and 40 per cent started to decline.
Figure 4: Long-term Trends in Inequality in Bangladesh, 1973-2005
Source: Drawn from Table 10
Figure 5: National Lorenz Income Inequality Curves for the Years 1973, 1981, 1995 and 2005
Source: Drawn from Table 10
28 Bodrun Nahar
Figure 7: Lorenz Income Inequality Curves for Urban Areas for the Years1973, 1981, 1995 and 2005
Figure 6: Lorenz Income Inequality Curves for Rural Areas for the Years 1973, 1981, 1995 and 2005
Source: Drawn from Table 10
Source: Drawn from Table 10
Trends in Poverty and Income Distribution in Bangladesh: Which Way? 29
On the other hand, the income share of the richest 5 per cent, and 20 per centstarted to increase and reached a peak during the same time period (Table 9). As aresult, there emerged a large gap between the highest and lowest income groups. In1983, the income accruing to the top 5 per cent of households was 18.30 per cent whilethe income share of the lowest 5 per cent was 1.17 per cent implying an incomedifferential of 14.41. By 2005, this differential had increased to 35 (26.93:0.77). Thesituation was more severe in urban areas than in rural areas. In rural areas, therichest-poorest ratio in 2005 was 26.17 compared with 15.24 in 1983. In urban areasthis ratio increased to 45.33 in 2005 from 14.35 in 1983 (Table 9). Thus it is clear thattrade liberalisation in Bangladesh did not bring any reduction in income inequality.Rather it was accompanied by increased inequality.
4. LABOUR MARKET DEVELOPMENT IN BANGLADESH
As discussed before, after the initiation of trade liberalisation in Bangladesh, therewere significant improvements in the overall macroeconomic indicators. Whetherthese improvements brought any changes in the creation of new employment is amatter of concern as employment provides the major link between economic growthand a reduction in poverty. Bangladesh’s labour market has experienced a structuralchange during the 1990s and the subsequent years. The share of agriculture andmanufacturing sector in total employment declined whereas the share in serviceincreased. Moreover, the shift of employment was mainly from agriculture to non-agricultural activities especially in services, including construction, trade, transport,hotels and restaurants, and community services (Hossain, A., 2006b). The followingsections discuss overall trends in the labour market and the employment situation inBangladesh for the last three decades.
4.1. Demographic Changes and the Labour Market
Table 10 shows the growth rate of population, labour force and employment duringthe period 1980-2000. It is evident that in Bangladesh the labour force grew at a muchfaster rate than the population. For example, during the period 1981-2000, the civilianlabour force increased from 25.9 million to 45.05 million at an annual average rate of3.69 per cent, while the total population grew from 89.9 million to 126.6 million at anannual average rate of 2.04 per cent (Table 10). The civilian labour force grew at therate of 3.18 per cent and 2.75 per cent during the first and second half of the 1980s;however, during the first and second phase of the 1990s the rate decreased. The size ofthe employed population also registered an increase of by 69 per cent for the period1981-2000 which was much less than the increase in civilian labour force by 73 percent for the same period.
An important change in the structure of employment was the rapid rate of growthin female employment. Male employment grew from 23.9 million in 1981 to 31.1million in 1990-2000 at an annual average rate of 3.88 per cent. Over the same periodfemale employment grew at an average annual rate of 8.26 per cent (Table 10).
30 Bodrun Nahar
Table 10Size and Structure of the Labour Force in Bangladesh, 1981-2000
Year (mid) Population Civillian labour Employed population (million)(million) force (million) Male Female Total
1981 89.9 25.9 23.9 1.4 25.31983 93.3 29 25.55 2.43 27.981984 95.3 29.5 26.43 2.55 28.981985 97.4 30.80 - - -1989 106.2 33.40 29.40 3.30 32.401990 108.6 35.9 30.44 4.47 34.911995 119.3 41.73 33.16 7.15 40.312000 126.6 45.05 33.67 9.15 42.82
Sources:Khan and Hossain (1989), Mujeri (2004)
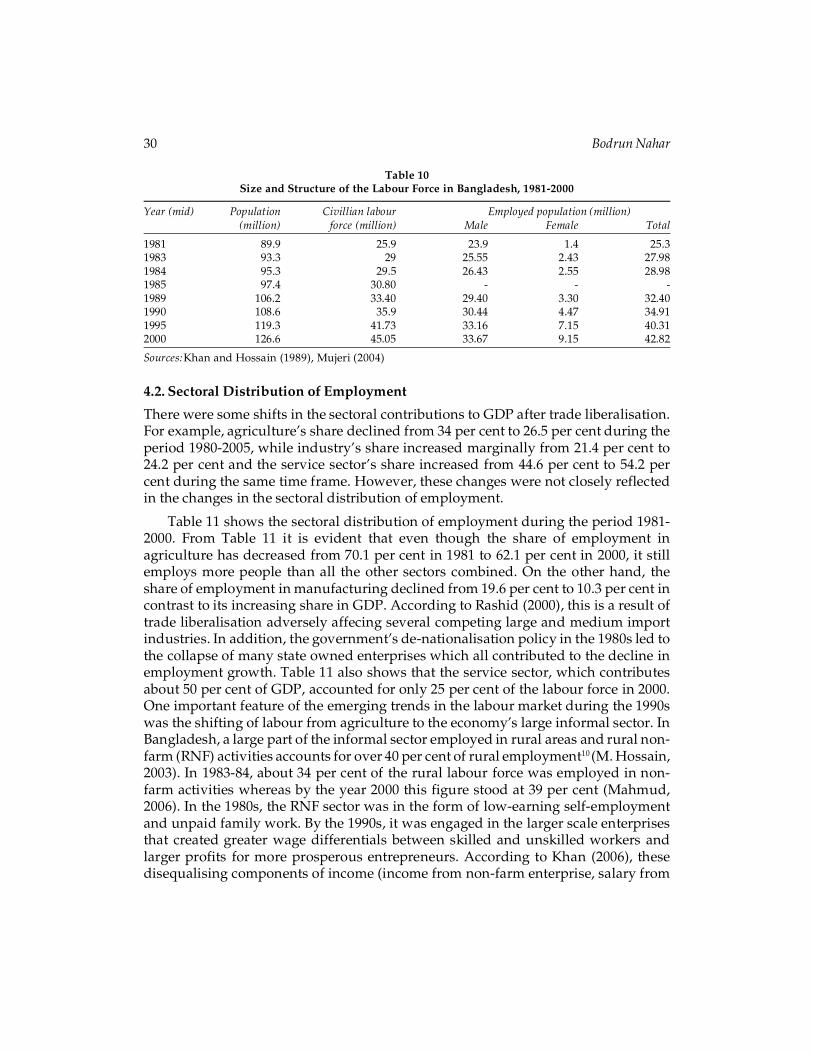
4.2. Sectoral Distribution of Employment
There were some shifts in the sectoral contributions to GDP after trade liberalisation.For example, agriculture’s share declined from 34 per cent to 26.5 per cent during theperiod 1980-2005, while industry’s share increased marginally from 21.4 per cent to24.2 per cent and the service sector’s share increased from 44.6 per cent to 54.2 percent during the same time frame. However, these changes were not closely reflectedin the changes in the sectoral distribution of employment.
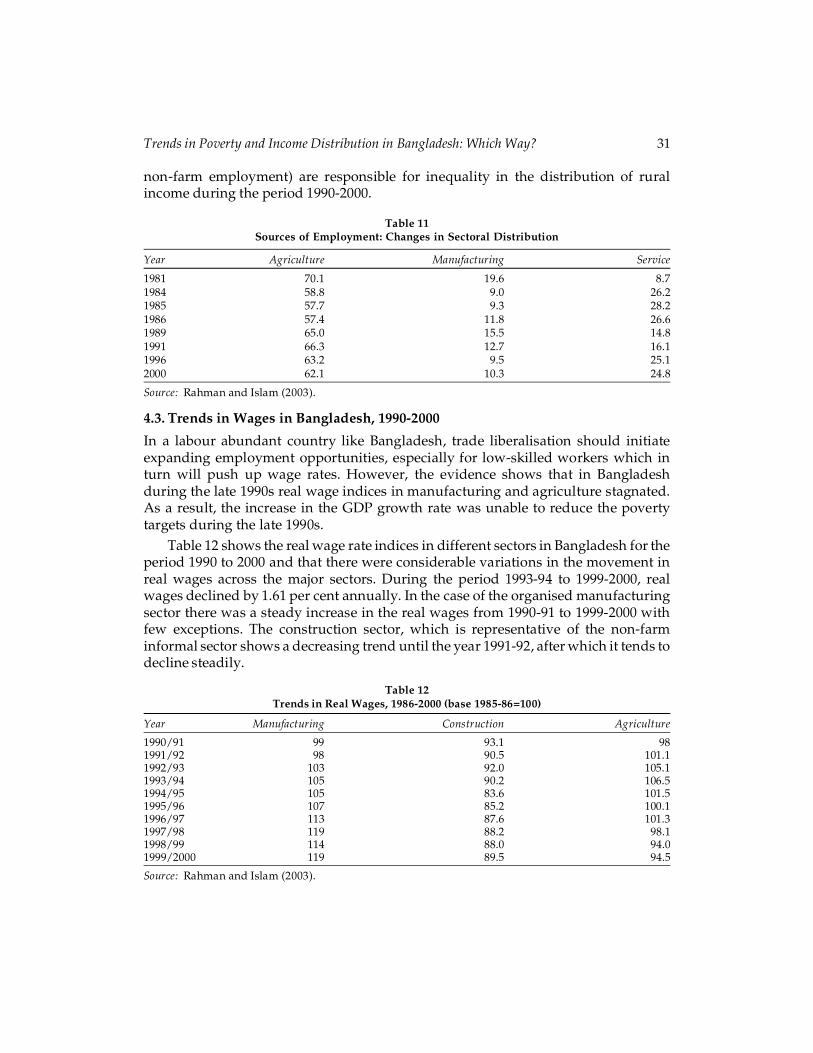
Table 11 shows the sectoral distribution of employment during the period 1981-2000. From Table 11 it is evident that even though the share of employment inagriculture has decreased from 70.1 per cent in 1981 to 62.1 per cent in 2000, it stillemploys more people than all the other sectors combined. On the other hand, theshare of employment in manufacturing declined from 19.6 per cent to 10.3 per cent incontrast to its increasing share in GDP. According to Rashid (2000), this is a result oftrade liberalisation adversely affecing several competing large and medium importindustries. In addition, the government’s de-nationalisation policy in the 1980s led tothe collapse of many state owned enterprises which all contributed to the decline inemployment growth. Table 11 also shows that the service sector, which contributesabout 50 per cent of GDP, accounted for only 25 per cent of the labour force in 2000.One important feature of the emerging trends in the labour market during the 1990swas the shifting of labour from agriculture to the economy’s large informal sector. InBangladesh, a large part of the informal sector employed in rural areas and rural non-farm (RNF) activities accounts for over 40 per cent of rural employment10 (M. Hossain,2003). In 1983-84, about 34 per cent of the rural labour force was employed in non-farm activities whereas by the year 2000 this figure stood at 39 per cent (Mahmud,2006). In the 1980s, the RNF sector was in the form of low-earning self-employmentand unpaid family work. By the 1990s, it was engaged in the larger scale enterprisesthat created greater wage differentials between skilled and unskilled workers andlarger profits for more prosperous entrepreneurs. According to Khan (2006), thesedisequalising components of income (income from non-farm enterprise, salary from
Trends in Poverty and Income Distribution in Bangladesh: Which Way? 31
non-farm employment) are responsible for inequality in the distribution of ruralincome during the period 1990-2000.
Table 11Sources of Employment: Changes in Sectoral Distribution
Year Agriculture Manufacturing Service
1981 70.1 19.6 8.71984 58.8 9.0 26.21985 57.7 9.3 28.21986 57.4 11.8 26.61989 65.0 15.5 14.81991 66.3 12.7 16.11996 63.2 9.5 25.12000 62.1 10.3 24.8
Source: Rahman and Islam (2003).
4.3. Trends in Wages in Bangladesh, 1990-2000
In a labour abundant country like Bangladesh, trade liberalisation should initiateexpanding employment opportunities, especially for low-skilled workers which inturn will push up wage rates. However, the evidence shows that in Bangladeshduring the late 1990s real wage indices in manufacturing and agriculture stagnated.As a result, the increase in the GDP growth rate was unable to reduce the povertytargets during the late 1990s.
Table 12 shows the real wage rate indices in different sectors in Bangladesh for theperiod 1990 to 2000 and that there were considerable variations in the movement inreal wages across the major sectors. During the period 1993-94 to 1999-2000, realwages declined by 1.61 per cent annually. In the case of the organised manufacturingsector there was a steady increase in the real wages from 1990-91 to 1999-2000 withfew exceptions. The construction sector, which is representative of the non-farminformal sector shows a decreasing trend until the year 1991-92, after which it tends todecline steadily.
Table 12Trends in Real Wages, 1986-2000 (base 1985-86=100)
Year Manufacturing Construction Agriculture
1990/91 99 93.1 981991/92 98 90.5 101.11992/93 103 92.0 105.11993/94 105 90.2 106.51994/95 105 83.6 101.51995/96 107 85.2 100.11996/97 113 87.6 101.31997/98 119 88.2 98.11998/99 114 88.0 94.01999/2000 119 89.5 94.5
Source: Rahman and Islam (2003).
32 Bodrun Nahar
During the period 199-91 to 1999-2000, the real wage index for constructiondeclined by 0.38 per cent. Thus, the trends in real wages in the agriculture andconstruction sectors imply that acceleration in GDP growth of these sectors did notcontribute much to raising real wages11.
5. CONCLUDING REMARKS
This paper provided an overview of the relationship between trade liberalisation,poverty, inequality and labour market developments in Bangladesh during the last fewdecades. It has been found that in Bangladesh the incidence of poverty declined,measured both by lower and upper poverty lines and the rate of reduction was faster inthe post-reform period compared to the pre/initial-reform period. However, thedecrease in poverty was greater in urban areas than in rural areas. Along with these,income inequality measured in terms of quintile shares of income, Gini coefficients andLorenz curves all indicate a positive trend during these periods. It was also observedthat existing inequality was aggravated during the policy reform implementationperiod. In addition, deterioration in the income inequality situation was found to bemore severe in urban areas. An analysis of labour force trends and the distribution ofemployment by sectors show that during the extensive trade liberalisation period (inthe 1990s) there was a deceleration in the rates of employment in both the agricultureand manufacturing sectors. However, the bulk of employment generation during the1990s was in the informal sector. Increases in real wages also did not match with thegrowth performance of major sectors. These observed phenomenons in terms ofpoverty, inequality, and the labour market in Bangladesh has led to a surge in studiesthat directly assess the impact on poor household groups of trade liberalisation policies.This also calls for public policy orientation towards more equitable and pro-pooreconomic growth. Government poverty reduction strategy has to prepare such that itemphasizes equitable distribution and also accelerate agricultural growth asagricultural growth has more equalizing effect. In addition, steps have to be taken toensure access of poor households to productive employment.
Notes
1. Head-count ratio is the most common measure of poverty, and is the proportion of thepoor in the total population.
2. Minimum consumption bundle estimated for an average Bangladeshi population contains832 gm of food consisting of 437 gm of cereals, 175gm of vegetables, 40gm of pulses, 58gmof milk, 48gm of fish and 12gm of meat. It corresponds to an average per capita dailyintake of 2,112 calories and 58gm of protein.
3. By this method, poverty lines are set by computing the level of consumption or income atwhich households are expected to satisfy the normative nutritional requirement (Wodon,1997).
4. ‘Lower nonfood allowance’ was estimated by taking the median amount spent fornonfood items by a group of households whose per capita total expenditure was close to
Trends in Poverty and Income Distribution in Bangladesh: Which Way? 33
the food poverty line. Similarly, for estimating ‘upper nonfood allowance’, the medianamount spent for nonfood items by a group of households whose per capita foodexpenditure was close to food poverty line (BBS, 2006) was taken.
5. Concurrently there are other poverty measures (for example, Osmani, et al. (2003) and Sen,et al. (2004). However, this paper has reported the WB/BBS results.
6. The Human Development Index (HDI) is a composite index that measures the averageachievements in a country in four basic dimensions of human development, such as lifeexpectancy at birth, adult literacy rate, the combined gross enrolment ratio for primary,secondary and tertiary schools, and gross domestic product per capita measured in termsof purchasing power parity.
7. The Gini coefficient measures the extent to which the distribution of income orconsumption expenditures among individuals or households within an economy deviatesfrom a perfectly equal distribution. It ranges from 0 (perfect equality) to 1 (all incomeaccrues to one household).
8. The Lorenz curve is a graphical representation of the cumulative distribution function. Byplotting the cumulative percentage of population on the horizontal axis whilst plotting thecumulative percentage of income along the vertical axis, the Lorenz curve is drawn. It iscompared with the perfect equality line that is at an angle of 45 degrees. The further theLorenz curve lies below the line of equality, the more unequal is the distribution ofincome.
9. According to M. Hossain (2003), RNF activities are classified into three categories: 1)manual labour based –includes self-employed subsistence oriented cottage industries,wage employment in rural business enterprise, transport operation and constructionlabour; 2) human capital based occupation-includes salaried service in public and privateorganisations, teachers and various types of personal services; and 3) physical and humancapital intensive activities-includes commercial type rural industries, for example, agro-processing, shop-keeping, peddling, petty trading and contractor services.
10. There is substantial discrepancy in the results for the trends in real wages. The reason liesin the use of different deflators in calculation. See Salmon (2002) and Sen & Hulme (2006)for comparison.
References
ADB and Government of Japan (2004), Economic Growth and Poverty Reduction in Bangladesh.Dhaka: Copublished by the Asian Development Bank Bangladesh Resident Mission andthe Embassy of Japan in Bangladesh.
Ahmed, A. U., Khan, H. A., & Sampath, R. K. (1991), Poverty in Bangladesh: Measurement,Decomposition, and Intertemporal Comparison. Journal of Development Studies, 27(4), 48-63.
Annabi, N., Khondker, B., Raihan, S., Cockburn, J., & Decaluwe, B. (2006), Implications ofWTO Aggrements and Unilateral Trade Policy Reforms for Poverty in Bangladesh: Short-versus Long-run Impacts. In T. W. Hertel & L. A. Winters (Eds.), Poverty & The WTO:Impacts of the Doha Development Agenda. Washington: A copublication of PalgraveMacmillan and the World Bank.
BBS (1988), Report of the Bangladesh Household Expenditure Survey 1985-86. BangladeshBureau of Statistics (BBS), Dhaka.
34 Bodrun Nahar
BBS (2006), Preliminary Report on Household Income and Expenditure Survey-2005. Dhaka:Bangladesh Bureau of Statistics, Planning Division, Ministry of Planning, Government ofthe People’s Republic of Bangladesh.
Hossain, A. (2003a), Trade Liberalisation and Economic Performance: Analytics and Empirics fromBangladesh. Unpublished Ph.D Dissertation, The University of Queensland.
Hossain, A.(2006b), Overview of the Bangladesh Economy. In A.Hossain, F.Khan & T. Akram(Eds.), Economic Analyses of Contemporary Issues in Bnagladesh, Dhaka: The UniversityPress Limited.
Hossain, M. (2003), Promoting Rural Non-farm Economy of Bangladesh. CPD-IRRI Policy Brief-3, available at http://www.cpd-bangladesh.org/publications/cpdiri/cpdiri_3.pdf , accessed onApril, 2006.
Hossain, M., & Sen, B. (1992), Rural Poverty in Bangladesh: Trends and Determinants. AsianDevelopment Review, 10(1), 1-34.
IMF (2005), Bangladesh: Poverty Reduction Strategy Paper: International Monetary Fund, IMFCountry Report No. 05/410.
Islam, I., & Khan, H. (1986), Income Inequality, Poverty and Socio-economic Development inBangladesh: An Empirical Investigation. The Bangladesh Development Studies, 14(2), 75-92.
Khan, A. R. (1990), Poverty in Bangladesh: A Consequences of and a Constraint on Growth.The Bangladesh Development Studies, 18(3), 19-33.
Khan, A. R. (2006), Rising Inequality in Bangladesh: An Analysis of Sources and Policies forContainment. In S. Ahmed & W. Mahmud (Eds.), Growth and Poverty: The DevelopmentExperience of Bangladesh. Dhaka: The University Press Limited.
Khan, A. R., & Hossain, M. (1989), The Strategy of Development in Bangladesh. London: TheMacmillan Press Ltd.
Khundker, N., Mahmud, M., Sen, B., & Ahmed, M. N. (1994), Urban Poverty in Bangladesh:Trends, Determinants and Policy Issues. Asian Development Review, 12(1), 1-31.
Mahmud, W. (2006), Employment, Incomes and Poverty. In S. Ahmed & W. Mahmud (Eds.),Growth and Poverty: The Development Experience of Bangladesh. Dhaka: The University PressLimited.
Mujeri, M. K. (2004), Bangladesh Decent Work Statistical Indicators: A Fact-finding Study.Decent Work Pilot Progarm, National Policy Group, International Labour Organisation, availableat http://www.ilo.org/public/english/bureau/dwpp/countries/Bangladesh/index.htm, accessed onAugust, 2007.
Osmani, S. R. (1990), Structural Change and Poverty in Bangladesh: The Case of a FalseTurning Point. The Bangladesh Development Studies, 18(3), 55-74.
Osmani, S. R., Mahmud, W., Sen, B., Dagdeviren, H., & Seth, A. (2003), The Macroeconomics ofPoverty Reduction: The Case Study of Bangladesh: The Asia-Pacific Regional Programme onMacroeconomics of Poverty Reduction, United Nations Development Programme,Dhaka, Bangladesh.
Rahman, A., & Haque, T. (1988), Poverty and Inequality in Bangladesh in the Eighties: AnAnalysis of Some Recent Evidence Research Report No. 91, Bangladesh Institute ofDevelopment Studies.
Trends in Poverty and Income Distribution in Bangladesh: Which Way? 35
Rahman, R. I., & Islam, K. M. N. (2003), Employment Poverty Linkages: Bangladesh. Issues inEmployment and Poverty, Recovery and Reconstruction Department, International Labour Office,Geneva., Discussion Paper No.10.
Rashid, M. A. (2000), Impact of Trade Policy Reforms on Industrial Capacity and Employment inBangladesh: Report Prepared for Structural Adjustment Participatory Review Initiative(SAPRI) and Presented at the Second National Forum on 13-15 March, 2001 in Dhaka,Bangladesh.
Ravallion, M., & Sen, B. (1996), When Method Matters: Monitoring Poverty in Bangladesh.Economic Development and Cultural Change, 44(4), 761-792.
Salmon, C. (2002), Performance of the Bangladesh Labour Market during the Nineties. Mimeo,Background Paper for the Asian Development Bank and the World Bank, Manilla and WashingtonD.C.
Sen, B., & Hulme, D. (2006), Chronic Poverty in Bangladesh: Tales of Ascent, Descent, Marginalityand Persistence. Dhaka: Bangladesh Institute of Development Studies (BIDS) and ChronicPoverty Research Centre (CPRC), University of Manchester, Manchester, UK.
Sen, B., Mujeri, K., & Shahabuddin, Q. (2004), Operationalizing Pro-poor Growth: Bangladeshas a Case Study. available at http://siteresources.worldbank.org/INTPGI/Resources/342674-1115051237044/oppgbangladesh(Nov).pdf. accessed on August, 2007.
UNDP (2006), Human Development Report 2006: Oxford University Press for the United NationsDevelopment Program.
Wodon, Q. T. (1997), Food and Energy Intake and Cost of Basic Needs: Measuring Poverty inBangladesh. Journal of Development Studies, 34(2), 66-101.
Wodon, Q. T. (1999), Microdeterminants of Consumption, Poverty, Growth, and Inequality inBangladesh. Policy Research Working Paper No. 2076, Poverty Reduction and EconomicManagement Sector Unit, South Asia Region, The World Bank.
World Bank (1987), Bangladesh: Promoting Higher Growth and Human Development. WorldBank Country Study.
World Bank (1998), Bangladesh: From Counting the Poor to Making the Poor Count. Report No.17534-BD, Poverty Reduction and Economic Management Network, South Asia Region, TheWorld Bank.
World Bank (2002a), 2002 World Development Indicators. Washington, D.C: The World Bank.World Bank (2002b), Poverty in Bangladesh: Building on Progress. Poverty Reduction and
Economic Management Sector Unit, South Asia Region, The World Bank, Report No. 24299-BD.World Bank (2005), Attaining the Millennium Development Goals in Bangladesh. Dhaka: Human
Development Unit, South Asia Region, The World Bank.World Bank (2007), Bangladesh and Nigeria Development Indicators Database. http://
www.devdata.worldbank.org/external/cpprofite.asp. accessed on January, 2007.