Embed Size (px)
Citation preview

Hoofdstuktitel 3
2015
Trends inthe Caribbean Netherlands

the Caribbean NetherlandsTrends in
2015

Publisher Statistics Netherlands Henri Faasdreef 312, 2492 JP The Hague www.cbs.nl Bulevar Gobernador Nicolaas Debrot # 67 unit 203 Kralendijk, Bonaire Telephone +599 7 178 676 Prepress: Statistics Netherlands, Studio BCO Printed by: Tuijtel, Hardinxveld-Giessendam Information Telephone +31 88 570 70 70 Via contact form: www.cbs.nl/infoservice Where to order Obtainable via www.cbs.nl Price: € 10.00 (excluding postage) ISBN 978-90-357-1577-6 ISSN 2467-9569 © Statistics Netherlands, The Hague/Heerlen/Bonaire 2015. Reproduction is permitted, provided Statistics Netherlands is quoted as the source.
Explanation of symbols
Empty cell Figure not applicable
. Figure is unknown, insufficiently reliable or confidential
* Provisional figure
** Revised provisional figure
2014–2015 2014 to 2015 inclusive
2014/2015 Average for 2014 to 2015 inclusive
2014/’15 Crop year, financial year, school year, etc.,beginning in 2014 and ending in 2015
2012/’13– 2014/’15 Crop year, financial year, etc., 2012/’13 to 2014/’15 inclusive
Due to rounding, some totals may not correspond to the sum of the separate figures.

Foreword 3
ForewordSince 10 October 2010, Statistics Netherlands has been responsible for the production and publication of statistics for the Caribbean Netherlands: Bonaire, St Eustatius and Saba. Trends in the Caribbean Netherlands 2015 gives a statistical overview of the Caribbean Netherlands, presented in a new format. It presents figures on some major aspects of society on the islands and gives a brief impression of population, education, justice and security, prices and more. This edition also presents some additional elaborated information on labour, macroeconomics and pays special attention to important statistical developments on the three islands after 10 October 2010. The new figures from the
Labour Force Survey 2014 and Tourism Satellite Account Bonaire are included. All statistics can be found on Statline, Statistics Netherlands’ online database. For more information on the Caribbean Netherlands, visit our website: www.cbs.nl. You can also stay up to date with the latest news and information by checking and liking our Facebook page, www.facebook.com/statistiekcbs.cn and our tweets at Twitter.com/statisticscbs.
Director General,Dr. T.B.P.M. Tjin-A-Tsoi
The Hague/Heerlen/Bonaire, October 2015

Introduction 7
1 Corporate information 9
2 Bonaire 13Climate 15
Education 16
Energy 17
Health and Welfare 18
Household amenities 20
Income 22
International trade 25
Labour 27
Macroeconomics 33
Population 36
Prices 39
Security and Justice 43
Social Security 45
Traffic, Transport & Tourism 46
3 Saba 53Education 55
Energy 56
Health and Welfare 57
Household amenities 59
Income 61
International trade 63
Labour 63
Population 69
Prices 72
Security and Justice 75
Social Security 77
Traffic, Transport & Tourism 78
Contents
Contents 5

6 Trends in the Caribbean Netherlands 2015
4 St Eustatius 83Education 85
Energy 86
Health and Welfare 87
Household amenities 89
Income 91
International trade 94
Labour 95
Macroeconomics 100
Population 100
Prices 103
Security and Justice 106
Social security 108
Traffic, Transport & Tourism 109

Introduction 7
IntroductionMuch has been accomplished since 10 October 2010, when Statistics Netherlands started collecting statistical information about the islands of the Caribbean Netherlands. This edition presents the latest statistical information on developments in the Caribbean Netherlands. It deals with many subjects and provides additional information in its new format and size compared to the earlier editions of 2012, 2013 and 2014. The growing demand for new statistics by the government has led to a large increase in available data. Apart from our regular statistical programme, Statistics Netherlands now also provides statistics for externally financed projects on national accounts, income statistics, labour and wage statistics.
This edition includes data on incoming tourists via airports, international trade, inflation, Gross Domestic Product (GDP) for all islands and the added value of tourism for the GDP of Bonaire.

8 Trends in the Caribbean Netherlands 2015
98,500followers on Twitter
3,600datasets in StatLine
50videos on CBS-YouTube
CBS online 2015

Corporate information 9
1. Corporate informationStatLine App and Open data portalStatistics Netherlands is changing drastically, which has resulted in several new products. A great deal has happened in 2014, such as the launch of the Open Data portal, which makes all 3,600 data collections from the StatLine database freely available as open data. There is also a Web App available for StatLine on the basis of open data. This application shows all StatLine tables as graphs or maps. Two simple clicks and users can get a graph on their devices. The app can of course also show the figures in tables. The app is easy to use, also for people who are new to StatLine. These products can be accessed at www.cbs.nl.
CBS in your neighbourhoodIn April 2015 Statistics Netherlands launched a new version of CBSinuwbuurt.nl showing maps with figures on 75 characteristics of neighbourhoods and their residents.

10 Trends in the Caribbean Netherlands 2015
Corporate news web appStatistics Netherlands now publishes up-to-date articles about new services, new products, international developments and CBS events at corporate.cbs.nl.The web app CBS Corporate nieuws is made for the external contacts of Statistics Netherlands, including enterprises, government, journalists, students and everyone else who is interested in news about Statistics Netherlands. The articles can easily be filtered and searched, and can just as easily be shared via Facebook, Twitter and LinkedIn. Director General Tjark Tjin-A-Tsoi is enthusiastic about this new product: ‘For seven years we had a paper magazine for our external contacts, which was published once every quarter in 2,500 copies. This has become obsolete by the fast new ways of publishing. So we now have a modern user-friendly web app that gives everyone easy access to the news about Statistics Netherlands on their devices.’
CBS and social mediaStatistics Netherlands makes its figures even more accessible by using social media. Everyone who wants to have the latest figures available can follow Statistics Netherlands on Twitter and

Corporate information 11
Facebook. Via @statistiekcbs and @statisticscbs Statistics Netherlands tweets its news, its latest figures and interesting facts. The number of followers had increased to about 98,000 by June 2015. Recently a Facebook page focusing exclusively on the Caribbean Netherlands has been launched because of the use of Facebook in Caribbean Netherlands. This Facebook page can be accessed at www.facebook.com/statistiekcbs.cn. The YouTube channel youtube.com/statistiekcbs shows about 50 videos explaining statistical concepts such as inflation, social developments such as the greying of the population, explanations about publications and recorded press conferences.
CBS Caribbean NetherlandsOn 10-10-2010 the Bonaire office of Statistics Netherlands was opened. The Bonaire office is responsible for all statistics referring to the three islands of the Caribbean Netherlands: Bonaire, St Eustatius and Saba, compiling statistics about prices, population, labour, income, the economy, tourism and trade.

12 Trends in the Caribbean Netherlands 2015 2 Trends in Nederland 2015
Bonaire
18,905inhabitants
80%Dutch nationality
64%Papiamento fi rst language

Bonaire 13
2. BonaireBonaire is one of the ABC islands of the Lesser Antilles, 70 km off the coast of Venezuela. The average temperature is 28.0 C and with an average wind speed of 7.3 m/s there is always wind. Rainfall in 2014 came to 322 mm. November was the month with the most precipitation (180mm). Some 18.9 thousand people live on the island, which has an area of 288 km2 and a population density of 65. The population has increased by 3,082 people since January 2011, a population increase of 19 percent in four years. The number of women grew faster than the number of men, 22 and 17 percent respectively. However, 52 percent of the population on Bonaire are men. The labour force is 10.6 thousand strong. A little under 10 thousand people are employed, a little under 700 are unemployed. Almost 69 percent of the population aged 15–74 years are working. About 80 percent of the population have the Dutch nationality. Most inhabitants – 58 percent – were born on the former Netherlands Antilles or Aruba, 14 percent was born in the European part of the Netherlands
and 20 percent was born in South or Central America. Papiamento is the most widely spoken language: two thirds of the population indicate that it is their first language. Dutch is the first language of 15 percent of the population on Bonaire. Also multilingualism is most common on Bonaire, 90 percent of the population speak more than one language. About 88 percent of inhabitants on Bonaire aged 15 years and older have a religious denomination. On Bonaire almost seven in ten inhabitants are Roman Catholics. Just under 7 percent are Pentecostals and nearly 5 percent Evangelical.In 2012 the Gross Domestic Product (GDP) of Bonaire was 372 million US dollar. The government, real estate and financial services sector are the most important economic sectors on Bonaire. The government contributed 17.5 percent to GDP, real estate 17.9 percent and the financial services sector 10.4 percent.

14 Trends in the Caribbean Netherlands 2015
162,800passengers
130,000tourists
Passengers arriving by air on Bonaire in 2014

Bonaire 15
2.1 Climate, 2014
Temperature Wind speedRelative
humidity Precipitation
ºC m/s % mm
Month
January 26 .4 7 .5 78 .6 79 .7
February 26 .6 7 .4 78 .1 5 .3
March 27 .0 7 .0 74 .4 2 .2
April 27 .5 8 .6 75 .0 0 .9
May 27 .7 7 .9 75 .3 1 .1
June 28 .5 8 .7 75 .2 8 .7
July 28 .4 8 .2 76 .5 2 .8
August 28 .9 6 .8 75 .1 6 .9
September 29 .3 7 .0 74 .3 7 .1
October 29 .4 5 .9 73 .7 3 .1
November 28 .2 5 .8 78 .6 180 .1
December 27 .7 6 .2 76 .5 24 .4
Year 28 .0 7 .3 75 .9 322 .2
Source: Royal Netherlands Meteorological Institute.
2.3 Wind speed, 2013–2014
Source: Royal Netherlands Meteorological Institute.
4
5
6
7
8
9
NovSepJulMayMarJanNovSepJulMayMarJan
Average wind speedWind speed
m/s
Climate 2.2 Monthly temperature, 2013–2014
0
26
27
28
29
30
NovSepJulMayMarJanNovSepJulMayMarJan
Average year temperatureTemperature
Source: Royal Netherlands Meteorological Institute.
ºC

16 Trends in the Caribbean Netherlands 2015
2.4 Government funded schools, 2014/'15*
Primary education 7
Secondary education including senior secondary vocational education 1
Source: OCW-unit Bonaire.
2.5 Pupils in government funded schools, 1 October
2011/'12 2012/'13 2013/'14 2014/'15*
Primary education 1,650 1,632 1,687 1,727
Secondary education 1,039 1,102 1,145 1,147
Secondary vocational education 340 388 505 614
Total 3,029 3,122 3,337 3,488
2.6 Pupils in secondary and secondary vocational government funded schools
2010/'11 2011/'12 2012/'13 2013/'14 2014/'15*
Secondary Vocational (bbl) 36 45 96 141 127
Secondary Vocational (bol) 180 295 292 364 487
Students in secondary education 1,078 1,039 1,102 1,145 1,147
Total 1,294 1,379 1,490 1,650 1,761
2.7 Pupils in government funded schools, 1 October 2014
Secondary vocational education
Secondary education
Primary education
49%
33%
18%
Education

Bonaire 17
2.8 Pupils in primary education on government funded schools
2012/'13 2013/'14 2014/'15*
4 years and younger 191 204 209
5 yrs 189 204 221
6 yrs 188 192 220
7 yrs 193 209 197
8 yrs 187 197 209
9 yrs 196 186 203
10 yrs 194 198 198
11 yrs 215 211 191
12 yrs 67 77 72
13 yrs 12 9 7
Total primary education 1,632 1,687 1,727
209 pupils aged under 5 in
government funded primary education
Aa
Energy
2.9 Power cuts
2010 2011 2012 2013 2014
Number of power cuts
Total 14 22 36 24 25
<1 hour 1 4 3 7 8
1–2 hours 5 7 11 6 8
2–5 hours 8 8 15 9 7
>5 hours 0 3 7 2 2
Hours
Total length 29 65 141 52 57
Average length 2 .1 2 .9 3 .9 2 .2 2 .3
2.10 Water production
0
1,100
1,200
1,300
1,400
1,500
1,600
20142013201220112010200920082007
1,000 m3

18 Trends in the Caribbean Netherlands 2015
2.11 Electricity production
0
20
40
60
80
100
120
20142013201220112010200920082007
Renewable energyFossil fuel
mln kWh
2.12 Contact with medical professionals, 2013
Persons with at least 1 contact
Average number of contacts (patient)
%
Contact with GP in the last 12 months 78 .1 10 .1
Contact with medical specialist in the last 12 months 40 .0 7 .4
Contact with dentist in the last 12 months 56 .2 7 .4
Health and Welfare
12% more electricity generated
from wind on Bonaire in 2014
Bb
2.13 Percentage of population who are underweight and overweight, 2013
Seriously overweight
Moderately overweight
Overweight
Normal weight
Underweight1%
23%
38%
16%
22%

Bonaire 19
2.15 Percentage of population who are satis�ed with life, 2013
Satisfied
Not satisfied, not dissatisfied
Dissatisfied4%
16%
80%
2.16 Percentage of population who feel happy, 2013
Happy
Not happy, not unhappy
Unhappy2%
13%
87%
80% of the population of
Bonaire are satisfied with life
Gg
2.14 Percentage of population who su�er from chronic disorders, 2013
0
10
20
30
40
50
% with 3 or more chronic disorders
% with 2 chronic disorders
% with 1 chronic disorder
% without chronic disorder

20 Trends in the Caribbean Netherlands 2015
2.19 Water supply, 2013
%1)
Waterworks 98 .7
Cistern or well 1 .1
Water truck 0 .7
1) The sum may be more than 100%, as households may have more than one source of water.
2.20 Fuel used most for cooking, 2013
%
Gas 95 .1
Electricity 4 .6
2.17 Appliances in the home, 2013
0 20 40 60 80 100 120
Refrigerator
Separate freezer
Washing machine
Dishwasher
2.18 Means of transport in household, 2013
%
Cars 80 .1
one car 47 .8
more than one car 40 .3
Bicycles 40 .4
Motorcycles 3 .3
Mopeds and scooters 7 .9
Household amenities
2.21 Internet use in previous 3 months (frequent users), 2013
Less than once a month
Not weekly but at least once a month
Not daily but at least once a week
(Almost) daily2%
11%1%
86%
Bonaire 21
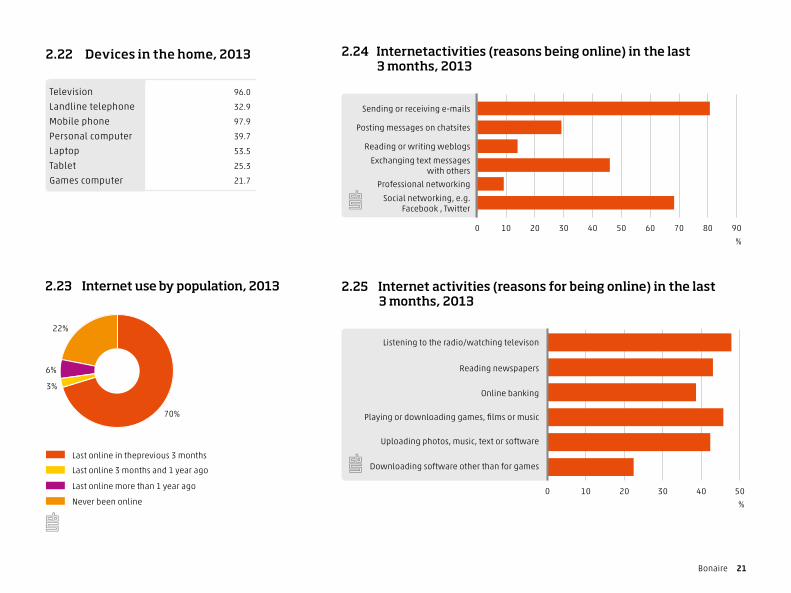
2.23 Internet use by population, 2013
Never been online
Last online more than 1 year ago
Last online 3 months and 1 year ago
Last online in theprevious 3 months
6%
3%
22%
70%
2.22 Devices in the home, 2013
Television 96 .0
Landline telephone 32 .9
Mobile phone 97 .9
Personal computer 39 .7
Laptop 53 .5
Tablet 25 .3
Games computer 21 .7
2.25 Internet activities (reasons for being online) in the last 3 months, 2013
0 10 20 30 40 50
Downloading software other than for games
Uploading photos, music, text or software
Playing or downloading games, films or music
Online banking
Reading newspapers
Listening to the radio/watching televison
%
2.24 Internetactivities (reasons being online) in the last 3 months, 2013
0 10 20 30 40 50 60 70 80 90
Social networking, e.g. Facebook , Twitter
Professional networking
Exchanging text messageswith others
Reading or writing weblogs
Posting messages on chatsites
Sending or receiving e-mails
%

22 Trends in the Caribbean Netherlands 2015
The income per capita on Bonaire is consistent with the Gross Domestic Product per capita. The median and the average income of the households in the lowest 25 percent income bracket on Bonaire was approximately 7 thousand dollars.
On Bonaire the median disposable household income was 22.4 thousand dollars in 2011 and 22.8 thousand dollars in 2012. The median disposable income of the highest 25 percent income bracket was 54.2 thousand dollars in 2011 and 56.5 thousand dollars in 2012.
Most households generated income from labour, running their own business and property (primary income). On Bonaire 84 percent of the households with an income have a primary income in 2011 and 2012. The median primary income was 24.7 and 24.9 thousand dollars in 2011 and 2012 respectively. The median disposable income of households that mainly relied on benefits was 7.5 thousand dollars on Bonaire.
Income 2.26 Income from (private) households to various characteristics, 2011–2012*
Year
Households Disposable income
number average median
x 1,000 USD
Total 2011 5,800 29 .4 22 .4
2012 6,150 30 .3 22 .8
Income quartile1st quartile (low income) 2011 1,450 7 .1 6 .8
2012 1,550 7 .0 7 .2
2nd quartile 2011 1,450 16 .9 16 .7
2012 1,550 17 .2 17 .0
3rd quartile 2011 1,450 29 .7 29 .5
2012 1,550 30 .6 30 .3
4th quartile (high income) 2011 1,450 64 .0 54 .2
2012 1,550 66 .4 56 .5
Age classup to 40 years 2011 1,600 24 .0 18 .5
2012 1,750 24 .1 18 .3
40 to 59 years 2011 2,850 32 .5 25 .7
2012 2,950 33 .8 26 .6
60 years and over 2011 1,400 29 .3 21 .1
2012 1,450 30 .6 21 .3
Number of household members1 person 2011 1,850 16 .9 12 .7
2012 2,050 17 .5 13 .2
2 and more persons 2011 3,950 35 .3 29 .2
2012 4,100 36 .8 30 .0
Main source of incomePrimary income 2011 5,150 31 .7 24 .7
2012 5,500 32 .5 24 .9
Transfer income 2011 650 11 .5 7 .5
2012 650 11 .8 7 .5

Bonaire 23
In general someone’s income level is related to their life stage. Young people at the start of their professional career earn relatively low wages. When they grow older, their income from labour increases as they gain more work experience and have access to better paying jobs. When they reach the retirement age, their income falls back.This pattern is prevalent in the incomes on the Caribbean Netherlands. On all three islands, households with a main breadwinner in the age category of 40 to 59 years had the highest incomes. On Bonaire the median income of these types of households was 25.7 thousand dollars in 2011 and 26.6 thousand dollars in 2012. The median income of the under 40s was in 2011 and 2012 18.5 and 18.3 thousand dollars respectively. On the other hand, the median income of people aged over 60 rose slightly from 21.1 thousand dollars in 2011 to 21.3 thousand dollars in 2012.
2.27 Average disposable income of (private) households by income quartile, 2011–2012*
Year
Persons Personal income
number average median
x 1,000 USD
Total 2011 10,150 22 .0 16 .1
2012 10,550 22 .7 16 .4
1st quartile (low income) 2011 2,550 4 .5 4 .7
2012 2,650 4 .8 5 .0
2nd quartile 2011 2,550 11 .8 11 .8
2012 2,650 12 .1 12 .1
3rd quartile 2011 2,550 21 .5 21 .3
2012 2,650 22 .1 21 .8
4th quartile (high income) 2011 2,550 50 .2 41 .7
2012 2,650 52 .0 43 .3
22,800 USD was the median
disposable income on Bonaire 2012
Aa

24 Trends in the Caribbean Netherlands 2015
Multi-person households usually have more than one income earner. As a result, multi-person households usually have higher incomes than single-person households. On the three Caribbean islands, incomes of multi-person households are approximately twice as high as incomes of single-person households.
2.28 Primary income of people between 20 and 60 years in (private) households, by income quartile, 2011–2012*
Year
Persons Primary income
number average median
x 1,000 USD
Total 2011 7,100 26 .6 19 .9
2012 7,350 27 .3 20 .4
1st quartile (low income) 2011 1,750 6 .4 6 .7
2012 1,850 6 .5 6 .7
2nd quartile 2011 1,750 15 .6 15 .6
2012 1,850 15 .9 15 .9
3rd quartile 2011 1,750 26 .0 25 .6
2012 1,850 26 .8 26 .3
4th quartile (high income) 2011 1,750 58 .3 49 .8
2012 1,850 60 .0 51 .6
62.5% of households on
Bonaire had a disposable income
below 30,300 USD
Bb

Bonaire 25
International trade
2.30 Import value according to SITC 1)
2012 2013 2014
x 1,000 USD
Food and live animals 28 ,766 29 ,602 32 ,395
Beverages and tobacco 12 ,879 12 ,326 13 ,162
Crude materials, inedibles ex. fuels 3 ,133 3 ,577 3 ,910
Mineral fuels, lubricants, etc. 10 ,399 9 ,850 7 ,061
Animal & vegetable oils, fats & waxes 600 411 420
Chemicals & related products 14 ,811 15 ,002 16 ,529
Manufactured goods 26 ,460 24 ,813 23 ,626
Machinery and transport equipment 40 ,893 40 ,516 38 ,863
Miscellaneous manufactured articles 26 ,812 24 ,653 25 ,704
Other commodities 3 ,979 4 ,535 2 ,104
Total goods 168 ,732 165 ,286 163 ,774
1) SITC: Standard International Trade Classification.
2.31 Total import and export value per quarter
ImportsExports
0
10,000
20,000
30,000
40,000
50,000
60,000
2015 II*2015 I*2014 IV2014 III2014 II2014 I2013 IV2013 III2013 II2013 I
x 1,000 USD
24% of total goods imported
are machinery and transport
equipment in 2014 Bb
2.29 Total import and export value per year
Imports Exports
x 1,000 USD
2012 168,732 11,557
2013 165,286 14,024
2014 163,774 13,834

26 Trends in the Caribbean Netherlands 2015
2.32 Export value according to SITC
2012 2013 2014
x 1,000 USD
Food and live animals 3 20 19
Beverages and tobacco 50 4 127
Crude materials, inedibles ex. fuels 624 3 ,838 5 ,440
Mineral fuels, lubricants, etc. 2 1 1
Animal & vegetable oils, fats & waxes 0 16 0
Chemicals & related products 171 29 66
Manufactured goods 2 ,059 2 ,009 1 ,366
Machinery and transport equipment 5 ,693 6 ,260 4 ,701
Miscellaneous manufactured articles 1 ,731 1 ,378 1 ,175
Other commodities 1 ,224 470 939
Total goods 11 ,557 14 ,024 13 ,834
20% of total goods imported
were food and live animals in 2014
Aa

Bonaire 27
The population of Bonaire (aged 15–74) is nearly 14.5 thousand strong and 68.9 percent have a job. Bonaire’s participation rates are higher for men than for women. Over 70 percent of men work, compared with around 65 percent of women. Nearly 90 percent of the employed labour force on Bonaire work full-time. The unemployment rate was 6.4 percent of the labour force in 2014. This is the equivalent of around 700 unemployed persons. The unemployment rate is especially high among young people. Besides government the main job providers on Bonaire are construction and care as well as hotel and restaurants.
On Bonaire education and a job don’t go as well together as in the European part of the Netherlands. Some 50 percent of the young people on Bonaire are not looking for a job and are not available for work. Just 16 percent of young students on Bonaire work alongside their studies. Education is also one of the main reasons why people on the island do not want to or are not available for work.
Labour2.33 Employed labour force by sex and full-time/ part-time (15–74 yrs), 2014
0
20
40
60
80
100
FemaleMaleTotal
Full-time (≥35 hrs per week) Part-time (<35 hrs per week)
%
2.34 Net labour participation by level of education (15–74 yrs)
0
20
40
60
80
100
Level of education:
high
Level of education:
middle
Level of education:
low
20142012
%

28 Trends in the Caribbean Netherlands 2015
Education levels among native-born Bonairians often low Around 60 percent of people living on Bonaire were born on Bonaire or one of the other islands of the former Netherlands Antilles. Most foreigners on Bonaire work in specific sectors of the labour market. People from the European part of the Netherlands mainly work in hotels and restaurants, education and government. Many foreigners have secondary and higher levels of education. Workers born on the islands themselves often have lower levels of education.
2.35 Net labour participation by place of birth (15–74 yrs)
0
20
40
60
80
100
Born elsewhere
Born in the Netherlands
Born on the other island of
Antilles (incl. Aruba)
Born on the island
20142012
%
2.36 Net labour participation by household (15–74 yrs)
0
20
40
60
80
100
Othermember
ChildPartof couple
withoutchildren
Partof couple
withchildren
One parentSingle
20142012
%

Bonaire 29
2.37 Labour force by gender and age (15–74 yrs)
Gender Age
Total
male female 15–24 yrs 25–44 yrs 45–74 yrs
Persons
2012
Total population 12,857 6,867 5,991 1,943 4,822 6,092
Labour force 9,357 5,113 4,244 1,005 4,306 4,046
Employed labour force 8,812 4,824 3,988 884 4,046 3,882
Unemployed labour force 546 289 257 121 260 164
Not in the labour force 3,500 1,753 1,747 938 516 2,046
%
Gross labour participation 72 .8 74 .5 70 .8 51 .7 89 .3 66 .4
Net labour participation 68 .5 70 .3 66 .6 45 .5 83 .9 63 .7
Unemployment rate 5 .8 5 .7 6 .0 12 .0 6 .0 4 .1
Persons
2014
Total population 14,456 7,644 6,812 2,101 5,468 6,887
Labour force 10,637 5,835 4,801 946 5,035 4,656
Employed labour force 9,959 5,499 4,461 772 4,754 4,433
Unemployed labour force 677 337 341 173 281 223
Not in the labour force 3,819 1,809 2,011 1,155 433 2,231
%
Gross labour participation 73 .6 76 .3 70 .5 45 .0 92 .1 67 .6
Net labour participation 68 .9 71 .9 65 .5 36 .8 86 .9 64 .4
Unemployment rate 6 .4 5 .8 7 .1 18 .3 5 .6 4 .8

30 Trends in the Caribbean Netherlands 2015
2.38 Labour-market position by gender and age (15–74 yrs), 2014
Gender Age
Total
male female 15–24 yrs 25–44 yrs 45–74 yrs
Persons
Total population 14,456 7,644 6,812 2,101 5,468 6,887
Employed labour force 9,959 5,499 4,461 772 4,754 4,433
Unemployed labour force 677 337 341 173 281 223
Not in the labour force 3,819 1,809 2,011 1,155 433 2,231
not available or not looking for work 523 260 263 127 174 222
not available and not looking for work 3,297 1,534 1,747 1,028 259 2,010
wants to work 127 . 112 65 15 47
does not want to work because of care 313 27 286 . 88 225
does not want to work because of education 938 456 482 882 56 .
does not want to work because of retirement/ old age 1,217 712 504 . . 1,217
does not want to work because of illness; disability; poor health 362 157 205 38 59 265
does not want to work because of other reason 340 182 158 43 41 256
2.39 Employed labour force by economic activity (15–74 yrs), 2014
28%
1%3%0%
6%
29%
4%4% 0%
17%
8%
Economic activity unknown
Culture, recreation and other services
Government and care
Business services
Renting, buying, selling real estate
Financial instutions
Information and communication
Trade, transport, hotels, catering
Construction
Industry (excl. construction, energy)
Agriculture, forestry and fishing

Bonaire 31
2.40 Jobs of employees by monthly wage and economic activity, 2013
0 20 40 60 80 100
Public administration and services
All economic activities
10,000 or more
5,000 to 10,000
4,500 to 5,000
4,000 to 4,500
3,500 to 4,000
3,000 to 3,500
2,500 to 3,000
2,000 to 2,500
1,500 to 2,000
1,000 to 1,500
500 to 1,000
Less than 500
%
2.41 Employed labour force by position (15–74 yrs), 2014
Self-employed
Employee with a temporary contract
Employee with a permanent contract
72%
17%
11%

32 Trends in the Caribbean Netherlands 2015
2.42 Jobs of employees by monthly wage and age, 2013
0
20
40
60
80
100
10,000 or
more
5,000 to
10,000
4,500 to
5,000
4,000 to
4,500
3,500 to
4,000
3,000 to
3,500
2,500 to
3,000
2,000 to
2,500
1,500 to
2,000
1,000 to
1,500
500 to
1,000
less than 500
75 yrs or older
65 to 74
55 to 64 yrs
45 to 54 yrs
35 to 44 yrs
25 to 34 yrs
15 to 24 yrs
Younger than 15 yrs
%
6.4% of the labour force on
Bonaire were unemployed in 2014
Aa

Bonaire 33
The Gross Domestic Product (GDP) of Bonaire had reached 372 million US dollar (USD) in 2012. The most important economic sectors on Bonaire are the government, which contributed 17.5%, real estate with 17.9% and the financial services sector with a 10.4% contribution to GDP.
Total consumption (households and government consumption combined) contributed 310 million USD to GDP. Major items included in household consumption are the expenditure on food (21% of household consumption) and the expenditure on rent and electricity and gas (also 21%). Gross capital formation (including the changes in stocks) came to 86 million USD in 2012.
Consumption and investments together constitute domestic spending. Foreign expenditure in Bonaire (exports of goods and services) mainly comes from tourism. Total exports in 2012 amounted to 181 million USD while the imports of goods and services came to 205 million USD. The most important products that were imported include food, manufactured goods and oil products.
Macroeconomics
2.44 Contribution sectors to (incoming) tourism, 2012
49%
11%
24%
1%8%
7%
Other tourism activities
Other services (culture, recreation)
Real estate activities
Horeca (hotels, restaurants and catering)
Transport and communication
Trade (wholesale and retail)
2.43 Supply and disposition of goods and services (million USD), 2012
Disposable for final expenditure Final expenditure
Gross Domestic Product 372 Consumption by households 196
Consumption by government 114
Consumption, total 310
Gross Capital Formation 86
Imports of goods and services 205 Exports of goods and services 181
Disposable for final expenditure 577 Total final expenditure 577

34 Trends in the Caribbean Netherlands 2015
2.45 Value added (gross, basis prices) by industry, 2012
Industries % of GDP
Agriculture, Mining, Manufacturing, Electricity, Gas 8 ,3
Construction 7 ,7
Trade (wholesale and retail) 9 ,2
Transport and Communication 10 ,1
Hotels, restaurants and catering 9 ,1
Financial services 10 ,4
Real estate activities 17 ,9
Other business services 5 ,4
Government, Education and Medical services 17 ,5
Other services (culture, recreation) 4 ,4
Domestic Product (gross, basis prices) 100
Incoming tourism contributes greatly to the economy of BonaireBonaire’s economy leans heavily on incoming tourism. The incoming tourism accounted for a direct contribution to Bonaire’s Gross Domestic Product (GDP) of approximately 16.4 percent in 2012. The contribution of incoming tourism to Bonaire’s economy is about the same as it is on similar Caribbean islands.126 thousand tourists flew to Bonaire in 2012. More than 60 percent had the Dutch nationality; another 20 percent were Americans. Cruise ships also regularly called at Bonaire and many tourists sailed to the island with their own boats.
Direct tourist spending amounts to 160 million dollarsDirect tourist spending was estimated at about 160 million dollars. When the costs of the tourism sector are taken into account, the value added of direct foreign tourist spending came to about 60 million dollars, i.e. 16.4 percent of Bonaire’s GDP.
21,900 USD
GDP per capita on Bonaire in 2012
Aa

Bonaire 35
2.46 Share of inbound tourism to the economy, 2012
Value added
Inbound tourism
value addedShare of tourism
Million USD %
Trade (wholesale and retail) 33 4 11 .6
Transport and Communication 36 5 13 .3
Hotels, restaurants and catering 33 28 87 .5
Real estate activities 64 7 10 .6
Other services (culture, recreation) 16 14 88 .2
Other tourism activities 176 0 0 .2
Value added (basic prices) 357 58 16 .3
Contribution to Gross Domestic Product 372 61 16 .4
Hotels and restaurants most important in tourism sectorForeign tourists spent their money mainly on overnight stays, food and drinks. Hotels, holiday parks, restaurants and bars benefit most from the inflow of tourists. The sector hotels and restaurants generates nearly half of the total value added of the tourism sector. Recreational activities also play a major part in the tourism sector on Bonaire, in particular scuba diving, snorkelling and water sports like wind- and kitesurfing.

36 Trends in the Caribbean Netherlands 2015
Population
2.47 Population
2013 2014 2015
Total population (1 January) 17,408 18,413 18,905
Male 9,163 9,635 9,871
Female 8,245 8,778 9,034
Population density 60 64 66
Population growth 1,004 515
Live births 194 207
Deaths 79 98
Registered immigration 1,549 1,235
Registered emigration 660 829
2.48 Households, 1 January 2014
Other
Single parent
Couple with children
Couple without children
One-person
41%
20%
24%
13%2%
2.49 Number of persons in households, 1 January 2014
5 persons and more
4 persons
3 persons
2 persons
1 person
41%
23%
14%
11%
10%
6 5 4 3 2 1
0 to 45 to 10
10 to 1415 to 2020 to 2425 to 3030 to 3435 to 4040 to 4445 to 5050 to 5455 to 6060 to 6465 to 7070 to 7475 to 8080 to 84
85 and older
Male Female
%
Age class (yrs)
0 1 2 3 4 5 6
2.50 Age distribution, 1 January 2015

Bonaire 37
2.51 Country of birth of inhabitants, 1 January 2015
Other countries
Netherlands
US and Canada
South and Central America
Former Netherlands Antilles and Aruba
58%20%
3%
14%
5%
2.52 First nationality of inhabitants, 1 January 2015
Other countries
US and Canada
Netherlands
South and Central America and the Caribbean
80%
4% 13%3%
2.53 Religious denomination, 2013
%
No religion 12 .0
Roman Catholic Church 68 .2
Pentecostal Church 6 .7
Protestant Church 2 .7
Evangelical Church 4 .5
Other denomination 6 .0
2.54 Church attendance of people with a denomination, 2013
0
5
10
15
20
25
30
35
Hardly or never
Less than once a month
Once a month
2 to 3 times a month
At least once a week

38 Trends in the Caribbean Netherlands 2015
2.55 Languages spoken on Bonaire, 2013
0
10
20
30
40
50
60
70
80
90
100
Other languageSpanishDutchEnglishPapiamento
% of population that speaks the language
Most frequently spoken language
The language that is most widely spoken as a percentage of the population who speak more than one language
% of population that speaks one language
%
80% of the inhabitants of
Bonaire have the Dutch nationality
Bb
58% of the inhabitants
of Bonaire are born on the former
Netherlands Antilles or Aruba
Bb
Bonaire 39
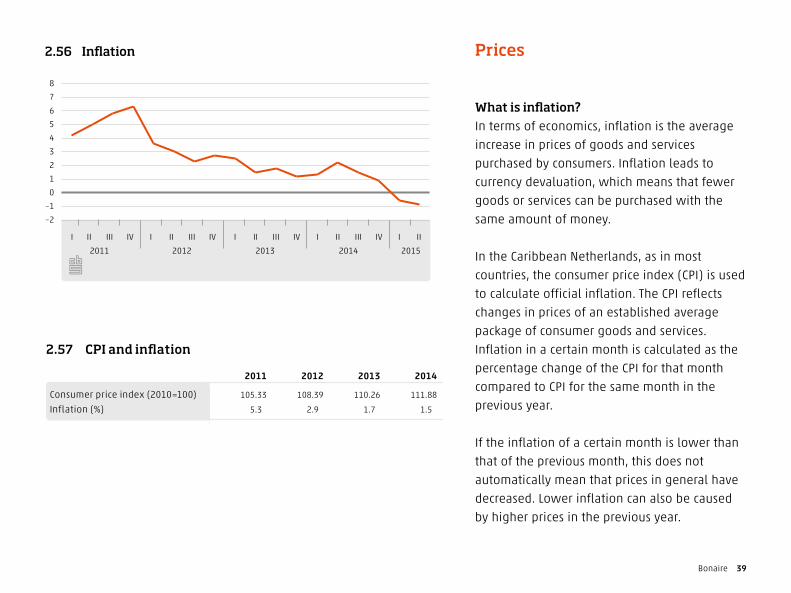
Prices
What is inflation?In terms of economics, inflation is the average increase in prices of goods and services purchased by consumers. Inflation leads to currency devaluation, which means that fewer goods or services can be purchased with the same amount of money.
In the Caribbean Netherlands, as in most countries, the consumer price index (CPI) is used to calculate official inflation. The CPI reflects changes in prices of an established average package of consumer goods and services. Inflation in a certain month is calculated as the percentage change of the CPI for that month compared to CPI for the same month in the previous year.
If the inflation of a certain month is lower than that of the previous month, this does not automatically mean that prices in general have decreased. Lower inflation can also be caused by higher prices in the previous year.
2.57 CPI and inflation
2011 2012 2013 2014
Consumer price index (2010=100) 105 .33 108 .39 110 .26 111 .88
Inflation (%) 5 .3 2 .9 1 .7 1 .5
2.56 In�ation
2011 2012 2013 2014 2015
–2
–1
0
1
2
3
4
5
6
7
8
IIIIVIIIIIIIVIIIIIIIVIIIIIIIVIIIIII

40 Trends in the Caribbean Netherlands 2015
Inflation on BonaireInflation on Bonaire fell in the last few consecutive quarters, reporting negative inflation for the first time in the first and second quarters of 2015. In the first quarter of 2015 inflation reached –0.6 percent from 0.9 percent in the fourth quarter of 2014. The strong decrease in petrol prices was the main cause of lower inflation on Bonaire. The lower price of electricity also contributed to the decrease in inflation.
In the second quarter of 2015 inflation fell for the third consecutive quarter, reaching –0.9 percent. Price developments of food in particular lowered Bonaire’s inflation rate. Although food prices were 0.4 percent higher than one year previously, the year-on-year price increase in the first quarter was still 2.9 percent. Clothing became more expensive on Bonaire which had an upward effect on inflation.
2.59 Price level index (world = 100), 2011
Bonaire Aruba Curaçao St Maarten
Individual consumption expenditure by households 109 .7 110 .1 95 .2 111 .8
Food and nonalcoholic beverages 148 .3 128 .9 116 .8 131 .4
Alcoholic beverages and tobacco 118 .0 146 .4 110 .8 71 .0
Clothing and footwear 81 .2 117 .9 142 .2 96 .1
Furnishings, household equipment and maintenance 129 .2 149 .2 121 .5 126 .7
Transport 115 .8 103 .5 94 .7 95 .0
Communication 165 .2 134 .2 148 .3 172 .4
Hotels and restaurants 103.1 150.0 118.6 125.0
2.58 Consumer price index (CPI)
98
100
102
104
106
108
110
112
114
IIIIVIIIIIIIVIIIIIIIVIIIIIIIVIIIIIIIVIIIIII
2010 2011 2012 2013 2014 2015
2010=100

Bonaire 41
2.61 Expenditure by consumers, 2013
% of total spending
Food and non-alcoholic beverages 18 .4
Alcoholic beverages and tobacco 1 .4
Clothing and footwear 3 .5
Housing, water, electricity, gas 17 .8
Furnishing, household equipment 5 .3
Health 1 .8
Transport 19 .0
Communication 8 .8
Recreation and culture 3 .5
Education 0 .6
Hotels and restaurants 6 .5
Miscellaneous goods and services 13 .4
Total expenditure 100 .0
2.60 Price level index (world=100), 2011
0 20 40 60 80 100 120 140 160 180 200
Hotels and restaurants
Communication
Transport
Furnishings, household equipment and maintenance
Clothing and footwear
Alcoholic beverages,and tobacco
Food and nonalcoholic beverages
Individual consumption expenditure by households
St MaartenCuraçaoArubaBonaire
Source: International Comparison Programme, 2011.
% 1.5%
inflation on Bonaire in 2014
Dd

42 Trends in the Caribbean Netherlands 2015
2.62 Breakdown of total household consumption, 2013
0 5 10 15 20
Miscellaneous goods and servicesHotels and restaurants
EducationRecreation and culture
CommunicationTransport
HealthFurnishing, household equipment
Housing, water, electricity, gasClothing and footwear
Alcoholic beverages and tobaccoFood and non-alcoholic beverages
% of total consumption
2.63 Breakdown of household consumption of food and non-alcoholic beverages, 2013
0 5 10 15 20 25
Mineral waters,soft drinks, juice
Co�ee, tea and cocoa
Food products, n.e.c.
Sugar, sweets and ice cream
Vegetables and potatoes
Fruit
Oils and fats
Milk, cheese and eggs
Fish
Meat
Bread and cereals
% of food consumption
2.64 Expenditure on food and non-alcoholic beverages, 2013
% of food spending
Bread and cereals 16 .7
Meat 21 .5
Fish 3 .5
Milk, cheese and eggs 12 .3
Oils and fats 2 .7
Fruit 9 .7
Vegetables and potatoes 11 .3
Sugar, sweets and ice cream 4 .1
Food products, n.e.c. 6 .9
Coffee, tea and cocoa 1 .9
Mineral waters, soft drinks, juice 9 .5
Food and non-alcoholic beverages 100 .0
7.8% price rise for clothes and
shoes on Bonaire in 2014 Aa

Bonaire 43
Security and Justice
2.66 Registered crime suspects, 2014
Other
Drugs-related crime
Weapon-related crime
Property crime
Sexual o�ences
Violent crime
Murder/manslaughter and attempted murder/ manslaughter
3%
15%
13%
21% 6%
32%
10%
Source: Public Prosecutor's o�ce Bonaire, St Eustatius and Saba.
2.65 Registered crime suspects
2011 2012 2013 2014
Murder/manslaughter and attempted murder/manslaughter 14 20 5 29
Violent crime 119 114 116 90
Sexual offences 23 21 19 16
Property crime 97 94 111 59
Weapon-related crime 6 7 11 8
Drugs-related crime 27 27 54 42
Other 41 51 71 26
Source: Public Prosecutor's office Bonaire, St Eustatius and Saba.
2.67 Feeling unsafe, 2013
Never
Seldom
Sometimes
Often
68%
18%
8%
6%
Source: Omnibus Survey Caribbean Netherlands, 2013.

44 Trends in the Caribbean Netherlands 2015
2.68 Perception of crime in own neighbourhood, 2013
0
10
20
30
40
50
No crimeLittle crimeMuch crime
%
2.69 Percentage of population reporting neighbourhood decline, 2013
0
10
20
30
40
Animal faeceson sidewalks
or in the street
Gra�ti on walls or buildings
Vandalised public items
Litter/junk in the street
%
2.70 Percentage of population reporting social nuisance, 2013
0
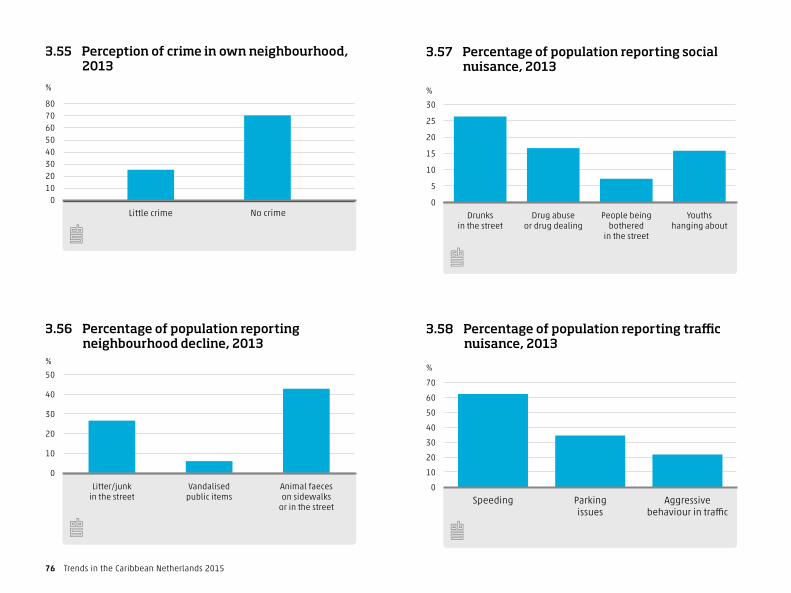
10
20
30
40
Youths hanging about
People being bothered
in the street
Drug abuse or drug dealing
Drunks in the street
%
2.71 Percentage of population reporting tra�c nuisance, 2013
0
10
20
30
40
50
60
Aggressive behaviour
Parking issuesSpeeding
%

Bonaire 45
Social Security
2.72 Income support (per two weeks)
2011 2012 2013 2014 2015
USD
Single 80 85 87 89 90
Allowances
1st child 23 25 25 26 26
2nd and 3rd child 12 13 13 13 14
living independently 19 20 21 21 22
married/living together 48 51 52 53 24
disability 95 100 153 156 159
Source: SZW unit Bonaire.
2.73 State pension
2011 2012 2013 2014 2015
USD
State old age pension (AOV) 524 555 567 577 586
Partner's allowance 359 380 389 396 402
Source: SZW unit Bonaire.

46 Trends in the Caribbean Netherlands 2015
Traffic, Transport & Tourism
Tourism on Bonaire consists of the influx of overnight tourists and day tourists. The overnight tourists generally arrive by airplane while most one-day tourist are passengers on cruise ships or boats. In 2014 more cruise passengers visited the island than tourists arriving by airplane: 156 thousand versus 130 thousand respectively.
11 Thousand tourists a month arrive by airplaneIn 2014, 11 thousand tourists a month travelled to Bonaire by airplane on average, approximately 130 thousand for the year. This is slightly lower than in 2013. Fewer tourists arrived by airplane in June and July than in the same period in previous years. This was compensated by more tourists arriving in the other months of 2014. In 2014 most tourists arriving by airplane had the Dutch or American (including Puerto Rican) nationality.
2.74 Number of cruise passengers, 2012–2014
2012** 2013* 2014*
x 1,000
January 28 .6 36 .0 32 .6
February 33 .7 22 .5 29 .1
March 24 .5 19 .5 26 .7
April 21 .3 14 .0 15 .1
May 0 .0 0 .4 0 .0
June 0 .0 0 .4 0 .0
July 0 .2 0 .5 2 .3
August 0 .4 0 .2 0 .2
September 0 .1 0 .2 0 .3
October 0 .7 0 .2 0 .4
November 14 .5 13 .5 26 .0
December 33 .6 34 .7 23 .7
Total 157 .5 142 .0 156 .4
2.75 Inbound tourism by air and by nationality
2012** 2013* 2014*
% of tourists
Dutch 62 59 58
American 20 21 19
Venezuelan 3 3 3
German 2 2 3
Canadian 2 2 2
Colombian 1 1 1
Brazilian 1 1 2
Other European nationalities 5 5 7
Other nationalities 4 4 5

Bonaire 47
Over 50 percent of tourists stay for one week or lessDay tourists accounted for 13.4 thousand of the approximately 130 thousand tourists who flew to Bonaire in 2014. Of the other people who stayed overnight, over 50 percent spent about a week or less on the island, with the highest peak for seven nights spent. The average number of nights spent by overnighters was 9.1 nights, which is about the same as the 9.2 nights spent on average in 2013.
More cruise ship passengers than tourists arriving by airplaneMore tourists arrived on Bonaire by ship than by airplane in 2014 just like they had in the previous years. Most – 156 thousand – were passengers on cruise ships. There were 158 thousand cruise ship passengers who visited the island in 2012 and about 142 thousand in 2013. The cruise ships carried on average 1,200 passengers each in 2014. Due to small changes in the composition of the cruise ships docking at Bonaire, this average is below the 1,500 per ship in 2013. If only comparable cruise ships are taken into account, the average number of passengers per ship in 2014 was similar to that in 2013. More
156 thousand cruise ship
tourists visited in 2014 Aa
2.76 Inbound tourism by air and by length of stay (nights spent), 2014. Zero nights spent means a day trip
0
3
6
9
12
15
18
36+302520151050
% of tourists

48 Trends in the Caribbean Netherlands 2015
passengers arrived on cruise ships in November 2014 and fewer in December than in the same months in 2013. It is not known how many cruise ship passengers actually went ashore.
The cruise industry for Bonaire is largely seasonal: hardly any cruise ships arrive Bonaire in the summer months. The economic significance of the cruise industry is clearly not as great for Bonaire as that of tourists staying on the island. For example, most cruise ships only stay in Bonaire for a single day and the passengers have their meals on board rather than on the island.
2.77 Total air passengers and aircraft movements Flamingo Airport
Aircraft
movementsTotal
PassengersPassengers
arrivalsPassengers departures
x 1,000
2013 January 1 .2 26 .9 13 .9 13 .0
2013 February 1 .2 26 .7 13 .7 13 .1
2013 March 1 .4 31 .3 15 .3 16 .0
2013 April 1 .3 27 .8 15 .0 12 .8
2013 May 1 .3 28 .1 13 .0 15 .1
2013 June 1 .2 27 .9 13 .9 14 .0
2013 July 1 .3 31 .6 15 .9 15 .7
2013 August 1 .2 29 .6 14 .3 15 .3
2013 September 1 .0 22 .5 11 .6 10 .9
2013 October 1 .1 26 .3 13 .5 12 .8
2013 November 1 .1 25 .8 12 .9 12 .9
2013 December 1 .1 28 .4 14 .4 14 .0
2014 January 1 .1 28 .7 14 .9 13 .8
2014 February 0 .9 26 .7 12 .9 13 .8
2014 March 0 .9 30 .2 14 .9 15 .4
2014 April 0 .9 26 .6 13 .4 13 .1
2014 May 0 .9 27 .8 13 .6 14 .2
2014 June 0 .8 23 .6 11 .5 12 .0
2014 July 0 .9 28 .2 14 .3 13 .9
2014 August 0 .9 28 .6 14 .2 14 .4
2014 September 0 .9 22 .6 11 .5 11 .1
2014 October 1 .0 27 .2 13 .5 13 .8
2014 November 1 .0 25 .9 12 .9 13 .0
2014 December 1 .2 29 .8 15 .2 14 .6
2015 January* 1 .0 29 .7 15 .5 14 .2
2015 February* 1 .0 27 .3 14 .1 13 .2
2015 March* 1 .0 29 .8 14 .7 15 .1

Bonaire 49
2.79 Passengers and aircrafts Flamingo Airport by year
Aircraft
movementsTotal
PassengersPassengers
arrivalsPassengers departures
x 1,000
2012 16 .7 328 .9 165 .5 163 .4
2013 14 .5 332 .8 167 .4 165 .5
2014 11 .3 325 .8 162 .8 163 .0
2.78 Passengers and aircrafts Flamingo Airport by quarter
Aircraft
movementsTotal
PassengersPassengers
arrivalsPassengers departures
x 1,000
2013-I 3 .9 84 .9 42 .9 42 .0
2013-II 3 .9 83 .8 41 .9 41 .9
2013-III 3 .5 83 .7 41 .8 41 .8
2013-IV 3 .2 80 .5 40 .8 39 .7
2014-I 2 .9 85 .6 42 .7 42 .9
2014-II 2 .5 77 .9 38 .6 39 .4
2014-III 2 .7 79 .4 40 .0 39 .4
2014-IV 3 .2 82 .9 41 .5 41 .3
2015-I 3 .0 86 .8 44 .3 42 .5
2015-II 3.0 82.6 41.0 41.6
130 thousand tourists
arrived by air in 2014 Cc
2.77 Total air passengers and aircraft movements Flamingo Airport
Aircraft
movementsTotal
PassengersPassengers
arrivalsPassengers departures
x 1,000
2015 April* 1.0 29.5 14.9 14.6
2015 May* 1.0 29.1 13.9 15.2
2015 June* 1.0 24.0 12.2 11.8
(end)

50 Trends in the Caribbean Netherlands 2015
2.80 Air passengers Flamingo Airport per month, 2014–2015 Q2
0
10
11
12
13
14
15
16
17
Jun*May*Apr*Mar*Feb*Jan*DecNovOctSepAugJulJunMayAprMarFebJanDecNovOctSepAugJulJunMayAprMarFebJan
2013 2014 ’15
DeparturesArrivals
11 thousand tourists a month
on average fly to Bonaire
Cc
2.81 Number of cruise passengers per month, 2012–2014
0
10
20
30
40
DecNovOctSepAugJulJunMayAprMarFebJan
2014*2013*2012**
Cruise passengers (x 1,000)

Bonaire 51
2.82 Age distribution of tourists
1) Due to rounding, some totals may not correspond to the sum of separate figures.
20132012 2014
0 2 4 6 8 10 12 14
0 to 4
5 to 9
10 to 14
15 to 19
20 to 24
25 to 29
30 to 34
35 to 39
40 to 44
45 to 49
50 to 54
55 to 59
60 to 64
65 to 69
70 to 74
75 to 79
80 to 84
85 and older
%
2.83 Number of tourists arriving by air, 2012–2014
2012** 2013* 2014*
x 1,000
January 10 .5 10 .6 11 .7
February 10 .9 11 .1 10 .8
March 10 .9 12 .5 12 .1
April 11 .3 11 .8 11 .7
May 9 .0 10 .1 10 .7
June 9 .9 10 .4 9 .5
July 12 .3 12 .0 10 .7
August 10 .4 10 .8 10 .7
September 8 .6 8 .7 9 .3
October 10 .7 10 .8 10 .6
November 10 .2 10 .4 10 .6
December 11 .2 11 .2 11 .5
Total 126 .1 130 .5 129 .9

52 Trends in the Caribbean Netherlands 20154 Trends in Nederland 2015
Saba
62%Dutch nationality
1,811inhabitants 93%
English fi rst language

Saba 53
3. SabaLike St Eustatius and St Maarten, Saba is one of the Leeward Islands. Nearly 2 thousand people live on the island with an area of 13 km2 and a population density of 139. Since January 2011 the population of Saba has marginally decreased by 22 people. With 906 men and 905 women the share of each sex is equal. The population of women grew by 39 while the population of men decreased by 61. The labour force is a little less than one thousand strong: 900 people are employed. 62 percent of the population have the Dutch nationality. Half of the population were born on one of the islands making up the former Netherlands Antilles or Aruba. English is the main language of 93 percent of the population; 3 percent speak mainly Spanish and another 4 percent another language. Hardly anyone on Saba speaks Dutch as their first language. 57 percent of the population is multilingual and 32 percent of the population indicated that they speak Dutch. 83 percent of inhabitants said they were religious, most people are Catholic: just over four in ten
inhabitants. Eight percent are Anglicans and 6 percent are Muslims. The size of the economy, measured by the Gross Domestic Product (GDP), of Saba amounted to well over USD 42 million in 2012. Since the number of inhabitants on Saba was 1981 in 2012, GDP per capita was USD 21,400.
4 Trends in Nederland 2015
Saba
62%Dutch nationality
1,811inhabitants 93%
English fi rst language

54 Trends in the Caribbean Netherlands 2015
278children younger than 15
103men older than 65
5%born in European Netherlands
Population of Saba, 1 January 2015
Saba 55
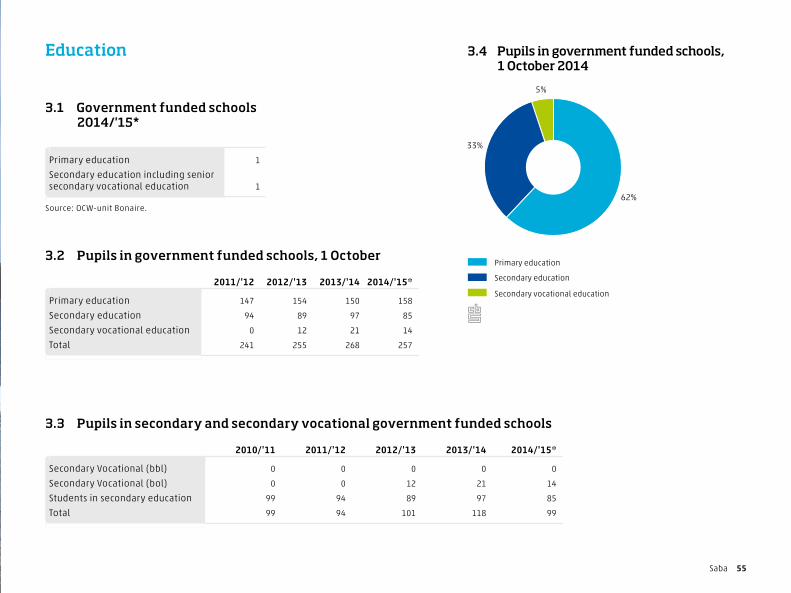
Education
3.1 Government funded schools 2014/'15*
Primary education 1
Secondary education including senior secondary vocational education 1
Source: OCW-unit Bonaire.
3.2 Pupils in government funded schools, 1 October
2011/'12 2012/'13 2013/'14 2014/'15*
Primary education 147 154 150 158
Secondary education 94 89 97 85
Secondary vocational education 0 12 21 14
Total 241 255 268 257
3.4 Pupils in government funded schools, 1 October 2014
Secondary vocational education
Secondary education
Primary education
5%
62%
33%
3.3 Pupils in secondary and secondary vocational government funded schools
2010/'11 2011/'12 2012/'13 2013/'14 2014/'15*
Secondary Vocational (bbl) 0 0 0 0 0
Secondary Vocational (bol) 0 0 12 21 14
Students in secondary education 99 94 89 97 85
Total 99 94 101 118 99

56 Trends in the Caribbean Netherlands 2015
3.5 Pupils in primary education on government funded schools
2012/'13 2013/'14 2014/'15*
4 yrs and younger 20 20 16
5 yrs 16 20 19
6 yrs 22 18 20
7 yrs 22 21 18
8 yrs 17 23 24
9 yrs 15 17 25
10 yrs 17 13 17
11 yrs 15 14 14
12 yrs 10 1 5
13 yrs 0 3 0
Total primary education 154 150 158
3.6 Electricity production
0
2
4
6
8
10
12
20142013201220112010200920082007
mln kWh
Energy
33% of the school children on
Saba are in primary education
Bb

Saba 57
Health and Welfare
3.7 Contact with medical professionals, 2013
% persons with at least 1 contact
Average number of contacts (patient)
Contact with GP in the last 12 months 72 .0 8 .7
Contact with medical specialist in the last 12 months 32 .9 8 .6
Contact with dentist in the last 12 months 50 .0 2 .5
3.8 Percentage of population who su�er from chronic disorders, 2013
0
10
20
30
40
50
60
70
% with 3 or morechronic disorders
% with2 chronic disorders
% with1 chronic disorder
% without chronic disorder
% of persons with disorders
3.9 Percentage of population who are underweight and overweight, 2013
Seriously overweight
Moderately overweight
Normal weight
Underweight5%
32%
32%
31%

58 Trends in the Caribbean Netherlands 2015
3.11 Percentage of population who feel happy, 2013
Happy
Not happy, not unhappy14%
86%
3.12 Percentage of population who are satis�ed with life, 2013
Satisfied
Not satisfied, not unsatisfied
Unsatisfied
3%14%
83%
3.10 Use of medicines, 2013
%
Prescribed medicines in 2 weeks 31 .5
Non-prescribed medicines in 2 weeks 35 .1
11% of over-15s
on Saba smoke dailyEe

Saba 59
3.13 Fuel used most for cooking, 2013
%
Gas 95 .9
Electricity 4 .0
3.15 Means of transport in household, 2013
%
Cars 61 .0
one car 38.5
more than one car 22.4
Bicycles 5 .0
Motorcycles 2 .5
Mopeds and scooters
3.14 Appliances in the home, 2013
0 20 40 60 80 100 120
Refrigerator
Separate freezer
Washing machine
Dishwasher
3.16 Devices in the home, 2013
%
Television 84 .8
Landline telephone 56 .0
Mobile phone 93 .9
Personal computer 44 .0
Laptop 72 .9
Tablet 36 .5
Games computer 29.0
Household amenities
60 Trends in the Caribbean Netherlands 2015
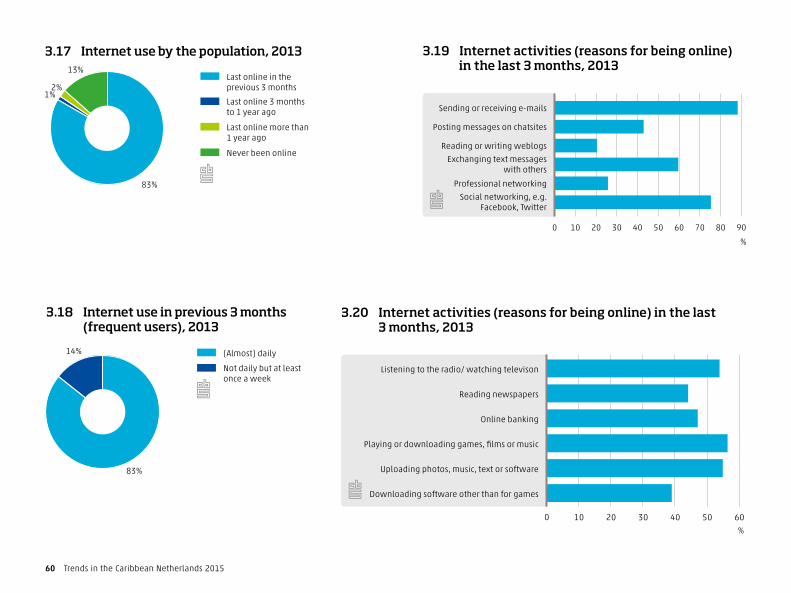
3.19 Internet activities (reasons for being online) in the last 3 months, 2013
0 10 20 30 40 50 60 70 80 90
Social networking, e.g.Facebook, Twitter
Professional networking
Exchanging text messageswith others
Reading or writing weblogs
Posting messages on chatsites
Sending or receiving e-mails
%
3.20 Internet activities (reasons for being online) in the last 3 months, 2013
0 10 20 30 40 50 60
Downloading software other than for games
Uploading photos, music, text or software
Playing or downloading games, films or music
Online banking
Reading newspapers
Listening to the radio/ watching televison
%
3.17 Internet use by the population, 2013
Never been online
Last online more than1 year ago
Last online 3 monthsto 1 year ago
Last online in theprevious 3 months2%
1%
13%
16%
83%
3.18 Internet use in previous 3 months (frequent users), 2013
Not daily but at least once a week
(Almost) daily14%
83%

Saba 61
Income
The income of households in the lowest 25 percent income bracket on Saba was 7.3 thousand dollars in 2011 and 7.8 thousand dollars in 2012.
On Saba the median disposable household income was 22.3 thousand dollars in 2011 and 23.7 thousand dollars in 2012. The median disposable income of the highest 25 percent income bracket was 54.1 thousand dollars in 2011 and 53.8 thousand dollars in 2012.
Most households generated income from labour, running their own business and property (primary income). On Saba 91 percent of the households had a median primary income in 2011 and 83 percent in 2012.
In general someone’s income level is related to their life stage. Young people at the start of their professional career earn relatively low wages. When they grow older, their income from labour increases as they gain more work experience and have access to better paying
3.21 Income from (private) households to various characteristics, 2011–2012*
Year
Households Disposable income
number average median
x 1,000 USD
Total 2011 550 28 .5 22 .3
2012 600 30 .1 23 .7
Income quartile
1st quartile (low income) 2011 150 6 .3 7 .3
2012 150 7 .7 7 .8
2nd quartile 2011 150 16 .9 16 .9
2012 150 18 .3 17 .8
3rd quartile 2011 150 29 .3 28 .7
2012 150 30 .7 30 .4
4th quartile (high income) 2011 150 61 .4 54 .1
2012 150 63 .7 53 .8
Age class
up to 40 years 2011 150 26 .0 21 .3
2012 200 26 .7 23 .8
40 to 59 years 2011 250 31 .0 24 .9
2012 250 34 .2 28 .0
60 years and over 2011 150 27 .5 19 .5
2012 150 28 .0 18 .6
Number of household members
1 person 2011 200 17 .9 12 .4
2012 200 19 .3 15 .1
2 and more persons 2011 350 34 .0 28 .4
2012 400 36 .2 30 .3
Main source of income
Primary income 2011 500 31 .7 26 .0
2012 500 33 .1 27 .3
Transfer income 2011 100 . .
2012 100 . .

62 Trends in the Caribbean Netherlands 2015
jobs. When they reach the retirement age, their income falls again. This pattern is prevalent in incomes on the Caribbean Netherlands. On all three islands, households with a main breadwinner in the age category of 40 to 59 years had the highest incomes. On Saba the median income of these types of households was 24.9 thousand dollars in 2011 and 28.0 thousand dollars in 2012. The median income of the under 40s increased to 23.8 thousand dollars in 2012 from 21.3 thousand dollars in 2011.
Multi-person households usually have more than one income earner. As a result, multi-person households usually have higher incomes than single-person households. On the three Caribbean islands, incomes of multi-person households are more than twice as high as incomes of single-person households.
3.22 Average disposable income of (private) households by income quartile, 2011–2012*
Year
Persons Personal income
number average median
x 1,000 USD
Total 2011 900 25 .1 19 .0
2012 900 26 .9 20 .0
1st quartile (low income) 2011 200 5 .2 6 .3
2012 250 6 .4 7 .6
2nd quartile 2011 200 13 .2 13 .0
2012 250 14 .8 15 .0
3rd quartile 2011 200 24 .1 23 .5
2012 250 25 .9 25 .2
4th quartile (high income) 2011 200 58 .0 48 .2
2012 250 60 .4 48 .4
3.23 Primary income of people between 20 and 60 years in (private) households, by income quartile, 2011–2012*
Year
Persons Primary income
number average median
x 1,000 USD
Total 2011 600 31 .0 24 .6
2012 600 33 .1 25 .8
1st quartile (low income) 2011 150 7 .4 7 .9
2012 150 8 .5 9 .4
2nd quartile 2011 150 19 .3 19 .6
2012 150 20 .3 20 .5
3rd quartile 2011 150 30 .5 29 .6
2012 150 33 .1 32 .6
4th quartile (high income) 2011 150 66 .6 59 .3
2012 150 70 .4 60 .6

Saba 63
International trade Labour
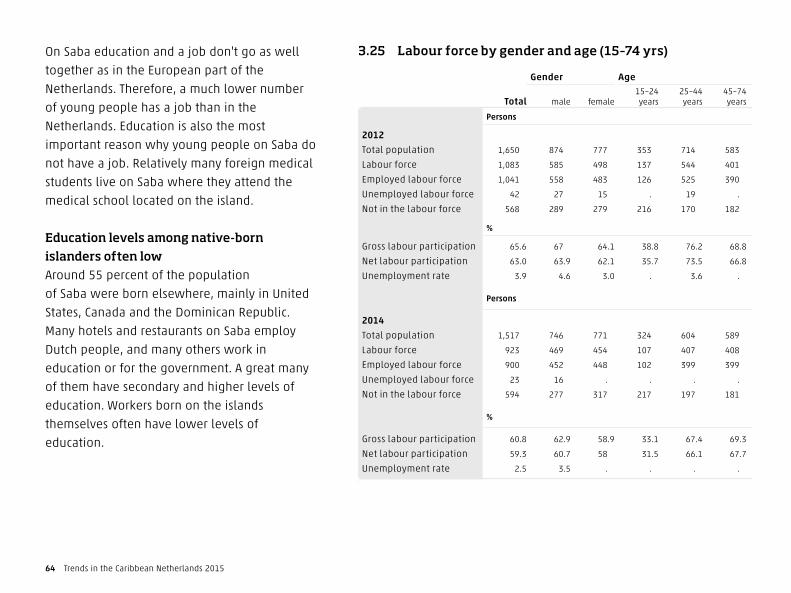
The working age population of Saba (aged 15–74) was nearly 1.5 thousand strong in 2014. Saba has the lowest labour participation rate of the Caribbean Netherlands, namely 59.3 percent. While the participation rates on the other islands are higher for men than for women, there is only a very small difference on Saba. Almost 61 percent of the men and 58 percent of the women are employed. Nearly 80 percent of the employed labour force on Saba work full-time.
Saba has the lowest unemployment rate of the Caribbean Netherlands: 2.5 percent. On Saba 35 out of every 100 inhabitants are not looking for a job nor are they available for work. This is one of the effects of the relatively large group of medical students living on the island.
Many people on Saba work in education. The other major employers are government, and health care.
3.24 Total import and export value per quarter
Imports Exports
x 1,000 USD
2013 I 3,822 2
2013 II 4,137 0
2013 III 4,122 28
2013 IV 4,582 0
2013 16,662 30
2014 I 4,194 38
2014 II 4,128 37
2014 III 4,575 21
2014 IV 6,269 65
2014 19,166 160
2015 I 4,434 22
2015 II* 5,000 123
15% increase in import
value on Saba in 2014 C c
64 Trends in the Caribbean Netherlands 2015
3.25 Labour force by gender and age (15–74 yrs)
Total
Gender Age
male female15–24
years25–44
years45–74
years
Persons
2012
Total population 1,650 874 777 353 714 583
Labour force 1,083 585 498 137 544 401
Employed labour force 1,041 558 483 126 525 390
Unemployed labour force 42 27 15 . 19 .
Not in the labour force 568 289 279 216 170 182
%
Gross labour participation 65 .6 67 64 .1 38 .8 76 .2 68 .8
Net labour participation 63 .0 63 .9 62 .1 35 .7 73 .5 66 .8
Unemployment rate 3 .9 4 .6 3 .0 . 3 .6 .
Persons
2014
Total population 1,517 746 771 324 604 589
Labour force 923 469 454 107 407 408
Employed labour force 900 452 448 102 399 399
Unemployed labour force 23 16 . . . .
Not in the labour force 594 277 317 217 197 181
%
Gross labour participation 60 .8 62 .9 58 .9 33 .1 67 .4 69 .3
Net labour participation 59 .3 60 .7 58 31 .5 66 .1 67 .7
Unemployment rate 2 .5 3 .5 . . . .
On Saba education and a job don't go as well together as in the European part of the Netherlands. Therefore, a much lower number of young people has a job than in the Netherlands. Education is also the most important reason why young people on Saba do not have a job. Relatively many foreign medical students live on Saba where they attend the medical school located on the island.
Education levels among native-born islanders often lowAround 55 percent of the population of Saba were born elsewhere, mainly in United States, Canada and the Dominican Republic. Many hotels and restaurants on Saba employ Dutch people, and many others work in education or for the government. A great many of them have secondary and higher levels of education. Workers born on the islands themselves often have lower levels of education.

Saba 65
3.26 Labour-market position by gender and age (15–74 yrs), 2014
Total
Gender Age
male female 15–24 yrs 25–44 yrs 45–74 yrs
Persons
Total population 1,517 746 771 324 604 589
Employed labour force 900 452 448 102 399 399
Unemployed labour force 23 16 . . . .
Not in the labour force 594 277 317 217 197 181
not available and not looking for work 46 20 26 . . 24
not available or not looking for work 537 240 282 200 169 143
wants to work 18 . 17 . . .
does not want to work because of care 28 . 21 . . 22
does not want to work because of education 368 185 184 200 169 .
does not want to work because of retirement/ old age 95 55 40 . . 95
does not want to work because of illness; disability; poor health 28 . 20 . . 26
does not want to work because of other reason . . . . . .
3.27 Gross Domestic Product, 2012
million USD
Gross Domestic Product (market prices) 42
60% of men and women
are employed on Saba
Ff
21,400 USD
GDP per capita on Saba in 2012
Aa

66 Trends in the Caribbean Netherlands 2015
3.28 Employed labour force by sex and full-time/ part-time (15–74 yrs), 2014
0
20
40
60
80
100
FemaleMaleTotal
Full-time (≥35 hrs per week) Part-time (<35 hrs per week)
%
3.30 Net labour participation by level of education, (15–74 yrs)
0
20
40
60
80
100
Level ofeducation:
high
Level ofeducation:
middle
Level ofeducation:
low
20142012
%
3.29 Net labour participation by place of birth (15–74 yrs)
0
20
40
60
80
100
Bornelsewhere
Born inthe Netherlands
Born on the otherisland of Antilles
(incl. Aruba)
Born onthe island
20142012
%
3.31 Net labour participation by household (15–74 yrs)
0
20
40
60
80
100
Othermember
ChildPart of couple withoutchildren
Part ofcouple with
children
Oneparent
Single
20142012
%

Saba 67
3.33 Employed labour force economic activity (15–74 yrs), 2014
19%
2%0%
4%
6%
49%
4% 2%
8%
6%
Economic activity unknown
Culture, recreation and other services
Government and care
Business services
Renting, buying, selling real estate
Financial instutions
Information and communication
Trade, transport, hotels, catering
Construction
Industry (excl. construction, energy)
Agriculture, forestry and fishing
0%
3.32 Jobs of employees by monthly wage and economic activity, 2013
0 20 40 60 80 100
Public administration and services
All economic activities
10,000 or more
5,000 to 10,000
4,500 to 5,000
4,000 to 4,500
3,500 to 4,000
3,000 to 3,500
2,500 to 3,000
2,000 to 2,500
1,500 to 2,000
1,000 to 1,500
500 to 1,000
Less than 500
%

68 Trends in the Caribbean Netherlands 2015
3.34 Employed labour force by position (15–74 years), 2014
Self-employed
Employee with a temporary contract
Employee with a permanent contract
68%
15%
17%
3.35 Jobs of employees by monthly wage and age, 2013
0
20
40
60
80
100
10,000or
more
5,000to
10,000
4,500to
5,000
4,000to
4,500
3,500to
4,000
3,000to
3,500
2,500to
3,000
2,000to
2,500
1,500to
2,000
1,000to
1,500
500to
1,000
lessthan500
75 yrs or older
65 to 74 yrs
55 to 64 yrs
45 to 54 yrs
35 to 44 yrs
25 to 34 yrs
15 to 24 yrs
Younger than 15 yrs
%

Saba 69
Population
3.37 Households, 1 January 2014
Other
Single parent
Couple with children
Couple without children
One-person
53%
20%
16%
10% 2%
3.38 Number of persons in households, 1 January 2014
5 persons and more
4 persons
3 persons
2 persons
1 person
53%
24%
12%
6%5%
3.39 Country of birth of inhabitants, 1 January 2015
Other countries
Netherlands
US and Canada
South and Central America
Former Netherlands Antilles and Aruba
50%
21%
12%
5%
12%
3.36 Population
2013 2014 2015
Total population (1 January) 1,991 1,846 1,811
Male 1,001 919 906
Female 990 927 905
Population density 153 142 139
Population growth −130 −41
Live births 10 11
Deaths 12 16
Registered immigration 305 358
Registered emigration 433 394

70 Trends in the Caribbean Netherlands 2015
3.42 Religious denominations, 2013
%
No religion 17 .0
Roman Catholic Church 42 .0
Pentecostal Church 3 .4
Protestant Church 3 .0
Evangelical Church 3 .7
Anglican 8 .2
Islam 5 .9
Other 16 .8
7 6 5 4 3 2 1 0
0 to 45 to 10
10 to 1415 to 2020 to 2425 to 3030 to 3435 to 4040 to 4445 to 5050 to 5455 to 6060 to 6465 to 7070 to 7475 to 8080 to 84
85 and older
Male Female
%
Age class (yrs)
1 2 3 4 5 6 7
3.40 Age distribution, 1 January 2015
3.41 First nationality of inhabitants, 1 January 2015
Other countries
US and Canada
Netherlands
South and Central America and the Caribbean
62%
17%
14%6%
3.43 Church attendance of people with a denomination, 2013
0
5
10
15
20
25
30
35
40
45
Hardlyor never
Less thanonce a month
Oncea month
2 to 3 timesa month
At leastonce a week

Saba 71
3.44 Languages spoken on Saba, 2013
0
10
20
30
40
50
60
70
80
90
100
Other languageSpanishEnglish
% of population that speaks one language
The language that is most widely spoken as a percentage of the populationwho speak more than one language
Most frequently spoken language
% of population that speaks the language
%
50% of the population
of Saba is male
Aa

72 Trends in the Caribbean Netherlands 2015
What is inflation?In terms of economics, inflation is the average
increase in prices of goods and services
purchased by consumers. Inflation leads to
currency devaluation, which means that fewer
goods or services can be purchased with the
same amount of money.
In the Caribbean Netherlands, as in most
countries, the consumer price index (CPI) is used
to calculate official inflation. The CPI reflects
changes in prices of an established average
package of consumer goods and services.
Inflation in a certain month is calculated as the
percentage change of the CPI for that month
compared to CPI for the same month in the
previous year.
If the inflation of a certain month is lower
than that of the previous month, this does not
automatically mean that prices in general have
decreased. Lower inflation can also be caused by
higher prices in the previous year.
Prices
3.46 CPI and inflation
2011 2012 2013 2014
Consumer price index (2010=100)106 .41 110 .38 111 .71 113 .95
inflation (%) 6 .4 3 .7 1 .2 2.0
3.45 Expenditure by consumers, 2013
% of total spending
Food and non-alcoholic beverages 25 .6
Alcoholic beverages and tobacco 1 .5
Clothing and footwear 4 .2
Housing, water, electricity, gas 10 .9
Furnishing, household equipment 5 .6
Health 1 .7
Transport 14 .5
Communication 8 .7
Recreation and culture 3 .4
Education 2 .2
Hotels and restaurants 7 .3
Miscellaneous goods and services 14 .4
Total expenditure 100 .0

Saba 73
Inflation on SabaInflation according to the consumer price index
(CPI) on Saba went down further in the second
quarter of 2015. On Saba inflation dropped to
0.4 percent in the second quarter. Consumer
prices in the first quarter were still up by
1 percent on the same quarter of 2014. The
decrease was mainly due to prices in restaurants
and cafes but also cosmetics and air tickets,
which had a downward effect on inflation.
3.47 Breakdown of total household consumption, 2013
0 5 10 15 20 25 30
Miscellaneous goods and servicesHotels and restaurants
EducationRecreation and culture
CommunicationTransport
HealthFurnishing, household equipment
Housing, water, electricity, gasClothing and footwear
Alcoholic beverages and tobaccoFood and non-alcoholic beverages
% of total consumption
3.48 Breakdown of household consumption of food and non-alcoholic beverages, 2013
0 5 10 15 20
Mineral waters, soft drinks, juice
Co�ee, tea and cocoa
Food products, n.e.c.
Sugar, sweets and ice cream
Vegetables and potatoes
Fruit
Oils and fats
Milk, cheese and eggs
Fish
Meat
Bread and cereals
% of food consumption
3.49 Expenditure on food and non-alcoholic beverages, 2013
% of food spending
Bread and cereals 17 .0
Meat 17 .5
Fish 1 .8
Milk, cheese and eggs 12 .2
Oils and fats 3 .5
Fruit 9 .5
Vegetables and potatoes 12 .8
Sugar, sweets and ice cream 4 .5
Food products, n.e.c. 7 .1
Coffee, tea and cocoa 2 .4
Mineral waters, soft drinks, juice 11 .7
Food and non-alcoholic beverages 100 .0

74 Trends in the Caribbean Netherlands 2015
2010=100
3.50 Consumer price index (CPI)
2010 2011 2012 2013 2014 2015
98100102104106108110112114116
IIIIVIIIIIIIVIIIIIIIVIIIIIIIVIIIIIIIVIIIIII
3.51 In�ation
2011 2012 2013 2014 2015
012345678
IIIIVIIIIIIIVIIIIIIIVIIIIIIIVIIIIII
2.0% inflation
on Saba in 2014
FDFd
3.2% increase of food
prices on Saba in 2014
Bb

Saba 75
3.52 Registered crime suspects
2012 2013 2014
Murder/manslaughter and attempted murder/manslaughter 2 3 0
Violent crime 28 16 13
Sexual offences 1 3 1
Property crime 7 2 3
Weapon-related crime 5 0 0
Drugs-related crime 7 8 1
Other 10 8 9
Source: Public Prosecutor's office Bonaire, St. Eustatius and Saba.
Security and Justice
3.54 Feeling unsafe, 2013
Never
Seldom
Sometimes
72%
15%
10%
3.53 Registered crime suspects, 2014
Other
Drugs-related crime
Property crime
Sexual o�ences
Violent crime
4%
33%
11%4%
48%
Source: Public Prosecutor's o�ce Bonaire, St. Eustatius and Saba
76 Trends in the Caribbean Netherlands 2015
3.55 Perception of crime in own neighbourhood, 2013
01020304050607080
No crimeLittle crime
%
3.56 Percentage of population reporting neighbourhood decline, 2013
0
10
20
30
40
50
Animal faeceson sidewalks
or in the street
Vandalisedpublic items
Litter/junkin the street
%
3.57 Percentage of population reporting social nuisance, 2013
0
5
10
15
20
25
30
Youthshanging about
People beingbothered
in the street
Drug abuseor drug dealing
Drunksin the street
%
3.58 Percentage of population reporting tra�c nuisance, 2013
0
10
20
30
40
50
60
70
Aggressivebehaviour in tra�c
Parkingissues
Speeding
%
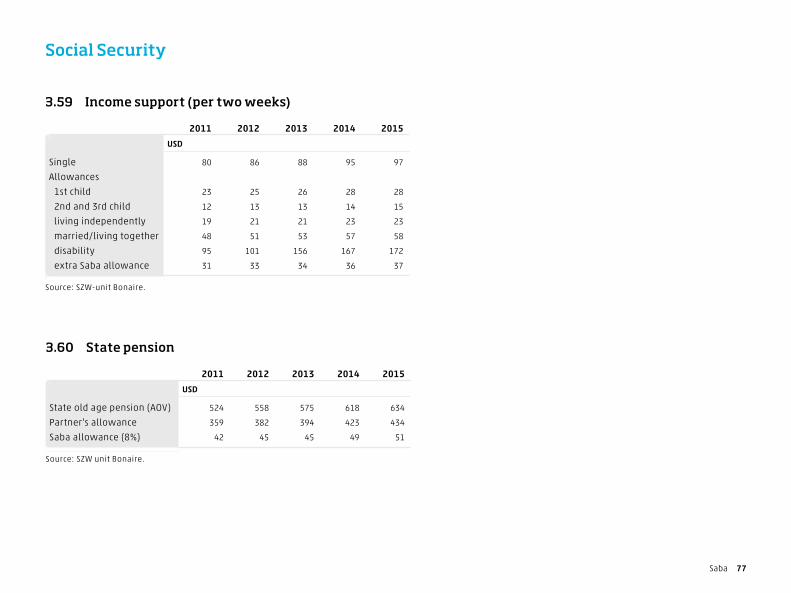
Saba 77
3.60 State pension
2011 2012 2013 2014 2015
USD
State old age pension (AOV) 524 558 575 618 634
Partner's allowance 359 382 394 423 434
Saba allowance (8%) 42 45 45 49 51
Source: SZW unit Bonaire.
3.59 Income support (per two weeks)
2011 2012 2013 2014 2015
USD
Single 80 86 88 95 97
Allowances
1st child 23 25 26 28 28
2nd and 3rd child 12 13 13 14 15
living independently 19 21 21 23 23
married/living together 48 51 53 57 58
disability 95 101 156 167 172
extra Saba allowance 31 33 34 36 37
Source: SZW-unit Bonaire.
Social Security

78 Trends in the Caribbean Netherlands 2015
Traffic, Transport & Tourism
The number of tourists flying to Saba in 2014 was almost the same as in 2013. However, on average the length of stay was shorter. The number of overnight stays of tourists arriving by airplane on Saba decreased in 2014. Tourists who arrive by boat are also an important driver for tourism on Saba, as important as the tourists who arrive by airplane. Saba was visited by 10.4 thousand boat passengers, almost as many as the 10.3 thousand tourists who arrived by airplane in 2014. Over 60 percent of the boat passengers arrived on the two ferries that sail between St Maarten and Saba, although it is not yet possible to determine how many ferry passengers are residents and how many are tourists.
On average nearly 900 tourists per month arrive by airplaneIn 2014, an average of almost 900 tourists per month travelled to Saba by airplane, bringing the total to 10,300 tourists per year. This number is comparable to that of 2013.
3.61 Passengers and aircrafts Juancho E. Yrausquin Airport per year
Aircraft
movementsTotal
PassengersPassengers
arrivalsPassengers departures
x 1,000
2012 3 29 .2 14 .3 14 .9
2013 3 .2 30 .9 15 .2 15 .7
2014 3 .1 32 .4 15 .9 16 .6
3.62 Passengers and aircrafts Juancho E. Yrausquin Airport per quarter
Aircraft
movementsTotal
PassengersPassengers
arrivalsPassengers departures
x 1,000
2013-I 0 .8 8 .5 4 .4 4 .1
2013-II 0 .8 7 .9 3 .9 4
2013-III 0 .8 7 .5 3 .6 3 .9
2013-IV 0 .8 7 3 .3 3 .7
2014-I 0 .8 8 .3 4 .2 4 .1
2014-II 0 .8 8 3 .9 4 .1
2014-III 0 .8 7 .5 3 .7 3 .8
2014-IV 0 .8 8 .6 4 4 .6
2015-I 0 .8 8 .6 4 .4 4 .1
2015-II 0.8 8.0 3.8 4.2

Saba 79
Dutch and Americans account for most foreign tourists arriving by airOn Saba most tourists arriving by air in 2014 had the Dutch or American nationality. Through the years, the share of American tourists has been higher in Saba than in Bonaire and St Eustatius. Just as on Bonaire, the share of tourists with the Dutch nationality has decreased in the past three years.Of the 10.3 thousand tourists who arrived on Saba by airplane over a fifth, that is 2.4 thousand tourists, just stayed for a single day. For the other four-fifths the most popular length of stay was between 1 to 3 nights. The average length of stay for the latter group in 2014 was 6.9 nights, which was down from the 7.6 nights in 2013.
Number of passengers arriving by boat equal to the number of tourists flying inIt is difficult for large cruise liners to call at Saba. Saba also does not have any protected harbours. However, there are two ferries that connect Saba with St Maarten and there are anchorages for motorboats, yachts and other small vessels. A total 500 of such vessels called at Saba in 2014, carrying approximately 3.7 thousand tourists. The average number of
3.63 Inbound tourism by air, 2012–2014
2014*2013*2012**
0
0.2
0.4
0.6
0.8
1.0
1.2
1.4
DecNovOctSepAugJulJunMayAprMarFebJan
Tourists (x 1,000)
10,400 boat passengers
visited Saba in 2014
A a

80 Trends in the Caribbean Netherlands 2015
passenger per vessel was 7.4. The average length of stay was 2.1 days. The most common nationalities of the ships were American, French and British. The two ferries carried about 6.7 thousand passengers to Saba in 2014.
3.65 Inbound tourism by air and by nationality, 2012–2014
2013*2012**
0 10 20 30 40 50 60
Other nationalities
Other European nationalities
British
German
Dominican
French
Canadian
American
Dutch (incl. St. Maarten,Aruba and Curaçao)
2014*
% of tourists
3.64 Number of tourists arriving by air, 2012–2014
2012** 2013* 2014*
x 1,000
January 1 .1 1 .1 1 .1
February 0 .9 0 .8 0 .8
March 1 .0 0 .9 0 .9
April 0 .8 0 .9 0 .9
May 1 .0 0 .9 0 .9
June 0 .9 0 .8 0 .8
July 1 .0 0 .9 0 .8
August 0 .8 0 .8 0 .8
September 0 .8 0 .8 0 .7
October 0 .7 0 .7 0 .8
November 0 .8 0 .8 0 .9
December 0 .8 0 .9 0 .9
Total 10 .5 10 .3 10 .3

Saba 81
3.66 Arrivals and departures Juancho E. Yrasquin Airport
x 1,000
DeparturesArrivals
0
0.5
1.0
1.5
2.0
2.5
Jun*May*Apr*Mar*Feb*Jan*DecNovOctSepAugJulJunMayAprMarFebJanDecNovOctSepAugJulJunMayAprMarFebJan
2013 2014 2015
3.67 Inbound tourism by air and by nationality, 2012–2014
2012** 2013* 2014*
% of tourists
Dutch 49 43 40
American 23 26 28
Canadian 9 10 10
French 4 5 5
Dominican 2 3 3
German 1 2 2
British 1 2 2
Other European nationalities 3 3 3
Other nationalities 8 7 8

82 Trends in the Caribbean Netherlands 20156 Trends in Nederland 2015
St Eustatius
3,877inhabitants
66%Dutch nationality
85%English fi rst language

St Eustatius 836 Trends in Nederland 2015
St Eustatius
3,877inhabitants
66%Dutch nationality
85%English fi rst language
4. St EustatiusLike Saba and St Maarten, St Eustatius is one of the Leeward islands. Some 4 thousand people live on the island with an area of 21 km2 and a population density of 185. The population has increased by a little less than 200 people since January 2011. With 120 the population of men grew twice as fast as the population of women. The labour force is 2.4 thousand strong of which 2.2 thousand people are employed. So 68 percent of the population aged 15–74 years are working. The unemployment rate is almost 9. Nearly half of the population – 45 percent – were born on one of the islands making up the former Netherlands Antilles or Aruba and 66 percent have the Dutch nationality. English is the main language of 85 percent of the population; 6 percent speak mainly Dutch and another 7 percent mainly Spanish. Dutch is the first language of 6 percent of the population on St Eustatius. On St Eustatius 68 percent of the population speak more than one language. On Saba and St Eustatius 83 percent of inhabitants said they were religious. St Eustatius has three main religions:
almost a quarter of inhabitants are Catholic, just under one in five are Methodists and one in six Adventists.The size of the economy, measured by the Gross Domestic Product (GDP), of St Eustatius amounted to USD 101 million in 2012. Since the number of inhabitants on St Eustatius was 3,844 in 2012, GDP per capita was USD 26,300.

84 Trends in the Caribbean Netherlands 2015
339in primary education
43in secondary vocational education
236in secondary education
Pupils in government funded schools on St Eustatius, 1 October 2014

St Eustatius 85
26% of the primary school pupils in
St Eustatius are younger than 6
Aa
Education
4.1 Government funded schools 2014/'15*
Primary education 4
Secondary education including senior secondary vocational education 1
Source: OCW-unit Bonaire.
4.2 Pupils in government funded schools, 1 October 2014
2011/'12 2012/'13 2013/'14 2014/'15*
Primary education 356 365 340 339
Secondary education 251 244 253 236
Secondary vocational education 0 31 39 43
Total 607 640 632 618
4.3 Pupils in government funded schools, 1 October 2014
Secondary vocational education
Secondary education
Primary education
55%
38%
7%

86 Trends in the Caribbean Netherlands 2015
4.5 Pupils in secondary and secondary vocational government funded schools
2010/'11 2011/'12 2012/'13 2013/'14 2014/'15*
Secondary Vocational (bbl) 0 0 0 0 0
Secondary Vocational (bol) 0 0 31 39 43
Students in secondary education 265 251 244 253 236
Total 265 251 275 292 279
Energy4.4 Pupils in primary education on government funded schools
2012/'13 2013/'14 2014/'15*
4 yrs and younger 35 39 45
5 yrs 41 36 44
6 yrs 39 39 37
7 yrs 45 37 43
8 yrs 55 45 36
9 yrs 39 48 46
10 yrs 46 40 43
11 yrs 54 43 37
12 yrs 10 12 8
13 yrs 1 1 0
Total primary education 365 340 339
4.6 Electricity production
0
5
10
15
2014*2013*201220112010200920082007

St Eustatius 87
4.7 Contact with medical professionals, 2013
% Persons with at least 1 contact
Average number of contacts (patient)
Contact with GP in the last 12 months 71 .7 11 .8
Contact with medical specialist in the last 12 months 47 .6 11 .1
Contact with dentist in the last 12 months 50 .2 4 .3
Health and Welfare
4.9 Use of medicines, 2013
%
Prescribed medicines in 2 weeks 33 .3
Non-prescribed medicines in 2 weeks 23 .9
4.8 Percentage of population who su�er from chronic disorders, 2013
0
10
20
30
40
50
60
% with 3 or more chronic disorders
% with 2 chronic disorders
% with 1 chronic disorder
% without chronic disorder
7% of over –15s on
St Eustatius smoke every dayEe

88 Trends in the Caribbean Netherlands 2015
4.10 Percentage of population who are overweight, 2013
Seriously overweight
Moderately overweight
Normal weight
38.8%
28.0%
29.5%
4.12 Percentage of population who feel happy, 2013
Happy
Not happy, not unhappy
Unhappy6%
8%
86%
4.11 Percentage of population who are satis�ed with life, 2013
Satisfied
Not satisfied, not unsatisfied
Unsatisfied5%
10%
85%
86% of the population
of St Eustatius feel happy
Gg

St Eustatius 89
4.13 Water supply, 2013
%1)
Waterworks 2 .8
Cistern or well 94 .5
Water truck 29 .6
Bottled water 26 .1
1) The sum may be more than 100%, as households may have more than one source of water.
4.15 Fuel used most for cooking, 2013
%
Gas 95 .9
Electricity 3 .6
4.16 Means of transport in household, 2013
%
Cars 74 .5
one car 48.9
more than one car 25.6
Bicycles 32 .2
Motorcycles 5 .8
Mopeds and scooters 9 .3
Household amenities
4.17 Devices in the home, 2013
% of households
Television 96 .0
Landline telephone 41 .5
Mobile phone 90 .7
Personal computer 40 .0
Laptop 55 .0
Tablet 29 .2
Games computer 27 .7
4.14 Appliances in the home, 2013
0 20 40 60 80 100 120
Refrigerator
Separate freezer
Washing machine
Dishwasher

90 Trends in the Caribbean Netherlands 2015
4.18 Internet use, 2013
Never been online
Last online more than 1 year ago
Last online 3 months and 1 year ago
Last online in the previous 3 months
6%
4%
28%
63%
4.19 Internet activities (reasons being online) in the last 3 months, 2013
0 10 20 30 40 50 60 70 80 90
Social networking, e.g. Facebook, Twitter
Professional networking
Exchanging text messages with others
Reading or writing weblogs
Posting messages on chatsites
Sending or receiving e-mails
%
4.20 Internet activities (reasons being online) in the last 3 months, 2013
0 10 20 30 40 50
Downloading software other than for games
Uploading photos, music, text or software
Playing or downloading games, films or music
Online banking
Reading newspapers
Listening to the radio/ watching televison
%

St Eustatius 91
4.21 Internet use in previous 3 months (frequent users), 2013
At least once a week, but not every day
Every day or nearly every day
11%
86%
53% of the households on
St Eustatius consist of 1 personAa
The median income of households in the lowest 25 percent income bracket on St Eustatius was 6.9 thousand dollars in 2011 and 7.7 thousand dollars in 2012, an increase of more than 11%.
On St Eustatius the median disposable household income was 24.5 thousand dollars in 2011 and 26.7 thousand dollars in 2012. The median disposable income of the highest 25 percent income bracket was 63.2 thousand dollars in 2011 and 63.1 thousand dollars in 2012.
Most households generated income from labour, running their own business and property (primary income). On St Eustatius 89 percent of the households mainly had a primary income in 2012 and 84 percent in 2011. This primary income was 27.6 in 2011 and 30.1 thousand dollars in 2012.The median disposable income of households mainly relying on benefits was 6.9 thousand dollars in 2011 and 7.7 thousand dollars in 2012.
Income

92 Trends in the Caribbean Netherlands 2015
In general someone’s income level is related to their life stage. Young people at the start of their professional career earn relatively low wages. When they grow older, their income from labour increases as they gain more work experience and have access to better paying jobs. When they reach the retirement age, their income falls again. This pattern is prevalent in incomes on the Caribbean Netherlands. On all three islands, households with a main breadwinner in the age category of 40 to 59 years had the highest incomes. On St Eustatius the median income of these types of households was 28.8 thousand dollars in 2011 and 32.4 thousand dollars in 2012. The median income of the under 40s increased to 22.5 thousand dollars in 2012 from 22.1 thousand dollars in 2011. The median income of people aged over 60 also increased, from 16.0 thousand dollars in 2011 to 17.1 thousand dollars in 2012.
Multi-person households usually have more than one income earner. As a result, multi-person households usually have higher incomes than single-person households. On the
4.22 Income from (private) households to various characteristics, 2011–2012*
YearHouseholds Disposable income
number average median
x 1,000 USD
Total 2011 950 32 .1 24 .5
2012 950 34 .3 26 .7
Income quartile1st quartile (low income) 2011 250 6 .5 6 .9
2012 250 7 .1 7 .7
2nd quartile 2011 250 18 .2 18 .1
2012 250 19 .5 19 .3
3rd quartile 2011 250 32 .9 32 .9
2012 250 35 .6 34 .6
4th quartile (high income) 2011 250 71 .0 63 .2
2012 250 75 .1 63 .1
Age classup to 40 years 2011 250 28 .5 22 .1
2012 250 27 .6 22 .5
40 to 59 years 2011 500 37 .2 28 .8
2012 500 41 .0 32 .4
60 years and over 2011 250 25 .2 16 .0
2012 250 28 .2 17 .1
Number of household members1 person 2011 300 21 .2 15 .5
2012 300 22 .9 17 .6
2 and more persons 2011 650 37 .0 28 .8
2012 650 40 .0 31 .8
Main source of incomePrimary income 2011 800 35 .7 27 .6
2012 850 38 .2 30 .1
Transfer income 2011 100 8 .0 6 .9
2012 150 9 .2 7 .7

St Eustatius 93
three Caribbean islands, incomes of multi-person households are higher than incomes of single-person households.
4.23 Average disposable income of (private) house- holds by income quartile, 2011–2012*
Year
Persons Personal income
number average median
x 1,000 USD
Total 2011 1,450 29 .4 20 .9
2012 1,500 31 .2 22 .8
1st quartile (low income) 2011 350 5 .5 6 .1
2012 400 5 .5 5 .9
2nd quartile 2011 350 14 .4 13 .9
2012 400 15 .8 16 .1
3rd quartile 2011 350 28 .9 28 .6
2012 400 31 .8 31 .5
4th quartile (high income) 2011 350 68 .6 59 .5
2012 400 71 .7 63 .4
4.24 Primary income of individuals of 20 to 60 years in (private) households, by income quartile, 2011–2012*
Year
Persons Primary income
number average median
x 1,000 USD
Total 2011 1,050 37 .0 27 .9
2012 1,100 39 .1 30 .6
1st quartile (low income) 2011 250 8 .2 9 .4
2012 250 8 .4 9 .1
2nd quartile 2011 250 20 .8 20 .8
2012 250 22 .6 22 .0
3rd quartile 2011 250 37 .1 36 .0
2012 250 41 .0 40 .5
4th quartile (high income) 2011 250 81 .6 72 .0
2012 250 84 .5 75 .4

94 Trends in the Caribbean Netherlands 2015
4.25 Total import and export value per quarter
Imports Exports
x 1,000 USD
2013 I 12,580 999
2013 II 9,420 442
2013 III 8,793 2,323
2013 IV 10,147 2,011
2013 40,940 5,775
2014 I 7,462 468
2014 II 8,539 92
2014 III 9,009 379
2014 IV 10,060 144
2014 35,070 1,083
2015 I 7,695 153
2015 II* 10,440 147
International trade
14% decrease in import
value in 2014 on St EustatiusDd

St Eustatius 95
4.26 Labour force by gender and age (15–74 yrs)
Total
Gender Age
male female15–24
years25–44
years45–74
years
Persons
2012
Total population 2,982 1,666 1,316 384 1,230 1,368
Labour force 2,160 1,277 882 93 1,060 1,008
Employed labour force 2,091 1,241 851 88 1,027 976
Unemployed labour force 69 37 32 . 33 32
Not in the labour force 822 388 433 291 170 360
%
Gross labour participation 72 .4 76 .7 67 .1 24 .1 86 .2 73 .7
Net labour participation 70 .1 74 .5 64 .7 23 .0 83 .5 71 .4
Unemployment rate 3 .2 2 .9 3 .6 . 3 .1 3 .2
Persons
2014
Total population 3,251 1,834 1,417 391 1,305 1,555
Labour force 2,416 1,442 974 142 1,167 1,106
Employed labour force 2,203 1,302 901 105 1,101 997
Unemployed labour force 213 140 73 37 66 109
Not in the labour force 835 392 443 249 138 449
%
Gross labour participation 74 .3 78 .6 68 .7 36 .3 89 .5 71 .2
Net labour participation 67 .8 71 .0 63 .6 26 .9 84 .4 64 .1
Unemployment rate 8 .8 9 .7 7 .5 26 .1 5 .7 9 .9
The working age population on St Eustatius (age 15–74) is nearly 3.3 thousand strong and 67.8 percent have a job. Island participation rates are higher for men than for women, over 90 percent of the men work on a full-time basis. The unemployment rate is 8.8 percent. Unemployment is especially high among young people on the island. The NuStar storage terminal has a significant impact on the labour market on St Eustatius, as do the government and care sectors. On St Eustatius education and a job don’t go as well together as in the European part of the Netherlands. About 45 percent of the young people on St Eustatius are not looking for a job and are not available to start work. Young students on St Eustatius don’t work alongside their studies. Education is also one of the main reasons why people on the islands do not want to, or are not available for, work. People with a Dutch nationality on St Eustatius work mainly in education and government. Many of them have secondary and higher levels of education. Workers born on the islands themselves often have lower levels of education.
Labour

96 Trends in the Caribbean Netherlands 2015
8.8% unemployment rate
on St Eustatius in 2014
Ee
4.27 Labour-market position by gender and age (15–74 yrs), 2014
Total
Gender Age
male female 15–24 years 25–44 years 45–74 years
Persons
Total population 3,251 1,834 1,417 391 1,305 1,555
Employed labour force 2,203 1,302 901 105 1,101 997
Unemployed labour force 213 140 73 37 66 109
Not in the labour force 835 392 443 249 138 449
not available or not looking for work 266 167 99 71 92 102
not available and not looking for work 569 216 344 168 39 348
wants to work 102 31 71 32 24 45
does not want to work because of care 48 . 48 . 15 33
does not want to work because of education 116 69 47 116 . .
does not want to work because of retirement/ old age 162 65 97 . . 162
does not want to work because of illness; disability; poor health 102 51 52 . . 88
does not want to work because of other reason 39 . 29 20 . 20

St Eustatius 97
4.29 Net labour participation by place of birth
0
20
40
60
80
100
Born elsewhere
Born in the Netherlands
Born on the other island of
Antilles (incl. Aruba)
Born on the island
20142012
%
4.31 Net labour participation by household
0
20
40
60
80
100
20142012
Othermember
ChildPartof couple
withoutchildren
Partof couple
withchildren
One parentSingle
%
4.30 Net labour participation by level of education (15–74 yrs)
0
20
40
60
80
100
Level ofeducation:
high
Level ofeducation:
middle
Level ofeducation:
low
20142012
%
4.28 Employed labour force by sex and full-time/ part-time (15–74 yrs), 2014
0
20
40
60
80
100
FemaleMaleTotal
Full-time (>=35 hrs per week) Part-time (<35 hrs per week)
%

98 Trends in the Caribbean Netherlands 2015
4.33 Employed labour force (15–74 yrs), 2014
15%
11%
42%
5%4% 0%
0%0%
0%
8%
13%
Economic activity unknown
Culture, recreation and other services
Government and care
Business services
Renting, buying, selling real estate
Financial instutions
Information and communication
Trade, transport, hotels, catering
Construction
Industry (excl. construction, energy)
Agriculture, forestry and fishing
4.32 Employed labour force by position (15–74 yrs), 2014
Self-employed
Employee with a temporary contract
Employee with a permanent contract
82%
8%
10%

St Eustatius 99
4.35 Jobs of employees by monthly wage and economic activity, 2013
0 10 20 30 40 50 60 70 80 90 100
Public administration and services
All economic activities
10,000 or more
5,000 to 10,000
4,500 to 5,000
4,000 to 4,500
3,500 to 4,000
3,000 to 3,500
2,500 to 3,000
2,000 to 2,500
1,500 to 2,000
1,000 to 1,500
500 to 1,000
Less than 500
%
4.34 Jobs of employees by monthly wage and age, 2013
0
20
40
60
80
100
10,000 or
more
5,000 to
10,000
4,500 to
5,000
4,000 to
4,500
3,500 to
4,000
3,000 to
3,500
2,500 to
3,000
2,000 to
2,500
1,500 to
2,000
1,000 to
1,500
500 to
1,000
less than 500
75 yrs or older
65 to 74 yrs
55 to 64 yrs
45 to 54 yrs
35 to 44 yrs
25 to 34 yrs
15 to 24 yrs
Younger than 15 yrs
%

100 Trends in the Caribbean Netherlands 2015
4.37 Population
2013 2014 2015
Total population (1 January) 3,897 4,020 3,877
male 2,159 2,225 2,130
female 1,738 1,795 1,747
Population density 186 191 185
Population growth 138 -134
Live births 51 24
Deaths 18 22
Registered immigration 378 177
Registered emigration 273 313
PopulationMacroeconomics
4.36 Gross Domestic Product, 2012
millions of USD
Gross Domestic Product (market prices) 101
4.38 Households, 1 January 2014
Other
Single parent
Couple with children
Couple without children
One-person
53%
17%
15%
12%3%
26,300 USD GDP per
capita on St Eustatius in 2012
CACa

St Eustatius 101
4.39 Number of persons in households, 1 January 2014
5 persons and more
4 persons
3 persons
2 persons
1 person
53%
21%
11%
7%7%
6 5 4 3 2 1 0
0 to 45 to 9
9 to 1415 to 1919 to 2425 to 2929 to 3435 to 3939 to 4445 to 4949 to 5455 to 5959 to 6465 to 6969 to 7475 to 7979 to 84
85 and older
Male Female
%
Age class (yrs)
1 2 3 4 5 6
4.40 Age distribution, 1 January 2015
4.41 Country of birth of inhabitants, 1 January 2015
Other countries
Netherlands
US and Canada
South and Central America
Former Netherlands Antilles and Aruba
45%
32%
10%
6%7%
4.42 First nationality of inhabitants, 1 January 2015
Other countries
US and Canada
Netherlands
South and Central America and the Caribbean
66%
11% 19%5%
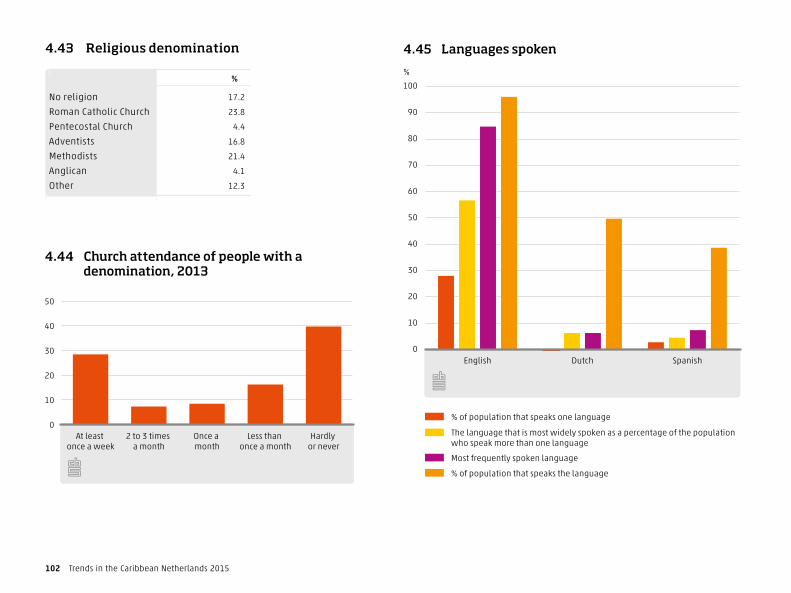
102 Trends in the Caribbean Netherlands 2015
4.44 Church attendance of people with a denomination, 2013
0
10
20
30
40
50
Hardly or never
Less than once a month
Once a month
2 to 3 times a month
At least once a week
4.43 Religious denomination
%
No religion 17 .2
Roman Catholic Church 23 .8
Pentecostal Church 4 .4
Adventists 16 .8
Methodists 21 .4
Anglican 4 .1
Other 12 .3
4.45 Languages spoken
% of population that speaks the language
Most frequently spoken language
The language that is most widely spoken as a percentage of the population who speak more than one language
% of population that speaks one language
0
10
20
30
40
50
60
70
80
90
100
SpanishDutchEnglish
%

St Eustatius 103
What is inflation?In terms of economics, inflation is the average increase in prices of goods and services purchased by consumers. Inflation leads to currency devaluation, which means that fewer goods or services can be purchased with the same amount of money.
In the Caribbean Netherlands, as in most countries, the consumer price index (CPI) is used to calculate official inflation. The CPI reflects changes in prices of an established average package of consumer goods and services. Inflation in a certain month is calculated as the percentage change of the CPI for that month compared to CPI for the same month in the previous year.
If the inflation of a certain month is lower than that of the previous month, this does not automatically mean that prices in general have decreased. Lower inflation can also be caused by higher prices in the previous year.
Prices
4.47 In�ation
2011 2012 2013 2014 2015
–2
0
2
4
6
8
10
12
IIIIVIIIIIIIVIIIIIIIVIIIIIIIVIIIIII
4.46 Consumer price index (CPI)
2010 2011 2012 2013 2014 2015
95
100
105
110
115
120
125
IIIIVIIIIIIIVIIIIIIIVIIIIIIIVIIIIIIIVIIIIII
2010=100
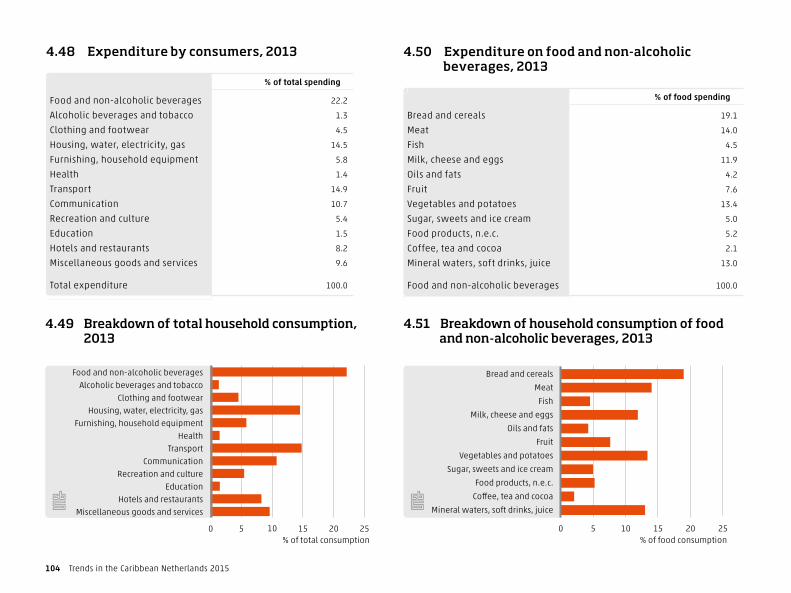
104 Trends in the Caribbean Netherlands 2015
4.49 Breakdown of total household consumption, 2013
0 5 10 15 20 25
Miscellaneous goods and servicesHotels and restaurants
EducationRecreation and culture
CommunicationTransport
HealthFurnishing, household equipment
Housing, water, electricity, gasClothing and footwear
Alcoholic beverages and tobaccoFood and non-alcoholic beverages
% of total consumption
4.51 Breakdown of household consumption of food and non-alcoholic beverages, 2013
0 5 10 15 20 25
Mineral waters, soft drinks, juice
Co�ee, tea and cocoa
Food products, n.e.c.
Sugar, sweets and ice cream
Vegetables and potatoes
Fruit
Oils and fats
Milk, cheese and eggs
Fish
Meat
Bread and cereals
% of food consumption
4.48 Expenditure by consumers, 2013
% of total spending
Food and non-alcoholic beverages 22 .2
Alcoholic beverages and tobacco 1 .3
Clothing and footwear 4 .5
Housing, water, electricity, gas 14 .5
Furnishing, household equipment 5 .8
Health 1 .4
Transport 14 .9
Communication 10 .7
Recreation and culture 5 .4
Education 1 .5
Hotels and restaurants 8 .2
Miscellaneous goods and services 9 .6
Total expenditure 100 .0
4.50 Expenditure on food and non-alcoholic beverages, 2013
% of food spending
Bread and cereals 19 .1
Meat 14 .0
Fish 4 .5
Milk, cheese and eggs 11 .9
Oils and fats 4 .2
Fruit 7 .6
Vegetables and potatoes 13 .4
Sugar, sweets and ice cream 5 .0
Food products, n.e.c. 5 .2
Coffee, tea and cocoa 2 .1
Mineral waters, soft drinks, juice 13 .0
Food and non-alcoholic beverages 100 .0

St Eustatius 105
7.1% increase in
transportation prices in 2014
Dd
4.52 CPI and inflation
2011 2012 2013 2014
Consumer price index (2010=100) 109 .90 115 .76 118 .47 121 .52
inflation (%) 9 .9 5 .3 2 .3 2 .6
Inflation on St EustatiusThe inflation has been falling consistently ever since Statistics Netherlands started measuring inflation for the Caribbean Netherlands in October 2010. For the very first time negative inflation was reported for St Eustatius in the first and second quarters of 2015.
On St Eustatius inflation fell for three consecutive quarters and came out at –1.7 percent in the second quarter of 2015. That is down 0.6 percentage points on the first quarter. Food prices accounted for much of the lower inflation rate.
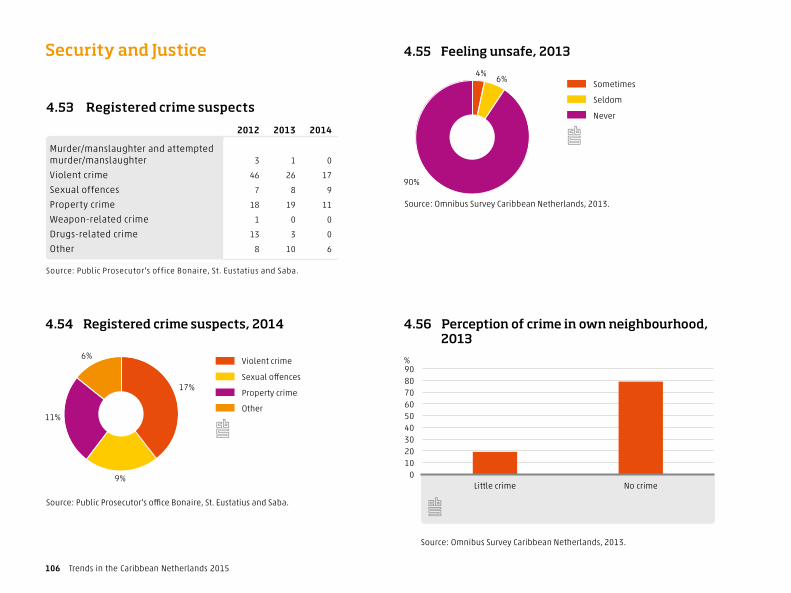
106 Trends in the Caribbean Netherlands 2015
Security and Justice
4.53 Registered crime suspects
2012 2013 2014
Murder/manslaughter and attempted murder/manslaughter 3 1 0
Violent crime 46 26 17
Sexual offences 7 8 9
Property crime 18 19 11
Weapon-related crime 1 0 0
Drugs-related crime 13 3 0
Other 8 10 6
Source: Public Prosecutor's office Bonaire, St. Eustatius and Saba.
4.55 Feeling unsafe, 2013
Never
Seldom
Sometimes
90%
6%4%
Source: Omnibus Survey Caribbean Netherlands, 2013.
4.54 Registered crime suspects, 2014
Other
Property crime
Sexual o ences
Violent crime6%
11%
9%
17%
Source: Public Prosecutor's o�ce Bonaire, St. Eustatius and Saba.
4.56 Perception of crime in own neighbourhood, 2013
0102030405060708090
No crimeLittle crime
Source: Omnibus Survey Caribbean Netherlands, 2013.
%

St Eustatius 107
4.57 Percentage of population reporting neighbourhood decline, 2013
01020304050607080
Animal faeces on sidewalks or in
the street
Gra�ti on walls or buildings
Vandalised public items
Litter/junk in the street
%
4.59 Percentage of population reporting social nuisance, 2013
0
5
10
15
20
Youths hanging about
People being bothered
in the street
Drug abuse or drug dealing
Drunks in the street
%
4.58 Percentage of population reporting tra�c nuisance, 2013
0
10
20
30
40
Aggressive behaviourParking issuesSpeeding
%

108 Trends in the Caribbean Netherlands 2015
4.60 Income support (per two weeks)
2011 2012 2013 2014 2015
USD
Single 80 89 94 95 98
Allowances
1st child 23 26 27 28 29
2nd and 3rd child 12 14 14 14 15
living independently 19 22 23 23 24
married/living together 48 53 56 57 59
disability 95 105 164 168 173
Source: SZW-unit.
4.61 State pension
2011 2012 2013 2014 2015
USD
State old age pension (AOV) 524 582 609 619 640
Partner's allowance 359 399 417 424 439
St Eustatius allowance (2%) 10 12 12 12 13
Source: SZW unit Bonaire.
Social security

St Eustatius 109
4.62 Passengers and aircrafts F.D. Roosevelt Airport per year
Aircraft
movementsTotal
PassengersPassengers
arrivalsPassengers departures
x 1,000
2012 5 .5 46 .5 23 .2 23 .3
2013 5 .7 43 .2 21 .6 21 .6
2014 5 .8 42 .6 21 .2 21 .3
The number of tourists who arrived in St Eustatius by airplane in 2014 was almost the same as in 2013. These tourists stayed on average for shorter periods on St Eustatius, so the number of overnight stays decreased in 2014. Most tourists arriving by airplane in St Eustatius had the Dutch or American (including Puerto Rican) nationality. About 900 tourists per month flew to St Eustatius in 2014, bringing the total annual average to nearly 11 thousand tourists. This is roughly the same as in 2013. Just over 50 percent of the tourists arriving by airplane stay up to 7 nights. Some 2,200 of the 11 thousand tourists who arrived by airplane were day trippers. The length of stay for the other tourists peaked at 1 to 3 nights. Just over 50 percent of the tourists who arrived by airplane and spent at least one night on St Eustatius stayed for seven nights or less. The average length of stay of this group in 2014 was 9.7 nights.
Traffic, Transport & Tourism
4.63 Inbound tourism by air and by nationality, 2012–2014
2012** 2013* 2014*
% of tourists
Dutch 56 56 53
American 11 13 12
Dominican 4 4 3
French 3 4 4
Canadian 2 2 1
Philippine 2 2 2
British 2 2 2
Other European nationalities 7 5 6
Other nationalities 13 13 16

110 Trends in the Caribbean Netherlands 2015
Boats bring in 3.7 thousand touristsLarge cruise ships cannot dock at St Eustatius. The 650 small vessels visiting the island in 2014 included motor boats, yachts and a small cruise ship. These carried 3.7 thousand tourists with an average of 5.7 passengers per ship. The average stay of these vessels in St Eustatius was 2.6 nights. The most common nationalities on board of the vessels were Americans, French and Dutch.
4.65 Total air passengers and aircraft movements F.D. Roosevelt Airport
Aircraft
movementsTotal
PassengersPassengers
arrivalsPassengers departures
x 1,000
2013 January 0 .6 3 .7 2 .0 1 .6
2013 February 0 .4 3 .4 1 .6 1 .8
2013 March 0 .5 3 .5 1 .8 1 .7
2013 April 0 .5 3 .7 1 .7 2 .0
2013 May 0 .5 3 .5 1 .9 1 .7
2013 June 0 .5 3 .7 1 .9 1 .8
2013 July 0 .5 4 .0 2 .0 2 .0
2013 August 0 .5 3 .9 1 .9 2 .0
2013 September 0 .4 3 .1 1 .5 1 .6
2013 October 0 .4 3 .4 1 .7 1 .7
2013 November 0 .5 3 .6 1 .8 1 .8
2013 December 0 .5 3 .7 1 .8 2 .0
2014 January 0 .5 3 .4 1 .8 1 .7
2014 February 0 .4 3 .1 1 .5 1 .5
2014 March 0 .5 3 .6 1 .9 1 .7
2014 April 0 .5 3 .5 1 .7 1 .8
2014 May 0 .5 3 .7 1 .9 1 .8
2014 June 0 .5 3 .8 1 .9 1 .9
2014 July 0 .5 4 .1 2 .1 2 .0
2014 August 0 .5 3 .8 1 .8 2 .0
2014 September 0 .4 2 .9 1 .5 1 .4
2014 October 0 .5 3 .7 1 .8 1 .8
2014 November 0 .5 3 .4 1 .7 1 .7
2014 December 0 .6 3 .6 1 .7 1 .9
2015 January* 0 .5 3 .4 1 .8 1 .6
2015 February* 0 .5 3 .1 1 .5 1 .6
2015 March* 0 .5 3 .6 1 .8 1 .8
2015 April* 0 .5 3 .4 1 .6 1 .7
2015 May* 0 .4 3 .4 1 .8 1 .6
2015 June* 0 .4 3 .5 1 .8 1 .7
4.64 Passengers and aircrafts F.D. Roosevelt Airport per quarter
Aircraft
movementsTotal
PassengersPassengers
arrivalsPassengers departures
x 1,000
2013-I 1 .5 10 .6 5 .5 5 .1
2013-II 1 .4 10 .9 5 .5 5 .4
2013-III 1 .4 11 .0 5 .4 5 .6
2013-IV 1 .4 10 .7 5 .3 5 .4
2014-I 1 .4 10 .1 5 .2 4 .9
2014-II 1 .5 11 .0 5 .4 5 .6
2014-III 1 .4 10 .8 5 .4 5 .4
2014-IV 1 .4 10 .2 5 .2 5 .0
2015-I 1 .5 10 .1 5 .2 5 .0
2015 II 1.4 10.2 5.2 5.0
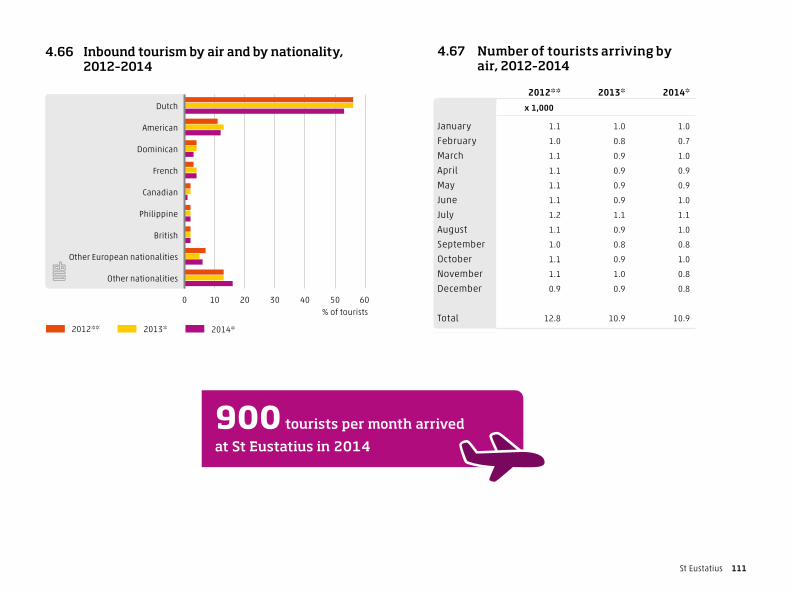
St Eustatius 111
4.66 Inbound tourism by air and by nationality, 2012–2014
2013*2012**
0 10 20 30 40 50 60
Other nationalities
Other European nationalities
British
Philippine
Canadian
French
Dominican
American
Dutch
2014*
% of tourists
4.67 Number of tourists arriving by air, 2012–2014
2012** 2013* 2014*
x 1,000
January 1 .1 1 .0 1 .0
February 1 .0 0 .8 0 .7
March 1 .1 0 .9 1 .0
April 1 .1 0 .9 0 .9
May 1 .1 0 .9 0 .9
June 1 .1 0 .9 1 .0
July 1 .2 1 .1 1 .1
August 1 .1 0 .9 1 .0
September 1 .0 0 .8 0 .8
October 1 .1 0 .9 1 .0
November 1 .1 1 .0 0 .8
December 0 .9 0 .9 0 .8
Total 12 .8 10 .9 10 .9
900 tourists per month arrived
at St Eustatius in 2014 Cc

112 Trends in the Caribbean Netherlands 2015
4.68 Air passengers F.D. Roosevelt Airport
0
0.5
1.0
1.5
2.0
2.5
Jun*May*Apr*Mar*Feb*Jan*DecNovOctSepAugJulJunMayAprMarFebJanDecNovOctSepAugJulJunMayAprMarFebJan
2013 2014 2015
DeparturesArrivals
4.69 Inbound tourism by air, 2012–2014
2014*2013*2012**
0
0.2
0.4
0.6
0.8
1.0
1.2
1.4
DecNovOctSepAugJulJunMayAprMarFebJan
Tourists (x 1,000)

1 Trends in Nederland 2015
9 789035 715776
Facts that matter
24,593
people living in the Caribbean Netherlands on 1 January 2015
18%
population growth in the Caribbean Netherlands since 2010
Gg
Ii
Tren
ds in th
e Caribbean N
etherlan
ds 2015